Port Alexander, AK Map & Demographics
Port Alexander Map
Port Alexander Overview
$26,628
PER CAPITA INCOME
$47,656
AVG FAMILY INCOME
$37,083
AVG HOUSEHOLD INCOME
0.31
INEQUALITY / GINI INDEX
39
TOTAL POPULATION
23
MALE POPULATION
16
FEMALE POPULATION
143.75
MALES / 100 FEMALES
69.57
FEMALES / 100 MALES
57.8
MEDIAN AGE
1.7
AVG FAMILY SIZE
1.6
AVG HOUSEHOLD SIZE
16
LABOR FORCE [ PEOPLE ]
44.4%
PERCENT IN LABOR FORCE
25.0%
UNEMPLOYMENT RATE
Port Alexander Zip Codes
Port Alexander Area Codes
Income in Port Alexander
Income Overview in Port Alexander
Per Capita Income in Port Alexander is $26,628, while median incomes of families and households are $47,656 and $37,083 respectively.
| Characteristic | Number | Measure |
| Per Capita Income | 39 | $26,628 |
| Median Family Income | 15 | $47,656 |
| Mean Family Income | 15 | $38,887 |
| Median Household Income | 24 | $37,083 |
| Mean Household Income | 24 | $44,400 |
| Income Deficit | 15 | $0 |
| Wage / Income Gap (%) | 39 | 0.00% |
| Wage / Income Gap ($) | 39 | 100.00¢ per $1 |
| Gini / Inequality Index | 39 | 0.31 |
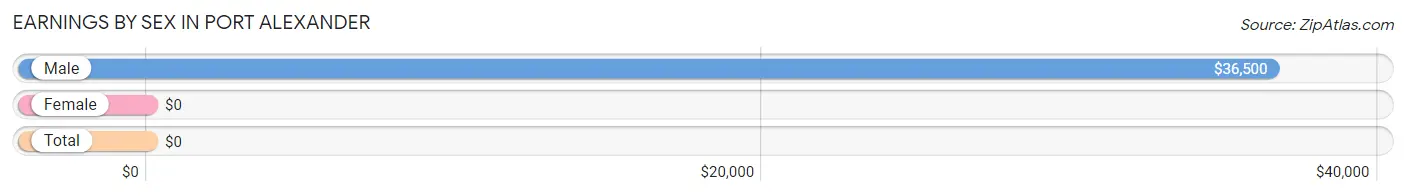
Earnings by Sex in Port Alexander
| Sex | Number | Average Earnings |
| Male | 16 (61.5%) | $36,500 |
| Female | 10 (38.5%) | $0 |
| Total | 26 (100.0%) | $0 |
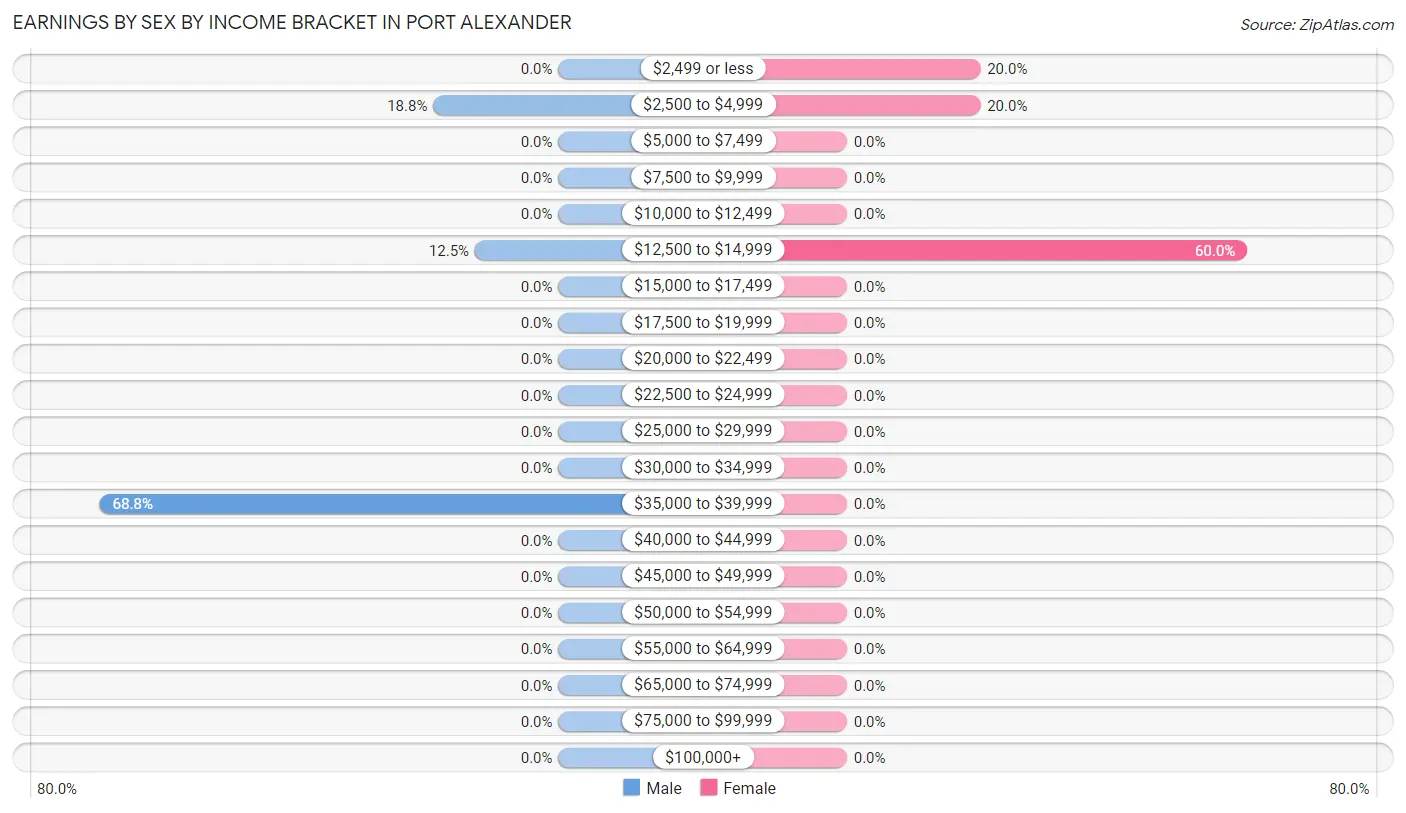
Earnings by Sex by Income Bracket in Port Alexander
The most common earnings brackets in Port Alexander are $35,000 to $39,999 for men (11 | 68.8%) and $12,500 to $14,999 for women (6 | 60.0%).
| Income | Male | Female |
| $2,499 or less | 0 (0.0%) | 2 (20.0%) |
| $2,500 to $4,999 | 3 (18.8%) | 2 (20.0%) |
| $5,000 to $7,499 | 0 (0.0%) | 0 (0.0%) |
| $7,500 to $9,999 | 0 (0.0%) | 0 (0.0%) |
| $10,000 to $12,499 | 0 (0.0%) | 0 (0.0%) |
| $12,500 to $14,999 | 2 (12.5%) | 6 (60.0%) |
| $15,000 to $17,499 | 0 (0.0%) | 0 (0.0%) |
| $17,500 to $19,999 | 0 (0.0%) | 0 (0.0%) |
| $20,000 to $22,499 | 0 (0.0%) | 0 (0.0%) |
| $22,500 to $24,999 | 0 (0.0%) | 0 (0.0%) |
| $25,000 to $29,999 | 0 (0.0%) | 0 (0.0%) |
| $30,000 to $34,999 | 0 (0.0%) | 0 (0.0%) |
| $35,000 to $39,999 | 11 (68.8%) | 0 (0.0%) |
| $40,000 to $44,999 | 0 (0.0%) | 0 (0.0%) |
| $45,000 to $49,999 | 0 (0.0%) | 0 (0.0%) |
| $50,000 to $54,999 | 0 (0.0%) | 0 (0.0%) |
| $55,000 to $64,999 | 0 (0.0%) | 0 (0.0%) |
| $65,000 to $74,999 | 0 (0.0%) | 0 (0.0%) |
| $75,000 to $99,999 | 0 (0.0%) | 0 (0.0%) |
| $100,000+ | 0 (0.0%) | 0 (0.0%) |
| Total | 16 (100.0%) | 10 (100.0%) |
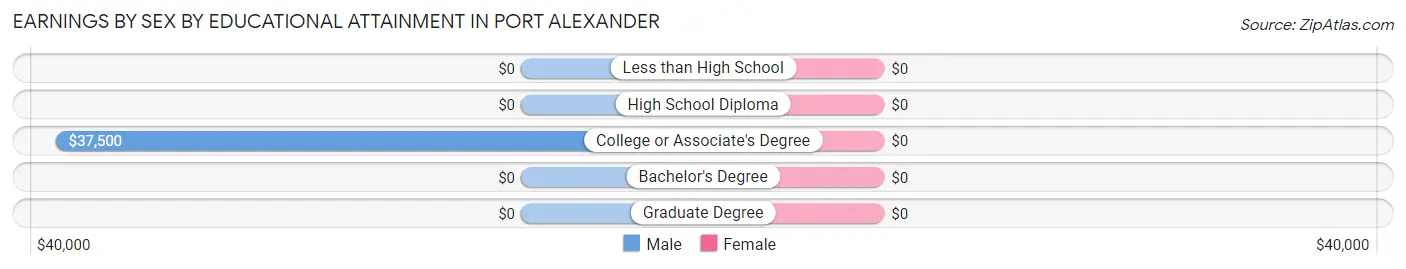
Earnings by Sex by Educational Attainment in Port Alexander
| Educational Attainment | Male Income | Female Income |
| Less than High School | - | - |
| High School Diploma | - | - |
| College or Associate's Degree | $37,500 | $0 |
| Bachelor's Degree | - | - |
| Graduate Degree | - | - |
| Total | $36,500 | $0 |
Family Income in Port Alexander
Family Income Brackets in Port Alexander
According to the Port Alexander family income data, there are 11 families falling into the $35,000 to $49,999 income range, which is the most common income bracket and makes up 73.3% of all families.
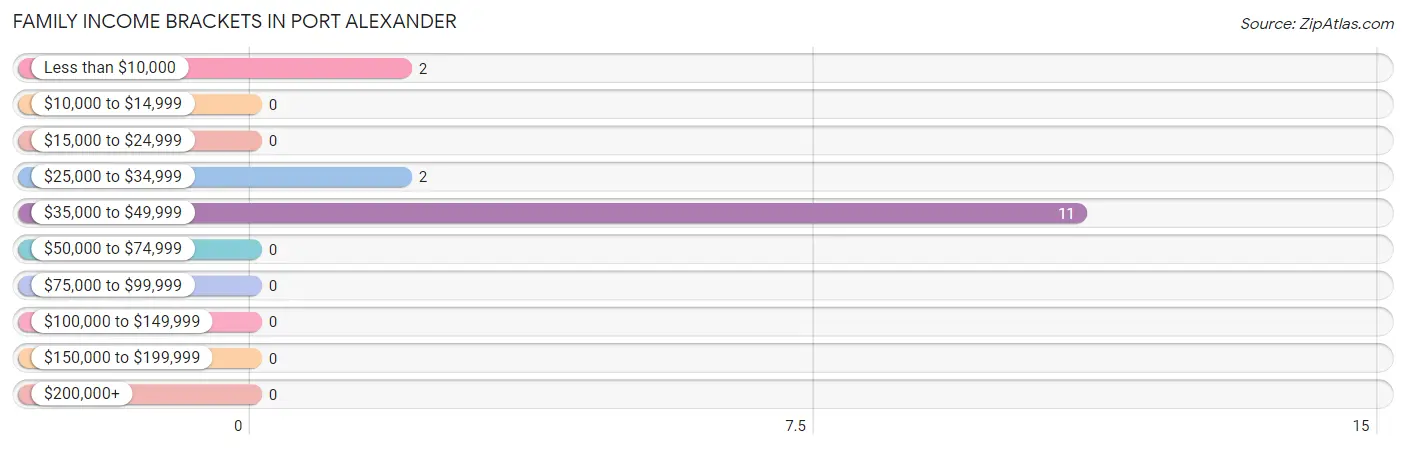
| Income Bracket | # Families | % Families |
| Less than $10,000 | 2 | 13.3% |
| $10,000 to $14,999 | 0 | 0.0% |
| $15,000 to $24,999 | 0 | 0.0% |
| $25,000 to $34,999 | 2 | 13.3% |
| $35,000 to $49,999 | 11 | 73.3% |
| $50,000 to $74,999 | 0 | 0.0% |
| $75,000 to $99,999 | 0 | 0.0% |
| $100,000 to $149,999 | 0 | 0.0% |
| $150,000 to $199,999 | 0 | 0.0% |
| $200,000+ | 0 | 0.0% |
Family Income by Famaliy Size in Port Alexander
2-person families (9 | 60.0%) account for the highest median family income in Port Alexander with $35,417 per family, while 2-person families (9 | 60.0%) have the highest median income of $17,708 per family member.
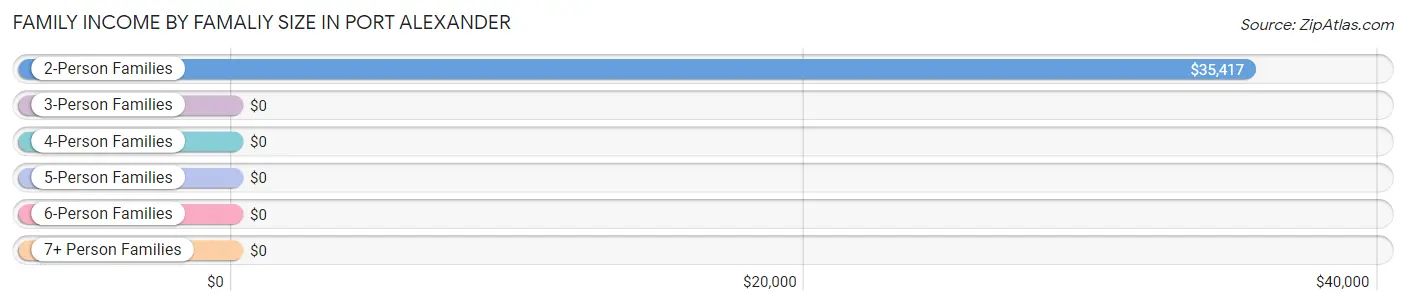
| Income Bracket | # Families | Median Income |
| 2-Person Families | 9 (60.0%) | $35,417 |
| 3-Person Families | 6 (40.0%) | $0 |
| 4-Person Families | 0 (0.0%) | $0 |
| 5-Person Families | 0 (0.0%) | $0 |
| 6-Person Families | 0 (0.0%) | $0 |
| 7+ Person Families | 0 (0.0%) | $0 |
| Total | 15 (100.0%) | $47,656 |
Family Income by Number of Earners in Port Alexander
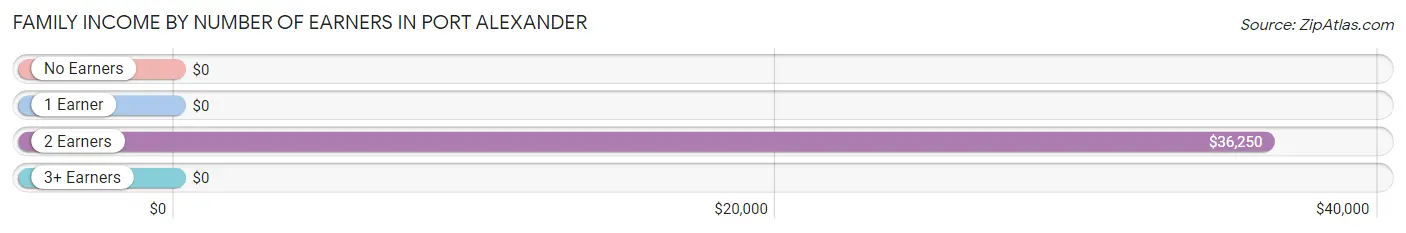
| Number of Earners | # Families | Median Income |
| No Earners | 2 (13.3%) | $0 |
| 1 Earner | 6 (40.0%) | $0 |
| 2 Earners | 7 (46.7%) | $36,250 |
| 3+ Earners | 0 (0.0%) | $0 |
| Total | 15 (100.0%) | $47,656 |
Household Income in Port Alexander
Household Income Brackets in Port Alexander
With 8 households falling in the category, the $35,000 to $49,999 income range is the most frequent in Port Alexander, accounting for 33.3% of all households.
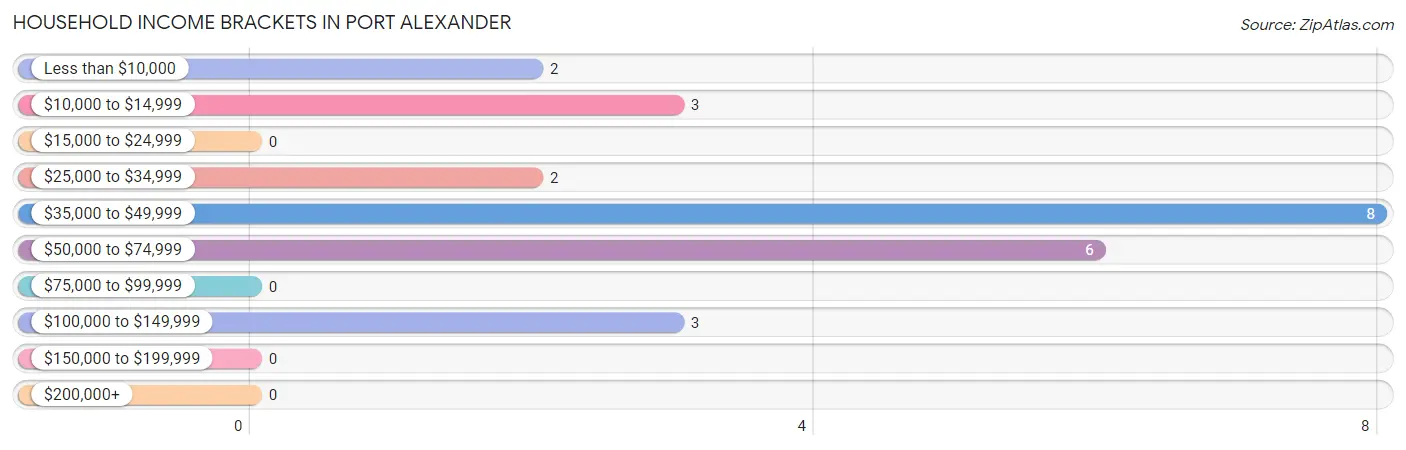
| Income Bracket | # Households | % Households |
| Less than $10,000 | 2 | 8.3% |
| $10,000 to $14,999 | 3 | 12.5% |
| $15,000 to $24,999 | 0 | 0.0% |
| $25,000 to $34,999 | 2 | 8.3% |
| $35,000 to $49,999 | 8 | 33.3% |
| $50,000 to $74,999 | 6 | 25.0% |
| $75,000 to $99,999 | 0 | 0.0% |
| $100,000 to $149,999 | 3 | 12.5% |
| $150,000 to $199,999 | 0 | 0.0% |
| $200,000+ | 0 | 0.0% |
Household Income by Householder Age in Port Alexander
The median household income in Port Alexander is $37,083, with the highest median household income of $35,625 found in the 45 to 64 years age bracket for the primary householder. A total of 13 households (54.2%) fall into this category.
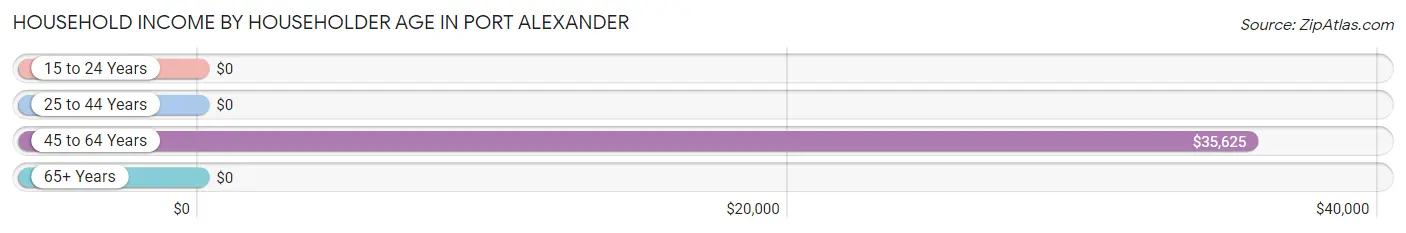
| Income Bracket | # Households | Median Income |
| 15 to 24 Years | 0 (0.0%) | $0 |
| 25 to 44 Years | 6 (25.0%) | $0 |
| 45 to 64 Years | 13 (54.2%) | $35,625 |
| 65+ Years | 5 (20.8%) | $0 |
| Total | 24 (100.0%) | $37,083 |
Poverty in Port Alexander
Income Below Poverty by Sex and Age in Port Alexander
With 13.0% poverty level for males and 56.2% for females among the residents of Port Alexander, 65 to 74 year old males and 35 to 44 year old females are the most vulnerable to poverty, with 3 males (30.0%) and 4 females (100.0%) in their respective age groups living below the poverty level.
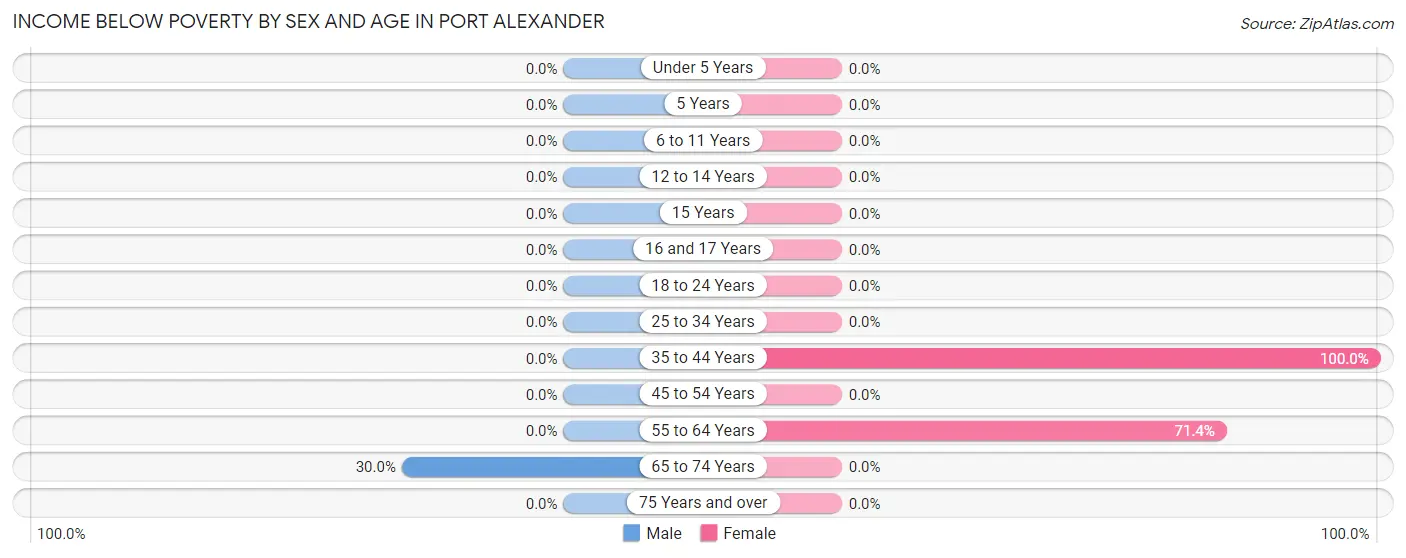
| Age Bracket | Male | Female |
| Under 5 Years | 0 (0.0%) | 0 (0.0%) |
| 5 Years | 0 (0.0%) | 0 (0.0%) |
| 6 to 11 Years | 0 (0.0%) | 0 (0.0%) |
| 12 to 14 Years | 0 (0.0%) | 0 (0.0%) |
| 15 Years | 0 (0.0%) | 0 (0.0%) |
| 16 and 17 Years | 0 (0.0%) | 0 (0.0%) |
| 18 to 24 Years | 0 (0.0%) | 0 (0.0%) |
| 25 to 34 Years | 0 (0.0%) | 0 (0.0%) |
| 35 to 44 Years | 0 (0.0%) | 4 (100.0%) |
| 45 to 54 Years | 0 (0.0%) | 0 (0.0%) |
| 55 to 64 Years | 0 (0.0%) | 5 (71.4%) |
| 65 to 74 Years | 3 (30.0%) | 0 (0.0%) |
| 75 Years and over | 0 (0.0%) | 0 (0.0%) |
| Total | 3 (13.0%) | 9 (56.2%) |
Income Above Poverty by Sex and Age in Port Alexander
According to the poverty statistics in Port Alexander, males aged 6 to 11 years and females aged 6 to 11 years are the age groups that are most secure financially, with 100.0% of males and 100.0% of females in these age groups living above the poverty line.
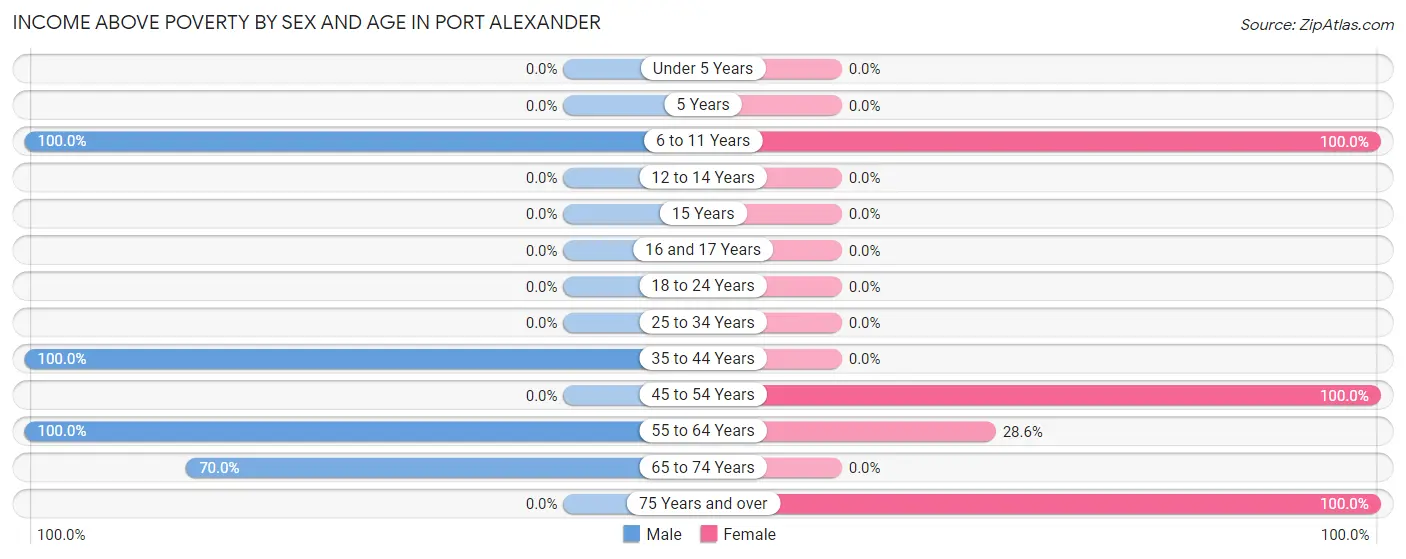
| Age Bracket | Male | Female |
| Under 5 Years | 0 (0.0%) | 0 (0.0%) |
| 5 Years | 0 (0.0%) | 0 (0.0%) |
| 6 to 11 Years | 2 (100.0%) | 1 (100.0%) |
| 12 to 14 Years | 0 (0.0%) | 0 (0.0%) |
| 15 Years | 0 (0.0%) | 0 (0.0%) |
| 16 and 17 Years | 0 (0.0%) | 0 (0.0%) |
| 18 to 24 Years | 0 (0.0%) | 0 (0.0%) |
| 25 to 34 Years | 0 (0.0%) | 0 (0.0%) |
| 35 to 44 Years | 6 (100.0%) | 0 (0.0%) |
| 45 to 54 Years | 0 (0.0%) | 3 (100.0%) |
| 55 to 64 Years | 5 (100.0%) | 2 (28.6%) |
| 65 to 74 Years | 7 (70.0%) | 0 (0.0%) |
| 75 Years and over | 0 (0.0%) | 1 (100.0%) |
| Total | 20 (87.0%) | 7 (43.8%) |
Income Below Poverty Among Married-Couple Families in Port Alexander
The poverty statistics for married-couple families in Port Alexander show that 22.2% or 2 of the total 9 families live below the poverty line. Families with no children have the highest poverty rate of 22.2%, comprising of 2 families. On the other hand, families with no children have the lowest poverty rate of 22.2%, which includes 2 families.
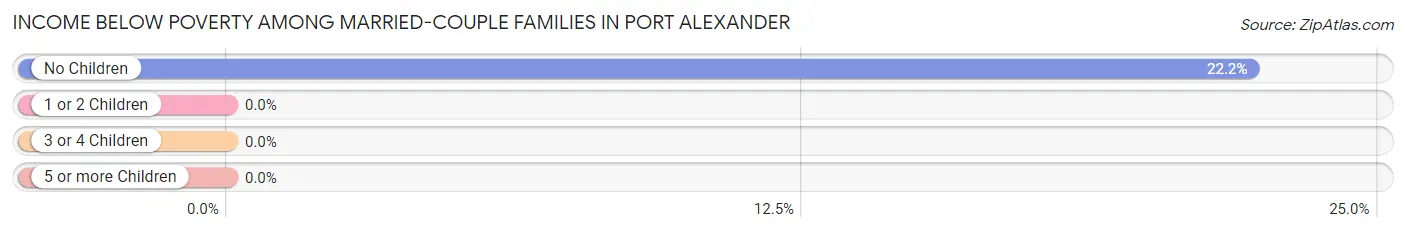
| Children | Above Poverty | Below Poverty |
| No Children | 7 (77.8%) | 2 (22.2%) |
| 1 or 2 Children | 0 (0.0%) | 0 (0.0%) |
| 3 or 4 Children | 0 (0.0%) | 0 (0.0%) |
| 5 or more Children | 0 (0.0%) | 0 (0.0%) |
| Total | 7 (77.8%) | 2 (22.2%) |
Income Below Poverty Among Single-Parent Households in Port Alexander
| Children | Single Father | Single Mother |
| No Children | 0 (0.0%) | 0 (0.0%) |
| 1 or 2 Children | 0 (0.0%) | 0 (0.0%) |
| 3 or 4 Children | 0 (0.0%) | 0 (0.0%) |
| 5 or more Children | 0 (0.0%) | 0 (0.0%) |
| Total | 0 (0.0%) | 0 (0.0%) |
Income Below Poverty Among Married-Couple vs Single-Parent Households in Port Alexander
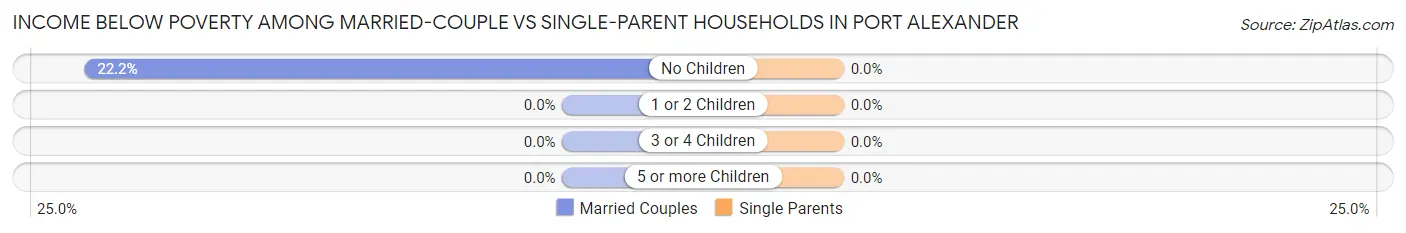
| Children | Married-Couple Families | Single-Parent Households |
| No Children | 2 (22.2%) | 0 (0.0%) |
| 1 or 2 Children | 0 (0.0%) | 0 (0.0%) |
| 3 or 4 Children | 0 (0.0%) | 0 (0.0%) |
| 5 or more Children | 0 (0.0%) | 0 (0.0%) |
| Total | 2 (22.2%) | 0 (0.0%) |
Race in Port Alexander
The most populous races in Port Alexander are White / Caucasian (39 | 100.0%), and Hispanic or Latino (6 | 15.4%).
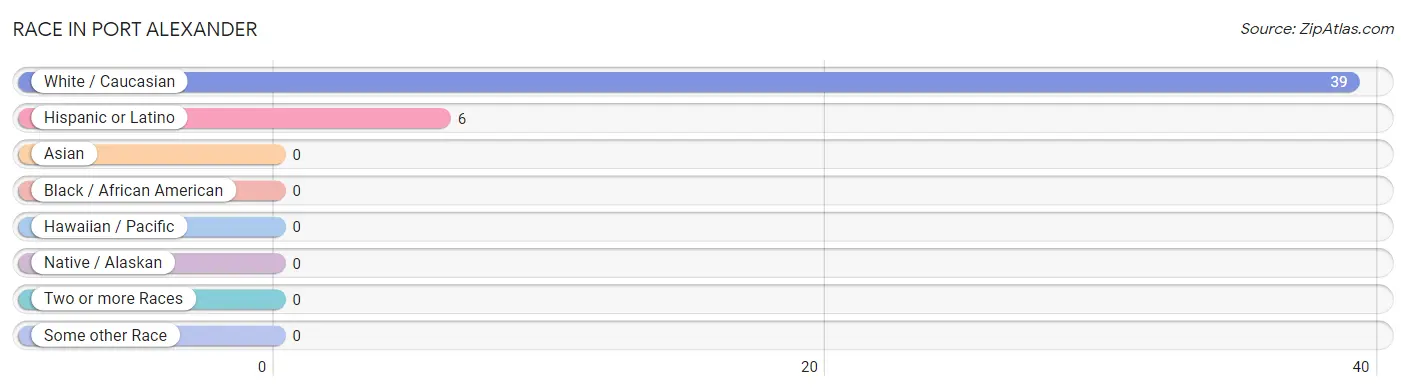
| Race | # Population | % Population |
| Asian | 0 | 0.0% |
| Black / African American | 0 | 0.0% |
| Hawaiian / Pacific | 0 | 0.0% |
| Hispanic or Latino | 6 | 15.4% |
| Native / Alaskan | 0 | 0.0% |
| White / Caucasian | 39 | 100.0% |
| Two or more Races | 0 | 0.0% |
| Some other Race | 0 | 0.0% |
| Total | 39 | 100.0% |
Ancestry in Port Alexander
The most populous ancestries reported in Port Alexander are German (14 | 35.9%), Spanish (6 | 15.4%), English (5 | 12.8%), Irish (4 | 10.3%), and European (3 | 7.7%), together accounting for 82.0% of all Port Alexander residents.
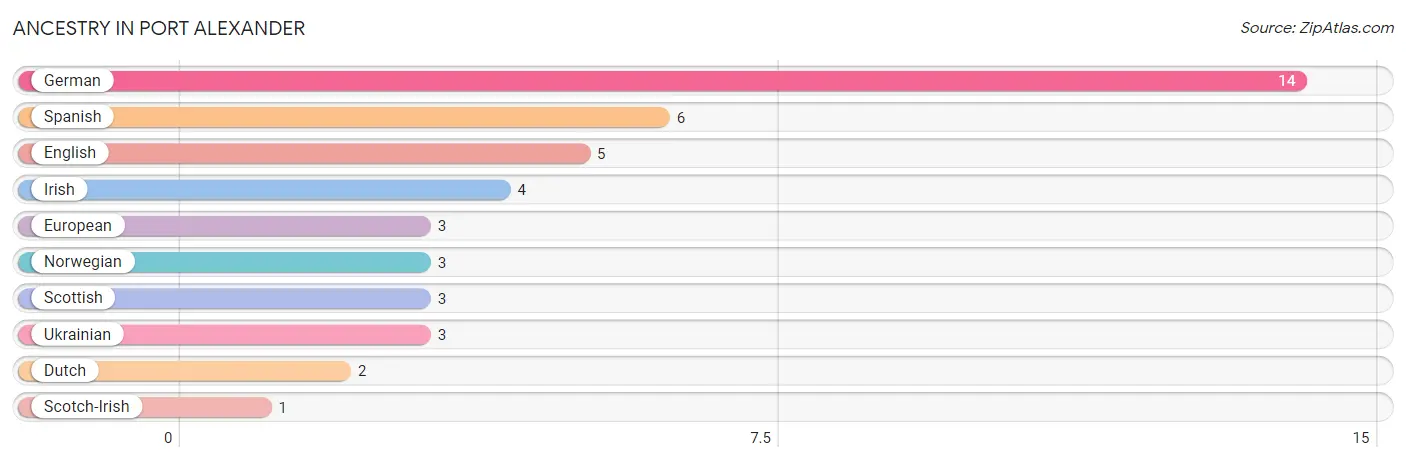
| Ancestry | # Population | % Population |
| Dutch | 2 | 5.1% |
| English | 5 | 12.8% |
| European | 3 | 7.7% |
| German | 14 | 35.9% |
| Irish | 4 | 10.3% |
| Norwegian | 3 | 7.7% |
| Scotch-Irish | 1 | 2.6% |
| Scottish | 3 | 7.7% |
| Spanish | 6 | 15.4% |
| Ukrainian | 3 | 7.7% | View All 10 Rows |
Immigrants in Port Alexander

| Immigration Origin | # Population | % Population | View All 0 Rows |
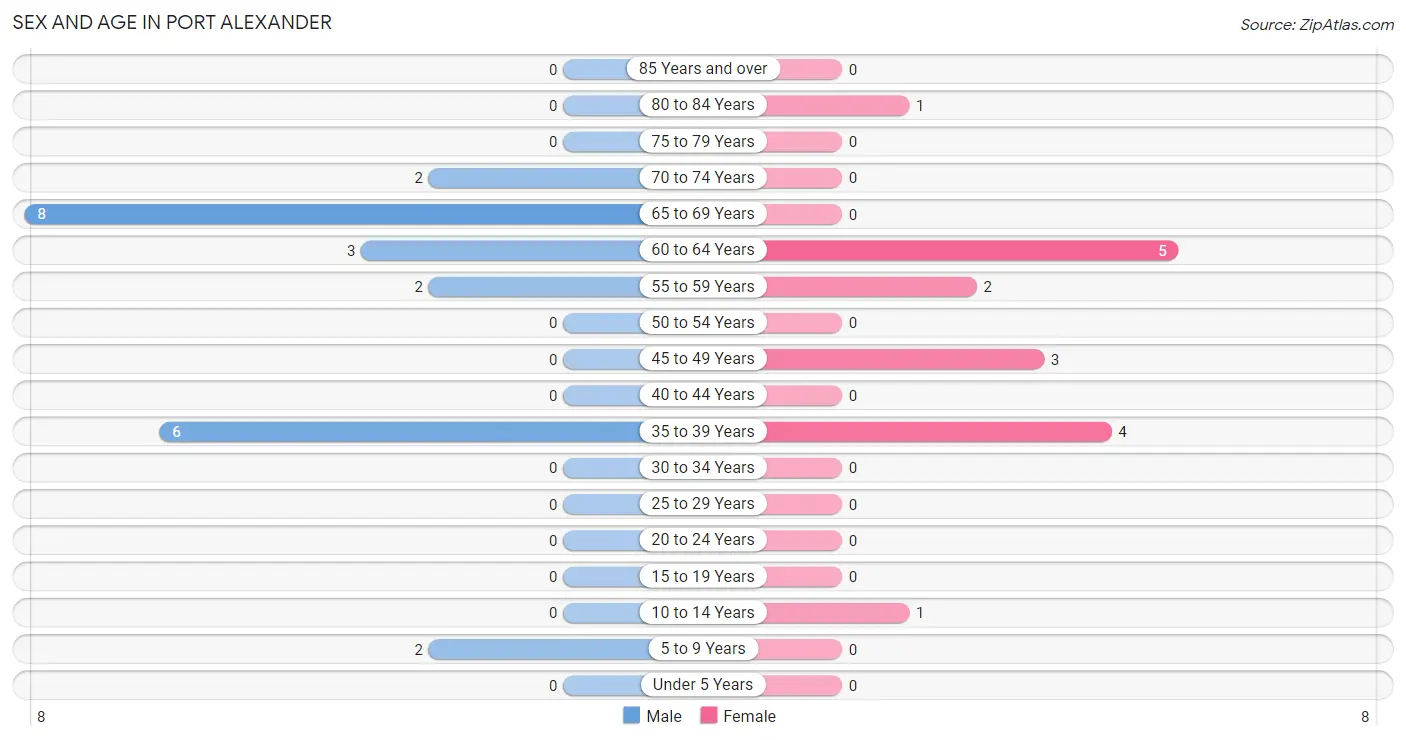
Sex and Age in Port Alexander
Sex and Age in Port Alexander
The most populous age groups in Port Alexander are 65 to 69 Years (8 | 34.8%) for men and 60 to 64 Years (5 | 31.2%) for women.
| Age Bracket | Male | Female |
| Under 5 Years | 0 (0.0%) | 0 (0.0%) |
| 5 to 9 Years | 2 (8.7%) | 0 (0.0%) |
| 10 to 14 Years | 0 (0.0%) | 1 (6.2%) |
| 15 to 19 Years | 0 (0.0%) | 0 (0.0%) |
| 20 to 24 Years | 0 (0.0%) | 0 (0.0%) |
| 25 to 29 Years | 0 (0.0%) | 0 (0.0%) |
| 30 to 34 Years | 0 (0.0%) | 0 (0.0%) |
| 35 to 39 Years | 6 (26.1%) | 4 (25.0%) |
| 40 to 44 Years | 0 (0.0%) | 0 (0.0%) |
| 45 to 49 Years | 0 (0.0%) | 3 (18.8%) |
| 50 to 54 Years | 0 (0.0%) | 0 (0.0%) |
| 55 to 59 Years | 2 (8.7%) | 2 (12.5%) |
| 60 to 64 Years | 3 (13.0%) | 5 (31.2%) |
| 65 to 69 Years | 8 (34.8%) | 0 (0.0%) |
| 70 to 74 Years | 2 (8.7%) | 0 (0.0%) |
| 75 to 79 Years | 0 (0.0%) | 0 (0.0%) |
| 80 to 84 Years | 0 (0.0%) | 1 (6.2%) |
| 85 Years and over | 0 (0.0%) | 0 (0.0%) |
| Total | 23 (100.0%) | 16 (100.0%) |
Families and Households in Port Alexander
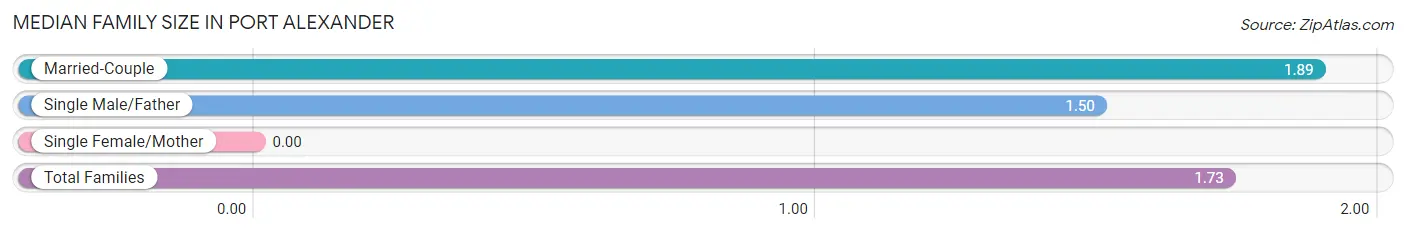
Median Family Size in Port Alexander
| Family Type | # Families | Family Size |
| Married-Couple | 9 (60.0%) | 1.89 |
| Single Male/Father | 6 (40.0%) | 1.50 |
| Single Female/Mother | 0 (0.0%) | - |
| Total Families | 15 (100.0%) | 1.73 |
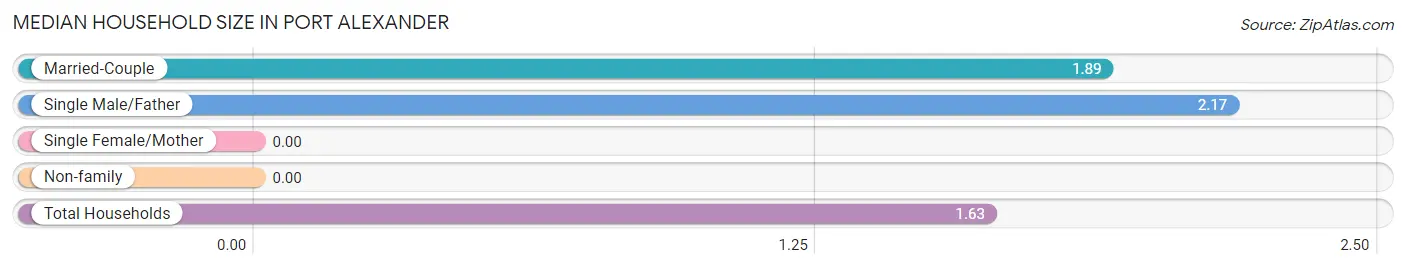
Median Household Size in Port Alexander
| Household Type | # Households | Household Size |
| Married-Couple | 9 (37.5%) | 1.89 |
| Single Male/Father | 6 (25.0%) | 2.17 |
| Single Female/Mother | 0 (0.0%) | - |
| Non-family | 9 (37.5%) | - |
| Total Households | 24 (100.0%) | 1.63 |
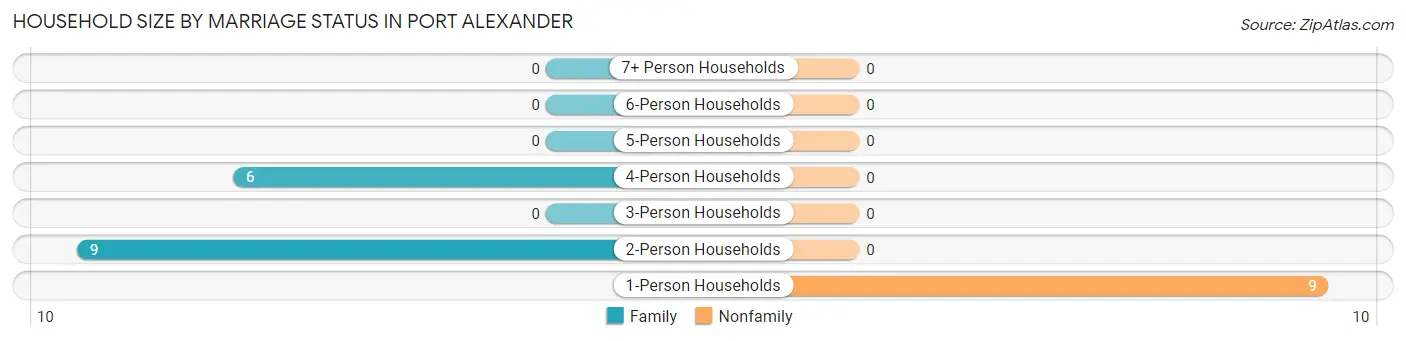
Household Size by Marriage Status in Port Alexander
Out of a total of 24 households in Port Alexander, 15 (62.5%) are family households, while 9 (37.5%) are nonfamily households. The most numerous type of family households are 2-person households, comprising 9, and the most common type of nonfamily households are 1-person households, comprising 9.
| Household Size | Family Households | Nonfamily Households |
| 1-Person Households | - | 9 (37.5%) |
| 2-Person Households | 9 (37.5%) | 0 (0.0%) |
| 3-Person Households | 0 (0.0%) | 0 (0.0%) |
| 4-Person Households | 6 (25.0%) | 0 (0.0%) |
| 5-Person Households | 0 (0.0%) | 0 (0.0%) |
| 6-Person Households | 0 (0.0%) | 0 (0.0%) |
| 7+ Person Households | 0 (0.0%) | 0 (0.0%) |
| Total | 15 (62.5%) | 9 (37.5%) |
Female Fertility in Port Alexander
Fertility by Age in Port Alexander
| Age Bracket | Women with Births | Births / 1,000 Women |
| 15 to 19 years | 0 (0.0%) | 0.0 |
| 20 to 34 years | 0 (0.0%) | 0.0 |
| 35 to 50 years | 0 (0.0%) | 0.0 |
| Total | 0 (0.0%) | 0.0 |
Fertility by Age by Marriage Status in Port Alexander
| Age Bracket | Married | Unmarried |
| 15 to 19 years | 0 (0.0%) | 0 (0.0%) |
| 20 to 34 years | 0 (0.0%) | 0 (0.0%) |
| 35 to 50 years | 0 (0.0%) | 0 (0.0%) |
| Total | 0 (0.0%) | 0 (0.0%) |
Fertility by Education in Port Alexander
| Educational Attainment | Women with Births | Births / 1,000 Women |
| Less than High School | 0 (0.0%) | 0.0 |
| High School Diploma | 0 (0.0%) | 0.0 |
| College or Associate's Degree | 0 (0.0%) | 0.0 |
| Bachelor's Degree | 0 (0.0%) | 0.0 |
| Graduate Degree | 0 (0.0%) | 0.0 |
| Total | 0 (0.0%) | 0.0 |
Fertility by Education by Marriage Status in Port Alexander
| Educational Attainment | Married | Unmarried |
| Less than High School | 0 (0.0%) | 0 (0.0%) |
| High School Diploma | 0 (0.0%) | 0 (0.0%) |
| College or Associate's Degree | 0 (0.0%) | 0 (0.0%) |
| Bachelor's Degree | 0 (0.0%) | 0 (0.0%) |
| Graduate Degree | 0 (0.0%) | 0 (0.0%) |
| Total | 0 (0.0%) | 0 (0.0%) |
Employment Characteristics in Port Alexander
Employment by Class of Employer in Port Alexander
Among the 12 employed individuals in Port Alexander, self-employed (not incorporated) (6 | 50.0%), private company employees (3 | 25.0%), and federal government employees (3 | 25.0%) make up the most common classes of employment.
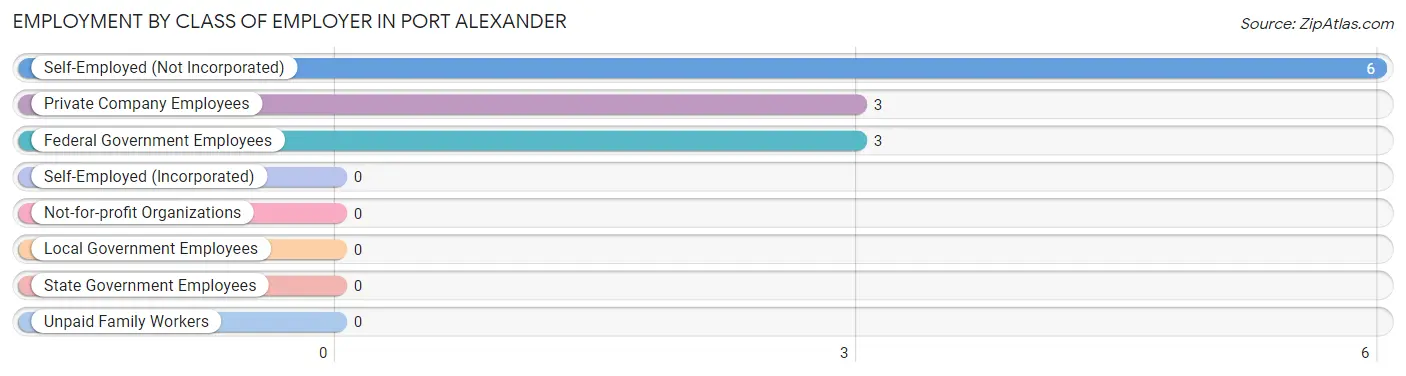
| Employer Class | # Employees | % Employees |
| Private Company Employees | 3 | 25.0% |
| Self-Employed (Incorporated) | 0 | 0.0% |
| Self-Employed (Not Incorporated) | 6 | 50.0% |
| Not-for-profit Organizations | 0 | 0.0% |
| Local Government Employees | 0 | 0.0% |
| State Government Employees | 0 | 0.0% |
| Federal Government Employees | 3 | 25.0% |
| Unpaid Family Workers | 0 | 0.0% |
| Total | 12 | 100.0% |
Employment Status by Age in Port Alexander
According to the labor force statistics for Port Alexander, out of the total population over 16 years of age (36), 44.4% or 16 individuals are in the labor force, with 25.0% or 4 of them unemployed. The age group with the highest labor force participation rate is 45 to 54 years, with 100.0% or 3 individuals in the labor force. Within the labor force, the 55 to 59 years age range has the highest percentage of unemployed individuals, with 100.0% or 2 of them being unemployed.
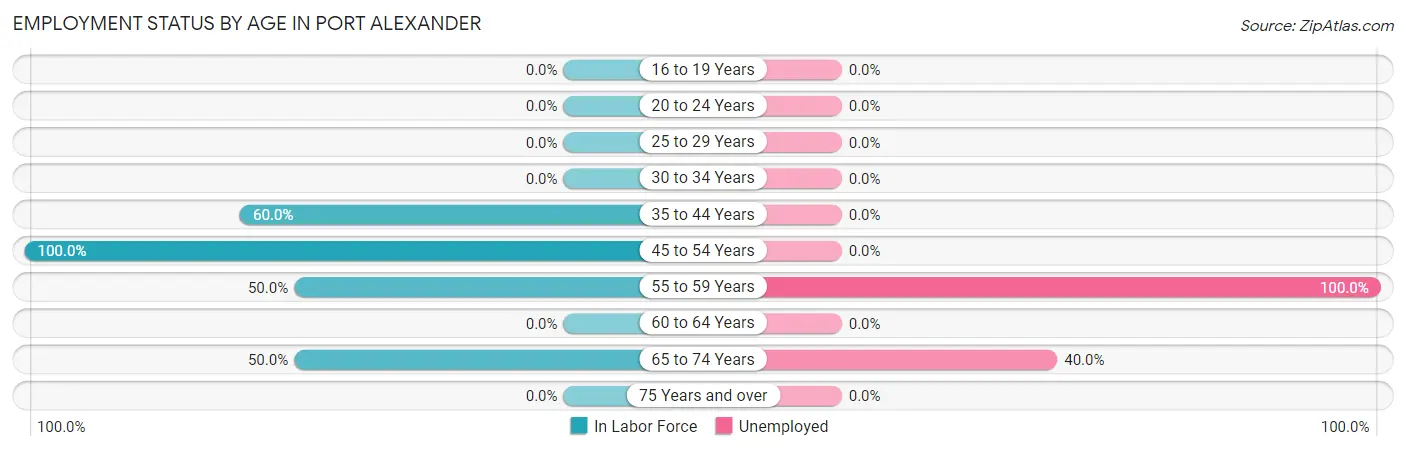
| Age Bracket | In Labor Force | Unemployed |
| 16 to 19 Years | 0 (0.0%) | 0 (0.0%) |
| 20 to 24 Years | 0 (0.0%) | 0 (0.0%) |
| 25 to 29 Years | 0 (0.0%) | 0 (0.0%) |
| 30 to 34 Years | 0 (0.0%) | 0 (0.0%) |
| 35 to 44 Years | 6 (60.0%) | 0 (0.0%) |
| 45 to 54 Years | 3 (100.0%) | 0 (0.0%) |
| 55 to 59 Years | 2 (50.0%) | 2 (100.0%) |
| 60 to 64 Years | 0 (0.0%) | 0 (0.0%) |
| 65 to 74 Years | 5 (50.0%) | 2 (40.0%) |
| 75 Years and over | 0 (0.0%) | 0 (0.0%) |
| Total | 16 (44.4%) | 4 (25.0%) |
Employment Status by Educational Attainment in Port Alexander
According to labor force statistics for Port Alexander, 44.0% of individuals (11) out of the total population between 25 and 64 years of age (25) are in the labor force, with 18.2% or 2 of them being unemployed. The group with the highest labor force participation rate are those with the educational attainment of high school diploma, with 50.0% or 2 individuals in the labor force. Within the labor force, individuals with high school diploma education have the highest percentage of unemployment, with 100.0% or 2 of them being unemployed.
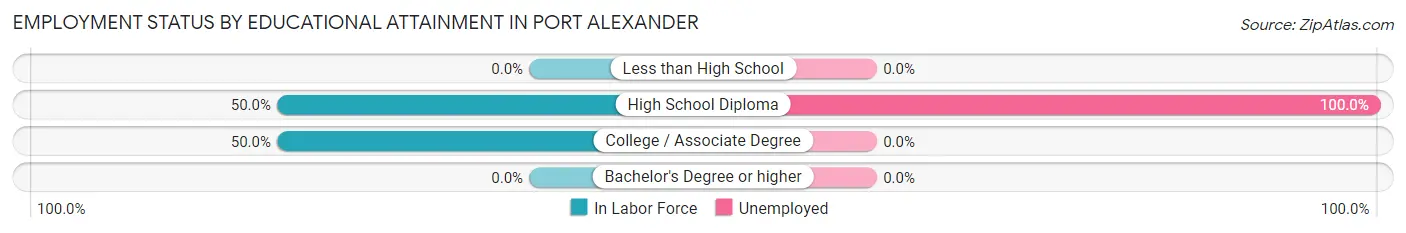
| Educational Attainment | In Labor Force | Unemployed |
| Less than High School | 0 (0.0%) | 0 (0.0%) |
| High School Diploma | 2 (50.0%) | 4 (100.0%) |
| College / Associate Degree | 9 (50.0%) | 0 (0.0%) |
| Bachelor's Degree or higher | 0 (0.0%) | 0 (0.0%) |
| Total | 11 (44.0%) | 5 (18.2%) |
Employment Occupations by Sex in Port Alexander
Management, Business, Science and Arts Occupations
The most common Management, Business, Science and Arts occupations in Port Alexander are , and Management (3 | 25.0%).
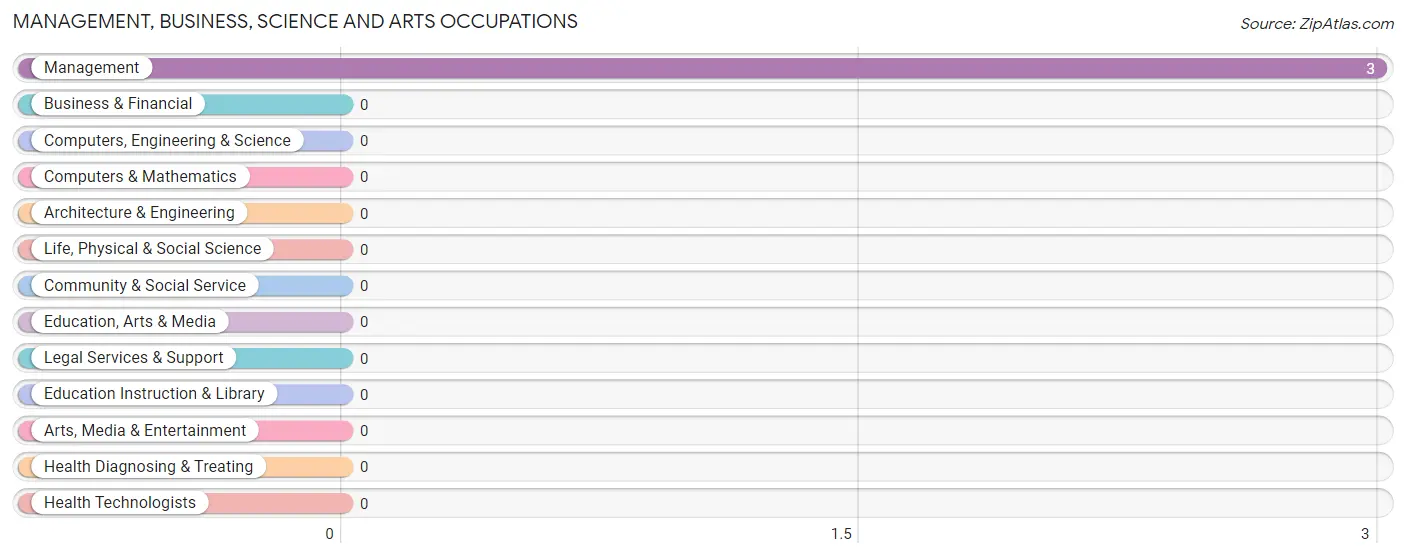
Management, Business, Science and Arts Occupations by Sex
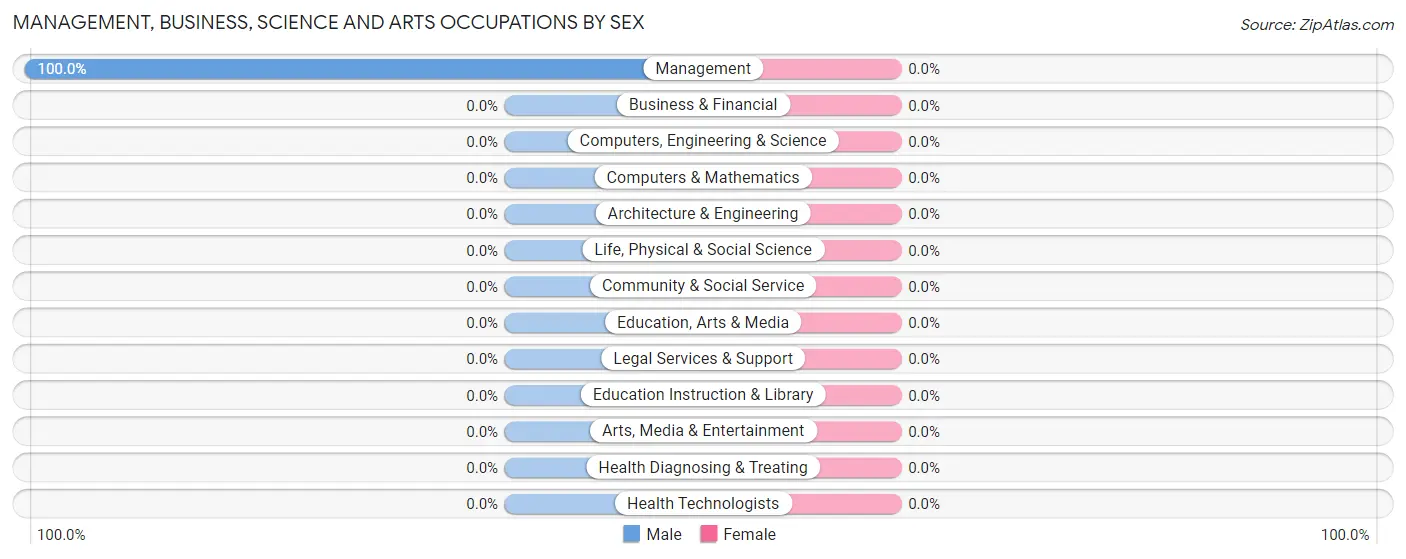
| Occupation | Male | Female |
| Management | 3 (100.0%) | 0 (0.0%) |
| Business & Financial | 0 (0.0%) | 0 (0.0%) |
| Computers, Engineering & Science | 0 (0.0%) | 0 (0.0%) |
| Computers & Mathematics | 0 (0.0%) | 0 (0.0%) |
| Architecture & Engineering | 0 (0.0%) | 0 (0.0%) |
| Life, Physical & Social Science | 0 (0.0%) | 0 (0.0%) |
| Community & Social Service | 0 (0.0%) | 0 (0.0%) |
| Education, Arts & Media | 0 (0.0%) | 0 (0.0%) |
| Legal Services & Support | 0 (0.0%) | 0 (0.0%) |
| Education Instruction & Library | 0 (0.0%) | 0 (0.0%) |
| Arts, Media & Entertainment | 0 (0.0%) | 0 (0.0%) |
| Health Diagnosing & Treating | 0 (0.0%) | 0 (0.0%) |
| Health Technologists | 0 (0.0%) | 0 (0.0%) |
| Total (Category) | 3 (100.0%) | 0 (0.0%) |
| Total (Overall) | 9 (75.0%) | 3 (25.0%) |
Services Occupations
The most common Services occupations in Port Alexander are , and Personal Care & Service (6 | 50.0%).
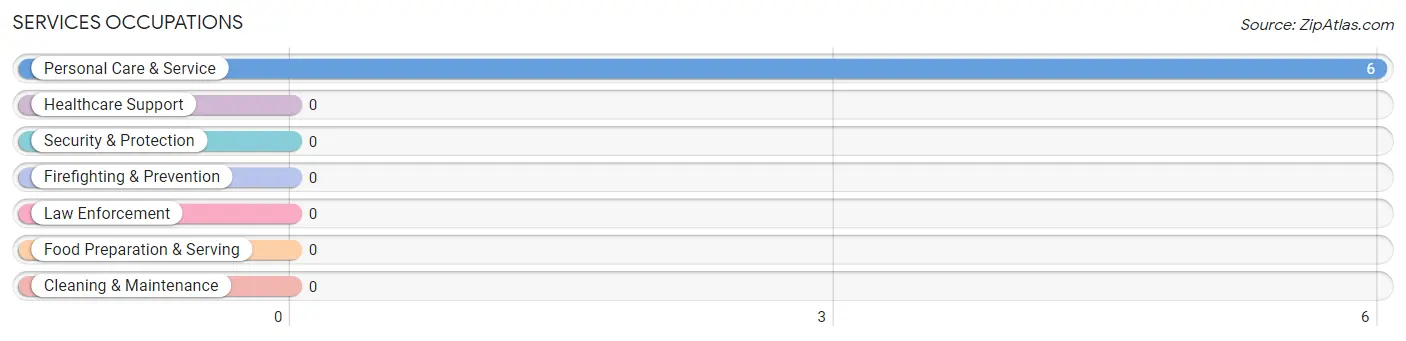
Services Occupations by Sex
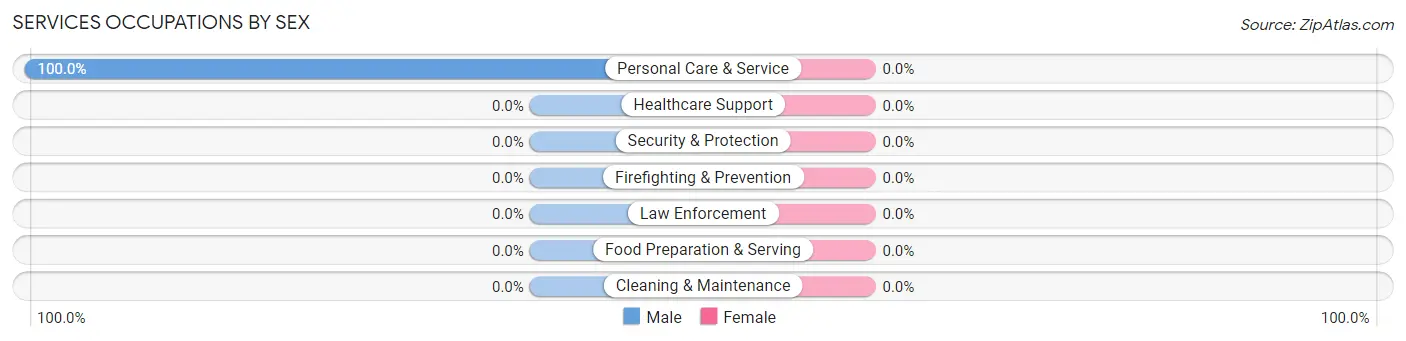
| Occupation | Male | Female |
| Healthcare Support | 0 (0.0%) | 0 (0.0%) |
| Security & Protection | 0 (0.0%) | 0 (0.0%) |
| Firefighting & Prevention | 0 (0.0%) | 0 (0.0%) |
| Law Enforcement | 0 (0.0%) | 0 (0.0%) |
| Food Preparation & Serving | 0 (0.0%) | 0 (0.0%) |
| Cleaning & Maintenance | 0 (0.0%) | 0 (0.0%) |
| Personal Care & Service | 6 (100.0%) | 0 (0.0%) |
| Total (Category) | 6 (100.0%) | 0 (0.0%) |
| Total (Overall) | 9 (75.0%) | 3 (25.0%) |
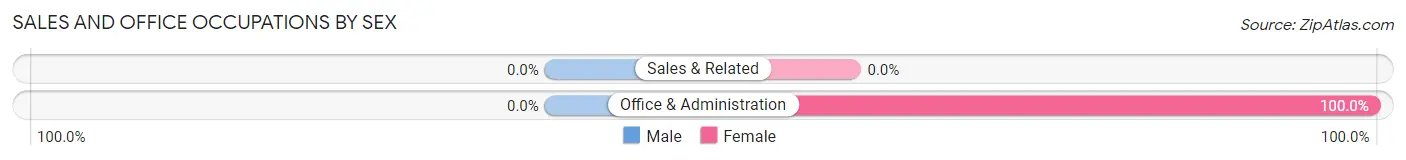
Sales and Office Occupations
The most common Sales and Office occupations in Port Alexander are , and Office & Administration (3 | 25.0%).
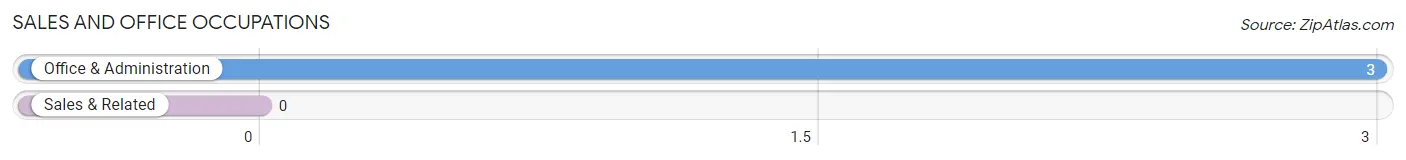
Sales and Office Occupations by Sex
| Occupation | Male | Female |
| Sales & Related | 0 (0.0%) | 0 (0.0%) |
| Office & Administration | 0 (0.0%) | 3 (100.0%) |
| Total (Category) | 0 (0.0%) | 3 (100.0%) |
| Total (Overall) | 9 (75.0%) | 3 (25.0%) |
Natural Resources, Construction and Maintenance Occupations
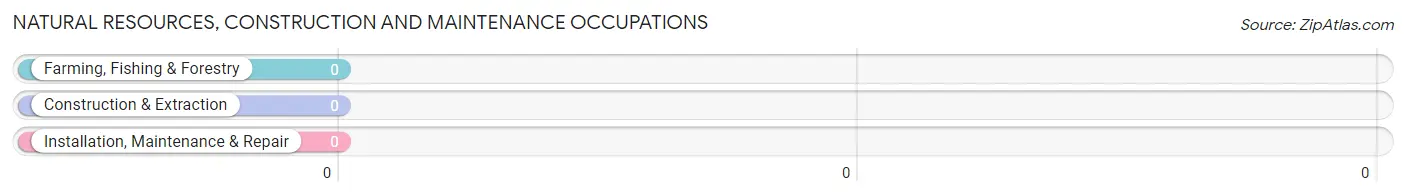
Natural Resources, Construction and Maintenance Occupations by Sex
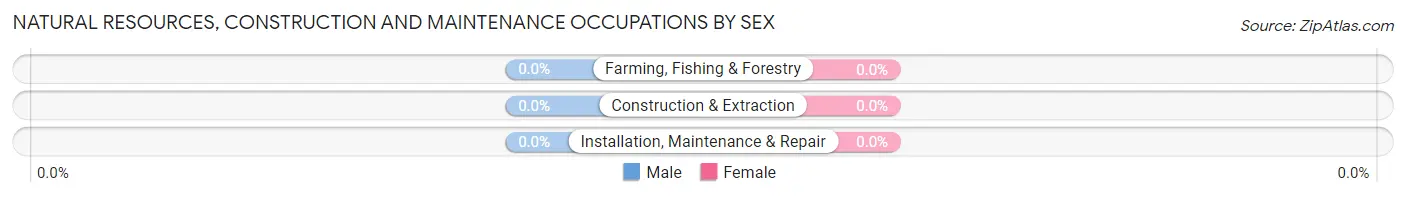
| Occupation | Male | Female |
| Farming, Fishing & Forestry | 0 (0.0%) | 0 (0.0%) |
| Construction & Extraction | 0 (0.0%) | 0 (0.0%) |
| Installation, Maintenance & Repair | 0 (0.0%) | 0 (0.0%) |
| Total (Category) | 0 (0.0%) | 0 (0.0%) |
| Total (Overall) | 9 (75.0%) | 3 (25.0%) |
Production, Transportation and Moving Occupations
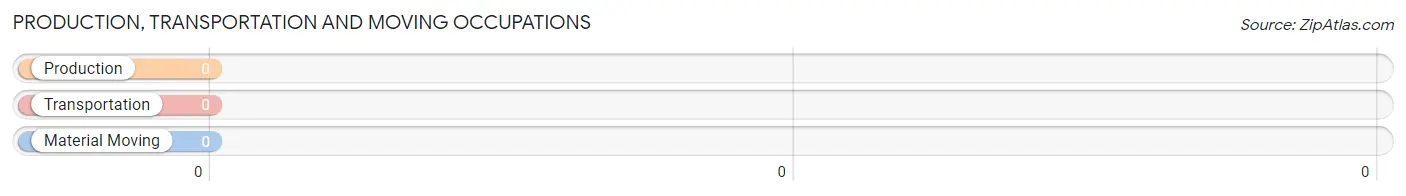
Production, Transportation and Moving Occupations by Sex
| Occupation | Male | Female |
| Production | 0 (0.0%) | 0 (0.0%) |
| Transportation | 0 (0.0%) | 0 (0.0%) |
| Material Moving | 0 (0.0%) | 0 (0.0%) |
| Total (Category) | 0 (0.0%) | 0 (0.0%) |
| Total (Overall) | 9 (75.0%) | 3 (25.0%) |
Employment Industries by Sex in Port Alexander
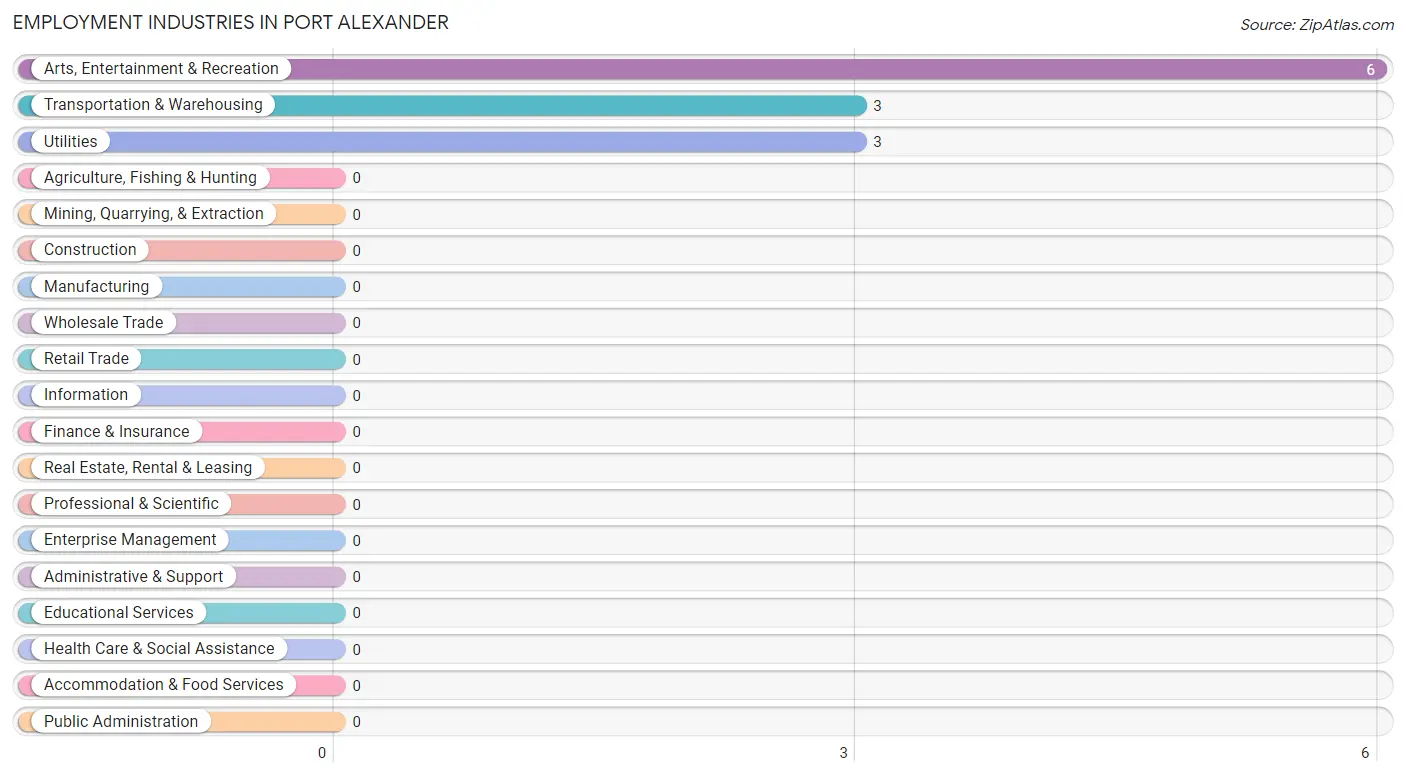
Employment Industries in Port Alexander
The major employment industries in Port Alexander include Arts, Entertainment & Recreation (6 | 50.0%), Transportation & Warehousing (3 | 25.0%), and Utilities (3 | 25.0%).
Employment Industries by Sex in Port Alexander
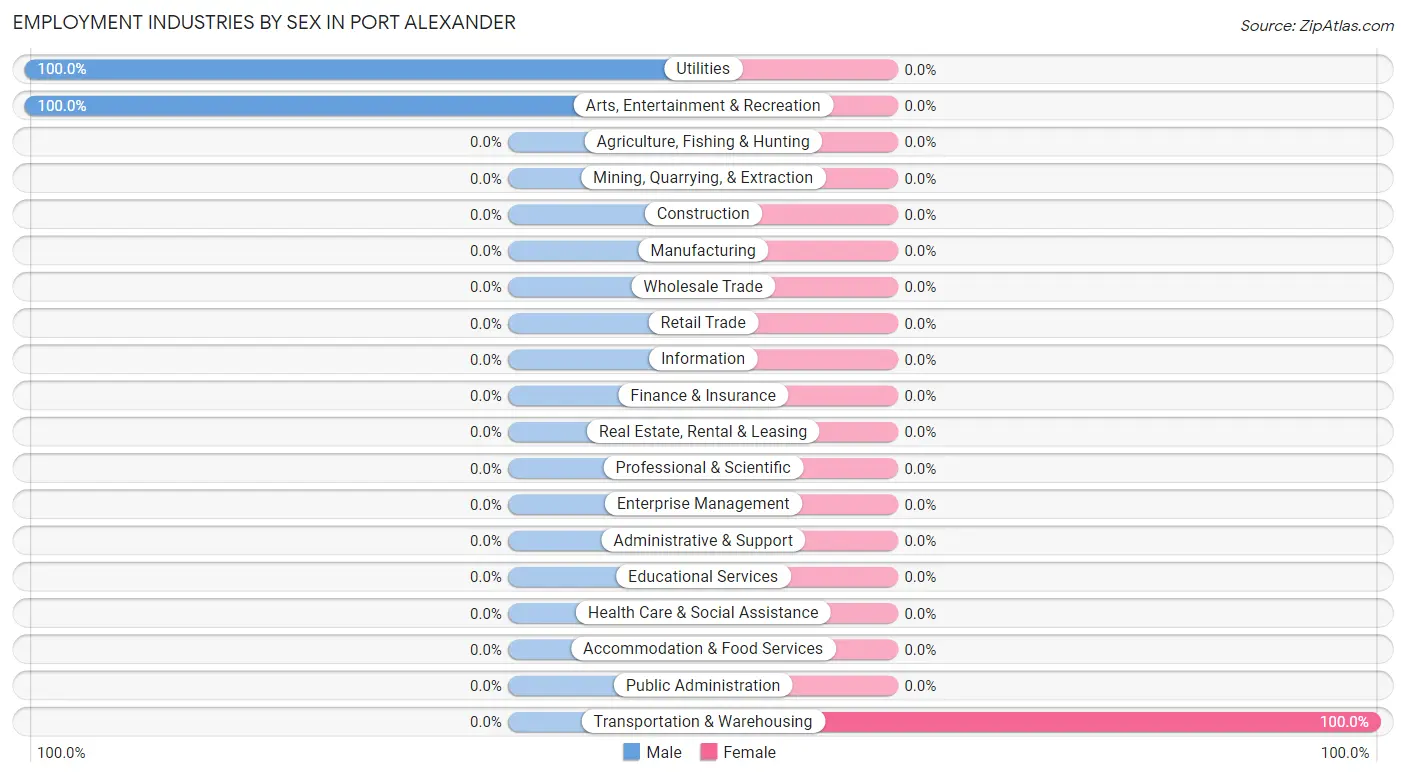
| Industry | Male | Female |
| Agriculture, Fishing & Hunting | 0 (0.0%) | 0 (0.0%) |
| Mining, Quarrying, & Extraction | 0 (0.0%) | 0 (0.0%) |
| Construction | 0 (0.0%) | 0 (0.0%) |
| Manufacturing | 0 (0.0%) | 0 (0.0%) |
| Wholesale Trade | 0 (0.0%) | 0 (0.0%) |
| Retail Trade | 0 (0.0%) | 0 (0.0%) |
| Transportation & Warehousing | 0 (0.0%) | 3 (100.0%) |
| Utilities | 3 (100.0%) | 0 (0.0%) |
| Information | 0 (0.0%) | 0 (0.0%) |
| Finance & Insurance | 0 (0.0%) | 0 (0.0%) |
| Real Estate, Rental & Leasing | 0 (0.0%) | 0 (0.0%) |
| Professional & Scientific | 0 (0.0%) | 0 (0.0%) |
| Enterprise Management | 0 (0.0%) | 0 (0.0%) |
| Administrative & Support | 0 (0.0%) | 0 (0.0%) |
| Educational Services | 0 (0.0%) | 0 (0.0%) |
| Health Care & Social Assistance | 0 (0.0%) | 0 (0.0%) |
| Arts, Entertainment & Recreation | 6 (100.0%) | 0 (0.0%) |
| Accommodation & Food Services | 0 (0.0%) | 0 (0.0%) |
| Public Administration | 0 (0.0%) | 0 (0.0%) |
| Total | 9 (75.0%) | 3 (25.0%) |
Education in Port Alexander
School Enrollment in Port Alexander
The most common levels of schooling among the 3 students in Port Alexander are elementary school (2 | 66.7%), and middle school (1 | 33.3%).
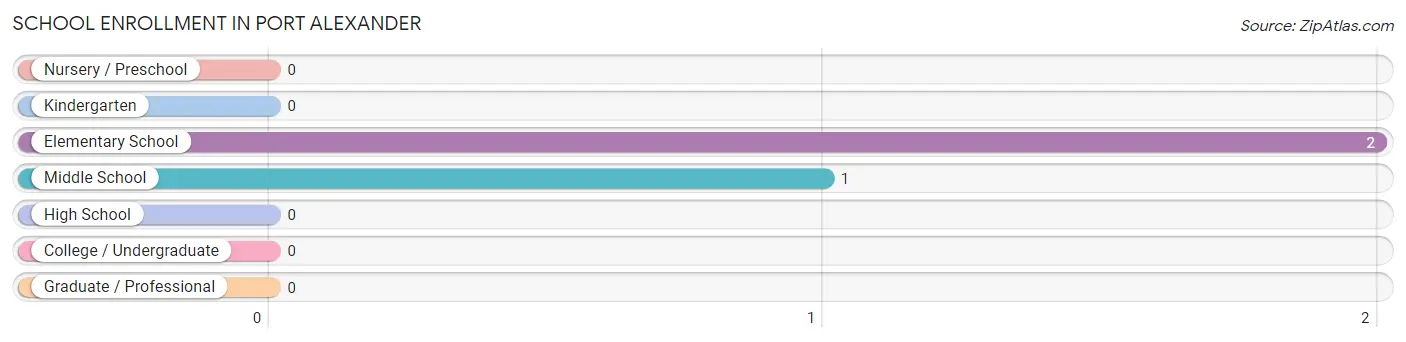
| School Level | # Students | % Students |
| Nursery / Preschool | 0 | 0.0% |
| Kindergarten | 0 | 0.0% |
| Elementary School | 2 | 66.7% |
| Middle School | 1 | 33.3% |
| High School | 0 | 0.0% |
| College / Undergraduate | 0 | 0.0% |
| Graduate / Professional | 0 | 0.0% |
| Total | 3 | 100.0% |
School Enrollment by Age by Funding Source in Port Alexander
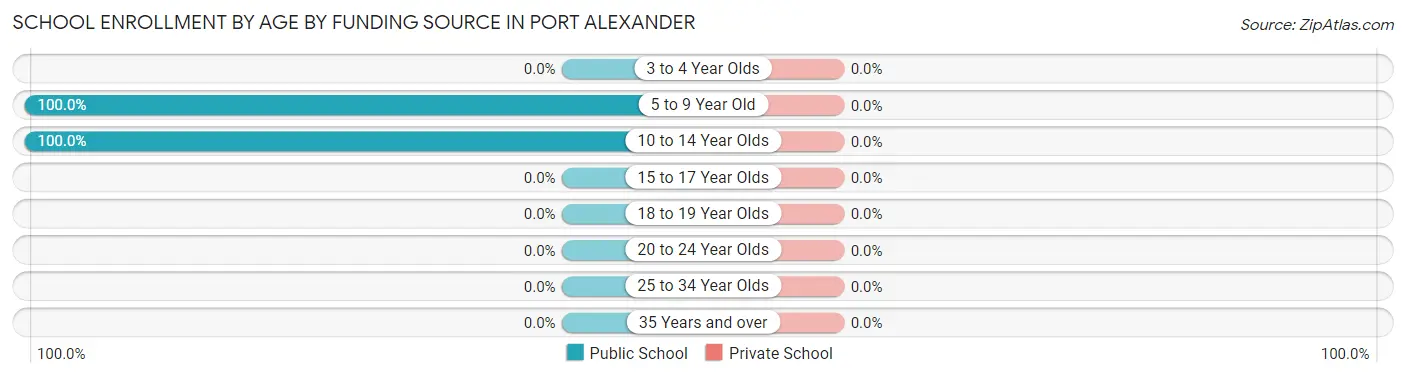
| Age Bracket | Public School | Private School |
| 3 to 4 Year Olds | 0 (0.0%) | 0 (0.0%) |
| 5 to 9 Year Old | 2 (100.0%) | 0 (0.0%) |
| 10 to 14 Year Olds | 1 (100.0%) | 0 (0.0%) |
| 15 to 17 Year Olds | 0 (0.0%) | 0 (0.0%) |
| 18 to 19 Year Olds | 0 (0.0%) | 0 (0.0%) |
| 20 to 24 Year Olds | 0 (0.0%) | 0 (0.0%) |
| 25 to 34 Year Olds | 0 (0.0%) | 0 (0.0%) |
| 35 Years and over | 0 (0.0%) | 0 (0.0%) |
| Total | 3 (100.0%) | 0 (0.0%) |
Educational Attainment by Field of Study in Port Alexander
, and education (3 | 100.0%) are the most common fields of study among 3 individuals in Port Alexander who have obtained a bachelor's degree or higher.
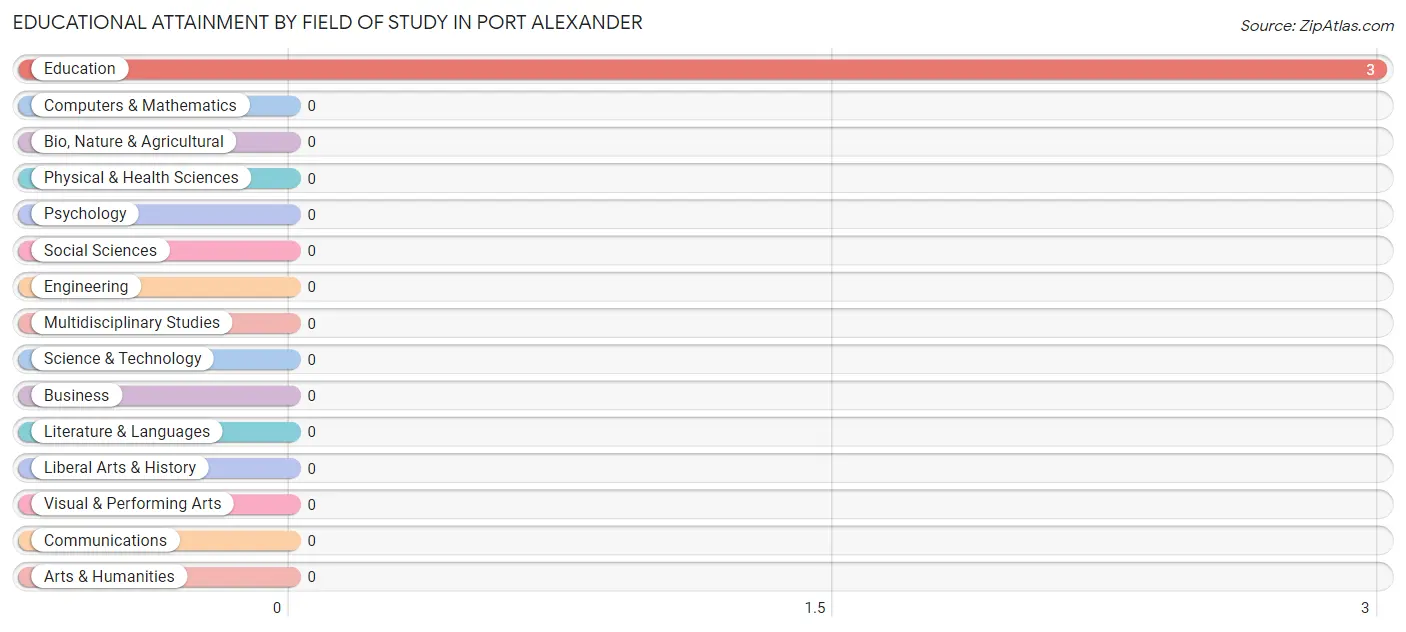
| Field of Study | # Graduates | % Graduates |
| Computers & Mathematics | 0 | 0.0% |
| Bio, Nature & Agricultural | 0 | 0.0% |
| Physical & Health Sciences | 0 | 0.0% |
| Psychology | 0 | 0.0% |
| Social Sciences | 0 | 0.0% |
| Engineering | 0 | 0.0% |
| Multidisciplinary Studies | 0 | 0.0% |
| Science & Technology | 0 | 0.0% |
| Business | 0 | 0.0% |
| Education | 3 | 100.0% |
| Literature & Languages | 0 | 0.0% |
| Liberal Arts & History | 0 | 0.0% |
| Visual & Performing Arts | 0 | 0.0% |
| Communications | 0 | 0.0% |
| Arts & Humanities | 0 | 0.0% |
| Total | 3 | 100.0% |
Transportation & Commute in Port Alexander
Vehicle Availability by Sex in Port Alexander
The most prevalent vehicle ownership categories in Port Alexander are males with no vehicle (6, accounting for 66.7%) and females with no vehicle (3, making up 200.0%).
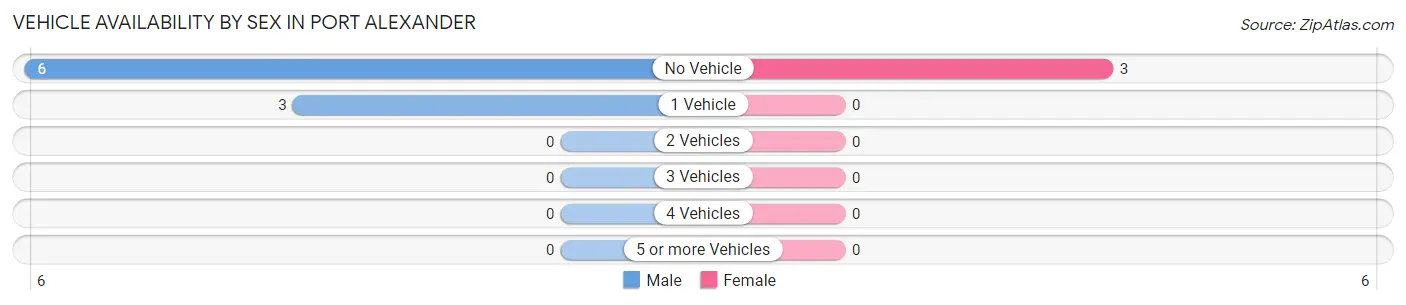
| Vehicles Available | Male | Female |
| No Vehicle | 6 (66.7%) | 3 (100.0%) |
| 1 Vehicle | 3 (33.3%) | 0 (0.0%) |
| 2 Vehicles | 0 (0.0%) | 0 (0.0%) |
| 3 Vehicles | 0 (0.0%) | 0 (0.0%) |
| 4 Vehicles | 0 (0.0%) | 0 (0.0%) |
| 5 or more Vehicles | 0 (0.0%) | 0 (0.0%) |
| Total | 9 (100.0%) | 3 (100.0%) |
Commute Time in Port Alexander
The most frequently occuring commute durations in Port Alexander are 5 to 9 minutes (6 commuters, 50.0%), 10 to 14 minutes (3 commuters, 25.0%), and 15 to 19 minutes (3 commuters, 25.0%).
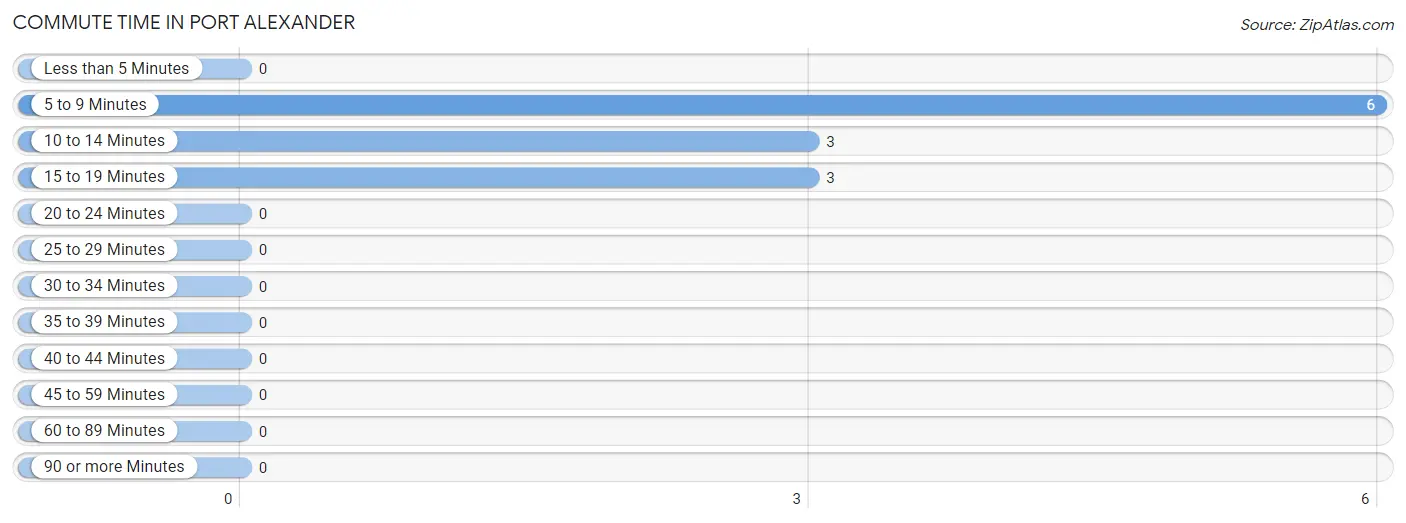
| Commute Time | # Commuters | % Commuters |
| Less than 5 Minutes | 0 | 0.0% |
| 5 to 9 Minutes | 6 | 50.0% |
| 10 to 14 Minutes | 3 | 25.0% |
| 15 to 19 Minutes | 3 | 25.0% |
| 20 to 24 Minutes | 0 | 0.0% |
| 25 to 29 Minutes | 0 | 0.0% |
| 30 to 34 Minutes | 0 | 0.0% |
| 35 to 39 Minutes | 0 | 0.0% |
| 40 to 44 Minutes | 0 | 0.0% |
| 45 to 59 Minutes | 0 | 0.0% |
| 60 to 89 Minutes | 0 | 0.0% |
| 90 or more Minutes | 0 | 0.0% |
Commute Time by Sex in Port Alexander
The most common commute times in Port Alexander are 5 to 9 minutes (6 commuters, 66.7%) for males and 10 to 14 minutes (3 commuters, 100.0%) for females.
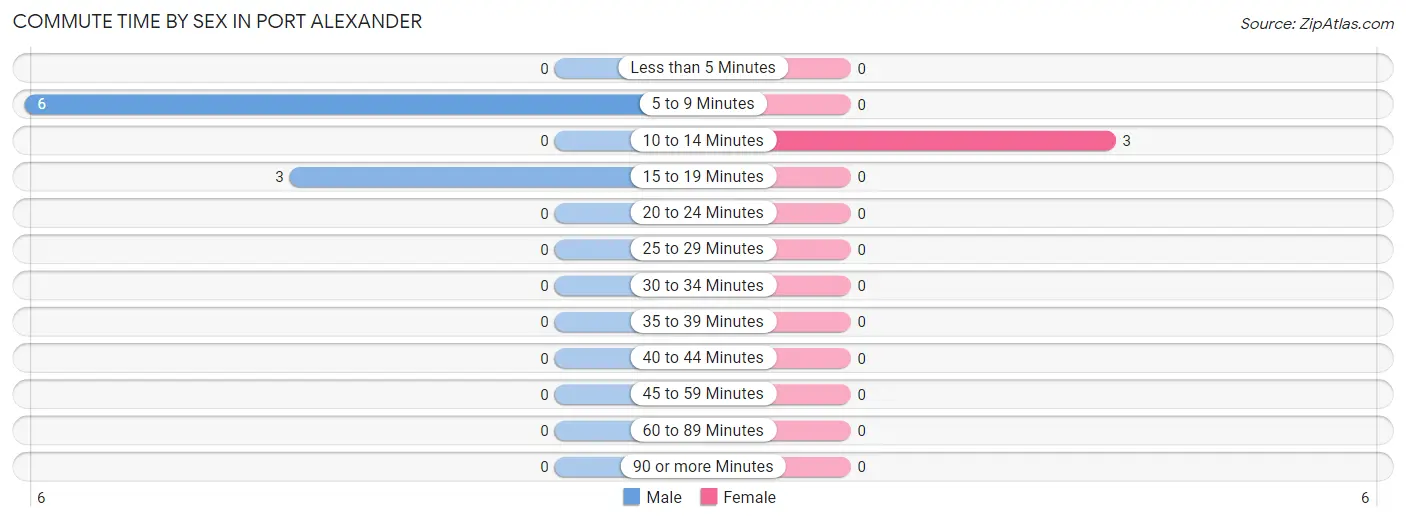
| Commute Time | Male | Female |
| Less than 5 Minutes | 0 (0.0%) | 0 (0.0%) |
| 5 to 9 Minutes | 6 (66.7%) | 0 (0.0%) |
| 10 to 14 Minutes | 0 (0.0%) | 3 (100.0%) |
| 15 to 19 Minutes | 3 (33.3%) | 0 (0.0%) |
| 20 to 24 Minutes | 0 (0.0%) | 0 (0.0%) |
| 25 to 29 Minutes | 0 (0.0%) | 0 (0.0%) |
| 30 to 34 Minutes | 0 (0.0%) | 0 (0.0%) |
| 35 to 39 Minutes | 0 (0.0%) | 0 (0.0%) |
| 40 to 44 Minutes | 0 (0.0%) | 0 (0.0%) |
| 45 to 59 Minutes | 0 (0.0%) | 0 (0.0%) |
| 60 to 89 Minutes | 0 (0.0%) | 0 (0.0%) |
| 90 or more Minutes | 0 (0.0%) | 0 (0.0%) |
Time of Departure to Work by Sex in Port Alexander
The most frequent times of departure to work in Port Alexander are 12:00 AM to 4:59 AM (6, 66.7%) for males and 8:30 AM to 8:59 AM (3, 100.0%) for females.
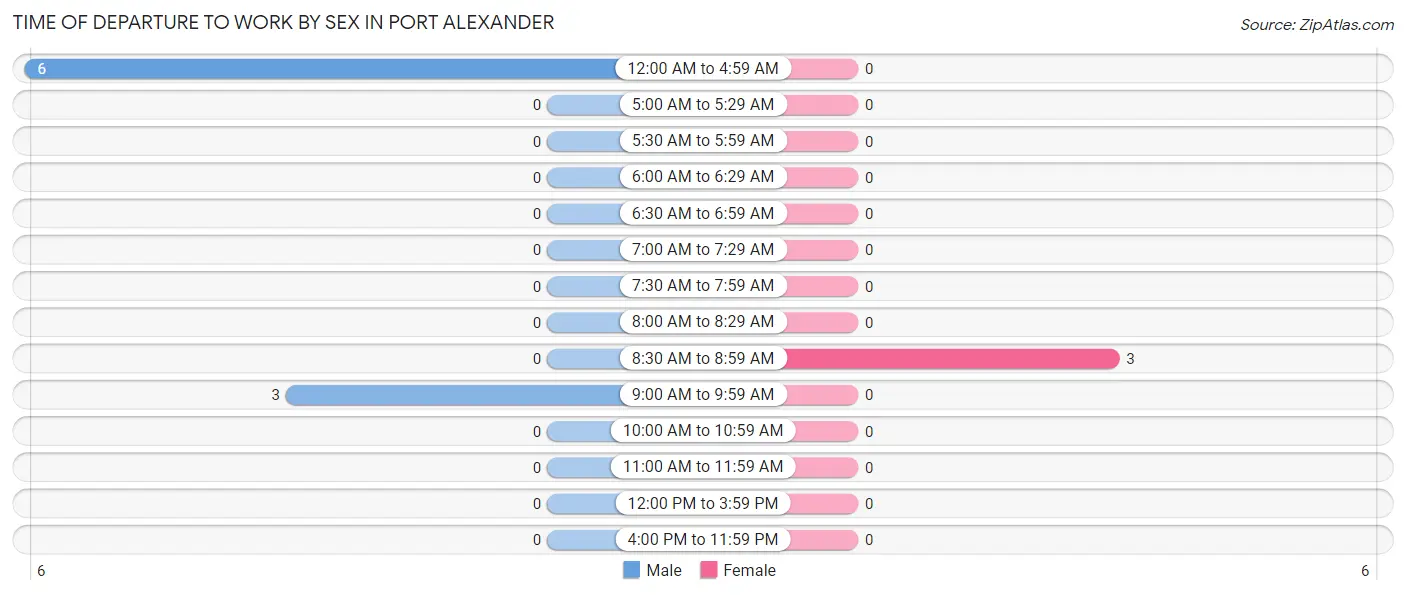
| Time of Departure | Male | Female |
| 12:00 AM to 4:59 AM | 6 (66.7%) | 0 (0.0%) |
| 5:00 AM to 5:29 AM | 0 (0.0%) | 0 (0.0%) |
| 5:30 AM to 5:59 AM | 0 (0.0%) | 0 (0.0%) |
| 6:00 AM to 6:29 AM | 0 (0.0%) | 0 (0.0%) |
| 6:30 AM to 6:59 AM | 0 (0.0%) | 0 (0.0%) |
| 7:00 AM to 7:29 AM | 0 (0.0%) | 0 (0.0%) |
| 7:30 AM to 7:59 AM | 0 (0.0%) | 0 (0.0%) |
| 8:00 AM to 8:29 AM | 0 (0.0%) | 0 (0.0%) |
| 8:30 AM to 8:59 AM | 0 (0.0%) | 3 (100.0%) |
| 9:00 AM to 9:59 AM | 3 (33.3%) | 0 (0.0%) |
| 10:00 AM to 10:59 AM | 0 (0.0%) | 0 (0.0%) |
| 11:00 AM to 11:59 AM | 0 (0.0%) | 0 (0.0%) |
| 12:00 PM to 3:59 PM | 0 (0.0%) | 0 (0.0%) |
| 4:00 PM to 11:59 PM | 0 (0.0%) | 0 (0.0%) |
| Total | 9 (100.0%) | 3 (100.0%) |
Housing Occupancy in Port Alexander
Occupancy by Ownership in Port Alexander
Of the total 24 dwellings in Port Alexander, owner-occupied units account for 21 (87.5%), while renter-occupied units make up 3 (12.5%).
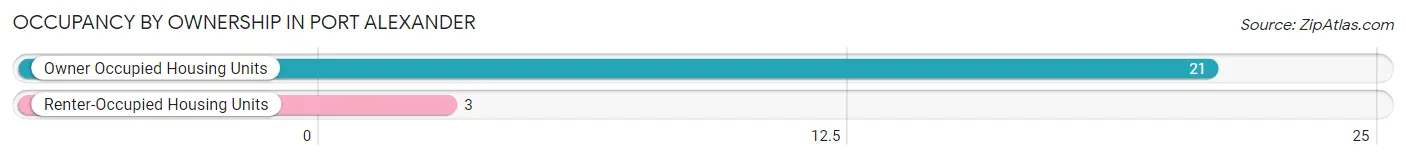
| Occupancy | # Housing Units | % Housing Units |
| Owner Occupied Housing Units | 21 | 87.5% |
| Renter-Occupied Housing Units | 3 | 12.5% |
| Total Occupied Housing Units | 24 | 100.0% |
Occupancy by Household Size in Port Alexander
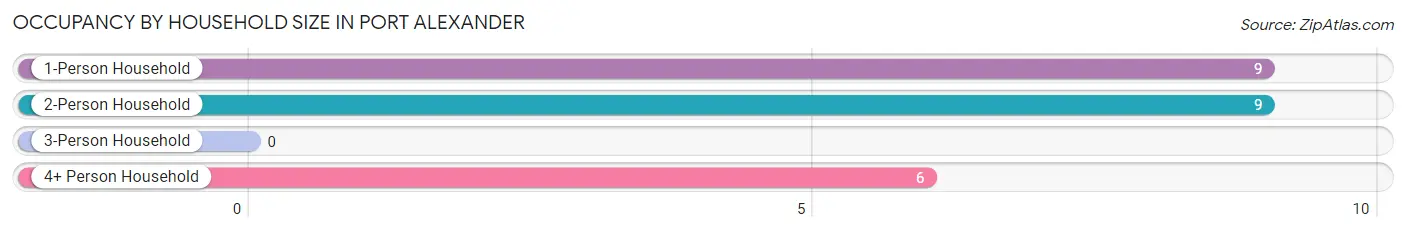
| Household Size | # Housing Units | % Housing Units |
| 1-Person Household | 9 | 37.5% |
| 2-Person Household | 9 | 37.5% |
| 3-Person Household | 0 | 0.0% |
| 4+ Person Household | 6 | 25.0% |
| Total Housing Units | 24 | 100.0% |
Occupancy by Ownership by Household Size in Port Alexander
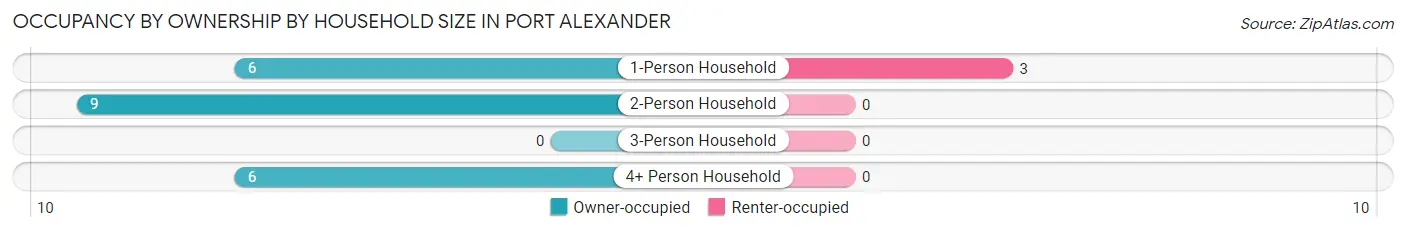
| Household Size | Owner-occupied | Renter-occupied |
| 1-Person Household | 6 (66.7%) | 3 (33.3%) |
| 2-Person Household | 9 (100.0%) | 0 (0.0%) |
| 3-Person Household | 0 (0.0%) | 0 (0.0%) |
| 4+ Person Household | 6 (100.0%) | 0 (0.0%) |
| Total Housing Units | 21 (87.5%) | 3 (12.5%) |
Occupancy by Educational Attainment in Port Alexander
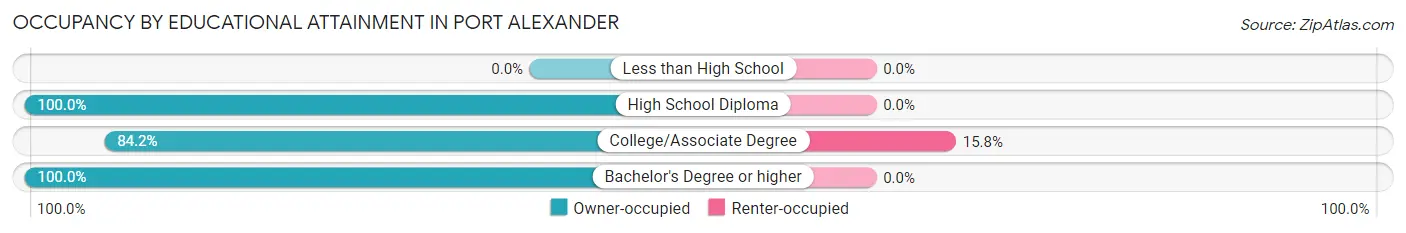
| Household Size | Owner-occupied | Renter-occupied |
| Less than High School | 0 (0.0%) | 0 (0.0%) |
| High School Diploma | 2 (100.0%) | 0 (0.0%) |
| College/Associate Degree | 16 (84.2%) | 3 (15.8%) |
| Bachelor's Degree or higher | 3 (100.0%) | 0 (0.0%) |
Occupancy by Age of Householder in Port Alexander
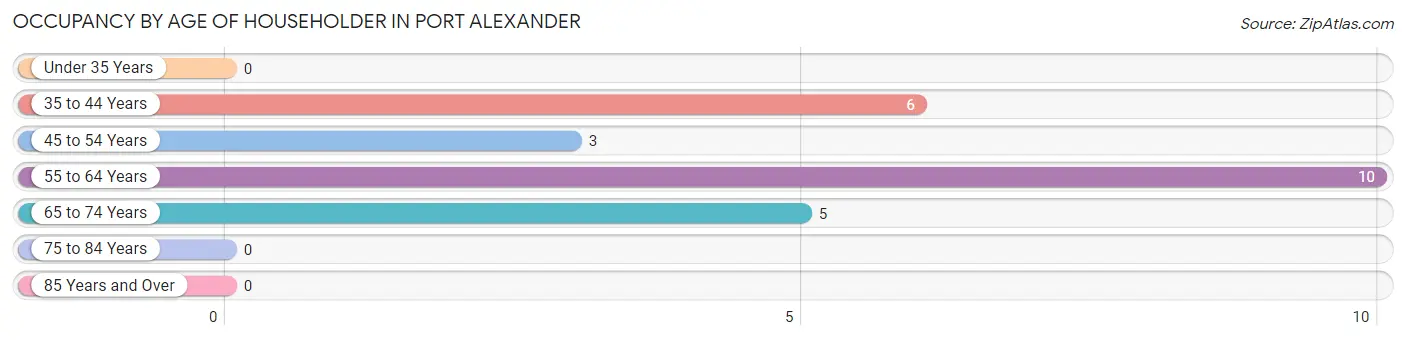
| Age Bracket | # Households | % Households |
| Under 35 Years | 0 | 0.0% |
| 35 to 44 Years | 6 | 25.0% |
| 45 to 54 Years | 3 | 12.5% |
| 55 to 64 Years | 10 | 41.7% |
| 65 to 74 Years | 5 | 20.8% |
| 75 to 84 Years | 0 | 0.0% |
| 85 Years and Over | 0 | 0.0% |
| Total | 24 | 100.0% |
Housing Finances in Port Alexander
Median Income by Occupancy in Port Alexander
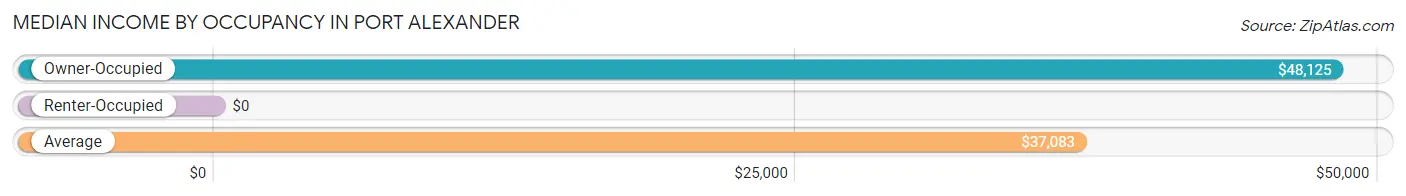
| Occupancy Type | # Households | Median Income |
| Owner-Occupied | 21 (87.5%) | $48,125 |
| Renter-Occupied | 3 (12.5%) | $0 |
| Average | 24 (100.0%) | $37,083 |
Occupancy by Householder Income Bracket in Port Alexander
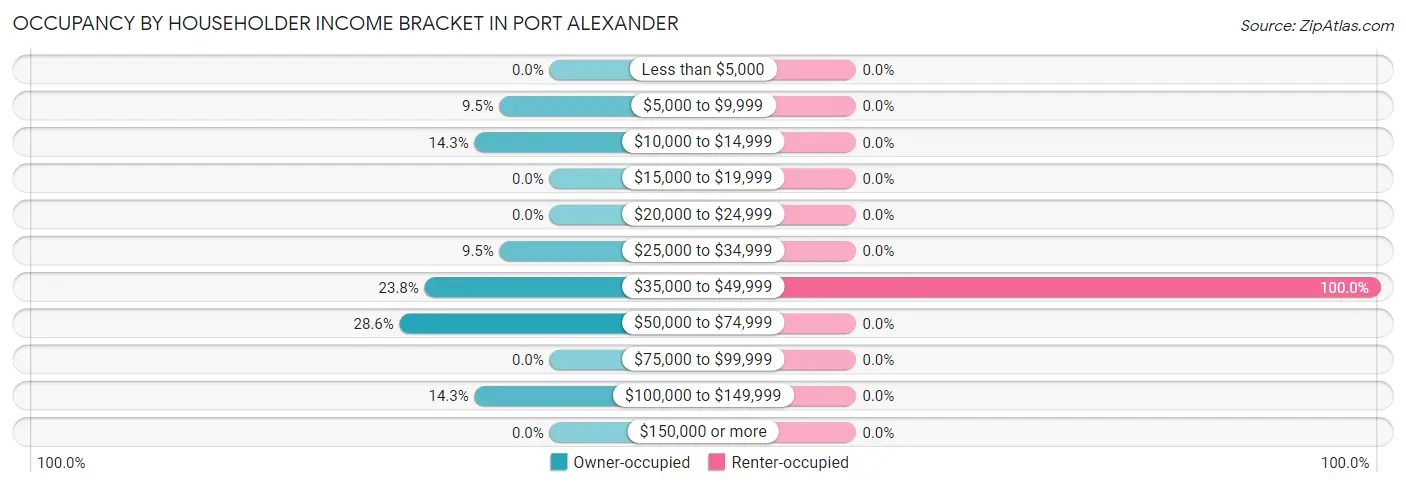
| Income Bracket | Owner-occupied | Renter-occupied |
| Less than $5,000 | 0 (0.0%) | 0 (0.0%) |
| $5,000 to $9,999 | 2 (9.5%) | 0 (0.0%) |
| $10,000 to $14,999 | 3 (14.3%) | 0 (0.0%) |
| $15,000 to $19,999 | 0 (0.0%) | 0 (0.0%) |
| $20,000 to $24,999 | 0 (0.0%) | 0 (0.0%) |
| $25,000 to $34,999 | 2 (9.5%) | 0 (0.0%) |
| $35,000 to $49,999 | 5 (23.8%) | 3 (100.0%) |
| $50,000 to $74,999 | 6 (28.6%) | 0 (0.0%) |
| $75,000 to $99,999 | 0 (0.0%) | 0 (0.0%) |
| $100,000 to $149,999 | 3 (14.3%) | 0 (0.0%) |
| $150,000 or more | 0 (0.0%) | 0 (0.0%) |
| Total | 21 (100.0%) | 3 (100.0%) |
Monthly Housing Cost Tiers in Port Alexander
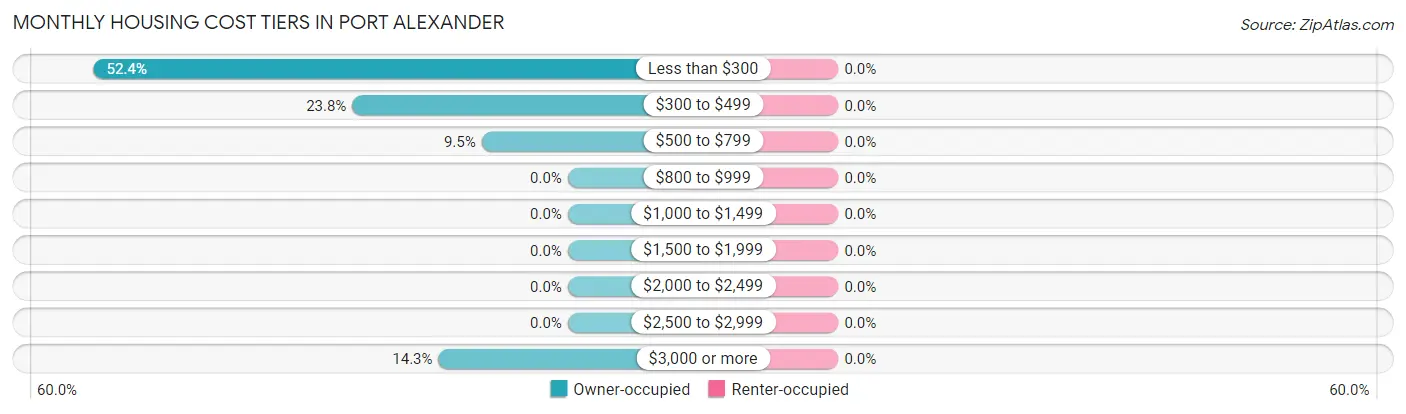
| Monthly Cost | Owner-occupied | Renter-occupied |
| Less than $300 | 11 (52.4%) | 0 (0.0%) |
| $300 to $499 | 5 (23.8%) | 0 (0.0%) |
| $500 to $799 | 2 (9.5%) | 0 (0.0%) |
| $800 to $999 | 0 (0.0%) | 0 (0.0%) |
| $1,000 to $1,499 | 0 (0.0%) | 0 (0.0%) |
| $1,500 to $1,999 | 0 (0.0%) | 0 (0.0%) |
| $2,000 to $2,499 | 0 (0.0%) | 0 (0.0%) |
| $2,500 to $2,999 | 0 (0.0%) | 0 (0.0%) |
| $3,000 or more | 3 (14.3%) | 0 (0.0%) |
| Total | 21 (100.0%) | 3 (100.0%) |
Physical Housing Characteristics in Port Alexander
Housing Structures in Port Alexander
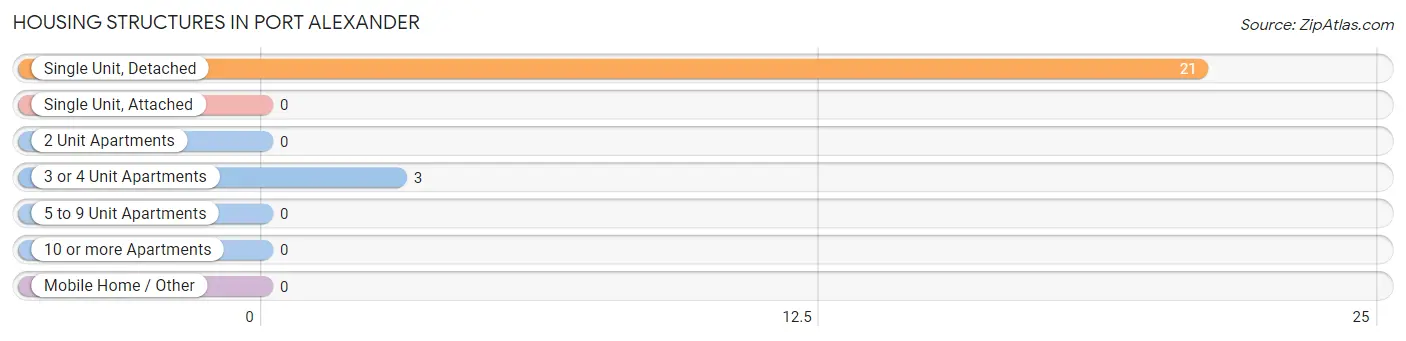
| Structure Type | # Housing Units | % Housing Units |
| Single Unit, Detached | 21 | 87.5% |
| Single Unit, Attached | 0 | 0.0% |
| 2 Unit Apartments | 0 | 0.0% |
| 3 or 4 Unit Apartments | 3 | 12.5% |
| 5 to 9 Unit Apartments | 0 | 0.0% |
| 10 or more Apartments | 0 | 0.0% |
| Mobile Home / Other | 0 | 0.0% |
| Total | 24 | 100.0% |
Housing Structures by Occupancy in Port Alexander
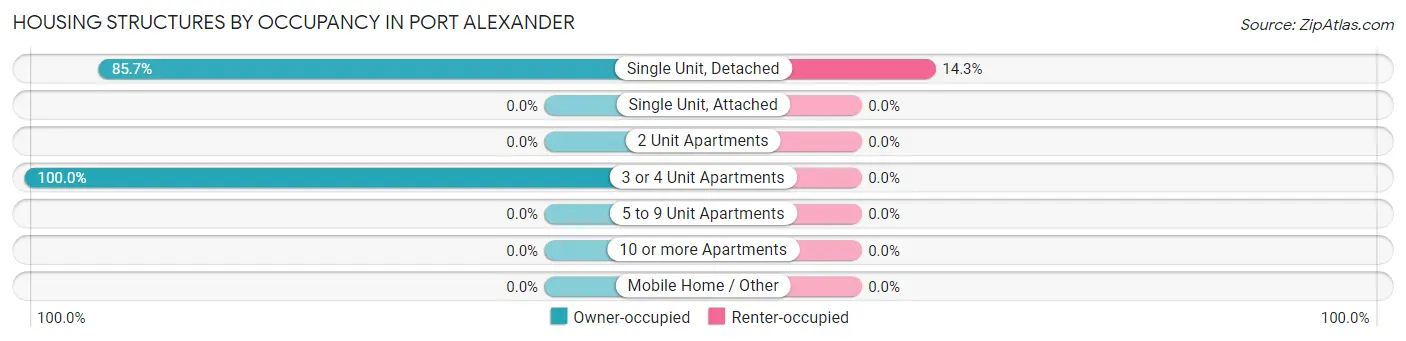
| Structure Type | Owner-occupied | Renter-occupied |
| Single Unit, Detached | 18 (85.7%) | 3 (14.3%) |
| Single Unit, Attached | 0 (0.0%) | 0 (0.0%) |
| 2 Unit Apartments | 0 (0.0%) | 0 (0.0%) |
| 3 or 4 Unit Apartments | 3 (100.0%) | 0 (0.0%) |
| 5 to 9 Unit Apartments | 0 (0.0%) | 0 (0.0%) |
| 10 or more Apartments | 0 (0.0%) | 0 (0.0%) |
| Mobile Home / Other | 0 (0.0%) | 0 (0.0%) |
| Total | 21 (87.5%) | 3 (12.5%) |
Housing Structures by Number of Rooms in Port Alexander
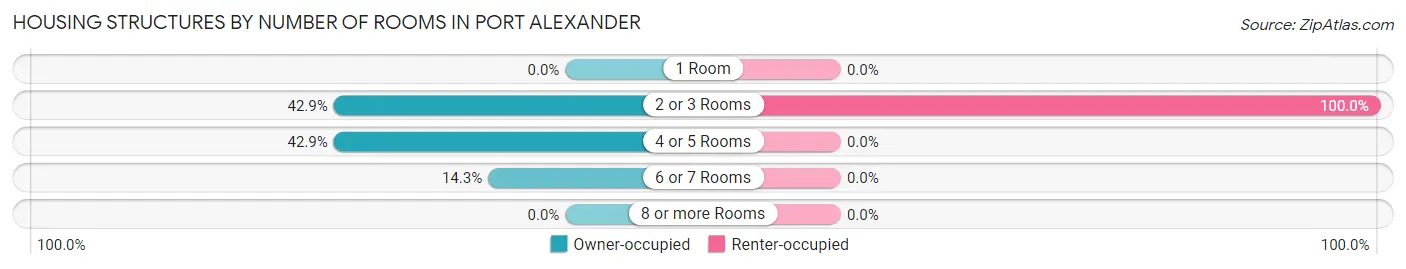
| Number of Rooms | Owner-occupied | Renter-occupied |
| 1 Room | 0 (0.0%) | 0 (0.0%) |
| 2 or 3 Rooms | 9 (42.9%) | 3 (100.0%) |
| 4 or 5 Rooms | 9 (42.9%) | 0 (0.0%) |
| 6 or 7 Rooms | 3 (14.3%) | 0 (0.0%) |
| 8 or more Rooms | 0 (0.0%) | 0 (0.0%) |
| Total | 21 (100.0%) | 3 (100.0%) |
Housing Structure by Heating Type in Port Alexander
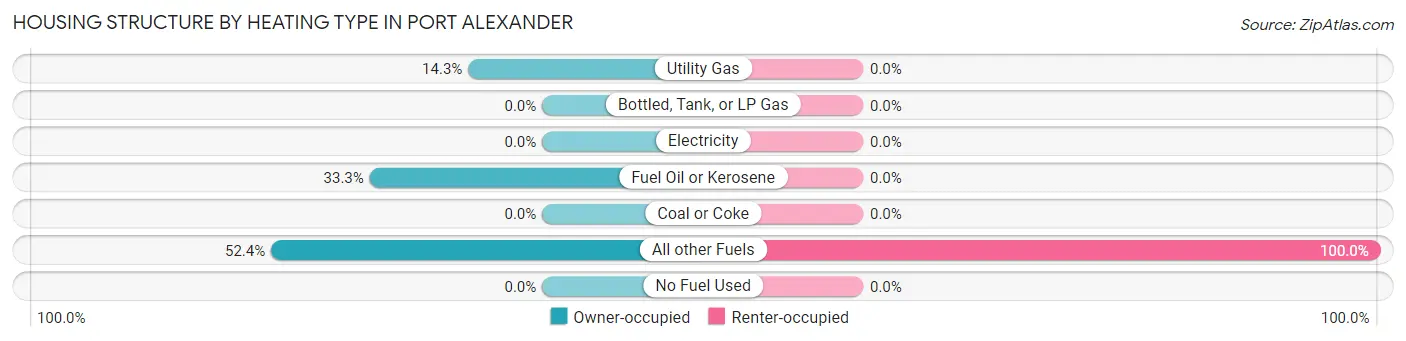
| Heating Type | Owner-occupied | Renter-occupied |
| Utility Gas | 3 (14.3%) | 0 (0.0%) |
| Bottled, Tank, or LP Gas | 0 (0.0%) | 0 (0.0%) |
| Electricity | 0 (0.0%) | 0 (0.0%) |
| Fuel Oil or Kerosene | 7 (33.3%) | 0 (0.0%) |
| Coal or Coke | 0 (0.0%) | 0 (0.0%) |
| All other Fuels | 11 (52.4%) | 3 (100.0%) |
| No Fuel Used | 0 (0.0%) | 0 (0.0%) |
| Total | 21 (100.0%) | 3 (100.0%) |
Household Vehicle Usage in Port Alexander
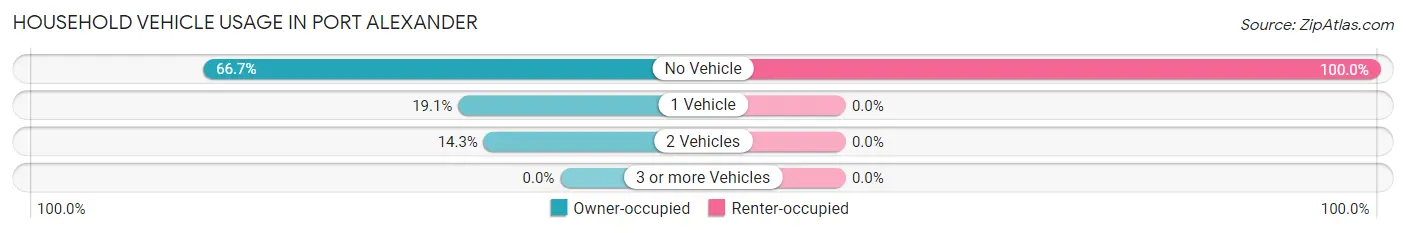
| Vehicles per Household | Owner-occupied | Renter-occupied |
| No Vehicle | 14 (66.7%) | 3 (100.0%) |
| 1 Vehicle | 4 (19.1%) | 0 (0.0%) |
| 2 Vehicles | 3 (14.3%) | 0 (0.0%) |
| 3 or more Vehicles | 0 (0.0%) | 0 (0.0%) |
| Total | 21 (100.0%) | 3 (100.0%) |
Real Estate & Mortgages in Port Alexander
Real Estate and Mortgage Overview in Port Alexander
| Characteristic | Without Mortgage | With Mortgage |
| Housing Units | 18 | 3 |
| Median Property Value | $112,500 | $0 |
| Median Household Income | $36,667 | $0 |
| Monthly Housing Costs | - | - |
| Real Estate Taxes | - | - |
Property Value by Mortgage Status in Port Alexander
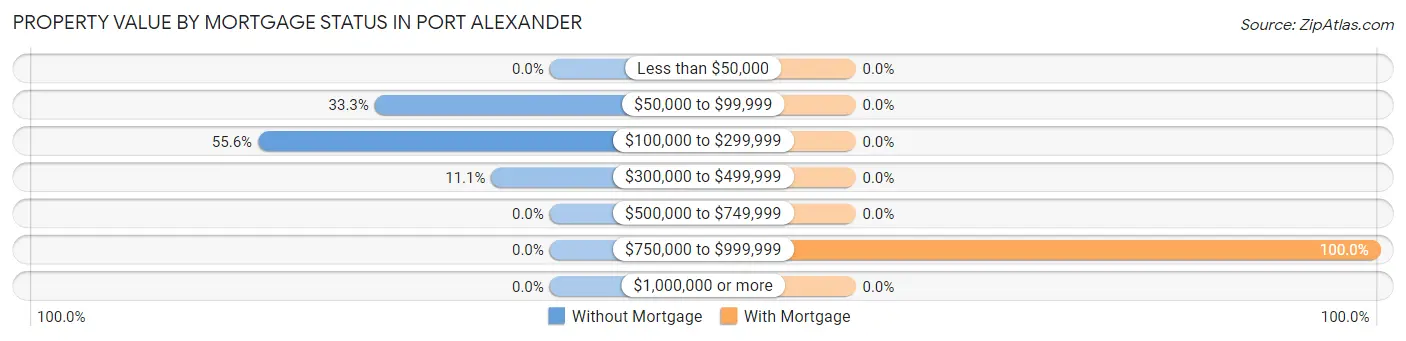
| Property Value | Without Mortgage | With Mortgage |
| Less than $50,000 | 0 (0.0%) | 0 (0.0%) |
| $50,000 to $99,999 | 6 (33.3%) | 0 (0.0%) |
| $100,000 to $299,999 | 10 (55.6%) | 0 (0.0%) |
| $300,000 to $499,999 | 2 (11.1%) | 0 (0.0%) |
| $500,000 to $749,999 | 0 (0.0%) | 0 (0.0%) |
| $750,000 to $999,999 | 0 (0.0%) | 3 (100.0%) |
| $1,000,000 or more | 0 (0.0%) | 0 (0.0%) |
| Total | 18 (100.0%) | 3 (100.0%) |
Household Income by Mortgage Status in Port Alexander
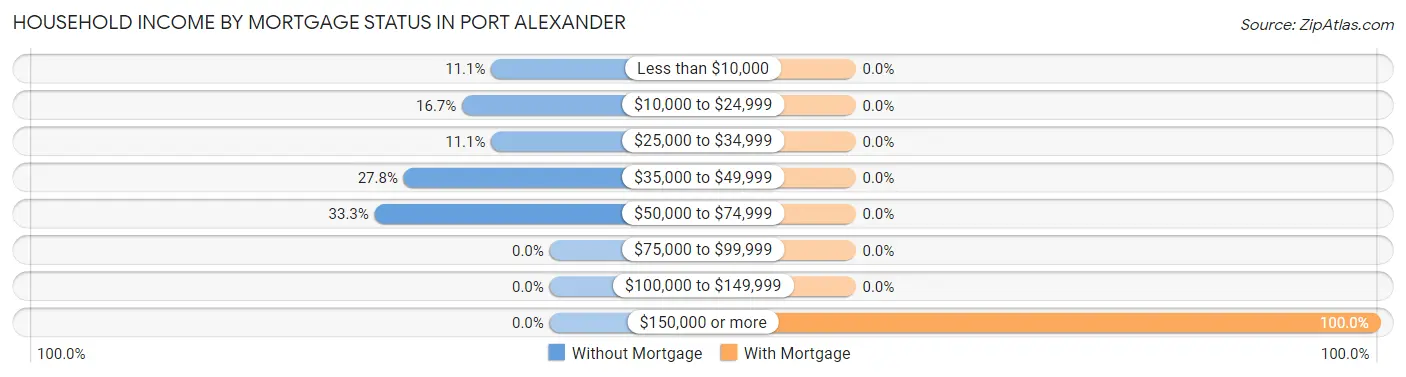
| Household Income | Without Mortgage | With Mortgage |
| Less than $10,000 | 2 (11.1%) | 0 (0.0%) |
| $10,000 to $24,999 | 3 (16.7%) | 0 (0.0%) |
| $25,000 to $34,999 | 2 (11.1%) | 0 (0.0%) |
| $35,000 to $49,999 | 5 (27.8%) | 0 (0.0%) |
| $50,000 to $74,999 | 6 (33.3%) | 0 (0.0%) |
| $75,000 to $99,999 | 0 (0.0%) | 0 (0.0%) |
| $100,000 to $149,999 | 0 (0.0%) | 0 (0.0%) |
| $150,000 or more | 0 (0.0%) | 3 (100.0%) |
| Total | 18 (100.0%) | 3 (100.0%) |
Property Value to Household Income Ratio in Port Alexander
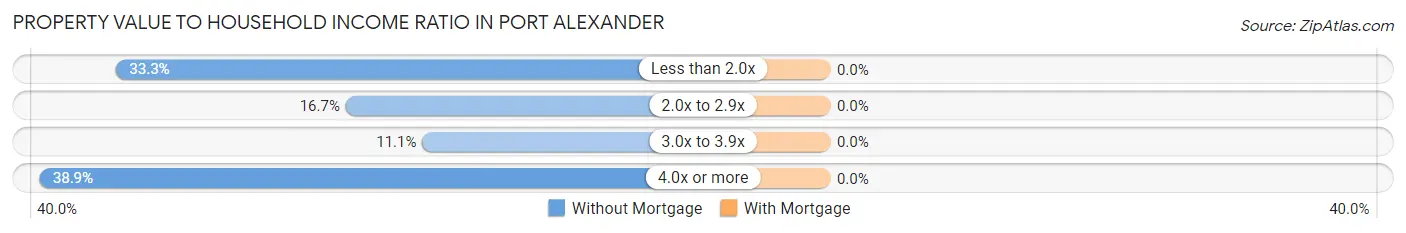
| Value-to-Income Ratio | Without Mortgage | With Mortgage |
| Less than 2.0x | 6 (33.3%) | 0 (0.0%) |
| 2.0x to 2.9x | 3 (16.7%) | 0 (0.0%) |
| 3.0x to 3.9x | 2 (11.1%) | 0 (0.0%) |
| 4.0x or more | 7 (38.9%) | 0 (0.0%) |
| Total | 18 (100.0%) | 3 (100.0%) |
Real Estate Taxes by Mortgage Status in Port Alexander
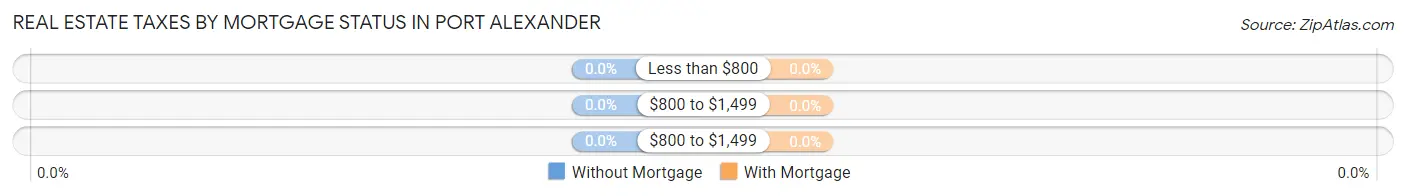
| Property Taxes | Without Mortgage | With Mortgage |
| Less than $800 | 0 (0.0%) | 0 (0.0%) |
| $800 to $1,499 | 0 (0.0%) | 0 (0.0%) |
| $800 to $1,499 | 0 (0.0%) | 0 (0.0%) |
| Total | 18 (100.0%) | 3 (100.0%) |
Health & Disability in Port Alexander
Health Insurance Coverage by Age in Port Alexander
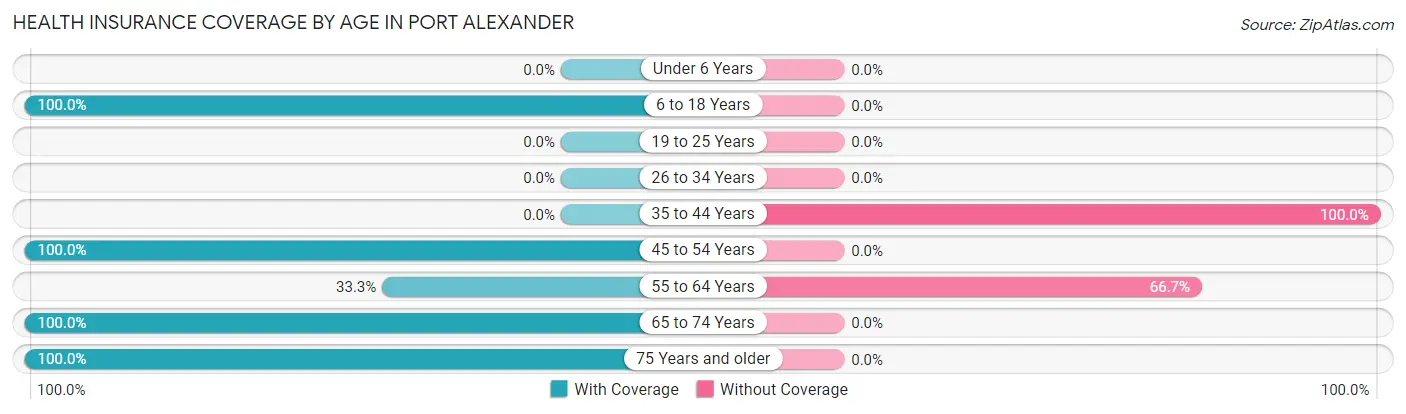
| Age Bracket | With Coverage | Without Coverage |
| Under 6 Years | 0 (0.0%) | 0 (0.0%) |
| 6 to 18 Years | 3 (100.0%) | 0 (0.0%) |
| 19 to 25 Years | 0 (0.0%) | 0 (0.0%) |
| 26 to 34 Years | 0 (0.0%) | 0 (0.0%) |
| 35 to 44 Years | 0 (0.0%) | 10 (100.0%) |
| 45 to 54 Years | 3 (100.0%) | 0 (0.0%) |
| 55 to 64 Years | 4 (33.3%) | 8 (66.7%) |
| 65 to 74 Years | 10 (100.0%) | 0 (0.0%) |
| 75 Years and older | 1 (100.0%) | 0 (0.0%) |
| Total | 21 (53.8%) | 18 (46.2%) |
Health Insurance Coverage by Citizenship Status in Port Alexander
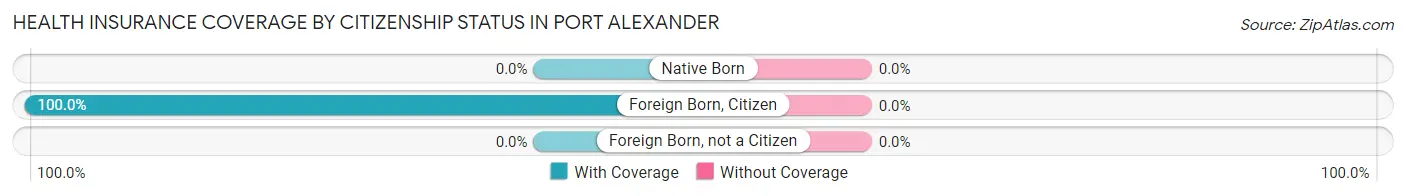
| Citizenship Status | With Coverage | Without Coverage |
| Native Born | 0 (0.0%) | 0 (0.0%) |
| Foreign Born, Citizen | 3 (100.0%) | 0 (0.0%) |
| Foreign Born, not a Citizen | 0 (0.0%) | 0 (0.0%) |
Health Insurance Coverage by Household Income in Port Alexander
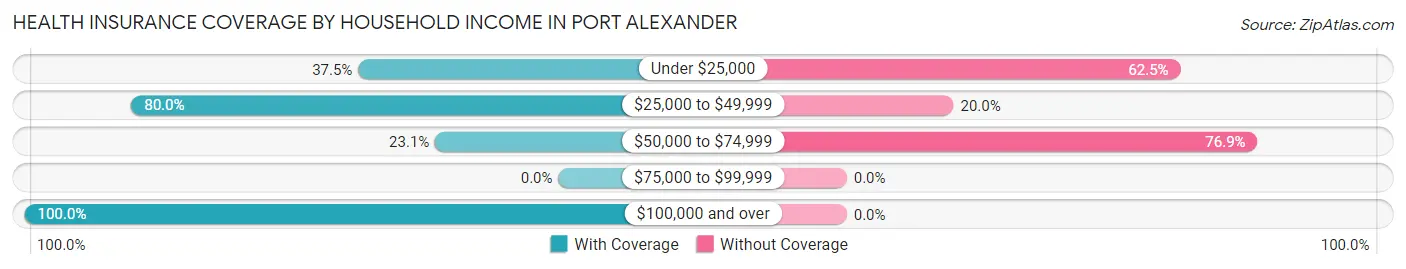
| Household Income | With Coverage | Without Coverage |
| Under $25,000 | 3 (37.5%) | 5 (62.5%) |
| $25,000 to $49,999 | 12 (80.0%) | 3 (20.0%) |
| $50,000 to $74,999 | 3 (23.1%) | 10 (76.9%) |
| $75,000 to $99,999 | 0 (0.0%) | 0 (0.0%) |
| $100,000 and over | 3 (100.0%) | 0 (0.0%) |
Public vs Private Health Insurance Coverage by Age in Port Alexander
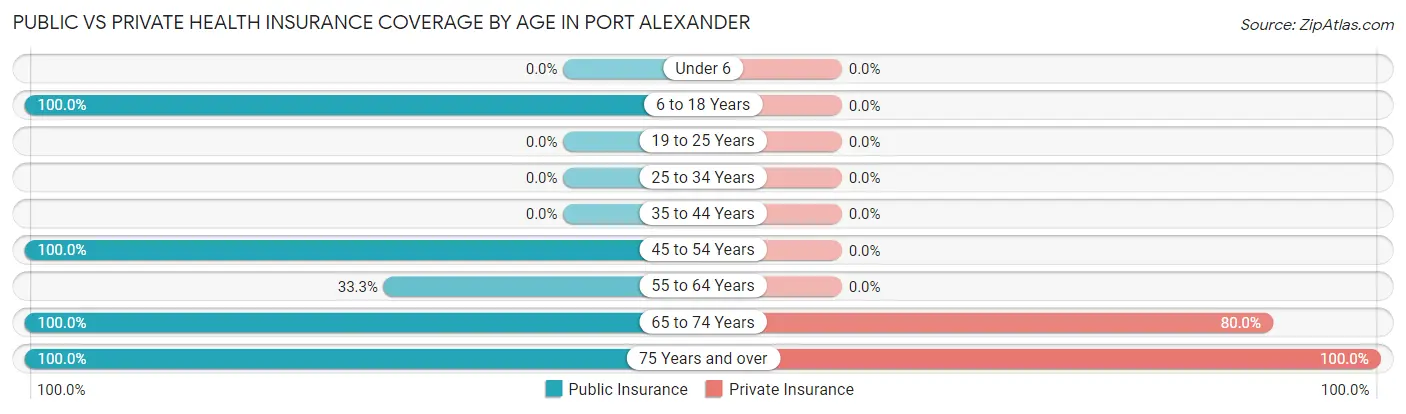
| Age Bracket | Public Insurance | Private Insurance |
| Under 6 | 0 (0.0%) | 0 (0.0%) |
| 6 to 18 Years | 3 (100.0%) | 0 (0.0%) |
| 19 to 25 Years | 0 (0.0%) | 0 (0.0%) |
| 25 to 34 Years | 0 (0.0%) | 0 (0.0%) |
| 35 to 44 Years | 0 (0.0%) | 0 (0.0%) |
| 45 to 54 Years | 3 (100.0%) | 0 (0.0%) |
| 55 to 64 Years | 4 (33.3%) | 0 (0.0%) |
| 65 to 74 Years | 10 (100.0%) | 8 (80.0%) |
| 75 Years and over | 1 (100.0%) | 1 (100.0%) |
| Total | 21 (53.8%) | 9 (23.1%) |
Disability Status by Sex by Age in Port Alexander
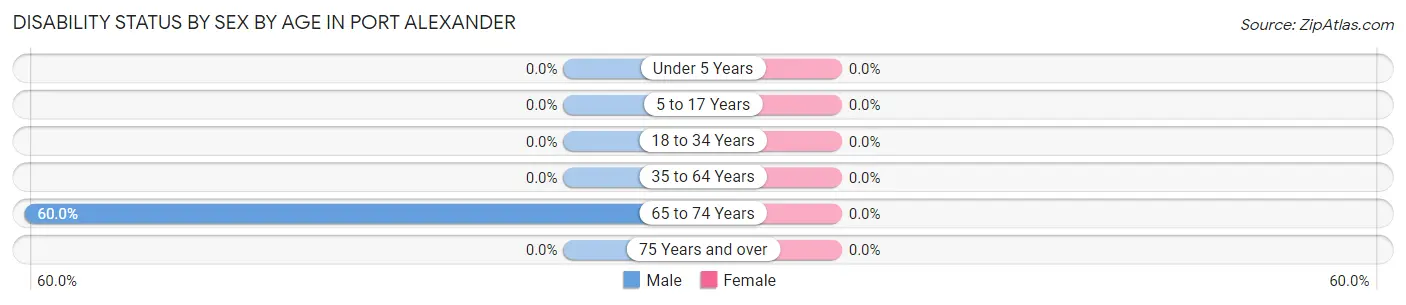
| Age Bracket | Male | Female |
| Under 5 Years | 0 (0.0%) | 0 (0.0%) |
| 5 to 17 Years | 0 (0.0%) | 0 (0.0%) |
| 18 to 34 Years | 0 (0.0%) | 0 (0.0%) |
| 35 to 64 Years | 0 (0.0%) | 0 (0.0%) |
| 65 to 74 Years | 6 (60.0%) | 0 (0.0%) |
| 75 Years and over | 0 (0.0%) | 0 (0.0%) |
Disability Class by Sex by Age in Port Alexander
Disability Class: Hearing Difficulty
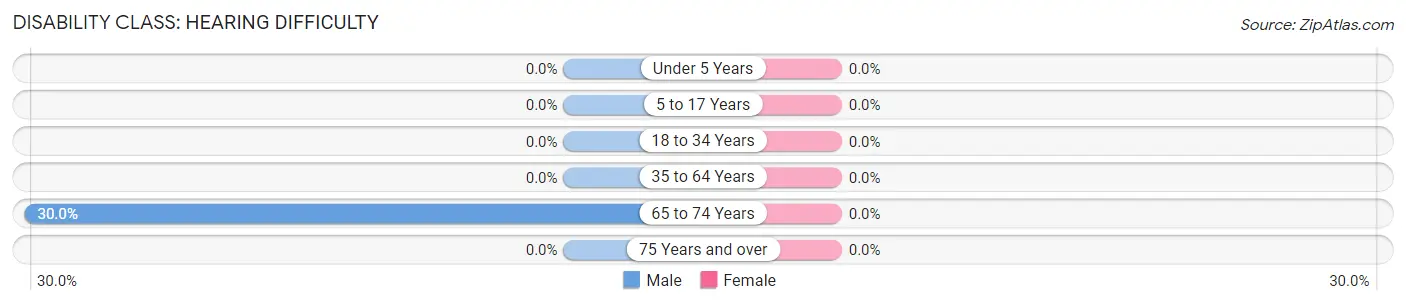
| Age Bracket | Male | Female |
| Under 5 Years | 0 (0.0%) | 0 (0.0%) |
| 5 to 17 Years | 0 (0.0%) | 0 (0.0%) |
| 18 to 34 Years | 0 (0.0%) | 0 (0.0%) |
| 35 to 64 Years | 0 (0.0%) | 0 (0.0%) |
| 65 to 74 Years | 3 (30.0%) | 0 (0.0%) |
| 75 Years and over | 0 (0.0%) | 0 (0.0%) |
Disability Class: Vision Difficulty
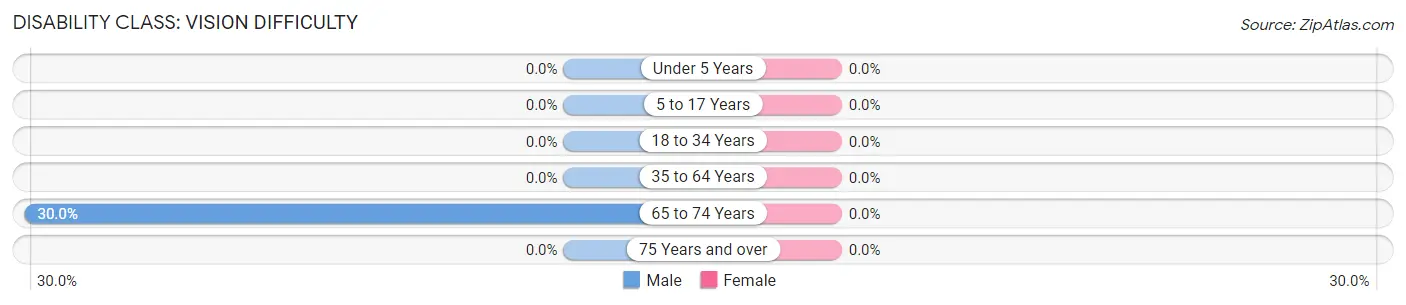
| Age Bracket | Male | Female |
| Under 5 Years | 0 (0.0%) | 0 (0.0%) |
| 5 to 17 Years | 0 (0.0%) | 0 (0.0%) |
| 18 to 34 Years | 0 (0.0%) | 0 (0.0%) |
| 35 to 64 Years | 0 (0.0%) | 0 (0.0%) |
| 65 to 74 Years | 3 (30.0%) | 0 (0.0%) |
| 75 Years and over | 0 (0.0%) | 0 (0.0%) |
Disability Class: Cognitive Difficulty
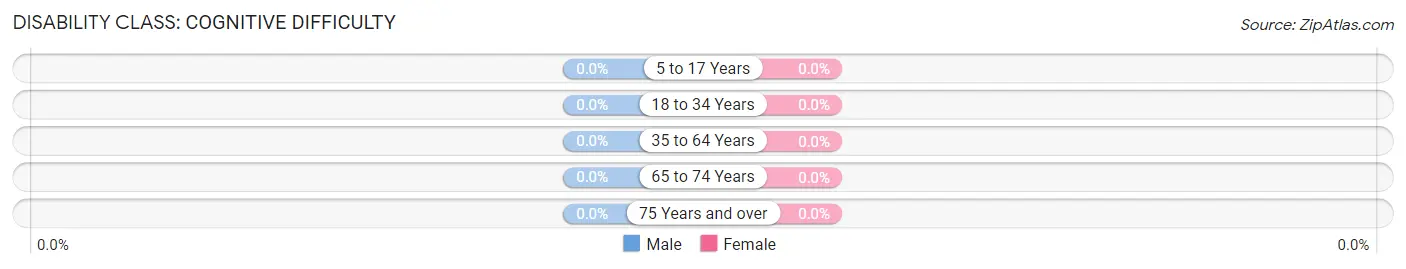
| Age Bracket | Male | Female |
| 5 to 17 Years | 0 (0.0%) | 0 (0.0%) |
| 18 to 34 Years | 0 (0.0%) | 0 (0.0%) |
| 35 to 64 Years | 0 (0.0%) | 0 (0.0%) |
| 65 to 74 Years | 0 (0.0%) | 0 (0.0%) |
| 75 Years and over | 0 (0.0%) | 0 (0.0%) |
Disability Class: Ambulatory Difficulty
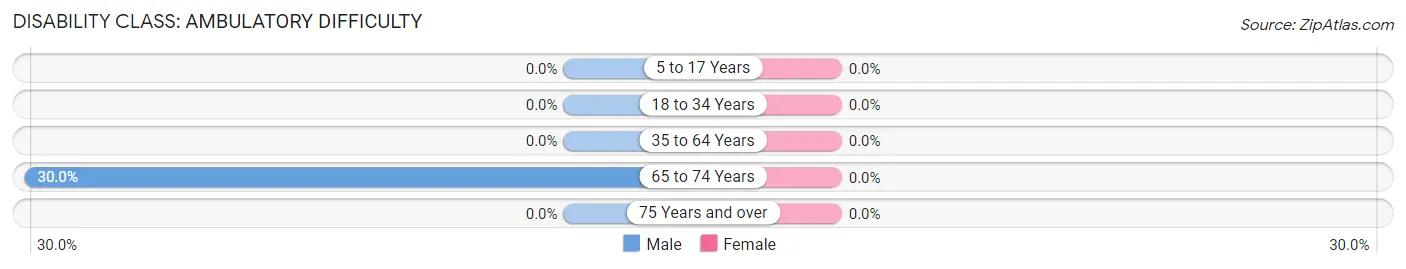
| Age Bracket | Male | Female |
| 5 to 17 Years | 0 (0.0%) | 0 (0.0%) |
| 18 to 34 Years | 0 (0.0%) | 0 (0.0%) |
| 35 to 64 Years | 0 (0.0%) | 0 (0.0%) |
| 65 to 74 Years | 3 (30.0%) | 0 (0.0%) |
| 75 Years and over | 0 (0.0%) | 0 (0.0%) |
Disability Class: Self-Care Difficulty
| Age Bracket | Male | Female |
| 5 to 17 Years | 0 (0.0%) | 0 (0.0%) |
| 18 to 34 Years | 0 (0.0%) | 0 (0.0%) |
| 35 to 64 Years | 0 (0.0%) | 0 (0.0%) |
| 65 to 74 Years | 0 (0.0%) | 0 (0.0%) |
| 75 Years and over | 0 (0.0%) | 0 (0.0%) |
Technology Access in Port Alexander
Computing Device Access in Port Alexander
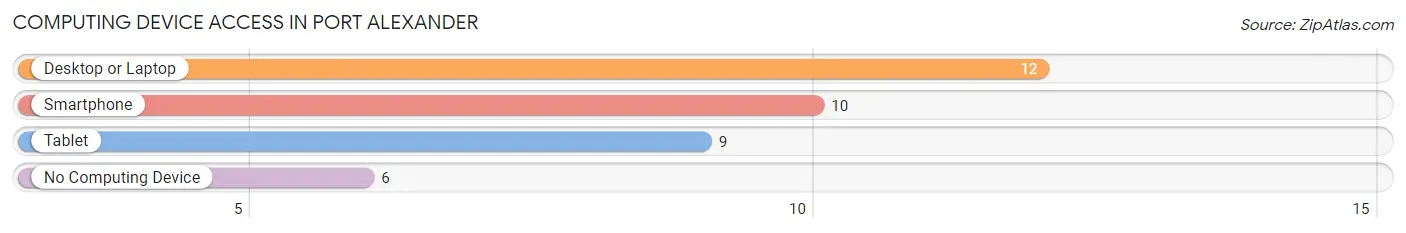
| Device Type | # Households | % Households |
| Desktop or Laptop | 12 | 50.0% |
| Smartphone | 10 | 41.7% |
| Tablet | 9 | 37.5% |
| No Computing Device | 6 | 25.0% |
| Total | 24 | 100.0% |
Internet Access in Port Alexander
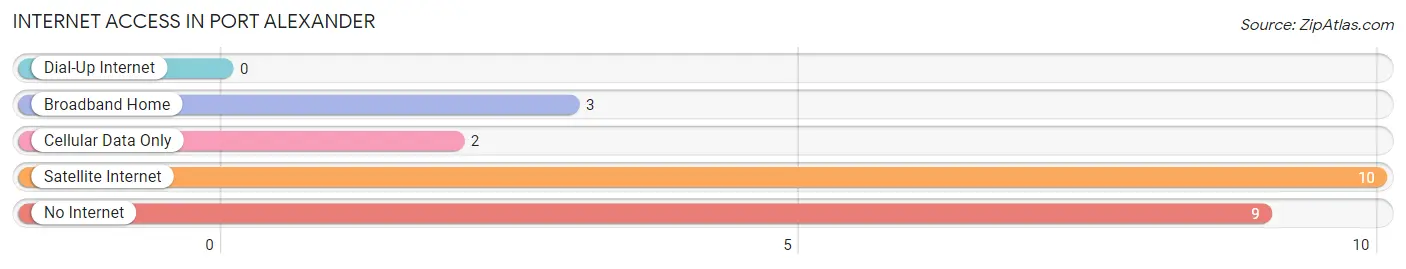
| Internet Type | # Households | % Households |
| Dial-Up Internet | 0 | 0.0% |
| Broadband Home | 3 | 12.5% |
| Cellular Data Only | 2 | 8.3% |
| Satellite Internet | 10 | 41.7% |
| No Internet | 9 | 37.5% |
| Total | 24 | 100.0% |
Port Alexander Summary
Alexander, Alaska is a small fishing village located on the southeastern coast of Baranof Island in the Alexander Archipelago of the Gulf of Alaska. It is part of the City and Borough of Sitka, Alaska, and is located approximately 30 miles southwest of the city of Sitka. The population of Alexander was estimated to be around 200 people in 2020.
History
Alexander was first settled by the Tlingit people, who had lived in the area for thousands of years prior to the arrival of Europeans. The first recorded European contact with the area was in 1799, when the Russian explorer Alexander Baranov arrived in the area. Baranov established a trading post in the area, which was later abandoned in 1808.
In 1867, the United States purchased Alaska from Russia, and the area around Alexander was included in the purchase. In 1882, the U.S. Army established a military post in the area, which was later abandoned in 1891.
In the early 1900s, the area around Alexander was settled by fishermen, who established a cannery in the area. The cannery was later abandoned in the 1950s, and the area around Alexander became a fishing village.
Geography
Alexander is located on the southeastern coast of Baranof Island in the Alexander Archipelago of the Gulf of Alaska. The village is situated on a small bay, which is protected from the open ocean by a small island. The bay is surrounded by steep mountains, which rise to a height of over 3,000 feet.
The climate in Alexander is mild and wet, with temperatures rarely dropping below freezing. The average annual precipitation is around 80 inches, with most of the precipitation falling in the form of rain.
Economy
The economy of Alexander is largely based on fishing and tourism. The village is home to several commercial fishing operations, which harvest salmon, halibut, and other fish from the surrounding waters. The village also has a small tourism industry, with visitors coming to the area to fish, hunt, and explore the surrounding wilderness.
Demographics
The population of Alexander was estimated to be around 200 people in 2020. The majority of the population is of Native American descent, with the majority being of Tlingit heritage. The village also has a small population of non-Native Americans, mostly of European descent.
The primary language spoken in Alexander is English, although some residents also speak Tlingit. The village is served by a small school, which offers classes from kindergarten through high school. The village also has a small medical clinic, which provides basic medical care to the residents.
Common Questions
What is Per Capita Income in Port Alexander?
Per Capita income in Port Alexander is $26,628.
What is the Median Family Income in Port Alexander?
Median Family Income in Port Alexander is $47,656.
What is the Median Household income in Port Alexander?
Median Household Income in Port Alexander is $37,083.
What is Inequality or Gini Index in Port Alexander?
Inequality or Gini Index in Port Alexander is 0.31.
What is the Total Population of Port Alexander?
Total Population of Port Alexander is 39.
What is the Total Male Population of Port Alexander?
Total Male Population of Port Alexander is 23.
What is the Total Female Population of Port Alexander?
Total Female Population of Port Alexander is 16.
What is the Ratio of Males per 100 Females in Port Alexander?
There are 143.75 Males per 100 Females in Port Alexander.
What is the Ratio of Females per 100 Males in Port Alexander?
There are 69.57 Females per 100 Males in Port Alexander.
What is the Median Population Age in Port Alexander?
Median Population Age in Port Alexander is 57.8 Years.
What is the Average Family Size in Port Alexander
Average Family Size in Port Alexander is 1.7 People.
What is the Average Household Size in Port Alexander
Average Household Size in Port Alexander is 1.6 People.
How Large is the Labor Force in Port Alexander?
There are 16 People in the Labor Forcein in Port Alexander.
What is the Percentage of People in the Labor Force in Port Alexander?
44.4% of People are in the Labor Force in Port Alexander.
What is the Unemployment Rate in Port Alexander?
Unemployment Rate in Port Alexander is 25.0%.