Zip Codes with the Highest Percentage of Population Employed in Arts, Entertainment & Recreation in the United States
RELATED REPORTS & OPTIONS
Arts, Entertainment & Recreation
United States
Compare Zip Codes
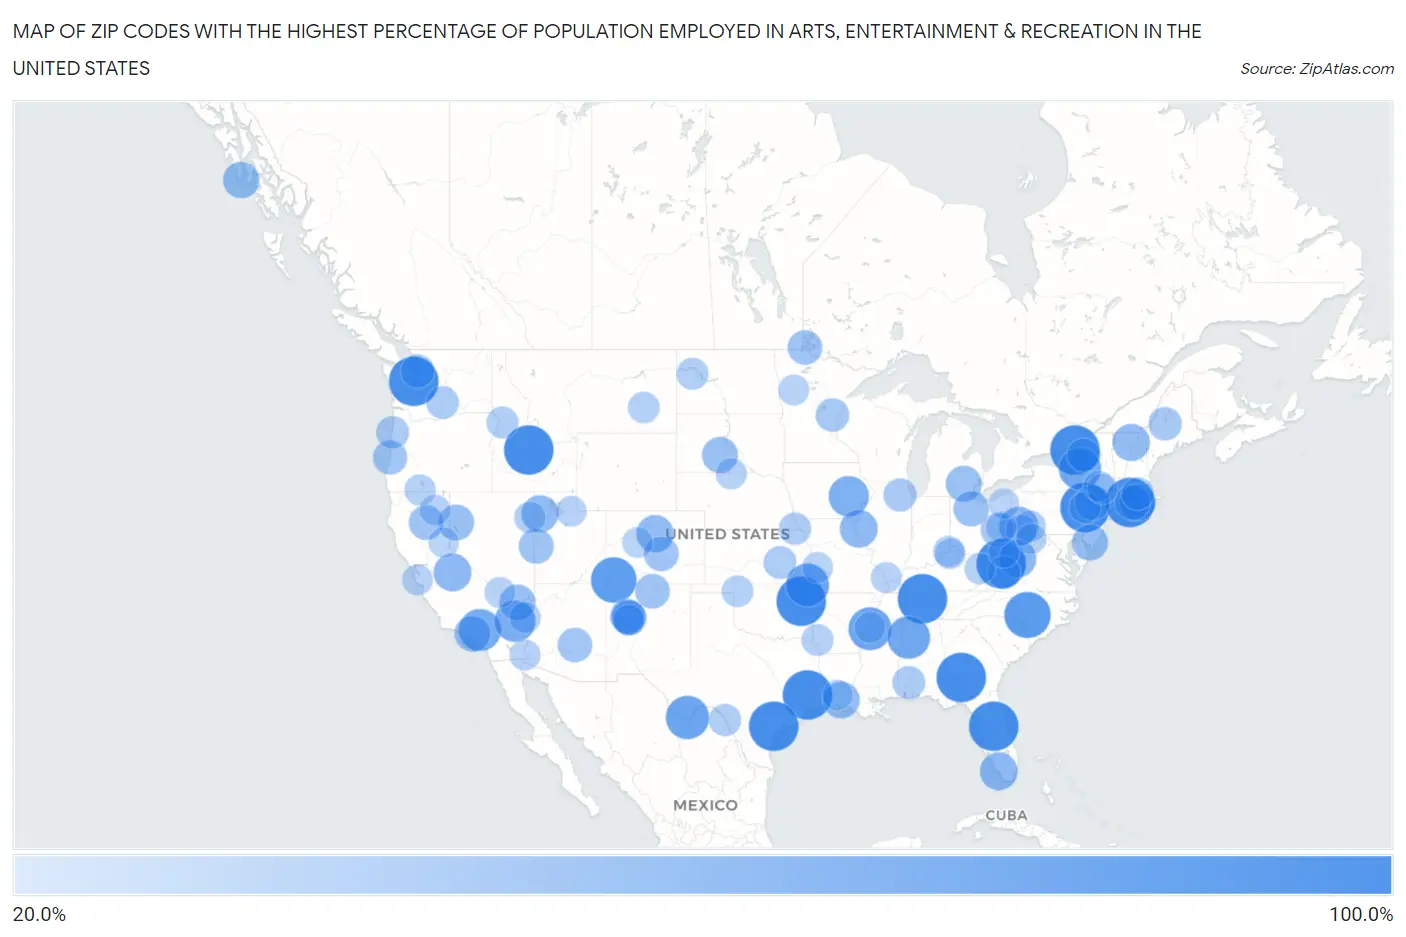
Map of Zip Codes with the Highest Percentage of Population Employed in Arts, Entertainment & Recreation in the United States
20.0%
100.0%
Zip Codes with the Highest Percentage of Population Employed in Arts, Entertainment & Recreation in the United States
| Zip Code | % Employed | vs State | vs National | |
| 1. | 77326 | 100.0% | 1.5%(+98.5)#1 | 2.1%(+97.9)#1 |
| 2. | 25057 | 100.0% | 1.6%(+98.4)#1 | 2.1%(+97.9)#2 |
| 3. | 31704 | 100.0% | 1.6%(+98.4)#1 | 2.1%(+97.9)#3 |
| 4. | 13632 | 100.0% | 2.4%(+97.6)#1 | 2.1%(+97.9)#4 |
| 5. | 18323 | 100.0% | 1.8%(+98.2)#1 | 2.1%(+97.9)#5 |
| 6. | 06353 | 100.0% | 2.5%(+97.5)#1 | 2.1%(+97.9)#6 |
| 7. | 83227 | 100.0% | 1.8%(+98.2)#1 | 2.1%(+97.9)#7 |
| 8. | 77960 | 100.0% | 1.5%(+98.5)#2 | 2.1%(+97.9)#8 |
| 9. | 34729 | 100.0% | 2.9%(+97.1)#1 | 2.1%(+97.9)#9 |
| 10. | 37213 | 100.0% | 1.8%(+98.2)#1 | 2.1%(+97.9)#10 |
| 11. | 98353 | 100.0% | 2.1%(+97.9)#1 | 2.1%(+97.9)#11 |
| 12. | 74477 | 100.0% | 2.4%(+97.6)#1 | 2.1%(+97.9)#12 |
| 13. | 28350 | 87.2% | 1.8%(+85.5)#1 | 2.1%(+85.2)#13 |
| 14. | 81330 | 84.7% | 2.6%(+82.1)#1 | 2.1%(+82.6)#14 |
| 15. | 79834 | 76.0% | 1.5%(+74.5)#3 | 2.1%(+73.9)#15 |
| 16. | 38644 | 75.0% | 2.1%(+72.9)#1 | 2.1%(+72.9)#16 |
| 17. | 74360 | 75.0% | 2.4%(+72.6)#2 | 2.1%(+72.9)#17 |
| 18. | 35559 | 73.3% | 1.4%(+72.0)#1 | 2.1%(+71.3)#18 |
| 19. | 13162 | 71.6% | 2.4%(+69.2)#2 | 2.1%(+69.5)#19 |
| 20. | 93563 | 71.4% | 2.6%(+68.9)#1 | 2.1%(+69.3)#20 |
| 21. | 92332 | 67.9% | 2.6%(+65.3)#2 | 2.1%(+65.8)#21 |
| 22. | 52307 | 64.6% | 1.5%(+63.1)#1 | 2.1%(+62.5)#22 |
| 23. | 15366 | 59.6% | 1.8%(+57.8)#2 | 2.1%(+57.5)#23 |
| 24. | 62359 | 55.3% | 1.9%(+53.4)#1 | 2.1%(+53.2)#24 |
| 25. | 95318 | 55.0% | 2.6%(+52.4)#3 | 2.1%(+52.9)#25 |
| 26. | 34138 | 54.6% | 2.9%(+51.7)#2 | 2.1%(+52.5)#26 |
| 27. | 26291 | 54.2% | 1.6%(+52.6)#2 | 2.1%(+52.1)#27 |
| 28. | 80427 | 53.2% | 2.6%(+50.6)#2 | 2.1%(+51.1)#28 |
| 29. | 05850 | 52.6% | 2.8%(+49.8)#1 | 2.1%(+50.5)#29 |
| 30. | 84083 | 51.8% | 2.1%(+49.8)#1 | 2.1%(+49.8)#30 |
| 31. | 70531 | 51.1% | 2.2%(+48.9)#1 | 2.1%(+49.0)#31 |
| 32. | 02875 | 50.0% | 2.4%(+47.6)#1 | 2.1%(+47.9)#32 |
| 33. | 99836 | 50.0% | 2.1%(+47.9)#1 | 2.1%(+47.9)#33 |
| 34. | 08316 | 48.6% | 2.1%(+46.5)#1 | 2.1%(+46.5)#34 |
| 35. | 89054 | 48.3% | 7.6%(+40.7)#1 | 2.1%(+46.2)#35 |
| 36. | 91608 | 48.2% | 2.6%(+45.7)#4 | 2.1%(+46.1)#36 |
| 37. | 48139 | 48.0% | 1.8%(+46.2)#1 | 2.1%(+45.9)#37 |
| 38. | 57562 | 47.7% | 1.9%(+45.8)#1 | 2.1%(+45.6)#38 |
| 39. | 89405 | 46.9% | 7.6%(+39.3)#2 | 2.1%(+44.8)#39 |
| 40. | 87040 | 46.4% | 2.3%(+44.1)#1 | 2.1%(+44.3)#40 |
| 41. | 06338 | 45.8% | 2.5%(+43.4)#2 | 2.1%(+43.8)#41 |
| 42. | 44809 | 45.7% | 1.7%(+44.0)#1 | 2.1%(+43.6)#42 |
| 43. | 18340 | 44.4% | 1.8%(+42.6)#3 | 2.1%(+42.4)#43 |
| 44. | 84728 | 44.2% | 2.1%(+42.1)#2 | 2.1%(+42.1)#44 |
| 45. | 96063 | 43.8% | 2.6%(+41.2)#5 | 2.1%(+41.7)#45 |
| 46. | 80860 | 43.5% | 2.6%(+40.9)#3 | 2.1%(+41.4)#46 |
| 47. | 87513 | 43.3% | 2.3%(+40.9)#2 | 2.1%(+41.2)#47 |
| 48. | 56711 | 43.1% | 1.9%(+41.2)#1 | 2.1%(+41.0)#48 |
| 49. | 85545 | 42.4% | 2.3%(+40.1)#1 | 2.1%(+40.3)#49 |
| 50. | 87014 | 42.2% | 2.3%(+39.8)#3 | 2.1%(+40.1)#50 |
| 51. | 97441 | 41.2% | 2.1%(+39.1)#1 | 2.1%(+39.1)#51 |
| 52. | 87038 | 41.0% | 2.3%(+38.6)#4 | 2.1%(+38.9)#52 |
| 53. | 43750 | 39.1% | 1.7%(+37.5)#2 | 2.1%(+37.0)#53 |
| 54. | 04442 | 38.8% | 1.7%(+37.0)#1 | 2.1%(+36.7)#54 |
| 55. | 98207 | 38.6% | 2.1%(+36.5)#2 | 2.1%(+36.6)#55 |
| 56. | 55036 | 38.5% | 1.9%(+36.5)#2 | 2.1%(+36.4)#56 |
| 57. | 13305 | 38.2% | 2.4%(+35.8)#3 | 2.1%(+36.2)#57 |
| 58. | 25989 | 37.7% | 1.6%(+36.1)#3 | 2.1%(+35.6)#58 |
| 59. | 60539 | 37.2% | 1.9%(+35.3)#2 | 2.1%(+35.1)#59 |
| 60. | 36550 | 36.2% | 1.4%(+34.8)#2 | 2.1%(+34.1)#60 |
| 61. | 97364 | 36.0% | 2.1%(+33.9)#2 | 2.1%(+33.9)#61 |
| 62. | 66843 | 35.5% | 1.7%(+33.7)#1 | 2.1%(+33.4)#62 |
| 63. | 98939 | 35.5% | 2.1%(+33.3)#3 | 2.1%(+33.4)#63 |
| 64. | 02829 | 35.0% | 2.4%(+32.6)#2 | 2.1%(+32.9)#64 |
| 65. | 68433 | 34.0% | 1.6%(+32.5)#1 | 2.1%(+32.0)#65 |
| 66. | 78877 | 34.0% | 1.5%(+32.5)#4 | 2.1%(+31.9)#66 |
| 67. | 58847 | 32.7% | 2.0%(+30.7)#1 | 2.1%(+30.6)#67 |
| 68. | 83542 | 32.5% | 1.8%(+30.7)#2 | 2.1%(+30.4)#68 |
| 69. | 71823 | 32.1% | 1.3%(+30.8)#1 | 2.1%(+30.1)#69 |
| 70. | 59333 | 31.8% | 2.5%(+29.3)#1 | 2.1%(+29.7)#70 |
| 71. | 18342 | 31.8% | 1.8%(+30.0)#4 | 2.1%(+29.7)#71 |
| 72. | 73851 | 31.4% | 2.4%(+29.0)#3 | 2.1%(+29.3)#72 |
| 73. | 15655 | 31.2% | 1.8%(+29.4)#5 | 2.1%(+29.1)#73 |
| 74. | 89883 | 30.9% | 7.6%(+23.2)#3 | 2.1%(+28.8)#74 |
| 75. | 89029 | 30.3% | 7.6%(+22.7)#4 | 2.1%(+28.2)#75 |
| 76. | 97627 | 30.0% | 2.1%(+27.9)#3 | 2.1%(+27.9)#76 |
| 77. | 47020 | 29.8% | 1.6%(+28.1)#1 | 2.1%(+27.7)#77 |
| 78. | 41271 | 29.8% | 1.4%(+28.3)#1 | 2.1%(+27.7)#78 |
| 79. | 69220 | 29.4% | 1.6%(+27.8)#2 | 2.1%(+27.3)#79 |
| 80. | 87007 | 29.2% | 2.3%(+26.8)#5 | 2.1%(+27.1)#80 |
| 81. | 89020 | 29.2% | 7.6%(+21.5)#5 | 2.1%(+27.1)#81 |
| 82. | 64750 | 28.8% | 1.8%(+27.0)#1 | 2.1%(+26.7)#82 |
| 83. | 38626 | 28.7% | 2.1%(+26.6)#2 | 2.1%(+26.6)#83 |
| 84. | 56591 | 28.6% | 1.9%(+26.7)#3 | 2.1%(+26.6)#84 |
| 85. | 62961 | 28.6% | 1.9%(+26.6)#3 | 2.1%(+26.5)#85 |
| 86. | 92283 | 28.4% | 2.6%(+25.8)#6 | 2.1%(+26.3)#86 |
| 87. | 96009 | 28.4% | 2.6%(+25.8)#7 | 2.1%(+26.3)#87 |
| 88. | 15449 | 28.4% | 1.8%(+26.6)#6 | 2.1%(+26.3)#88 |
| 89. | 43983 | 28.3% | 1.7%(+26.7)#3 | 2.1%(+26.3)#89 |
| 90. | 26638 | 28.3% | 1.6%(+26.7)#4 | 2.1%(+26.2)#90 |
| 91. | 84024 | 28.2% | 2.1%(+26.1)#3 | 2.1%(+26.1)#91 |
| 92. | 41052 | 28.1% | 1.4%(+26.7)#2 | 2.1%(+26.0)#92 |
| 93. | 94021 | 28.1% | 2.6%(+25.5)#8 | 2.1%(+26.0)#93 |
| 94. | 12407 | 27.9% | 2.4%(+25.5)#4 | 2.1%(+25.9)#94 |
| 95. | 81656 | 27.8% | 2.6%(+25.2)#4 | 2.1%(+25.7)#95 |
| 96. | 12427 | 27.6% | 2.4%(+25.2)#5 | 2.1%(+25.5)#96 |
| 97. | 44080 | 27.5% | 1.7%(+25.8)#4 | 2.1%(+25.4)#97 |
| 98. | 21523 | 27.4% | 1.9%(+25.5)#1 | 2.1%(+25.3)#98 |
| 99. | 70532 | 27.3% | 2.2%(+25.1)#2 | 2.1%(+25.2)#99 |
| 100. | 95728 | 27.2% | 2.6%(+24.7)#9 | 2.1%(+25.1)#100 |
Common Questions
What are the Top 10 Zip Codes with the Highest Percentage of Population Employed in Arts, Entertainment & Recreation in the United States?
Top 10 Zip Codes with the Highest Percentage of Population Employed in Arts, Entertainment & Recreation in the United States are:
What zip code has the Highest Percentage of Population Employed in Arts, Entertainment & Recreation in the United States?
77326 has the Highest Percentage of Population Employed in Arts, Entertainment & Recreation in the United States with 100.0%.
What is the Percentage of Population Employed in Arts, Entertainment & Recreation in the United States?
Percentage of Population Employed in Arts, Entertainment & Recreation in the United States is 2.1%.