Rocky Boy s Agency, MT Map & Demographics
Rocky Boy s Agency Map
Rocky Boy s Agency Overview
$35,331
PER CAPITA INCOME
$136,375
AVG FAMILY INCOME
$56,105
AVG HOUSEHOLD INCOME
0.36
INEQUALITY / GINI INDEX
204
TOTAL POPULATION
122
MALE POPULATION
82
FEMALE POPULATION
148.78
MALES / 100 FEMALES
67.21
FEMALES / 100 MALES
53.6
MEDIAN AGE
3.4
AVG FAMILY SIZE
1.8
AVG HOUSEHOLD SIZE
114
LABOR FORCE [ PEOPLE ]
64.0%
PERCENT IN LABOR FORCE
Income in Rocky Boy s Agency
Income Overview in Rocky Boy s Agency
Per Capita Income in Rocky Boy s Agency is $35,331, while median incomes of families and households are $136,375 and $56,105 respectively.
| Characteristic | Number | Measure |
| Per Capita Income | 204 | $35,331 |
| Median Family Income | 39 | $136,375 |
| Mean Family Income | 39 | $115,264 |
| Median Household Income | 112 | $56,105 |
| Mean Household Income | 112 | $68,603 |
| Income Deficit | 39 | $0 |
| Wage / Income Gap (%) | 204 | 0.00% |
| Wage / Income Gap ($) | 204 | 100.00¢ per $1 |
| Gini / Inequality Index | 204 | 0.36 |
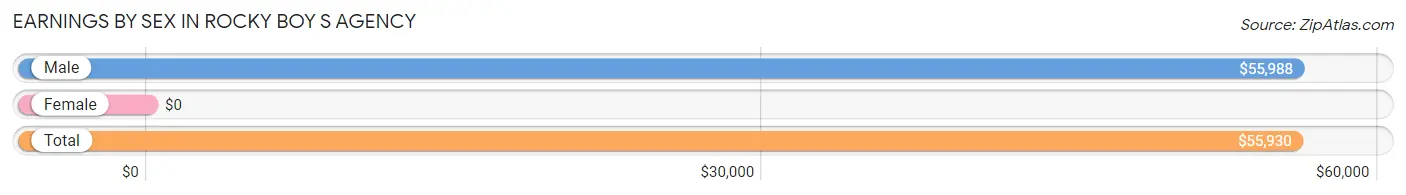
Earnings by Sex in Rocky Boy s Agency
| Sex | Number | Average Earnings |
| Male | 98 (86.0%) | $55,988 |
| Female | 16 (14.0%) | $0 |
| Total | 114 (100.0%) | $55,930 |
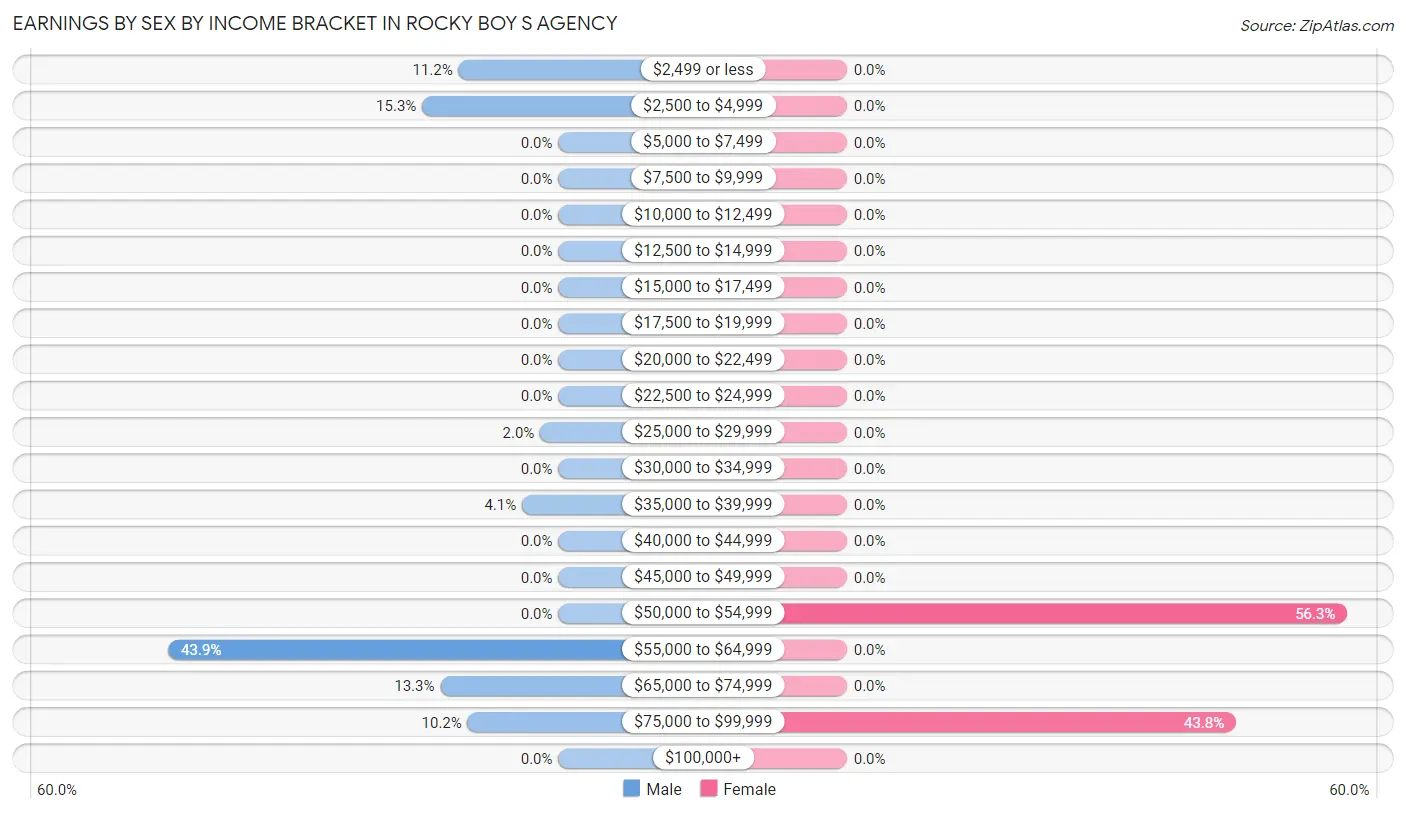
Earnings by Sex by Income Bracket in Rocky Boy s Agency
The most common earnings brackets in Rocky Boy s Agency are $55,000 to $64,999 for men (43 | 43.9%) and $50,000 to $54,999 for women (9 | 56.2%).
| Income | Male | Female |
| $2,499 or less | 11 (11.2%) | 0 (0.0%) |
| $2,500 to $4,999 | 15 (15.3%) | 0 (0.0%) |
| $5,000 to $7,499 | 0 (0.0%) | 0 (0.0%) |
| $7,500 to $9,999 | 0 (0.0%) | 0 (0.0%) |
| $10,000 to $12,499 | 0 (0.0%) | 0 (0.0%) |
| $12,500 to $14,999 | 0 (0.0%) | 0 (0.0%) |
| $15,000 to $17,499 | 0 (0.0%) | 0 (0.0%) |
| $17,500 to $19,999 | 0 (0.0%) | 0 (0.0%) |
| $20,000 to $22,499 | 0 (0.0%) | 0 (0.0%) |
| $22,500 to $24,999 | 0 (0.0%) | 0 (0.0%) |
| $25,000 to $29,999 | 2 (2.0%) | 0 (0.0%) |
| $30,000 to $34,999 | 0 (0.0%) | 0 (0.0%) |
| $35,000 to $39,999 | 4 (4.1%) | 0 (0.0%) |
| $40,000 to $44,999 | 0 (0.0%) | 0 (0.0%) |
| $45,000 to $49,999 | 0 (0.0%) | 0 (0.0%) |
| $50,000 to $54,999 | 0 (0.0%) | 9 (56.2%) |
| $55,000 to $64,999 | 43 (43.9%) | 0 (0.0%) |
| $65,000 to $74,999 | 13 (13.3%) | 0 (0.0%) |
| $75,000 to $99,999 | 10 (10.2%) | 7 (43.8%) |
| $100,000+ | 0 (0.0%) | 0 (0.0%) |
| Total | 98 (100.0%) | 16 (100.0%) |
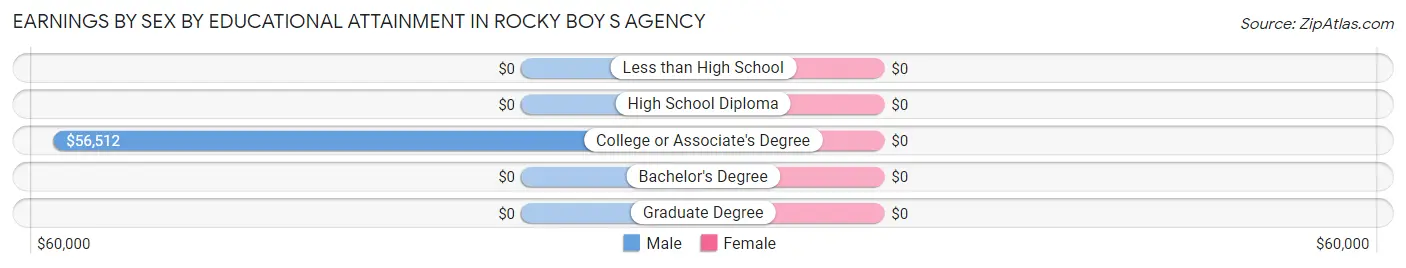
Earnings by Sex by Educational Attainment in Rocky Boy s Agency
| Educational Attainment | Male Income | Female Income |
| Less than High School | - | - |
| High School Diploma | - | - |
| College or Associate's Degree | $56,512 | $0 |
| Bachelor's Degree | - | - |
| Graduate Degree | - | - |
| Total | $55,988 | $0 |
Family Income in Rocky Boy s Agency
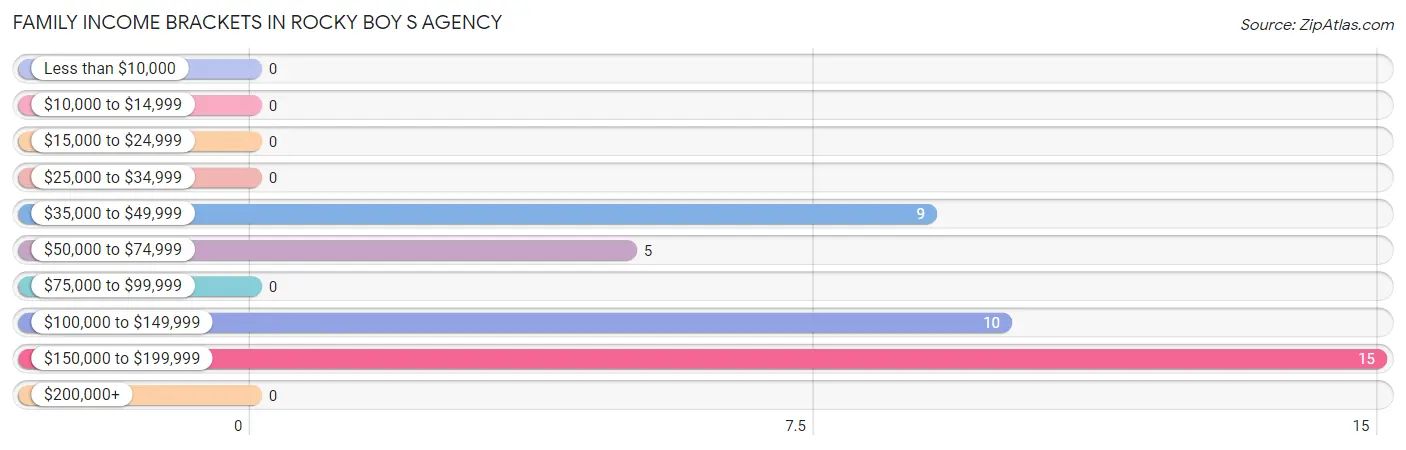
Family Income Brackets in Rocky Boy s Agency
According to the Rocky Boy s Agency family income data, there are 15 families falling into the $150,000 to $199,999 income range, which is the most common income bracket and makes up 38.5% of all families.
| Income Bracket | # Families | % Families |
| Less than $10,000 | 0 | 0.0% |
| $10,000 to $14,999 | 0 | 0.0% |
| $15,000 to $24,999 | 0 | 0.0% |
| $25,000 to $34,999 | 0 | 0.0% |
| $35,000 to $49,999 | 9 | 23.1% |
| $50,000 to $74,999 | 5 | 12.8% |
| $75,000 to $99,999 | 0 | 0.0% |
| $100,000 to $149,999 | 10 | 25.6% |
| $150,000 to $199,999 | 15 | 38.5% |
| $200,000+ | 0 | 0.0% |
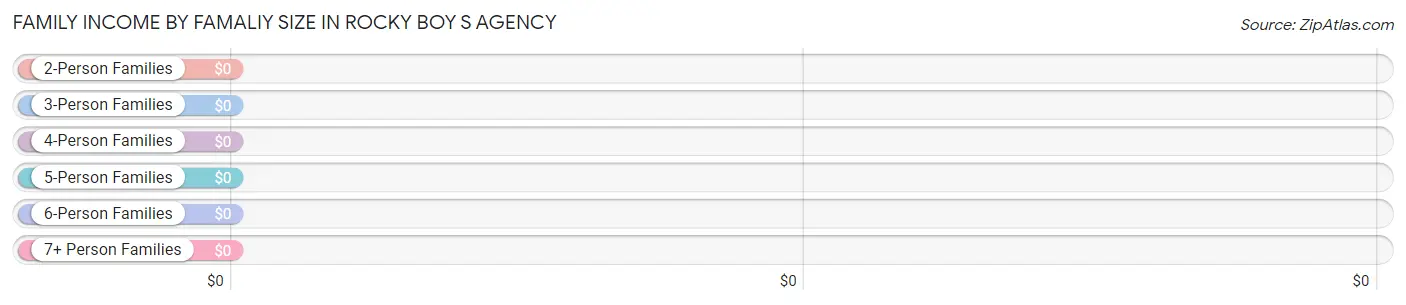
Family Income by Famaliy Size in Rocky Boy s Agency
| Income Bracket | # Families | Median Income |
| 2-Person Families | 7 (17.9%) | $0 |
| 3-Person Families | 10 (25.6%) | $0 |
| 4-Person Families | 22 (56.4%) | $0 |
| 5-Person Families | 0 (0.0%) | $0 |
| 6-Person Families | 0 (0.0%) | $0 |
| 7+ Person Families | 0 (0.0%) | $0 |
| Total | 39 (100.0%) | $136,375 |
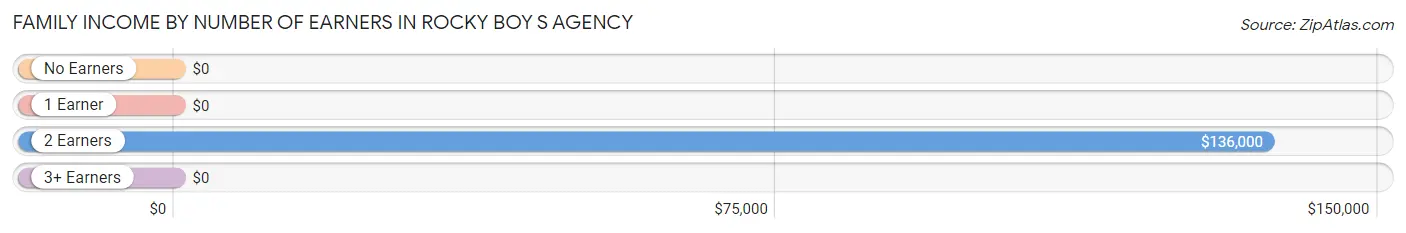
Family Income by Number of Earners in Rocky Boy s Agency
| Number of Earners | # Families | Median Income |
| No Earners | 0 (0.0%) | $0 |
| 1 Earner | 13 (33.3%) | $0 |
| 2 Earners | 26 (66.7%) | $136,000 |
| 3+ Earners | 0 (0.0%) | $0 |
| Total | 39 (100.0%) | $136,375 |
Household Income in Rocky Boy s Agency
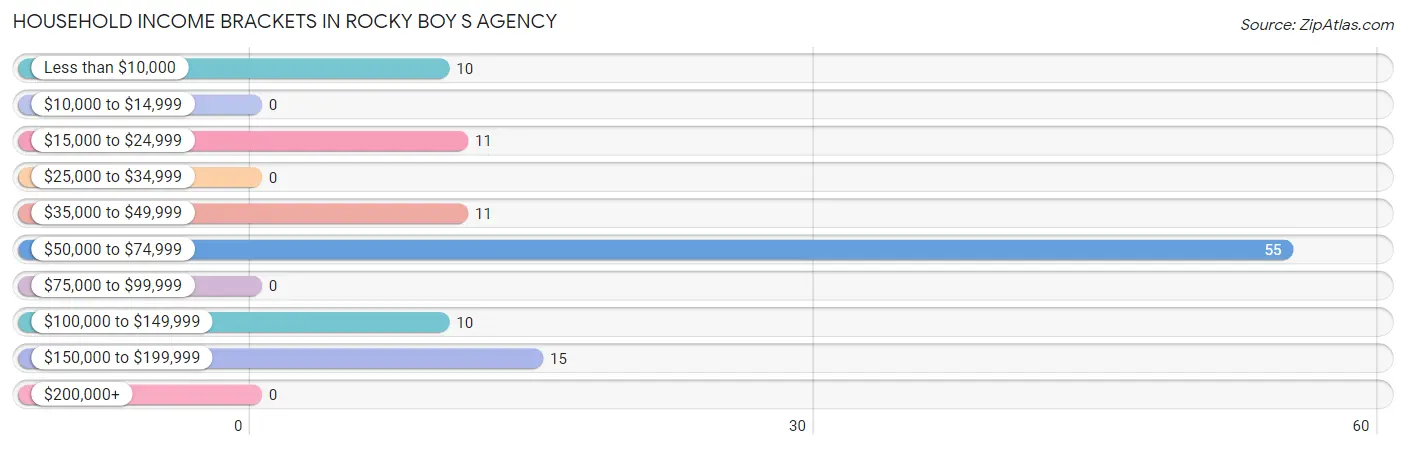
Household Income Brackets in Rocky Boy s Agency
With 55 households falling in the category, the $50,000 to $74,999 income range is the most frequent in Rocky Boy s Agency, accounting for 49.1% of all households.
| Income Bracket | # Households | % Households |
| Less than $10,000 | 10 | 8.9% |
| $10,000 to $14,999 | 0 | 0.0% |
| $15,000 to $24,999 | 11 | 9.8% |
| $25,000 to $34,999 | 0 | 0.0% |
| $35,000 to $49,999 | 11 | 9.8% |
| $50,000 to $74,999 | 55 | 49.1% |
| $75,000 to $99,999 | 0 | 0.0% |
| $100,000 to $149,999 | 10 | 8.9% |
| $150,000 to $199,999 | 15 | 13.4% |
| $200,000+ | 0 | 0.0% |
Household Income by Householder Age in Rocky Boy s Agency
The median household income in Rocky Boy s Agency is $56,105, with the highest median household income of $56,279 found in the 45 to 64 years age bracket for the primary householder. A total of 56 households (50.0%) fall into this category.
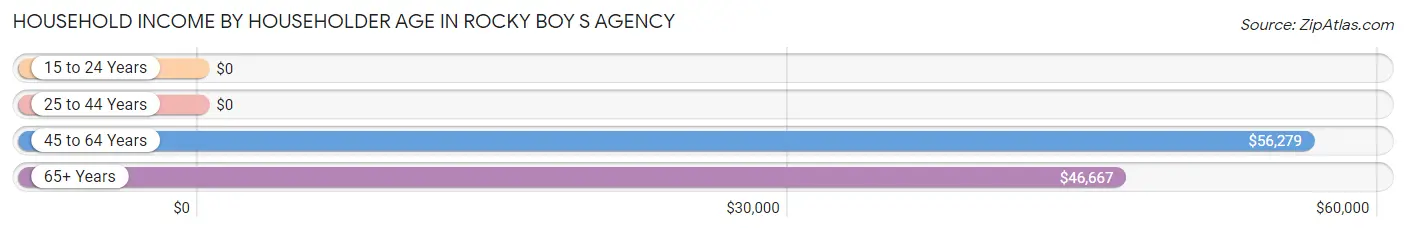
| Income Bracket | # Households | Median Income |
| 15 to 24 Years | 0 (0.0%) | $0 |
| 25 to 44 Years | 10 (8.9%) | $0 |
| 45 to 64 Years | 56 (50.0%) | $56,279 |
| 65+ Years | 46 (41.1%) | $46,667 |
| Total | 112 (100.0%) | $56,105 |
Poverty in Rocky Boy s Agency
Income Below Poverty by Sex and Age in Rocky Boy s Agency
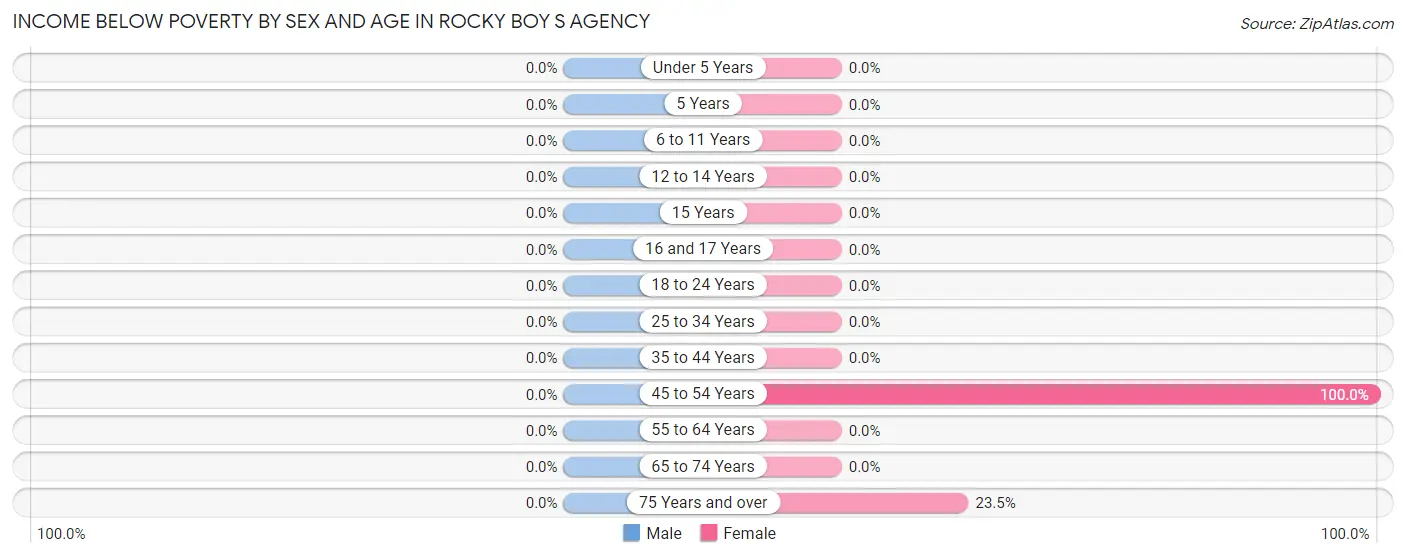
| Age Bracket | Male | Female |
| Under 5 Years | 0 (0.0%) | 0 (0.0%) |
| 5 Years | 0 (0.0%) | 0 (0.0%) |
| 6 to 11 Years | 0 (0.0%) | 0 (0.0%) |
| 12 to 14 Years | 0 (0.0%) | 0 (0.0%) |
| 15 Years | 0 (0.0%) | 0 (0.0%) |
| 16 and 17 Years | 0 (0.0%) | 0 (0.0%) |
| 18 to 24 Years | 0 (0.0%) | 0 (0.0%) |
| 25 to 34 Years | 0 (0.0%) | 0 (0.0%) |
| 35 to 44 Years | 0 (0.0%) | 0 (0.0%) |
| 45 to 54 Years | 0 (0.0%) | 6 (100.0%) |
| 55 to 64 Years | 0 (0.0%) | 0 (0.0%) |
| 65 to 74 Years | 0 (0.0%) | 0 (0.0%) |
| 75 Years and over | 0 (0.0%) | 4 (23.5%) |
| Total | 0 (0.0%) | 10 (12.2%) |
Income Above Poverty by Sex and Age in Rocky Boy s Agency
According to the poverty statistics in Rocky Boy s Agency, males aged 18 to 24 years and females aged under 5 years are the age groups that are most secure financially, with 100.0% of males and 100.0% of females in these age groups living above the poverty line.
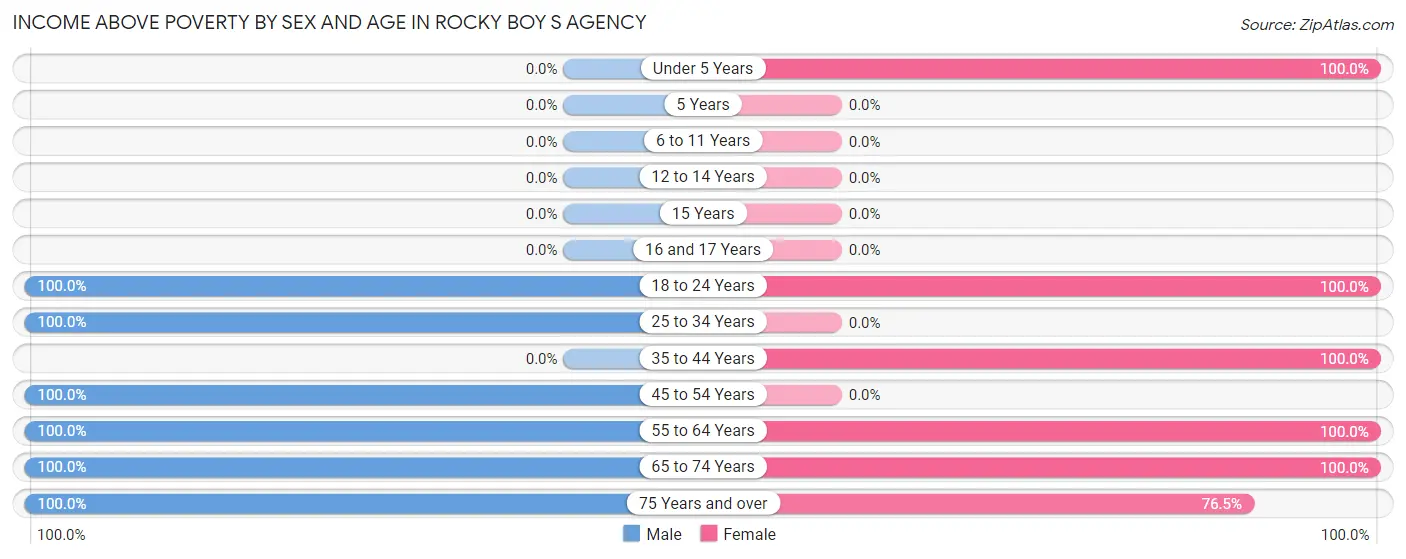
| Age Bracket | Male | Female |
| Under 5 Years | 0 (0.0%) | 26 (100.0%) |
| 5 Years | 0 (0.0%) | 0 (0.0%) |
| 6 to 11 Years | 0 (0.0%) | 0 (0.0%) |
| 12 to 14 Years | 0 (0.0%) | 0 (0.0%) |
| 15 Years | 0 (0.0%) | 0 (0.0%) |
| 16 and 17 Years | 0 (0.0%) | 0 (0.0%) |
| 18 to 24 Years | 15 (100.0%) | 9 (100.0%) |
| 25 to 34 Years | 20 (100.0%) | 0 (0.0%) |
| 35 to 44 Years | 0 (0.0%) | 5 (100.0%) |
| 45 to 54 Years | 48 (100.0%) | 0 (0.0%) |
| 55 to 64 Years | 9 (100.0%) | 7 (100.0%) |
| 65 to 74 Years | 21 (100.0%) | 12 (100.0%) |
| 75 Years and over | 9 (100.0%) | 13 (76.5%) |
| Total | 122 (100.0%) | 72 (87.8%) |
Income Below Poverty Among Married-Couple Families in Rocky Boy s Agency
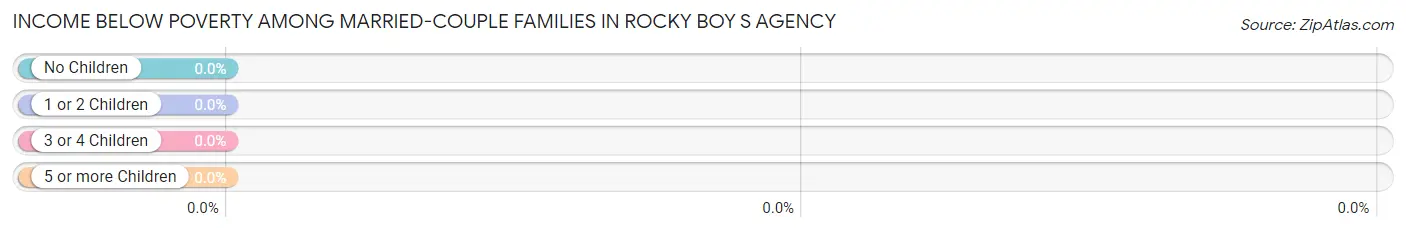
| Children | Above Poverty | Below Poverty |
| No Children | 16 (100.0%) | 0 (0.0%) |
| 1 or 2 Children | 18 (100.0%) | 0 (0.0%) |
| 3 or 4 Children | 0 (0.0%) | 0 (0.0%) |
| 5 or more Children | 0 (0.0%) | 0 (0.0%) |
| Total | 34 (100.0%) | 0 (0.0%) |
Income Below Poverty Among Single-Parent Households in Rocky Boy s Agency
| Children | Single Father | Single Mother |
| No Children | 0 (0.0%) | 0 (0.0%) |
| 1 or 2 Children | 0 (0.0%) | 0 (0.0%) |
| 3 or 4 Children | 0 (0.0%) | 0 (0.0%) |
| 5 or more Children | 0 (0.0%) | 0 (0.0%) |
| Total | 0 (0.0%) | 0 (0.0%) |
Income Below Poverty Among Married-Couple vs Single-Parent Households in Rocky Boy s Agency
| Children | Married-Couple Families | Single-Parent Households |
| No Children | 0 (0.0%) | 0 (0.0%) |
| 1 or 2 Children | 0 (0.0%) | 0 (0.0%) |
| 3 or 4 Children | 0 (0.0%) | 0 (0.0%) |
| 5 or more Children | 0 (0.0%) | 0 (0.0%) |
| Total | 0 (0.0%) | 0 (0.0%) |
Race in Rocky Boy s Agency
The most populous races in Rocky Boy s Agency are Native / Alaskan (200 | 98.0%), and White / Caucasian (4 | 2.0%).
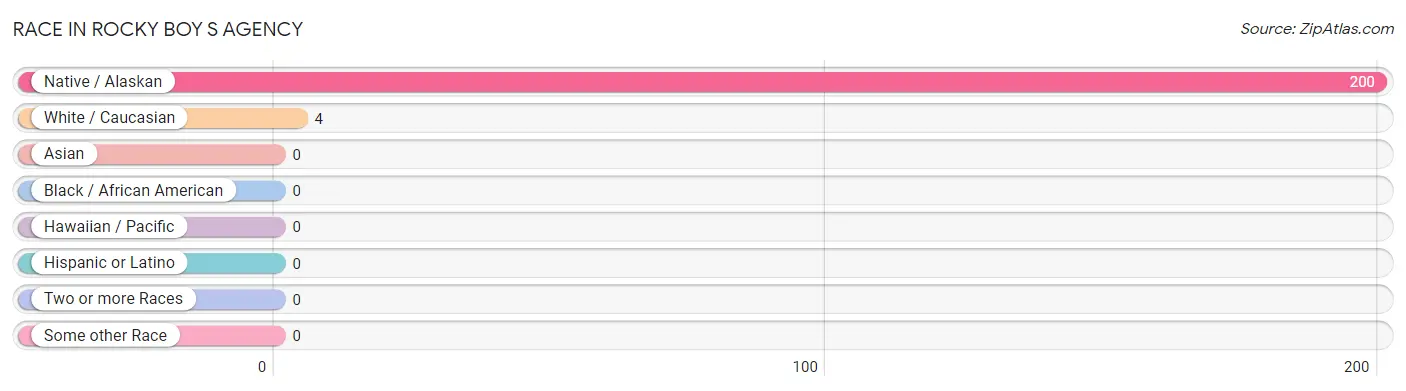
| Race | # Population | % Population |
| Asian | 0 | 0.0% |
| Black / African American | 0 | 0.0% |
| Hawaiian / Pacific | 0 | 0.0% |
| Hispanic or Latino | 0 | 0.0% |
| Native / Alaskan | 200 | 98.0% |
| White / Caucasian | 4 | 2.0% |
| Two or more Races | 0 | 0.0% |
| Some other Race | 0 | 0.0% |
| Total | 204 | 100.0% |
Ancestry in Rocky Boy s Agency
The most populous ancestries reported in Rocky Boy s Agency are , and Irish (4 | 2.0%), together accounting for 2.0% of all Rocky Boy s Agency residents.

| Ancestry | # Population | % Population |
| Irish | 4 | 2.0% | View All 1 Rows |
Immigrants in Rocky Boy s Agency

| Immigration Origin | # Population | % Population | View All 0 Rows |
Sex and Age in Rocky Boy s Agency
Sex and Age in Rocky Boy s Agency
The most populous age groups in Rocky Boy s Agency are 50 to 54 Years (48 | 39.3%) for men and Under 5 Years (26 | 31.7%) for women.
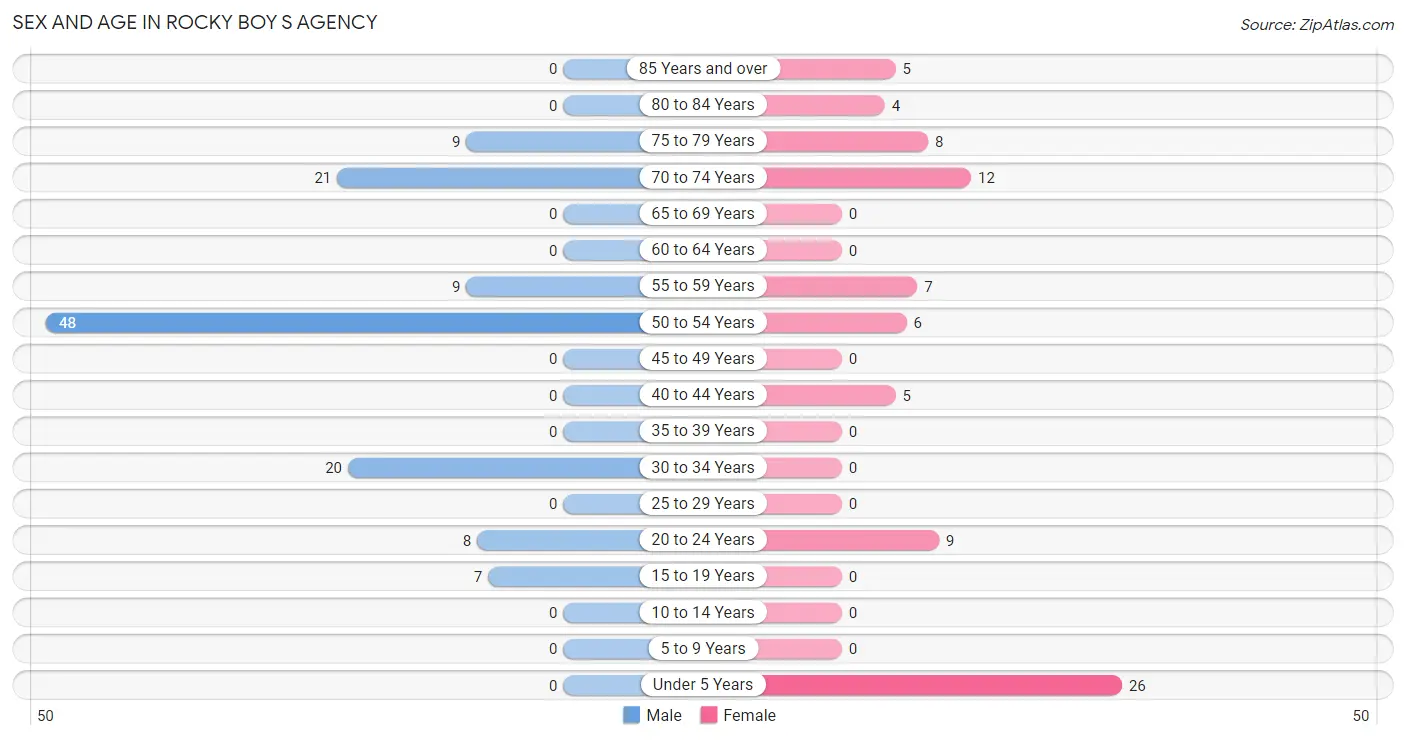
| Age Bracket | Male | Female |
| Under 5 Years | 0 (0.0%) | 26 (31.7%) |
| 5 to 9 Years | 0 (0.0%) | 0 (0.0%) |
| 10 to 14 Years | 0 (0.0%) | 0 (0.0%) |
| 15 to 19 Years | 7 (5.7%) | 0 (0.0%) |
| 20 to 24 Years | 8 (6.6%) | 9 (11.0%) |
| 25 to 29 Years | 0 (0.0%) | 0 (0.0%) |
| 30 to 34 Years | 20 (16.4%) | 0 (0.0%) |
| 35 to 39 Years | 0 (0.0%) | 0 (0.0%) |
| 40 to 44 Years | 0 (0.0%) | 5 (6.1%) |
| 45 to 49 Years | 0 (0.0%) | 0 (0.0%) |
| 50 to 54 Years | 48 (39.3%) | 6 (7.3%) |
| 55 to 59 Years | 9 (7.4%) | 7 (8.5%) |
| 60 to 64 Years | 0 (0.0%) | 0 (0.0%) |
| 65 to 69 Years | 0 (0.0%) | 0 (0.0%) |
| 70 to 74 Years | 21 (17.2%) | 12 (14.6%) |
| 75 to 79 Years | 9 (7.4%) | 8 (9.8%) |
| 80 to 84 Years | 0 (0.0%) | 4 (4.9%) |
| 85 Years and over | 0 (0.0%) | 5 (6.1%) |
| Total | 122 (100.0%) | 82 (100.0%) |
Families and Households in Rocky Boy s Agency
Median Family Size in Rocky Boy s Agency
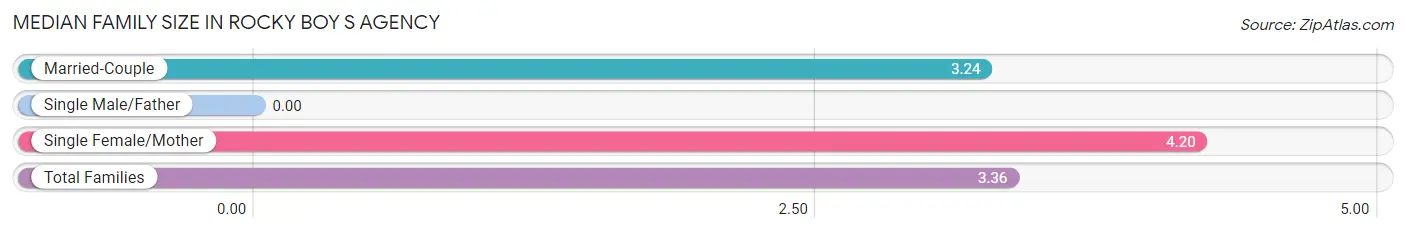
| Family Type | # Families | Family Size |
| Married-Couple | 34 (87.2%) | 3.24 |
| Single Male/Father | 0 (0.0%) | - |
| Single Female/Mother | 5 (12.8%) | 4.20 |
| Total Families | 39 (100.0%) | 3.36 |
Median Household Size in Rocky Boy s Agency
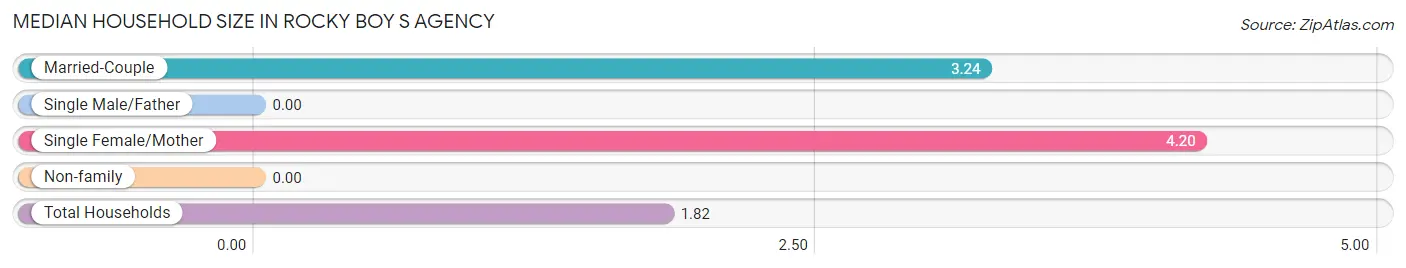
| Household Type | # Households | Household Size |
| Married-Couple | 34 (30.4%) | 3.24 |
| Single Male/Father | 0 (0.0%) | - |
| Single Female/Mother | 5 (4.5%) | 4.20 |
| Non-family | 73 (65.2%) | - |
| Total Households | 112 (100.0%) | 1.82 |
Household Size by Marriage Status in Rocky Boy s Agency
Out of a total of 112 households in Rocky Boy s Agency, 39 (34.8%) are family households, while 73 (65.2%) are nonfamily households. The most numerous type of family households are 4-person households, comprising 22, and the most common type of nonfamily households are 1-person households, comprising 73.
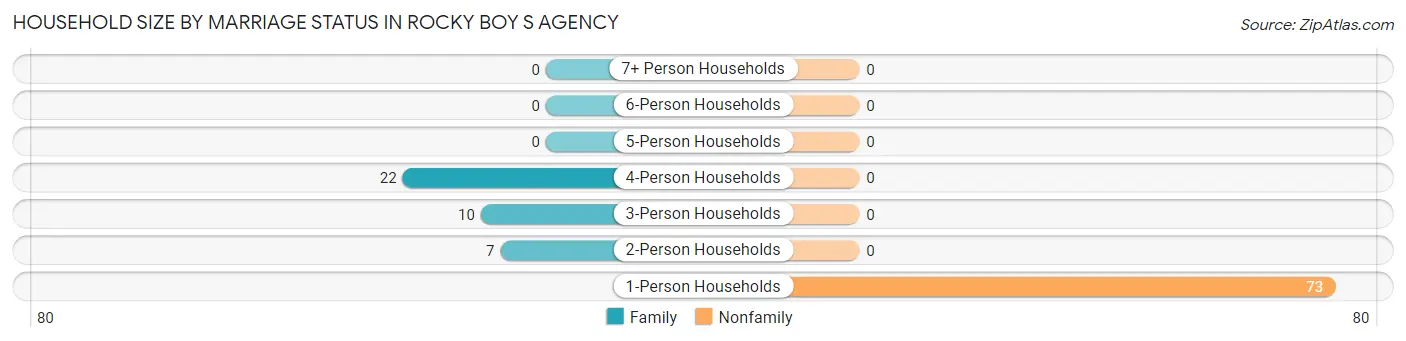
| Household Size | Family Households | Nonfamily Households |
| 1-Person Households | - | 73 (65.2%) |
| 2-Person Households | 7 (6.2%) | 0 (0.0%) |
| 3-Person Households | 10 (8.9%) | 0 (0.0%) |
| 4-Person Households | 22 (19.6%) | 0 (0.0%) |
| 5-Person Households | 0 (0.0%) | 0 (0.0%) |
| 6-Person Households | 0 (0.0%) | 0 (0.0%) |
| 7+ Person Households | 0 (0.0%) | 0 (0.0%) |
| Total | 39 (34.8%) | 73 (65.2%) |
Female Fertility in Rocky Boy s Agency
Fertility by Age in Rocky Boy s Agency
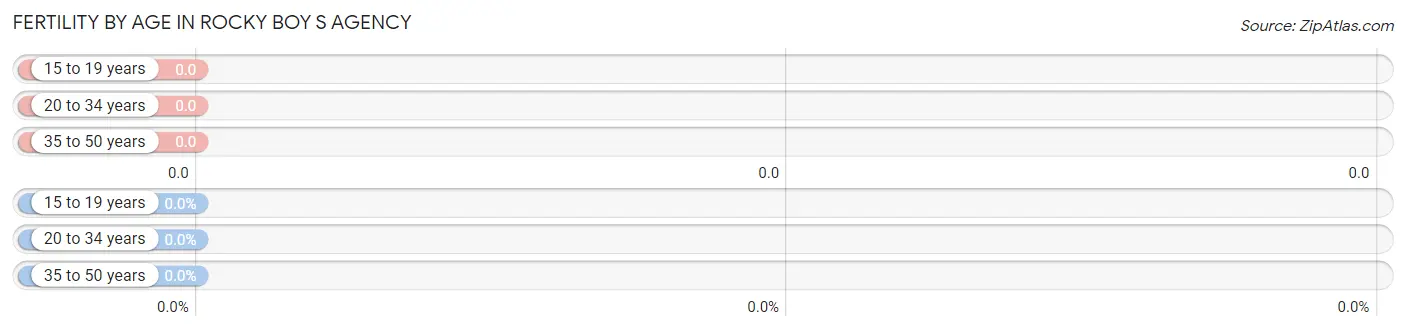
| Age Bracket | Women with Births | Births / 1,000 Women |
| 15 to 19 years | 0 (0.0%) | 0.0 |
| 20 to 34 years | 0 (0.0%) | 0.0 |
| 35 to 50 years | 0 (0.0%) | 0.0 |
| Total | 0 (0.0%) | 0.0 |
Fertility by Age by Marriage Status in Rocky Boy s Agency
| Age Bracket | Married | Unmarried |
| 15 to 19 years | 0 (0.0%) | 0 (0.0%) |
| 20 to 34 years | 0 (0.0%) | 0 (0.0%) |
| 35 to 50 years | 0 (0.0%) | 0 (0.0%) |
| Total | 0 (0.0%) | 0 (0.0%) |
Fertility by Education in Rocky Boy s Agency
| Educational Attainment | Women with Births | Births / 1,000 Women |
| Less than High School | 0 (0.0%) | 0.0 |
| High School Diploma | 0 (0.0%) | 0.0 |
| College or Associate's Degree | 0 (0.0%) | 0.0 |
| Bachelor's Degree | 0 (0.0%) | 0.0 |
| Graduate Degree | 0 (0.0%) | 0.0 |
| Total | 0 (0.0%) | 0.0 |
Fertility by Education by Marriage Status in Rocky Boy s Agency
| Educational Attainment | Married | Unmarried |
| Less than High School | 0 (0.0%) | 0 (0.0%) |
| High School Diploma | 0 (0.0%) | 0 (0.0%) |
| College or Associate's Degree | 0 (0.0%) | 0 (0.0%) |
| Bachelor's Degree | 0 (0.0%) | 0 (0.0%) |
| Graduate Degree | 0 (0.0%) | 0 (0.0%) |
| Total | 0 (0.0%) | 0 (0.0%) |
Employment Characteristics in Rocky Boy s Agency
Employment by Class of Employer in Rocky Boy s Agency
Among the 114 employed individuals in Rocky Boy s Agency, private company employees (47 | 41.2%), federal government employees (27 | 23.7%), and local government employees (25 | 21.9%) make up the most common classes of employment.
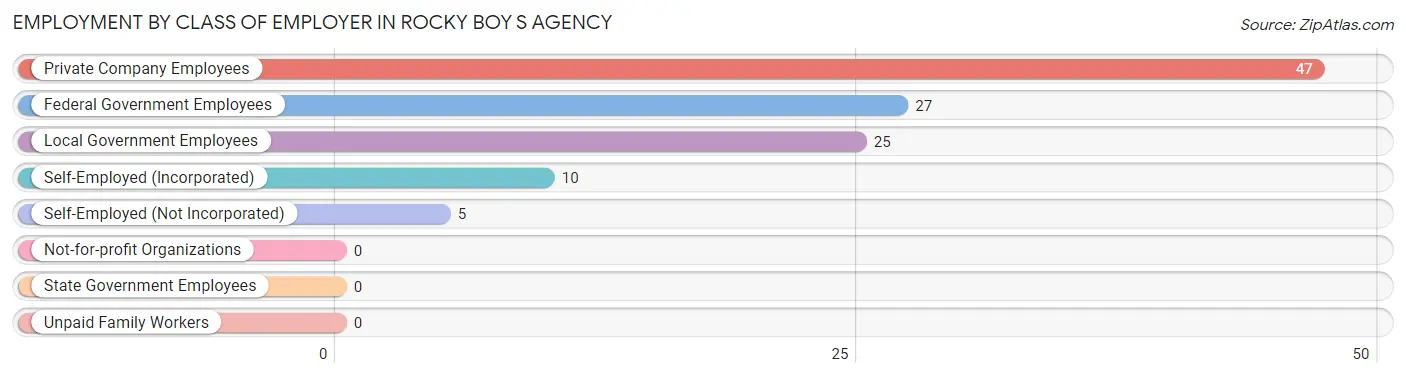
| Employer Class | # Employees | % Employees |
| Private Company Employees | 47 | 41.2% |
| Self-Employed (Incorporated) | 10 | 8.8% |
| Self-Employed (Not Incorporated) | 5 | 4.4% |
| Not-for-profit Organizations | 0 | 0.0% |
| Local Government Employees | 25 | 21.9% |
| State Government Employees | 0 | 0.0% |
| Federal Government Employees | 27 | 23.7% |
| Unpaid Family Workers | 0 | 0.0% |
| Total | 114 | 100.0% |
Employment Status by Age in Rocky Boy s Agency
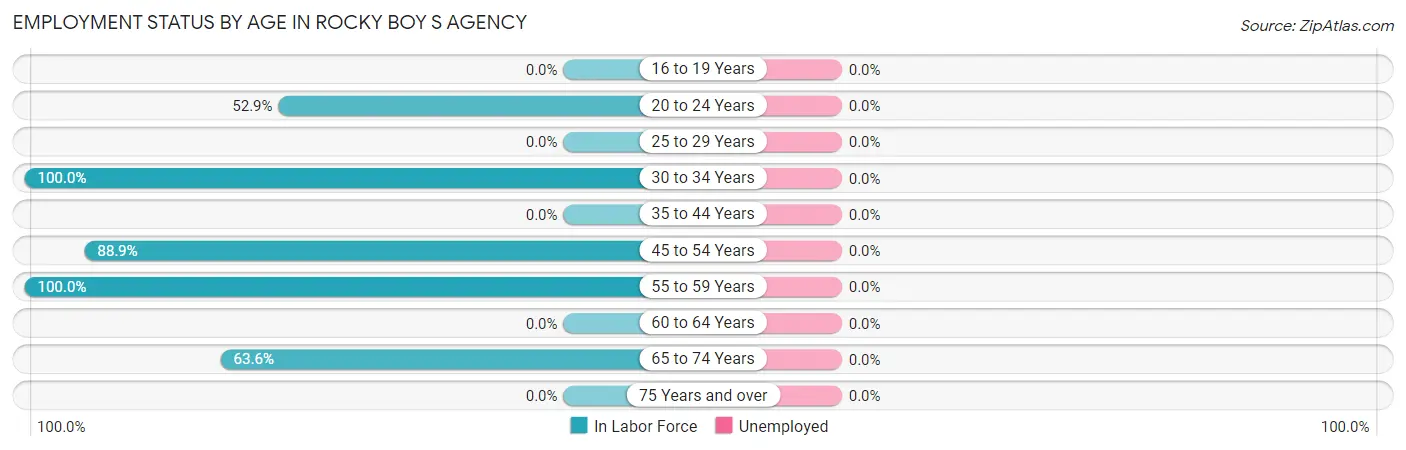
| Age Bracket | In Labor Force | Unemployed |
| 16 to 19 Years | 0 (0.0%) | 0 (0.0%) |
| 20 to 24 Years | 9 (52.9%) | 0 (0.0%) |
| 25 to 29 Years | 0 (0.0%) | 0 (0.0%) |
| 30 to 34 Years | 20 (100.0%) | 0 (0.0%) |
| 35 to 44 Years | 0 (0.0%) | 0 (0.0%) |
| 45 to 54 Years | 48 (88.9%) | 0 (0.0%) |
| 55 to 59 Years | 16 (100.0%) | 0 (0.0%) |
| 60 to 64 Years | 0 (0.0%) | 0 (0.0%) |
| 65 to 74 Years | 21 (63.6%) | 0 (0.0%) |
| 75 Years and over | 0 (0.0%) | 0 (0.0%) |
| Total | 114 (64.0%) | 0 (0.0%) |
Employment Status by Educational Attainment in Rocky Boy s Agency
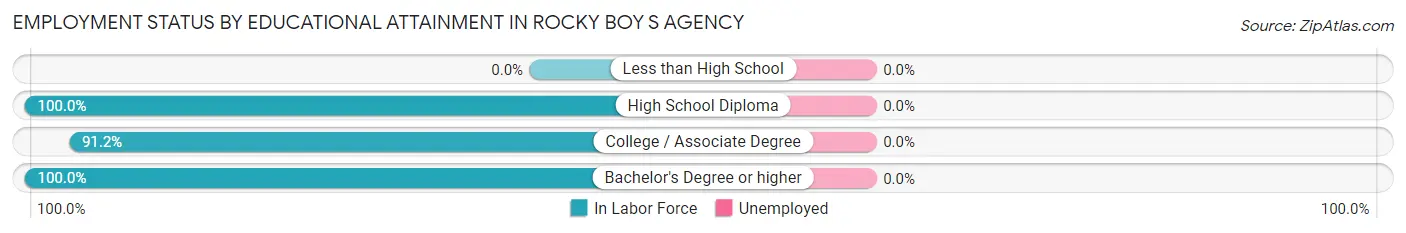
| Educational Attainment | In Labor Force | Unemployed |
| Less than High School | 0 (0.0%) | 0 (0.0%) |
| High School Diploma | 25 (100.0%) | 0 (0.0%) |
| College / Associate Degree | 52 (91.2%) | 0 (0.0%) |
| Bachelor's Degree or higher | 7 (100.0%) | 0 (0.0%) |
| Total | 84 (88.4%) | 0 (0.0%) |
Employment Occupations by Sex in Rocky Boy s Agency
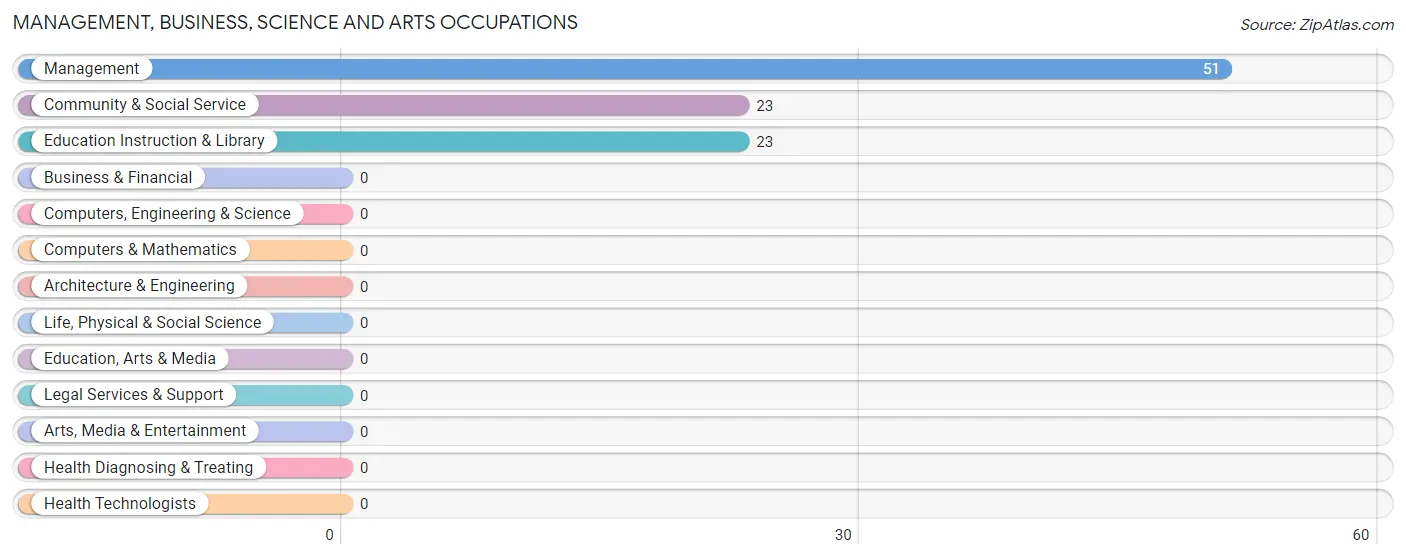
Management, Business, Science and Arts Occupations
The most common Management, Business, Science and Arts occupations in Rocky Boy s Agency are Management (51 | 44.7%), Community & Social Service (23 | 20.2%), and Education Instruction & Library (23 | 20.2%).
Management, Business, Science and Arts Occupations by Sex
Within the Management, Business, Science and Arts occupations in Rocky Boy s Agency, the most male-oriented occupations are Management (100.0%), Community & Social Service (69.6%), and Education Instruction & Library (69.6%), while the most female-oriented occupations are Community & Social Service (30.4%), and Education Instruction & Library (30.4%).
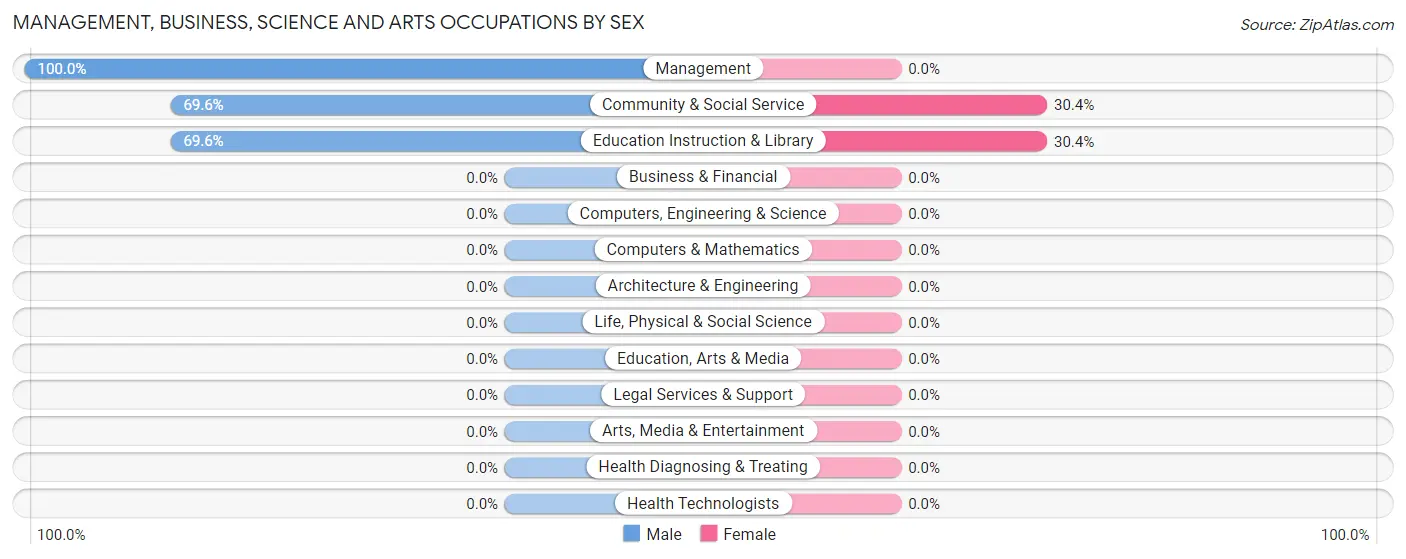
| Occupation | Male | Female |
| Management | 51 (100.0%) | 0 (0.0%) |
| Business & Financial | 0 (0.0%) | 0 (0.0%) |
| Computers, Engineering & Science | 0 (0.0%) | 0 (0.0%) |
| Computers & Mathematics | 0 (0.0%) | 0 (0.0%) |
| Architecture & Engineering | 0 (0.0%) | 0 (0.0%) |
| Life, Physical & Social Science | 0 (0.0%) | 0 (0.0%) |
| Community & Social Service | 16 (69.6%) | 7 (30.4%) |
| Education, Arts & Media | 0 (0.0%) | 0 (0.0%) |
| Legal Services & Support | 0 (0.0%) | 0 (0.0%) |
| Education Instruction & Library | 16 (69.6%) | 7 (30.4%) |
| Arts, Media & Entertainment | 0 (0.0%) | 0 (0.0%) |
| Health Diagnosing & Treating | 0 (0.0%) | 0 (0.0%) |
| Health Technologists | 0 (0.0%) | 0 (0.0%) |
| Total (Category) | 67 (90.5%) | 7 (9.5%) |
| Total (Overall) | 98 (86.0%) | 16 (14.0%) |
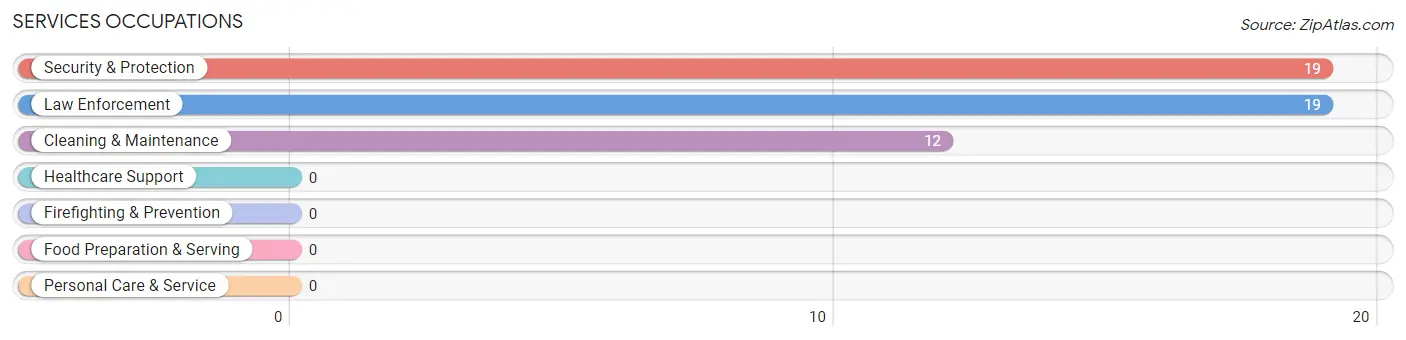
Services Occupations
The most common Services occupations in Rocky Boy s Agency are Security & Protection (19 | 16.7%), Law Enforcement (19 | 16.7%), and Cleaning & Maintenance (12 | 10.5%).
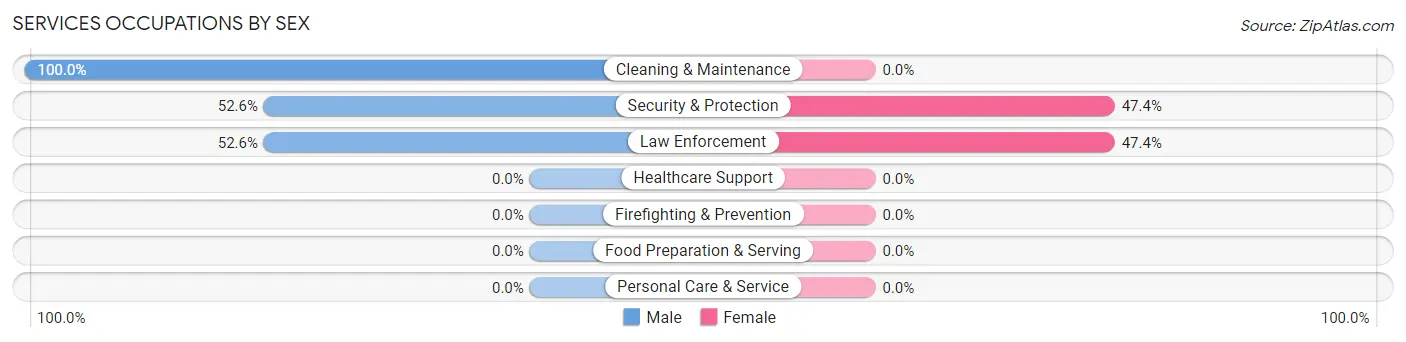
Services Occupations by Sex
Within the Services occupations in Rocky Boy s Agency, the most male-oriented occupations are Cleaning & Maintenance (100.0%), Security & Protection (52.6%), and Law Enforcement (52.6%), while the most female-oriented occupations are Security & Protection (47.4%), and Law Enforcement (47.4%).
| Occupation | Male | Female |
| Healthcare Support | 0 (0.0%) | 0 (0.0%) |
| Security & Protection | 10 (52.6%) | 9 (47.4%) |
| Firefighting & Prevention | 0 (0.0%) | 0 (0.0%) |
| Law Enforcement | 10 (52.6%) | 9 (47.4%) |
| Food Preparation & Serving | 0 (0.0%) | 0 (0.0%) |
| Cleaning & Maintenance | 12 (100.0%) | 0 (0.0%) |
| Personal Care & Service | 0 (0.0%) | 0 (0.0%) |
| Total (Category) | 22 (71.0%) | 9 (29.0%) |
| Total (Overall) | 98 (86.0%) | 16 (14.0%) |
Sales and Office Occupations
Sales and Office Occupations by Sex
| Occupation | Male | Female |
| Sales & Related | 0 (0.0%) | 0 (0.0%) |
| Office & Administration | 0 (0.0%) | 0 (0.0%) |
| Total (Category) | 0 (0.0%) | 0 (0.0%) |
| Total (Overall) | 98 (86.0%) | 16 (14.0%) |
Natural Resources, Construction and Maintenance Occupations
The most common Natural Resources, Construction and Maintenance occupations in Rocky Boy s Agency are Construction & Extraction (5 | 4.4%), and Farming, Fishing & Forestry (4 | 3.5%).
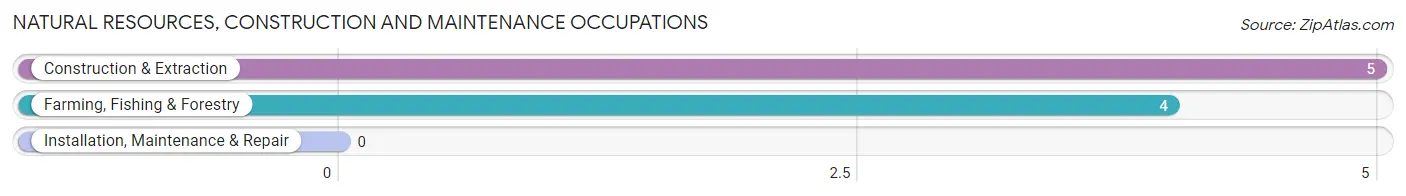
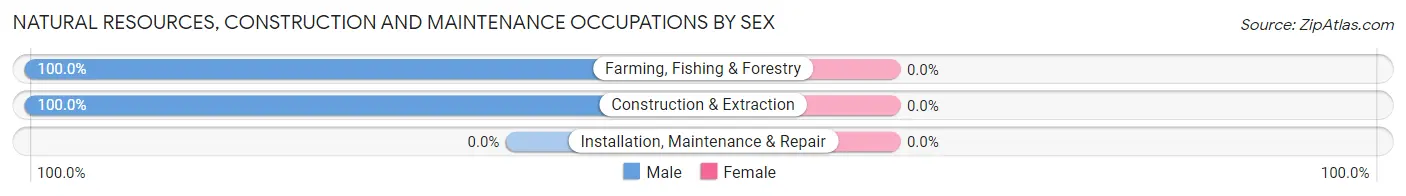
Natural Resources, Construction and Maintenance Occupations by Sex
| Occupation | Male | Female |
| Farming, Fishing & Forestry | 4 (100.0%) | 0 (0.0%) |
| Construction & Extraction | 5 (100.0%) | 0 (0.0%) |
| Installation, Maintenance & Repair | 0 (0.0%) | 0 (0.0%) |
| Total (Category) | 9 (100.0%) | 0 (0.0%) |
| Total (Overall) | 98 (86.0%) | 16 (14.0%) |
Production, Transportation and Moving Occupations
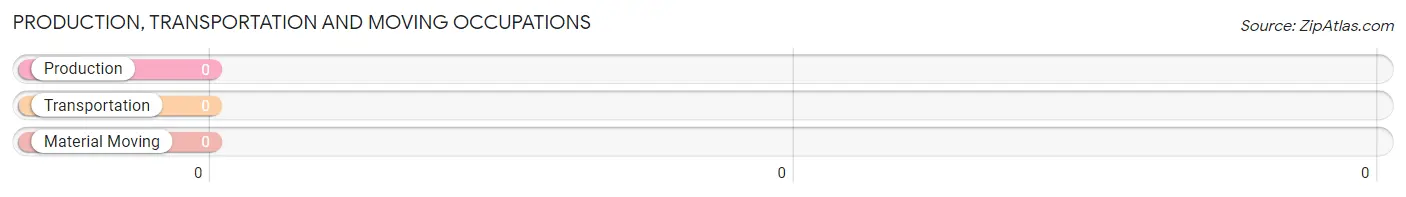
Production, Transportation and Moving Occupations by Sex
| Occupation | Male | Female |
| Production | 0 (0.0%) | 0 (0.0%) |
| Transportation | 0 (0.0%) | 0 (0.0%) |
| Material Moving | 0 (0.0%) | 0 (0.0%) |
| Total (Category) | 0 (0.0%) | 0 (0.0%) |
| Total (Overall) | 98 (86.0%) | 16 (14.0%) |
Employment Industries by Sex in Rocky Boy s Agency
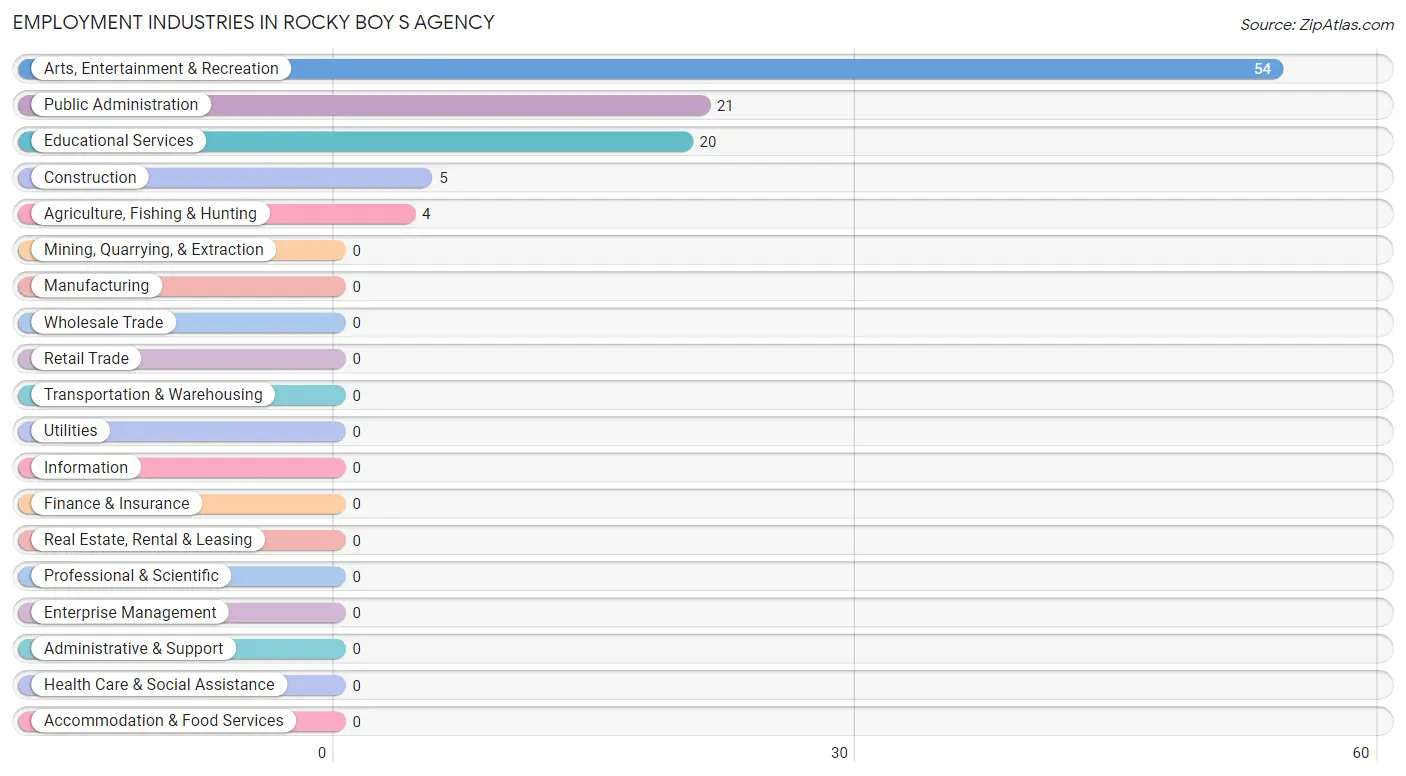
Employment Industries in Rocky Boy s Agency
The major employment industries in Rocky Boy s Agency include Arts, Entertainment & Recreation (54 | 47.4%), Public Administration (21 | 18.4%), Educational Services (20 | 17.5%), Construction (5 | 4.4%), and Agriculture, Fishing & Hunting (4 | 3.5%).
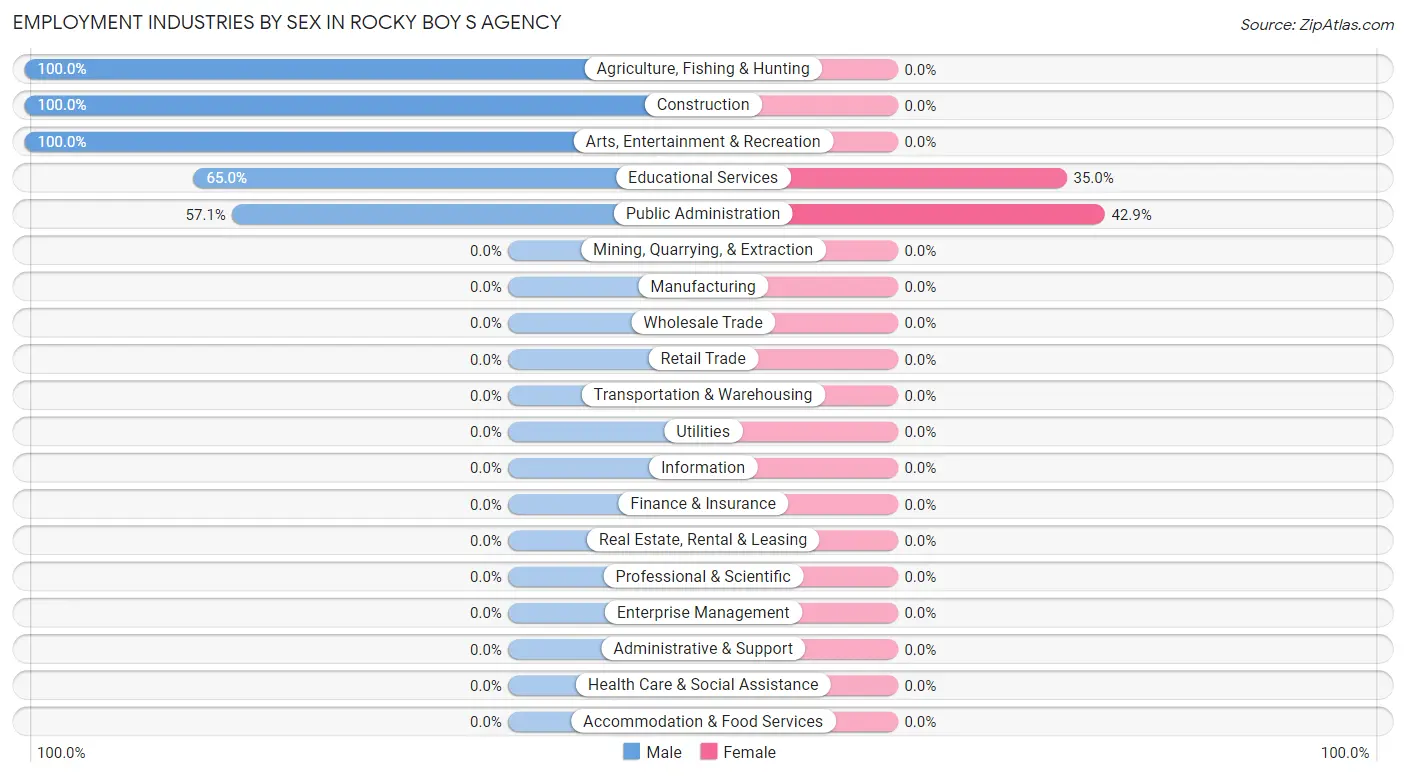
Employment Industries by Sex in Rocky Boy s Agency
The Rocky Boy s Agency industries that see more men than women are Agriculture, Fishing & Hunting (100.0%), Construction (100.0%), and Arts, Entertainment & Recreation (100.0%), whereas the industries that tend to have a higher number of women are Public Administration (42.9%), and Educational Services (35.0%).
| Industry | Male | Female |
| Agriculture, Fishing & Hunting | 4 (100.0%) | 0 (0.0%) |
| Mining, Quarrying, & Extraction | 0 (0.0%) | 0 (0.0%) |
| Construction | 5 (100.0%) | 0 (0.0%) |
| Manufacturing | 0 (0.0%) | 0 (0.0%) |
| Wholesale Trade | 0 (0.0%) | 0 (0.0%) |
| Retail Trade | 0 (0.0%) | 0 (0.0%) |
| Transportation & Warehousing | 0 (0.0%) | 0 (0.0%) |
| Utilities | 0 (0.0%) | 0 (0.0%) |
| Information | 0 (0.0%) | 0 (0.0%) |
| Finance & Insurance | 0 (0.0%) | 0 (0.0%) |
| Real Estate, Rental & Leasing | 0 (0.0%) | 0 (0.0%) |
| Professional & Scientific | 0 (0.0%) | 0 (0.0%) |
| Enterprise Management | 0 (0.0%) | 0 (0.0%) |
| Administrative & Support | 0 (0.0%) | 0 (0.0%) |
| Educational Services | 13 (65.0%) | 7 (35.0%) |
| Health Care & Social Assistance | 0 (0.0%) | 0 (0.0%) |
| Arts, Entertainment & Recreation | 54 (100.0%) | 0 (0.0%) |
| Accommodation & Food Services | 0 (0.0%) | 0 (0.0%) |
| Public Administration | 12 (57.1%) | 9 (42.9%) |
| Total | 98 (86.0%) | 16 (14.0%) |
Education in Rocky Boy s Agency
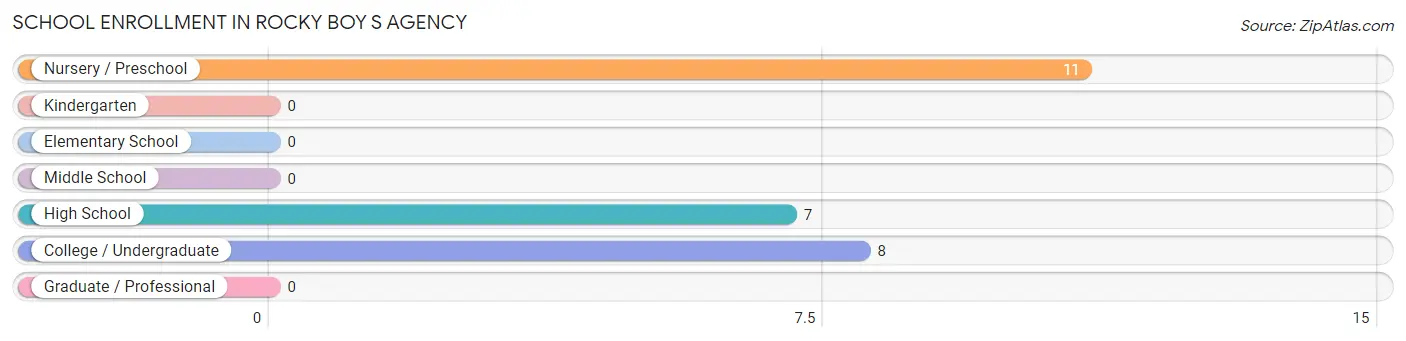
School Enrollment in Rocky Boy s Agency
The most common levels of schooling among the 26 students in Rocky Boy s Agency are nursery / preschool (11 | 42.3%), college / undergraduate (8 | 30.8%), and high school (7 | 26.9%).
| School Level | # Students | % Students |
| Nursery / Preschool | 11 | 42.3% |
| Kindergarten | 0 | 0.0% |
| Elementary School | 0 | 0.0% |
| Middle School | 0 | 0.0% |
| High School | 7 | 26.9% |
| College / Undergraduate | 8 | 30.8% |
| Graduate / Professional | 0 | 0.0% |
| Total | 26 | 100.0% |
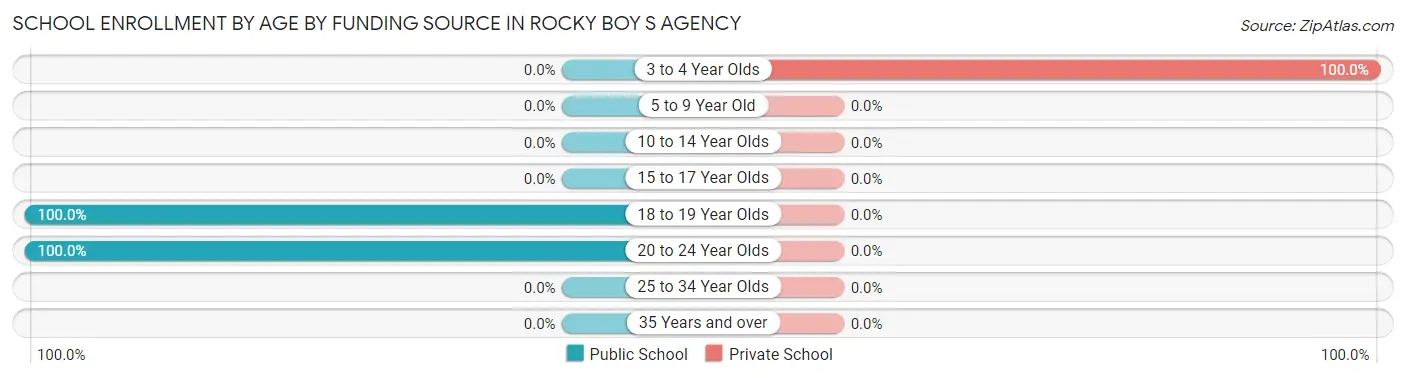
School Enrollment by Age by Funding Source in Rocky Boy s Agency
Out of a total of 26 students who are enrolled in schools in Rocky Boy s Agency, 11 (42.3%) attend a private institution, while the remaining 15 (57.7%) are enrolled in public schools. The age group of 3 to 4 year olds has the highest likelihood of being enrolled in private schools, with 11 (100.0% in the age bracket) enrolled. Conversely, the age group of 18 to 19 year olds has the lowest likelihood of being enrolled in a private school, with 7 (100.0% in the age bracket) attending a public institution.
| Age Bracket | Public School | Private School |
| 3 to 4 Year Olds | 0 (0.0%) | 11 (100.0%) |
| 5 to 9 Year Old | 0 (0.0%) | 0 (0.0%) |
| 10 to 14 Year Olds | 0 (0.0%) | 0 (0.0%) |
| 15 to 17 Year Olds | 0 (0.0%) | 0 (0.0%) |
| 18 to 19 Year Olds | 7 (100.0%) | 0 (0.0%) |
| 20 to 24 Year Olds | 8 (100.0%) | 0 (0.0%) |
| 25 to 34 Year Olds | 0 (0.0%) | 0 (0.0%) |
| 35 Years and over | 0 (0.0%) | 0 (0.0%) |
| Total | 15 (57.7%) | 11 (42.3%) |
Educational Attainment by Field of Study in Rocky Boy s Agency
Education (30 | 88.2%), and liberal arts & history (4 | 11.8%) are the most common fields of study among 34 individuals in Rocky Boy s Agency who have obtained a bachelor's degree or higher.
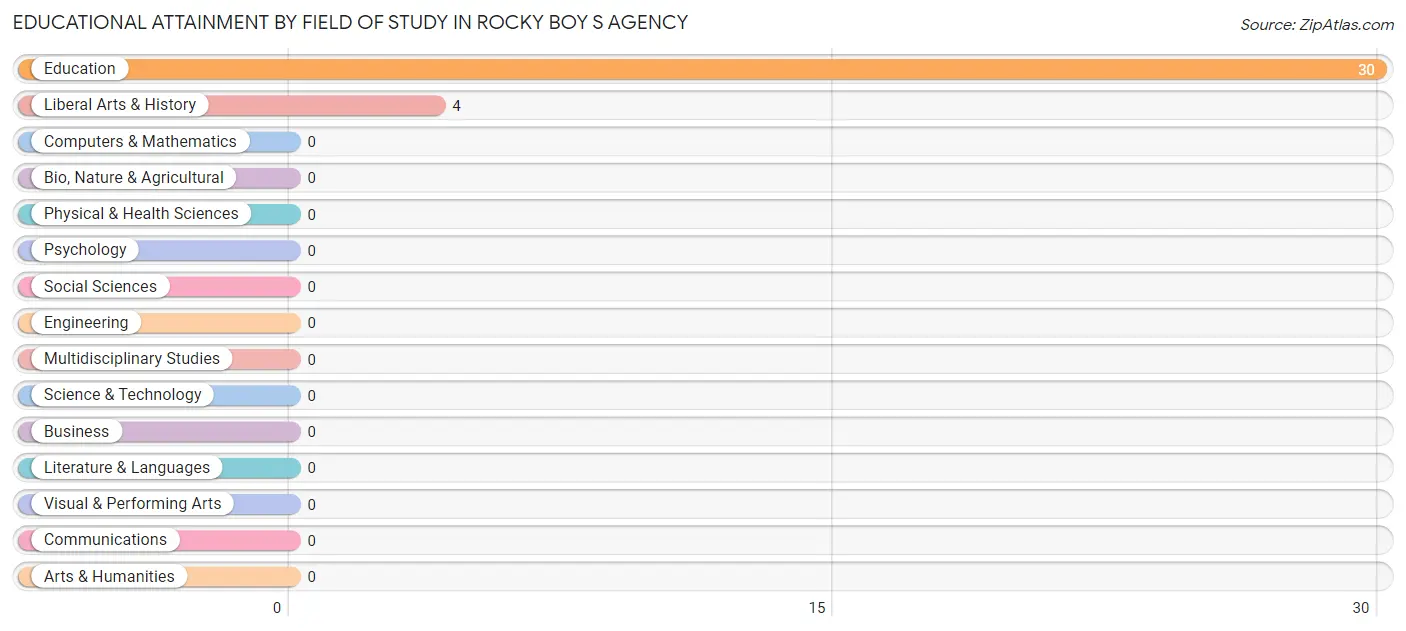
| Field of Study | # Graduates | % Graduates |
| Computers & Mathematics | 0 | 0.0% |
| Bio, Nature & Agricultural | 0 | 0.0% |
| Physical & Health Sciences | 0 | 0.0% |
| Psychology | 0 | 0.0% |
| Social Sciences | 0 | 0.0% |
| Engineering | 0 | 0.0% |
| Multidisciplinary Studies | 0 | 0.0% |
| Science & Technology | 0 | 0.0% |
| Business | 0 | 0.0% |
| Education | 30 | 88.2% |
| Literature & Languages | 0 | 0.0% |
| Liberal Arts & History | 4 | 11.8% |
| Visual & Performing Arts | 0 | 0.0% |
| Communications | 0 | 0.0% |
| Arts & Humanities | 0 | 0.0% |
| Total | 34 | 100.0% |
Transportation & Commute in Rocky Boy s Agency
Vehicle Availability by Sex in Rocky Boy s Agency
The most prevalent vehicle ownership categories in Rocky Boy s Agency are males with 2 vehicles (48, accounting for 49.0%) and females with 2 vehicles (7, making up 300.0%).
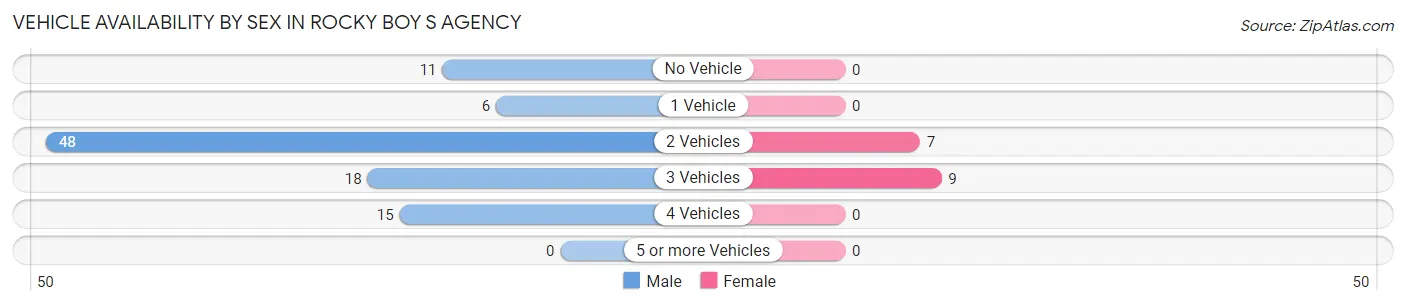
| Vehicles Available | Male | Female |
| No Vehicle | 11 (11.2%) | 0 (0.0%) |
| 1 Vehicle | 6 (6.1%) | 0 (0.0%) |
| 2 Vehicles | 48 (49.0%) | 7 (43.8%) |
| 3 Vehicles | 18 (18.4%) | 9 (56.2%) |
| 4 Vehicles | 15 (15.3%) | 0 (0.0%) |
| 5 or more Vehicles | 0 (0.0%) | 0 (0.0%) |
| Total | 98 (100.0%) | 16 (100.0%) |
Commute Time in Rocky Boy s Agency
The most frequently occuring commute durations in Rocky Boy s Agency are 10 to 14 minutes (67 commuters, 60.9%), 20 to 24 minutes (15 commuters, 13.6%), and 45 to 59 minutes (11 commuters, 10.0%).
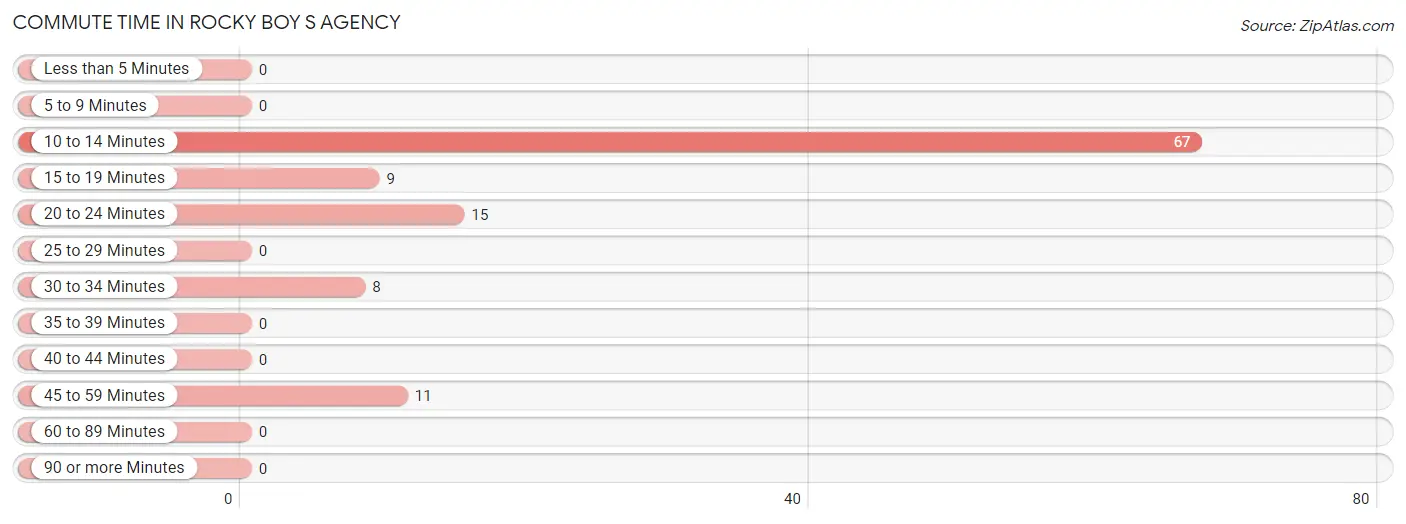
| Commute Time | # Commuters | % Commuters |
| Less than 5 Minutes | 0 | 0.0% |
| 5 to 9 Minutes | 0 | 0.0% |
| 10 to 14 Minutes | 67 | 60.9% |
| 15 to 19 Minutes | 9 | 8.2% |
| 20 to 24 Minutes | 15 | 13.6% |
| 25 to 29 Minutes | 0 | 0.0% |
| 30 to 34 Minutes | 8 | 7.3% |
| 35 to 39 Minutes | 0 | 0.0% |
| 40 to 44 Minutes | 0 | 0.0% |
| 45 to 59 Minutes | 11 | 10.0% |
| 60 to 89 Minutes | 0 | 0.0% |
| 90 or more Minutes | 0 | 0.0% |
Commute Time by Sex in Rocky Boy s Agency
The most common commute times in Rocky Boy s Agency are 10 to 14 minutes (60 commuters, 63.8%) for males and 15 to 19 minutes (9 commuters, 56.2%) for females.
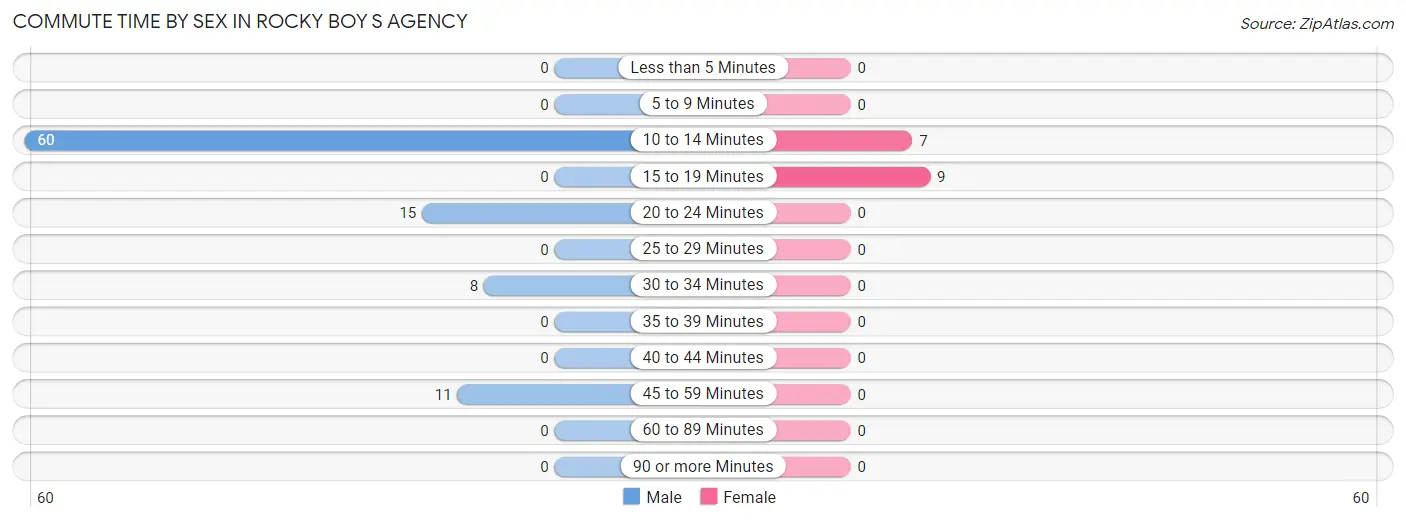
| Commute Time | Male | Female |
| Less than 5 Minutes | 0 (0.0%) | 0 (0.0%) |
| 5 to 9 Minutes | 0 (0.0%) | 0 (0.0%) |
| 10 to 14 Minutes | 60 (63.8%) | 7 (43.8%) |
| 15 to 19 Minutes | 0 (0.0%) | 9 (56.2%) |
| 20 to 24 Minutes | 15 (16.0%) | 0 (0.0%) |
| 25 to 29 Minutes | 0 (0.0%) | 0 (0.0%) |
| 30 to 34 Minutes | 8 (8.5%) | 0 (0.0%) |
| 35 to 39 Minutes | 0 (0.0%) | 0 (0.0%) |
| 40 to 44 Minutes | 0 (0.0%) | 0 (0.0%) |
| 45 to 59 Minutes | 11 (11.7%) | 0 (0.0%) |
| 60 to 89 Minutes | 0 (0.0%) | 0 (0.0%) |
| 90 or more Minutes | 0 (0.0%) | 0 (0.0%) |
Time of Departure to Work by Sex in Rocky Boy s Agency
The most frequent times of departure to work in Rocky Boy s Agency are 8:00 AM to 8:29 AM (60, 63.8%) for males and 4:00 PM to 11:59 PM (9, 56.2%) for females.
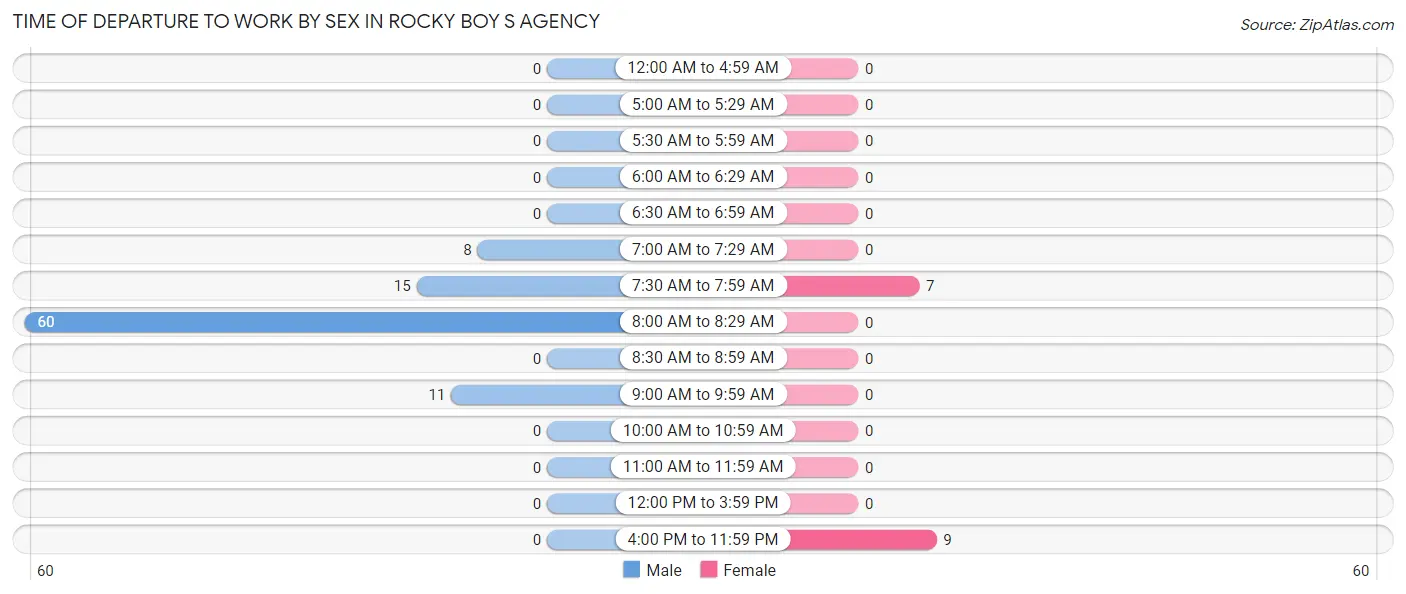
| Time of Departure | Male | Female |
| 12:00 AM to 4:59 AM | 0 (0.0%) | 0 (0.0%) |
| 5:00 AM to 5:29 AM | 0 (0.0%) | 0 (0.0%) |
| 5:30 AM to 5:59 AM | 0 (0.0%) | 0 (0.0%) |
| 6:00 AM to 6:29 AM | 0 (0.0%) | 0 (0.0%) |
| 6:30 AM to 6:59 AM | 0 (0.0%) | 0 (0.0%) |
| 7:00 AM to 7:29 AM | 8 (8.5%) | 0 (0.0%) |
| 7:30 AM to 7:59 AM | 15 (16.0%) | 7 (43.8%) |
| 8:00 AM to 8:29 AM | 60 (63.8%) | 0 (0.0%) |
| 8:30 AM to 8:59 AM | 0 (0.0%) | 0 (0.0%) |
| 9:00 AM to 9:59 AM | 11 (11.7%) | 0 (0.0%) |
| 10:00 AM to 10:59 AM | 0 (0.0%) | 0 (0.0%) |
| 11:00 AM to 11:59 AM | 0 (0.0%) | 0 (0.0%) |
| 12:00 PM to 3:59 PM | 0 (0.0%) | 0 (0.0%) |
| 4:00 PM to 11:59 PM | 0 (0.0%) | 9 (56.2%) |
| Total | 94 (100.0%) | 16 (100.0%) |
Housing Occupancy in Rocky Boy s Agency
Occupancy by Ownership in Rocky Boy s Agency
Of the total 112 dwellings in Rocky Boy s Agency, owner-occupied units account for 47 (42.0%), while renter-occupied units make up 65 (58.0%).
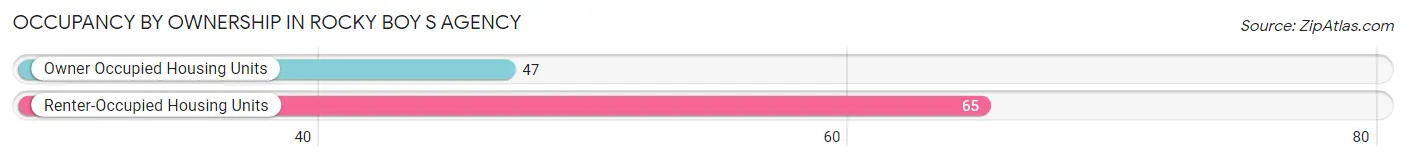
| Occupancy | # Housing Units | % Housing Units |
| Owner Occupied Housing Units | 47 | 42.0% |
| Renter-Occupied Housing Units | 65 | 58.0% |
| Total Occupied Housing Units | 112 | 100.0% |
Occupancy by Household Size in Rocky Boy s Agency
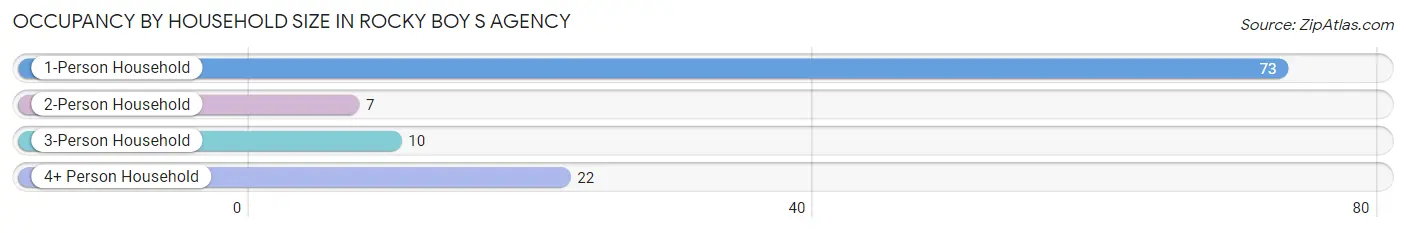
| Household Size | # Housing Units | % Housing Units |
| 1-Person Household | 73 | 65.2% |
| 2-Person Household | 7 | 6.2% |
| 3-Person Household | 10 | 8.9% |
| 4+ Person Household | 22 | 19.6% |
| Total Housing Units | 112 | 100.0% |
Occupancy by Ownership by Household Size in Rocky Boy s Agency
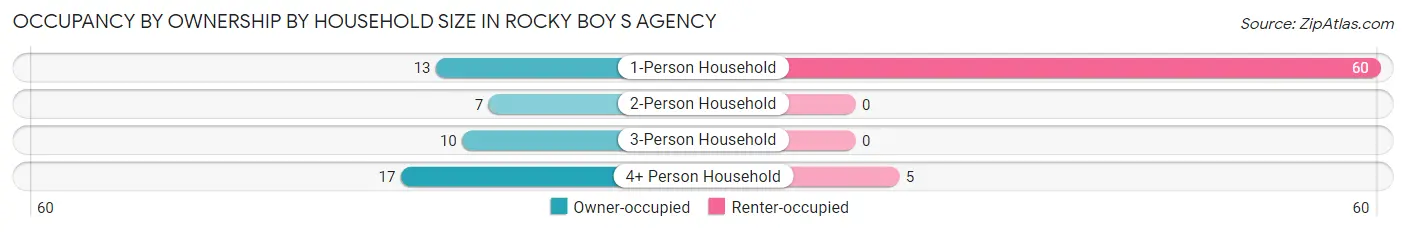
| Household Size | Owner-occupied | Renter-occupied |
| 1-Person Household | 13 (17.8%) | 60 (82.2%) |
| 2-Person Household | 7 (100.0%) | 0 (0.0%) |
| 3-Person Household | 10 (100.0%) | 0 (0.0%) |
| 4+ Person Household | 17 (77.3%) | 5 (22.7%) |
| Total Housing Units | 47 (42.0%) | 65 (58.0%) |
Occupancy by Educational Attainment in Rocky Boy s Agency
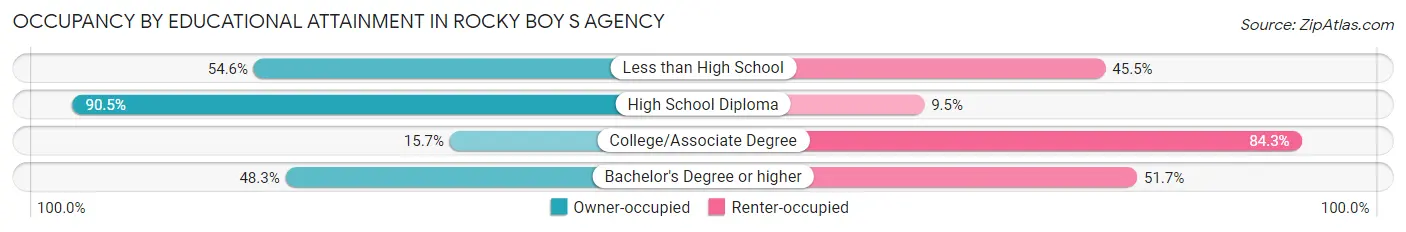
| Household Size | Owner-occupied | Renter-occupied |
| Less than High School | 6 (54.5%) | 5 (45.5%) |
| High School Diploma | 19 (90.5%) | 2 (9.5%) |
| College/Associate Degree | 8 (15.7%) | 43 (84.3%) |
| Bachelor's Degree or higher | 14 (48.3%) | 15 (51.7%) |
Occupancy by Age of Householder in Rocky Boy s Agency
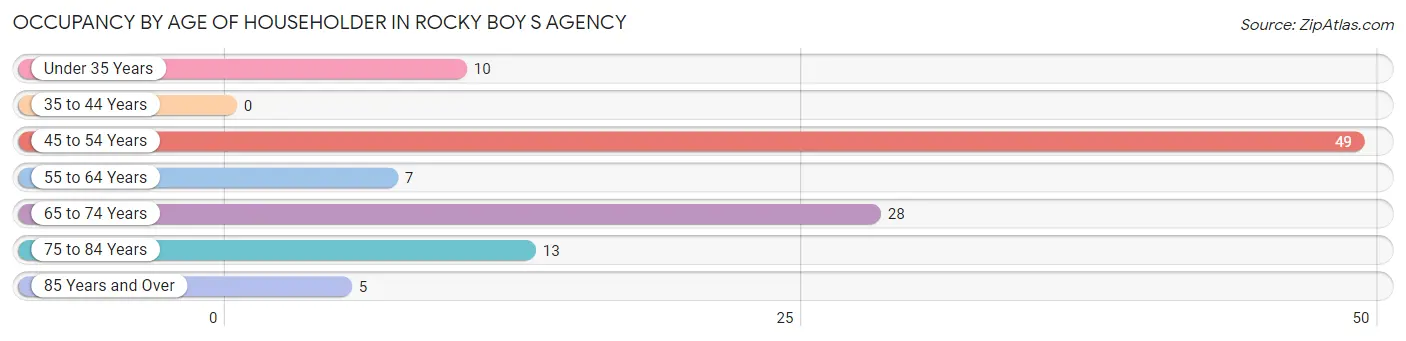
| Age Bracket | # Households | % Households |
| Under 35 Years | 10 | 8.9% |
| 35 to 44 Years | 0 | 0.0% |
| 45 to 54 Years | 49 | 43.8% |
| 55 to 64 Years | 7 | 6.2% |
| 65 to 74 Years | 28 | 25.0% |
| 75 to 84 Years | 13 | 11.6% |
| 85 Years and Over | 5 | 4.5% |
| Total | 112 | 100.0% |
Housing Finances in Rocky Boy s Agency
Median Income by Occupancy in Rocky Boy s Agency
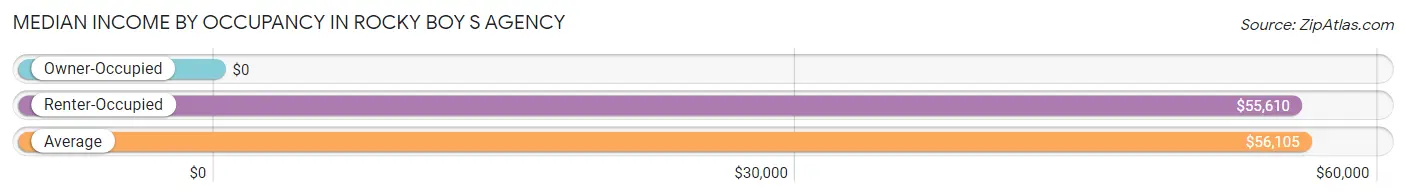
| Occupancy Type | # Households | Median Income |
| Owner-Occupied | 47 (42.0%) | $0 |
| Renter-Occupied | 65 (58.0%) | $55,610 |
| Average | 112 (100.0%) | $56,105 |
Occupancy by Householder Income Bracket in Rocky Boy s Agency
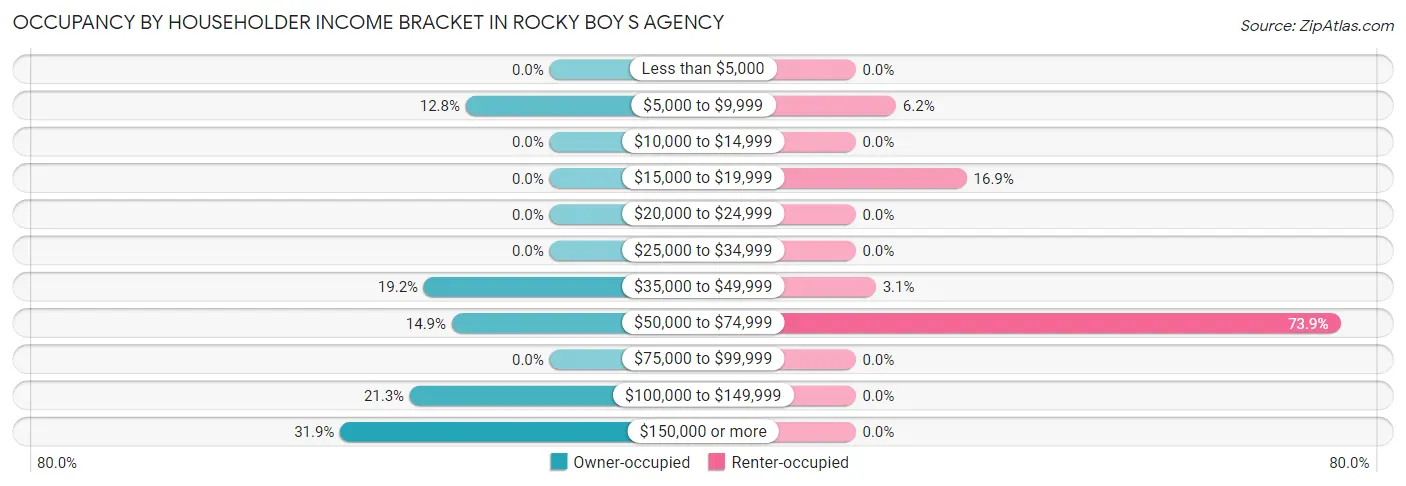
| Income Bracket | Owner-occupied | Renter-occupied |
| Less than $5,000 | 0 (0.0%) | 0 (0.0%) |
| $5,000 to $9,999 | 6 (12.8%) | 4 (6.1%) |
| $10,000 to $14,999 | 0 (0.0%) | 0 (0.0%) |
| $15,000 to $19,999 | 0 (0.0%) | 11 (16.9%) |
| $20,000 to $24,999 | 0 (0.0%) | 0 (0.0%) |
| $25,000 to $34,999 | 0 (0.0%) | 0 (0.0%) |
| $35,000 to $49,999 | 9 (19.2%) | 2 (3.1%) |
| $50,000 to $74,999 | 7 (14.9%) | 48 (73.9%) |
| $75,000 to $99,999 | 0 (0.0%) | 0 (0.0%) |
| $100,000 to $149,999 | 10 (21.3%) | 0 (0.0%) |
| $150,000 or more | 15 (31.9%) | 0 (0.0%) |
| Total | 47 (100.0%) | 65 (100.0%) |
Monthly Housing Cost Tiers in Rocky Boy s Agency
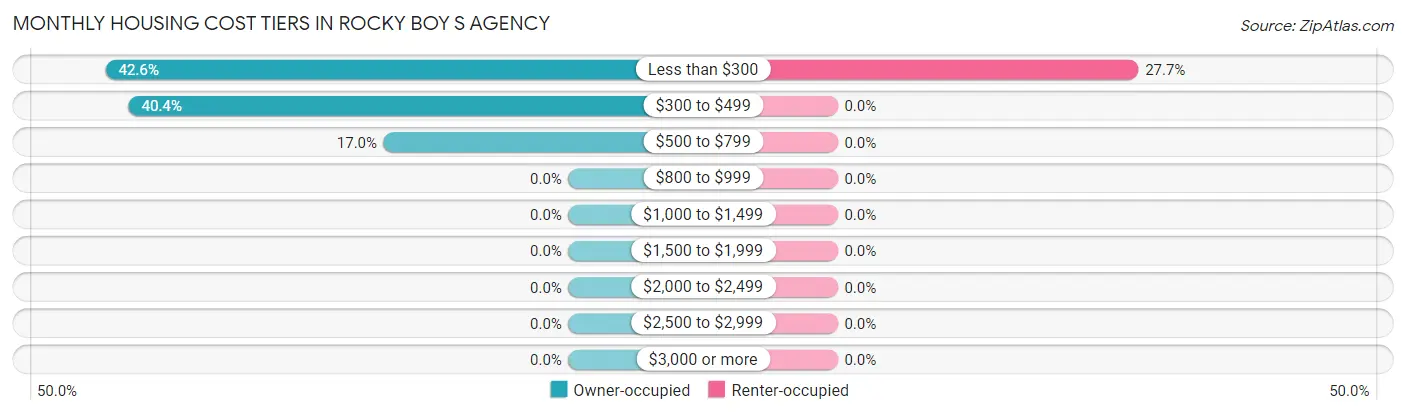
| Monthly Cost | Owner-occupied | Renter-occupied |
| Less than $300 | 20 (42.5%) | 18 (27.7%) |
| $300 to $499 | 19 (40.4%) | 0 (0.0%) |
| $500 to $799 | 8 (17.0%) | 0 (0.0%) |
| $800 to $999 | 0 (0.0%) | 0 (0.0%) |
| $1,000 to $1,499 | 0 (0.0%) | 0 (0.0%) |
| $1,500 to $1,999 | 0 (0.0%) | 0 (0.0%) |
| $2,000 to $2,499 | 0 (0.0%) | 0 (0.0%) |
| $2,500 to $2,999 | 0 (0.0%) | 0 (0.0%) |
| $3,000 or more | 0 (0.0%) | 0 (0.0%) |
| Total | 47 (100.0%) | 65 (100.0%) |
Physical Housing Characteristics in Rocky Boy s Agency
Housing Structures in Rocky Boy s Agency
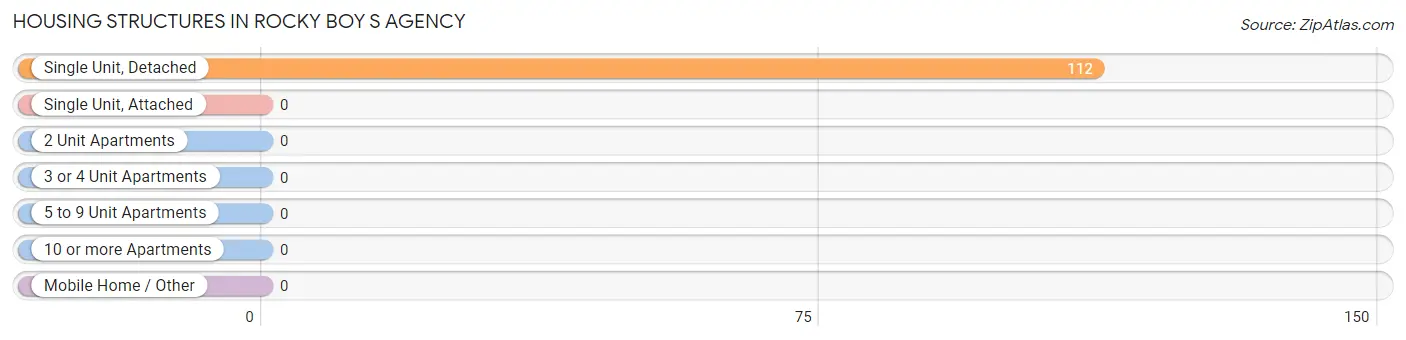
| Structure Type | # Housing Units | % Housing Units |
| Single Unit, Detached | 112 | 100.0% |
| Single Unit, Attached | 0 | 0.0% |
| 2 Unit Apartments | 0 | 0.0% |
| 3 or 4 Unit Apartments | 0 | 0.0% |
| 5 to 9 Unit Apartments | 0 | 0.0% |
| 10 or more Apartments | 0 | 0.0% |
| Mobile Home / Other | 0 | 0.0% |
| Total | 112 | 100.0% |
Housing Structures by Occupancy in Rocky Boy s Agency
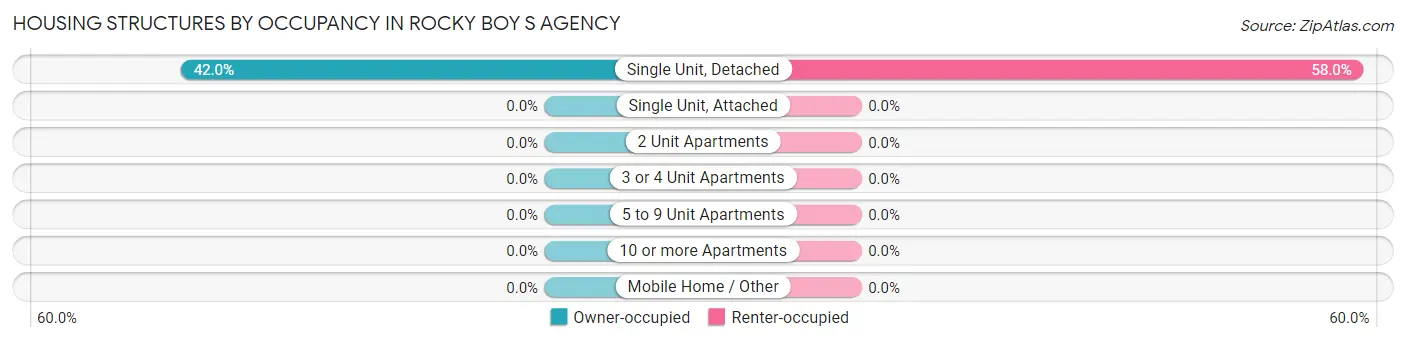
| Structure Type | Owner-occupied | Renter-occupied |
| Single Unit, Detached | 47 (42.0%) | 65 (58.0%) |
| Single Unit, Attached | 0 (0.0%) | 0 (0.0%) |
| 2 Unit Apartments | 0 (0.0%) | 0 (0.0%) |
| 3 or 4 Unit Apartments | 0 (0.0%) | 0 (0.0%) |
| 5 to 9 Unit Apartments | 0 (0.0%) | 0 (0.0%) |
| 10 or more Apartments | 0 (0.0%) | 0 (0.0%) |
| Mobile Home / Other | 0 (0.0%) | 0 (0.0%) |
| Total | 47 (42.0%) | 65 (58.0%) |
Housing Structures by Number of Rooms in Rocky Boy s Agency
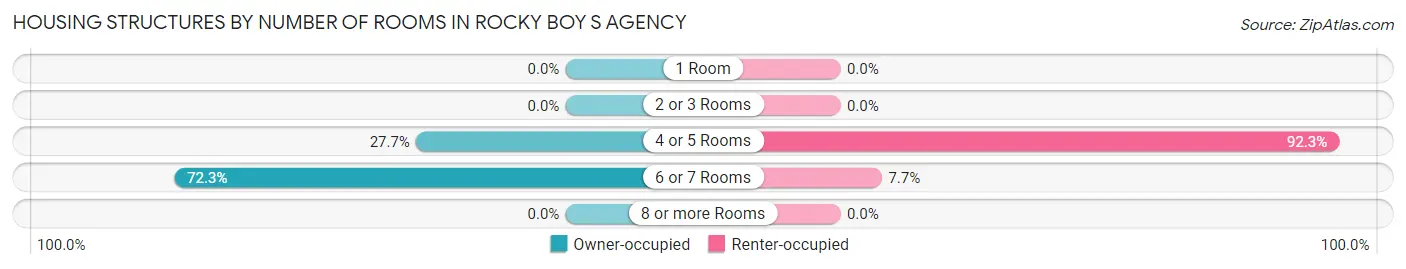
| Number of Rooms | Owner-occupied | Renter-occupied |
| 1 Room | 0 (0.0%) | 0 (0.0%) |
| 2 or 3 Rooms | 0 (0.0%) | 0 (0.0%) |
| 4 or 5 Rooms | 13 (27.7%) | 60 (92.3%) |
| 6 or 7 Rooms | 34 (72.3%) | 5 (7.7%) |
| 8 or more Rooms | 0 (0.0%) | 0 (0.0%) |
| Total | 47 (100.0%) | 65 (100.0%) |
Housing Structure by Heating Type in Rocky Boy s Agency
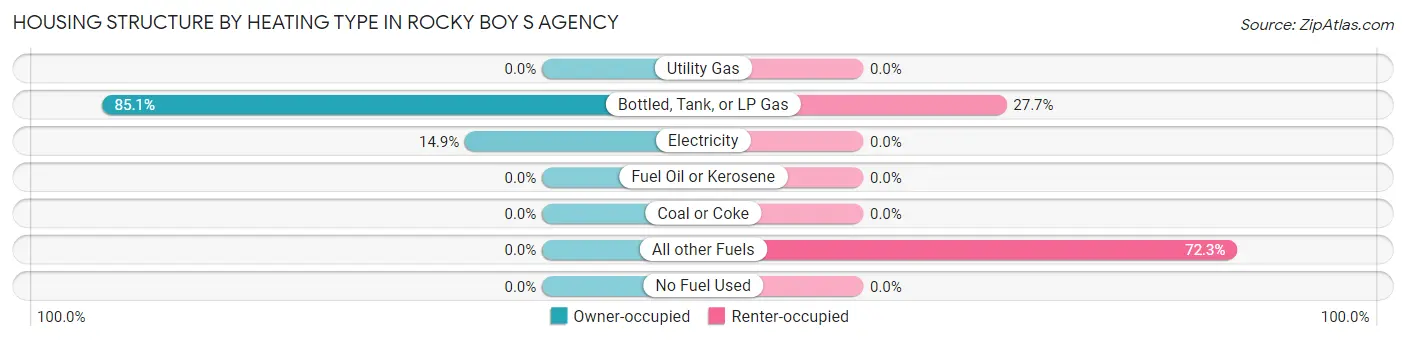
| Heating Type | Owner-occupied | Renter-occupied |
| Utility Gas | 0 (0.0%) | 0 (0.0%) |
| Bottled, Tank, or LP Gas | 40 (85.1%) | 18 (27.7%) |
| Electricity | 7 (14.9%) | 0 (0.0%) |
| Fuel Oil or Kerosene | 0 (0.0%) | 0 (0.0%) |
| Coal or Coke | 0 (0.0%) | 0 (0.0%) |
| All other Fuels | 0 (0.0%) | 47 (72.3%) |
| No Fuel Used | 0 (0.0%) | 0 (0.0%) |
| Total | 47 (100.0%) | 65 (100.0%) |
Household Vehicle Usage in Rocky Boy s Agency
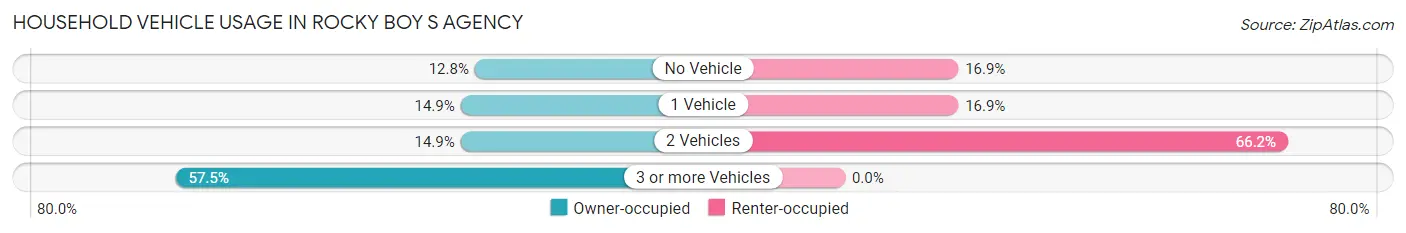
| Vehicles per Household | Owner-occupied | Renter-occupied |
| No Vehicle | 6 (12.8%) | 11 (16.9%) |
| 1 Vehicle | 7 (14.9%) | 11 (16.9%) |
| 2 Vehicles | 7 (14.9%) | 43 (66.1%) |
| 3 or more Vehicles | 27 (57.5%) | 0 (0.0%) |
| Total | 47 (100.0%) | 65 (100.0%) |
Real Estate & Mortgages in Rocky Boy s Agency
Real Estate and Mortgage Overview in Rocky Boy s Agency
| Characteristic | Without Mortgage | With Mortgage |
| Housing Units | 47 | 0 |
| Median Property Value | $47,900 | $0 |
| Median Household Income | - | - |
| Monthly Housing Costs | $359 | $0 |
| Real Estate Taxes | - | - |
Property Value by Mortgage Status in Rocky Boy s Agency
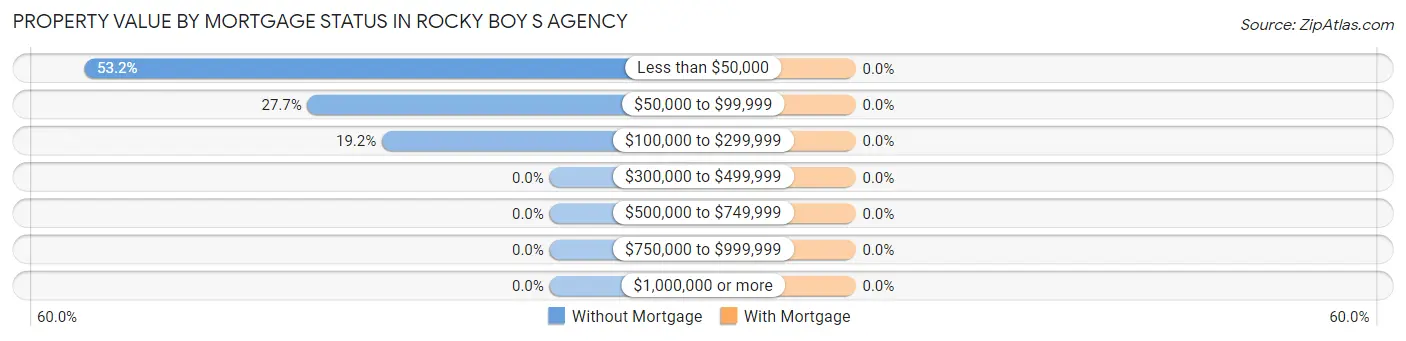
| Property Value | Without Mortgage | With Mortgage |
| Less than $50,000 | 25 (53.2%) | 0 (0.0%) |
| $50,000 to $99,999 | 13 (27.7%) | 0 (0.0%) |
| $100,000 to $299,999 | 9 (19.2%) | 0 (0.0%) |
| $300,000 to $499,999 | 0 (0.0%) | 0 (0.0%) |
| $500,000 to $749,999 | 0 (0.0%) | 0 (0.0%) |
| $750,000 to $999,999 | 0 (0.0%) | 0 (0.0%) |
| $1,000,000 or more | 0 (0.0%) | 0 (0.0%) |
| Total | 47 (100.0%) | 0 (0.0%) |
Household Income by Mortgage Status in Rocky Boy s Agency
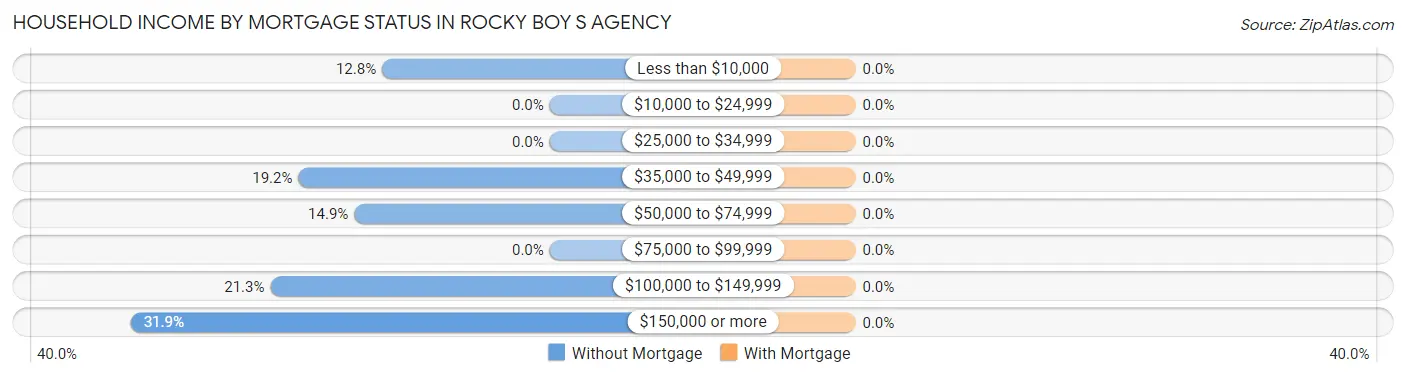
| Household Income | Without Mortgage | With Mortgage |
| Less than $10,000 | 6 (12.8%) | 0 (0.0%) |
| $10,000 to $24,999 | 0 (0.0%) | 0 (0.0%) |
| $25,000 to $34,999 | 0 (0.0%) | 0 (0.0%) |
| $35,000 to $49,999 | 9 (19.2%) | 0 (0.0%) |
| $50,000 to $74,999 | 7 (14.9%) | 0 (0.0%) |
| $75,000 to $99,999 | 0 (0.0%) | 0 (0.0%) |
| $100,000 to $149,999 | 10 (21.3%) | 0 (0.0%) |
| $150,000 or more | 15 (31.9%) | 0 (0.0%) |
| Total | 47 (100.0%) | 0 (0.0%) |
Property Value to Household Income Ratio in Rocky Boy s Agency
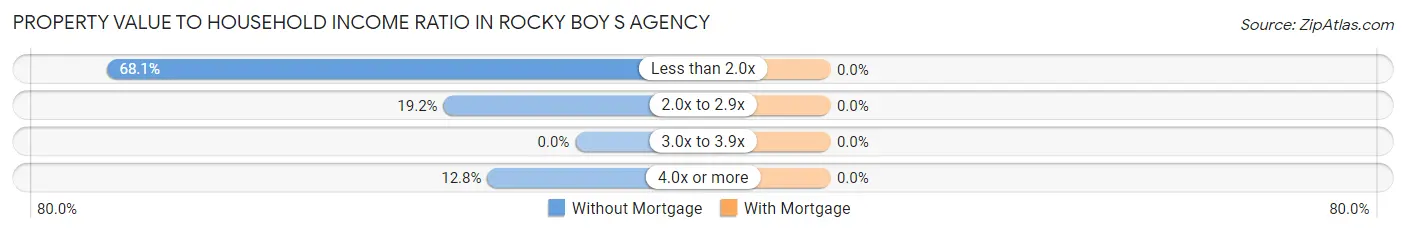
| Value-to-Income Ratio | Without Mortgage | With Mortgage |
| Less than 2.0x | 32 (68.1%) | 0 (0.0%) |
| 2.0x to 2.9x | 9 (19.2%) | 0 (0.0%) |
| 3.0x to 3.9x | 0 (0.0%) | 0 (0.0%) |
| 4.0x or more | 6 (12.8%) | 0 (0.0%) |
| Total | 47 (100.0%) | 0 (0.0%) |
Real Estate Taxes by Mortgage Status in Rocky Boy s Agency
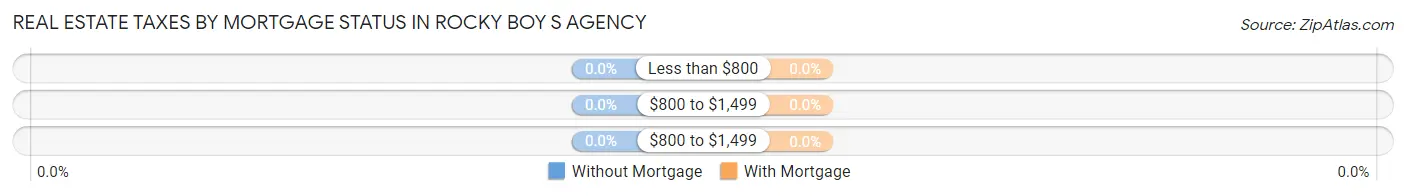
| Property Taxes | Without Mortgage | With Mortgage |
| Less than $800 | 0 (0.0%) | 0 (0.0%) |
| $800 to $1,499 | 0 (0.0%) | 0 (0.0%) |
| $800 to $1,499 | 0 (0.0%) | 0 (0.0%) |
| Total | 47 (100.0%) | 0 (0.0%) |
Health & Disability in Rocky Boy s Agency
Health Insurance Coverage by Age in Rocky Boy s Agency
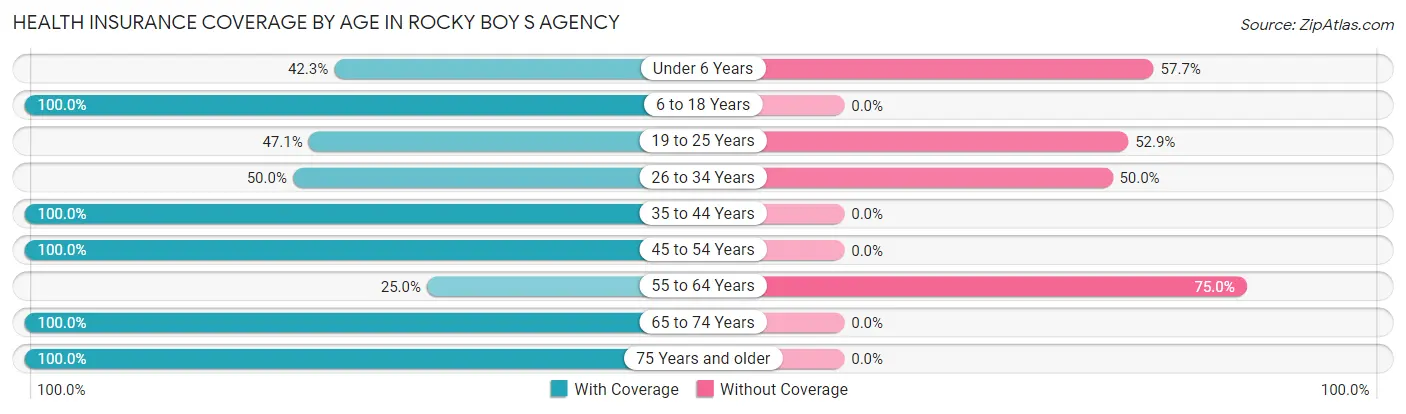
| Age Bracket | With Coverage | Without Coverage |
| Under 6 Years | 11 (42.3%) | 15 (57.7%) |
| 6 to 18 Years | 7 (100.0%) | 0 (0.0%) |
| 19 to 25 Years | 8 (47.1%) | 9 (52.9%) |
| 26 to 34 Years | 10 (50.0%) | 10 (50.0%) |
| 35 to 44 Years | 5 (100.0%) | 0 (0.0%) |
| 45 to 54 Years | 54 (100.0%) | 0 (0.0%) |
| 55 to 64 Years | 4 (25.0%) | 12 (75.0%) |
| 65 to 74 Years | 33 (100.0%) | 0 (0.0%) |
| 75 Years and older | 26 (100.0%) | 0 (0.0%) |
| Total | 158 (77.4%) | 46 (22.6%) |
Health Insurance Coverage by Citizenship Status in Rocky Boy s Agency
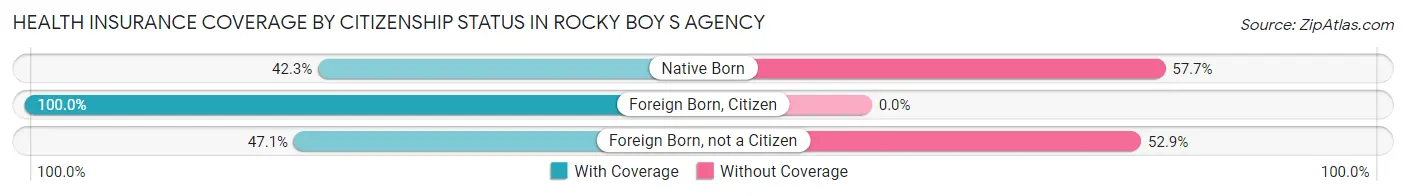
| Citizenship Status | With Coverage | Without Coverage |
| Native Born | 11 (42.3%) | 15 (57.7%) |
| Foreign Born, Citizen | 7 (100.0%) | 0 (0.0%) |
| Foreign Born, not a Citizen | 8 (47.1%) | 9 (52.9%) |
Health Insurance Coverage by Household Income in Rocky Boy s Agency
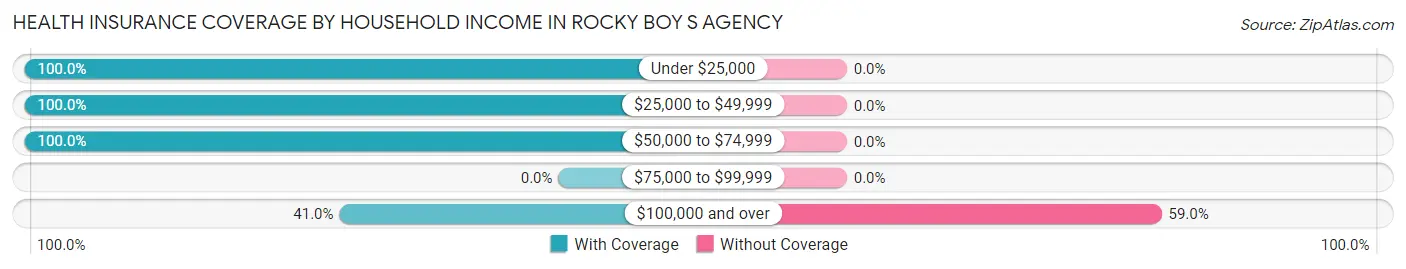
| Household Income | With Coverage | Without Coverage |
| Under $25,000 | 21 (100.0%) | 0 (0.0%) |
| $25,000 to $49,999 | 34 (100.0%) | 0 (0.0%) |
| $50,000 to $74,999 | 71 (100.0%) | 0 (0.0%) |
| $75,000 to $99,999 | 0 (0.0%) | 0 (0.0%) |
| $100,000 and over | 32 (41.0%) | 46 (59.0%) |
Public vs Private Health Insurance Coverage by Age in Rocky Boy s Agency
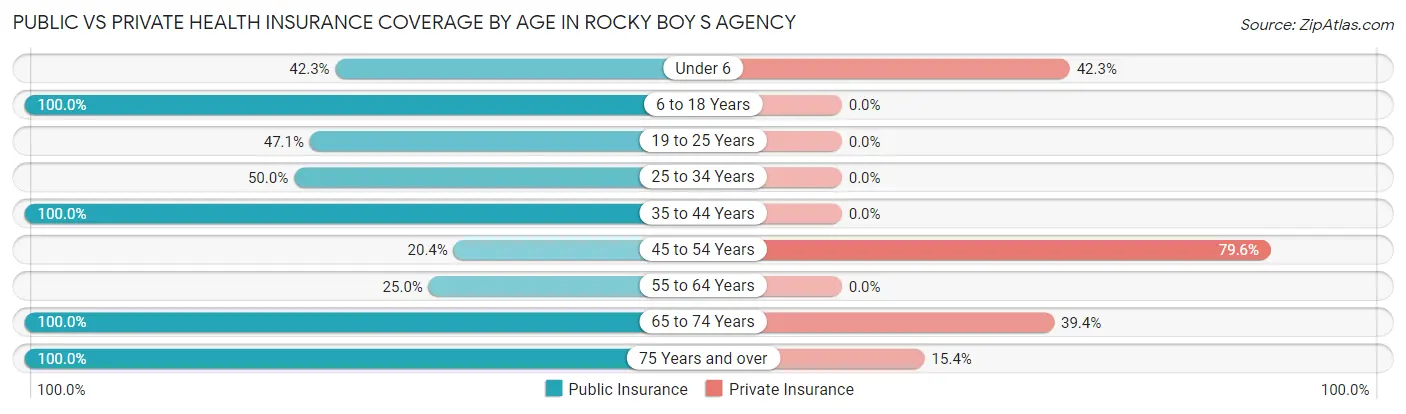
| Age Bracket | Public Insurance | Private Insurance |
| Under 6 | 11 (42.3%) | 11 (42.3%) |
| 6 to 18 Years | 7 (100.0%) | 0 (0.0%) |
| 19 to 25 Years | 8 (47.1%) | 0 (0.0%) |
| 25 to 34 Years | 10 (50.0%) | 0 (0.0%) |
| 35 to 44 Years | 5 (100.0%) | 0 (0.0%) |
| 45 to 54 Years | 11 (20.4%) | 43 (79.6%) |
| 55 to 64 Years | 4 (25.0%) | 0 (0.0%) |
| 65 to 74 Years | 33 (100.0%) | 13 (39.4%) |
| 75 Years and over | 26 (100.0%) | 4 (15.4%) |
| Total | 115 (56.4%) | 71 (34.8%) |
Disability Status by Sex by Age in Rocky Boy s Agency
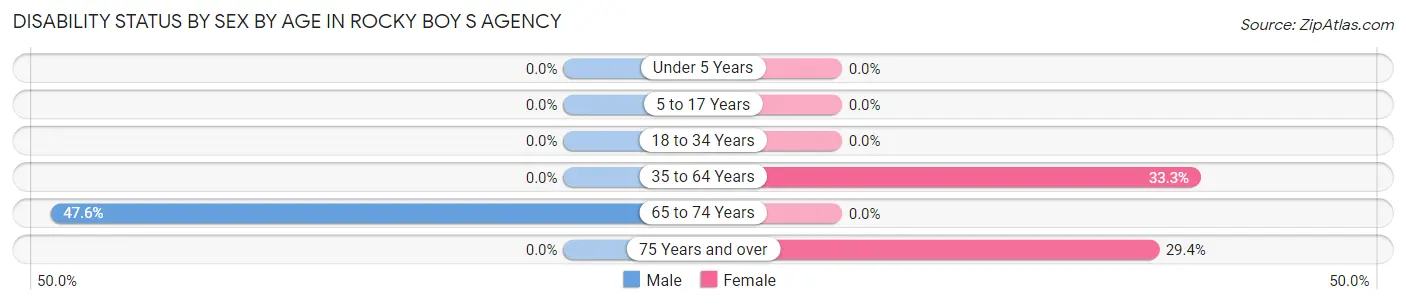
| Age Bracket | Male | Female |
| Under 5 Years | 0 (0.0%) | 0 (0.0%) |
| 5 to 17 Years | 0 (0.0%) | 0 (0.0%) |
| 18 to 34 Years | 0 (0.0%) | 0 (0.0%) |
| 35 to 64 Years | 0 (0.0%) | 6 (33.3%) |
| 65 to 74 Years | 10 (47.6%) | 0 (0.0%) |
| 75 Years and over | 0 (0.0%) | 5 (29.4%) |
Disability Class by Sex by Age in Rocky Boy s Agency
Disability Class: Hearing Difficulty
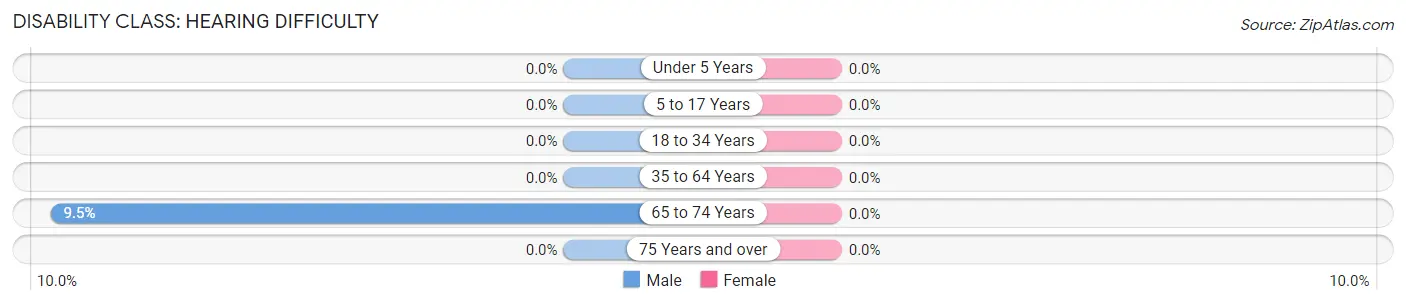
| Age Bracket | Male | Female |
| Under 5 Years | 0 (0.0%) | 0 (0.0%) |
| 5 to 17 Years | 0 (0.0%) | 0 (0.0%) |
| 18 to 34 Years | 0 (0.0%) | 0 (0.0%) |
| 35 to 64 Years | 0 (0.0%) | 0 (0.0%) |
| 65 to 74 Years | 2 (9.5%) | 0 (0.0%) |
| 75 Years and over | 0 (0.0%) | 0 (0.0%) |
Disability Class: Vision Difficulty
| Age Bracket | Male | Female |
| Under 5 Years | 0 (0.0%) | 0 (0.0%) |
| 5 to 17 Years | 0 (0.0%) | 0 (0.0%) |
| 18 to 34 Years | 0 (0.0%) | 0 (0.0%) |
| 35 to 64 Years | 0 (0.0%) | 0 (0.0%) |
| 65 to 74 Years | 0 (0.0%) | 0 (0.0%) |
| 75 Years and over | 0 (0.0%) | 0 (0.0%) |
Disability Class: Cognitive Difficulty
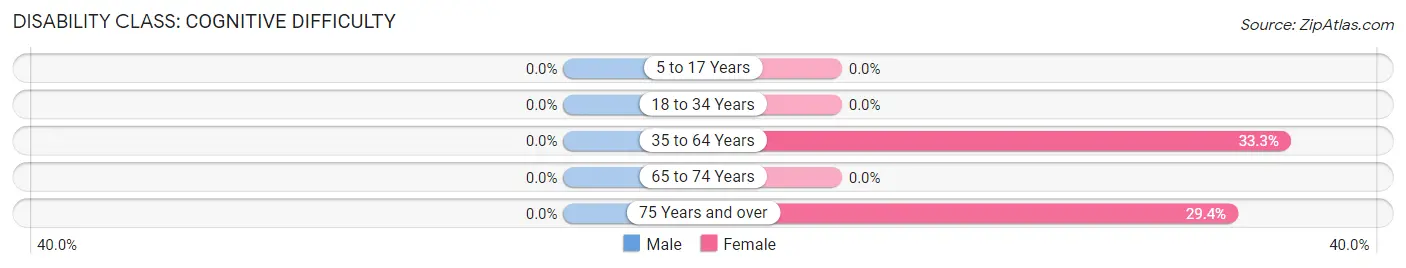
| Age Bracket | Male | Female |
| 5 to 17 Years | 0 (0.0%) | 0 (0.0%) |
| 18 to 34 Years | 0 (0.0%) | 0 (0.0%) |
| 35 to 64 Years | 0 (0.0%) | 6 (33.3%) |
| 65 to 74 Years | 0 (0.0%) | 0 (0.0%) |
| 75 Years and over | 0 (0.0%) | 5 (29.4%) |
Disability Class: Ambulatory Difficulty
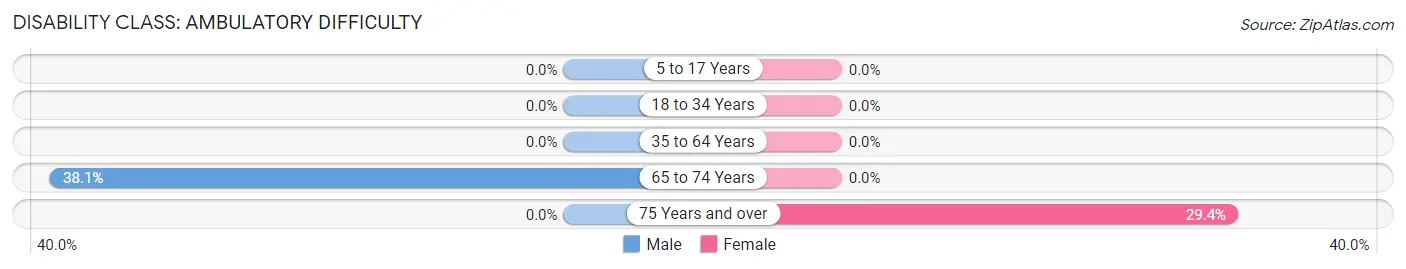
| Age Bracket | Male | Female |
| 5 to 17 Years | 0 (0.0%) | 0 (0.0%) |
| 18 to 34 Years | 0 (0.0%) | 0 (0.0%) |
| 35 to 64 Years | 0 (0.0%) | 0 (0.0%) |
| 65 to 74 Years | 8 (38.1%) | 0 (0.0%) |
| 75 Years and over | 0 (0.0%) | 5 (29.4%) |
Disability Class: Self-Care Difficulty
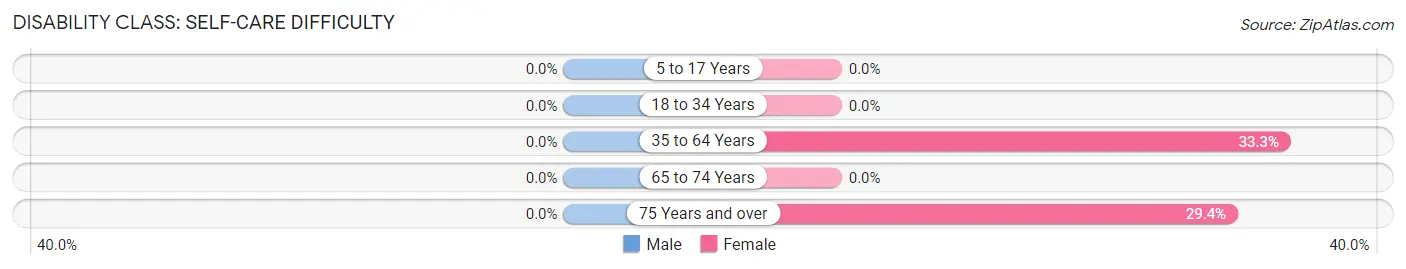
| Age Bracket | Male | Female |
| 5 to 17 Years | 0 (0.0%) | 0 (0.0%) |
| 18 to 34 Years | 0 (0.0%) | 0 (0.0%) |
| 35 to 64 Years | 0 (0.0%) | 6 (33.3%) |
| 65 to 74 Years | 0 (0.0%) | 0 (0.0%) |
| 75 Years and over | 0 (0.0%) | 5 (29.4%) |
Technology Access in Rocky Boy s Agency
Computing Device Access in Rocky Boy s Agency
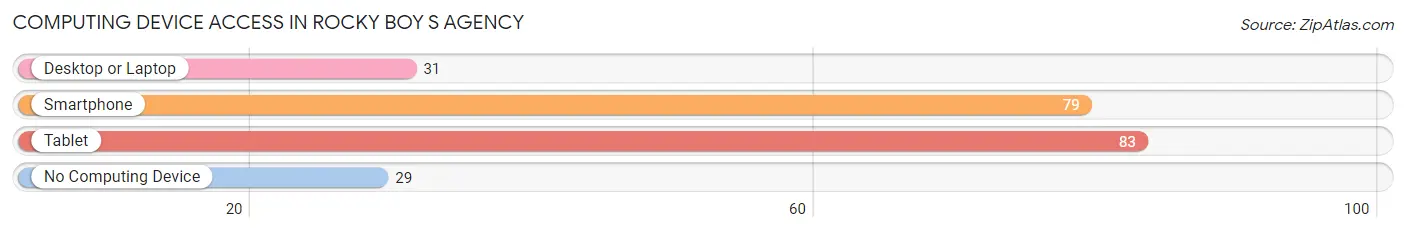
| Device Type | # Households | % Households |
| Desktop or Laptop | 31 | 27.7% |
| Smartphone | 79 | 70.5% |
| Tablet | 83 | 74.1% |
| No Computing Device | 29 | 25.9% |
| Total | 112 | 100.0% |
Internet Access in Rocky Boy s Agency
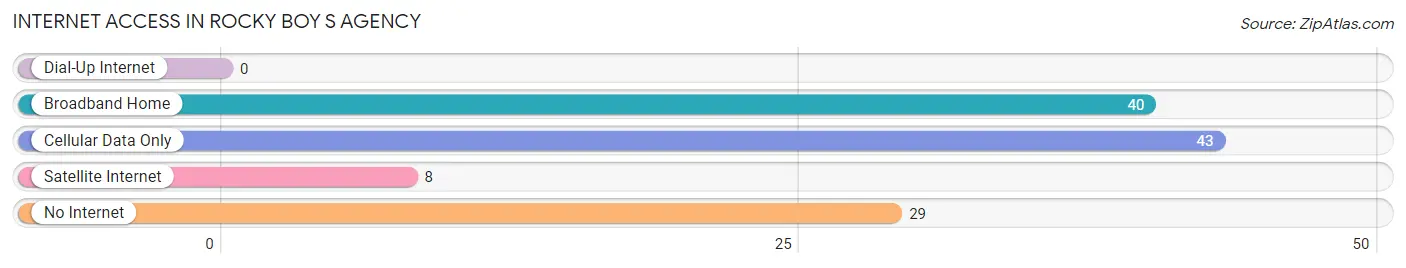
| Internet Type | # Households | % Households |
| Dial-Up Internet | 0 | 0.0% |
| Broadband Home | 40 | 35.7% |
| Cellular Data Only | 43 | 38.4% |
| Satellite Internet | 8 | 7.1% |
| No Internet | 29 | 25.9% |
| Total | 112 | 100.0% |
Rocky Boy s Agency Summary
Rocky Boy's Agency is a Native American reservation located in the north-central region of Montana. It is home to the Chippewa Cree Tribe, who are descendants of the Cree and Ojibwe people. The reservation was established in 1916 and is located in Hill and Chouteau counties. It is the smallest reservation in Montana, covering only about 200 square miles.
Geography
Rocky Boy's Agency is located in the north-central region of Montana, about 50 miles north of Great Falls. It is bordered by the Rocky Boy Indian Reservation to the east, the Blackfeet Indian Reservation to the south, and the Fort Belknap Indian Reservation to the west. The reservation is located in the Rocky Mountain foothills and is characterized by rolling hills, grasslands, and forests. The highest point on the reservation is the Bear Paw Mountains, which reach an elevation of 4,922 feet.
Economy
The economy of Rocky Boy's Agency is largely based on agriculture and natural resource extraction. The reservation is home to a variety of crops, including wheat, barley, oats, and hay. Livestock production is also important, with cattle, sheep, and horses being raised on the reservation. The reservation also has a number of natural resources, including timber, coal, and oil.
Demographics
As of the 2010 census, the population of Rocky Boy's Agency was 4,076. The majority of the population (90.3%) is Native American, with the Chippewa Cree Tribe making up the majority of the population. The median household income is $25,000, and the poverty rate is 44.3%.
Education
Rocky Boy's Agency is served by the Rocky Boy School District, which operates four schools on the reservation. The district also operates a Head Start program and a tribal college, the Chippewa Cree Tribal College. The college offers associate's and bachelor's degrees in a variety of fields, including business, education, and health sciences.
Conclusion
Rocky Boy's Agency is a small Native American reservation located in the north-central region of Montana. It is home to the Chippewa Cree Tribe, who are descendants of the Cree and Ojibwe people. The reservation is characterized by rolling hills, grasslands, and forests, and its economy is largely based on agriculture and natural resource extraction. The population of the reservation is 4,076, with the majority of the population being Native American. The reservation is served by the Rocky Boy School District, which operates four schools on the reservation, as well as a tribal college.
Common Questions
What is Per Capita Income in Rocky Boy s Agency?
Per Capita income in Rocky Boy s Agency is $35,331.
What is the Median Family Income in Rocky Boy s Agency?
Median Family Income in Rocky Boy s Agency is $136,375.
What is the Median Household income in Rocky Boy s Agency?
Median Household Income in Rocky Boy s Agency is $56,105.
What is Inequality or Gini Index in Rocky Boy s Agency?
Inequality or Gini Index in Rocky Boy s Agency is 0.36.
What is the Total Population of Rocky Boy s Agency?
Total Population of Rocky Boy s Agency is 204.
What is the Total Male Population of Rocky Boy s Agency?
Total Male Population of Rocky Boy s Agency is 122.
What is the Total Female Population of Rocky Boy s Agency?
Total Female Population of Rocky Boy s Agency is 82.
What is the Ratio of Males per 100 Females in Rocky Boy s Agency?
There are 148.78 Males per 100 Females in Rocky Boy s Agency.
What is the Ratio of Females per 100 Males in Rocky Boy s Agency?
There are 67.21 Females per 100 Males in Rocky Boy s Agency.
What is the Median Population Age in Rocky Boy s Agency?
Median Population Age in Rocky Boy s Agency is 53.6 Years.
What is the Average Family Size in Rocky Boy s Agency
Average Family Size in Rocky Boy s Agency is 3.4 People.
What is the Average Household Size in Rocky Boy s Agency
Average Household Size in Rocky Boy s Agency is 1.8 People.
How Large is the Labor Force in Rocky Boy s Agency?
There are 114 People in the Labor Forcein in Rocky Boy s Agency.
What is the Percentage of People in the Labor Force in Rocky Boy s Agency?
64.0% of People are in the Labor Force in Rocky Boy s Agency.