Central City, CO Map & Demographics
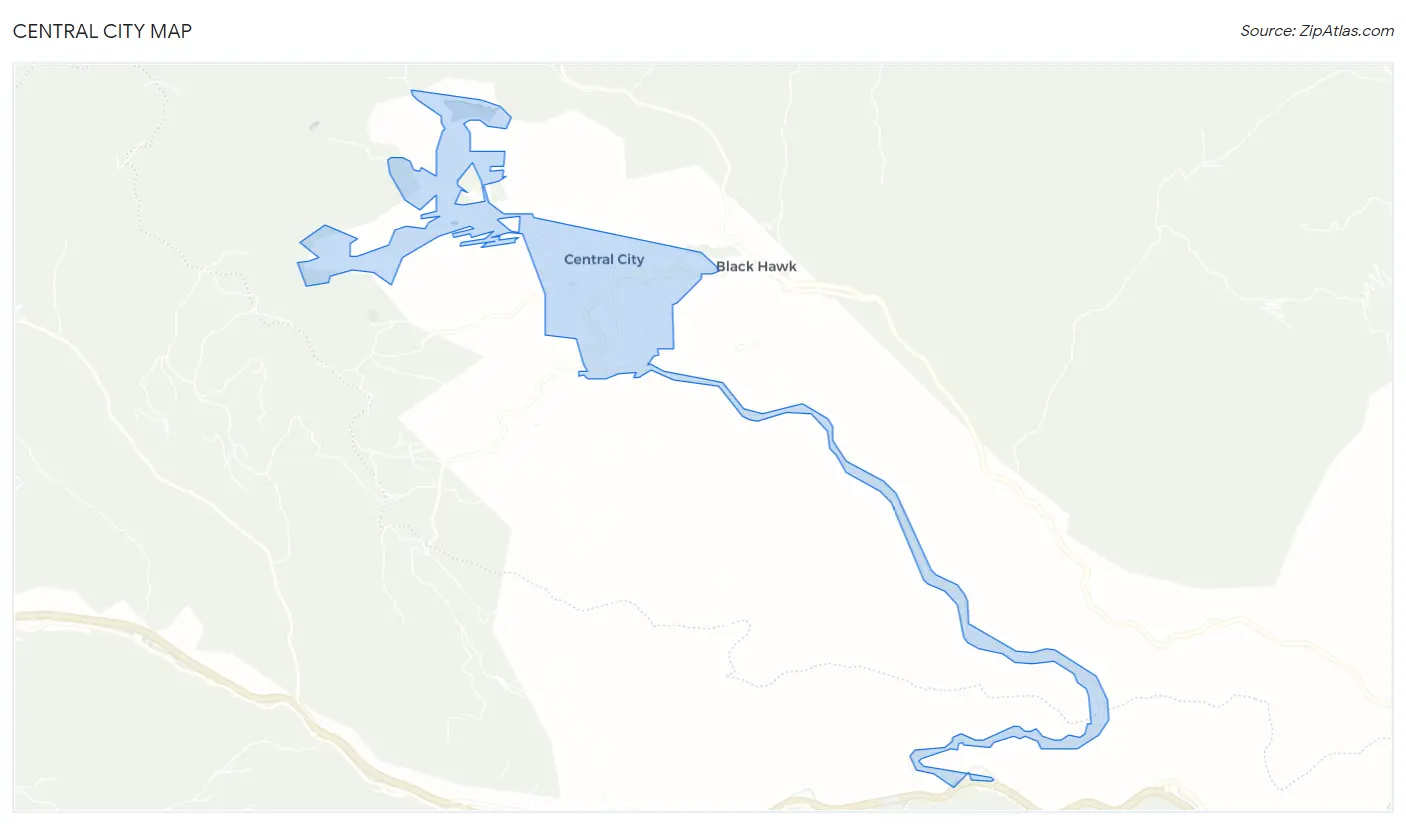
Central City Map
Central City Overview
$46,847
PER CAPITA INCOME
$81,364
AVG FAMILY INCOME
$58,388
AVG HOUSEHOLD INCOME
0.45
INEQUALITY / GINI INDEX
655
TOTAL POPULATION
341
MALE POPULATION
314
FEMALE POPULATION
108.60
MALES / 100 FEMALES
92.08
FEMALES / 100 MALES
43.5
MEDIAN AGE
2.6
AVG FAMILY SIZE
1.8
AVG HOUSEHOLD SIZE
453
LABOR FORCE [ PEOPLE ]
77.2%
PERCENT IN LABOR FORCE
4.0%
UNEMPLOYMENT RATE
Central City Zip Codes
Central City Area Codes
Income in Central City
Income Overview in Central City
Per Capita Income in Central City is $46,847, while median incomes of families and households are $81,364 and $58,388 respectively.
| Characteristic | Number | Measure |
| Per Capita Income | 655 | $46,847 |
| Median Family Income | 126 | $81,364 |
| Mean Family Income | 126 | $92,700 |
| Median Household Income | 365 | $58,388 |
| Mean Household Income | 365 | $79,562 |
| Income Deficit | 126 | $0 |
| Wage / Income Gap (%) | 655 | 0.00% |
| Wage / Income Gap ($) | 655 | 100.00¢ per $1 |
| Gini / Inequality Index | 655 | 0.45 |
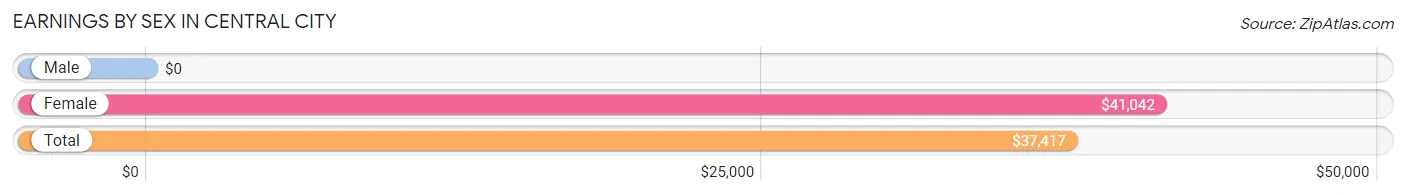
Earnings by Sex in Central City
| Sex | Number | Average Earnings |
| Male | 215 (48.3%) | $0 |
| Female | 230 (51.7%) | $41,042 |
| Total | 445 (100.0%) | $37,417 |
Earnings by Sex by Income Bracket in Central City
The most common earnings brackets in Central City are $75,000 to $99,999 for men (42 | 19.5%) and $55,000 to $64,999 for women (50 | 21.7%).
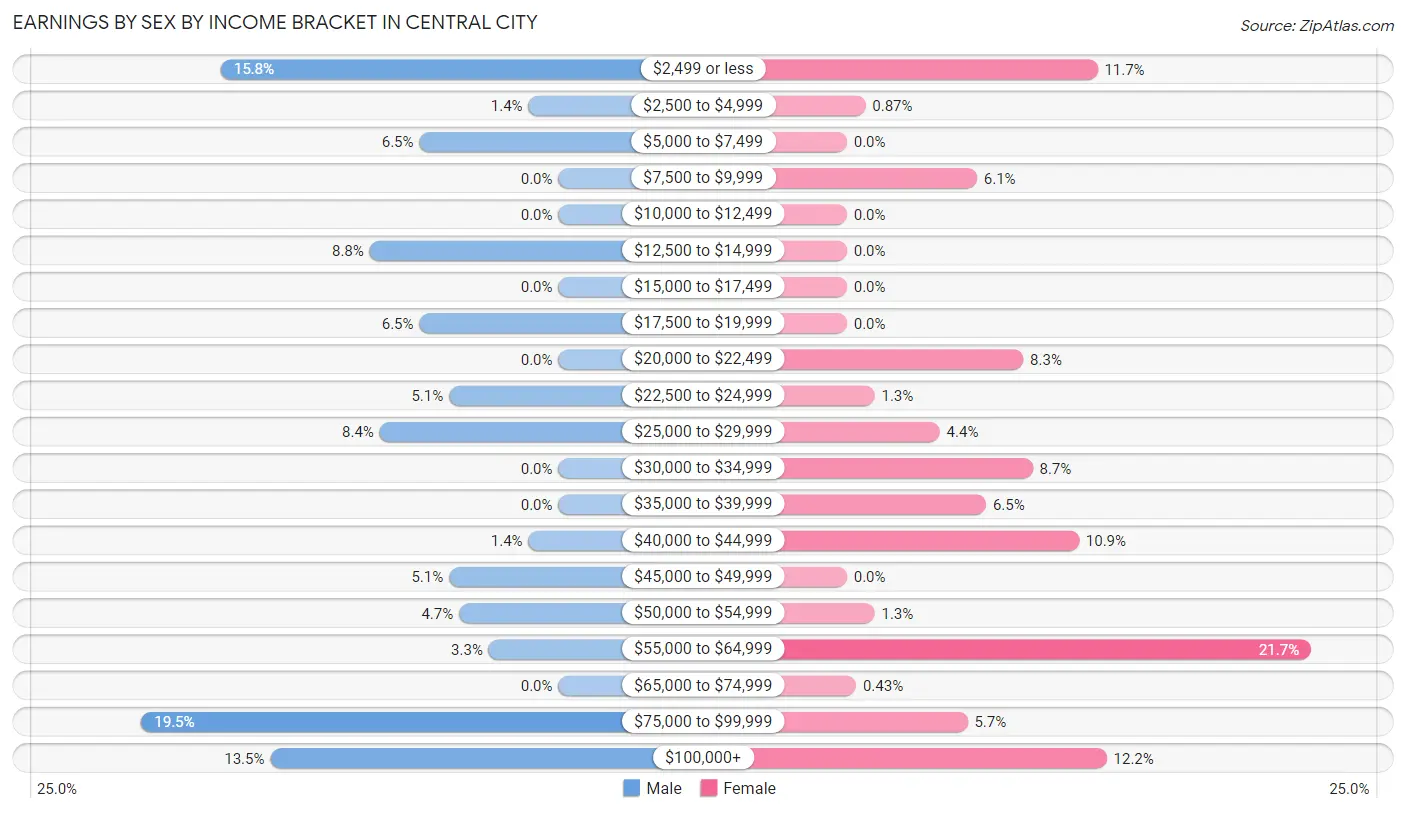
| Income | Male | Female |
| $2,499 or less | 34 (15.8%) | 27 (11.7%) |
| $2,500 to $4,999 | 3 (1.4%) | 2 (0.9%) |
| $5,000 to $7,499 | 14 (6.5%) | 0 (0.0%) |
| $7,500 to $9,999 | 0 (0.0%) | 14 (6.1%) |
| $10,000 to $12,499 | 0 (0.0%) | 0 (0.0%) |
| $12,500 to $14,999 | 19 (8.8%) | 0 (0.0%) |
| $15,000 to $17,499 | 0 (0.0%) | 0 (0.0%) |
| $17,500 to $19,999 | 14 (6.5%) | 0 (0.0%) |
| $20,000 to $22,499 | 0 (0.0%) | 19 (8.3%) |
| $22,500 to $24,999 | 11 (5.1%) | 3 (1.3%) |
| $25,000 to $29,999 | 18 (8.4%) | 10 (4.3%) |
| $30,000 to $34,999 | 0 (0.0%) | 20 (8.7%) |
| $35,000 to $39,999 | 0 (0.0%) | 15 (6.5%) |
| $40,000 to $44,999 | 3 (1.4%) | 25 (10.9%) |
| $45,000 to $49,999 | 11 (5.1%) | 0 (0.0%) |
| $50,000 to $54,999 | 10 (4.6%) | 3 (1.3%) |
| $55,000 to $64,999 | 7 (3.3%) | 50 (21.7%) |
| $65,000 to $74,999 | 0 (0.0%) | 1 (0.4%) |
| $75,000 to $99,999 | 42 (19.5%) | 13 (5.7%) |
| $100,000+ | 29 (13.5%) | 28 (12.2%) |
| Total | 215 (100.0%) | 230 (100.0%) |
Earnings by Sex by Educational Attainment in Central City
Average earnings in Central City are $53,375 for men and $43,750 for women, a difference of 18.0%. Men with an educational attainment of college or associate's degree enjoy the highest average annual earnings of $60,714, while those with college or associate's degree education earn the least with $60,714. Women with an educational attainment of high school diploma earn the most with the average annual earnings of $60,673, while those with college or associate's degree education have the smallest earnings of $55,347.
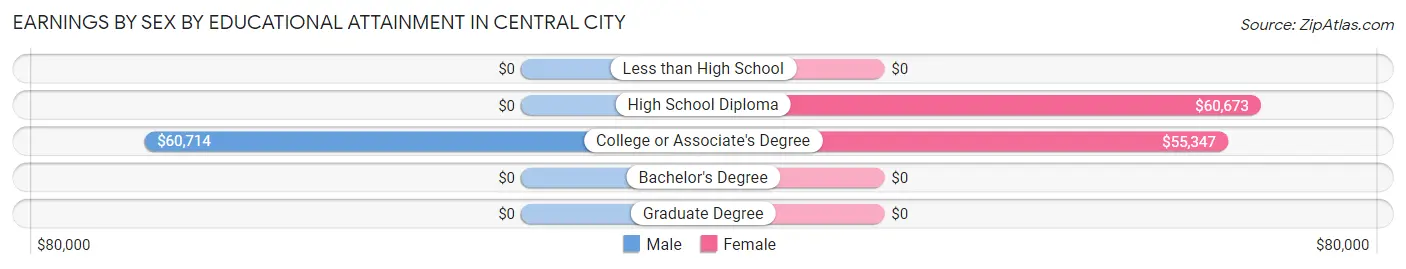
| Educational Attainment | Male Income | Female Income |
| Less than High School | - | - |
| High School Diploma | - | - |
| College or Associate's Degree | $60,714 | $55,347 |
| Bachelor's Degree | - | - |
| Graduate Degree | - | - |
| Total | $53,375 | $43,750 |
Family Income in Central City
Family Income Brackets in Central City
According to the Central City family income data, there are 28 families falling into the $25,000 to $34,999 income range, which is the most common income bracket and makes up 22.2% of all families.
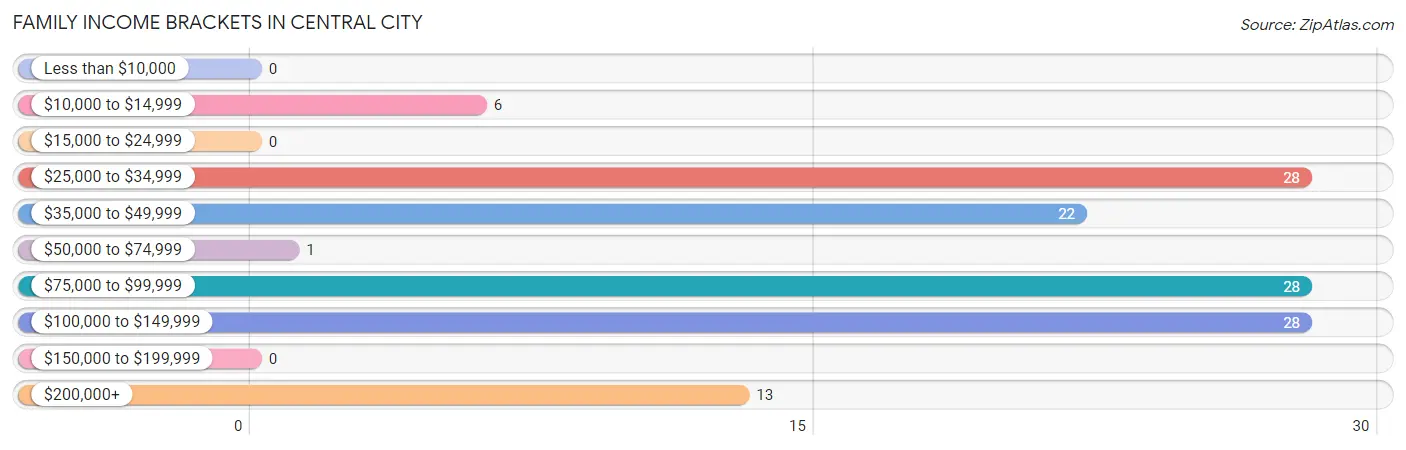
| Income Bracket | # Families | % Families |
| Less than $10,000 | 0 | 0.0% |
| $10,000 to $14,999 | 6 | 4.8% |
| $15,000 to $24,999 | 0 | 0.0% |
| $25,000 to $34,999 | 28 | 22.2% |
| $35,000 to $49,999 | 22 | 17.5% |
| $50,000 to $74,999 | 1 | 0.8% |
| $75,000 to $99,999 | 28 | 22.2% |
| $100,000 to $149,999 | 28 | 22.2% |
| $150,000 to $199,999 | 0 | 0.0% |
| $200,000+ | 13 | 10.3% |
Family Income by Famaliy Size in Central City
2-person families (87 | 69.1%) account for the highest median family income in Central City with $92,614 per family, while 2-person families (87 | 69.1%) have the highest median income of $46,307 per family member.
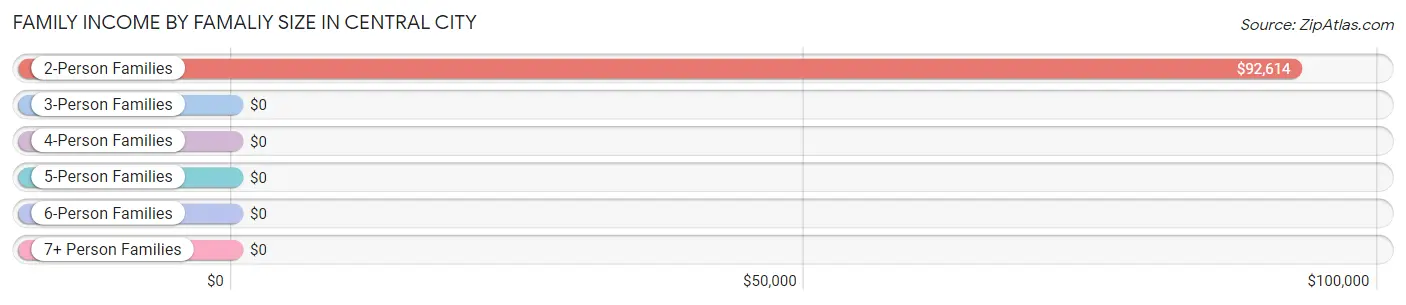
| Income Bracket | # Families | Median Income |
| 2-Person Families | 87 (69.1%) | $92,614 |
| 3-Person Families | 39 (30.9%) | $0 |
| 4-Person Families | 0 (0.0%) | $0 |
| 5-Person Families | 0 (0.0%) | $0 |
| 6-Person Families | 0 (0.0%) | $0 |
| 7+ Person Families | 0 (0.0%) | $0 |
| Total | 126 (100.0%) | $81,364 |
Family Income by Number of Earners in Central City
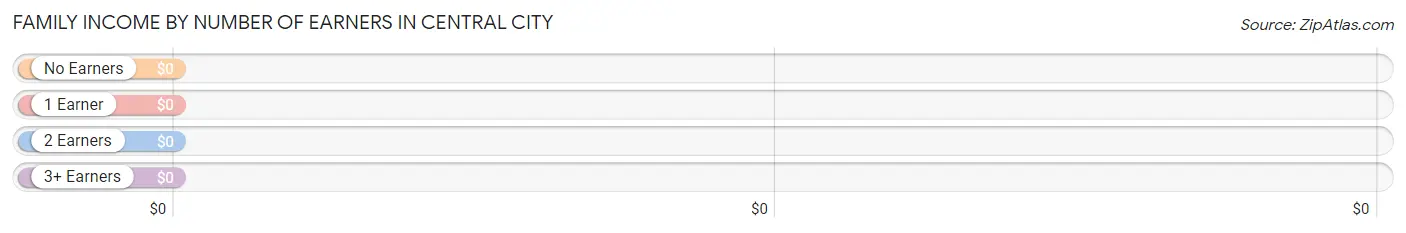
| Number of Earners | # Families | Median Income |
| No Earners | 16 (12.7%) | $0 |
| 1 Earner | 67 (53.2%) | $0 |
| 2 Earners | 31 (24.6%) | $0 |
| 3+ Earners | 12 (9.5%) | $0 |
| Total | 126 (100.0%) | $81,364 |
Household Income in Central City
Household Income Brackets in Central City
With 73 households falling in the category, the $50,000 to $74,999 income range is the most frequent in Central City, accounting for 20.0% of all households.
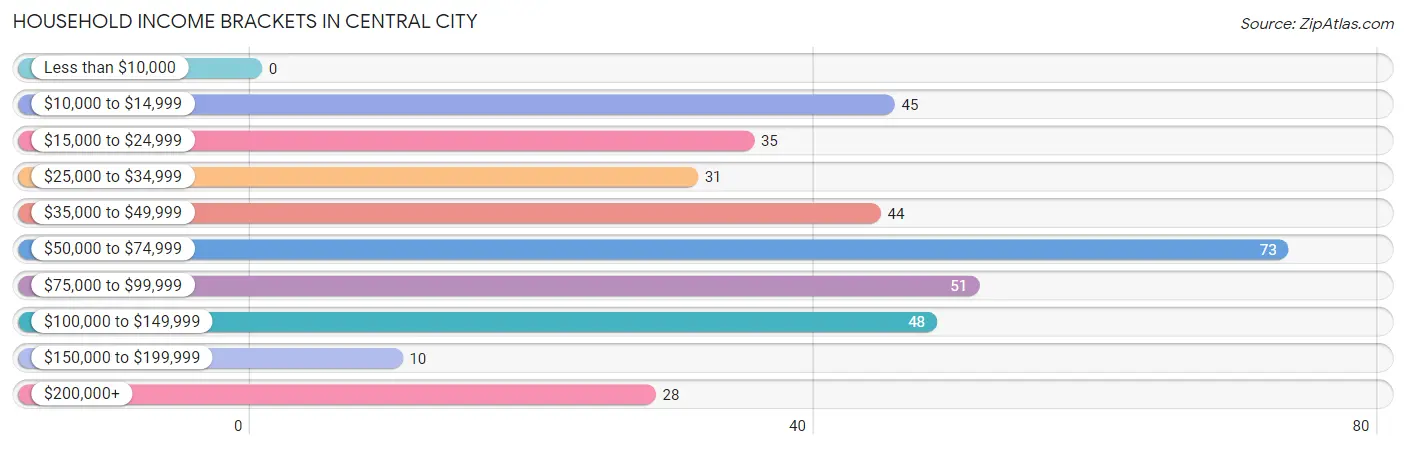
| Income Bracket | # Households | % Households |
| Less than $10,000 | 0 | 0.0% |
| $10,000 to $14,999 | 45 | 12.3% |
| $15,000 to $24,999 | 35 | 9.6% |
| $25,000 to $34,999 | 31 | 8.5% |
| $35,000 to $49,999 | 44 | 12.1% |
| $50,000 to $74,999 | 73 | 20.0% |
| $75,000 to $99,999 | 51 | 14.0% |
| $100,000 to $149,999 | 48 | 13.2% |
| $150,000 to $199,999 | 10 | 2.7% |
| $200,000+ | 28 | 7.7% |
Household Income by Householder Age in Central City
The median household income in Central City is $58,388, with the highest median household income of $61,806 found in the 25 to 44 years age bracket for the primary householder. A total of 152 households (41.6%) fall into this category.
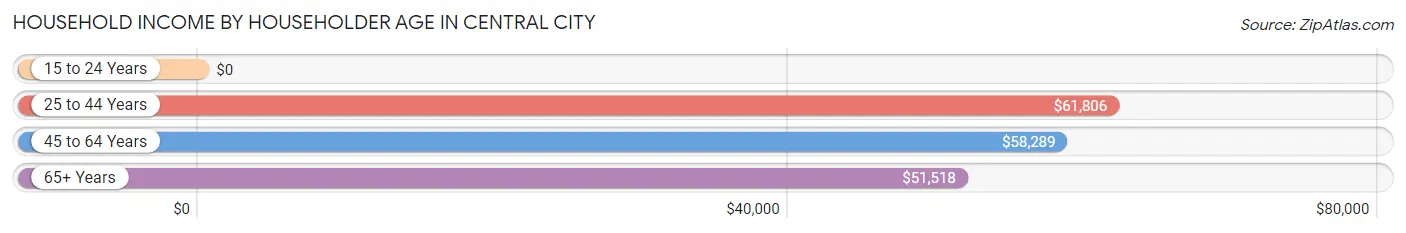
| Income Bracket | # Households | Median Income |
| 15 to 24 Years | 0 (0.0%) | $0 |
| 25 to 44 Years | 152 (41.6%) | $61,806 |
| 45 to 64 Years | 132 (36.2%) | $58,289 |
| 65+ Years | 81 (22.2%) | $51,518 |
| Total | 365 (100.0%) | $58,388 |
Poverty in Central City
Income Below Poverty by Sex and Age in Central City
With 15.8% poverty level for males and 3.8% for females among the residents of Central City, 25 to 34 year old males and 45 to 54 year old females are the most vulnerable to poverty, with 21 males (53.8%) and 8 females (21.0%) in their respective age groups living below the poverty level.
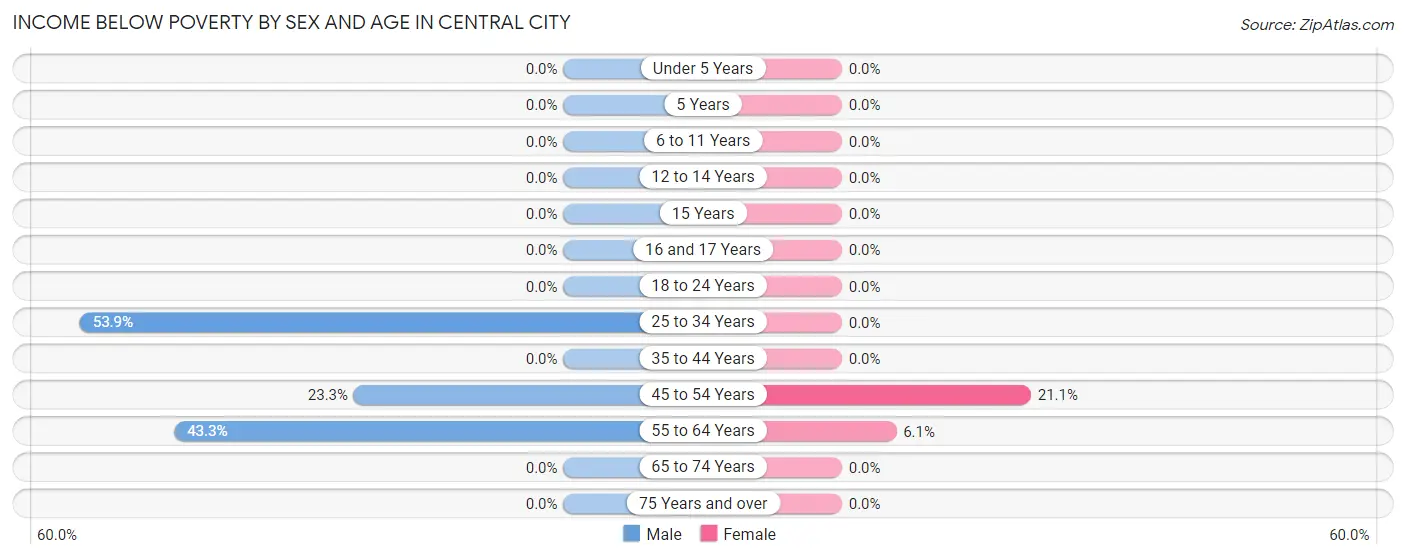
| Age Bracket | Male | Female |
| Under 5 Years | 0 (0.0%) | 0 (0.0%) |
| 5 Years | 0 (0.0%) | 0 (0.0%) |
| 6 to 11 Years | 0 (0.0%) | 0 (0.0%) |
| 12 to 14 Years | 0 (0.0%) | 0 (0.0%) |
| 15 Years | 0 (0.0%) | 0 (0.0%) |
| 16 and 17 Years | 0 (0.0%) | 0 (0.0%) |
| 18 to 24 Years | 0 (0.0%) | 0 (0.0%) |
| 25 to 34 Years | 21 (53.8%) | 0 (0.0%) |
| 35 to 44 Years | 0 (0.0%) | 0 (0.0%) |
| 45 to 54 Years | 7 (23.3%) | 8 (21.0%) |
| 55 to 64 Years | 26 (43.3%) | 4 (6.1%) |
| 65 to 74 Years | 0 (0.0%) | 0 (0.0%) |
| 75 Years and over | 0 (0.0%) | 0 (0.0%) |
| Total | 54 (15.8%) | 12 (3.8%) |
Income Above Poverty by Sex and Age in Central City
According to the poverty statistics in Central City, males aged 6 to 11 years and females aged 12 to 14 years are the age groups that are most secure financially, with 100.0% of males and 100.0% of females in these age groups living above the poverty line.
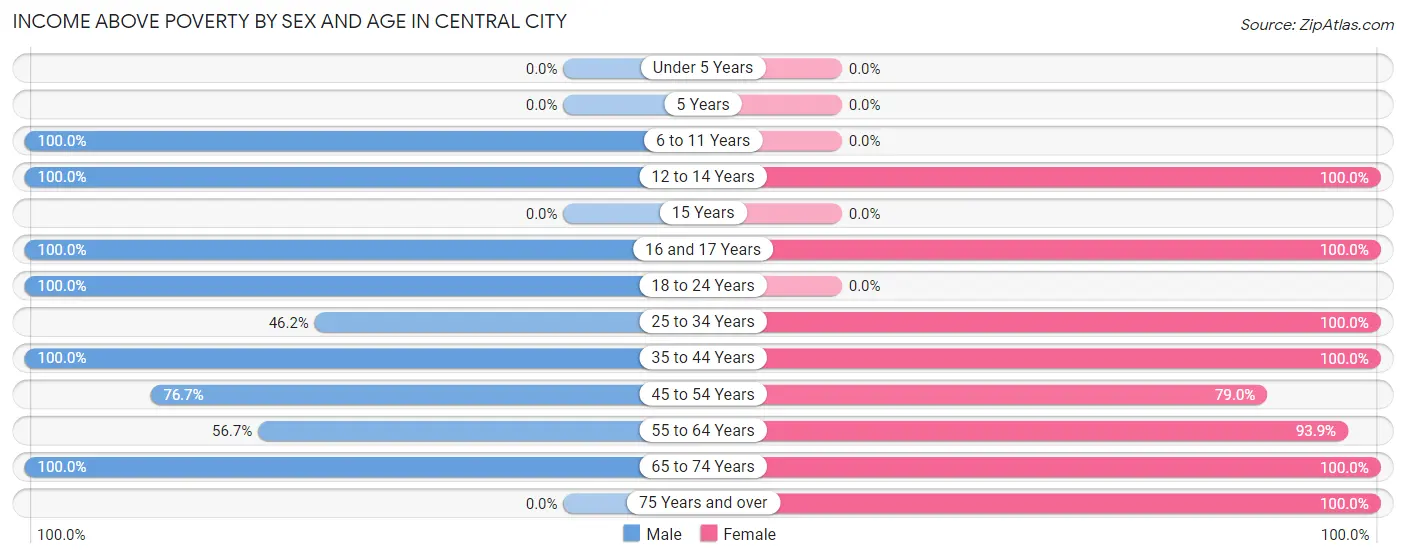
| Age Bracket | Male | Female |
| Under 5 Years | 0 (0.0%) | 0 (0.0%) |
| 5 Years | 0 (0.0%) | 0 (0.0%) |
| 6 to 11 Years | 32 (100.0%) | 0 (0.0%) |
| 12 to 14 Years | 27 (100.0%) | 9 (100.0%) |
| 15 Years | 0 (0.0%) | 0 (0.0%) |
| 16 and 17 Years | 14 (100.0%) | 38 (100.0%) |
| 18 to 24 Years | 32 (100.0%) | 0 (0.0%) |
| 25 to 34 Years | 18 (46.2%) | 53 (100.0%) |
| 35 to 44 Years | 72 (100.0%) | 49 (100.0%) |
| 45 to 54 Years | 23 (76.7%) | 30 (78.9%) |
| 55 to 64 Years | 34 (56.7%) | 62 (93.9%) |
| 65 to 74 Years | 35 (100.0%) | 27 (100.0%) |
| 75 Years and over | 0 (0.0%) | 34 (100.0%) |
| Total | 287 (84.2%) | 302 (96.2%) |
Income Below Poverty Among Married-Couple Families in Central City
The poverty statistics for married-couple families in Central City show that 11.8% or 6 of the total 51 families live below the poverty line. Families with no children have the highest poverty rate of 11.8%, comprising of 6 families. On the other hand, families with no children have the lowest poverty rate of 11.8%, which includes 6 families.
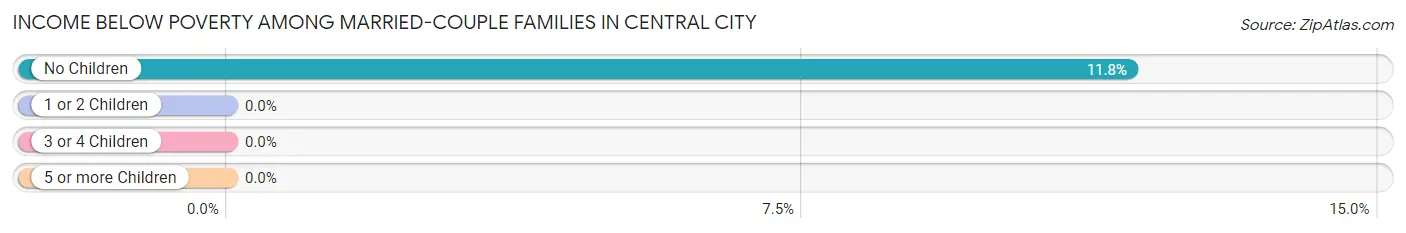
| Children | Above Poverty | Below Poverty |
| No Children | 45 (88.2%) | 6 (11.8%) |
| 1 or 2 Children | 0 (0.0%) | 0 (0.0%) |
| 3 or 4 Children | 0 (0.0%) | 0 (0.0%) |
| 5 or more Children | 0 (0.0%) | 0 (0.0%) |
| Total | 45 (88.2%) | 6 (11.8%) |
Income Below Poverty Among Single-Parent Households in Central City
| Children | Single Father | Single Mother |
| No Children | 0 (0.0%) | 0 (0.0%) |
| 1 or 2 Children | 0 (0.0%) | 0 (0.0%) |
| 3 or 4 Children | 0 (0.0%) | 0 (0.0%) |
| 5 or more Children | 0 (0.0%) | 0 (0.0%) |
| Total | 0 (0.0%) | 0 (0.0%) |
Income Below Poverty Among Married-Couple vs Single-Parent Households in Central City
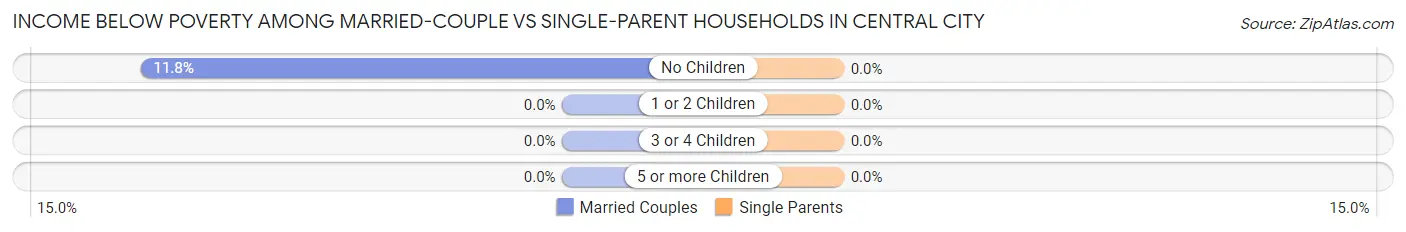
| Children | Married-Couple Families | Single-Parent Households |
| No Children | 6 (11.8%) | 0 (0.0%) |
| 1 or 2 Children | 0 (0.0%) | 0 (0.0%) |
| 3 or 4 Children | 0 (0.0%) | 0 (0.0%) |
| 5 or more Children | 0 (0.0%) | 0 (0.0%) |
| Total | 6 (11.8%) | 0 (0.0%) |
Race in Central City
The most populous races in Central City are White / Caucasian (541 | 82.6%), Hispanic or Latino (195 | 29.8%), and Two or more Races (96 | 14.7%).
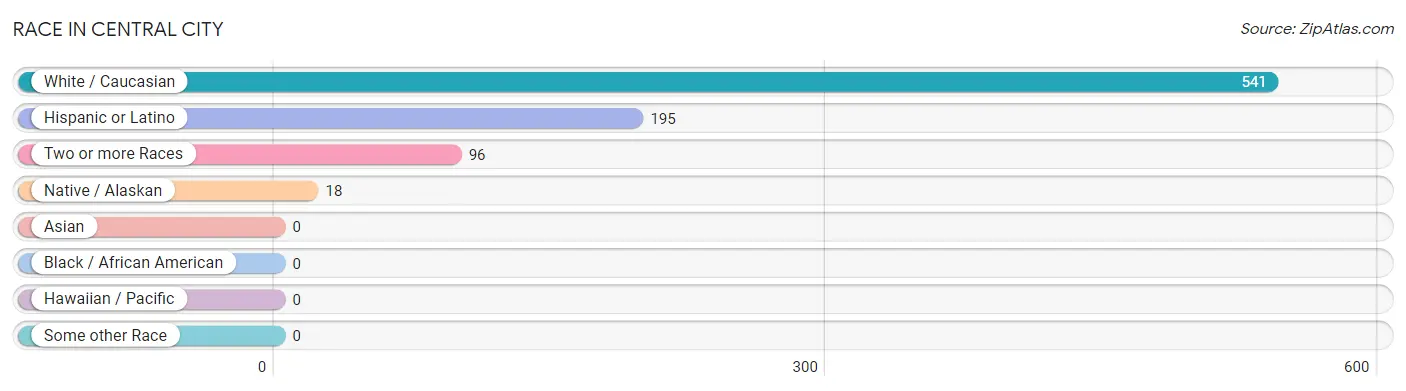
| Race | # Population | % Population |
| Asian | 0 | 0.0% |
| Black / African American | 0 | 0.0% |
| Hawaiian / Pacific | 0 | 0.0% |
| Hispanic or Latino | 195 | 29.8% |
| Native / Alaskan | 18 | 2.8% |
| White / Caucasian | 541 | 82.6% |
| Two or more Races | 96 | 14.7% |
| Some other Race | 0 | 0.0% |
| Total | 655 | 100.0% |
Ancestry in Central City
The most populous ancestries reported in Central City are Mexican (195 | 29.8%), English (136 | 20.8%), German (109 | 16.6%), Irish (98 | 15.0%), and Italian (82 | 12.5%), together accounting for 94.7% of all Central City residents.
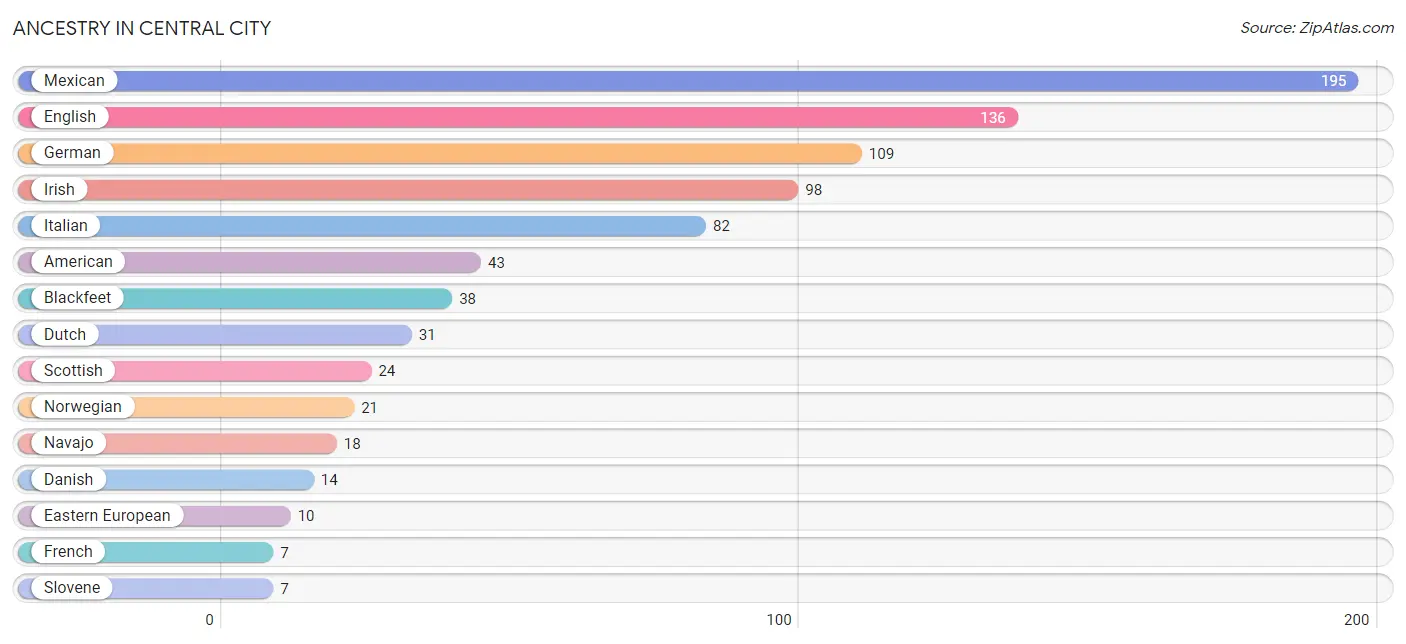
| Ancestry | # Population | % Population |
| American | 43 | 6.6% |
| Blackfeet | 38 | 5.8% |
| Czechoslovakian | 3 | 0.5% |
| Danish | 14 | 2.1% |
| Dutch | 31 | 4.7% |
| Eastern European | 10 | 1.5% |
| English | 136 | 20.8% |
| French | 7 | 1.1% |
| German | 109 | 16.6% |
| Irish | 98 | 15.0% |
| Italian | 82 | 12.5% |
| Mexican | 195 | 29.8% |
| Navajo | 18 | 2.8% |
| Norwegian | 21 | 3.2% |
| Romanian | 3 | 0.5% |
| Scottish | 24 | 3.7% |
| Slovene | 7 | 1.1% | View All 17 Rows |
Immigrants in Central City
The most numerous immigrant groups reported in Central City came from Africa (19 | 2.9%), and South Africa (19 | 2.9%), together accounting for 5.8% of all Central City residents.
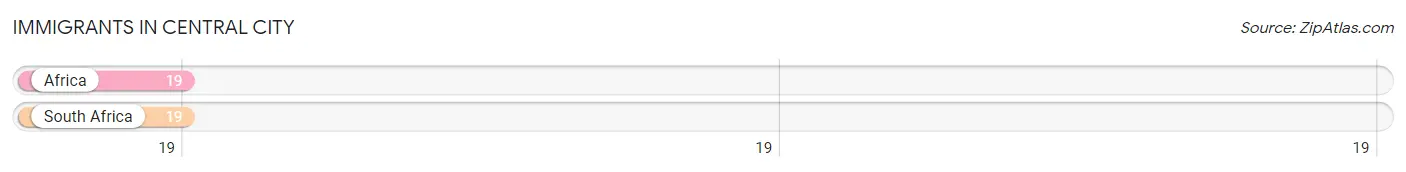
| Immigration Origin | # Population | % Population |
| Africa | 19 | 2.9% |
| South Africa | 19 | 2.9% | View All 2 Rows |
Sex and Age in Central City
Sex and Age in Central City
The most populous age groups in Central City are 10 to 14 Years (48 | 14.1%) for men and 40 to 44 Years (49 | 15.6%) for women.
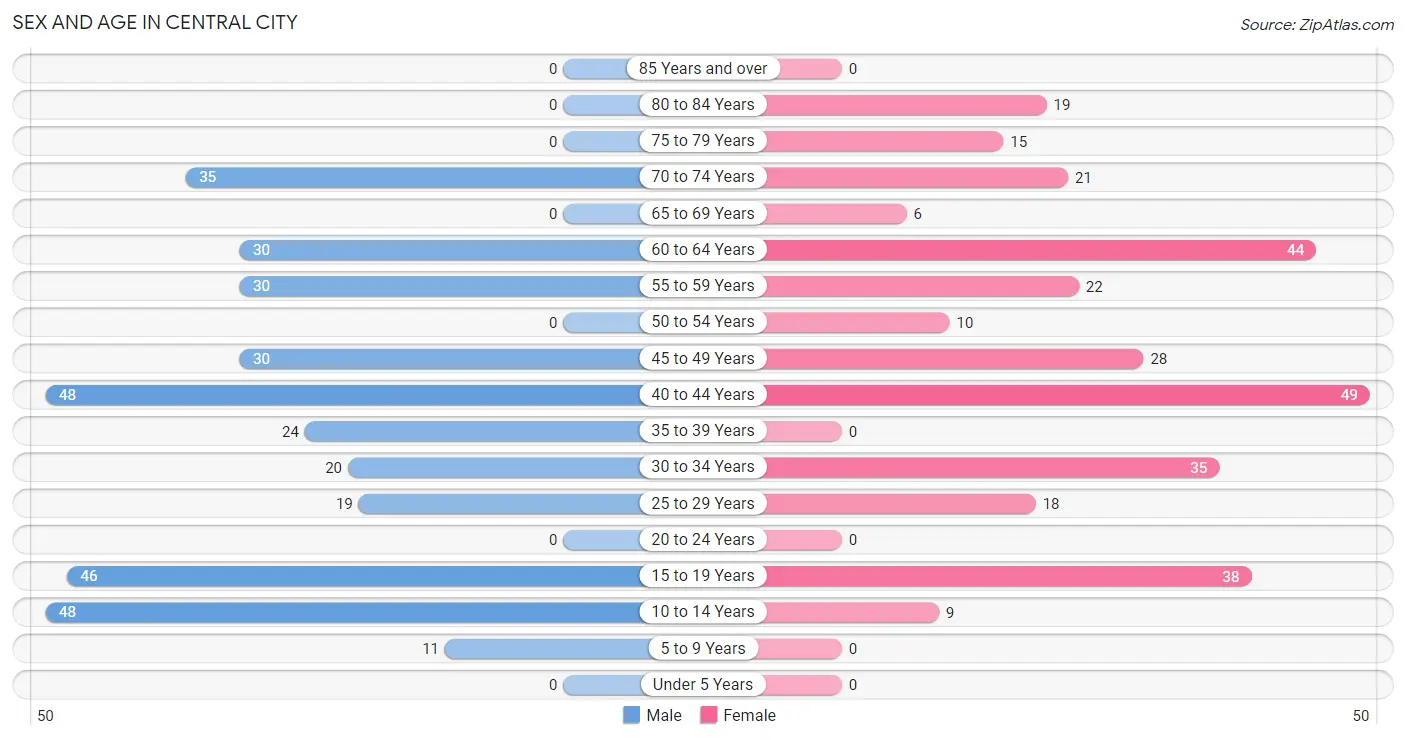
| Age Bracket | Male | Female |
| Under 5 Years | 0 (0.0%) | 0 (0.0%) |
| 5 to 9 Years | 11 (3.2%) | 0 (0.0%) |
| 10 to 14 Years | 48 (14.1%) | 9 (2.9%) |
| 15 to 19 Years | 46 (13.5%) | 38 (12.1%) |
| 20 to 24 Years | 0 (0.0%) | 0 (0.0%) |
| 25 to 29 Years | 19 (5.6%) | 18 (5.7%) |
| 30 to 34 Years | 20 (5.9%) | 35 (11.2%) |
| 35 to 39 Years | 24 (7.0%) | 0 (0.0%) |
| 40 to 44 Years | 48 (14.1%) | 49 (15.6%) |
| 45 to 49 Years | 30 (8.8%) | 28 (8.9%) |
| 50 to 54 Years | 0 (0.0%) | 10 (3.2%) |
| 55 to 59 Years | 30 (8.8%) | 22 (7.0%) |
| 60 to 64 Years | 30 (8.8%) | 44 (14.0%) |
| 65 to 69 Years | 0 (0.0%) | 6 (1.9%) |
| 70 to 74 Years | 35 (10.3%) | 21 (6.7%) |
| 75 to 79 Years | 0 (0.0%) | 15 (4.8%) |
| 80 to 84 Years | 0 (0.0%) | 19 (6.0%) |
| 85 Years and over | 0 (0.0%) | 0 (0.0%) |
| Total | 341 (100.0%) | 314 (100.0%) |
Families and Households in Central City
Median Family Size in Central City
The median family size in Central City is 2.63 persons per family, with single female/mother families (44 | 34.9%) accounting for the largest median family size of 3.34 persons per family. On the other hand, married-couple families (51 | 40.5%) represent the smallest median family size with 2.06 persons per family.
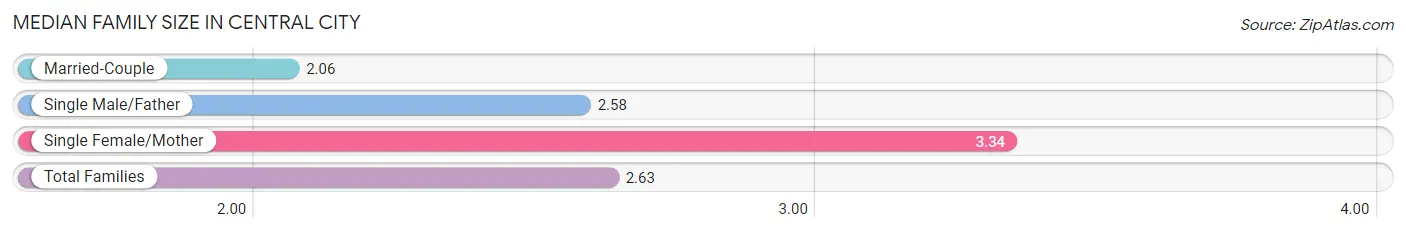
| Family Type | # Families | Family Size |
| Married-Couple | 51 (40.5%) | 2.06 |
| Single Male/Father | 31 (24.6%) | 2.58 |
| Single Female/Mother | 44 (34.9%) | 3.34 |
| Total Families | 126 (100.0%) | 2.63 |
Median Household Size in Central City
The median household size in Central City is 1.79 persons per household, with single female/mother households (44 | 12.0%) accounting for the largest median household size of 3.34 persons per household. non-family households (239 | 65.5%) represent the smallest median household size with 1.27 persons per household.
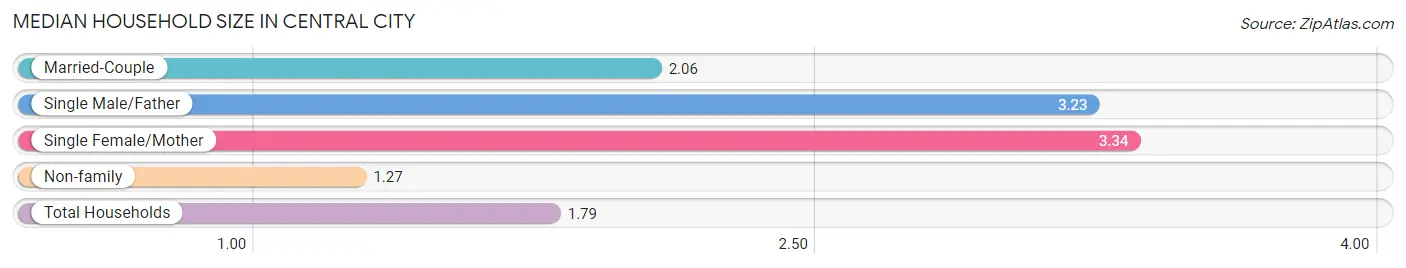
| Household Type | # Households | Household Size |
| Married-Couple | 51 (14.0%) | 2.06 |
| Single Male/Father | 31 (8.5%) | 3.23 |
| Single Female/Mother | 44 (12.0%) | 3.34 |
| Non-family | 239 (65.5%) | 1.27 |
| Total Households | 365 (100.0%) | 1.79 |
Household Size by Marriage Status in Central City
Out of a total of 365 households in Central City, 126 (34.5%) are family households, while 239 (65.5%) are nonfamily households. The most numerous type of family households are 2-person households, comprising 74, and the most common type of nonfamily households are 1-person households, comprising 181.
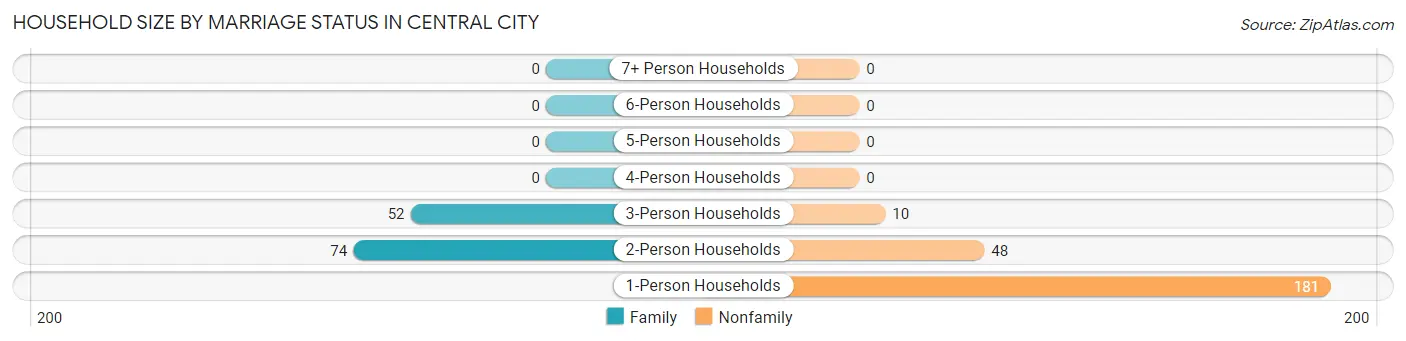
| Household Size | Family Households | Nonfamily Households |
| 1-Person Households | - | 181 (49.6%) |
| 2-Person Households | 74 (20.3%) | 48 (13.2%) |
| 3-Person Households | 52 (14.2%) | 10 (2.7%) |
| 4-Person Households | 0 (0.0%) | 0 (0.0%) |
| 5-Person Households | 0 (0.0%) | 0 (0.0%) |
| 6-Person Households | 0 (0.0%) | 0 (0.0%) |
| 7+ Person Households | 0 (0.0%) | 0 (0.0%) |
| Total | 126 (34.5%) | 239 (65.5%) |
Female Fertility in Central City
Fertility by Age in Central City
| Age Bracket | Women with Births | Births / 1,000 Women |
| 15 to 19 years | 0 (0.0%) | 0.0 |
| 20 to 34 years | 0 (0.0%) | 0.0 |
| 35 to 50 years | 0 (0.0%) | 0.0 |
| Total | 0 (0.0%) | 0.0 |
Fertility by Age by Marriage Status in Central City
| Age Bracket | Married | Unmarried |
| 15 to 19 years | 0 (0.0%) | 0 (0.0%) |
| 20 to 34 years | 0 (0.0%) | 0 (0.0%) |
| 35 to 50 years | 0 (0.0%) | 0 (0.0%) |
| Total | 0 (0.0%) | 0 (0.0%) |
Fertility by Education in Central City
| Educational Attainment | Women with Births | Births / 1,000 Women |
| Less than High School | 0 (0.0%) | 0.0 |
| High School Diploma | 0 (0.0%) | 0.0 |
| College or Associate's Degree | 0 (0.0%) | 0.0 |
| Bachelor's Degree | 0 (0.0%) | 0.0 |
| Graduate Degree | 0 (0.0%) | 0.0 |
| Total | 0 (0.0%) | 0.0 |
Fertility by Education by Marriage Status in Central City
| Educational Attainment | Married | Unmarried |
| Less than High School | 0 (0.0%) | 0 (0.0%) |
| High School Diploma | 0 (0.0%) | 0 (0.0%) |
| College or Associate's Degree | 0 (0.0%) | 0 (0.0%) |
| Bachelor's Degree | 0 (0.0%) | 0 (0.0%) |
| Graduate Degree | 0 (0.0%) | 0 (0.0%) |
| Total | 0 (0.0%) | 0 (0.0%) |
Employment Characteristics in Central City
Employment by Class of Employer in Central City
Among the 433 employed individuals in Central City, private company employees (340 | 78.5%), not-for-profit organizations (28 | 6.5%), and local government employees (28 | 6.5%) make up the most common classes of employment.
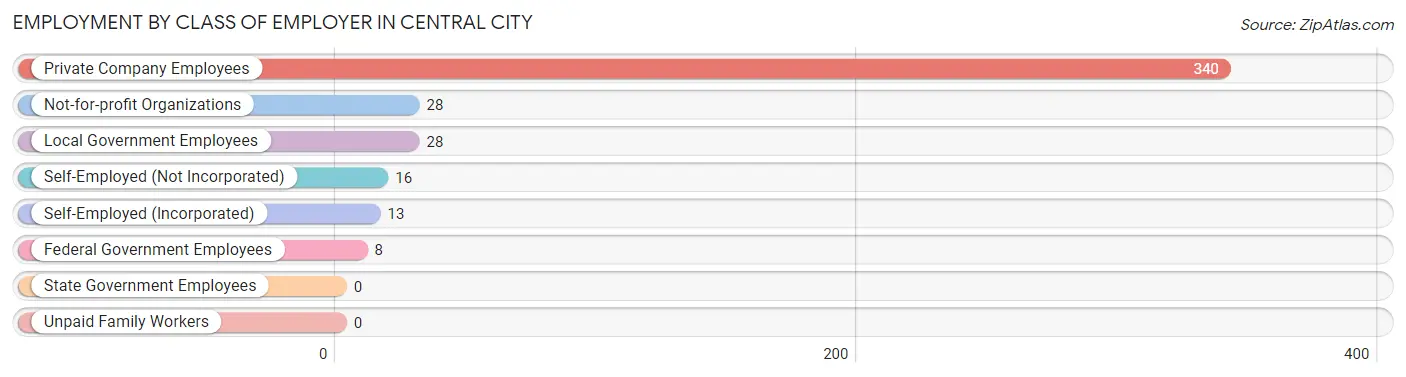
| Employer Class | # Employees | % Employees |
| Private Company Employees | 340 | 78.5% |
| Self-Employed (Incorporated) | 13 | 3.0% |
| Self-Employed (Not Incorporated) | 16 | 3.7% |
| Not-for-profit Organizations | 28 | 6.5% |
| Local Government Employees | 28 | 6.5% |
| State Government Employees | 0 | 0.0% |
| Federal Government Employees | 8 | 1.8% |
| Unpaid Family Workers | 0 | 0.0% |
| Total | 433 | 100.0% |
Employment Status by Age in Central City
According to the labor force statistics for Central City, out of the total population over 16 years of age (587), 77.2% or 453 individuals are in the labor force, with 4.0% or 18 of them unemployed. The age group with the highest labor force participation rate is 25 to 29 years, with 100.0% or 37 individuals in the labor force. Within the labor force, the 55 to 59 years age range has the highest percentage of unemployed individuals, with 17.1% or 6 of them being unemployed.
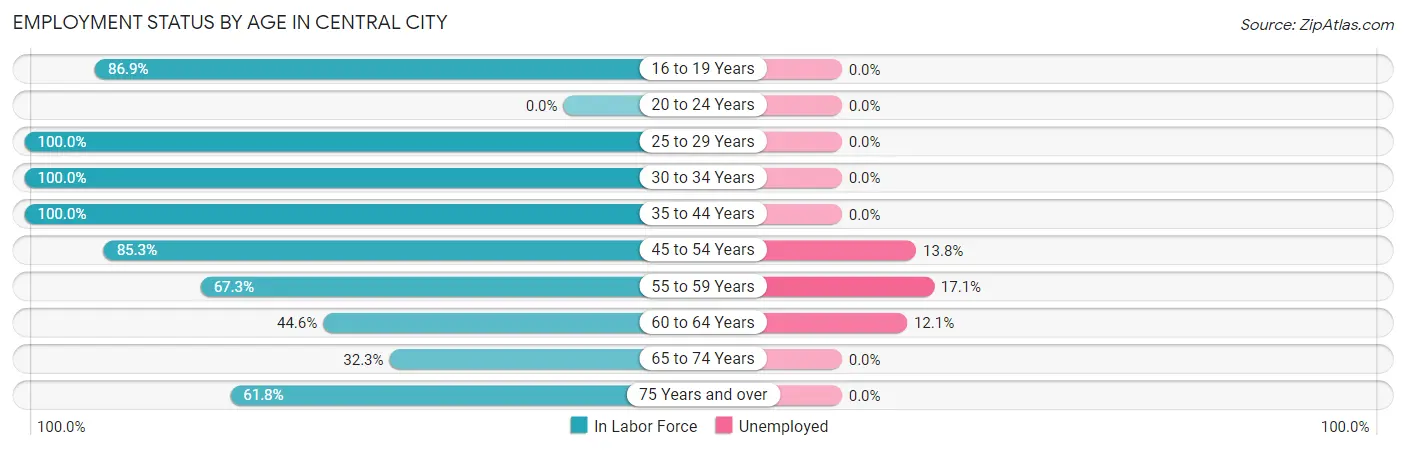
| Age Bracket | In Labor Force | Unemployed |
| 16 to 19 Years | 73 (86.9%) | 0 (0.0%) |
| 20 to 24 Years | 0 (0.0%) | 0 (0.0%) |
| 25 to 29 Years | 37 (100.0%) | 0 (0.0%) |
| 30 to 34 Years | 55 (100.0%) | 0 (0.0%) |
| 35 to 44 Years | 121 (100.0%) | 0 (0.0%) |
| 45 to 54 Years | 58 (85.3%) | 8 (13.8%) |
| 55 to 59 Years | 35 (67.3%) | 6 (17.1%) |
| 60 to 64 Years | 33 (44.6%) | 4 (12.1%) |
| 65 to 74 Years | 20 (32.3%) | 0 (0.0%) |
| 75 Years and over | 21 (61.8%) | 0 (0.0%) |
| Total | 453 (77.2%) | 18 (4.0%) |
Employment Status by Educational Attainment in Central City
According to labor force statistics for Central City, 83.3% of individuals (339) out of the total population between 25 and 64 years of age (407) are in the labor force, with 5.3% or 18 of them being unemployed. The group with the highest labor force participation rate are those with the educational attainment of less than high school, with 100.0% or 33 individuals in the labor force. Within the labor force, individuals with high school diploma education have the highest percentage of unemployment, with 19.6% or 18 of them being unemployed.
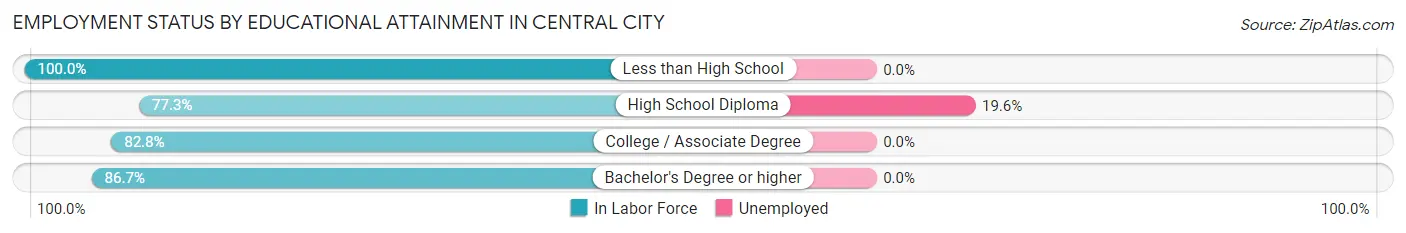
| Educational Attainment | In Labor Force | Unemployed |
| Less than High School | 33 (100.0%) | 0 (0.0%) |
| High School Diploma | 92 (77.3%) | 23 (19.6%) |
| College / Associate Degree | 149 (82.8%) | 0 (0.0%) |
| Bachelor's Degree or higher | 65 (86.7%) | 0 (0.0%) |
| Total | 339 (83.3%) | 22 (5.3%) |
Employment Occupations by Sex in Central City
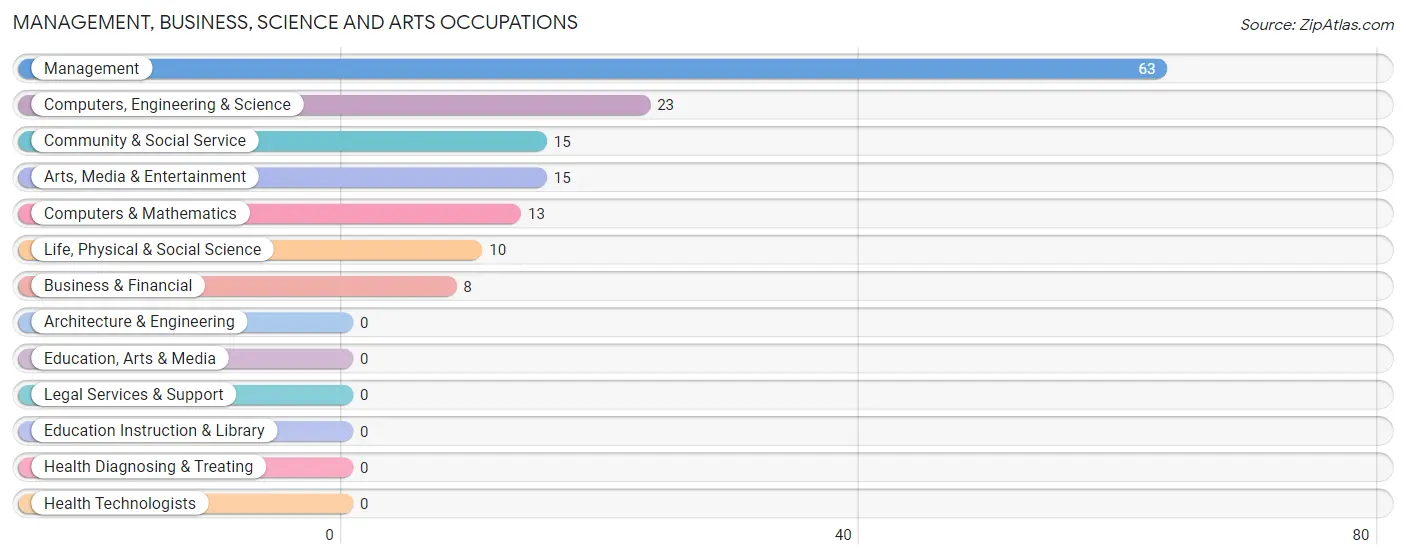
Management, Business, Science and Arts Occupations
The most common Management, Business, Science and Arts occupations in Central City are Management (63 | 14.5%), Computers, Engineering & Science (23 | 5.3%), Community & Social Service (15 | 3.5%), Arts, Media & Entertainment (15 | 3.5%), and Computers & Mathematics (13 | 3.0%).
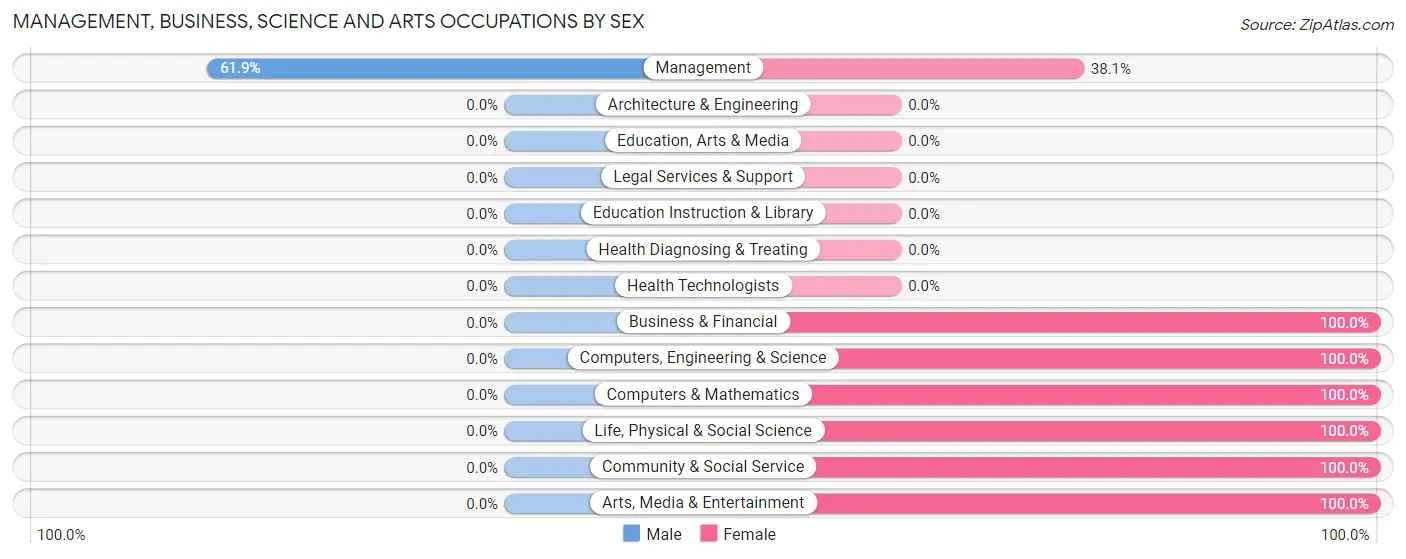
Management, Business, Science and Arts Occupations by Sex
| Occupation | Male | Female |
| Management | 39 (61.9%) | 24 (38.1%) |
| Business & Financial | 0 (0.0%) | 8 (100.0%) |
| Computers, Engineering & Science | 0 (0.0%) | 23 (100.0%) |
| Computers & Mathematics | 0 (0.0%) | 13 (100.0%) |
| Architecture & Engineering | 0 (0.0%) | 0 (0.0%) |
| Life, Physical & Social Science | 0 (0.0%) | 10 (100.0%) |
| Community & Social Service | 0 (0.0%) | 15 (100.0%) |
| Education, Arts & Media | 0 (0.0%) | 0 (0.0%) |
| Legal Services & Support | 0 (0.0%) | 0 (0.0%) |
| Education Instruction & Library | 0 (0.0%) | 0 (0.0%) |
| Arts, Media & Entertainment | 0 (0.0%) | 15 (100.0%) |
| Health Diagnosing & Treating | 0 (0.0%) | 0 (0.0%) |
| Health Technologists | 0 (0.0%) | 0 (0.0%) |
| Total (Category) | 39 (35.8%) | 70 (64.2%) |
| Total (Overall) | 215 (49.4%) | 220 (50.6%) |
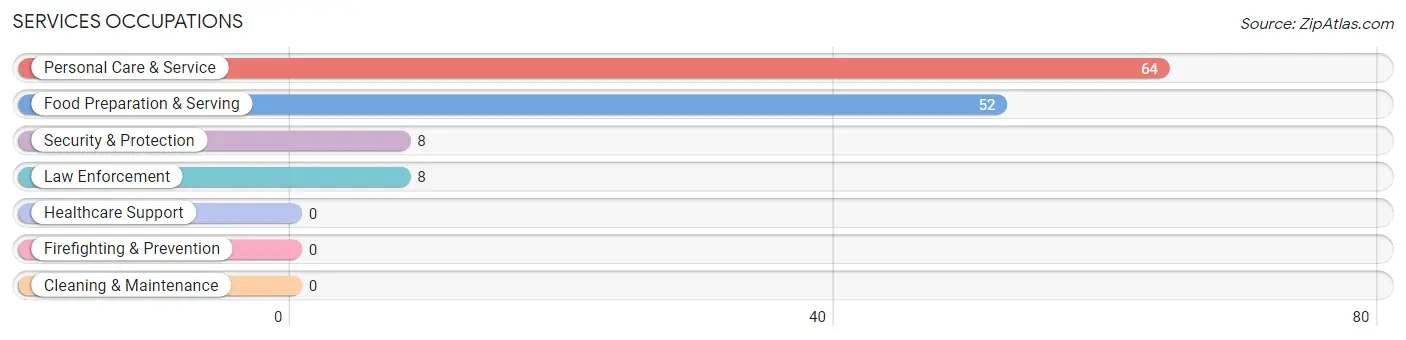
Services Occupations
The most common Services occupations in Central City are Personal Care & Service (64 | 14.7%), Food Preparation & Serving (52 | 11.9%), Security & Protection (8 | 1.8%), and Law Enforcement (8 | 1.8%).
Services Occupations by Sex
Within the Services occupations in Central City, the most male-oriented occupations are Security & Protection (100.0%), Law Enforcement (100.0%), and Personal Care & Service (64.1%), while the most female-oriented occupations are Food Preparation & Serving (48.1%), and Personal Care & Service (35.9%).
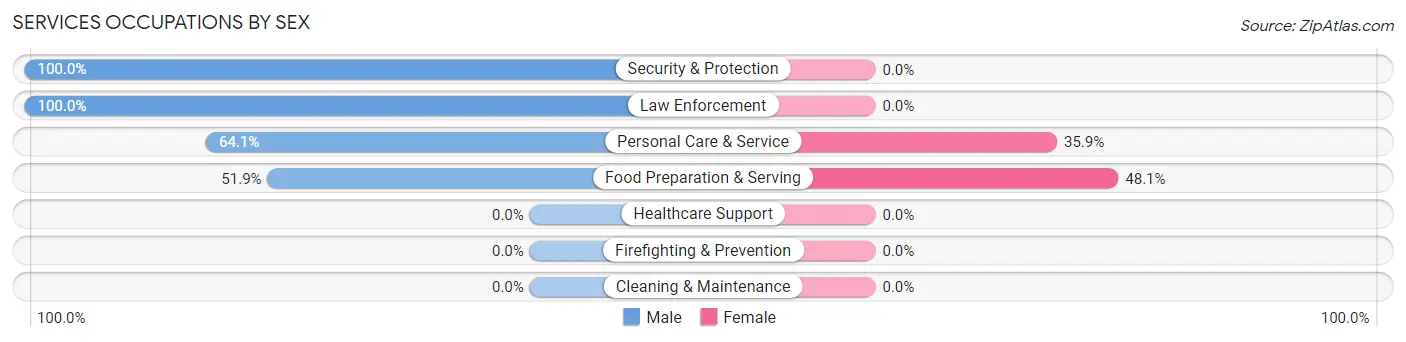
| Occupation | Male | Female |
| Healthcare Support | 0 (0.0%) | 0 (0.0%) |
| Security & Protection | 8 (100.0%) | 0 (0.0%) |
| Firefighting & Prevention | 0 (0.0%) | 0 (0.0%) |
| Law Enforcement | 8 (100.0%) | 0 (0.0%) |
| Food Preparation & Serving | 27 (51.9%) | 25 (48.1%) |
| Cleaning & Maintenance | 0 (0.0%) | 0 (0.0%) |
| Personal Care & Service | 41 (64.1%) | 23 (35.9%) |
| Total (Category) | 76 (61.3%) | 48 (38.7%) |
| Total (Overall) | 215 (49.4%) | 220 (50.6%) |
Sales and Office Occupations
The most common Sales and Office occupations in Central City are Office & Administration (57 | 13.1%), and Sales & Related (40 | 9.2%).

Sales and Office Occupations by Sex

| Occupation | Male | Female |
| Sales & Related | 22 (55.0%) | 18 (45.0%) |
| Office & Administration | 0 (0.0%) | 57 (100.0%) |
| Total (Category) | 22 (22.7%) | 75 (77.3%) |
| Total (Overall) | 215 (49.4%) | 220 (50.6%) |
Natural Resources, Construction and Maintenance Occupations
The most common Natural Resources, Construction and Maintenance occupations in Central City are , and Farming, Fishing & Forestry (7 | 1.6%).

Natural Resources, Construction and Maintenance Occupations by Sex

| Occupation | Male | Female |
| Farming, Fishing & Forestry | 7 (100.0%) | 0 (0.0%) |
| Construction & Extraction | 0 (0.0%) | 0 (0.0%) |
| Installation, Maintenance & Repair | 0 (0.0%) | 0 (0.0%) |
| Total (Category) | 7 (100.0%) | 0 (0.0%) |
| Total (Overall) | 215 (49.4%) | 220 (50.6%) |
Production, Transportation and Moving Occupations
The most common Production, Transportation and Moving occupations in Central City are Production (41 | 9.4%), Transportation (32 | 7.4%), and Material Moving (25 | 5.8%).
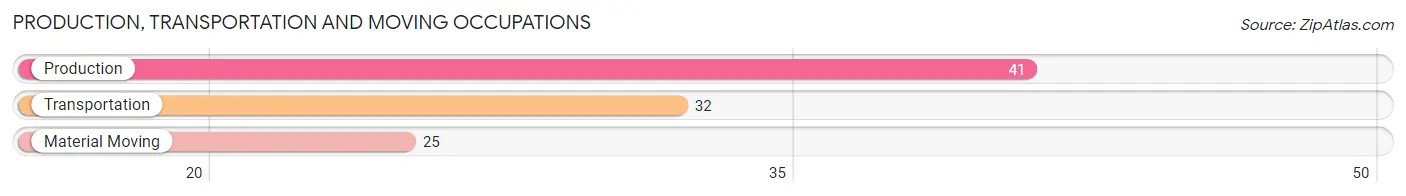
Production, Transportation and Moving Occupations by Sex
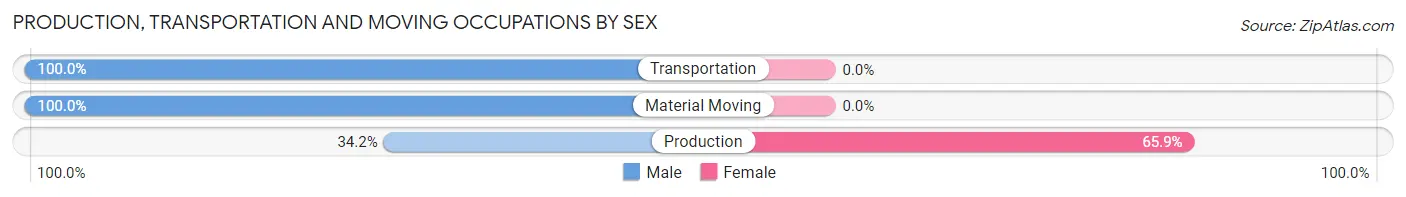
| Occupation | Male | Female |
| Production | 14 (34.2%) | 27 (65.8%) |
| Transportation | 32 (100.0%) | 0 (0.0%) |
| Material Moving | 25 (100.0%) | 0 (0.0%) |
| Total (Category) | 71 (72.5%) | 27 (27.6%) |
| Total (Overall) | 215 (49.4%) | 220 (50.6%) |
Employment Industries by Sex in Central City
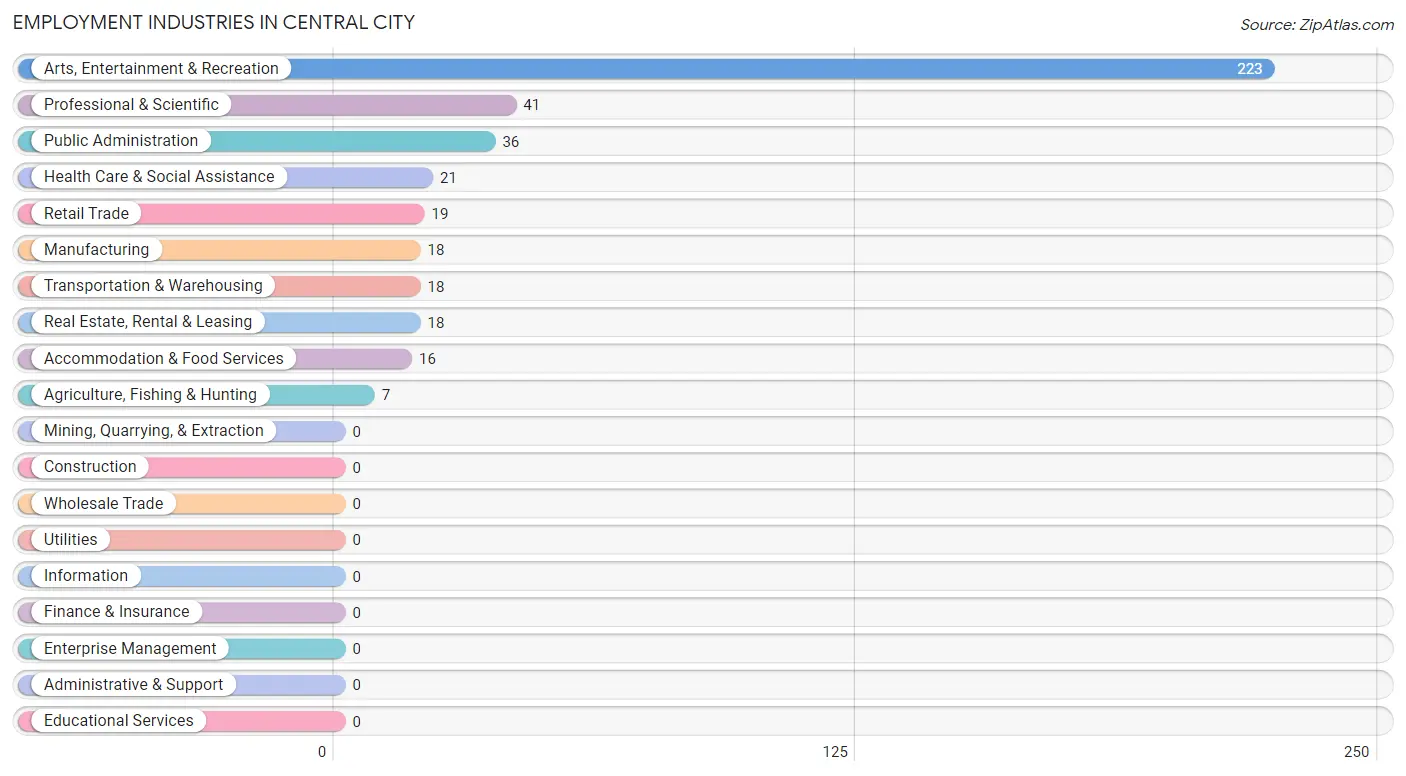
Employment Industries in Central City
The major employment industries in Central City include Arts, Entertainment & Recreation (223 | 51.3%), Professional & Scientific (41 | 9.4%), Public Administration (36 | 8.3%), Health Care & Social Assistance (21 | 4.8%), and Retail Trade (19 | 4.4%).
Employment Industries by Sex in Central City
The Central City industries that see more men than women are Agriculture, Fishing & Hunting (100.0%), Manufacturing (100.0%), and Retail Trade (100.0%), whereas the industries that tend to have a higher number of women are Real Estate, Rental & Leasing (100.0%), Health Care & Social Assistance (100.0%), and Public Administration (77.8%).
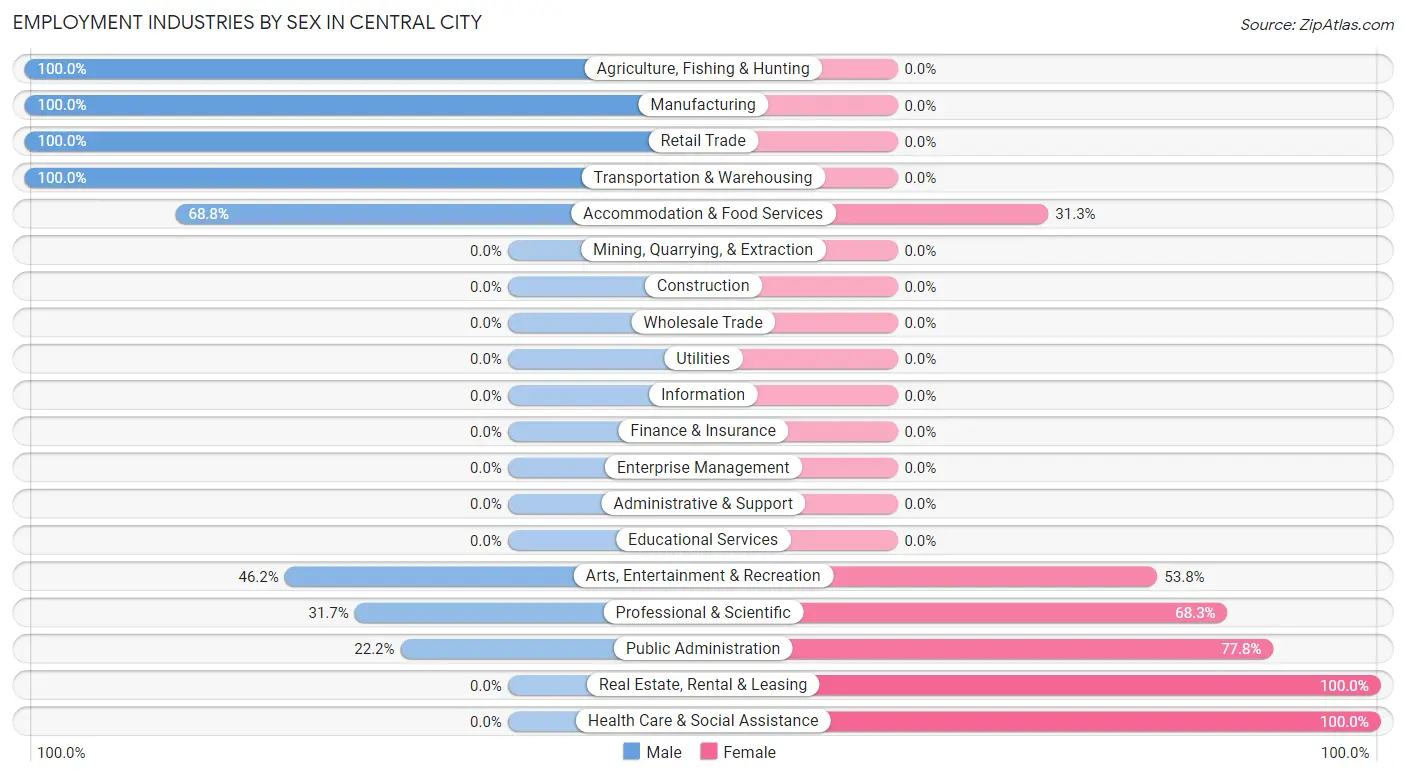
| Industry | Male | Female |
| Agriculture, Fishing & Hunting | 7 (100.0%) | 0 (0.0%) |
| Mining, Quarrying, & Extraction | 0 (0.0%) | 0 (0.0%) |
| Construction | 0 (0.0%) | 0 (0.0%) |
| Manufacturing | 18 (100.0%) | 0 (0.0%) |
| Wholesale Trade | 0 (0.0%) | 0 (0.0%) |
| Retail Trade | 19 (100.0%) | 0 (0.0%) |
| Transportation & Warehousing | 18 (100.0%) | 0 (0.0%) |
| Utilities | 0 (0.0%) | 0 (0.0%) |
| Information | 0 (0.0%) | 0 (0.0%) |
| Finance & Insurance | 0 (0.0%) | 0 (0.0%) |
| Real Estate, Rental & Leasing | 0 (0.0%) | 18 (100.0%) |
| Professional & Scientific | 13 (31.7%) | 28 (68.3%) |
| Enterprise Management | 0 (0.0%) | 0 (0.0%) |
| Administrative & Support | 0 (0.0%) | 0 (0.0%) |
| Educational Services | 0 (0.0%) | 0 (0.0%) |
| Health Care & Social Assistance | 0 (0.0%) | 21 (100.0%) |
| Arts, Entertainment & Recreation | 103 (46.2%) | 120 (53.8%) |
| Accommodation & Food Services | 11 (68.8%) | 5 (31.2%) |
| Public Administration | 8 (22.2%) | 28 (77.8%) |
| Total | 215 (49.4%) | 220 (50.6%) |
Education in Central City
School Enrollment in Central City
The most common levels of schooling among the 171 students in Central City are high school (59 | 34.5%), college / undergraduate (51 | 29.8%), and middle school (50 | 29.2%).
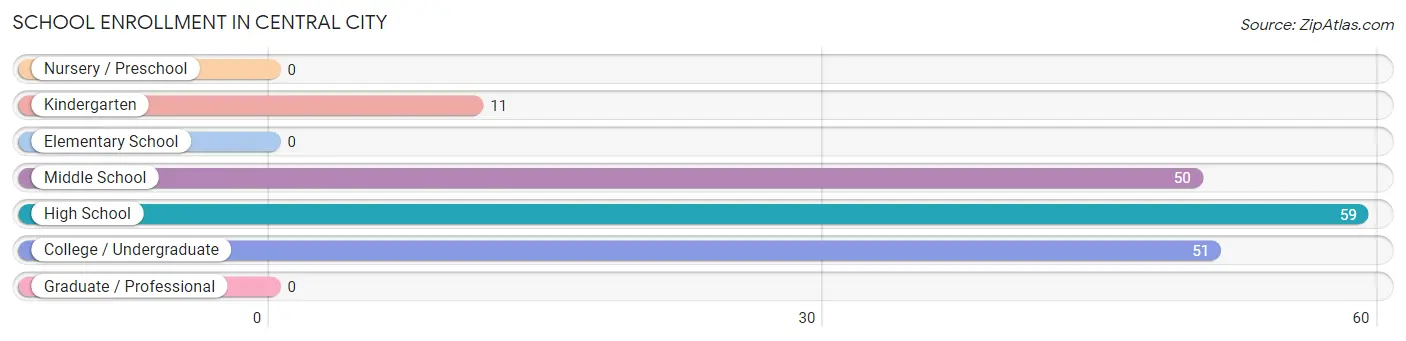
| School Level | # Students | % Students |
| Nursery / Preschool | 0 | 0.0% |
| Kindergarten | 11 | 6.4% |
| Elementary School | 0 | 0.0% |
| Middle School | 50 | 29.2% |
| High School | 59 | 34.5% |
| College / Undergraduate | 51 | 29.8% |
| Graduate / Professional | 0 | 0.0% |
| Total | 171 | 100.0% |
School Enrollment by Age by Funding Source in Central City
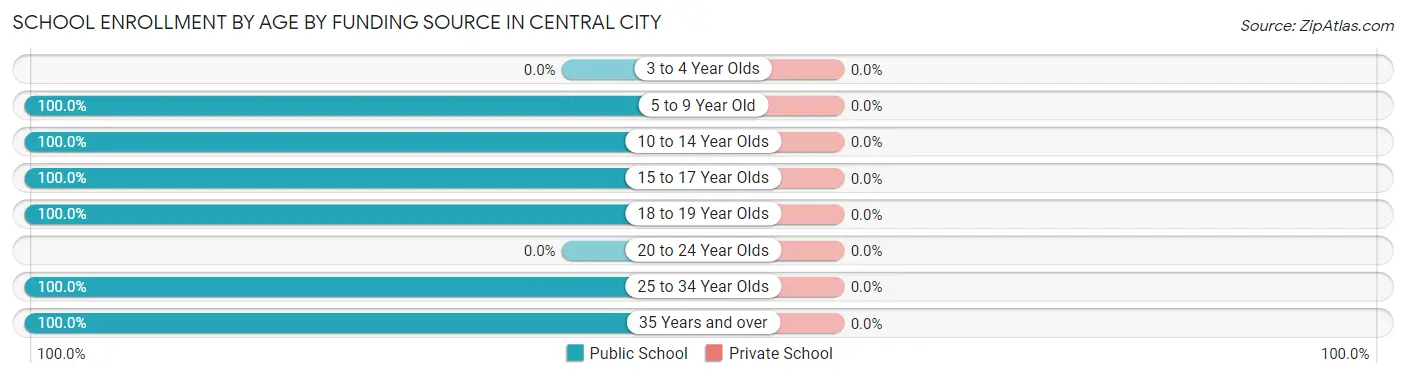
| Age Bracket | Public School | Private School |
| 3 to 4 Year Olds | 0 (0.0%) | 0 (0.0%) |
| 5 to 9 Year Old | 11 (100.0%) | 0 (0.0%) |
| 10 to 14 Year Olds | 57 (100.0%) | 0 (0.0%) |
| 15 to 17 Year Olds | 52 (100.0%) | 0 (0.0%) |
| 18 to 19 Year Olds | 32 (100.0%) | 0 (0.0%) |
| 20 to 24 Year Olds | 0 (0.0%) | 0 (0.0%) |
| 25 to 34 Year Olds | 18 (100.0%) | 0 (0.0%) |
| 35 Years and over | 1 (100.0%) | 0 (0.0%) |
| Total | 171 (100.0%) | 0 (0.0%) |
Educational Attainment by Field of Study in Central City
Visual & performing arts (29 | 21.8%), education (26 | 19.6%), business (21 | 15.8%), psychology (16 | 12.0%), and literature & languages (13 | 9.8%) are the most common fields of study among 133 individuals in Central City who have obtained a bachelor's degree or higher.
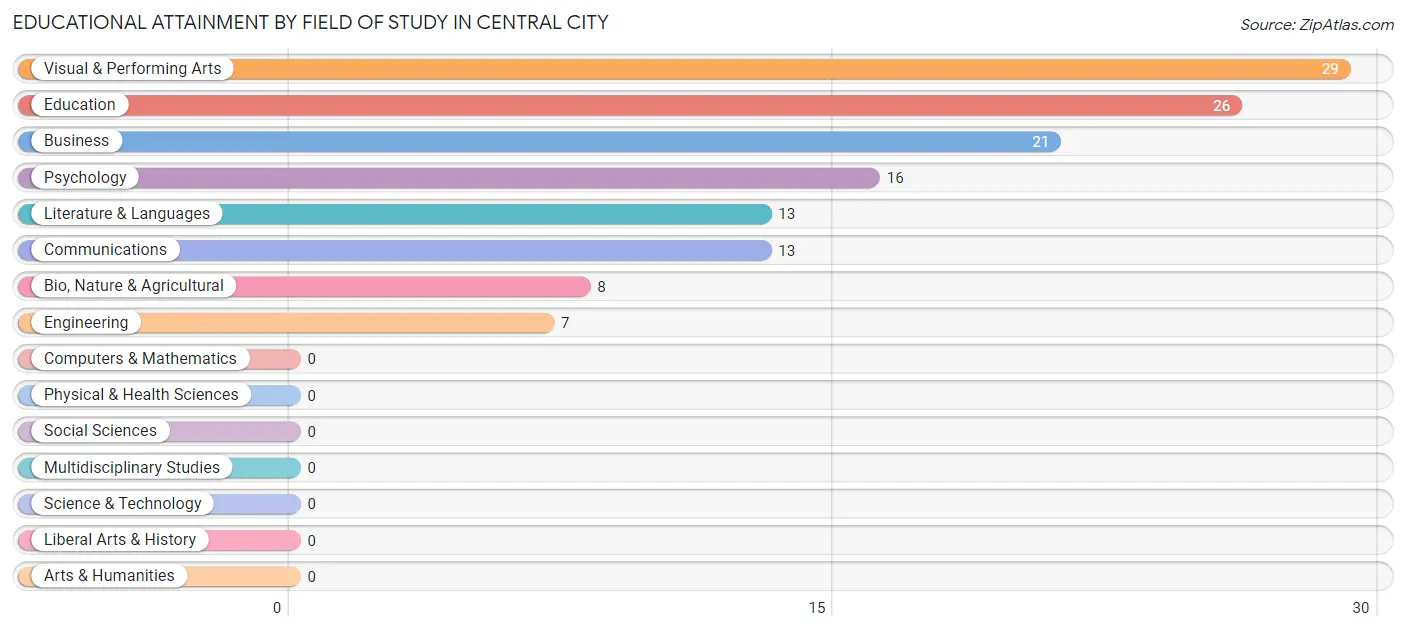
| Field of Study | # Graduates | % Graduates |
| Computers & Mathematics | 0 | 0.0% |
| Bio, Nature & Agricultural | 8 | 6.0% |
| Physical & Health Sciences | 0 | 0.0% |
| Psychology | 16 | 12.0% |
| Social Sciences | 0 | 0.0% |
| Engineering | 7 | 5.3% |
| Multidisciplinary Studies | 0 | 0.0% |
| Science & Technology | 0 | 0.0% |
| Business | 21 | 15.8% |
| Education | 26 | 19.6% |
| Literature & Languages | 13 | 9.8% |
| Liberal Arts & History | 0 | 0.0% |
| Visual & Performing Arts | 29 | 21.8% |
| Communications | 13 | 9.8% |
| Arts & Humanities | 0 | 0.0% |
| Total | 133 | 100.0% |
Transportation & Commute in Central City
Vehicle Availability by Sex in Central City
The most prevalent vehicle ownership categories in Central City are males with 2 vehicles (98, accounting for 46.0%) and females with 2 vehicles (122, making up 44.6%).
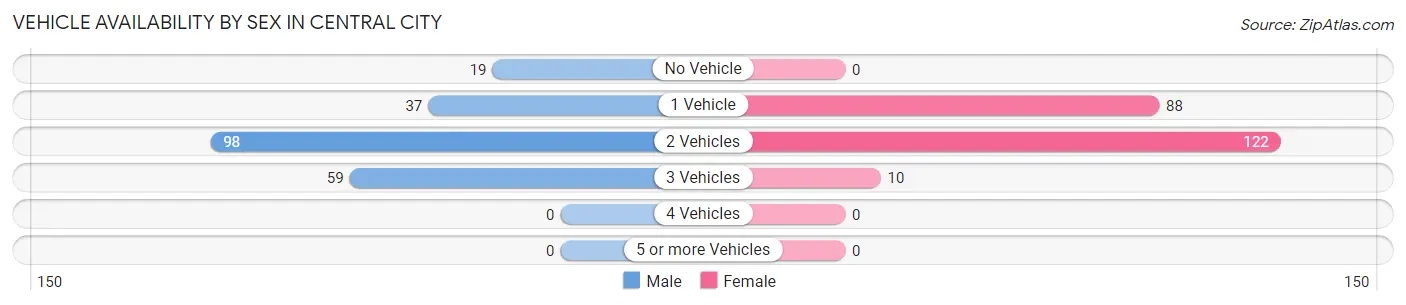
| Vehicles Available | Male | Female |
| No Vehicle | 19 (8.9%) | 0 (0.0%) |
| 1 Vehicle | 37 (17.4%) | 88 (40.0%) |
| 2 Vehicles | 98 (46.0%) | 122 (55.4%) |
| 3 Vehicles | 59 (27.7%) | 10 (4.5%) |
| 4 Vehicles | 0 (0.0%) | 0 (0.0%) |
| 5 or more Vehicles | 0 (0.0%) | 0 (0.0%) |
| Total | 213 (100.0%) | 220 (100.0%) |
Commute Time in Central City
The most frequently occuring commute durations in Central City are 5 to 9 minutes (175 commuters, 45.0%), 10 to 14 minutes (74 commuters, 19.0%), and 45 to 59 minutes (34 commuters, 8.7%).
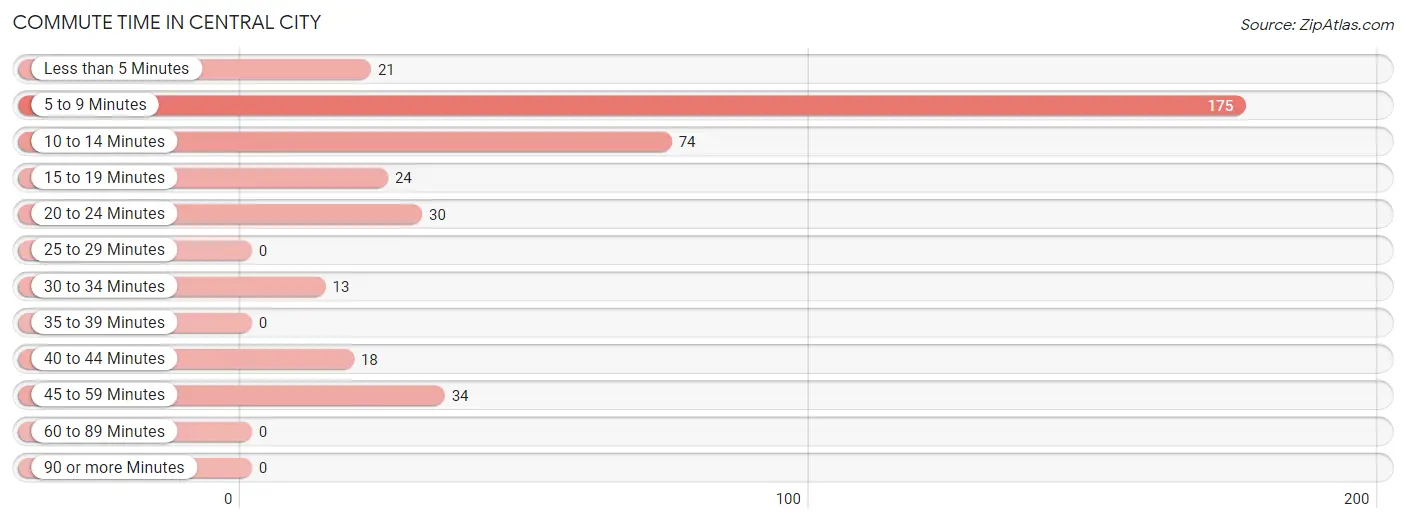
| Commute Time | # Commuters | % Commuters |
| Less than 5 Minutes | 21 | 5.4% |
| 5 to 9 Minutes | 175 | 45.0% |
| 10 to 14 Minutes | 74 | 19.0% |
| 15 to 19 Minutes | 24 | 6.2% |
| 20 to 24 Minutes | 30 | 7.7% |
| 25 to 29 Minutes | 0 | 0.0% |
| 30 to 34 Minutes | 13 | 3.3% |
| 35 to 39 Minutes | 0 | 0.0% |
| 40 to 44 Minutes | 18 | 4.6% |
| 45 to 59 Minutes | 34 | 8.7% |
| 60 to 89 Minutes | 0 | 0.0% |
| 90 or more Minutes | 0 | 0.0% |
Commute Time by Sex in Central City
The most common commute times in Central City are 5 to 9 minutes (73 commuters, 38.0%) for males and 5 to 9 minutes (102 commuters, 51.8%) for females.
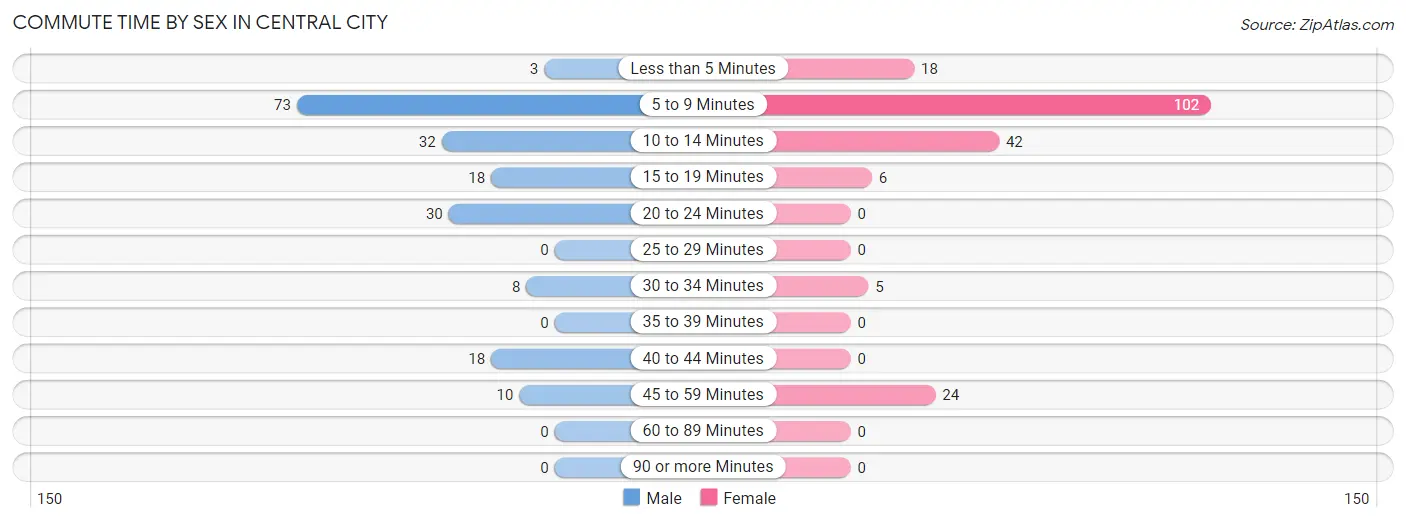
| Commute Time | Male | Female |
| Less than 5 Minutes | 3 (1.6%) | 18 (9.1%) |
| 5 to 9 Minutes | 73 (38.0%) | 102 (51.8%) |
| 10 to 14 Minutes | 32 (16.7%) | 42 (21.3%) |
| 15 to 19 Minutes | 18 (9.4%) | 6 (3.0%) |
| 20 to 24 Minutes | 30 (15.6%) | 0 (0.0%) |
| 25 to 29 Minutes | 0 (0.0%) | 0 (0.0%) |
| 30 to 34 Minutes | 8 (4.2%) | 5 (2.5%) |
| 35 to 39 Minutes | 0 (0.0%) | 0 (0.0%) |
| 40 to 44 Minutes | 18 (9.4%) | 0 (0.0%) |
| 45 to 59 Minutes | 10 (5.2%) | 24 (12.2%) |
| 60 to 89 Minutes | 0 (0.0%) | 0 (0.0%) |
| 90 or more Minutes | 0 (0.0%) | 0 (0.0%) |
Time of Departure to Work by Sex in Central City
The most frequent times of departure to work in Central City are 4:00 PM to 11:59 PM (77, 40.1%) for males and 9:00 AM to 9:59 AM (48, 24.4%) for females.
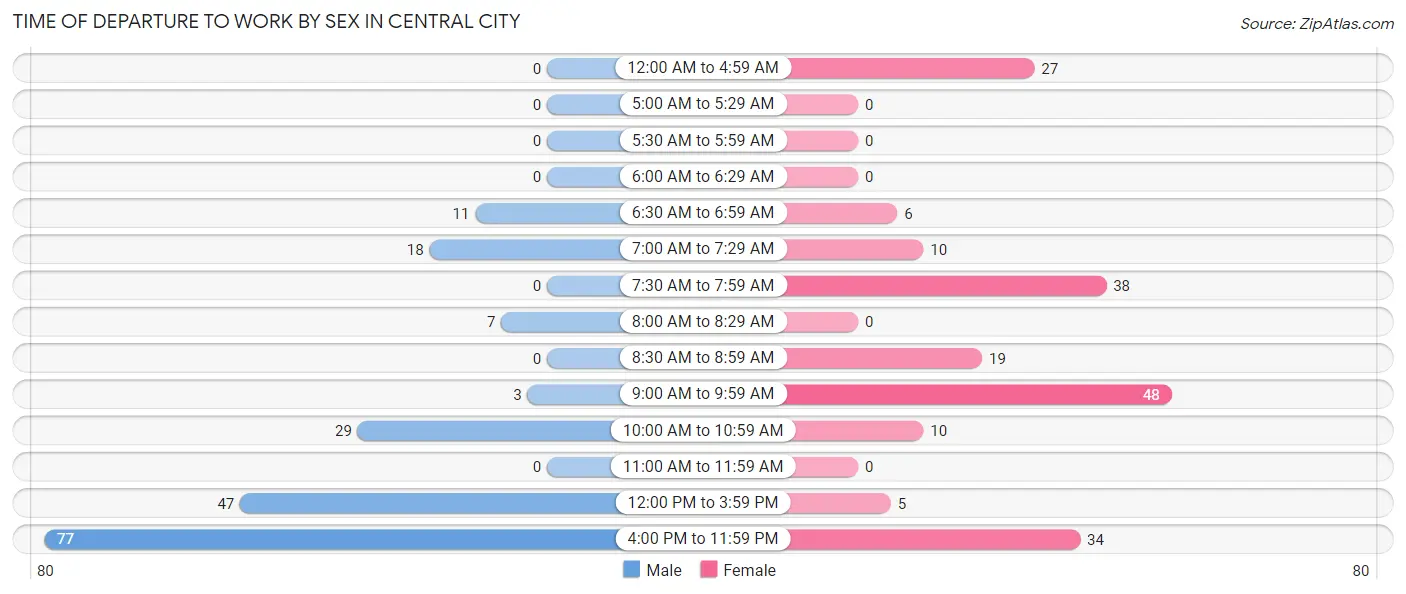
| Time of Departure | Male | Female |
| 12:00 AM to 4:59 AM | 0 (0.0%) | 27 (13.7%) |
| 5:00 AM to 5:29 AM | 0 (0.0%) | 0 (0.0%) |
| 5:30 AM to 5:59 AM | 0 (0.0%) | 0 (0.0%) |
| 6:00 AM to 6:29 AM | 0 (0.0%) | 0 (0.0%) |
| 6:30 AM to 6:59 AM | 11 (5.7%) | 6 (3.0%) |
| 7:00 AM to 7:29 AM | 18 (9.4%) | 10 (5.1%) |
| 7:30 AM to 7:59 AM | 0 (0.0%) | 38 (19.3%) |
| 8:00 AM to 8:29 AM | 7 (3.6%) | 0 (0.0%) |
| 8:30 AM to 8:59 AM | 0 (0.0%) | 19 (9.6%) |
| 9:00 AM to 9:59 AM | 3 (1.6%) | 48 (24.4%) |
| 10:00 AM to 10:59 AM | 29 (15.1%) | 10 (5.1%) |
| 11:00 AM to 11:59 AM | 0 (0.0%) | 0 (0.0%) |
| 12:00 PM to 3:59 PM | 47 (24.5%) | 5 (2.5%) |
| 4:00 PM to 11:59 PM | 77 (40.1%) | 34 (17.3%) |
| Total | 192 (100.0%) | 197 (100.0%) |
Housing Occupancy in Central City
Occupancy by Ownership in Central City
Of the total 365 dwellings in Central City, owner-occupied units account for 190 (52.0%), while renter-occupied units make up 175 (47.9%).
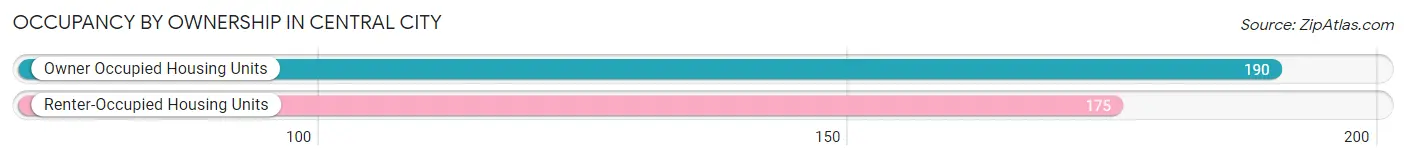
| Occupancy | # Housing Units | % Housing Units |
| Owner Occupied Housing Units | 190 | 52.0% |
| Renter-Occupied Housing Units | 175 | 47.9% |
| Total Occupied Housing Units | 365 | 100.0% |
Occupancy by Household Size in Central City
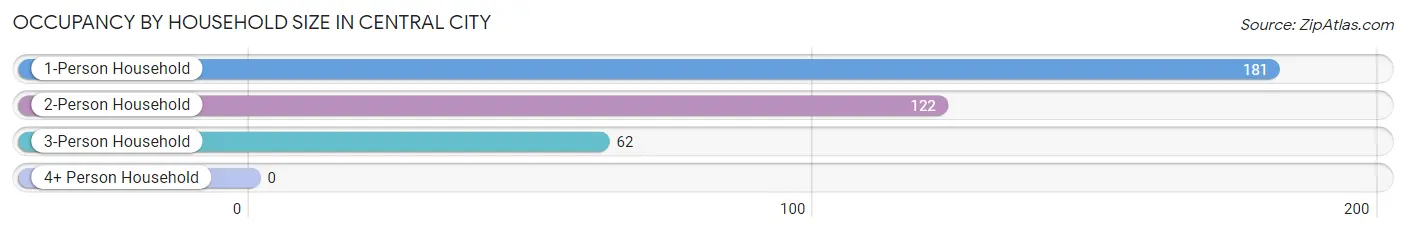
| Household Size | # Housing Units | % Housing Units |
| 1-Person Household | 181 | 49.6% |
| 2-Person Household | 122 | 33.4% |
| 3-Person Household | 62 | 17.0% |
| 4+ Person Household | 0 | 0.0% |
| Total Housing Units | 365 | 100.0% |
Occupancy by Ownership by Household Size in Central City
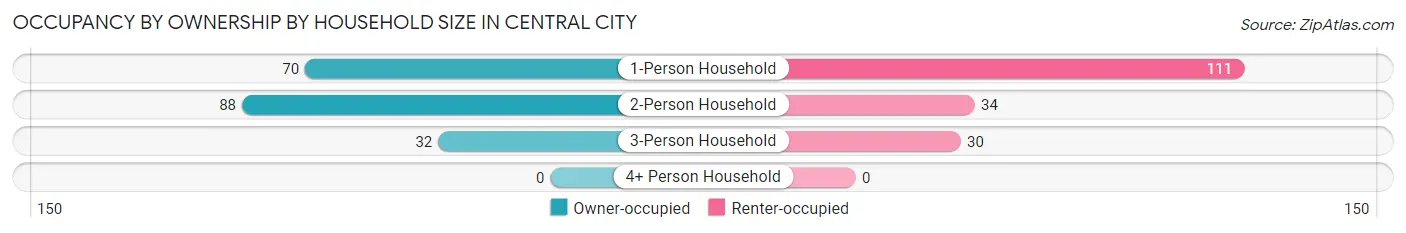
| Household Size | Owner-occupied | Renter-occupied |
| 1-Person Household | 70 (38.7%) | 111 (61.3%) |
| 2-Person Household | 88 (72.1%) | 34 (27.9%) |
| 3-Person Household | 32 (51.6%) | 30 (48.4%) |
| 4+ Person Household | 0 (0.0%) | 0 (0.0%) |
| Total Housing Units | 190 (52.0%) | 175 (47.9%) |
Occupancy by Educational Attainment in Central City
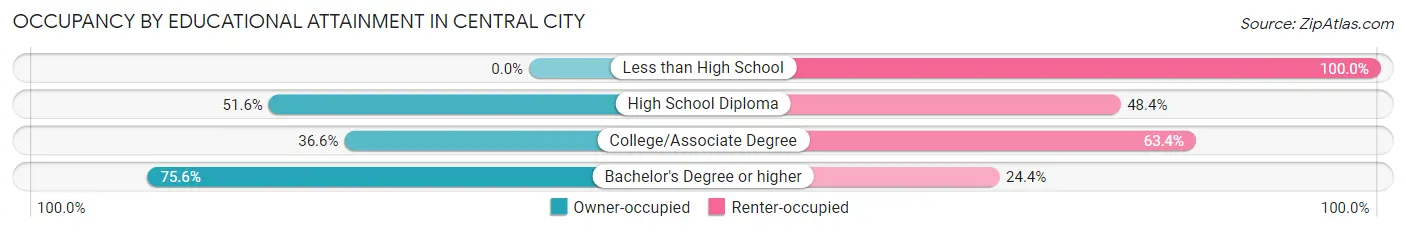
| Household Size | Owner-occupied | Renter-occupied |
| Less than High School | 0 (0.0%) | 11 (100.0%) |
| High School Diploma | 48 (51.6%) | 45 (48.4%) |
| College/Associate Degree | 52 (36.6%) | 90 (63.4%) |
| Bachelor's Degree or higher | 90 (75.6%) | 29 (24.4%) |
Occupancy by Age of Householder in Central City
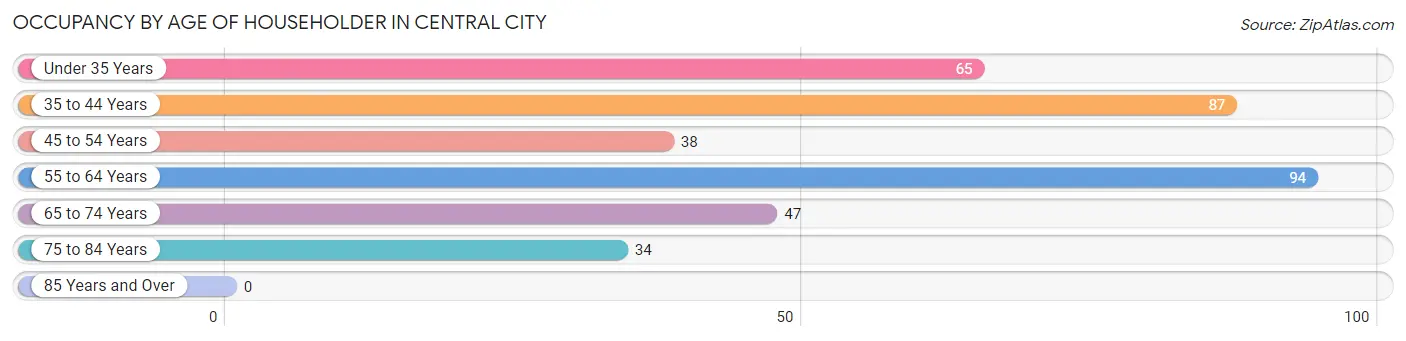
| Age Bracket | # Households | % Households |
| Under 35 Years | 65 | 17.8% |
| 35 to 44 Years | 87 | 23.8% |
| 45 to 54 Years | 38 | 10.4% |
| 55 to 64 Years | 94 | 25.8% |
| 65 to 74 Years | 47 | 12.9% |
| 75 to 84 Years | 34 | 9.3% |
| 85 Years and Over | 0 | 0.0% |
| Total | 365 | 100.0% |
Housing Finances in Central City
Median Income by Occupancy in Central City
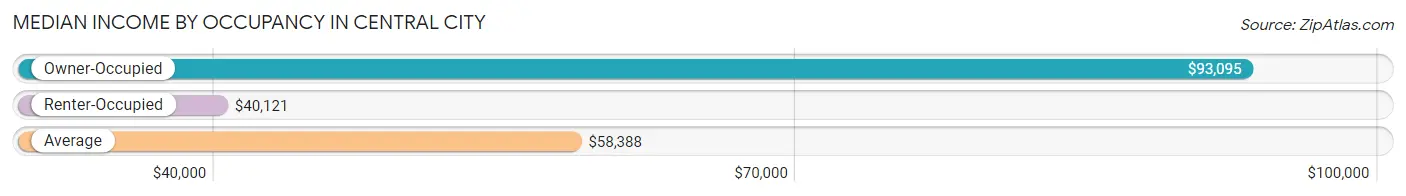
| Occupancy Type | # Households | Median Income |
| Owner-Occupied | 190 (52.0%) | $93,095 |
| Renter-Occupied | 175 (47.9%) | $40,121 |
| Average | 365 (100.0%) | $58,388 |
Occupancy by Householder Income Bracket in Central City
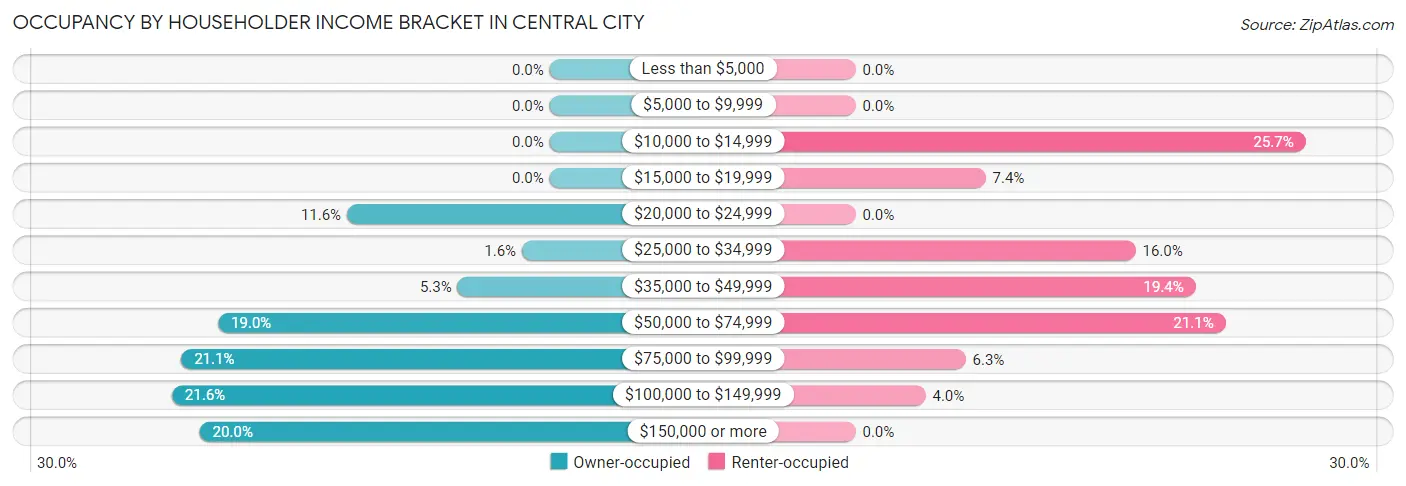
| Income Bracket | Owner-occupied | Renter-occupied |
| Less than $5,000 | 0 (0.0%) | 0 (0.0%) |
| $5,000 to $9,999 | 0 (0.0%) | 0 (0.0%) |
| $10,000 to $14,999 | 0 (0.0%) | 45 (25.7%) |
| $15,000 to $19,999 | 0 (0.0%) | 13 (7.4%) |
| $20,000 to $24,999 | 22 (11.6%) | 0 (0.0%) |
| $25,000 to $34,999 | 3 (1.6%) | 28 (16.0%) |
| $35,000 to $49,999 | 10 (5.3%) | 34 (19.4%) |
| $50,000 to $74,999 | 36 (19.0%) | 37 (21.1%) |
| $75,000 to $99,999 | 40 (21.0%) | 11 (6.3%) |
| $100,000 to $149,999 | 41 (21.6%) | 7 (4.0%) |
| $150,000 or more | 38 (20.0%) | 0 (0.0%) |
| Total | 190 (100.0%) | 175 (100.0%) |
Monthly Housing Cost Tiers in Central City
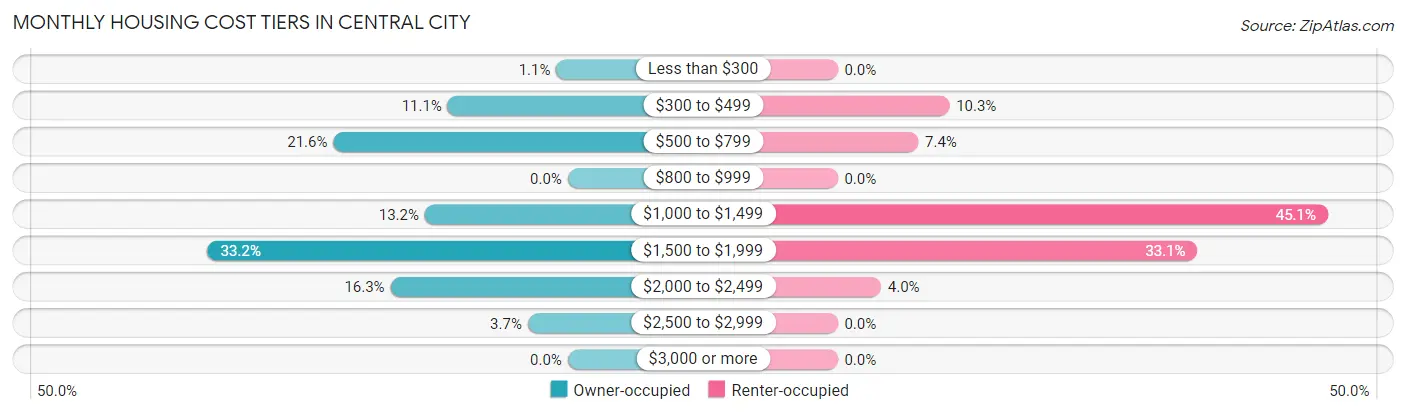
| Monthly Cost | Owner-occupied | Renter-occupied |
| Less than $300 | 2 (1.1%) | 0 (0.0%) |
| $300 to $499 | 21 (11.1%) | 18 (10.3%) |
| $500 to $799 | 41 (21.6%) | 13 (7.4%) |
| $800 to $999 | 0 (0.0%) | 0 (0.0%) |
| $1,000 to $1,499 | 25 (13.2%) | 79 (45.1%) |
| $1,500 to $1,999 | 63 (33.2%) | 58 (33.1%) |
| $2,000 to $2,499 | 31 (16.3%) | 7 (4.0%) |
| $2,500 to $2,999 | 7 (3.7%) | 0 (0.0%) |
| $3,000 or more | 0 (0.0%) | 0 (0.0%) |
| Total | 190 (100.0%) | 175 (100.0%) |
Physical Housing Characteristics in Central City
Housing Structures in Central City
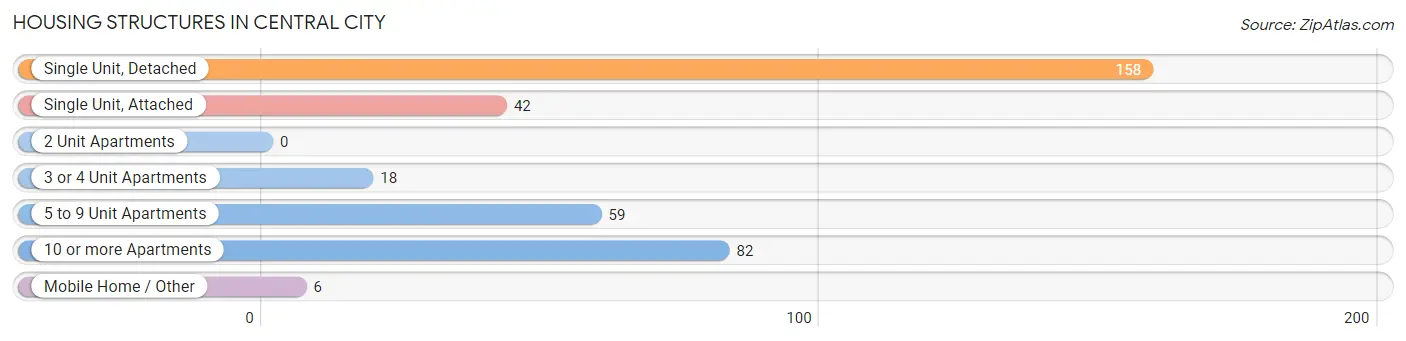
| Structure Type | # Housing Units | % Housing Units |
| Single Unit, Detached | 158 | 43.3% |
| Single Unit, Attached | 42 | 11.5% |
| 2 Unit Apartments | 0 | 0.0% |
| 3 or 4 Unit Apartments | 18 | 4.9% |
| 5 to 9 Unit Apartments | 59 | 16.2% |
| 10 or more Apartments | 82 | 22.5% |
| Mobile Home / Other | 6 | 1.6% |
| Total | 365 | 100.0% |
Housing Structures by Occupancy in Central City
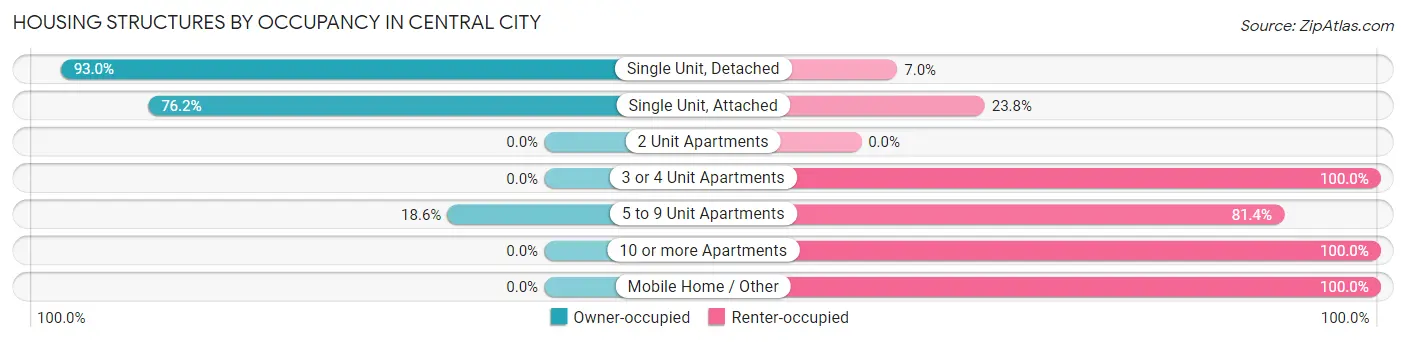
| Structure Type | Owner-occupied | Renter-occupied |
| Single Unit, Detached | 147 (93.0%) | 11 (7.0%) |
| Single Unit, Attached | 32 (76.2%) | 10 (23.8%) |
| 2 Unit Apartments | 0 (0.0%) | 0 (0.0%) |
| 3 or 4 Unit Apartments | 0 (0.0%) | 18 (100.0%) |
| 5 to 9 Unit Apartments | 11 (18.6%) | 48 (81.4%) |
| 10 or more Apartments | 0 (0.0%) | 82 (100.0%) |
| Mobile Home / Other | 0 (0.0%) | 6 (100.0%) |
| Total | 190 (52.0%) | 175 (47.9%) |
Housing Structures by Number of Rooms in Central City
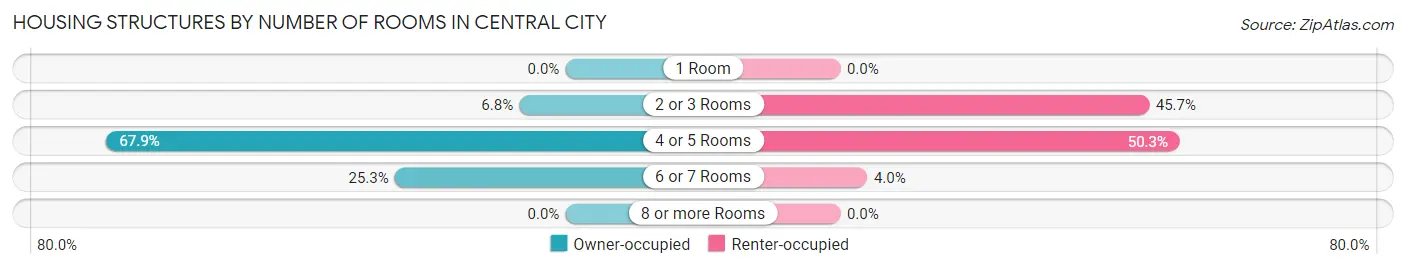
| Number of Rooms | Owner-occupied | Renter-occupied |
| 1 Room | 0 (0.0%) | 0 (0.0%) |
| 2 or 3 Rooms | 13 (6.8%) | 80 (45.7%) |
| 4 or 5 Rooms | 129 (67.9%) | 88 (50.3%) |
| 6 or 7 Rooms | 48 (25.3%) | 7 (4.0%) |
| 8 or more Rooms | 0 (0.0%) | 0 (0.0%) |
| Total | 190 (100.0%) | 175 (100.0%) |
Housing Structure by Heating Type in Central City
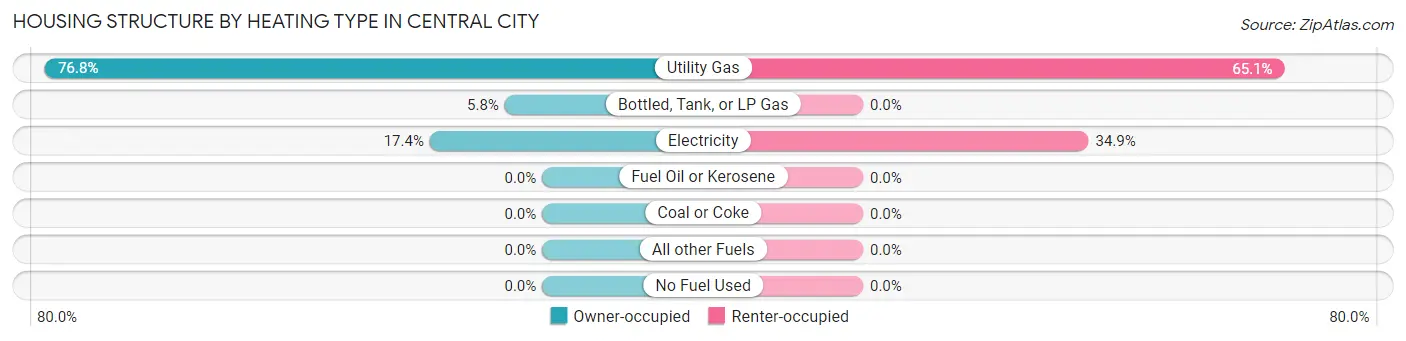
| Heating Type | Owner-occupied | Renter-occupied |
| Utility Gas | 146 (76.8%) | 114 (65.1%) |
| Bottled, Tank, or LP Gas | 11 (5.8%) | 0 (0.0%) |
| Electricity | 33 (17.4%) | 61 (34.9%) |
| Fuel Oil or Kerosene | 0 (0.0%) | 0 (0.0%) |
| Coal or Coke | 0 (0.0%) | 0 (0.0%) |
| All other Fuels | 0 (0.0%) | 0 (0.0%) |
| No Fuel Used | 0 (0.0%) | 0 (0.0%) |
| Total | 190 (100.0%) | 175 (100.0%) |
Household Vehicle Usage in Central City
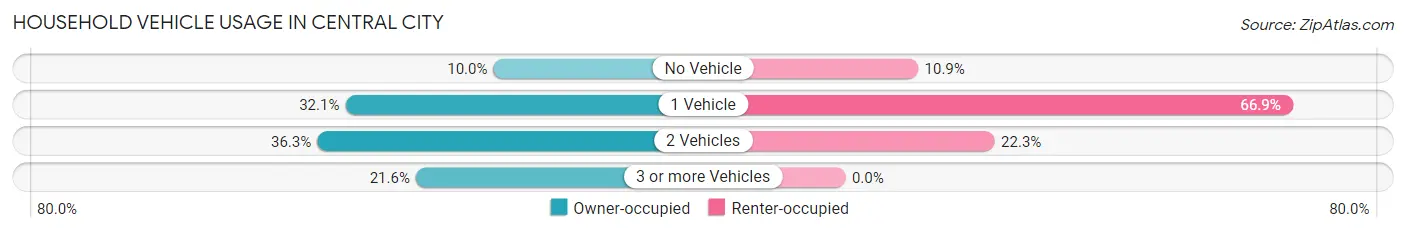
| Vehicles per Household | Owner-occupied | Renter-occupied |
| No Vehicle | 19 (10.0%) | 19 (10.9%) |
| 1 Vehicle | 61 (32.1%) | 117 (66.9%) |
| 2 Vehicles | 69 (36.3%) | 39 (22.3%) |
| 3 or more Vehicles | 41 (21.6%) | 0 (0.0%) |
| Total | 190 (100.0%) | 175 (100.0%) |
Real Estate & Mortgages in Central City
Real Estate and Mortgage Overview in Central City
| Characteristic | Without Mortgage | With Mortgage |
| Housing Units | 64 | 126 |
| Median Property Value | $366,700 | $348,500 |
| Median Household Income | - | - |
| Monthly Housing Costs | $553 | $0 |
| Real Estate Taxes | $513 | $8 |
Property Value by Mortgage Status in Central City
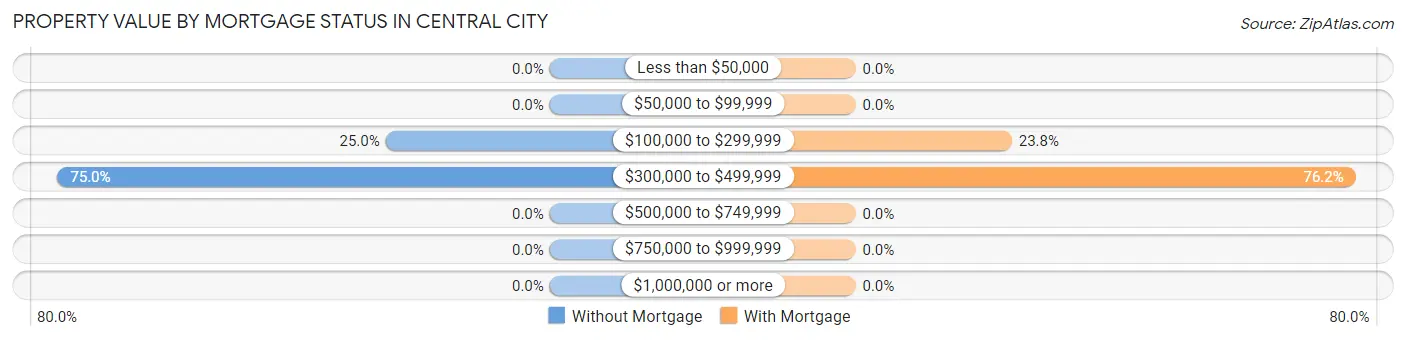
| Property Value | Without Mortgage | With Mortgage |
| Less than $50,000 | 0 (0.0%) | 0 (0.0%) |
| $50,000 to $99,999 | 0 (0.0%) | 0 (0.0%) |
| $100,000 to $299,999 | 16 (25.0%) | 30 (23.8%) |
| $300,000 to $499,999 | 48 (75.0%) | 96 (76.2%) |
| $500,000 to $749,999 | 0 (0.0%) | 0 (0.0%) |
| $750,000 to $999,999 | 0 (0.0%) | 0 (0.0%) |
| $1,000,000 or more | 0 (0.0%) | 0 (0.0%) |
| Total | 64 (100.0%) | 126 (100.0%) |
Household Income by Mortgage Status in Central City
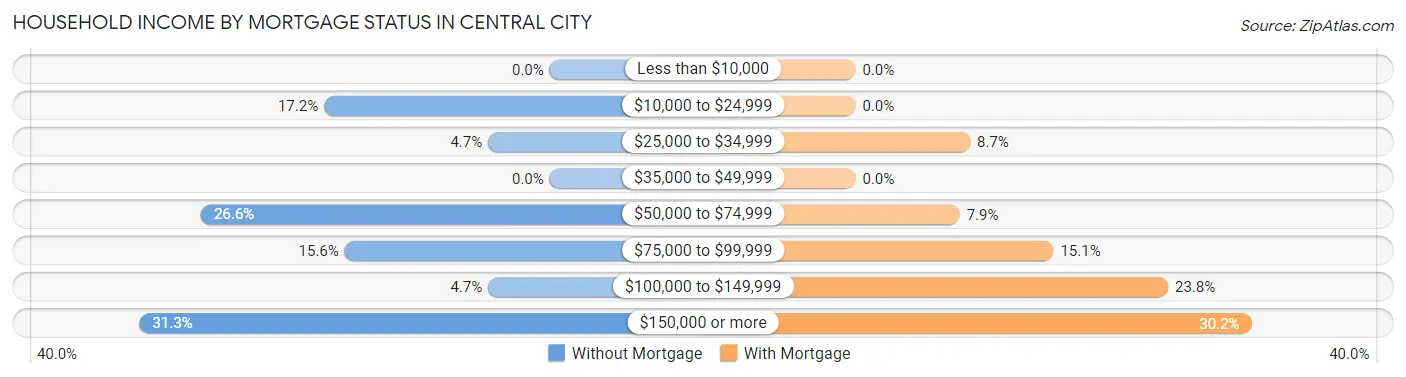
| Household Income | Without Mortgage | With Mortgage |
| Less than $10,000 | 0 (0.0%) | 0 (0.0%) |
| $10,000 to $24,999 | 11 (17.2%) | 0 (0.0%) |
| $25,000 to $34,999 | 3 (4.7%) | 11 (8.7%) |
| $35,000 to $49,999 | 0 (0.0%) | 0 (0.0%) |
| $50,000 to $74,999 | 17 (26.6%) | 10 (7.9%) |
| $75,000 to $99,999 | 10 (15.6%) | 19 (15.1%) |
| $100,000 to $149,999 | 3 (4.7%) | 30 (23.8%) |
| $150,000 or more | 20 (31.2%) | 38 (30.2%) |
| Total | 64 (100.0%) | 126 (100.0%) |
Property Value to Household Income Ratio in Central City
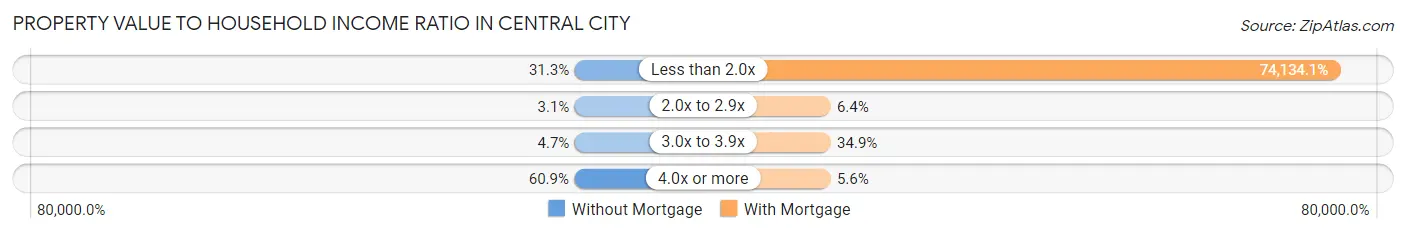
| Value-to-Income Ratio | Without Mortgage | With Mortgage |
| Less than 2.0x | 20 (31.2%) | 93,409 (74,134.1%) |
| 2.0x to 2.9x | 2 (3.1%) | 8 (6.4%) |
| 3.0x to 3.9x | 3 (4.7%) | 44 (34.9%) |
| 4.0x or more | 39 (60.9%) | 7 (5.6%) |
| Total | 64 (100.0%) | 126 (100.0%) |
Real Estate Taxes by Mortgage Status in Central City
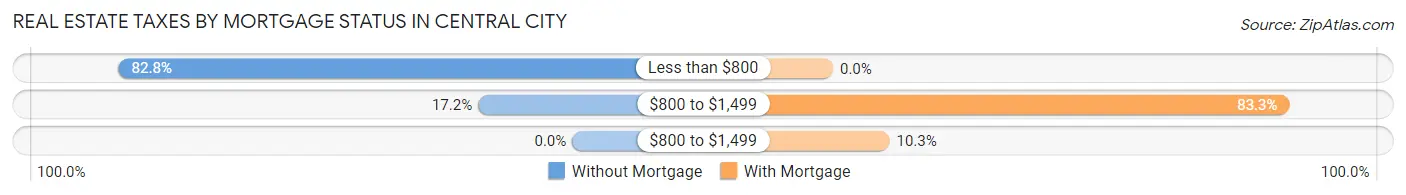
| Property Taxes | Without Mortgage | With Mortgage |
| Less than $800 | 53 (82.8%) | 0 (0.0%) |
| $800 to $1,499 | 11 (17.2%) | 105 (83.3%) |
| $800 to $1,499 | 0 (0.0%) | 13 (10.3%) |
| Total | 64 (100.0%) | 126 (100.0%) |
Health & Disability in Central City
Health Insurance Coverage by Age in Central City
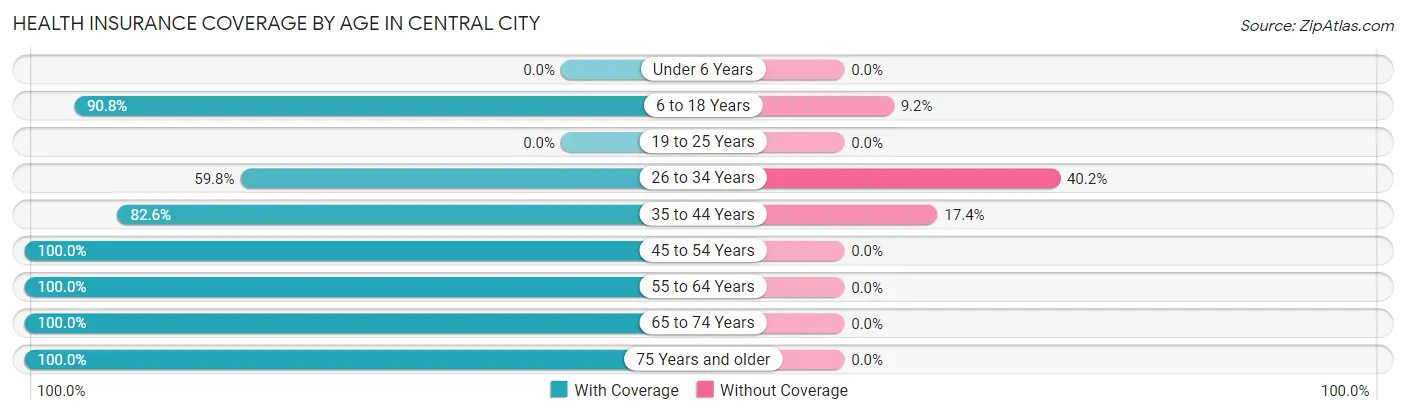
| Age Bracket | With Coverage | Without Coverage |
| Under 6 Years | 0 (0.0%) | 0 (0.0%) |
| 6 to 18 Years | 138 (90.8%) | 14 (9.2%) |
| 19 to 25 Years | 0 (0.0%) | 0 (0.0%) |
| 26 to 34 Years | 55 (59.8%) | 37 (40.2%) |
| 35 to 44 Years | 100 (82.6%) | 21 (17.4%) |
| 45 to 54 Years | 68 (100.0%) | 0 (0.0%) |
| 55 to 64 Years | 126 (100.0%) | 0 (0.0%) |
| 65 to 74 Years | 62 (100.0%) | 0 (0.0%) |
| 75 Years and older | 34 (100.0%) | 0 (0.0%) |
| Total | 583 (89.0%) | 72 (11.0%) |
Health Insurance Coverage by Citizenship Status in Central City
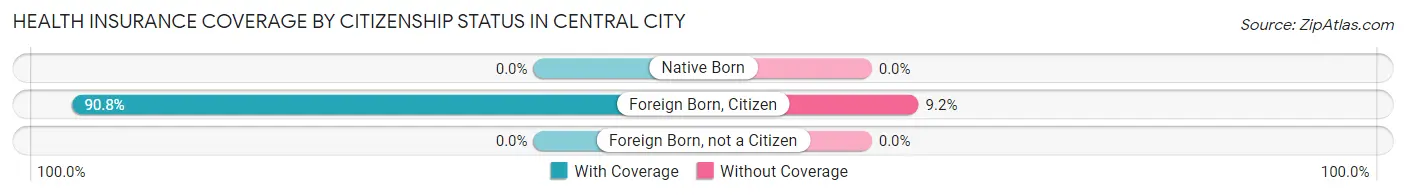
| Citizenship Status | With Coverage | Without Coverage |
| Native Born | 0 (0.0%) | 0 (0.0%) |
| Foreign Born, Citizen | 138 (90.8%) | 14 (9.2%) |
| Foreign Born, not a Citizen | 0 (0.0%) | 0 (0.0%) |
Health Insurance Coverage by Household Income in Central City
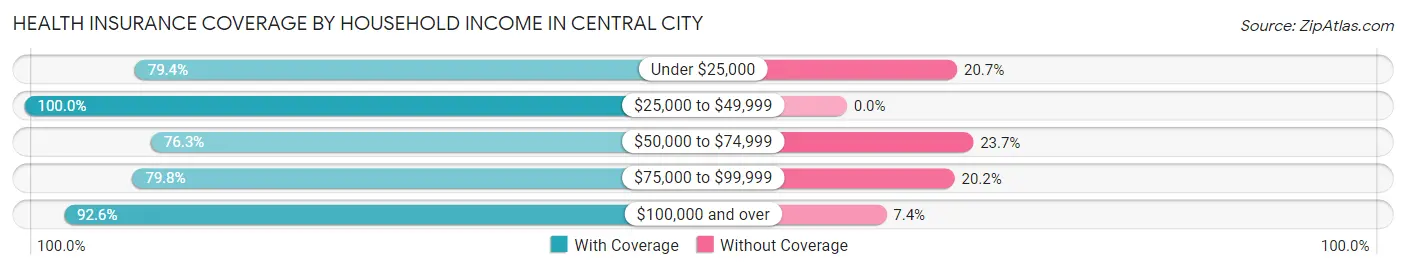
| Household Income | With Coverage | Without Coverage |
| Under $25,000 | 73 (79.3%) | 19 (20.6%) |
| $25,000 to $49,999 | 194 (100.0%) | 0 (0.0%) |
| $50,000 to $74,999 | 58 (76.3%) | 18 (23.7%) |
| $75,000 to $99,999 | 83 (79.8%) | 21 (20.2%) |
| $100,000 and over | 175 (92.6%) | 14 (7.4%) |
Public vs Private Health Insurance Coverage by Age in Central City
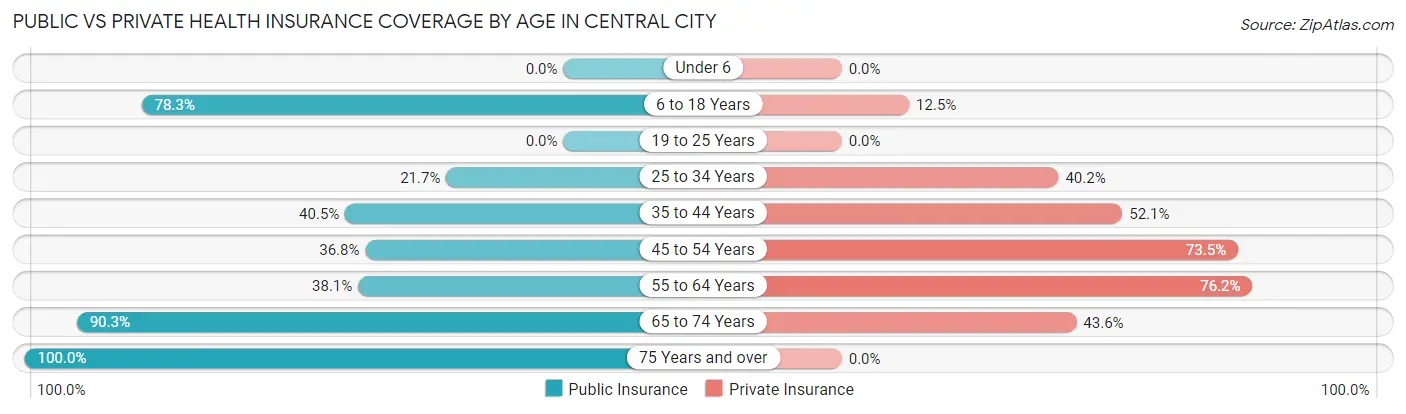
| Age Bracket | Public Insurance | Private Insurance |
| Under 6 | 0 (0.0%) | 0 (0.0%) |
| 6 to 18 Years | 119 (78.3%) | 19 (12.5%) |
| 19 to 25 Years | 0 (0.0%) | 0 (0.0%) |
| 25 to 34 Years | 20 (21.7%) | 37 (40.2%) |
| 35 to 44 Years | 49 (40.5%) | 63 (52.1%) |
| 45 to 54 Years | 25 (36.8%) | 50 (73.5%) |
| 55 to 64 Years | 48 (38.1%) | 96 (76.2%) |
| 65 to 74 Years | 56 (90.3%) | 27 (43.5%) |
| 75 Years and over | 34 (100.0%) | 0 (0.0%) |
| Total | 351 (53.6%) | 292 (44.6%) |
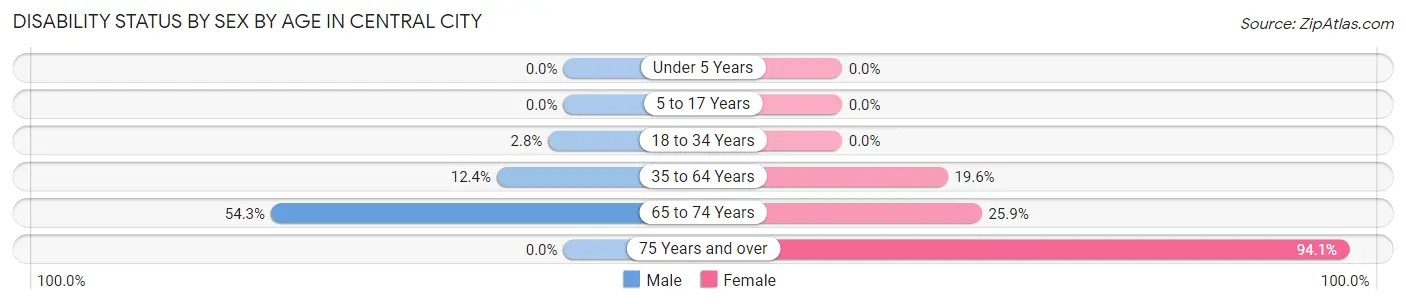
Disability Status by Sex by Age in Central City
| Age Bracket | Male | Female |
| Under 5 Years | 0 (0.0%) | 0 (0.0%) |
| 5 to 17 Years | 0 (0.0%) | 0 (0.0%) |
| 18 to 34 Years | 2 (2.8%) | 0 (0.0%) |
| 35 to 64 Years | 20 (12.3%) | 30 (19.6%) |
| 65 to 74 Years | 19 (54.3%) | 7 (25.9%) |
| 75 Years and over | 0 (0.0%) | 32 (94.1%) |
Disability Class by Sex by Age in Central City
Disability Class: Hearing Difficulty
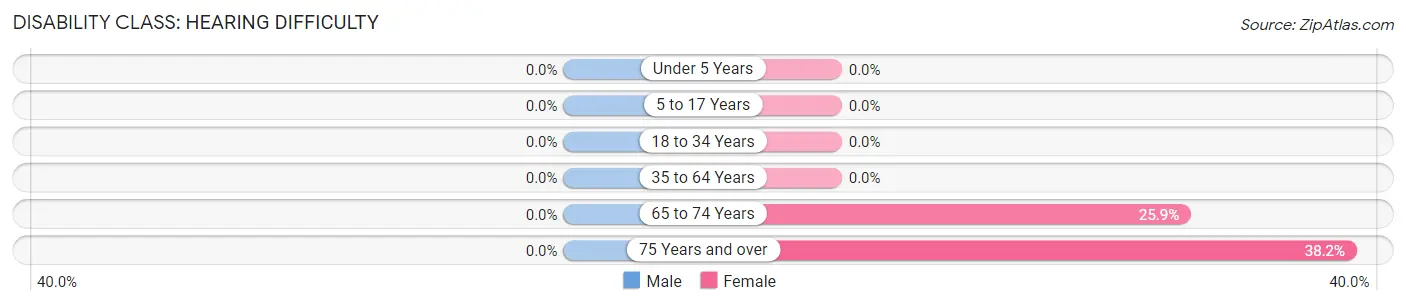
| Age Bracket | Male | Female |
| Under 5 Years | 0 (0.0%) | 0 (0.0%) |
| 5 to 17 Years | 0 (0.0%) | 0 (0.0%) |
| 18 to 34 Years | 0 (0.0%) | 0 (0.0%) |
| 35 to 64 Years | 0 (0.0%) | 0 (0.0%) |
| 65 to 74 Years | 0 (0.0%) | 7 (25.9%) |
| 75 Years and over | 0 (0.0%) | 13 (38.2%) |
Disability Class: Vision Difficulty
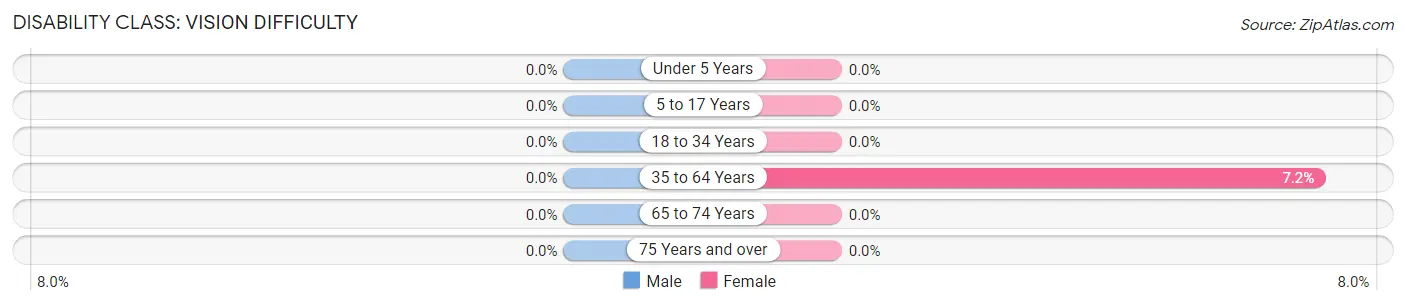
| Age Bracket | Male | Female |
| Under 5 Years | 0 (0.0%) | 0 (0.0%) |
| 5 to 17 Years | 0 (0.0%) | 0 (0.0%) |
| 18 to 34 Years | 0 (0.0%) | 0 (0.0%) |
| 35 to 64 Years | 0 (0.0%) | 11 (7.2%) |
| 65 to 74 Years | 0 (0.0%) | 0 (0.0%) |
| 75 Years and over | 0 (0.0%) | 0 (0.0%) |
Disability Class: Cognitive Difficulty
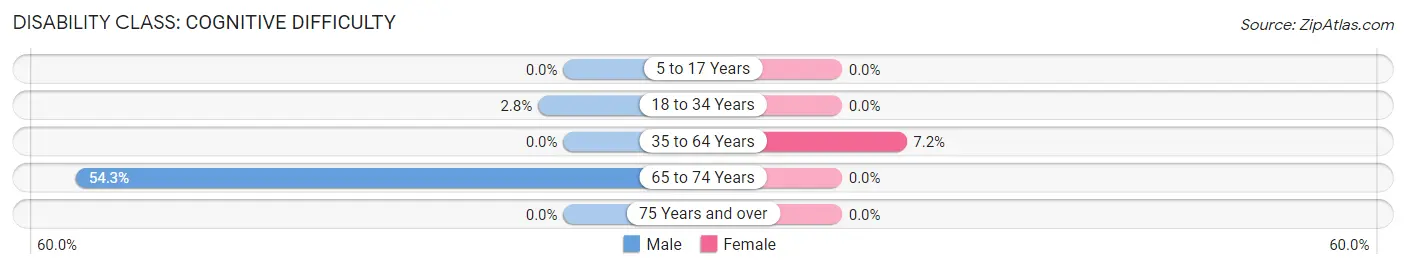
| Age Bracket | Male | Female |
| 5 to 17 Years | 0 (0.0%) | 0 (0.0%) |
| 18 to 34 Years | 2 (2.8%) | 0 (0.0%) |
| 35 to 64 Years | 0 (0.0%) | 11 (7.2%) |
| 65 to 74 Years | 19 (54.3%) | 0 (0.0%) |
| 75 Years and over | 0 (0.0%) | 0 (0.0%) |
Disability Class: Ambulatory Difficulty
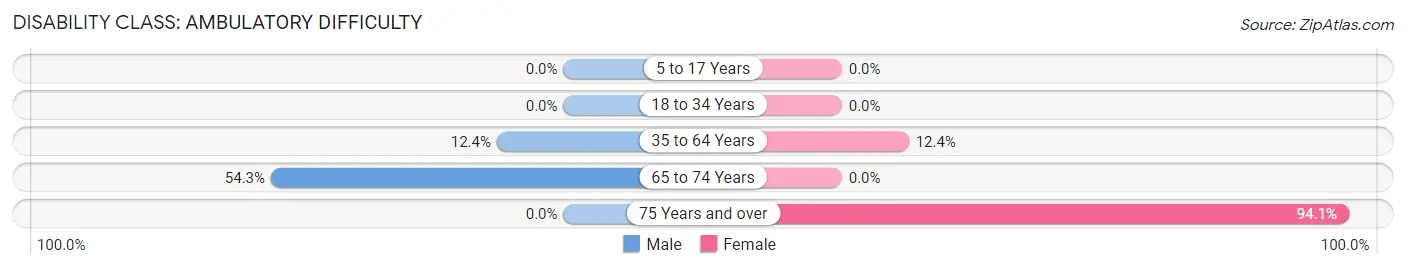
| Age Bracket | Male | Female |
| 5 to 17 Years | 0 (0.0%) | 0 (0.0%) |
| 18 to 34 Years | 0 (0.0%) | 0 (0.0%) |
| 35 to 64 Years | 20 (12.3%) | 19 (12.4%) |
| 65 to 74 Years | 19 (54.3%) | 0 (0.0%) |
| 75 Years and over | 0 (0.0%) | 32 (94.1%) |
Disability Class: Self-Care Difficulty
| Age Bracket | Male | Female |
| 5 to 17 Years | 0 (0.0%) | 0 (0.0%) |
| 18 to 34 Years | 0 (0.0%) | 0 (0.0%) |
| 35 to 64 Years | 0 (0.0%) | 0 (0.0%) |
| 65 to 74 Years | 0 (0.0%) | 0 (0.0%) |
| 75 Years and over | 0 (0.0%) | 0 (0.0%) |
Technology Access in Central City
Computing Device Access in Central City
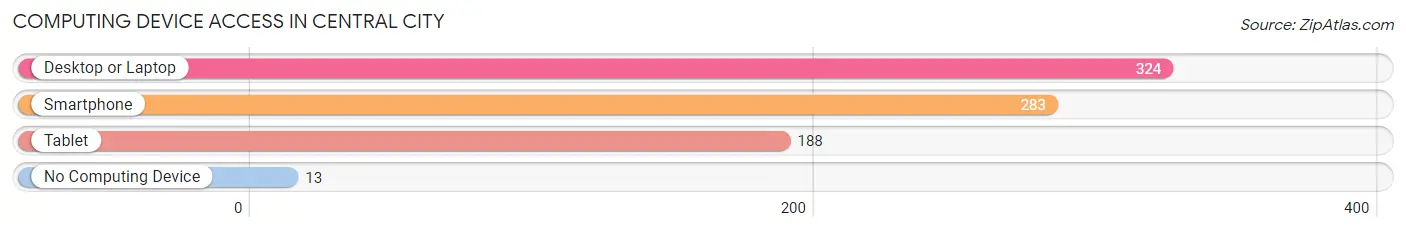
| Device Type | # Households | % Households |
| Desktop or Laptop | 324 | 88.8% |
| Smartphone | 283 | 77.5% |
| Tablet | 188 | 51.5% |
| No Computing Device | 13 | 3.6% |
| Total | 365 | 100.0% |
Internet Access in Central City
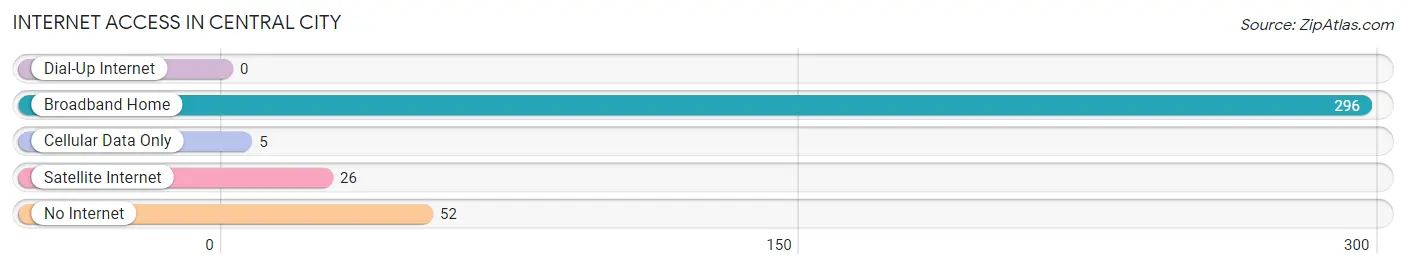
| Internet Type | # Households | % Households |
| Dial-Up Internet | 0 | 0.0% |
| Broadband Home | 296 | 81.1% |
| Cellular Data Only | 5 | 1.4% |
| Satellite Internet | 26 | 7.1% |
| No Internet | 52 | 14.2% |
| Total | 365 | 100.0% |
Central City Summary
Central City, Colorado is a small town located in the Rocky Mountains of Gilpin County, Colorado. It is situated in the Clear Creek Valley, approximately one hour west of Denver. The town was founded in 1859 during the Pike’s Peak Gold Rush and is known as the “Richest Square Mile on Earth” due to the large amount of gold that was discovered in the area.
History
Central City was founded in 1859 during the Pike’s Peak Gold Rush. The town was originally called Mountain City, but was renamed Central City in 1861. The town quickly grew as prospectors flocked to the area in search of gold. By the late 1860s, Central City had become the largest city in Colorado with a population of over 10,000.
The town was home to many of the most successful gold mines in the area, including the Gregory, Gregory Gulch, and the Russell Mines. The Gregory Mine was the most successful, producing over $20 million in gold.
The town experienced a decline in the late 19th century as the gold rush ended and the mines began to close. However, the town was revitalized in the early 20th century when the Central City Opera House was built in 1932. The opera house is still in operation today and is one of the most popular attractions in the area.
Geography
Central City is located in the Rocky Mountains of Gilpin County, Colorado. It is situated in the Clear Creek Valley, approximately one hour west of Denver. The town is surrounded by mountains, including the Continental Divide to the west and the Front Range to the east.
The town is located at an elevation of 8,530 feet and has a total area of 1.2 square miles. The climate is semi-arid, with hot summers and cold winters. The average annual precipitation is 16.5 inches.
Economy
Central City’s economy is largely based on tourism. The town is home to several casinos, which attract visitors from all over the world. The casinos also provide employment for many of the town’s residents.
The town is also home to several historic sites, including the Central City Opera House and the Teller House. These sites attract visitors from all over the world and provide an important source of income for the town.
In addition, the town is home to several small businesses, including restaurants, shops, and galleries. These businesses provide employment for many of the town’s residents and contribute to the local economy.
Demographics
As of the 2010 census, Central City had a population of 595. The racial makeup of the town was 95.2% White, 0.2% African American, 0.2% Native American, 0.2% Asian, 0.2% Pacific Islander, 0.2% from other races, and 3.9% from two or more races. Hispanic or Latino of any race were 2.7% of the population.
The median income for a household in the town was $37,500, and the median income for a family was $41,250. The per capita income for the town was $19,945. About 10.2% of families and 11.7% of the population were below the poverty line, including 16.7% of those under age 18 and none of those age 65 or over.
Central City is a small town with a rich history and a vibrant economy. The town is home to several casinos, historic sites, and small businesses, which provide employment for many of the town’s residents. The town also has a diverse population, with a mix of races and ethnicities. Central City is an important part of Colorado’s history and culture and is a great place to visit or live.
Common Questions
What is Per Capita Income in Central City?
Per Capita income in Central City is $46,847.
What is the Median Family Income in Central City?
Median Family Income in Central City is $81,364.
What is the Median Household income in Central City?
Median Household Income in Central City is $58,388.
What is Inequality or Gini Index in Central City?
Inequality or Gini Index in Central City is 0.45.
What is the Total Population of Central City?
Total Population of Central City is 655.
What is the Total Male Population of Central City?
Total Male Population of Central City is 341.
What is the Total Female Population of Central City?
Total Female Population of Central City is 314.
What is the Ratio of Males per 100 Females in Central City?
There are 108.60 Males per 100 Females in Central City.
What is the Ratio of Females per 100 Males in Central City?
There are 92.08 Females per 100 Males in Central City.
What is the Median Population Age in Central City?
Median Population Age in Central City is 43.5 Years.
What is the Average Family Size in Central City
Average Family Size in Central City is 2.6 People.
What is the Average Household Size in Central City
Average Household Size in Central City is 1.8 People.
How Large is the Labor Force in Central City?
There are 453 People in the Labor Forcein in Central City.
What is the Percentage of People in the Labor Force in Central City?
77.2% of People are in the Labor Force in Central City.
What is the Unemployment Rate in Central City?
Unemployment Rate in Central City is 4.0%.