Cripple Creek, CO Map & Demographics
Cripple Creek Map
Cripple Creek Overview
$25,620
PER CAPITA INCOME
$45,250
AVG FAMILY INCOME
$36,783
AVG HOUSEHOLD INCOME
2.9%
WAGE / INCOME GAP [ % ]
97.1¢/ $1
WAGE / INCOME GAP [ $ ]
0.44
INEQUALITY / GINI INDEX
1,093
TOTAL POPULATION
571
MALE POPULATION
522
FEMALE POPULATION
109.39
MALES / 100 FEMALES
91.42
FEMALES / 100 MALES
50.3
MEDIAN AGE
2.8
AVG FAMILY SIZE
1.9
AVG HOUSEHOLD SIZE
379
LABOR FORCE [ PEOPLE ]
40.8%
PERCENT IN LABOR FORCE
8.4%
UNEMPLOYMENT RATE
Cripple Creek Zip Codes
Cripple Creek Area Codes
Income in Cripple Creek
Income Overview in Cripple Creek
Per Capita Income in Cripple Creek is $25,620, while median incomes of families and households are $45,250 and $36,783 respectively.
| Characteristic | Number | Measure |
| Per Capita Income | 1,093 | $25,620 |
| Median Family Income | 233 | $45,250 |
| Mean Family Income | 233 | $56,956 |
| Median Household Income | 545 | $36,783 |
| Mean Household Income | 545 | $51,234 |
| Income Deficit | 233 | $0 |
| Wage / Income Gap (%) | 1,093 | 2.91% |
| Wage / Income Gap ($) | 1,093 | 97.09¢ per $1 |
| Gini / Inequality Index | 1,093 | 0.44 |
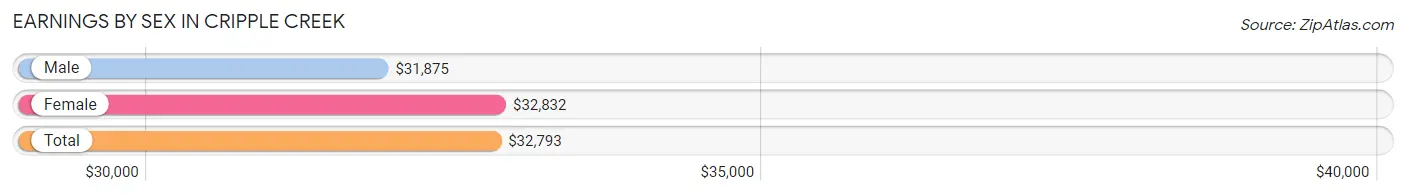
Earnings by Sex in Cripple Creek
Average Earnings in Cripple Creek are $32,793, $31,875 for men and $32,832 for women, a difference of 2.9%.
| Sex | Number | Average Earnings |
| Male | 148 (36.9%) | $31,875 |
| Female | 253 (63.1%) | $32,832 |
| Total | 401 (100.0%) | $32,793 |
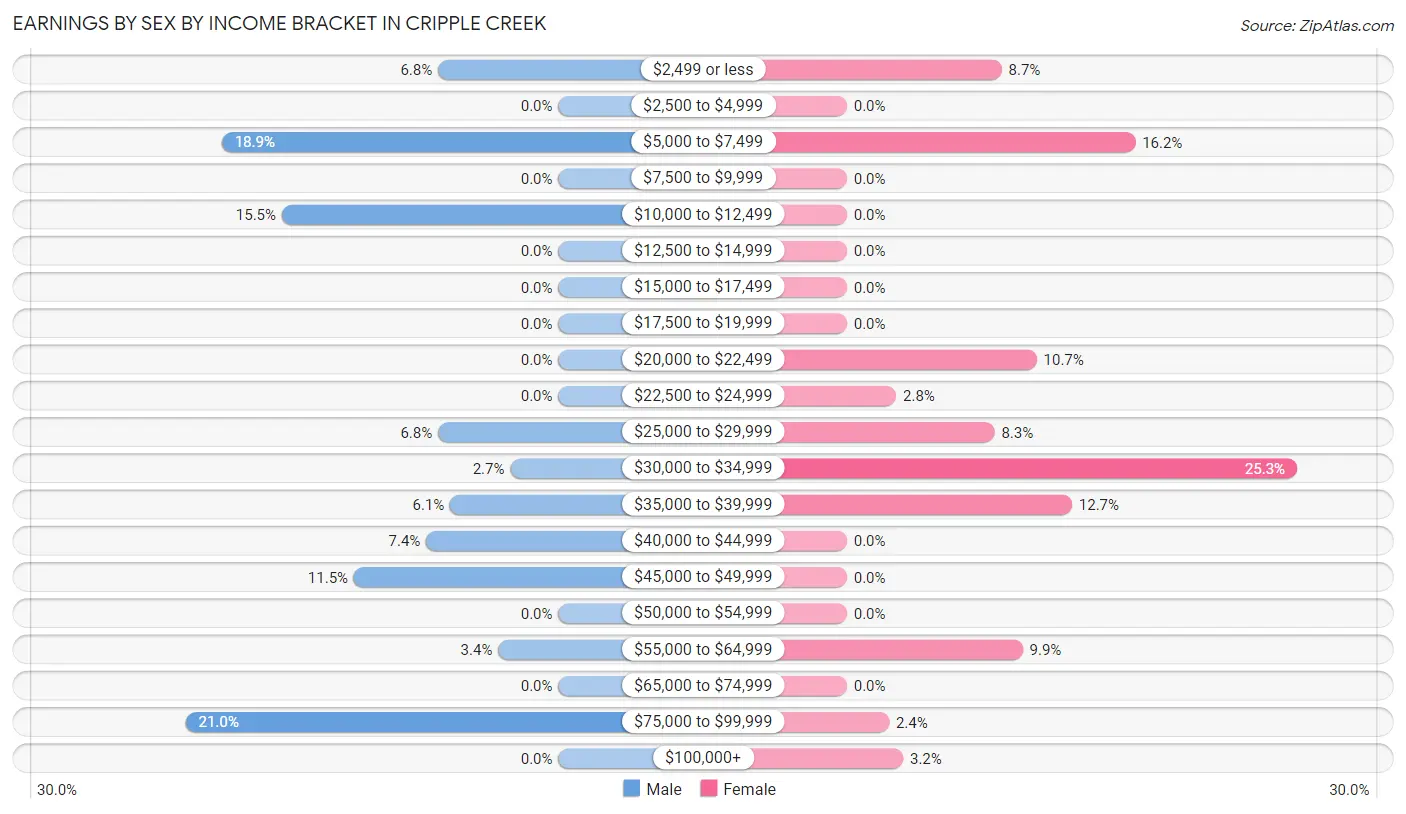
Earnings by Sex by Income Bracket in Cripple Creek
The most common earnings brackets in Cripple Creek are $75,000 to $99,999 for men (31 | 20.9%) and $30,000 to $34,999 for women (64 | 25.3%).
| Income | Male | Female |
| $2,499 or less | 10 (6.8%) | 22 (8.7%) |
| $2,500 to $4,999 | 0 (0.0%) | 0 (0.0%) |
| $5,000 to $7,499 | 28 (18.9%) | 41 (16.2%) |
| $7,500 to $9,999 | 0 (0.0%) | 0 (0.0%) |
| $10,000 to $12,499 | 23 (15.5%) | 0 (0.0%) |
| $12,500 to $14,999 | 0 (0.0%) | 0 (0.0%) |
| $15,000 to $17,499 | 0 (0.0%) | 0 (0.0%) |
| $17,500 to $19,999 | 0 (0.0%) | 0 (0.0%) |
| $20,000 to $22,499 | 0 (0.0%) | 27 (10.7%) |
| $22,500 to $24,999 | 0 (0.0%) | 7 (2.8%) |
| $25,000 to $29,999 | 10 (6.8%) | 21 (8.3%) |
| $30,000 to $34,999 | 4 (2.7%) | 64 (25.3%) |
| $35,000 to $39,999 | 9 (6.1%) | 32 (12.7%) |
| $40,000 to $44,999 | 11 (7.4%) | 0 (0.0%) |
| $45,000 to $49,999 | 17 (11.5%) | 0 (0.0%) |
| $50,000 to $54,999 | 0 (0.0%) | 0 (0.0%) |
| $55,000 to $64,999 | 5 (3.4%) | 25 (9.9%) |
| $65,000 to $74,999 | 0 (0.0%) | 0 (0.0%) |
| $75,000 to $99,999 | 31 (20.9%) | 6 (2.4%) |
| $100,000+ | 0 (0.0%) | 8 (3.2%) |
| Total | 148 (100.0%) | 253 (100.0%) |
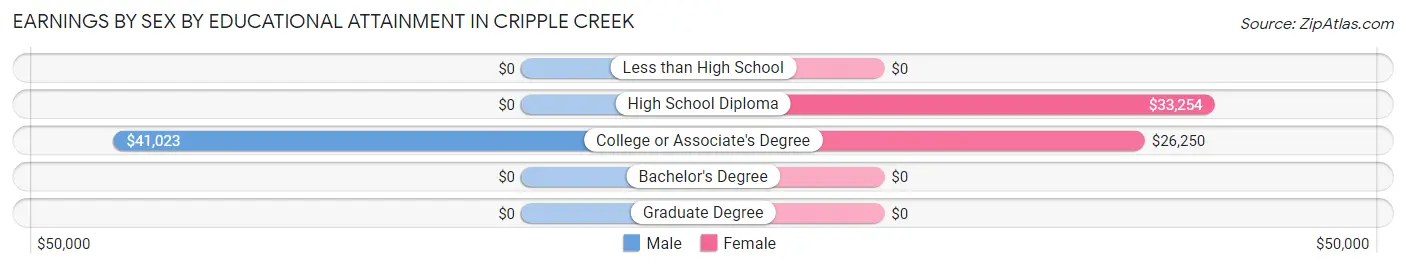
Earnings by Sex by Educational Attainment in Cripple Creek
Average earnings in Cripple Creek are $31,875 for men and $33,262 for women, a difference of 4.2%. Men with an educational attainment of college or associate's degree enjoy the highest average annual earnings of $41,023, while those with college or associate's degree education earn the least with $41,023. Women with an educational attainment of high school diploma earn the most with the average annual earnings of $33,254, while those with college or associate's degree education have the smallest earnings of $26,250.
| Educational Attainment | Male Income | Female Income |
| Less than High School | - | - |
| High School Diploma | - | - |
| College or Associate's Degree | $41,023 | $26,250 |
| Bachelor's Degree | - | - |
| Graduate Degree | - | - |
| Total | $31,875 | $33,262 |
Family Income in Cripple Creek
Family Income Brackets in Cripple Creek
According to the Cripple Creek family income data, there are 86 families falling into the $35,000 to $49,999 income range, which is the most common income bracket and makes up 36.9% of all families.
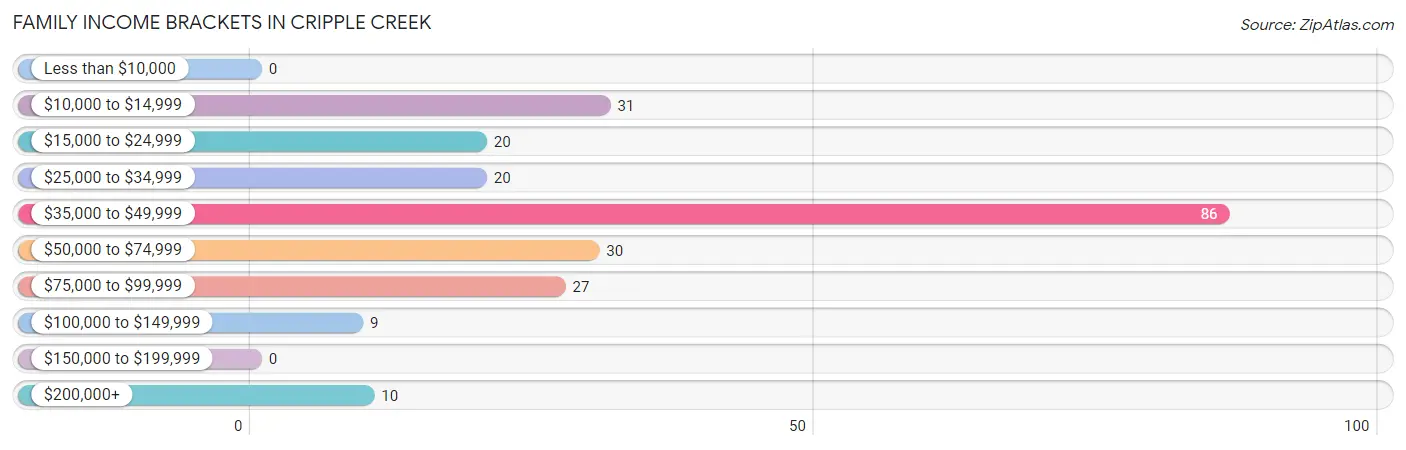
| Income Bracket | # Families | % Families |
| Less than $10,000 | 0 | 0.0% |
| $10,000 to $14,999 | 31 | 13.3% |
| $15,000 to $24,999 | 20 | 8.6% |
| $25,000 to $34,999 | 20 | 8.6% |
| $35,000 to $49,999 | 86 | 36.9% |
| $50,000 to $74,999 | 30 | 12.9% |
| $75,000 to $99,999 | 27 | 11.6% |
| $100,000 to $149,999 | 9 | 3.9% |
| $150,000 to $199,999 | 0 | 0.0% |
| $200,000+ | 10 | 4.3% |
Family Income by Famaliy Size in Cripple Creek
2-person families (152 | 65.2%) account for the highest median family income in Cripple Creek with $47,167 per family, while 2-person families (152 | 65.2%) have the highest median income of $23,584 per family member.
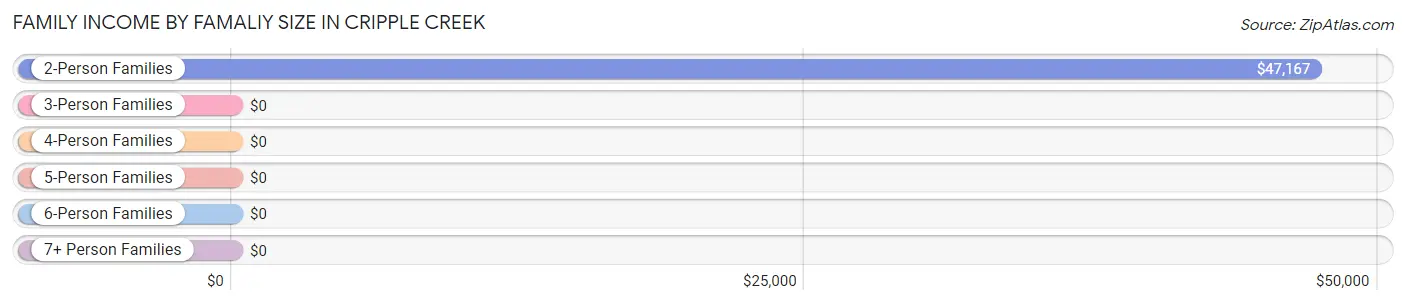
| Income Bracket | # Families | Median Income |
| 2-Person Families | 152 (65.2%) | $47,167 |
| 3-Person Families | 32 (13.7%) | $0 |
| 4-Person Families | 18 (7.7%) | $0 |
| 5-Person Families | 15 (6.4%) | $0 |
| 6-Person Families | 0 (0.0%) | $0 |
| 7+ Person Families | 16 (6.9%) | $0 |
| Total | 233 (100.0%) | $45,250 |
Family Income by Number of Earners in Cripple Creek
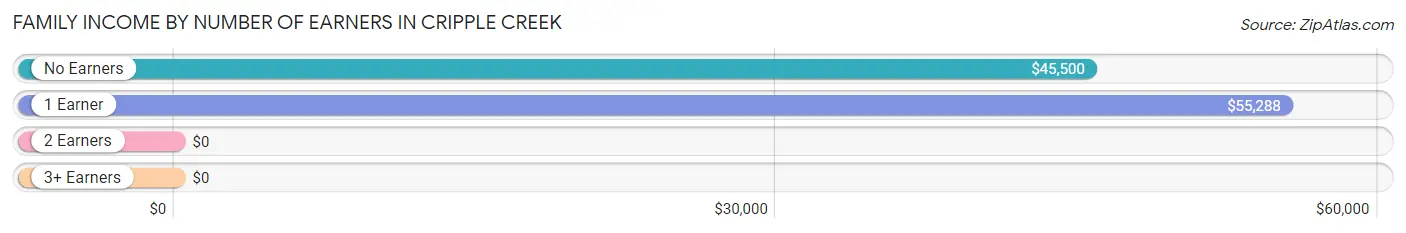
| Number of Earners | # Families | Median Income |
| No Earners | 72 (30.9%) | $45,500 |
| 1 Earner | 123 (52.8%) | $55,288 |
| 2 Earners | 23 (9.9%) | $0 |
| 3+ Earners | 15 (6.4%) | $0 |
| Total | 233 (100.0%) | $45,250 |
Household Income in Cripple Creek
Household Income Brackets in Cripple Creek
With 185 households falling in the category, the $35,000 to $49,999 income range is the most frequent in Cripple Creek, accounting for 33.9% of all households.
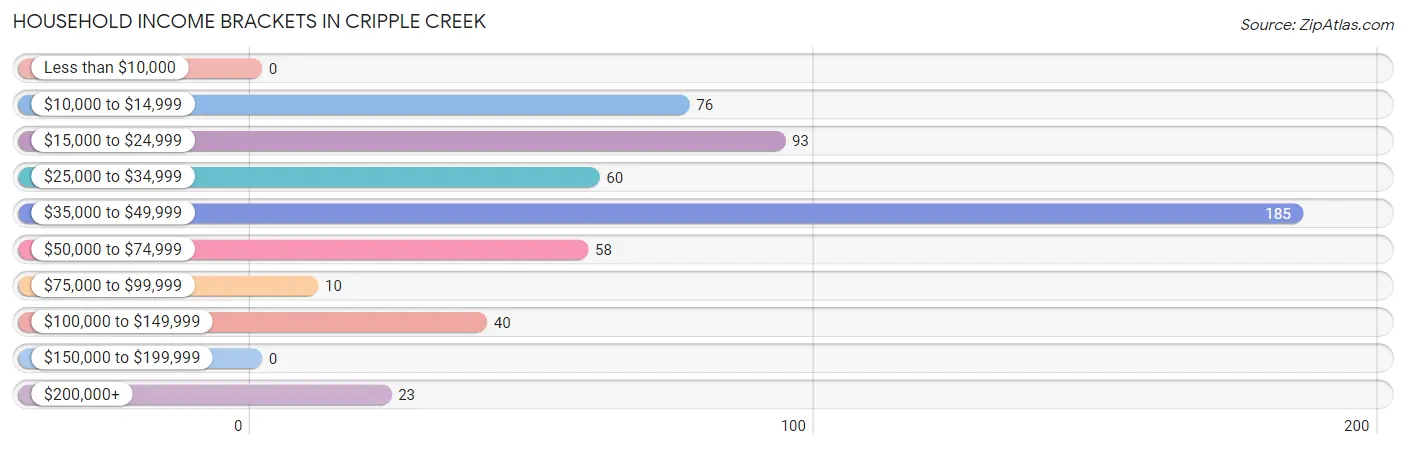
| Income Bracket | # Households | % Households |
| Less than $10,000 | 0 | 0.0% |
| $10,000 to $14,999 | 76 | 13.9% |
| $15,000 to $24,999 | 93 | 17.1% |
| $25,000 to $34,999 | 60 | 11.0% |
| $35,000 to $49,999 | 185 | 33.9% |
| $50,000 to $74,999 | 58 | 10.6% |
| $75,000 to $99,999 | 10 | 1.8% |
| $100,000 to $149,999 | 40 | 7.3% |
| $150,000 to $199,999 | 0 | 0.0% |
| $200,000+ | 23 | 4.2% |
Household Income by Householder Age in Cripple Creek
The median household income in Cripple Creek is $36,783, with the highest median household income of $45,323 found in the 65+ years age bracket for the primary householder. A total of 213 households (39.1%) fall into this category.
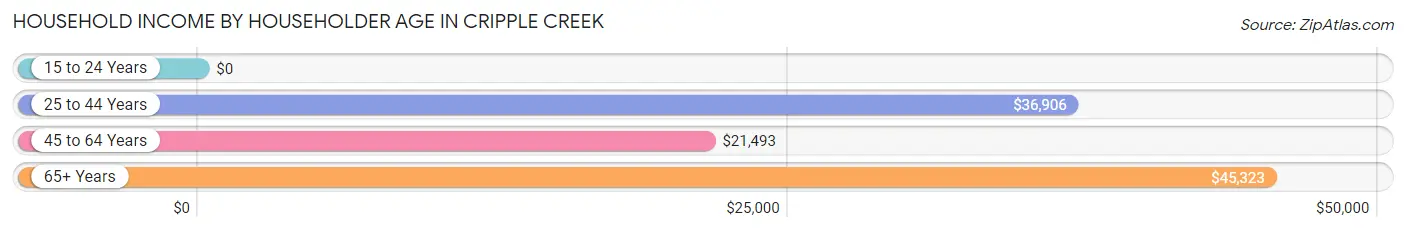
| Income Bracket | # Households | Median Income |
| 15 to 24 Years | 0 (0.0%) | $0 |
| 25 to 44 Years | 175 (32.1%) | $36,906 |
| 45 to 64 Years | 157 (28.8%) | $21,493 |
| 65+ Years | 213 (39.1%) | $45,323 |
| Total | 545 (100.0%) | $36,783 |
Poverty in Cripple Creek
Income Below Poverty by Sex and Age in Cripple Creek
With 24.7% poverty level for males and 26.5% for females among the residents of Cripple Creek, 18 to 24 year old males and 6 to 11 year old females are the most vulnerable to poverty, with 11 males (64.7%) and 38 females (100.0%) in their respective age groups living below the poverty level.
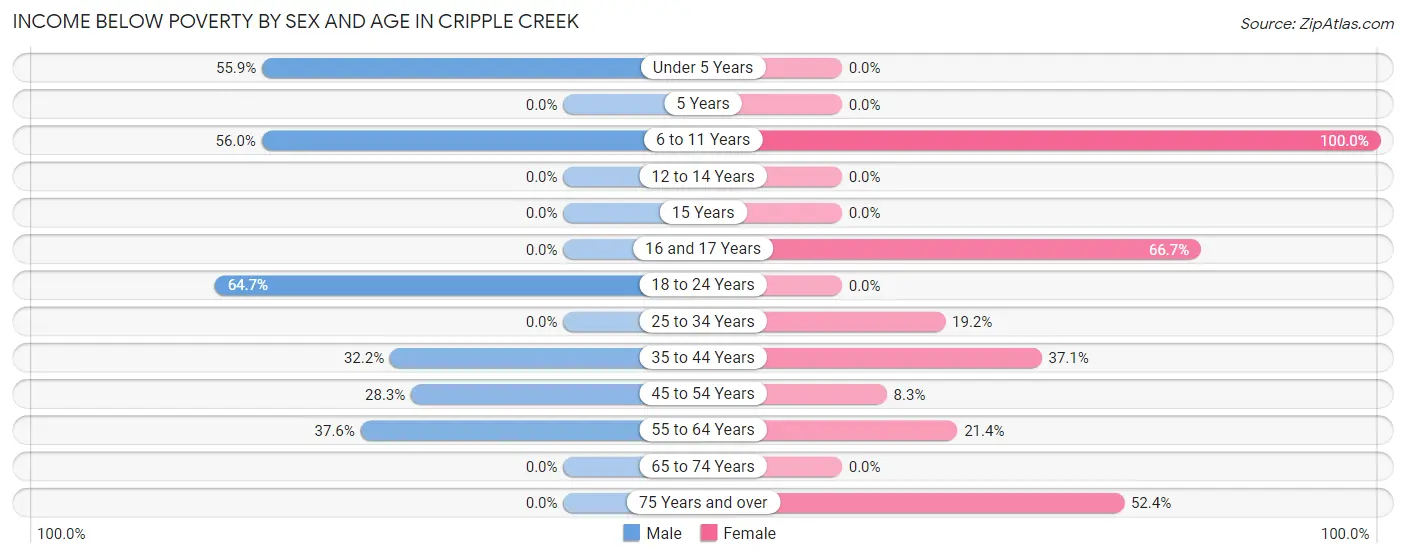
| Age Bracket | Male | Female |
| Under 5 Years | 33 (55.9%) | 0 (0.0%) |
| 5 Years | 0 (0.0%) | 0 (0.0%) |
| 6 to 11 Years | 14 (56.0%) | 38 (100.0%) |
| 12 to 14 Years | 0 (0.0%) | 0 (0.0%) |
| 15 Years | 0 (0.0%) | 0 (0.0%) |
| 16 and 17 Years | 0 (0.0%) | 22 (66.7%) |
| 18 to 24 Years | 11 (64.7%) | 0 (0.0%) |
| 25 to 34 Years | 0 (0.0%) | 14 (19.2%) |
| 35 to 44 Years | 28 (32.2%) | 33 (37.1%) |
| 45 to 54 Years | 13 (28.3%) | 4 (8.3%) |
| 55 to 64 Years | 35 (37.6%) | 9 (21.4%) |
| 65 to 74 Years | 0 (0.0%) | 0 (0.0%) |
| 75 Years and over | 0 (0.0%) | 11 (52.4%) |
| Total | 134 (24.7%) | 131 (26.5%) |
Income Above Poverty by Sex and Age in Cripple Creek
According to the poverty statistics in Cripple Creek, males aged 12 to 14 years and females aged 5 years are the age groups that are most secure financially, with 100.0% of males and 100.0% of females in these age groups living above the poverty line.
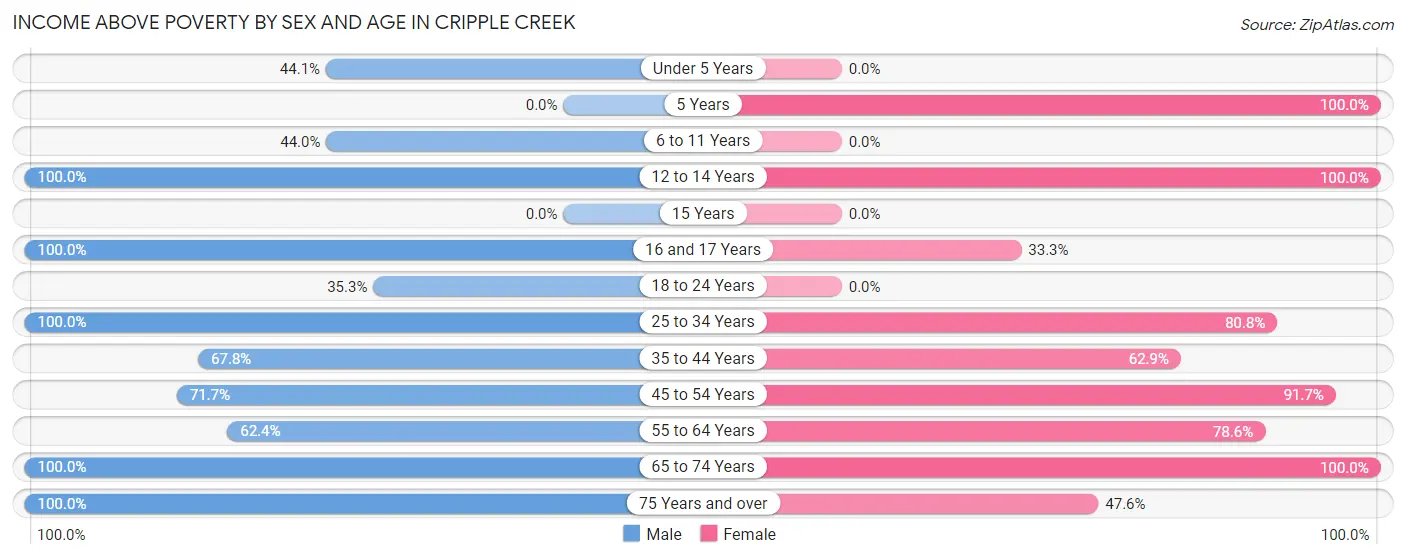
| Age Bracket | Male | Female |
| Under 5 Years | 26 (44.1%) | 0 (0.0%) |
| 5 Years | 0 (0.0%) | 12 (100.0%) |
| 6 to 11 Years | 11 (44.0%) | 0 (0.0%) |
| 12 to 14 Years | 9 (100.0%) | 22 (100.0%) |
| 15 Years | 0 (0.0%) | 0 (0.0%) |
| 16 and 17 Years | 12 (100.0%) | 11 (33.3%) |
| 18 to 24 Years | 6 (35.3%) | 0 (0.0%) |
| 25 to 34 Years | 23 (100.0%) | 59 (80.8%) |
| 35 to 44 Years | 59 (67.8%) | 56 (62.9%) |
| 45 to 54 Years | 33 (71.7%) | 44 (91.7%) |
| 55 to 64 Years | 58 (62.4%) | 33 (78.6%) |
| 65 to 74 Years | 154 (100.0%) | 117 (100.0%) |
| 75 Years and over | 17 (100.0%) | 10 (47.6%) |
| Total | 408 (75.3%) | 364 (73.5%) |
Income Below Poverty Among Married-Couple Families in Cripple Creek
The poverty statistics for married-couple families in Cripple Creek show that 18.4% or 31 of the total 168 families live below the poverty line. Families with 5 or more children have the highest poverty rate of 100.0%, comprising of 16 families. On the other hand, families with no children have the lowest poverty rate of 0.0%, which includes 0 families.
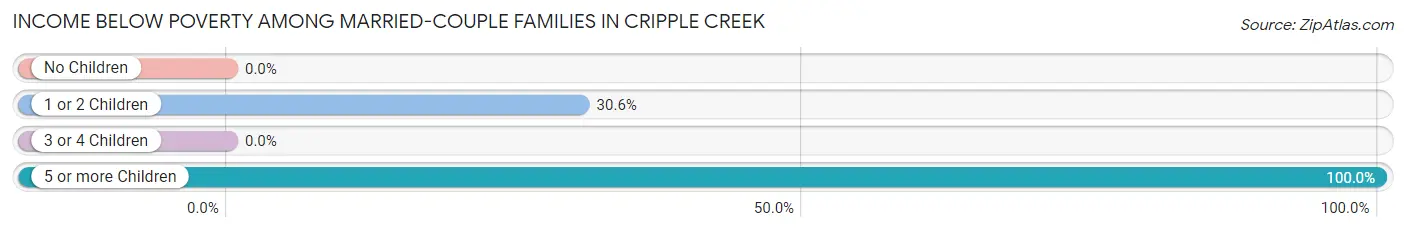
| Children | Above Poverty | Below Poverty |
| No Children | 103 (100.0%) | 0 (0.0%) |
| 1 or 2 Children | 34 (69.4%) | 15 (30.6%) |
| 3 or 4 Children | 0 (0.0%) | 0 (0.0%) |
| 5 or more Children | 0 (0.0%) | 16 (100.0%) |
| Total | 137 (81.6%) | 31 (18.4%) |
Income Below Poverty Among Single-Parent Households in Cripple Creek
| Children | Single Father | Single Mother |
| No Children | 0 (0.0%) | 0 (0.0%) |
| 1 or 2 Children | 0 (0.0%) | 0 (0.0%) |
| 3 or 4 Children | 0 (0.0%) | 0 (0.0%) |
| 5 or more Children | 0 (0.0%) | 0 (0.0%) |
| Total | 0 (0.0%) | 0 (0.0%) |
Income Below Poverty Among Married-Couple vs Single-Parent Households in Cripple Creek
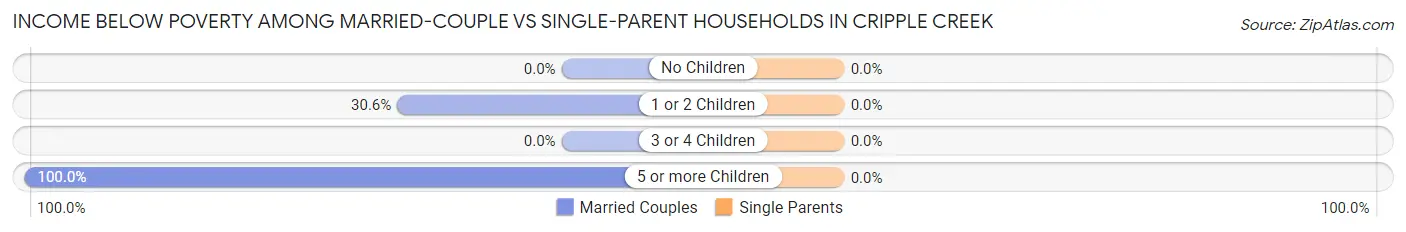
| Children | Married-Couple Families | Single-Parent Households |
| No Children | 0 (0.0%) | 0 (0.0%) |
| 1 or 2 Children | 15 (30.6%) | 0 (0.0%) |
| 3 or 4 Children | 0 (0.0%) | 0 (0.0%) |
| 5 or more Children | 16 (100.0%) | 0 (0.0%) |
| Total | 31 (18.4%) | 0 (0.0%) |
Race in Cripple Creek
The most populous races in Cripple Creek are White / Caucasian (968 | 88.6%), Hispanic or Latino (114 | 10.4%), and Two or more Races (100 | 9.1%).
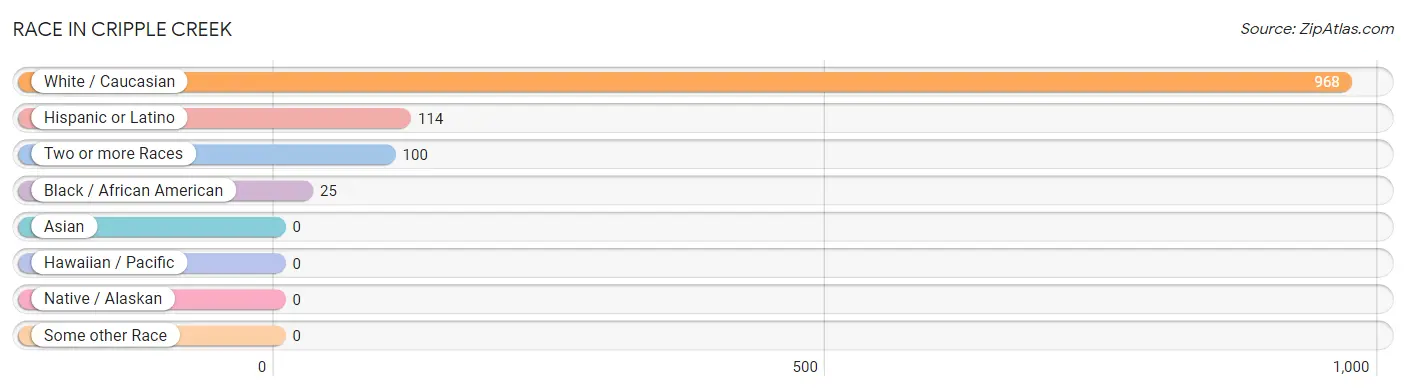
| Race | # Population | % Population |
| Asian | 0 | 0.0% |
| Black / African American | 25 | 2.3% |
| Hawaiian / Pacific | 0 | 0.0% |
| Hispanic or Latino | 114 | 10.4% |
| Native / Alaskan | 0 | 0.0% |
| White / Caucasian | 968 | 88.6% |
| Two or more Races | 100 | 9.1% |
| Some other Race | 0 | 0.0% |
| Total | 1,093 | 100.0% |
Ancestry in Cripple Creek
The most populous ancestries reported in Cripple Creek are German (230 | 21.0%), Irish (123 | 11.3%), Mexican (67 | 6.1%), English (55 | 5.0%), and Scottish (52 | 4.8%), together accounting for 48.2% of all Cripple Creek residents.
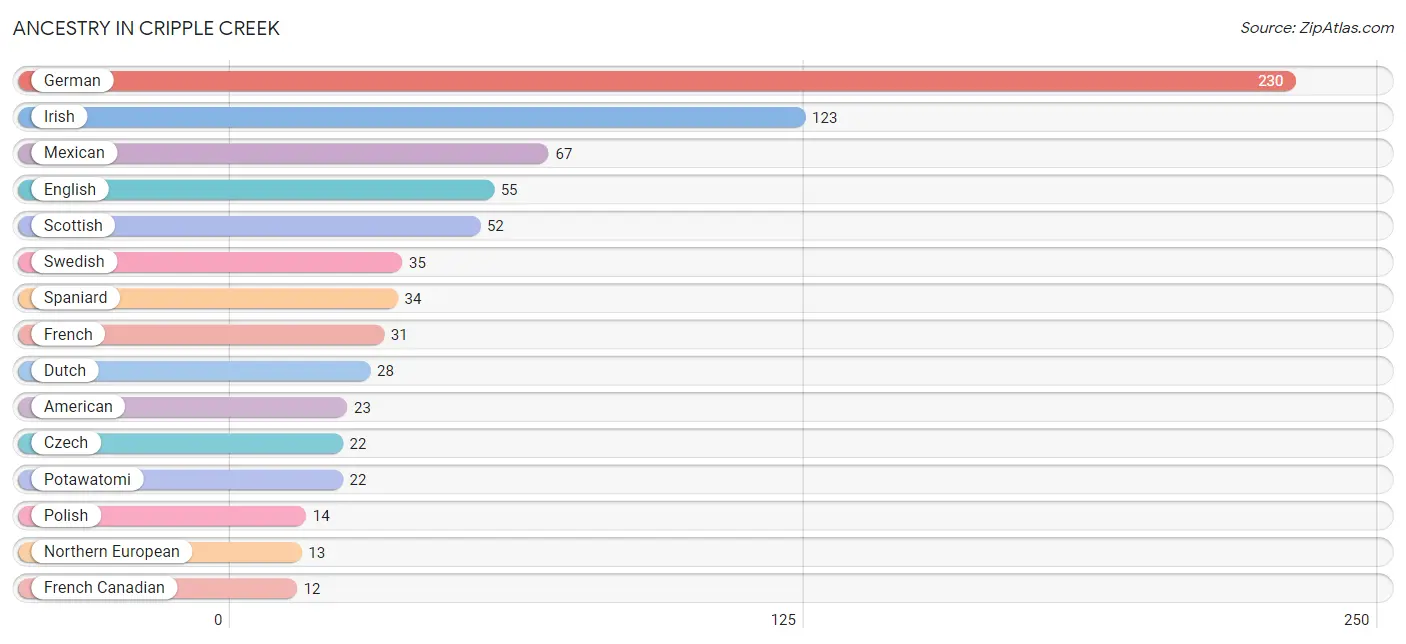
| Ancestry | # Population | % Population |
| American | 23 | 2.1% |
| British | 9 | 0.8% |
| Czech | 22 | 2.0% |
| Danish | 11 | 1.0% |
| Dutch | 28 | 2.6% |
| English | 55 | 5.0% |
| French | 31 | 2.8% |
| French Canadian | 12 | 1.1% |
| German | 230 | 21.0% |
| Irish | 123 | 11.3% |
| Italian | 10 | 0.9% |
| Lithuanian | 10 | 0.9% |
| Mexican | 67 | 6.1% |
| Northern European | 13 | 1.2% |
| Norwegian | 7 | 0.6% |
| Polish | 14 | 1.3% |
| Potawatomi | 22 | 2.0% |
| Scotch-Irish | 5 | 0.5% |
| Scottish | 52 | 4.8% |
| Spaniard | 34 | 3.1% |
| Subsaharan African | 6 | 0.5% |
| Swedish | 35 | 3.2% | View All 22 Rows |
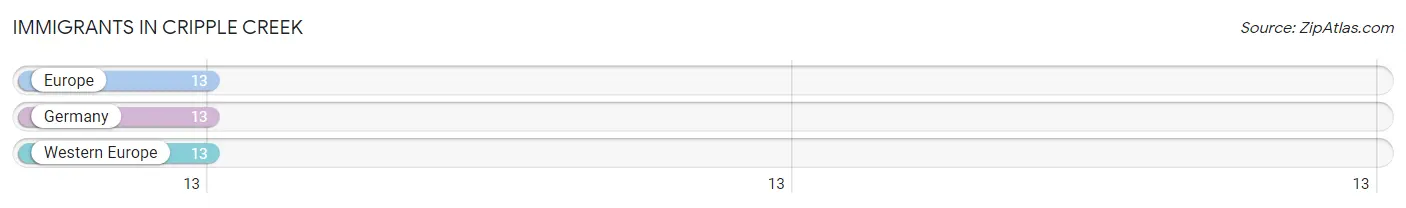
Immigrants in Cripple Creek
The most numerous immigrant groups reported in Cripple Creek came from Europe (13 | 1.2%), Germany (13 | 1.2%), and Western Europe (13 | 1.2%), together accounting for 3.6% of all Cripple Creek residents.
| Immigration Origin | # Population | % Population |
| Europe | 13 | 1.2% |
| Germany | 13 | 1.2% |
| Western Europe | 13 | 1.2% | View All 3 Rows |
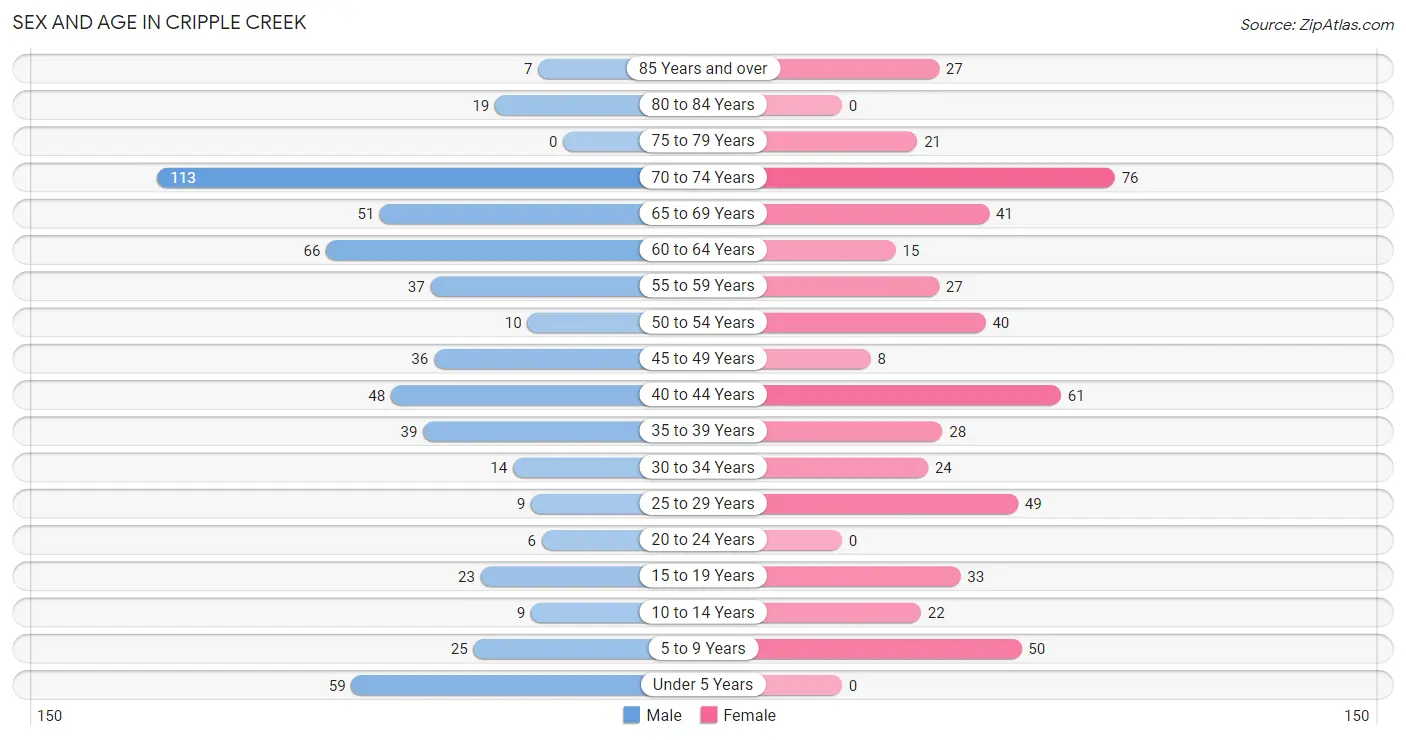
Sex and Age in Cripple Creek
Sex and Age in Cripple Creek
The most populous age groups in Cripple Creek are 70 to 74 Years (113 | 19.8%) for men and 70 to 74 Years (76 | 14.6%) for women.
| Age Bracket | Male | Female |
| Under 5 Years | 59 (10.3%) | 0 (0.0%) |
| 5 to 9 Years | 25 (4.4%) | 50 (9.6%) |
| 10 to 14 Years | 9 (1.6%) | 22 (4.2%) |
| 15 to 19 Years | 23 (4.0%) | 33 (6.3%) |
| 20 to 24 Years | 6 (1.1%) | 0 (0.0%) |
| 25 to 29 Years | 9 (1.6%) | 49 (9.4%) |
| 30 to 34 Years | 14 (2.5%) | 24 (4.6%) |
| 35 to 39 Years | 39 (6.8%) | 28 (5.4%) |
| 40 to 44 Years | 48 (8.4%) | 61 (11.7%) |
| 45 to 49 Years | 36 (6.3%) | 8 (1.5%) |
| 50 to 54 Years | 10 (1.8%) | 40 (7.7%) |
| 55 to 59 Years | 37 (6.5%) | 27 (5.2%) |
| 60 to 64 Years | 66 (11.6%) | 15 (2.9%) |
| 65 to 69 Years | 51 (8.9%) | 41 (7.9%) |
| 70 to 74 Years | 113 (19.8%) | 76 (14.6%) |
| 75 to 79 Years | 0 (0.0%) | 21 (4.0%) |
| 80 to 84 Years | 19 (3.3%) | 0 (0.0%) |
| 85 Years and over | 7 (1.2%) | 27 (5.2%) |
| Total | 571 (100.0%) | 522 (100.0%) |
Families and Households in Cripple Creek
Median Family Size in Cripple Creek
The median family size in Cripple Creek is 2.77 persons per family, with single female/mother families (39 | 16.7%) accounting for the largest median family size of 3 persons per family. On the other hand, single male/father families (26 | 11.2%) represent the smallest median family size with 1.81 persons per family.
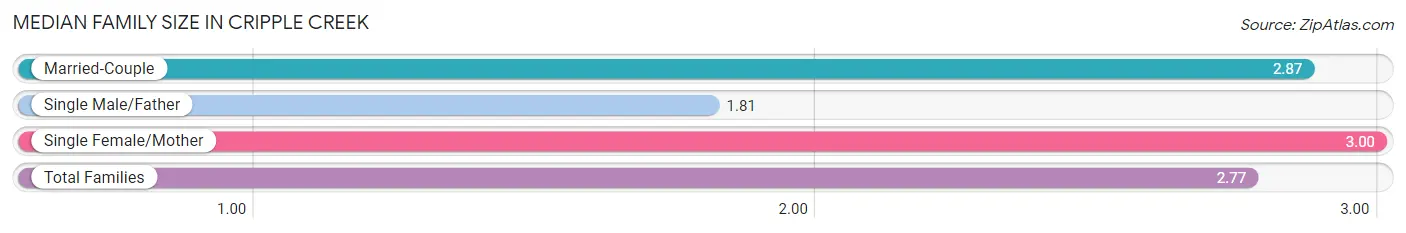
| Family Type | # Families | Family Size |
| Married-Couple | 168 (72.1%) | 2.87 |
| Single Male/Father | 26 (11.2%) | 1.81 |
| Single Female/Mother | 39 (16.7%) | 3.00 |
| Total Families | 233 (100.0%) | 2.77 |
Median Household Size in Cripple Creek
The median household size in Cripple Creek is 1.90 persons per household, with single female/mother households (39 | 7.2%) accounting for the largest median household size of 3 persons per household. non-family households (312 | 57.3%) represent the smallest median household size with 1.22 persons per household.
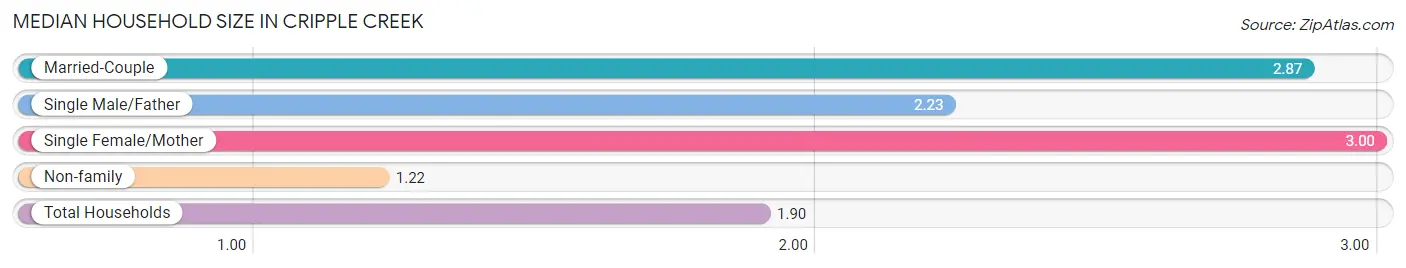
| Household Type | # Households | Household Size |
| Married-Couple | 168 (30.8%) | 2.87 |
| Single Male/Father | 26 (4.8%) | 2.23 |
| Single Female/Mother | 39 (7.2%) | 3.00 |
| Non-family | 312 (57.3%) | 1.22 |
| Total Households | 545 (100.0%) | 1.90 |
Household Size by Marriage Status in Cripple Creek
Out of a total of 545 households in Cripple Creek, 233 (42.7%) are family households, while 312 (57.3%) are nonfamily households. The most numerous type of family households are 2-person households, comprising 135, and the most common type of nonfamily households are 1-person households, comprising 232.
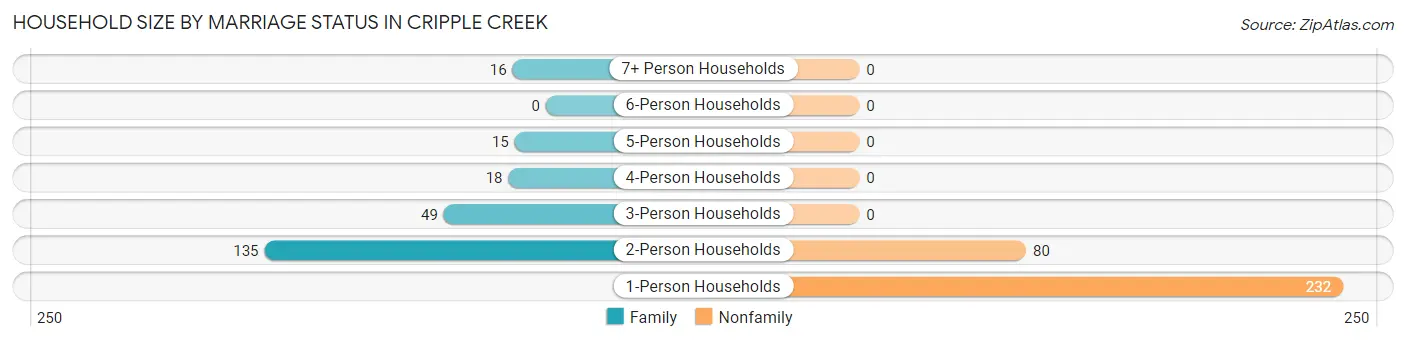
| Household Size | Family Households | Nonfamily Households |
| 1-Person Households | - | 232 (42.6%) |
| 2-Person Households | 135 (24.8%) | 80 (14.7%) |
| 3-Person Households | 49 (9.0%) | 0 (0.0%) |
| 4-Person Households | 18 (3.3%) | 0 (0.0%) |
| 5-Person Households | 15 (2.8%) | 0 (0.0%) |
| 6-Person Households | 0 (0.0%) | 0 (0.0%) |
| 7+ Person Households | 16 (2.9%) | 0 (0.0%) |
| Total | 233 (42.7%) | 312 (57.3%) |
Female Fertility in Cripple Creek
Fertility by Age in Cripple Creek
Average fertility rate in Cripple Creek is 48.0 births per 1,000 women. Women in the age bracket of 20 to 34 years have the highest fertility rate with 137.0 births per 1,000 women. Women in the age bracket of 20 to 34 years acount for 100.0% of all women with births.
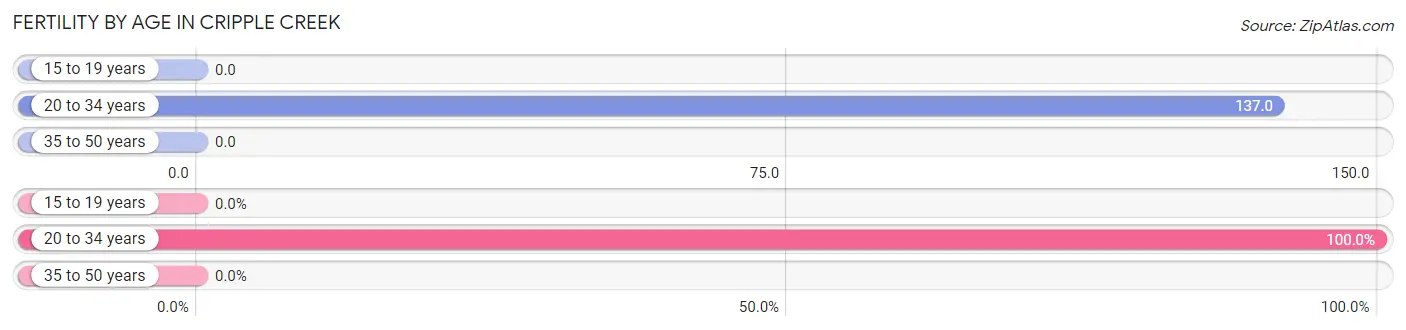
| Age Bracket | Women with Births | Births / 1,000 Women |
| 15 to 19 years | 0 (0.0%) | 0.0 |
| 20 to 34 years | 10 (100.0%) | 137.0 |
| 35 to 50 years | 0 (0.0%) | 0.0 |
| Total | 10 (100.0%) | 48.0 |
Fertility by Age by Marriage Status in Cripple Creek
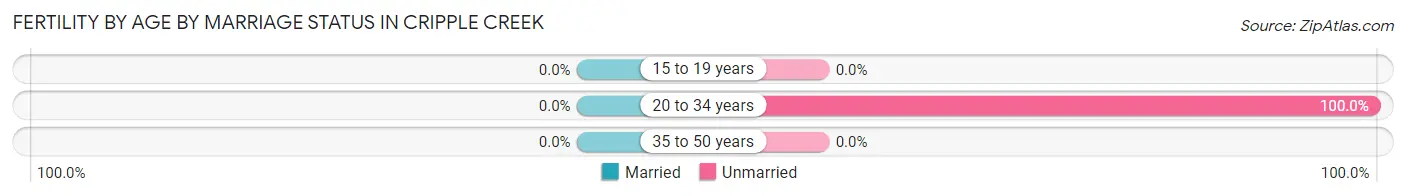
| Age Bracket | Married | Unmarried |
| 15 to 19 years | 0 (0.0%) | 0 (0.0%) |
| 20 to 34 years | 0 (0.0%) | 10 (100.0%) |
| 35 to 50 years | 0 (0.0%) | 0 (0.0%) |
| Total | 0 (0.0%) | 10 (100.0%) |
Fertility by Education in Cripple Creek
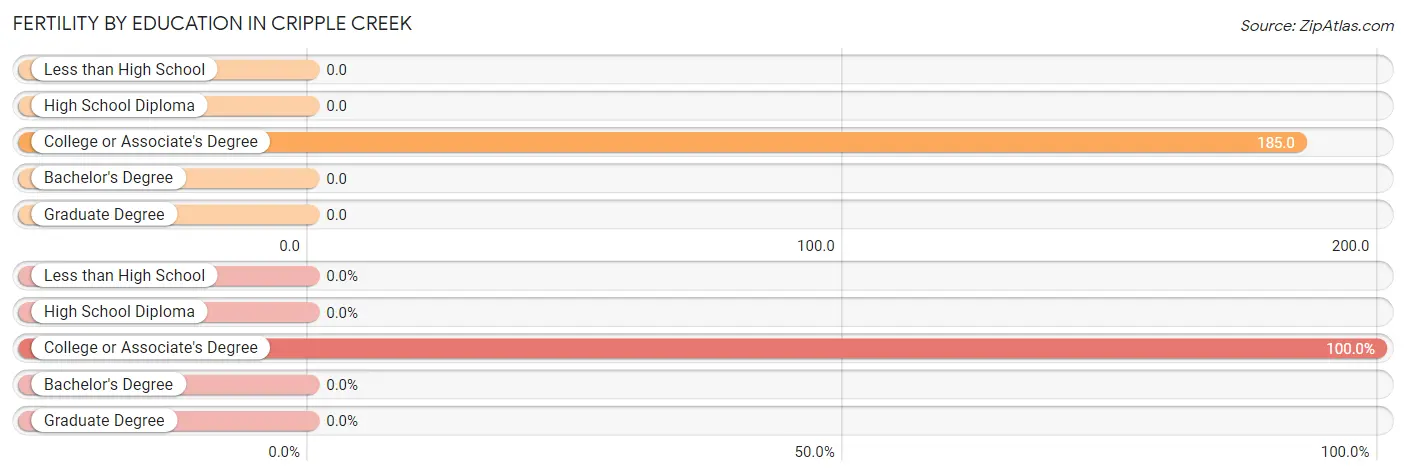
| Educational Attainment | Women with Births | Births / 1,000 Women |
| Less than High School | 0 (0.0%) | 0.0 |
| High School Diploma | 0 (0.0%) | 0.0 |
| College or Associate's Degree | 10 (100.0%) | 185.0 |
| Bachelor's Degree | 0 (0.0%) | 0.0 |
| Graduate Degree | 0 (0.0%) | 0.0 |
| Total | 10 (100.0%) | 48.0 |
Fertility by Education by Marriage Status in Cripple Creek
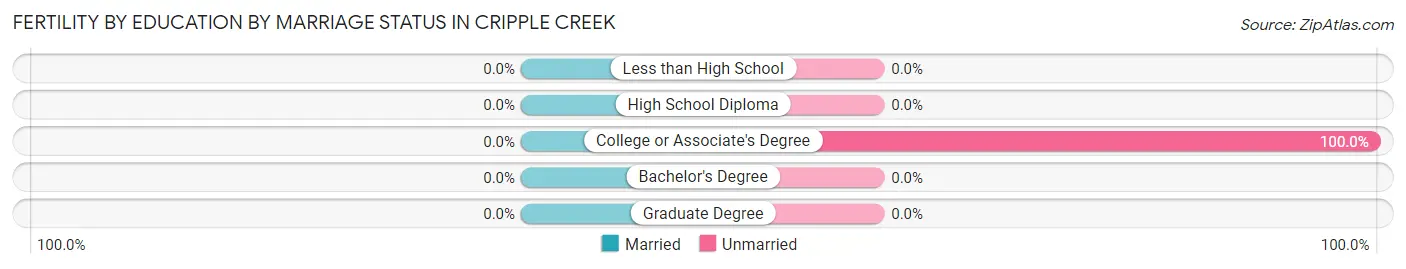
| Educational Attainment | Married | Unmarried |
| Less than High School | 0 (0.0%) | 0 (0.0%) |
| High School Diploma | 0 (0.0%) | 0 (0.0%) |
| College or Associate's Degree | 0 (0.0%) | 10 (100.0%) |
| Bachelor's Degree | 0 (0.0%) | 0 (0.0%) |
| Graduate Degree | 0 (0.0%) | 0 (0.0%) |
| Total | 0 (0.0%) | 10 (100.0%) |
Employment Characteristics in Cripple Creek
Employment by Class of Employer in Cripple Creek
Among the 347 employed individuals in Cripple Creek, private company employees (247 | 71.2%), local government employees (42 | 12.1%), and self-employed (not incorporated) (40 | 11.5%) make up the most common classes of employment.
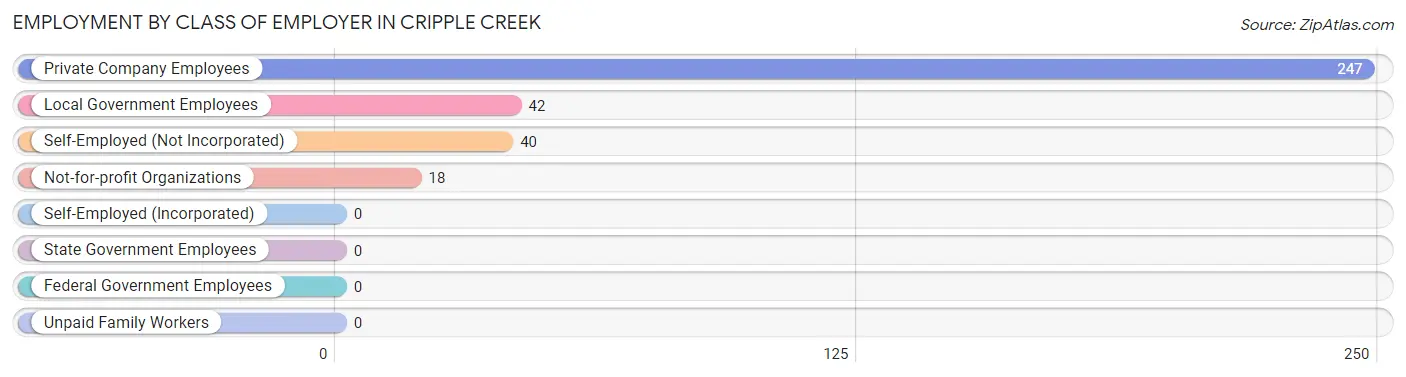
| Employer Class | # Employees | % Employees |
| Private Company Employees | 247 | 71.2% |
| Self-Employed (Incorporated) | 0 | 0.0% |
| Self-Employed (Not Incorporated) | 40 | 11.5% |
| Not-for-profit Organizations | 18 | 5.2% |
| Local Government Employees | 42 | 12.1% |
| State Government Employees | 0 | 0.0% |
| Federal Government Employees | 0 | 0.0% |
| Unpaid Family Workers | 0 | 0.0% |
| Total | 347 | 100.0% |
Employment Status by Age in Cripple Creek
According to the labor force statistics for Cripple Creek, out of the total population over 16 years of age (928), 40.8% or 379 individuals are in the labor force, with 8.4% or 32 of them unemployed. The age group with the highest labor force participation rate is 25 to 29 years, with 100.0% or 58 individuals in the labor force. Within the labor force, the 35 to 44 years age range has the highest percentage of unemployed individuals, with 19.3% or 28 of them being unemployed.
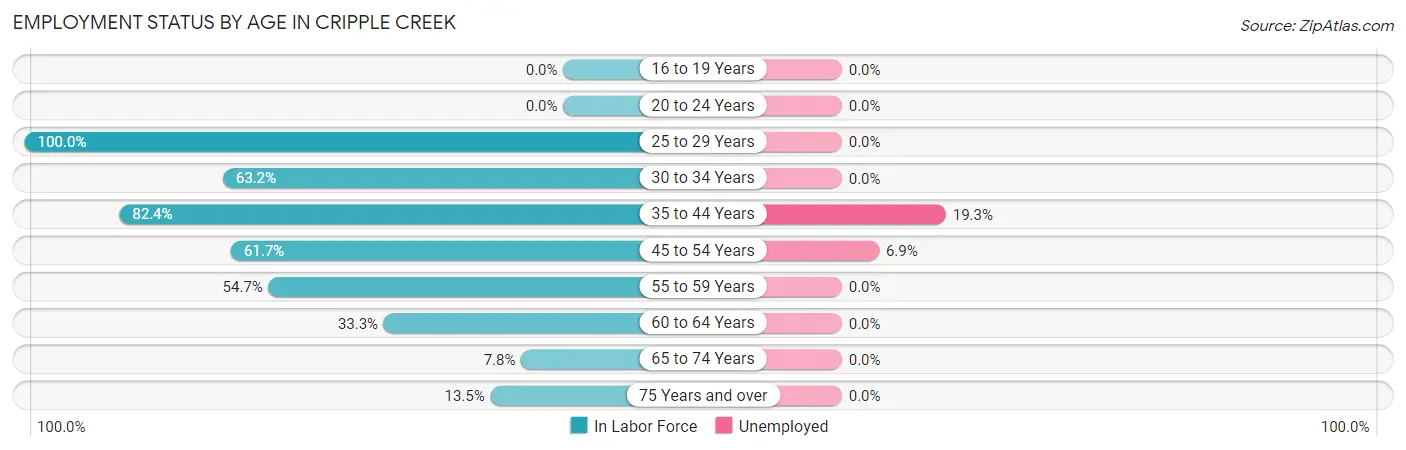
| Age Bracket | In Labor Force | Unemployed |
| 16 to 19 Years | 0 (0.0%) | 0 (0.0%) |
| 20 to 24 Years | 0 (0.0%) | 0 (0.0%) |
| 25 to 29 Years | 58 (100.0%) | 0 (0.0%) |
| 30 to 34 Years | 24 (63.2%) | 0 (0.0%) |
| 35 to 44 Years | 145 (82.4%) | 28 (19.3%) |
| 45 to 54 Years | 58 (61.7%) | 4 (6.9%) |
| 55 to 59 Years | 35 (54.7%) | 0 (0.0%) |
| 60 to 64 Years | 27 (33.3%) | 0 (0.0%) |
| 65 to 74 Years | 22 (7.8%) | 0 (0.0%) |
| 75 Years and over | 10 (13.5%) | 0 (0.0%) |
| Total | 379 (40.8%) | 32 (8.4%) |
Employment Status by Educational Attainment in Cripple Creek
According to labor force statistics for Cripple Creek, 67.9% of individuals (347) out of the total population between 25 and 64 years of age (511) are in the labor force, with 9.2% or 32 of them being unemployed. The group with the highest labor force participation rate are those with the educational attainment of less than high school, with 100.0% or 4 individuals in the labor force. Within the labor force, individuals with bachelor's degree or higher education have the highest percentage of unemployment, with 34.3% or 12 of them being unemployed.
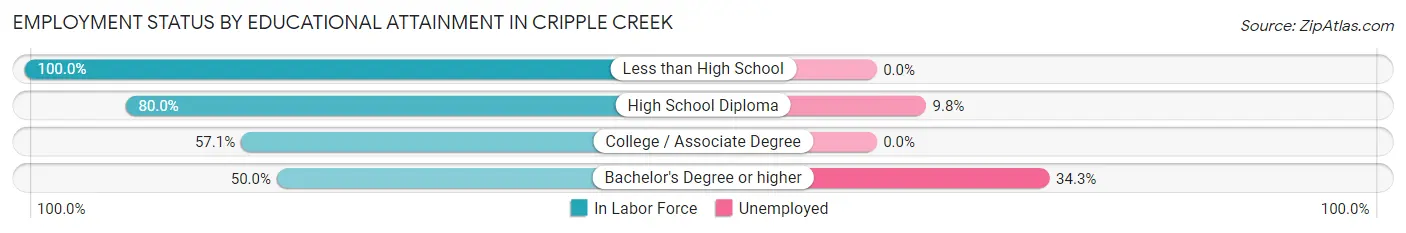
| Educational Attainment | In Labor Force | Unemployed |
| Less than High School | 4 (100.0%) | 0 (0.0%) |
| High School Diploma | 204 (80.0%) | 25 (9.8%) |
| College / Associate Degree | 104 (57.1%) | 0 (0.0%) |
| Bachelor's Degree or higher | 35 (50.0%) | 24 (34.3%) |
| Total | 347 (67.9%) | 47 (9.2%) |
Employment Occupations by Sex in Cripple Creek
Management, Business, Science and Arts Occupations
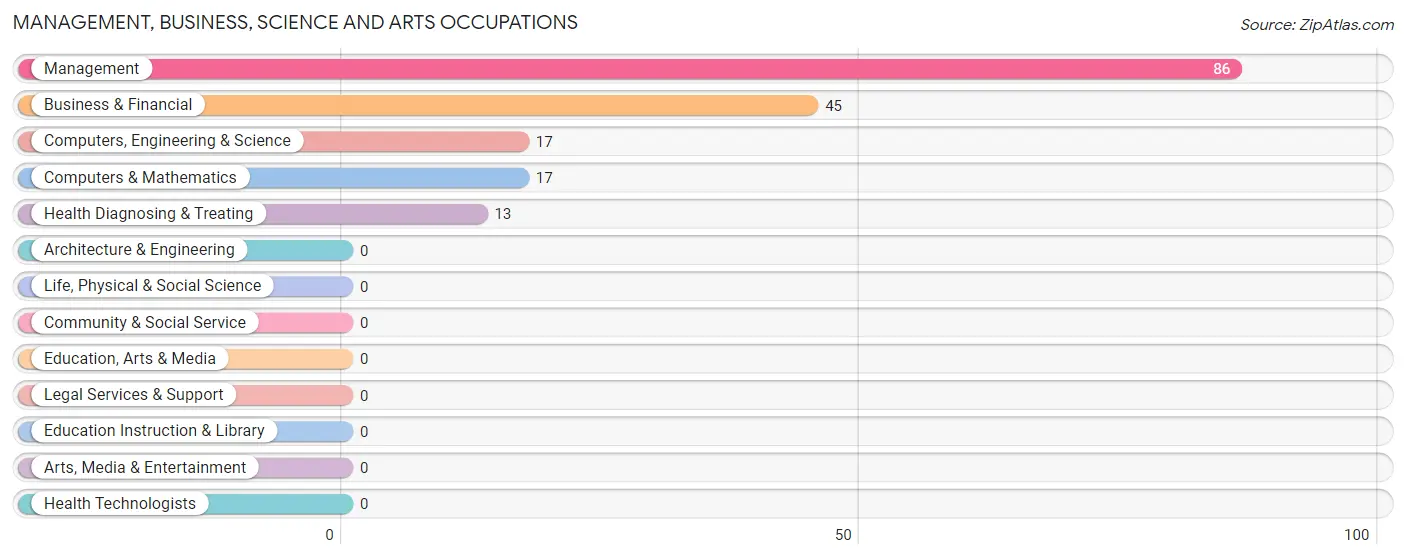
The most common Management, Business, Science and Arts occupations in Cripple Creek are Management (86 | 24.8%), Business & Financial (45 | 13.0%), Computers, Engineering & Science (17 | 4.9%), Computers & Mathematics (17 | 4.9%), and Health Diagnosing & Treating (13 | 3.7%).
Management, Business, Science and Arts Occupations by Sex
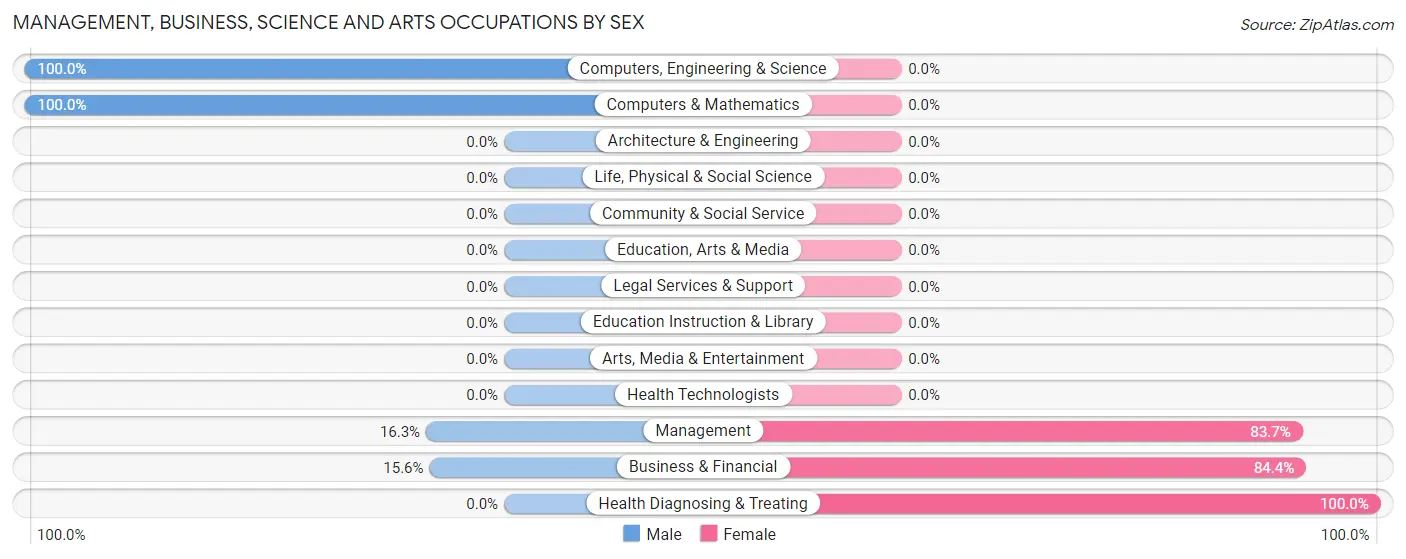
Within the Management, Business, Science and Arts occupations in Cripple Creek, the most male-oriented occupations are Computers, Engineering & Science (100.0%), Computers & Mathematics (100.0%), and Management (16.3%), while the most female-oriented occupations are Health Diagnosing & Treating (100.0%), Business & Financial (84.4%), and Management (83.7%).
| Occupation | Male | Female |
| Management | 14 (16.3%) | 72 (83.7%) |
| Business & Financial | 7 (15.6%) | 38 (84.4%) |
| Computers, Engineering & Science | 17 (100.0%) | 0 (0.0%) |
| Computers & Mathematics | 17 (100.0%) | 0 (0.0%) |
| Architecture & Engineering | 0 (0.0%) | 0 (0.0%) |
| Life, Physical & Social Science | 0 (0.0%) | 0 (0.0%) |
| Community & Social Service | 0 (0.0%) | 0 (0.0%) |
| Education, Arts & Media | 0 (0.0%) | 0 (0.0%) |
| Legal Services & Support | 0 (0.0%) | 0 (0.0%) |
| Education Instruction & Library | 0 (0.0%) | 0 (0.0%) |
| Arts, Media & Entertainment | 0 (0.0%) | 0 (0.0%) |
| Health Diagnosing & Treating | 0 (0.0%) | 13 (100.0%) |
| Health Technologists | 0 (0.0%) | 0 (0.0%) |
| Total (Category) | 38 (23.6%) | 123 (76.4%) |
| Total (Overall) | 116 (33.4%) | 231 (66.6%) |
Services Occupations
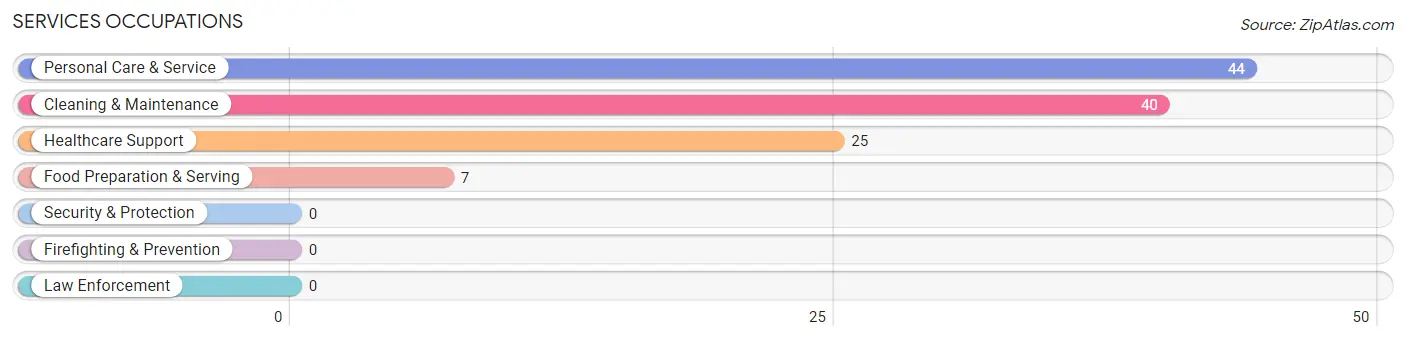
The most common Services occupations in Cripple Creek are Personal Care & Service (44 | 12.7%), Cleaning & Maintenance (40 | 11.5%), Healthcare Support (25 | 7.2%), and Food Preparation & Serving (7 | 2.0%).
Services Occupations by Sex
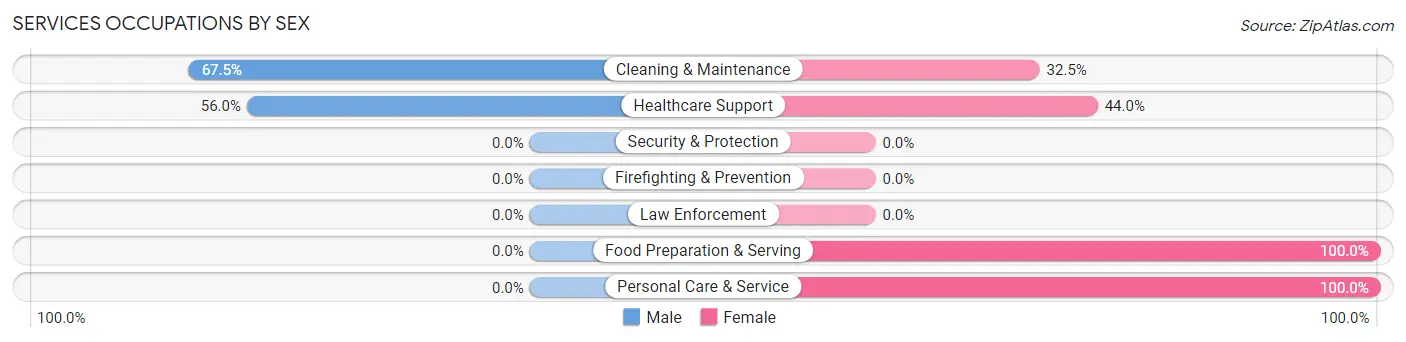
Within the Services occupations in Cripple Creek, the most male-oriented occupations are Cleaning & Maintenance (67.5%), and Healthcare Support (56.0%), while the most female-oriented occupations are Food Preparation & Serving (100.0%), Personal Care & Service (100.0%), and Healthcare Support (44.0%).
| Occupation | Male | Female |
| Healthcare Support | 14 (56.0%) | 11 (44.0%) |
| Security & Protection | 0 (0.0%) | 0 (0.0%) |
| Firefighting & Prevention | 0 (0.0%) | 0 (0.0%) |
| Law Enforcement | 0 (0.0%) | 0 (0.0%) |
| Food Preparation & Serving | 0 (0.0%) | 7 (100.0%) |
| Cleaning & Maintenance | 27 (67.5%) | 13 (32.5%) |
| Personal Care & Service | 0 (0.0%) | 44 (100.0%) |
| Total (Category) | 41 (35.3%) | 75 (64.7%) |
| Total (Overall) | 116 (33.4%) | 231 (66.6%) |
Sales and Office Occupations
The most common Sales and Office occupations in Cripple Creek are Office & Administration (19 | 5.5%), and Sales & Related (10 | 2.9%).
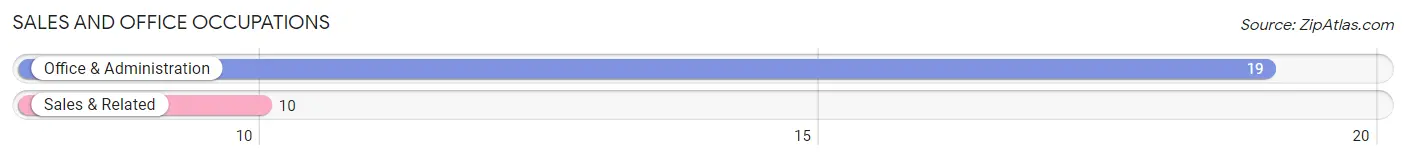
Sales and Office Occupations by Sex
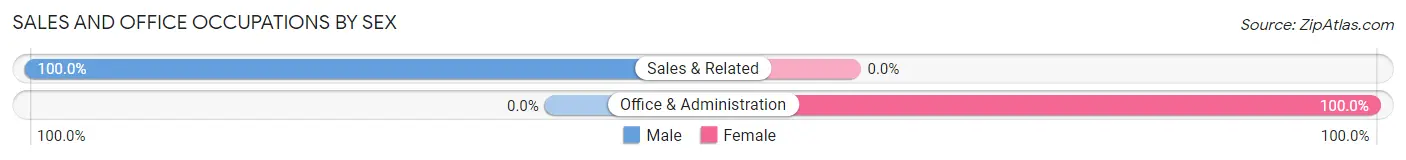
| Occupation | Male | Female |
| Sales & Related | 10 (100.0%) | 0 (0.0%) |
| Office & Administration | 0 (0.0%) | 19 (100.0%) |
| Total (Category) | 10 (34.5%) | 19 (65.5%) |
| Total (Overall) | 116 (33.4%) | 231 (66.6%) |
Natural Resources, Construction and Maintenance Occupations
The most common Natural Resources, Construction and Maintenance occupations in Cripple Creek are , and Construction & Extraction (17 | 4.9%).
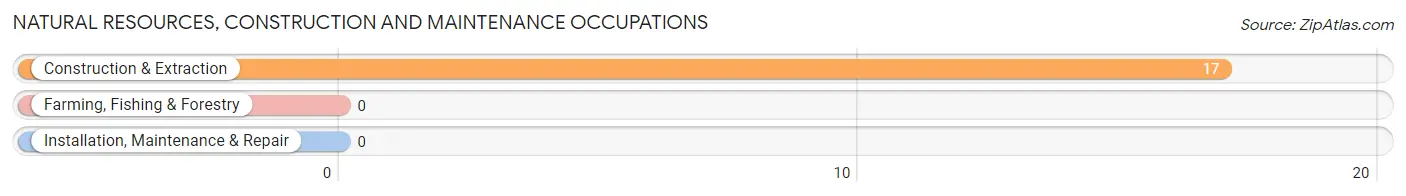
Natural Resources, Construction and Maintenance Occupations by Sex
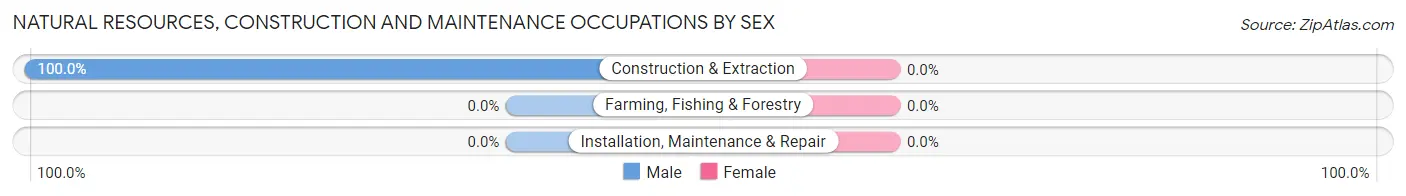
| Occupation | Male | Female |
| Farming, Fishing & Forestry | 0 (0.0%) | 0 (0.0%) |
| Construction & Extraction | 17 (100.0%) | 0 (0.0%) |
| Installation, Maintenance & Repair | 0 (0.0%) | 0 (0.0%) |
| Total (Category) | 17 (100.0%) | 0 (0.0%) |
| Total (Overall) | 116 (33.4%) | 231 (66.6%) |
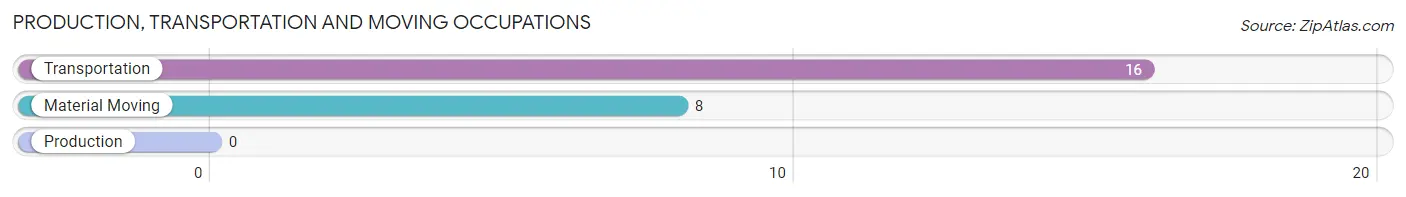
Production, Transportation and Moving Occupations
The most common Production, Transportation and Moving occupations in Cripple Creek are Transportation (16 | 4.6%), and Material Moving (8 | 2.3%).
Production, Transportation and Moving Occupations by Sex
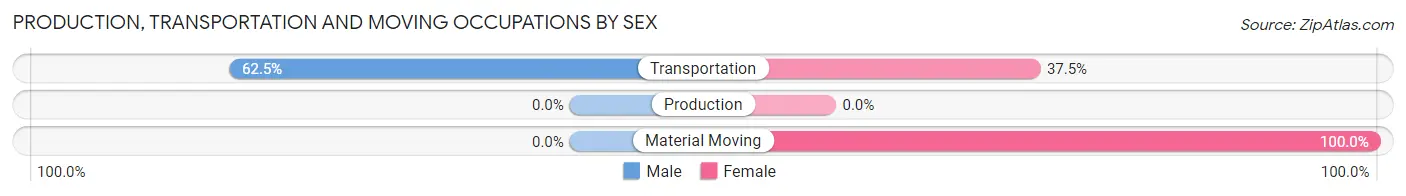
| Occupation | Male | Female |
| Production | 0 (0.0%) | 0 (0.0%) |
| Transportation | 10 (62.5%) | 6 (37.5%) |
| Material Moving | 0 (0.0%) | 8 (100.0%) |
| Total (Category) | 10 (41.7%) | 14 (58.3%) |
| Total (Overall) | 116 (33.4%) | 231 (66.6%) |
Employment Industries by Sex in Cripple Creek
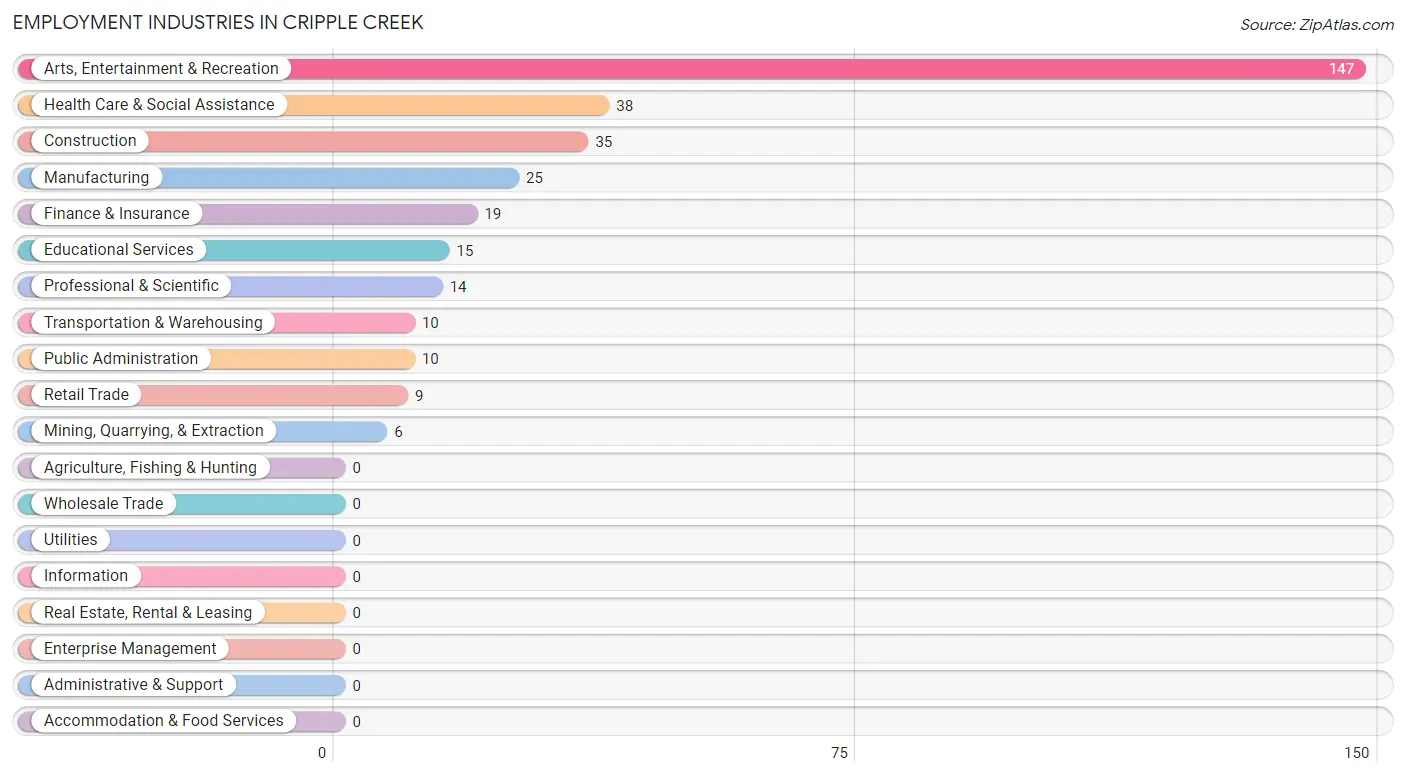
Employment Industries in Cripple Creek
The major employment industries in Cripple Creek include Arts, Entertainment & Recreation (147 | 42.4%), Health Care & Social Assistance (38 | 11.0%), Construction (35 | 10.1%), Manufacturing (25 | 7.2%), and Finance & Insurance (19 | 5.5%).
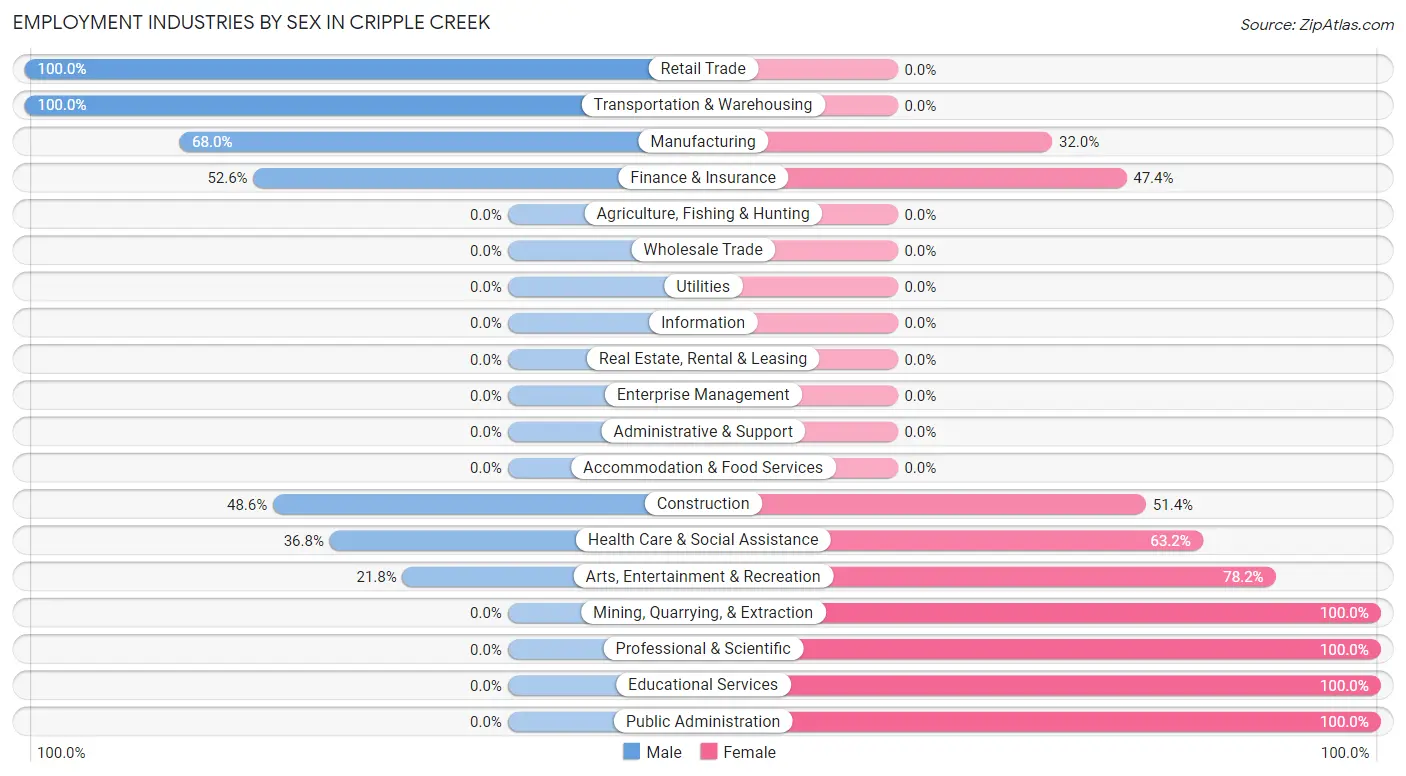
Employment Industries by Sex in Cripple Creek
The Cripple Creek industries that see more men than women are Retail Trade (100.0%), Transportation & Warehousing (100.0%), and Manufacturing (68.0%), whereas the industries that tend to have a higher number of women are Mining, Quarrying, & Extraction (100.0%), Professional & Scientific (100.0%), and Educational Services (100.0%).
| Industry | Male | Female |
| Agriculture, Fishing & Hunting | 0 (0.0%) | 0 (0.0%) |
| Mining, Quarrying, & Extraction | 0 (0.0%) | 6 (100.0%) |
| Construction | 17 (48.6%) | 18 (51.4%) |
| Manufacturing | 17 (68.0%) | 8 (32.0%) |
| Wholesale Trade | 0 (0.0%) | 0 (0.0%) |
| Retail Trade | 9 (100.0%) | 0 (0.0%) |
| Transportation & Warehousing | 10 (100.0%) | 0 (0.0%) |
| Utilities | 0 (0.0%) | 0 (0.0%) |
| Information | 0 (0.0%) | 0 (0.0%) |
| Finance & Insurance | 10 (52.6%) | 9 (47.4%) |
| Real Estate, Rental & Leasing | 0 (0.0%) | 0 (0.0%) |
| Professional & Scientific | 0 (0.0%) | 14 (100.0%) |
| Enterprise Management | 0 (0.0%) | 0 (0.0%) |
| Administrative & Support | 0 (0.0%) | 0 (0.0%) |
| Educational Services | 0 (0.0%) | 15 (100.0%) |
| Health Care & Social Assistance | 14 (36.8%) | 24 (63.2%) |
| Arts, Entertainment & Recreation | 32 (21.8%) | 115 (78.2%) |
| Accommodation & Food Services | 0 (0.0%) | 0 (0.0%) |
| Public Administration | 0 (0.0%) | 10 (100.0%) |
| Total | 116 (33.4%) | 231 (66.6%) |
Education in Cripple Creek
School Enrollment in Cripple Creek
The most common levels of schooling among the 167 students in Cripple Creek are kindergarten (50 | 29.9%), high school (45 | 27.0%), and middle school (31 | 18.6%).
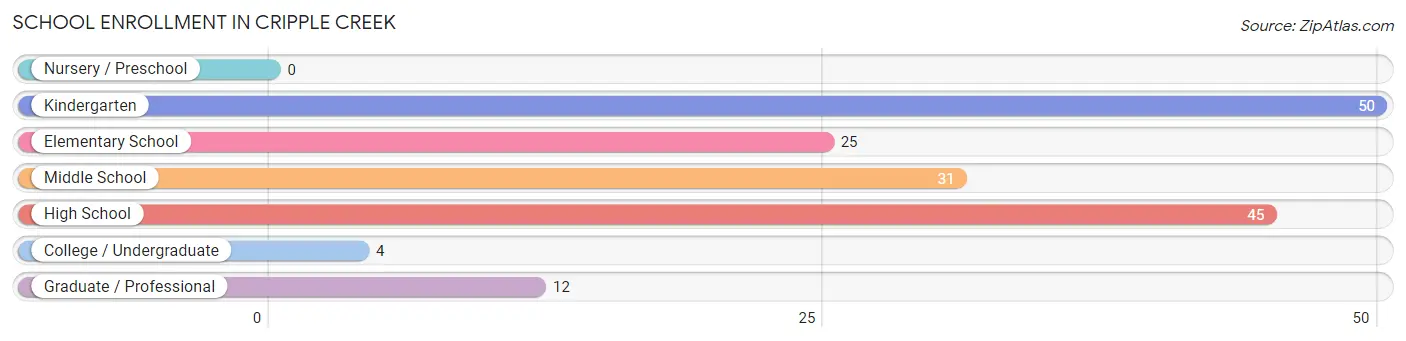
| School Level | # Students | % Students |
| Nursery / Preschool | 0 | 0.0% |
| Kindergarten | 50 | 29.9% |
| Elementary School | 25 | 15.0% |
| Middle School | 31 | 18.6% |
| High School | 45 | 27.0% |
| College / Undergraduate | 4 | 2.4% |
| Graduate / Professional | 12 | 7.2% |
| Total | 167 | 100.0% |
School Enrollment by Age by Funding Source in Cripple Creek
Out of a total of 167 students who are enrolled in schools in Cripple Creek, 16 (9.6%) attend a private institution, while the remaining 151 (90.4%) are enrolled in public schools. The age group of 35 years and over has the highest likelihood of being enrolled in private schools, with 16 (100.0% in the age bracket) enrolled. Conversely, the age group of 5 to 9 year old has the lowest likelihood of being enrolled in a private school, with 75 (100.0% in the age bracket) attending a public institution.
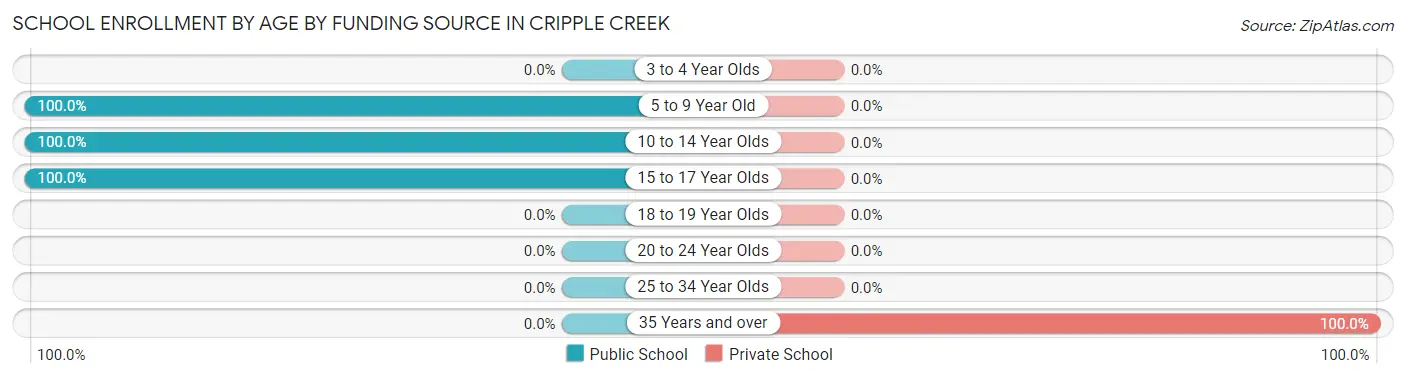
| Age Bracket | Public School | Private School |
| 3 to 4 Year Olds | 0 (0.0%) | 0 (0.0%) |
| 5 to 9 Year Old | 75 (100.0%) | 0 (0.0%) |
| 10 to 14 Year Olds | 31 (100.0%) | 0 (0.0%) |
| 15 to 17 Year Olds | 45 (100.0%) | 0 (0.0%) |
| 18 to 19 Year Olds | 0 (0.0%) | 0 (0.0%) |
| 20 to 24 Year Olds | 0 (0.0%) | 0 (0.0%) |
| 25 to 34 Year Olds | 0 (0.0%) | 0 (0.0%) |
| 35 Years and over | 0 (0.0%) | 16 (100.0%) |
| Total | 151 (90.4%) | 16 (9.6%) |
Educational Attainment by Field of Study in Cripple Creek
Business (29 | 20.7%), computers & mathematics (25 | 17.9%), engineering (22 | 15.7%), literature & languages (13 | 9.3%), and social sciences (12 | 8.6%) are the most common fields of study among 140 individuals in Cripple Creek who have obtained a bachelor's degree or higher.
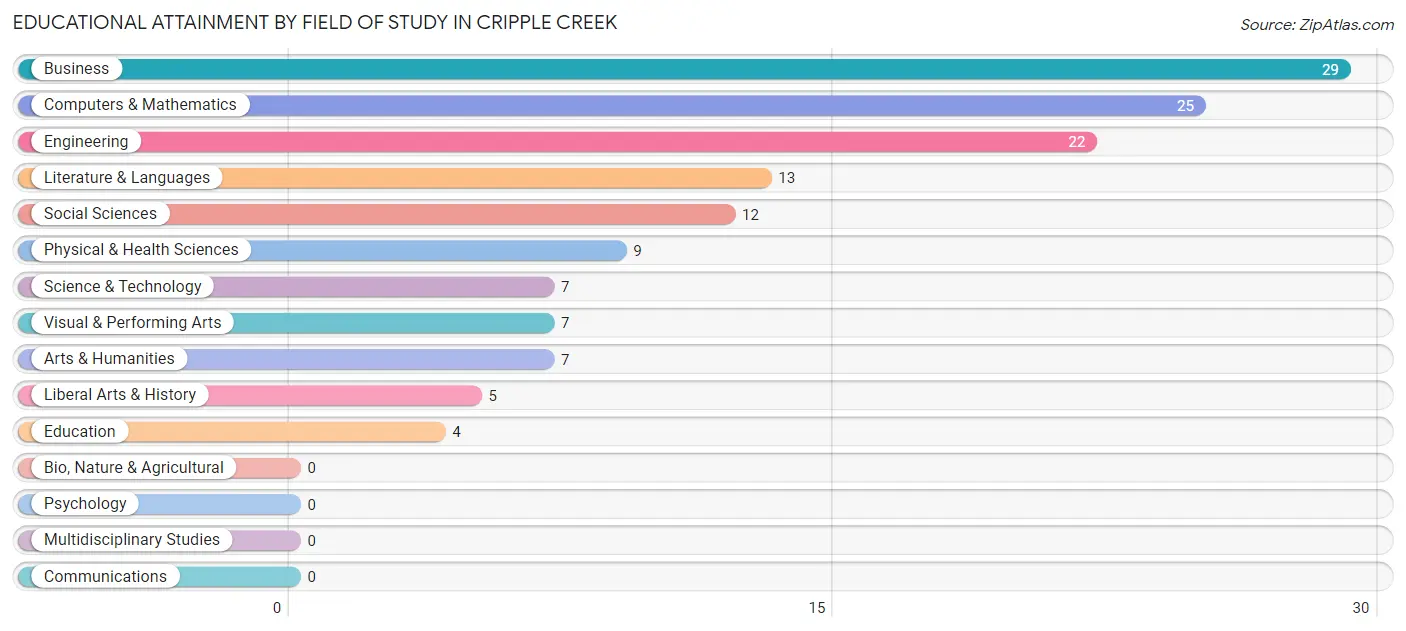
| Field of Study | # Graduates | % Graduates |
| Computers & Mathematics | 25 | 17.9% |
| Bio, Nature & Agricultural | 0 | 0.0% |
| Physical & Health Sciences | 9 | 6.4% |
| Psychology | 0 | 0.0% |
| Social Sciences | 12 | 8.6% |
| Engineering | 22 | 15.7% |
| Multidisciplinary Studies | 0 | 0.0% |
| Science & Technology | 7 | 5.0% |
| Business | 29 | 20.7% |
| Education | 4 | 2.9% |
| Literature & Languages | 13 | 9.3% |
| Liberal Arts & History | 5 | 3.6% |
| Visual & Performing Arts | 7 | 5.0% |
| Communications | 0 | 0.0% |
| Arts & Humanities | 7 | 5.0% |
| Total | 140 | 100.0% |
Transportation & Commute in Cripple Creek
Vehicle Availability by Sex in Cripple Creek
The most prevalent vehicle ownership categories in Cripple Creek are males with 2 vehicles (52, accounting for 44.8%) and females with 2 vehicles (60, making up 22.5%).
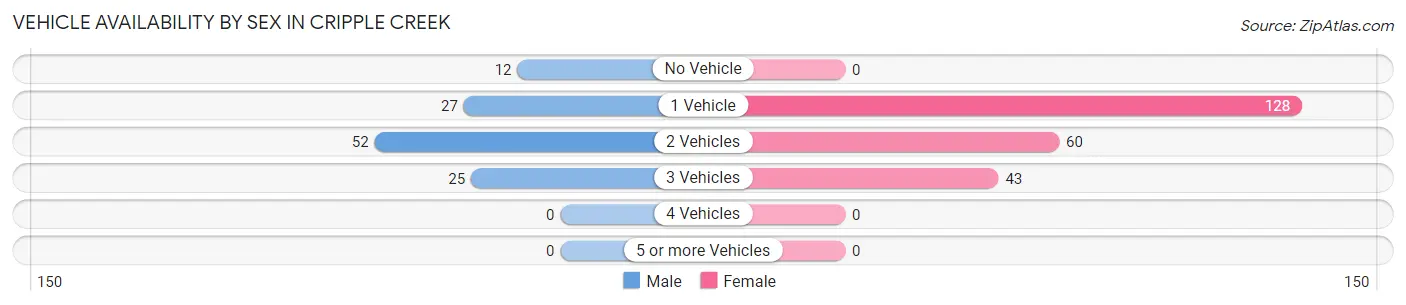
| Vehicles Available | Male | Female |
| No Vehicle | 12 (10.3%) | 0 (0.0%) |
| 1 Vehicle | 27 (23.3%) | 128 (55.4%) |
| 2 Vehicles | 52 (44.8%) | 60 (26.0%) |
| 3 Vehicles | 25 (21.5%) | 43 (18.6%) |
| 4 Vehicles | 0 (0.0%) | 0 (0.0%) |
| 5 or more Vehicles | 0 (0.0%) | 0 (0.0%) |
| Total | 116 (100.0%) | 231 (100.0%) |
Commute Time in Cripple Creek
The most frequently occuring commute durations in Cripple Creek are 5 to 9 minutes (159 commuters, 53.2%), less than 5 minutes (44 commuters, 14.7%), and 25 to 29 minutes (25 commuters, 8.4%).
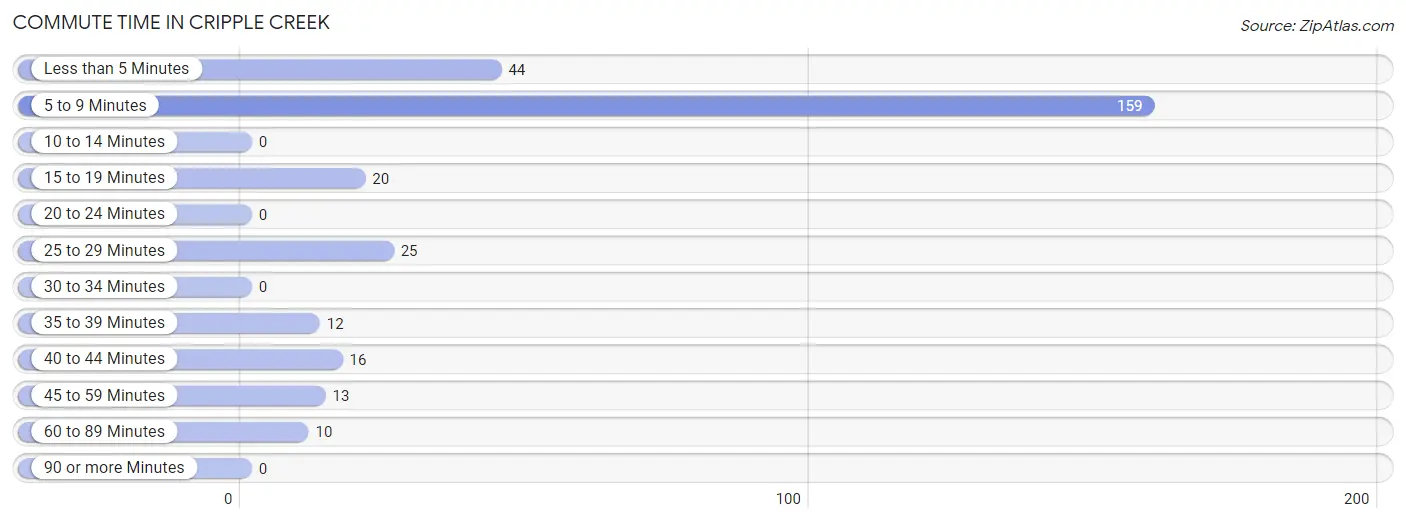
| Commute Time | # Commuters | % Commuters |
| Less than 5 Minutes | 44 | 14.7% |
| 5 to 9 Minutes | 159 | 53.2% |
| 10 to 14 Minutes | 0 | 0.0% |
| 15 to 19 Minutes | 20 | 6.7% |
| 20 to 24 Minutes | 0 | 0.0% |
| 25 to 29 Minutes | 25 | 8.4% |
| 30 to 34 Minutes | 0 | 0.0% |
| 35 to 39 Minutes | 12 | 4.0% |
| 40 to 44 Minutes | 16 | 5.3% |
| 45 to 59 Minutes | 13 | 4.3% |
| 60 to 89 Minutes | 10 | 3.3% |
| 90 or more Minutes | 0 | 0.0% |
Commute Time by Sex in Cripple Creek
The most common commute times in Cripple Creek are 5 to 9 minutes (32 commuters, 33.7%) for males and 5 to 9 minutes (127 commuters, 62.3%) for females.
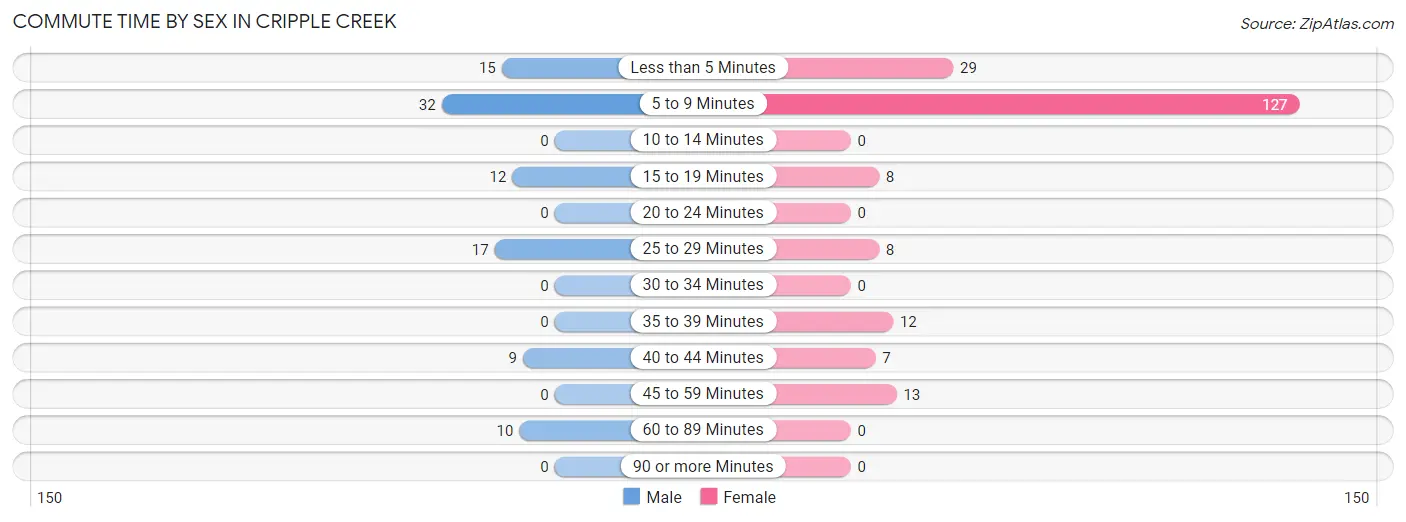
| Commute Time | Male | Female |
| Less than 5 Minutes | 15 (15.8%) | 29 (14.2%) |
| 5 to 9 Minutes | 32 (33.7%) | 127 (62.3%) |
| 10 to 14 Minutes | 0 (0.0%) | 0 (0.0%) |
| 15 to 19 Minutes | 12 (12.6%) | 8 (3.9%) |
| 20 to 24 Minutes | 0 (0.0%) | 0 (0.0%) |
| 25 to 29 Minutes | 17 (17.9%) | 8 (3.9%) |
| 30 to 34 Minutes | 0 (0.0%) | 0 (0.0%) |
| 35 to 39 Minutes | 0 (0.0%) | 12 (5.9%) |
| 40 to 44 Minutes | 9 (9.5%) | 7 (3.4%) |
| 45 to 59 Minutes | 0 (0.0%) | 13 (6.4%) |
| 60 to 89 Minutes | 10 (10.5%) | 0 (0.0%) |
| 90 or more Minutes | 0 (0.0%) | 0 (0.0%) |
Time of Departure to Work by Sex in Cripple Creek
The most frequent times of departure to work in Cripple Creek are 6:30 AM to 6:59 AM (38, 40.0%) for males and 8:00 AM to 8:29 AM (62, 30.4%) for females.
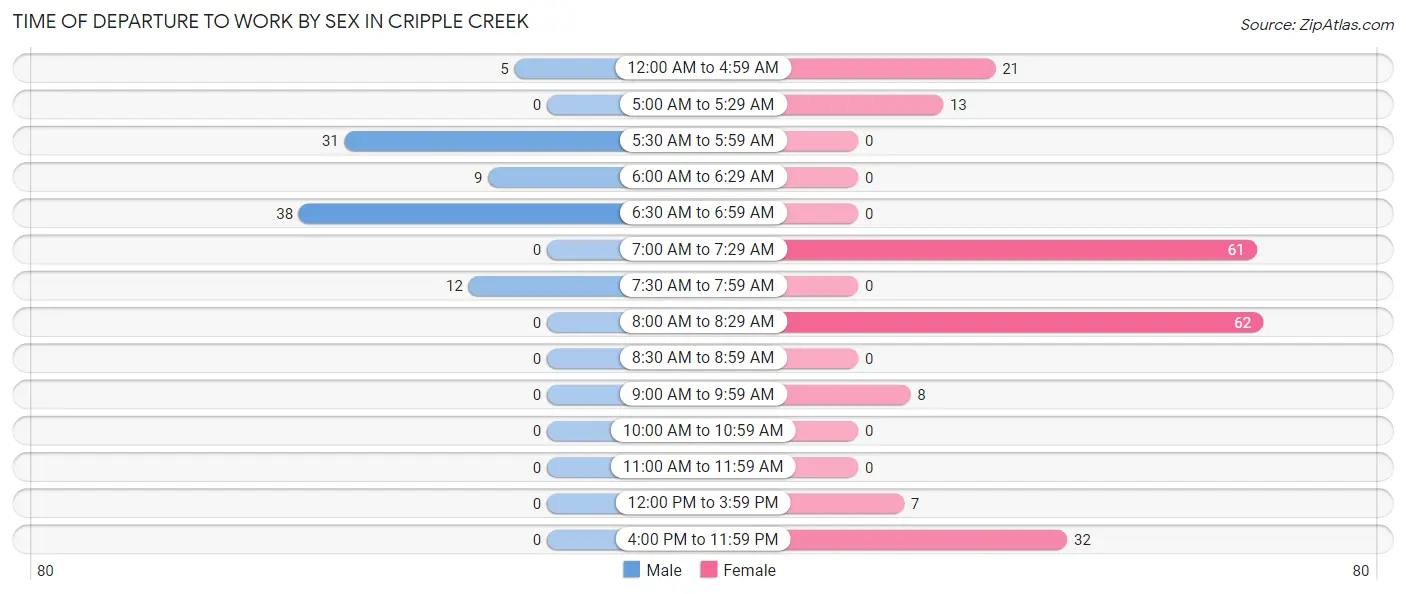
| Time of Departure | Male | Female |
| 12:00 AM to 4:59 AM | 5 (5.3%) | 21 (10.3%) |
| 5:00 AM to 5:29 AM | 0 (0.0%) | 13 (6.4%) |
| 5:30 AM to 5:59 AM | 31 (32.6%) | 0 (0.0%) |
| 6:00 AM to 6:29 AM | 9 (9.5%) | 0 (0.0%) |
| 6:30 AM to 6:59 AM | 38 (40.0%) | 0 (0.0%) |
| 7:00 AM to 7:29 AM | 0 (0.0%) | 61 (29.9%) |
| 7:30 AM to 7:59 AM | 12 (12.6%) | 0 (0.0%) |
| 8:00 AM to 8:29 AM | 0 (0.0%) | 62 (30.4%) |
| 8:30 AM to 8:59 AM | 0 (0.0%) | 0 (0.0%) |
| 9:00 AM to 9:59 AM | 0 (0.0%) | 8 (3.9%) |
| 10:00 AM to 10:59 AM | 0 (0.0%) | 0 (0.0%) |
| 11:00 AM to 11:59 AM | 0 (0.0%) | 0 (0.0%) |
| 12:00 PM to 3:59 PM | 0 (0.0%) | 7 (3.4%) |
| 4:00 PM to 11:59 PM | 0 (0.0%) | 32 (15.7%) |
| Total | 95 (100.0%) | 204 (100.0%) |
Housing Occupancy in Cripple Creek
Occupancy by Ownership in Cripple Creek
Of the total 545 dwellings in Cripple Creek, owner-occupied units account for 309 (56.7%), while renter-occupied units make up 236 (43.3%).
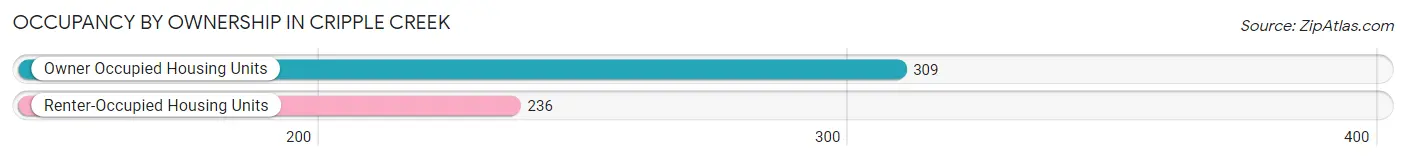
| Occupancy | # Housing Units | % Housing Units |
| Owner Occupied Housing Units | 309 | 56.7% |
| Renter-Occupied Housing Units | 236 | 43.3% |
| Total Occupied Housing Units | 545 | 100.0% |
Occupancy by Household Size in Cripple Creek
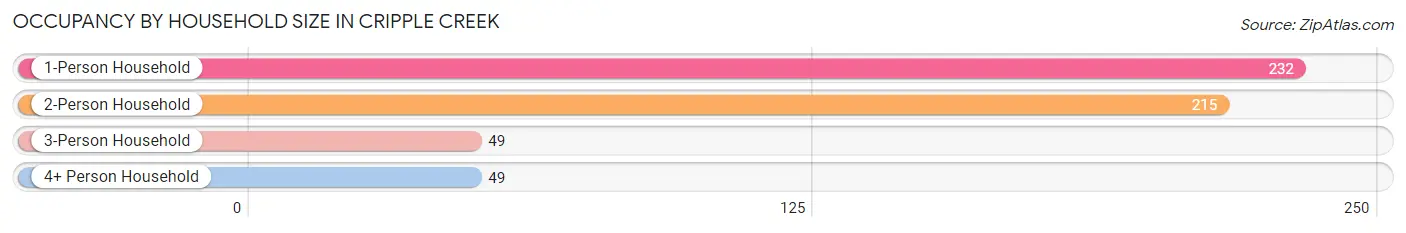
| Household Size | # Housing Units | % Housing Units |
| 1-Person Household | 232 | 42.6% |
| 2-Person Household | 215 | 39.5% |
| 3-Person Household | 49 | 9.0% |
| 4+ Person Household | 49 | 9.0% |
| Total Housing Units | 545 | 100.0% |
Occupancy by Ownership by Household Size in Cripple Creek
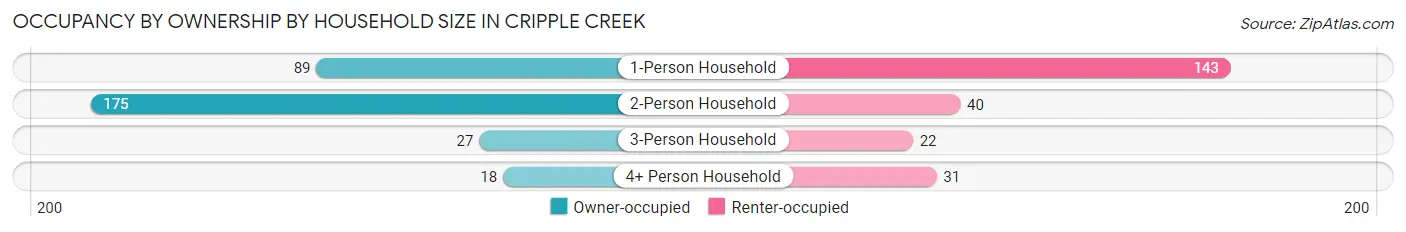
| Household Size | Owner-occupied | Renter-occupied |
| 1-Person Household | 89 (38.4%) | 143 (61.6%) |
| 2-Person Household | 175 (81.4%) | 40 (18.6%) |
| 3-Person Household | 27 (55.1%) | 22 (44.9%) |
| 4+ Person Household | 18 (36.7%) | 31 (63.3%) |
| Total Housing Units | 309 (56.7%) | 236 (43.3%) |
Occupancy by Educational Attainment in Cripple Creek
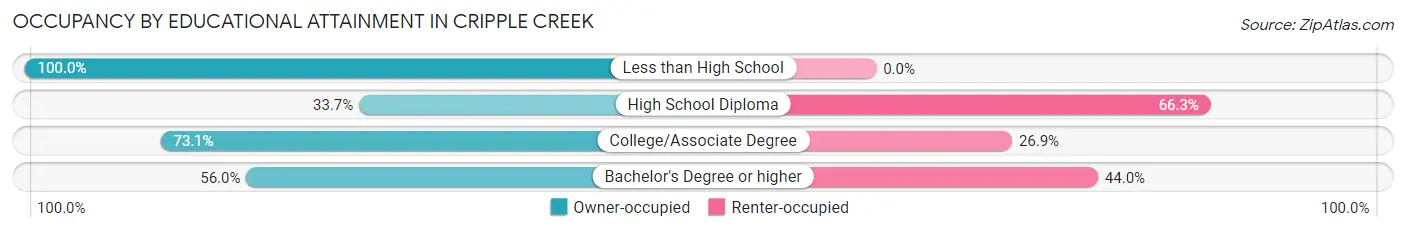
| Household Size | Owner-occupied | Renter-occupied |
| Less than High School | 4 (100.0%) | 0 (0.0%) |
| High School Diploma | 64 (33.7%) | 126 (66.3%) |
| College/Associate Degree | 190 (73.1%) | 70 (26.9%) |
| Bachelor's Degree or higher | 51 (56.0%) | 40 (44.0%) |
Occupancy by Age of Householder in Cripple Creek
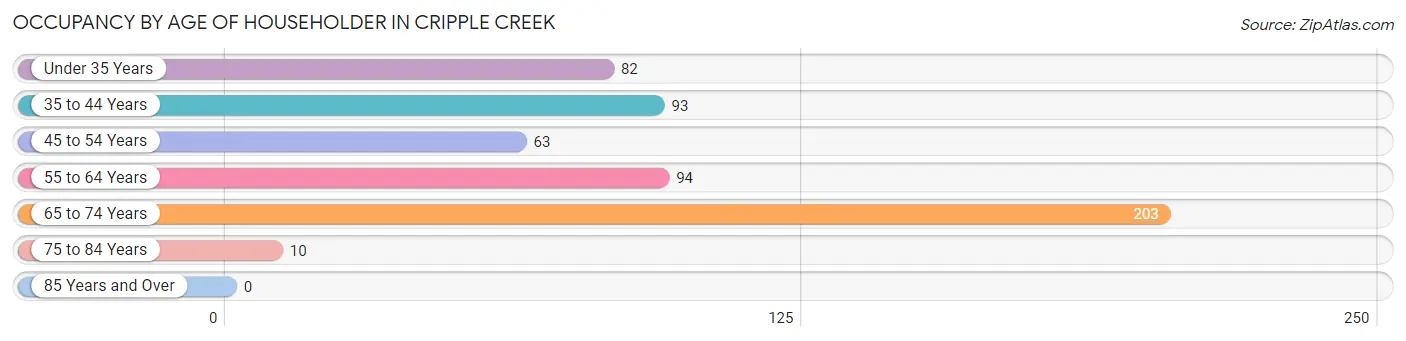
| Age Bracket | # Households | % Households |
| Under 35 Years | 82 | 15.0% |
| 35 to 44 Years | 93 | 17.1% |
| 45 to 54 Years | 63 | 11.6% |
| 55 to 64 Years | 94 | 17.2% |
| 65 to 74 Years | 203 | 37.2% |
| 75 to 84 Years | 10 | 1.8% |
| 85 Years and Over | 0 | 0.0% |
| Total | 545 | 100.0% |
Housing Finances in Cripple Creek
Median Income by Occupancy in Cripple Creek
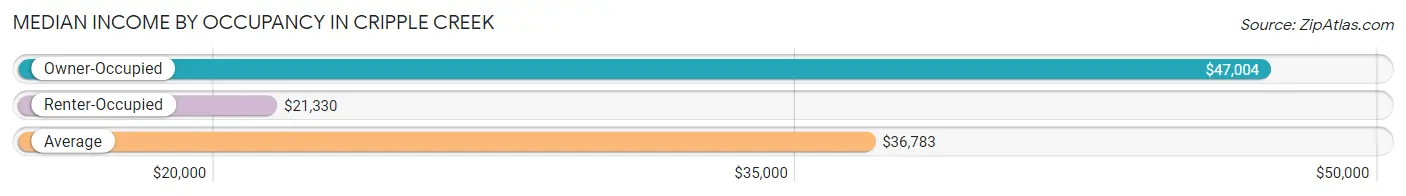
| Occupancy Type | # Households | Median Income |
| Owner-Occupied | 309 (56.7%) | $47,004 |
| Renter-Occupied | 236 (43.3%) | $21,330 |
| Average | 545 (100.0%) | $36,783 |
Occupancy by Householder Income Bracket in Cripple Creek
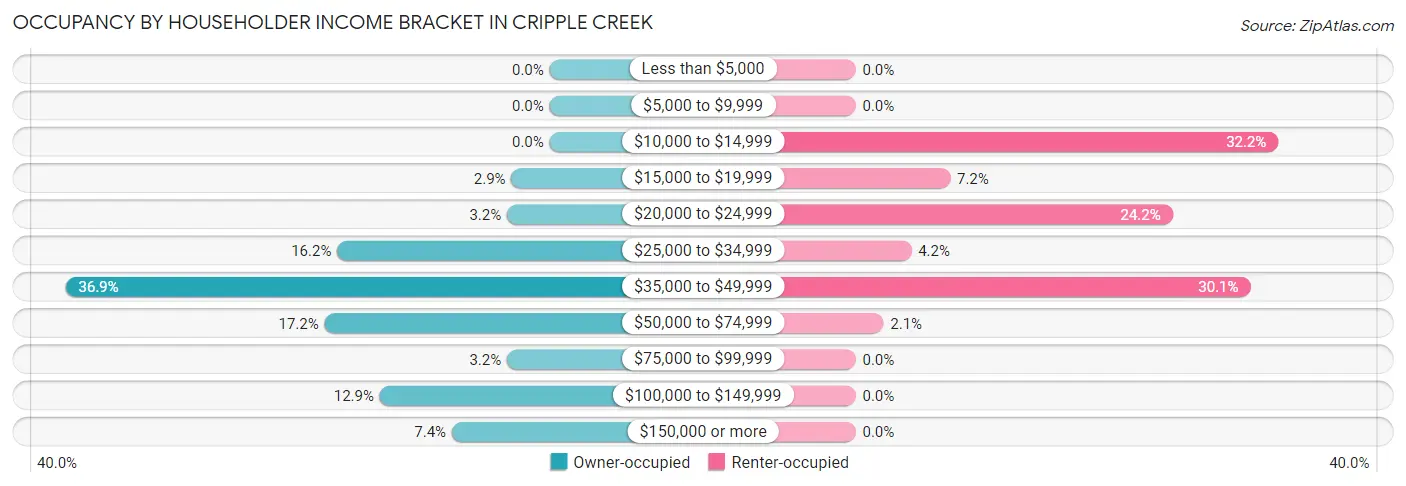
| Income Bracket | Owner-occupied | Renter-occupied |
| Less than $5,000 | 0 (0.0%) | 0 (0.0%) |
| $5,000 to $9,999 | 0 (0.0%) | 0 (0.0%) |
| $10,000 to $14,999 | 0 (0.0%) | 76 (32.2%) |
| $15,000 to $19,999 | 9 (2.9%) | 17 (7.2%) |
| $20,000 to $24,999 | 10 (3.2%) | 57 (24.1%) |
| $25,000 to $34,999 | 50 (16.2%) | 10 (4.2%) |
| $35,000 to $49,999 | 114 (36.9%) | 71 (30.1%) |
| $50,000 to $74,999 | 53 (17.2%) | 5 (2.1%) |
| $75,000 to $99,999 | 10 (3.2%) | 0 (0.0%) |
| $100,000 to $149,999 | 40 (12.9%) | 0 (0.0%) |
| $150,000 or more | 23 (7.4%) | 0 (0.0%) |
| Total | 309 (100.0%) | 236 (100.0%) |
Monthly Housing Cost Tiers in Cripple Creek
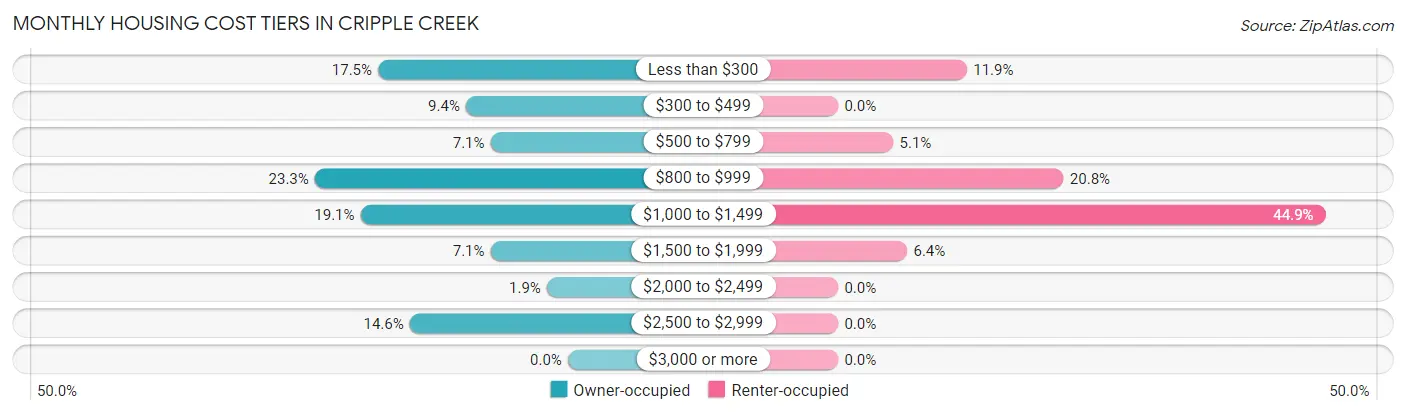
| Monthly Cost | Owner-occupied | Renter-occupied |
| Less than $300 | 54 (17.5%) | 28 (11.9%) |
| $300 to $499 | 29 (9.4%) | 0 (0.0%) |
| $500 to $799 | 22 (7.1%) | 12 (5.1%) |
| $800 to $999 | 72 (23.3%) | 49 (20.8%) |
| $1,000 to $1,499 | 59 (19.1%) | 106 (44.9%) |
| $1,500 to $1,999 | 22 (7.1%) | 15 (6.4%) |
| $2,000 to $2,499 | 6 (1.9%) | 0 (0.0%) |
| $2,500 to $2,999 | 45 (14.6%) | 0 (0.0%) |
| $3,000 or more | 0 (0.0%) | 0 (0.0%) |
| Total | 309 (100.0%) | 236 (100.0%) |
Physical Housing Characteristics in Cripple Creek
Housing Structures in Cripple Creek
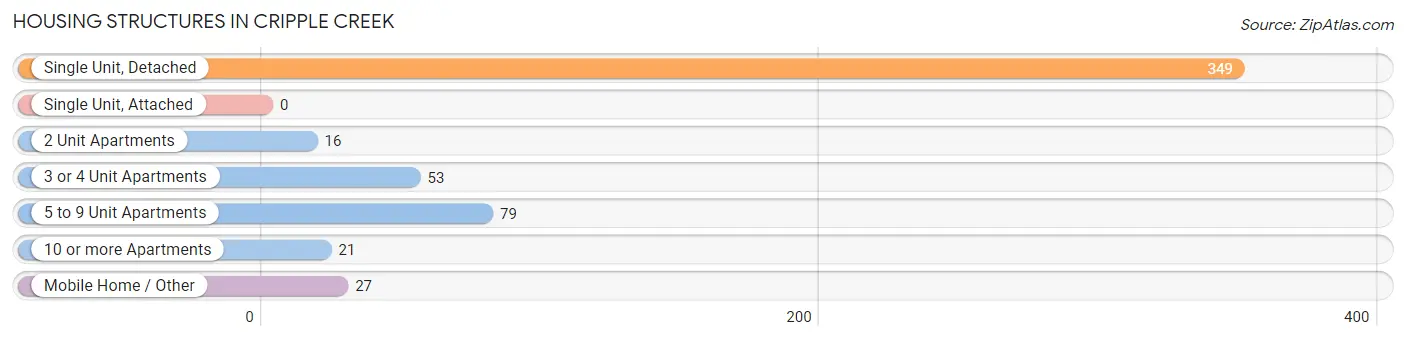
| Structure Type | # Housing Units | % Housing Units |
| Single Unit, Detached | 349 | 64.0% |
| Single Unit, Attached | 0 | 0.0% |
| 2 Unit Apartments | 16 | 2.9% |
| 3 or 4 Unit Apartments | 53 | 9.7% |
| 5 to 9 Unit Apartments | 79 | 14.5% |
| 10 or more Apartments | 21 | 3.8% |
| Mobile Home / Other | 27 | 5.0% |
| Total | 545 | 100.0% |
Housing Structures by Occupancy in Cripple Creek
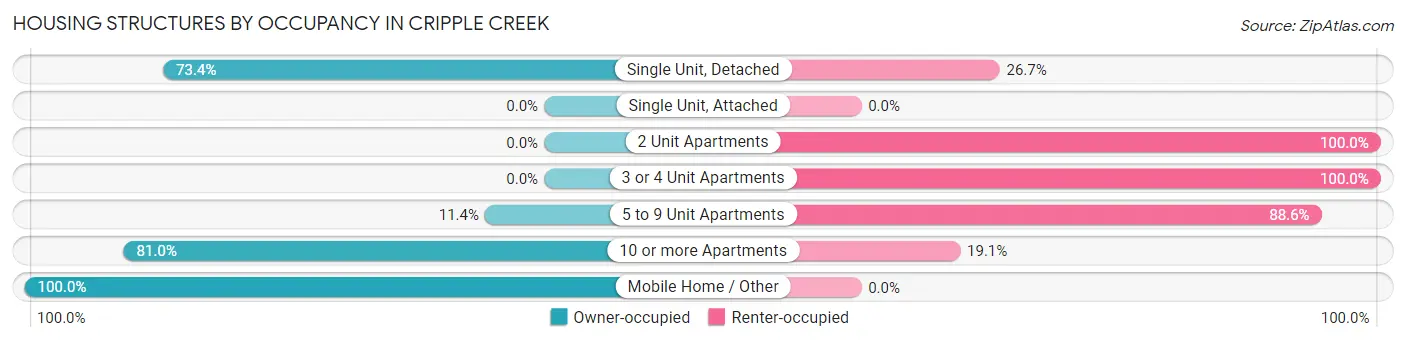
| Structure Type | Owner-occupied | Renter-occupied |
| Single Unit, Detached | 256 (73.4%) | 93 (26.7%) |
| Single Unit, Attached | 0 (0.0%) | 0 (0.0%) |
| 2 Unit Apartments | 0 (0.0%) | 16 (100.0%) |
| 3 or 4 Unit Apartments | 0 (0.0%) | 53 (100.0%) |
| 5 to 9 Unit Apartments | 9 (11.4%) | 70 (88.6%) |
| 10 or more Apartments | 17 (80.9%) | 4 (19.1%) |
| Mobile Home / Other | 27 (100.0%) | 0 (0.0%) |
| Total | 309 (56.7%) | 236 (43.3%) |
Housing Structures by Number of Rooms in Cripple Creek
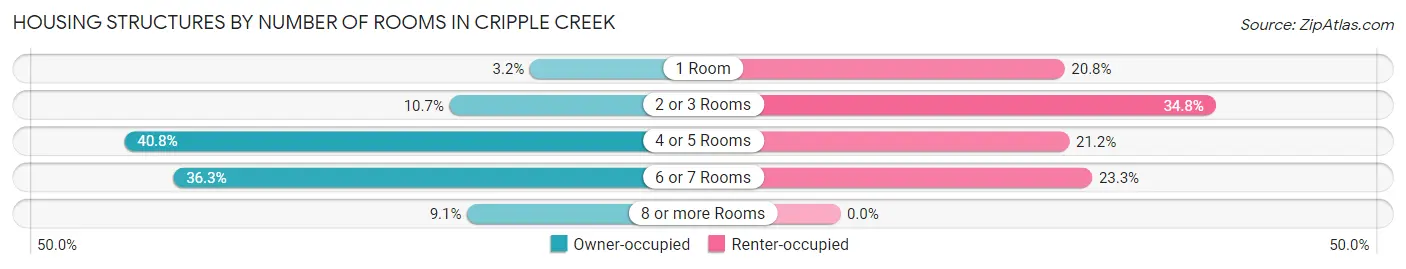
| Number of Rooms | Owner-occupied | Renter-occupied |
| 1 Room | 10 (3.2%) | 49 (20.8%) |
| 2 or 3 Rooms | 33 (10.7%) | 82 (34.7%) |
| 4 or 5 Rooms | 126 (40.8%) | 50 (21.2%) |
| 6 or 7 Rooms | 112 (36.2%) | 55 (23.3%) |
| 8 or more Rooms | 28 (9.1%) | 0 (0.0%) |
| Total | 309 (100.0%) | 236 (100.0%) |
Housing Structure by Heating Type in Cripple Creek
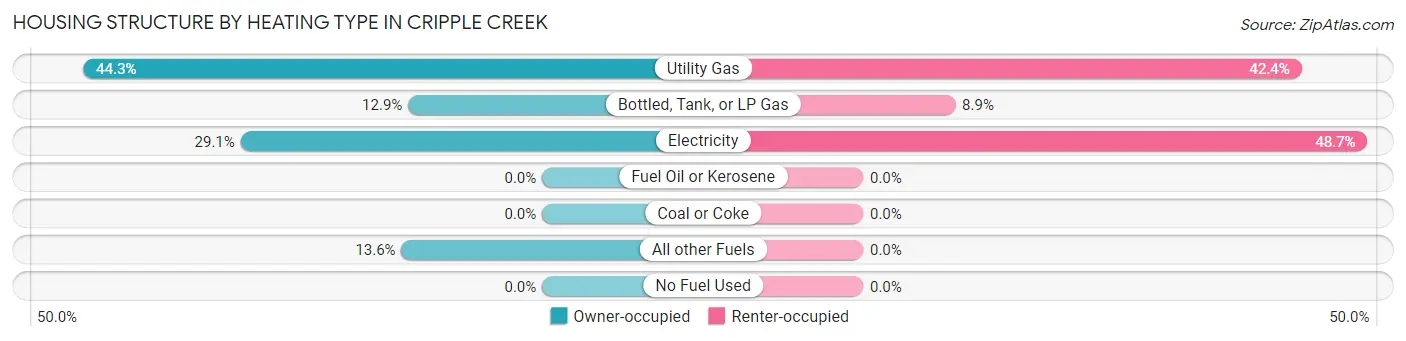
| Heating Type | Owner-occupied | Renter-occupied |
| Utility Gas | 137 (44.3%) | 100 (42.4%) |
| Bottled, Tank, or LP Gas | 40 (12.9%) | 21 (8.9%) |
| Electricity | 90 (29.1%) | 115 (48.7%) |
| Fuel Oil or Kerosene | 0 (0.0%) | 0 (0.0%) |
| Coal or Coke | 0 (0.0%) | 0 (0.0%) |
| All other Fuels | 42 (13.6%) | 0 (0.0%) |
| No Fuel Used | 0 (0.0%) | 0 (0.0%) |
| Total | 309 (100.0%) | 236 (100.0%) |
Household Vehicle Usage in Cripple Creek
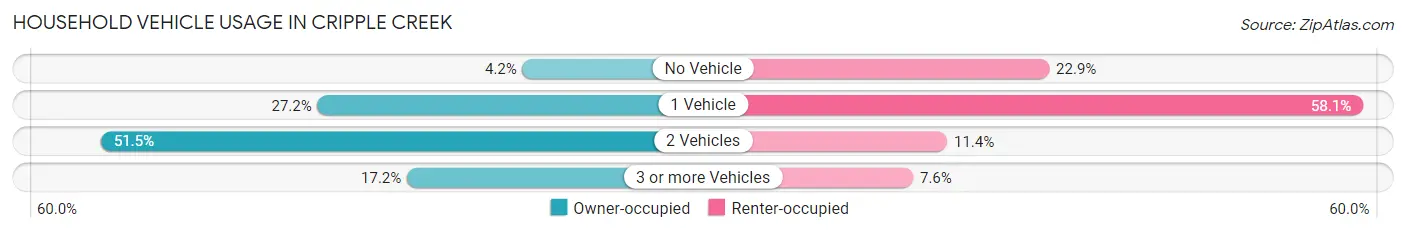
| Vehicles per Household | Owner-occupied | Renter-occupied |
| No Vehicle | 13 (4.2%) | 54 (22.9%) |
| 1 Vehicle | 84 (27.2%) | 137 (58.1%) |
| 2 Vehicles | 159 (51.5%) | 27 (11.4%) |
| 3 or more Vehicles | 53 (17.2%) | 18 (7.6%) |
| Total | 309 (100.0%) | 236 (100.0%) |
Real Estate & Mortgages in Cripple Creek
Real Estate and Mortgage Overview in Cripple Creek
| Characteristic | Without Mortgage | With Mortgage |
| Housing Units | 93 | 216 |
| Median Property Value | $230,900 | $207,100 |
| Median Household Income | $48,015 | $0 |
| Monthly Housing Costs | $290 | $0 |
| Real Estate Taxes | $375 | $0 |
Property Value by Mortgage Status in Cripple Creek
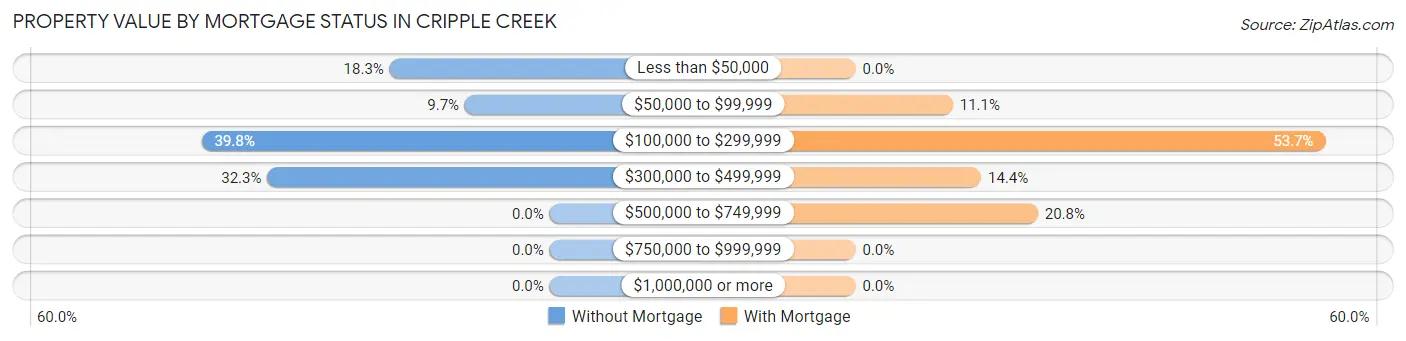
| Property Value | Without Mortgage | With Mortgage |
| Less than $50,000 | 17 (18.3%) | 0 (0.0%) |
| $50,000 to $99,999 | 9 (9.7%) | 24 (11.1%) |
| $100,000 to $299,999 | 37 (39.8%) | 116 (53.7%) |
| $300,000 to $499,999 | 30 (32.3%) | 31 (14.3%) |
| $500,000 to $749,999 | 0 (0.0%) | 45 (20.8%) |
| $750,000 to $999,999 | 0 (0.0%) | 0 (0.0%) |
| $1,000,000 or more | 0 (0.0%) | 0 (0.0%) |
| Total | 93 (100.0%) | 216 (100.0%) |
Household Income by Mortgage Status in Cripple Creek
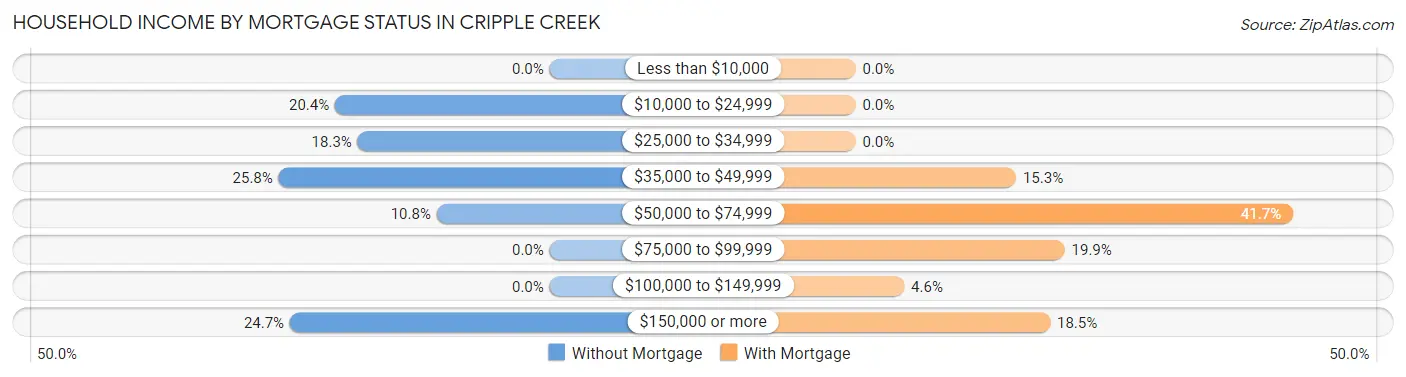
| Household Income | Without Mortgage | With Mortgage |
| Less than $10,000 | 0 (0.0%) | 0 (0.0%) |
| $10,000 to $24,999 | 19 (20.4%) | 0 (0.0%) |
| $25,000 to $34,999 | 17 (18.3%) | 0 (0.0%) |
| $35,000 to $49,999 | 24 (25.8%) | 33 (15.3%) |
| $50,000 to $74,999 | 10 (10.7%) | 90 (41.7%) |
| $75,000 to $99,999 | 0 (0.0%) | 43 (19.9%) |
| $100,000 to $149,999 | 0 (0.0%) | 10 (4.6%) |
| $150,000 or more | 23 (24.7%) | 40 (18.5%) |
| Total | 93 (100.0%) | 216 (100.0%) |
Property Value to Household Income Ratio in Cripple Creek
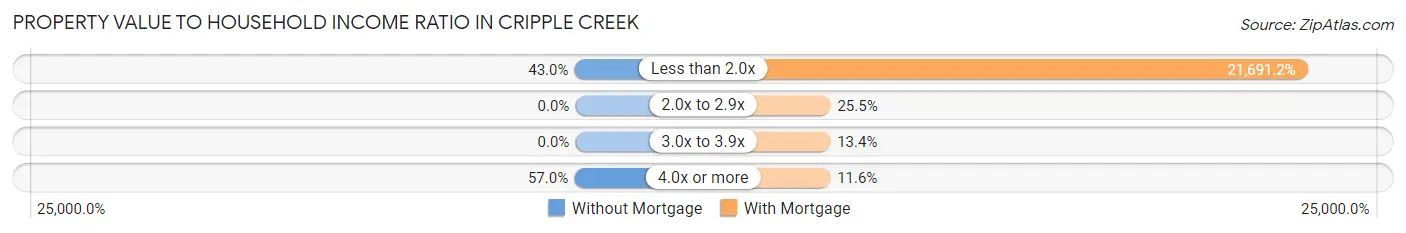
| Value-to-Income Ratio | Without Mortgage | With Mortgage |
| Less than 2.0x | 40 (43.0%) | 46,853 (21,691.2%) |
| 2.0x to 2.9x | 0 (0.0%) | 55 (25.5%) |
| 3.0x to 3.9x | 0 (0.0%) | 29 (13.4%) |
| 4.0x or more | 53 (57.0%) | 25 (11.6%) |
| Total | 93 (100.0%) | 216 (100.0%) |
Real Estate Taxes by Mortgage Status in Cripple Creek
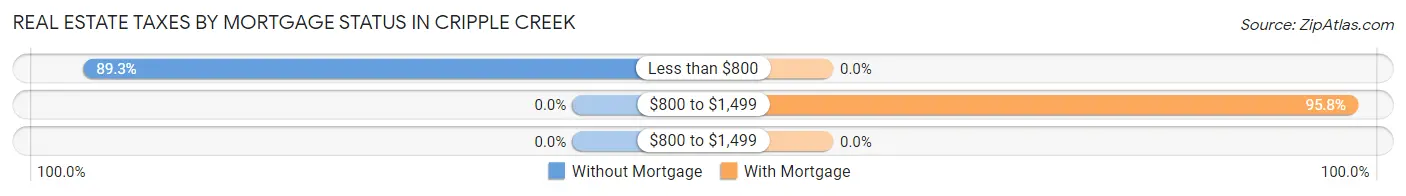
| Property Taxes | Without Mortgage | With Mortgage |
| Less than $800 | 83 (89.2%) | 0 (0.0%) |
| $800 to $1,499 | 0 (0.0%) | 207 (95.8%) |
| $800 to $1,499 | 0 (0.0%) | 0 (0.0%) |
| Total | 93 (100.0%) | 216 (100.0%) |
Health & Disability in Cripple Creek
Health Insurance Coverage by Age in Cripple Creek
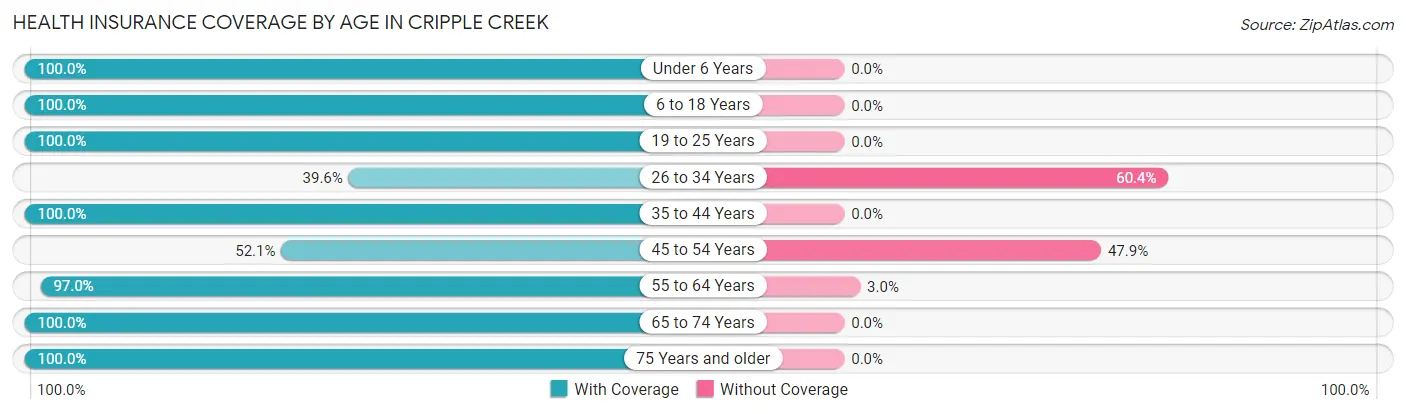
| Age Bracket | With Coverage | Without Coverage |
| Under 6 Years | 71 (100.0%) | 0 (0.0%) |
| 6 to 18 Years | 139 (100.0%) | 0 (0.0%) |
| 19 to 25 Years | 17 (100.0%) | 0 (0.0%) |
| 26 to 34 Years | 38 (39.6%) | 58 (60.4%) |
| 35 to 44 Years | 176 (100.0%) | 0 (0.0%) |
| 45 to 54 Years | 49 (52.1%) | 45 (47.9%) |
| 55 to 64 Years | 131 (97.0%) | 4 (3.0%) |
| 65 to 74 Years | 271 (100.0%) | 0 (0.0%) |
| 75 Years and older | 38 (100.0%) | 0 (0.0%) |
| Total | 930 (89.7%) | 107 (10.3%) |
Health Insurance Coverage by Citizenship Status in Cripple Creek
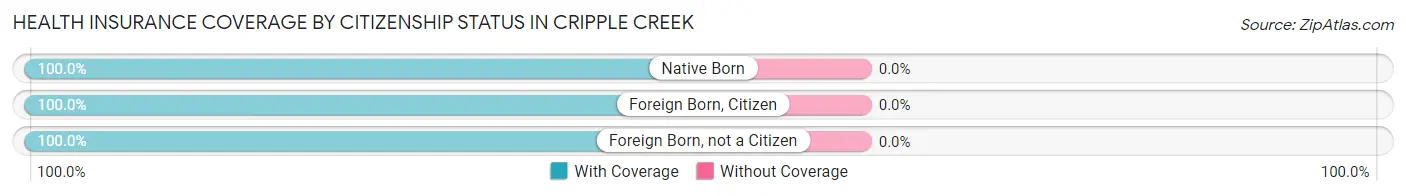
| Citizenship Status | With Coverage | Without Coverage |
| Native Born | 71 (100.0%) | 0 (0.0%) |
| Foreign Born, Citizen | 139 (100.0%) | 0 (0.0%) |
| Foreign Born, not a Citizen | 17 (100.0%) | 0 (0.0%) |
Health Insurance Coverage by Household Income in Cripple Creek
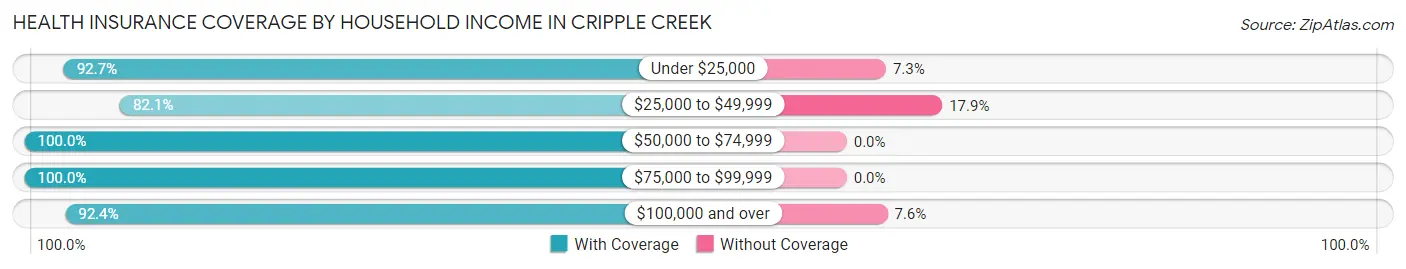
| Household Income | With Coverage | Without Coverage |
| Under $25,000 | 341 (92.7%) | 27 (7.3%) |
| $25,000 to $49,999 | 326 (82.1%) | 71 (17.9%) |
| $50,000 to $74,999 | 117 (100.0%) | 0 (0.0%) |
| $75,000 to $99,999 | 37 (100.0%) | 0 (0.0%) |
| $100,000 and over | 109 (92.4%) | 9 (7.6%) |
Public vs Private Health Insurance Coverage by Age in Cripple Creek
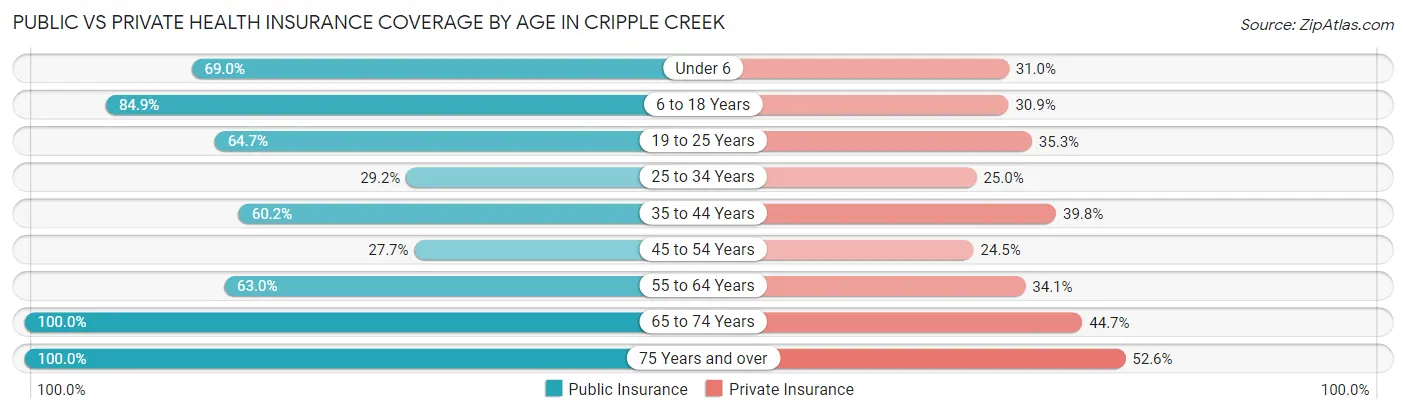
| Age Bracket | Public Insurance | Private Insurance |
| Under 6 | 49 (69.0%) | 22 (31.0%) |
| 6 to 18 Years | 118 (84.9%) | 43 (30.9%) |
| 19 to 25 Years | 11 (64.7%) | 6 (35.3%) |
| 25 to 34 Years | 28 (29.2%) | 24 (25.0%) |
| 35 to 44 Years | 106 (60.2%) | 70 (39.8%) |
| 45 to 54 Years | 26 (27.7%) | 23 (24.5%) |
| 55 to 64 Years | 85 (63.0%) | 46 (34.1%) |
| 65 to 74 Years | 271 (100.0%) | 121 (44.7%) |
| 75 Years and over | 38 (100.0%) | 20 (52.6%) |
| Total | 732 (70.6%) | 375 (36.2%) |
Disability Status by Sex by Age in Cripple Creek
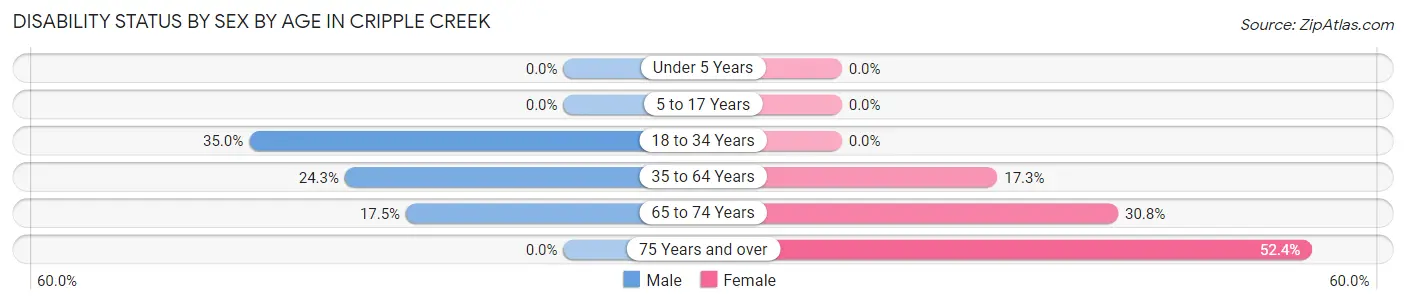
| Age Bracket | Male | Female |
| Under 5 Years | 0 (0.0%) | 0 (0.0%) |
| 5 to 17 Years | 0 (0.0%) | 0 (0.0%) |
| 18 to 34 Years | 14 (35.0%) | 0 (0.0%) |
| 35 to 64 Years | 55 (24.3%) | 31 (17.3%) |
| 65 to 74 Years | 27 (17.5%) | 36 (30.8%) |
| 75 Years and over | 0 (0.0%) | 11 (52.4%) |
Disability Class by Sex by Age in Cripple Creek
Disability Class: Hearing Difficulty
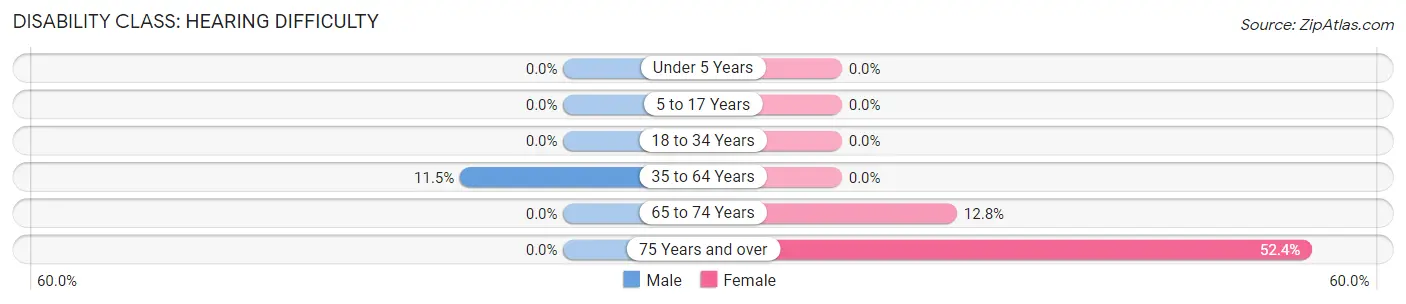
| Age Bracket | Male | Female |
| Under 5 Years | 0 (0.0%) | 0 (0.0%) |
| 5 to 17 Years | 0 (0.0%) | 0 (0.0%) |
| 18 to 34 Years | 0 (0.0%) | 0 (0.0%) |
| 35 to 64 Years | 26 (11.5%) | 0 (0.0%) |
| 65 to 74 Years | 0 (0.0%) | 15 (12.8%) |
| 75 Years and over | 0 (0.0%) | 11 (52.4%) |
Disability Class: Vision Difficulty
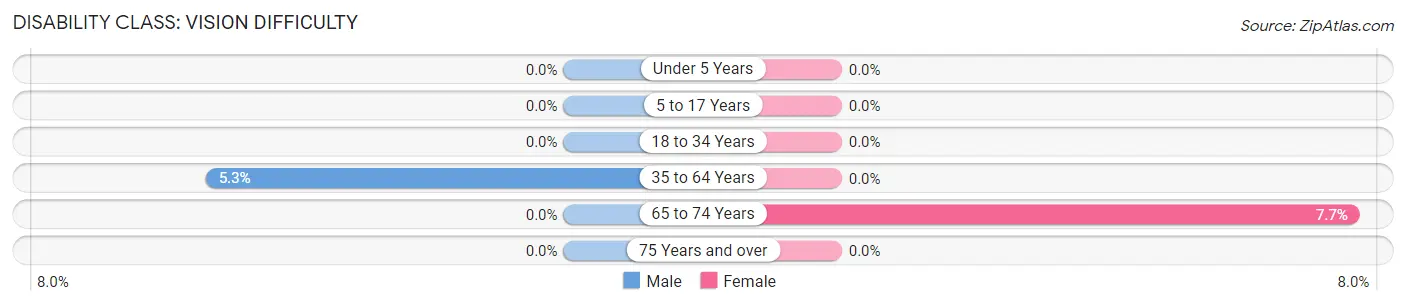
| Age Bracket | Male | Female |
| Under 5 Years | 0 (0.0%) | 0 (0.0%) |
| 5 to 17 Years | 0 (0.0%) | 0 (0.0%) |
| 18 to 34 Years | 0 (0.0%) | 0 (0.0%) |
| 35 to 64 Years | 12 (5.3%) | 0 (0.0%) |
| 65 to 74 Years | 0 (0.0%) | 9 (7.7%) |
| 75 Years and over | 0 (0.0%) | 0 (0.0%) |
Disability Class: Cognitive Difficulty
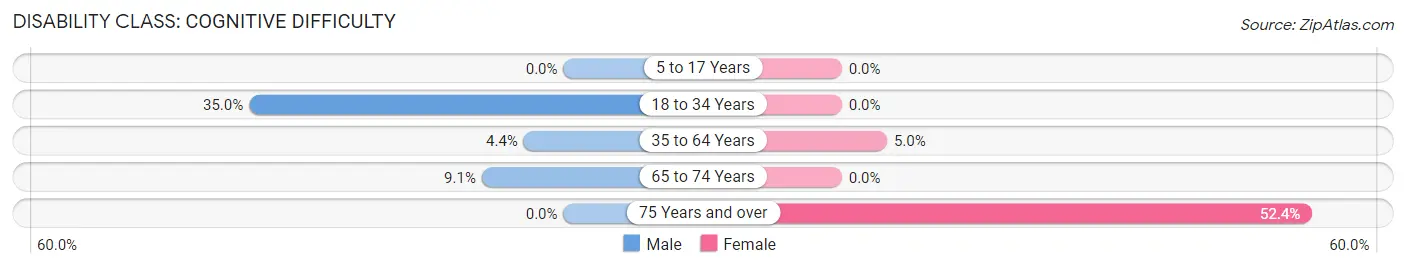
| Age Bracket | Male | Female |
| 5 to 17 Years | 0 (0.0%) | 0 (0.0%) |
| 18 to 34 Years | 14 (35.0%) | 0 (0.0%) |
| 35 to 64 Years | 10 (4.4%) | 9 (5.0%) |
| 65 to 74 Years | 14 (9.1%) | 0 (0.0%) |
| 75 Years and over | 0 (0.0%) | 11 (52.4%) |
Disability Class: Ambulatory Difficulty
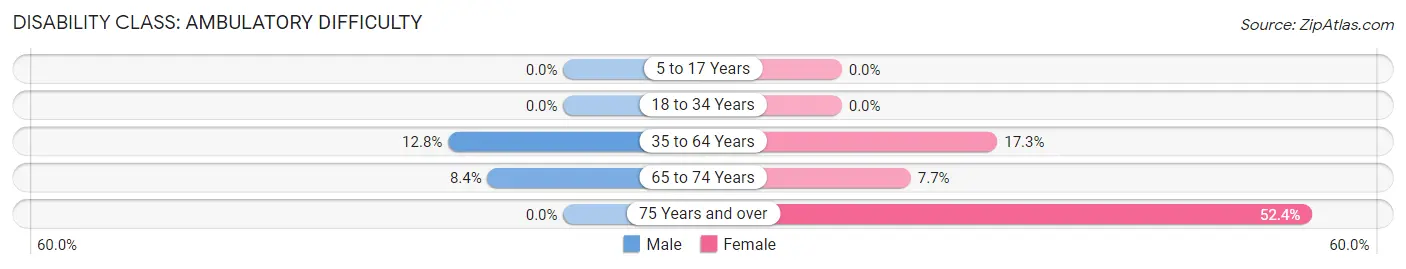
| Age Bracket | Male | Female |
| 5 to 17 Years | 0 (0.0%) | 0 (0.0%) |
| 18 to 34 Years | 0 (0.0%) | 0 (0.0%) |
| 35 to 64 Years | 29 (12.8%) | 31 (17.3%) |
| 65 to 74 Years | 13 (8.4%) | 9 (7.7%) |
| 75 Years and over | 0 (0.0%) | 11 (52.4%) |
Disability Class: Self-Care Difficulty
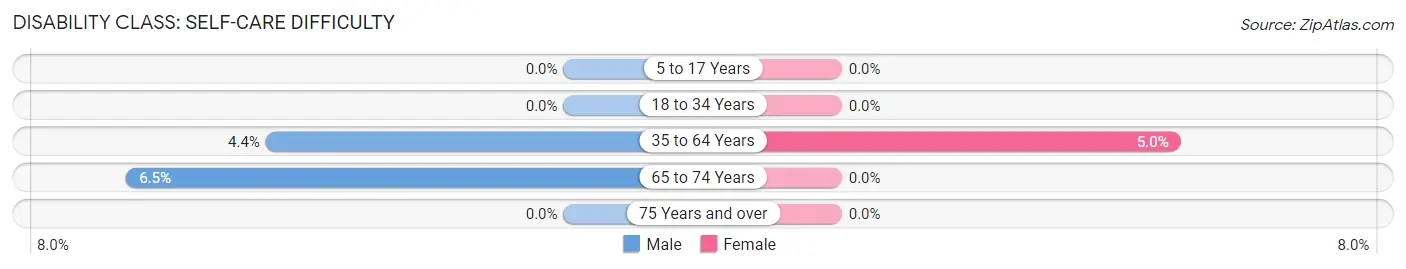
| Age Bracket | Male | Female |
| 5 to 17 Years | 0 (0.0%) | 0 (0.0%) |
| 18 to 34 Years | 0 (0.0%) | 0 (0.0%) |
| 35 to 64 Years | 10 (4.4%) | 9 (5.0%) |
| 65 to 74 Years | 10 (6.5%) | 0 (0.0%) |
| 75 Years and over | 0 (0.0%) | 0 (0.0%) |
Technology Access in Cripple Creek
Computing Device Access in Cripple Creek
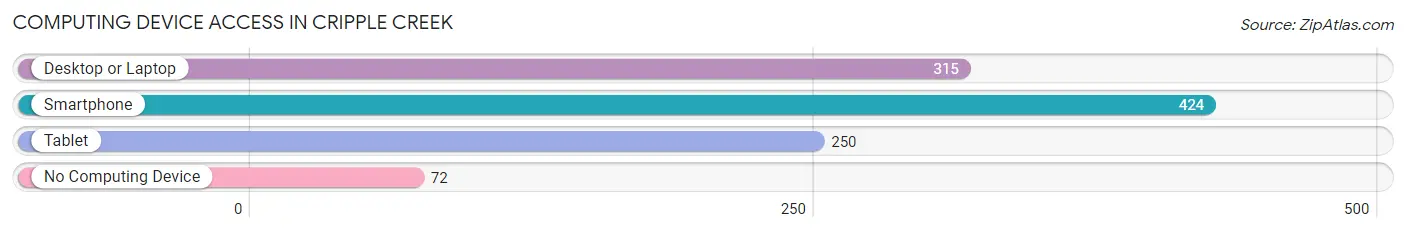
| Device Type | # Households | % Households |
| Desktop or Laptop | 315 | 57.8% |
| Smartphone | 424 | 77.8% |
| Tablet | 250 | 45.9% |
| No Computing Device | 72 | 13.2% |
| Total | 545 | 100.0% |
Internet Access in Cripple Creek
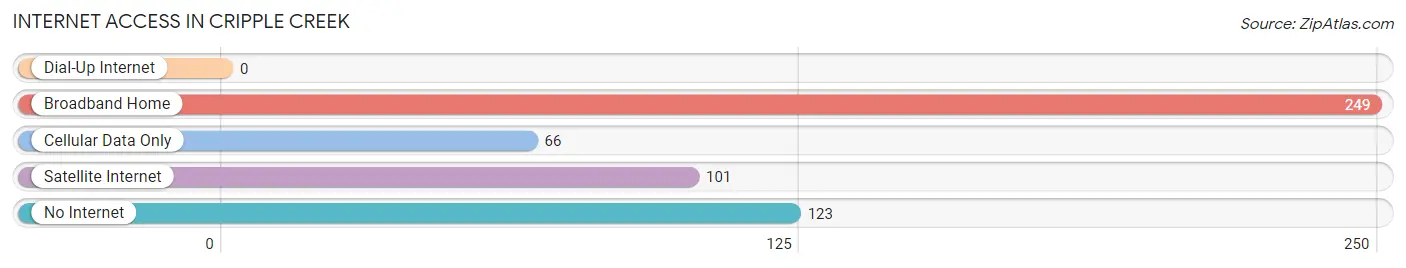
| Internet Type | # Households | % Households |
| Dial-Up Internet | 0 | 0.0% |
| Broadband Home | 249 | 45.7% |
| Cellular Data Only | 66 | 12.1% |
| Satellite Internet | 101 | 18.5% |
| No Internet | 123 | 22.6% |
| Total | 545 | 100.0% |
Cripple Creek Summary
Cripple Creek is a small city located in the foothills of the Rocky Mountains in Teller County, Colorado. It is situated at an elevation of 9,494 feet, making it one of the highest cities in the United States. The city was founded in the late 19th century as a mining camp, and it quickly grew to become one of the most prosperous cities in the state.
History
The area around Cripple Creek was first explored by prospectors in the late 1800s. In 1890, a group of prospectors discovered gold in the area, and the city of Cripple Creek was founded shortly thereafter. The city quickly grew to become one of the most prosperous mining towns in the state, and by 1900, it had a population of over 10,000 people.
The city was home to several large gold mines, including the Cresson Mine, the Portland Mine, and the Independence Mine. These mines produced millions of dollars worth of gold, and the city quickly became one of the most prosperous in the state.
The city experienced a period of decline in the early 20th century, as the gold mines began to run dry. By the 1950s, the population had dropped to just over 1,000 people. However, the city experienced a resurgence in the late 20th century, as it became a popular tourist destination.
Geography
Cripple Creek is located in the foothills of the Rocky Mountains in Teller County, Colorado. It is situated at an elevation of 9,494 feet, making it one of the highest cities in the United States. The city is surrounded by mountains, including Pikes Peak, which is located just to the south.
The city is located in a valley, and it is surrounded by several small mountain ranges. The city is located near several popular tourist attractions, including the Cripple Creek & Victor Narrow Gauge Railroad, the Mollie Kathleen Gold Mine, and the Cripple Creek & Victor Gold Mining Company.
Economy
The economy of Cripple Creek is largely based on tourism. The city is home to several popular tourist attractions, including the Cripple Creek & Victor Narrow Gauge Railroad, the Mollie Kathleen Gold Mine, and the Cripple Creek & Victor Gold Mining Company. The city also has several casinos, which attract visitors from all over the state.
In addition to tourism, the city is also home to several small businesses, including restaurants, shops, and other services. The city is also home to several small manufacturing companies, which produce a variety of products, including furniture, clothing, and jewelry.
Demographics
As of the 2010 census, the population of Cripple Creek was 1,189. The racial makeup of the city was 95.3% White, 0.7% African American, 0.3% Native American, 0.2% Asian, 0.1% Pacific Islander, 1.2% from other races, and 2.4% from two or more races. Hispanic or Latino of any race were 4.2% of the population.
The median income for a household in the city was $37,500, and the median income for a family was $41,250. The per capita income for the city was $19,945. About 11.2% of families and 13.2% of the population were below the poverty line, including 16.7% of those under age 18 and 8.3% of those age 65 or over.
Common Questions
What is Per Capita Income in Cripple Creek?
Per Capita income in Cripple Creek is $25,620.
What is the Median Family Income in Cripple Creek?
Median Family Income in Cripple Creek is $45,250.
What is the Median Household income in Cripple Creek?
Median Household Income in Cripple Creek is $36,783.
What is Income or Wage Gap in Cripple Creek?
Income or Wage Gap in Cripple Creek is 2.9%.
Women in Cripple Creek earn 97.1 cents for every dollar earned by a man.
What is Inequality or Gini Index in Cripple Creek?
Inequality or Gini Index in Cripple Creek is 0.44.
What is the Total Population of Cripple Creek?
Total Population of Cripple Creek is 1,093.
What is the Total Male Population of Cripple Creek?
Total Male Population of Cripple Creek is 571.
What is the Total Female Population of Cripple Creek?
Total Female Population of Cripple Creek is 522.
What is the Ratio of Males per 100 Females in Cripple Creek?
There are 109.39 Males per 100 Females in Cripple Creek.
What is the Ratio of Females per 100 Males in Cripple Creek?
There are 91.42 Females per 100 Males in Cripple Creek.
What is the Median Population Age in Cripple Creek?
Median Population Age in Cripple Creek is 50.3 Years.
What is the Average Family Size in Cripple Creek
Average Family Size in Cripple Creek is 2.8 People.
What is the Average Household Size in Cripple Creek
Average Household Size in Cripple Creek is 1.9 People.
How Large is the Labor Force in Cripple Creek?
There are 379 People in the Labor Forcein in Cripple Creek.
What is the Percentage of People in the Labor Force in Cripple Creek?
40.8% of People are in the Labor Force in Cripple Creek.
What is the Unemployment Rate in Cripple Creek?
Unemployment Rate in Cripple Creek is 8.4%.