Huetter, ID Map & Demographics
Huetter Map
Huetter Overview
$20,309
PER CAPITA INCOME
$36,282
AVG HOUSEHOLD INCOME
92.3%
WAGE / INCOME GAP [ % ]
7.7¢/ $1
WAGE / INCOME GAP [ $ ]
0.26
INEQUALITY / GINI INDEX
161
TOTAL POPULATION
109
MALE POPULATION
52
FEMALE POPULATION
209.62
MALES / 100 FEMALES
47.71
FEMALES / 100 MALES
32.2
MEDIAN AGE
2.6
AVG FAMILY SIZE
1.9
AVG HOUSEHOLD SIZE
92
LABOR FORCE [ PEOPLE ]
62.2%
PERCENT IN LABOR FORCE
Huetter Area Codes
Income in Huetter
Income Overview in Huetter
| Characteristic | Number | Measure |
| Per Capita Income | 161 | $20,309 |
| Median Family Income | 14 | $0 |
| Mean Family Income | 14 | $23,743 |
| Median Household Income | 68 | $36,282 |
| Mean Household Income | 68 | $38,926 |
| Income Deficit | 14 | $0 |
| Wage / Income Gap (%) | 161 | 92.34% |
| Wage / Income Gap ($) | 161 | 7.66¢ per $1 |
| Gini / Inequality Index | 161 | 0.26 |
Earnings by Sex in Huetter
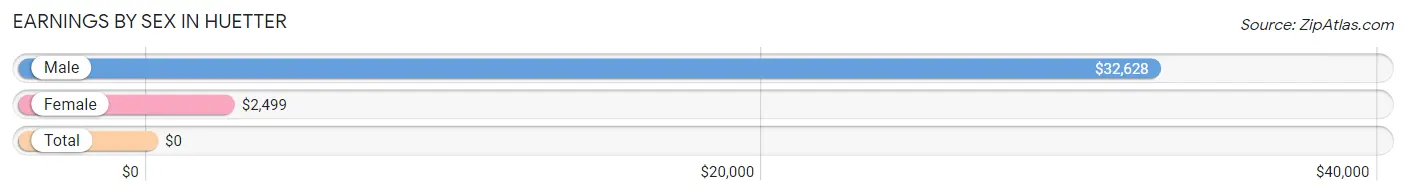
| Sex | Number | Average Earnings |
| Male | 100 (75.2%) | $32,628 |
| Female | 33 (24.8%) | $2,499 |
| Total | 133 (100.0%) | $0 |
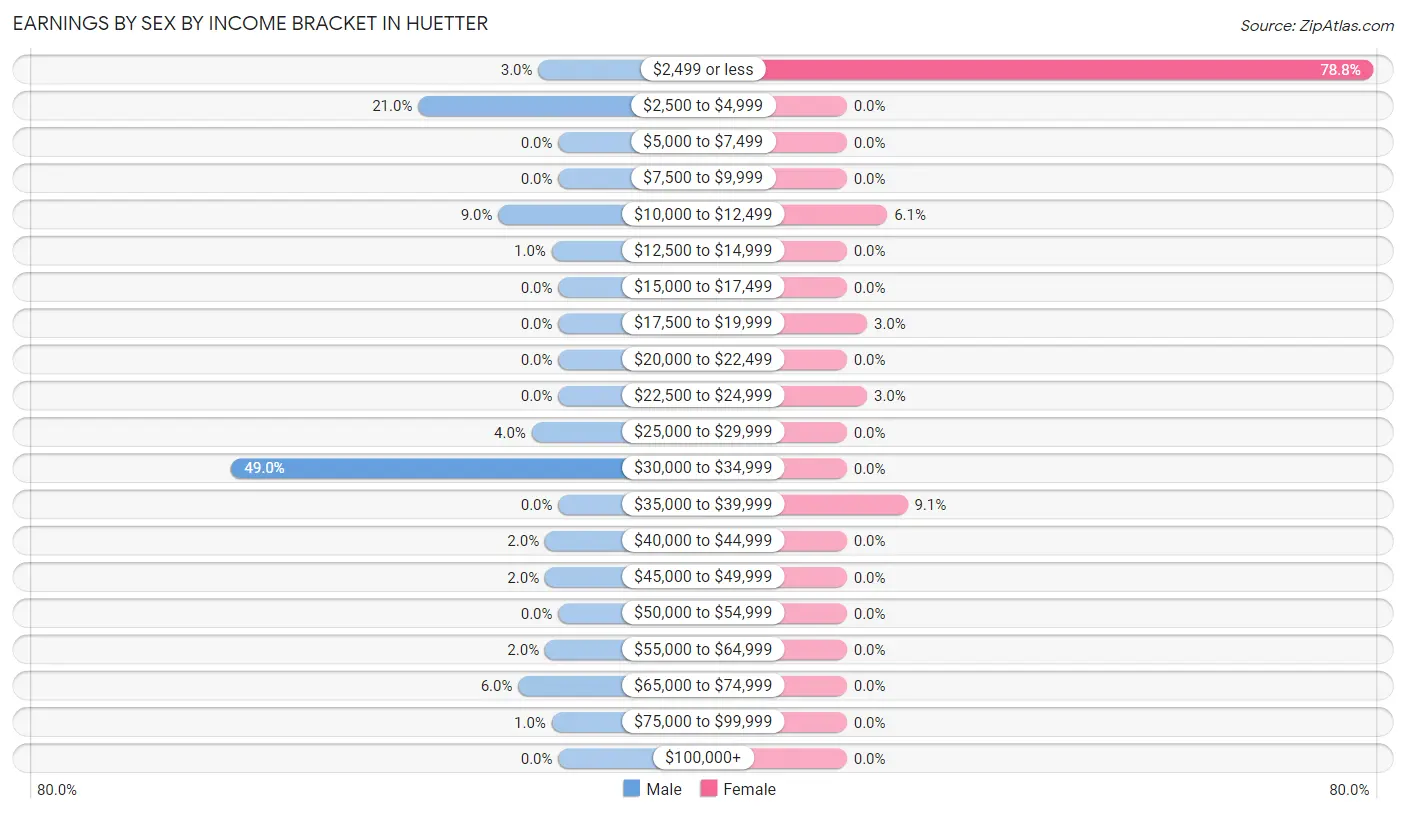
Earnings by Sex by Income Bracket in Huetter
The most common earnings brackets in Huetter are $30,000 to $34,999 for men (49 | 49.0%) and $2,499 or less for women (26 | 78.8%).
| Income | Male | Female |
| $2,499 or less | 3 (3.0%) | 26 (78.8%) |
| $2,500 to $4,999 | 21 (21.0%) | 0 (0.0%) |
| $5,000 to $7,499 | 0 (0.0%) | 0 (0.0%) |
| $7,500 to $9,999 | 0 (0.0%) | 0 (0.0%) |
| $10,000 to $12,499 | 9 (9.0%) | 2 (6.1%) |
| $12,500 to $14,999 | 1 (1.0%) | 0 (0.0%) |
| $15,000 to $17,499 | 0 (0.0%) | 0 (0.0%) |
| $17,500 to $19,999 | 0 (0.0%) | 1 (3.0%) |
| $20,000 to $22,499 | 0 (0.0%) | 0 (0.0%) |
| $22,500 to $24,999 | 0 (0.0%) | 1 (3.0%) |
| $25,000 to $29,999 | 4 (4.0%) | 0 (0.0%) |
| $30,000 to $34,999 | 49 (49.0%) | 0 (0.0%) |
| $35,000 to $39,999 | 0 (0.0%) | 3 (9.1%) |
| $40,000 to $44,999 | 2 (2.0%) | 0 (0.0%) |
| $45,000 to $49,999 | 2 (2.0%) | 0 (0.0%) |
| $50,000 to $54,999 | 0 (0.0%) | 0 (0.0%) |
| $55,000 to $64,999 | 2 (2.0%) | 0 (0.0%) |
| $65,000 to $74,999 | 6 (6.0%) | 0 (0.0%) |
| $75,000 to $99,999 | 1 (1.0%) | 0 (0.0%) |
| $100,000+ | 0 (0.0%) | 0 (0.0%) |
| Total | 100 (100.0%) | 33 (100.0%) |
Earnings by Sex by Educational Attainment in Huetter
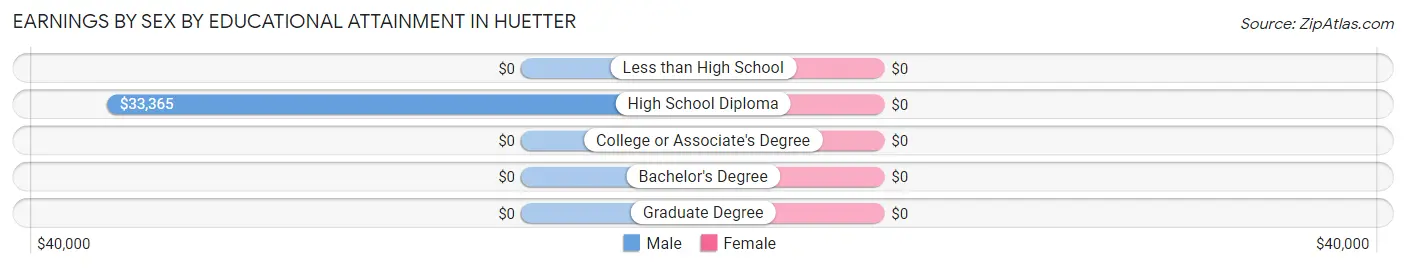
| Educational Attainment | Male Income | Female Income |
| Less than High School | - | - |
| High School Diploma | $33,365 | $0 |
| College or Associate's Degree | - | - |
| Bachelor's Degree | - | - |
| Graduate Degree | - | - |
| Total | $32,917 | $2,499 |
Family Income in Huetter
Family Income Brackets in Huetter
According to the Huetter family income data, there are 9 families falling into the less than $10,000 income range, which is the most common income bracket and makes up 64.3% of all families.
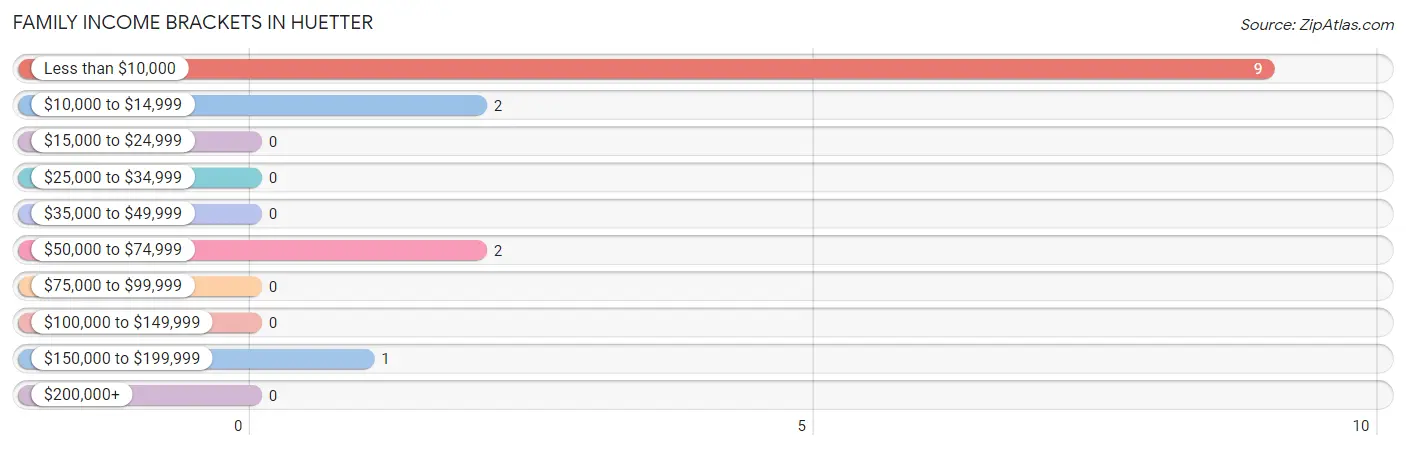
| Income Bracket | # Families | % Families |
| Less than $10,000 | 9 | 64.3% |
| $10,000 to $14,999 | 2 | 14.3% |
| $15,000 to $24,999 | 0 | 0.0% |
| $25,000 to $34,999 | 0 | 0.0% |
| $35,000 to $49,999 | 0 | 0.0% |
| $50,000 to $74,999 | 2 | 14.3% |
| $75,000 to $99,999 | 0 | 0.0% |
| $100,000 to $149,999 | 0 | 0.0% |
| $150,000 to $199,999 | 1 | 7.1% |
| $200,000+ | 0 | 0.0% |
Family Income by Famaliy Size in Huetter
| Income Bracket | # Families | Median Income |
| 2-Person Families | 11 (78.6%) | $0 |
| 3-Person Families | 1 (7.1%) | $0 |
| 4-Person Families | 2 (14.3%) | $0 |
| 5-Person Families | 0 (0.0%) | $0 |
| 6-Person Families | 0 (0.0%) | $0 |
| 7+ Person Families | 0 (0.0%) | $0 |
| Total | 14 (100.0%) | $0 |
Family Income by Number of Earners in Huetter
| Number of Earners | # Families | Median Income |
| No Earners | 2 (14.3%) | $0 |
| 1 Earner | 10 (71.4%) | $0 |
| 2 Earners | 2 (14.3%) | $0 |
| 3+ Earners | 0 (0.0%) | $0 |
| Total | 14 (100.0%) | $0 |
Household Income in Huetter
Household Income Brackets in Huetter
With 41 households falling in the category, the $35,000 to $49,999 income range is the most frequent in Huetter, accounting for 60.3% of all households.
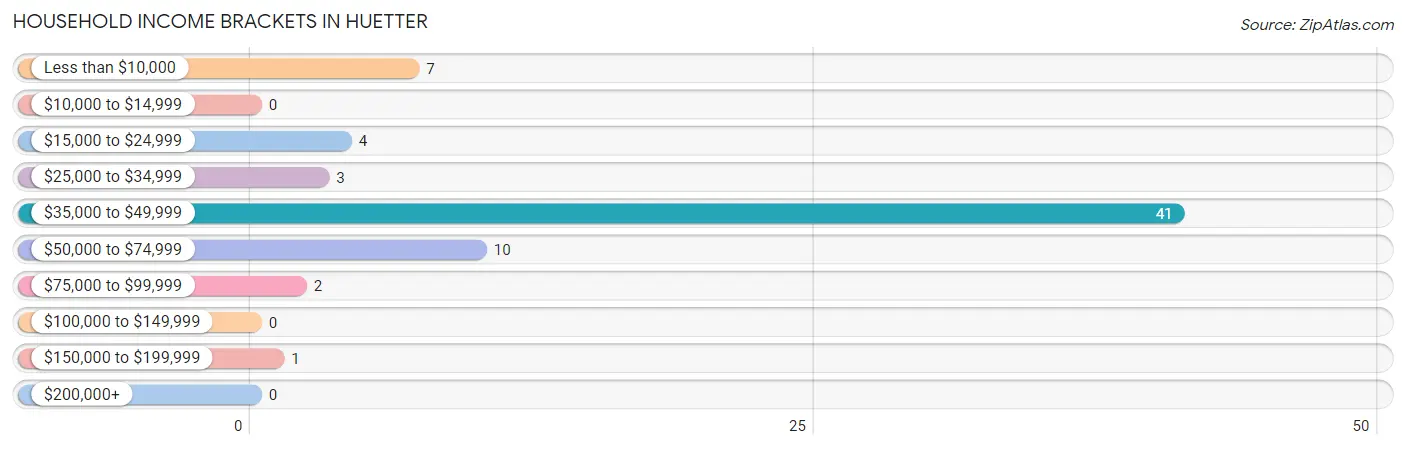
| Income Bracket | # Households | % Households |
| Less than $10,000 | 7 | 10.3% |
| $10,000 to $14,999 | 0 | 0.0% |
| $15,000 to $24,999 | 4 | 5.9% |
| $25,000 to $34,999 | 3 | 4.4% |
| $35,000 to $49,999 | 41 | 60.3% |
| $50,000 to $74,999 | 10 | 14.7% |
| $75,000 to $99,999 | 2 | 2.9% |
| $100,000 to $149,999 | 0 | 0.0% |
| $150,000 to $199,999 | 1 | 1.5% |
| $200,000+ | 0 | 0.0% |
Household Income by Householder Age in Huetter
The median household income in Huetter is $36,282, with the highest median household income of $36,186 found in the 25 to 44 years age bracket for the primary householder. A total of 55 households (80.9%) fall into this category.
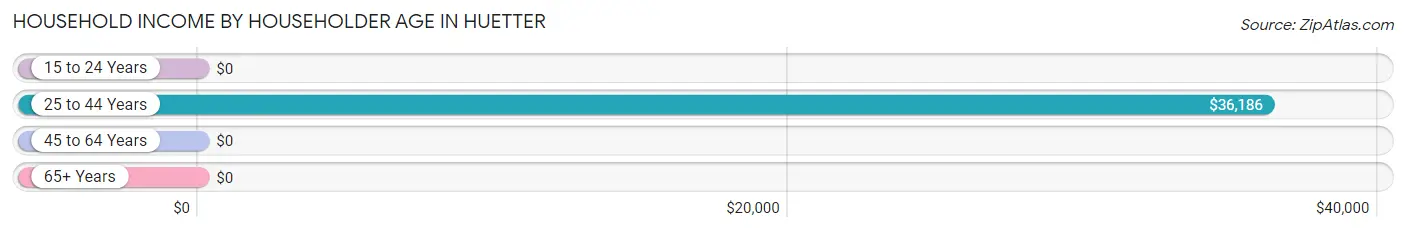
| Income Bracket | # Households | Median Income |
| 15 to 24 Years | 0 (0.0%) | $0 |
| 25 to 44 Years | 55 (80.9%) | $36,186 |
| 45 to 64 Years | 9 (13.2%) | $0 |
| 65+ Years | 4 (5.9%) | $0 |
| Total | 68 (100.0%) | $36,282 |
Poverty in Huetter
Income Below Poverty by Sex and Age in Huetter
With 20.9% poverty level for males and 86.5% for females among the residents of Huetter, 65 to 74 year old males and under 5 year old females are the most vulnerable to poverty, with 3 males (75.0%) and 11 females (100.0%) in their respective age groups living below the poverty level.
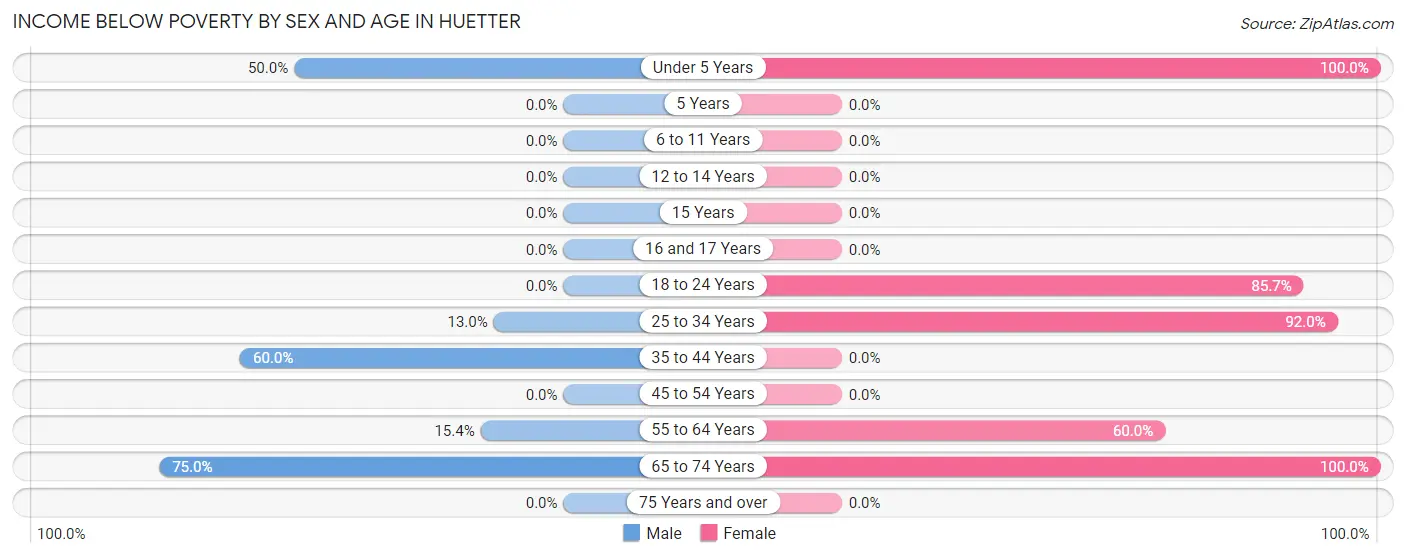
| Age Bracket | Male | Female |
| Under 5 Years | 1 (50.0%) | 11 (100.0%) |
| 5 Years | 0 (0.0%) | 0 (0.0%) |
| 6 to 11 Years | 0 (0.0%) | 0 (0.0%) |
| 12 to 14 Years | 0 (0.0%) | 0 (0.0%) |
| 15 Years | 0 (0.0%) | 0 (0.0%) |
| 16 and 17 Years | 0 (0.0%) | 0 (0.0%) |
| 18 to 24 Years | 0 (0.0%) | 6 (85.7%) |
| 25 to 34 Years | 7 (13.0%) | 23 (92.0%) |
| 35 to 44 Years | 6 (60.0%) | 0 (0.0%) |
| 45 to 54 Years | 0 (0.0%) | 0 (0.0%) |
| 55 to 64 Years | 2 (15.4%) | 3 (60.0%) |
| 65 to 74 Years | 3 (75.0%) | 2 (100.0%) |
| 75 Years and over | 0 (0.0%) | 0 (0.0%) |
| Total | 19 (20.9%) | 45 (86.5%) |
Income Above Poverty by Sex and Age in Huetter
According to the poverty statistics in Huetter, males aged 45 to 54 years and females aged 45 to 54 years are the age groups that are most secure financially, with 100.0% of males and 100.0% of females in these age groups living above the poverty line.
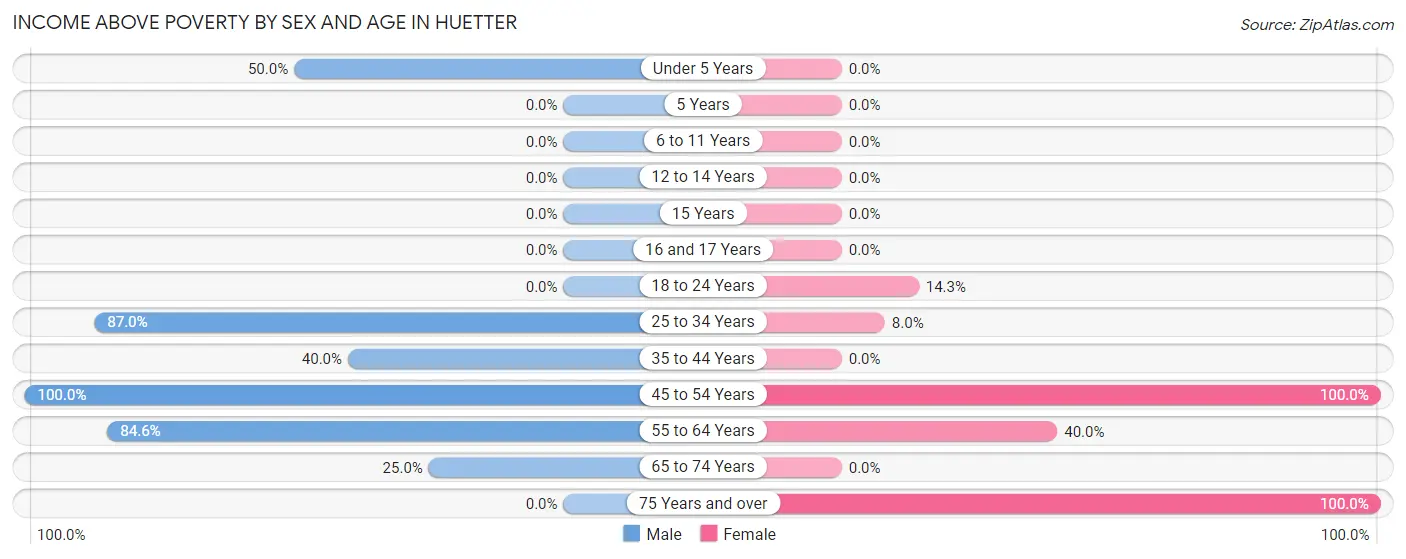
| Age Bracket | Male | Female |
| Under 5 Years | 1 (50.0%) | 0 (0.0%) |
| 5 Years | 0 (0.0%) | 0 (0.0%) |
| 6 to 11 Years | 0 (0.0%) | 0 (0.0%) |
| 12 to 14 Years | 0 (0.0%) | 0 (0.0%) |
| 15 Years | 0 (0.0%) | 0 (0.0%) |
| 16 and 17 Years | 0 (0.0%) | 0 (0.0%) |
| 18 to 24 Years | 0 (0.0%) | 1 (14.3%) |
| 25 to 34 Years | 47 (87.0%) | 2 (8.0%) |
| 35 to 44 Years | 4 (40.0%) | 0 (0.0%) |
| 45 to 54 Years | 8 (100.0%) | 1 (100.0%) |
| 55 to 64 Years | 11 (84.6%) | 2 (40.0%) |
| 65 to 74 Years | 1 (25.0%) | 0 (0.0%) |
| 75 Years and over | 0 (0.0%) | 1 (100.0%) |
| Total | 72 (79.1%) | 7 (13.5%) |
Income Below Poverty Among Married-Couple Families in Huetter
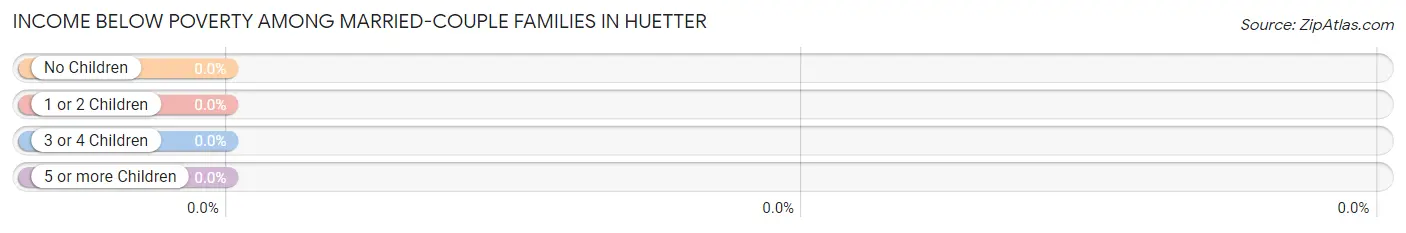
| Children | Above Poverty | Below Poverty |
| No Children | 2 (100.0%) | 0 (0.0%) |
| 1 or 2 Children | 1 (100.0%) | 0 (0.0%) |
| 3 or 4 Children | 0 (0.0%) | 0 (0.0%) |
| 5 or more Children | 0 (0.0%) | 0 (0.0%) |
| Total | 3 (100.0%) | 0 (0.0%) |
Income Below Poverty Among Single-Parent Households in Huetter
According to the poverty data in Huetter, 100.0% or 7 single-father households and 100.0% or 4 single-mother households are living below the poverty line. Among single-father households, those with 1 or 2 children have the highest poverty rate, with 7 households (100.0%) experiencing poverty. Likewise, among single-mother households, those with 1 or 2 children have the highest poverty rate, with 4 households (100.0%) falling below the poverty line.
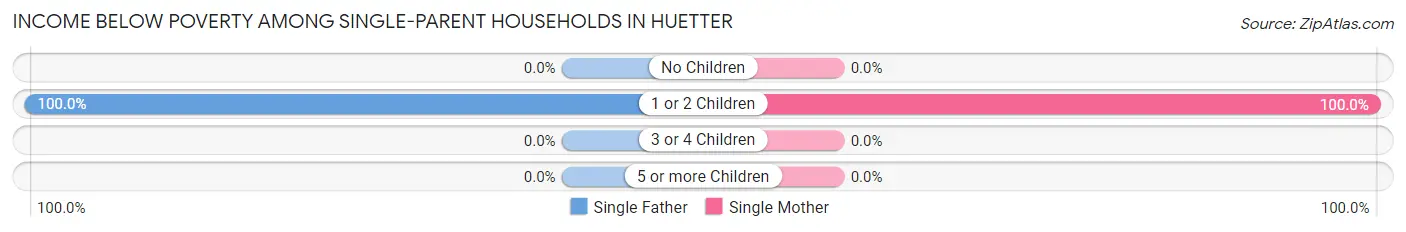
| Children | Single Father | Single Mother |
| No Children | 0 (0.0%) | 0 (0.0%) |
| 1 or 2 Children | 7 (100.0%) | 4 (100.0%) |
| 3 or 4 Children | 0 (0.0%) | 0 (0.0%) |
| 5 or more Children | 0 (0.0%) | 0 (0.0%) |
| Total | 7 (100.0%) | 4 (100.0%) |
Income Below Poverty Among Married-Couple vs Single-Parent Households in Huetter
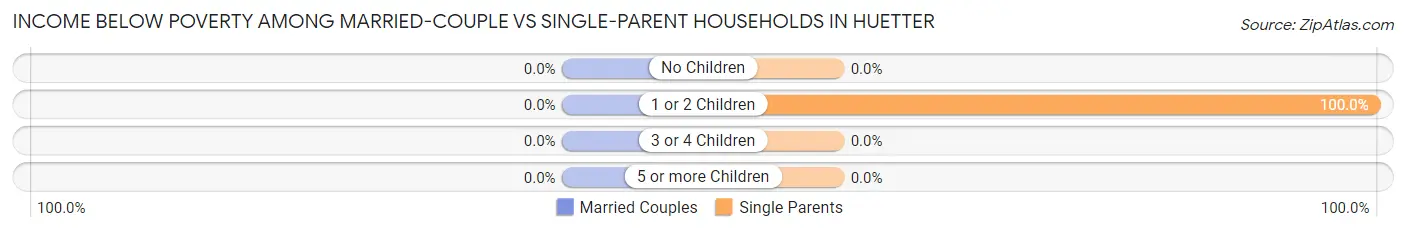
| Children | Married-Couple Families | Single-Parent Households |
| No Children | 0 (0.0%) | 0 (0.0%) |
| 1 or 2 Children | 0 (0.0%) | 11 (100.0%) |
| 3 or 4 Children | 0 (0.0%) | 0 (0.0%) |
| 5 or more Children | 0 (0.0%) | 0 (0.0%) |
| Total | 0 (0.0%) | 11 (100.0%) |
Race in Huetter
The most populous races in Huetter are White / Caucasian (127 | 78.9%), Two or more Races (30 | 18.6%), and Hispanic or Latino (15 | 9.3%).
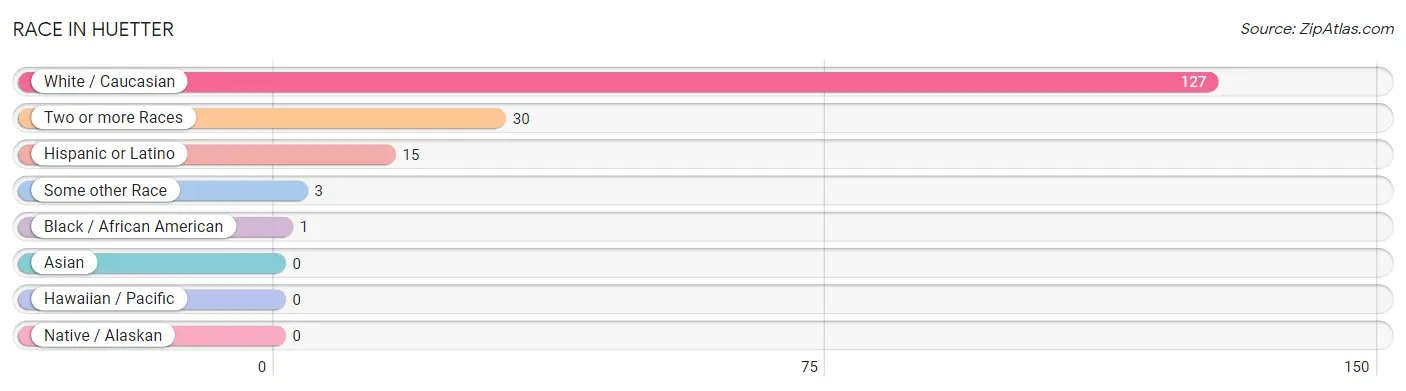
| Race | # Population | % Population |
| Asian | 0 | 0.0% |
| Black / African American | 1 | 0.6% |
| Hawaiian / Pacific | 0 | 0.0% |
| Hispanic or Latino | 15 | 9.3% |
| Native / Alaskan | 0 | 0.0% |
| White / Caucasian | 127 | 78.9% |
| Two or more Races | 30 | 18.6% |
| Some other Race | 3 | 1.9% |
| Total | 161 | 100.0% |
Ancestry in Huetter
The most populous ancestries reported in Huetter are French (41 | 25.5%), Scottish (39 | 24.2%), English (29 | 18.0%), Scotch-Irish (21 | 13.0%), and German (18 | 11.2%), together accounting for 91.9% of all Huetter residents.
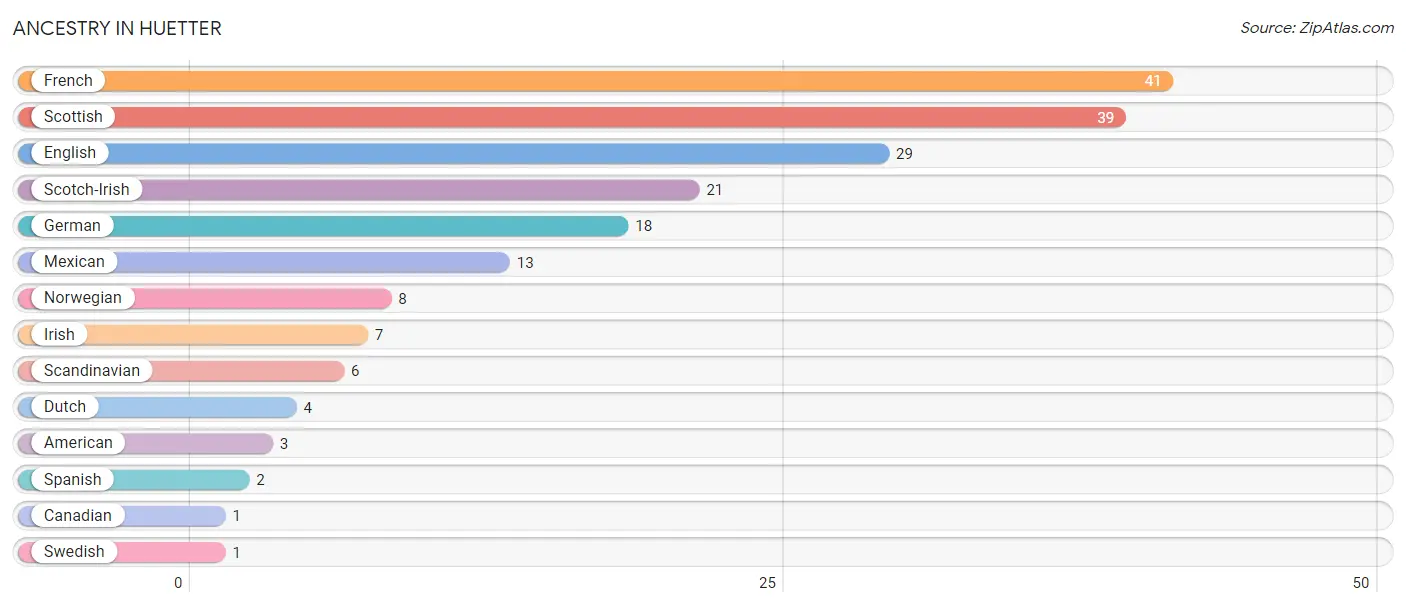
| Ancestry | # Population | % Population |
| American | 3 | 1.9% |
| Canadian | 1 | 0.6% |
| Dutch | 4 | 2.5% |
| English | 29 | 18.0% |
| French | 41 | 25.5% |
| German | 18 | 11.2% |
| Irish | 7 | 4.3% |
| Mexican | 13 | 8.1% |
| Norwegian | 8 | 5.0% |
| Scandinavian | 6 | 3.7% |
| Scotch-Irish | 21 | 13.0% |
| Scottish | 39 | 24.2% |
| Spanish | 2 | 1.2% |
| Swedish | 1 | 0.6% | View All 14 Rows |
Immigrants in Huetter
The most numerous immigrant groups reported in Huetter came from Central America (3 | 1.9%), Latin America (3 | 1.9%), Mexico (3 | 1.9%), and Canada (1 | 0.6%), together accounting for 6.2% of all Huetter residents.
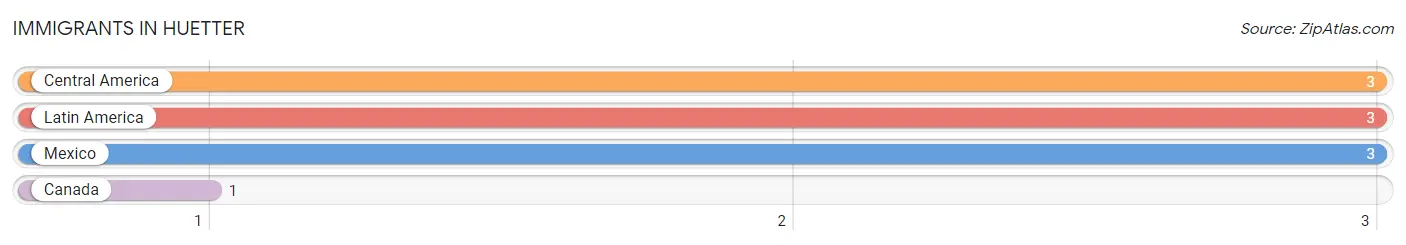
| Immigration Origin | # Population | % Population |
| Canada | 1 | 0.6% |
| Central America | 3 | 1.9% |
| Latin America | 3 | 1.9% |
| Mexico | 3 | 1.9% | View All 4 Rows |
Sex and Age in Huetter
Sex and Age in Huetter
The most populous age groups in Huetter are 30 to 34 Years (48 | 44.0%) for men and 25 to 29 Years (24 | 46.2%) for women.
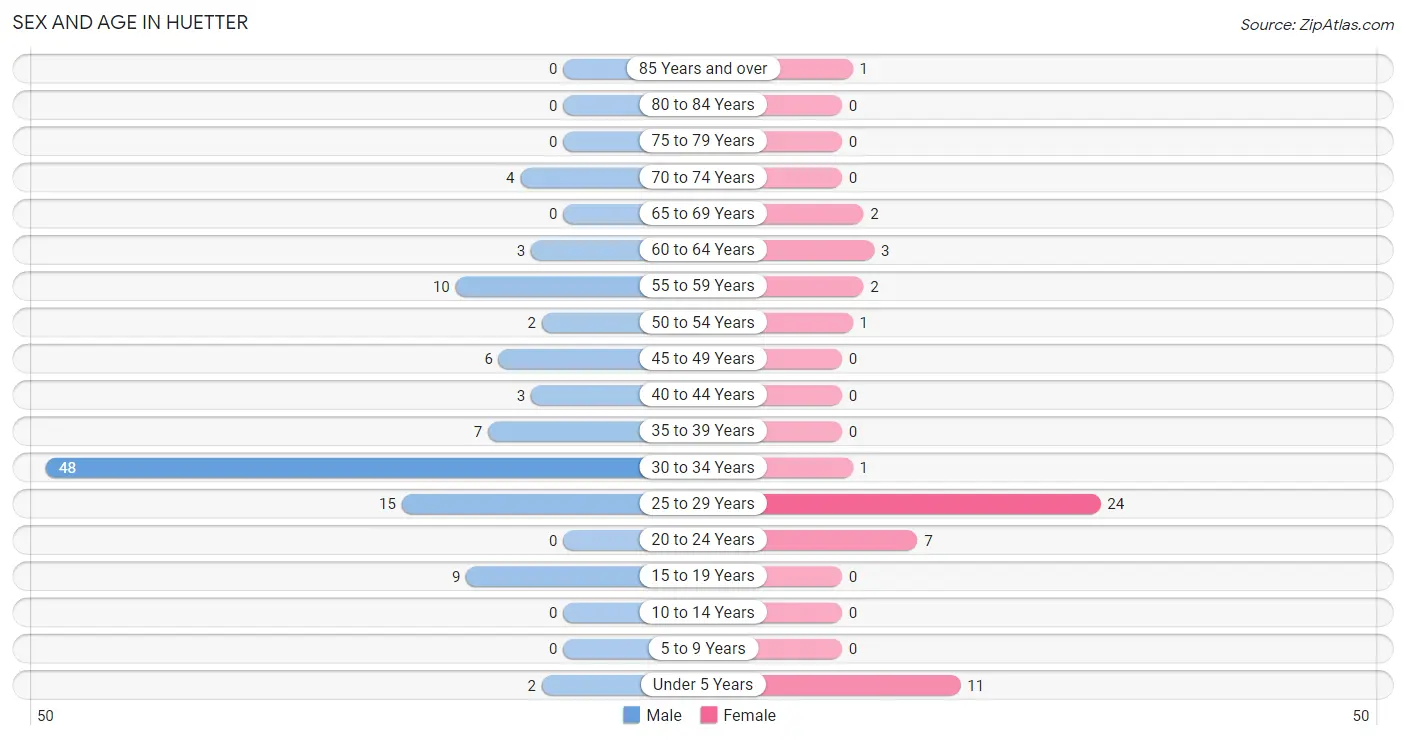
| Age Bracket | Male | Female |
| Under 5 Years | 2 (1.8%) | 11 (21.1%) |
| 5 to 9 Years | 0 (0.0%) | 0 (0.0%) |
| 10 to 14 Years | 0 (0.0%) | 0 (0.0%) |
| 15 to 19 Years | 9 (8.3%) | 0 (0.0%) |
| 20 to 24 Years | 0 (0.0%) | 7 (13.5%) |
| 25 to 29 Years | 15 (13.8%) | 24 (46.2%) |
| 30 to 34 Years | 48 (44.0%) | 1 (1.9%) |
| 35 to 39 Years | 7 (6.4%) | 0 (0.0%) |
| 40 to 44 Years | 3 (2.8%) | 0 (0.0%) |
| 45 to 49 Years | 6 (5.5%) | 0 (0.0%) |
| 50 to 54 Years | 2 (1.8%) | 1 (1.9%) |
| 55 to 59 Years | 10 (9.2%) | 2 (3.8%) |
| 60 to 64 Years | 3 (2.8%) | 3 (5.8%) |
| 65 to 69 Years | 0 (0.0%) | 2 (3.8%) |
| 70 to 74 Years | 4 (3.7%) | 0 (0.0%) |
| 75 to 79 Years | 0 (0.0%) | 0 (0.0%) |
| 80 to 84 Years | 0 (0.0%) | 0 (0.0%) |
| 85 Years and over | 0 (0.0%) | 1 (1.9%) |
| Total | 109 (100.0%) | 52 (100.0%) |
Families and Households in Huetter
Median Family Size in Huetter
The median family size in Huetter is 2.57 persons per family, with single female/mother families (4 | 28.6%) accounting for the largest median family size of 3.25 persons per family. On the other hand, single male/father families (7 | 50.0%) represent the smallest median family size with 2.00 persons per family.
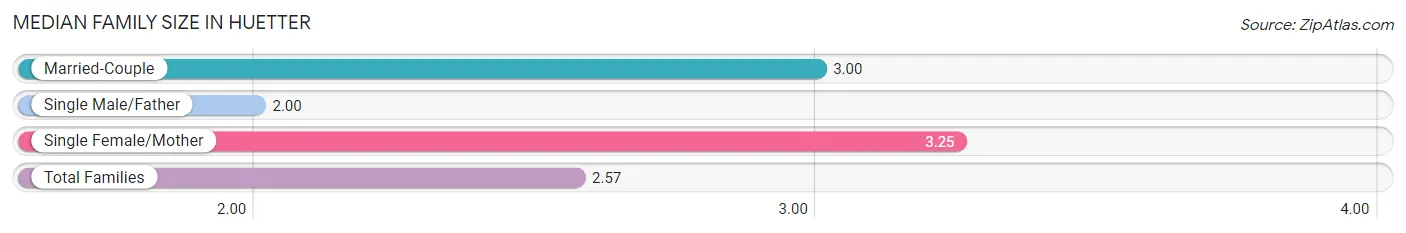
| Family Type | # Families | Family Size |
| Married-Couple | 3 (21.4%) | 3.00 |
| Single Male/Father | 7 (50.0%) | 2.00 |
| Single Female/Mother | 4 (28.6%) | 3.25 |
| Total Families | 14 (100.0%) | 2.57 |
Median Household Size in Huetter
The median household size in Huetter is 1.90 persons per household, with single female/mother households (4 | 5.9%) accounting for the largest median household size of 4.5 persons per household. non-family households (54 | 79.4%) represent the smallest median household size with 1.54 persons per household.
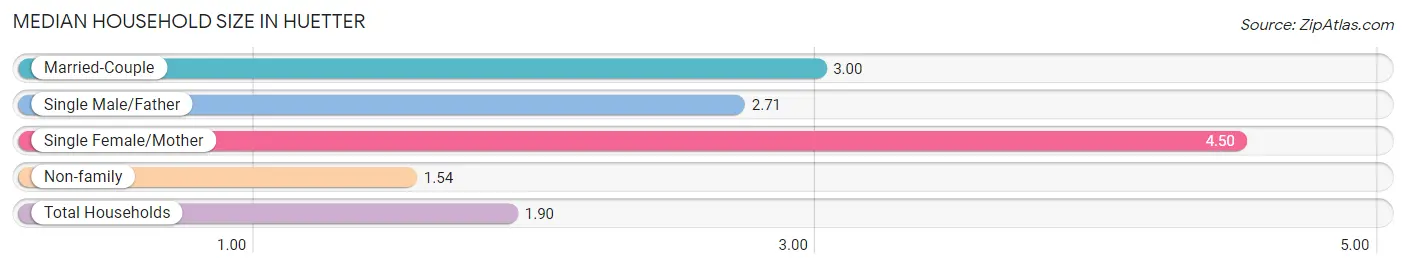
| Household Type | # Households | Household Size |
| Married-Couple | 3 (4.4%) | 3.00 |
| Single Male/Father | 7 (10.3%) | 2.71 |
| Single Female/Mother | 4 (5.9%) | 4.50 |
| Non-family | 54 (79.4%) | 1.54 |
| Total Households | 68 (100.0%) | 1.90 |
Household Size by Marriage Status in Huetter
Out of a total of 68 households in Huetter, 14 (20.6%) are family households, while 54 (79.4%) are nonfamily households. The most numerous type of family households are 3-person households, comprising 10, and the most common type of nonfamily households are 2-person households, comprising 43.
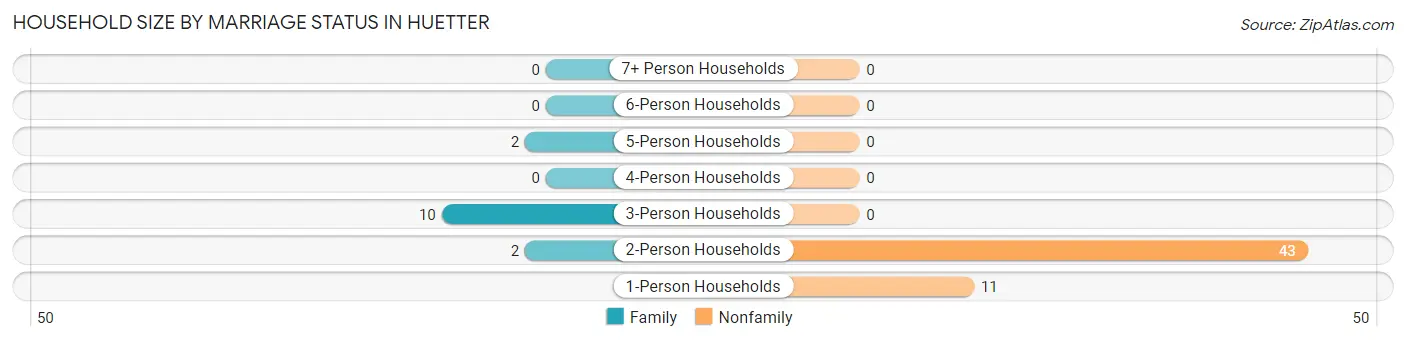
| Household Size | Family Households | Nonfamily Households |
| 1-Person Households | - | 11 (16.2%) |
| 2-Person Households | 2 (2.9%) | 43 (63.2%) |
| 3-Person Households | 10 (14.7%) | 0 (0.0%) |
| 4-Person Households | 0 (0.0%) | 0 (0.0%) |
| 5-Person Households | 2 (2.9%) | 0 (0.0%) |
| 6-Person Households | 0 (0.0%) | 0 (0.0%) |
| 7+ Person Households | 0 (0.0%) | 0 (0.0%) |
| Total | 14 (20.6%) | 54 (79.4%) |
Female Fertility in Huetter
Fertility by Age in Huetter
Average fertility rate in Huetter is 219.0 births per 1,000 women. Women in the age bracket of 20 to 34 years have the highest fertility rate with 219.0 births per 1,000 women. Women in the age bracket of 20 to 34 years acount for 100.0% of all women with births.
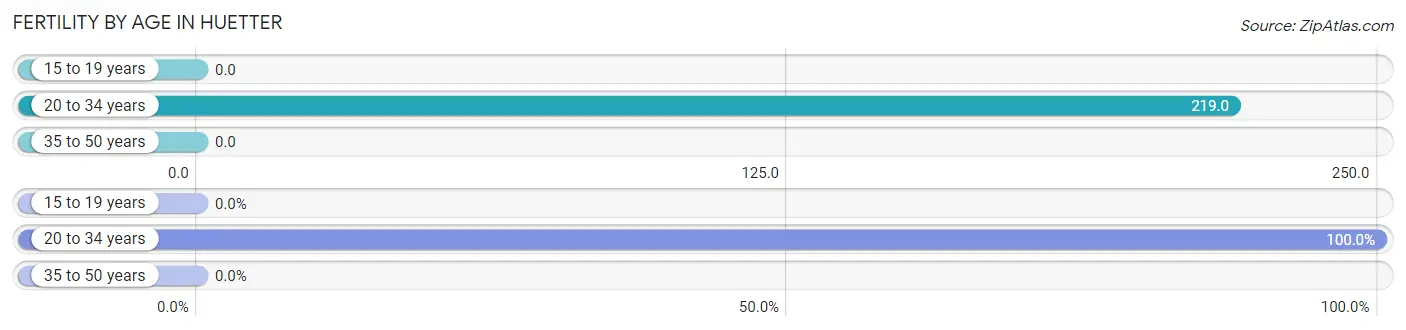
| Age Bracket | Women with Births | Births / 1,000 Women |
| 15 to 19 years | 0 (0.0%) | 0.0 |
| 20 to 34 years | 7 (100.0%) | 219.0 |
| 35 to 50 years | 0 (0.0%) | 0.0 |
| Total | 7 (100.0%) | 219.0 |
Fertility by Age by Marriage Status in Huetter
28.6% of women with births (7) in Huetter are married. The highest percentage of unmarried women with births falls into 20 to 34 years age bracket with 71.4% of them unmarried at the time of birth, while the lowest percentage of unmarried women with births belong to 20 to 34 years age bracket with 71.4% of them unmarried.
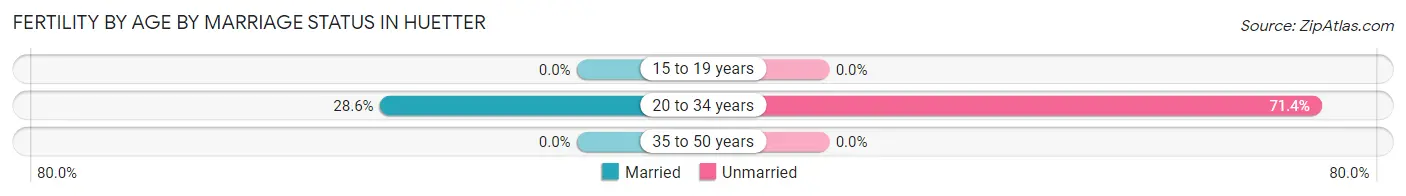
| Age Bracket | Married | Unmarried |
| 15 to 19 years | 0 (0.0%) | 0 (0.0%) |
| 20 to 34 years | 2 (28.6%) | 5 (71.4%) |
| 35 to 50 years | 0 (0.0%) | 0 (0.0%) |
| Total | 2 (28.6%) | 5 (71.4%) |
Fertility by Education in Huetter
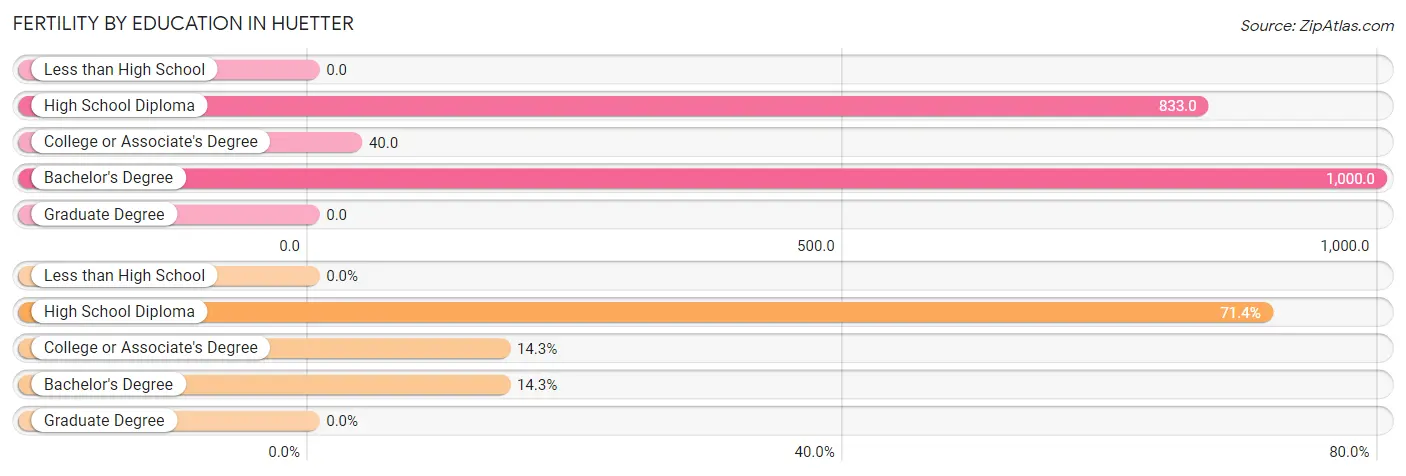
| Educational Attainment | Women with Births | Births / 1,000 Women |
| Less than High School | 0 (0.0%) | 0.0 |
| High School Diploma | 5 (71.4%) | 833.0 |
| College or Associate's Degree | 1 (14.3%) | 40.0 |
| Bachelor's Degree | 1 (14.3%) | 1,000.0 |
| Graduate Degree | 0 (0.0%) | 0.0 |
| Total | 7 (100.0%) | 219.0 |
Fertility by Education by Marriage Status in Huetter
71.4% of women with births in Huetter are unmarried. Women with the educational attainment of college or associate's degree are most likely to be married with 100.0% of them married at childbirth, while women with the educational attainment of high school diploma are least likely to be married with 100.0% of them unmarried at childbirth.
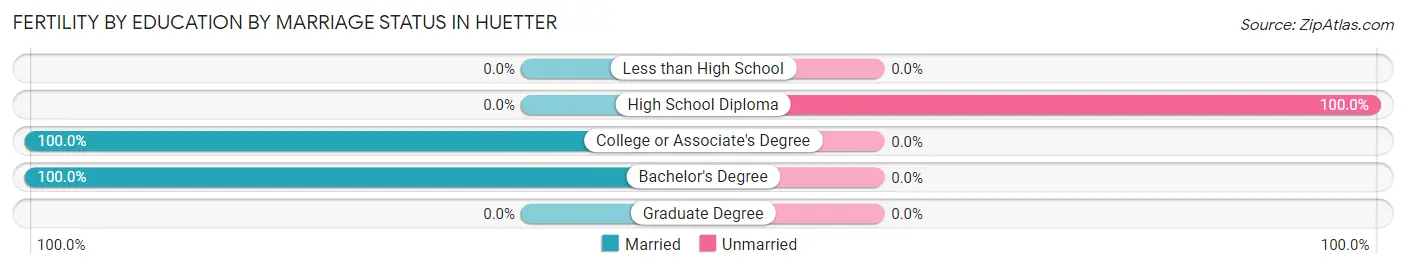
| Educational Attainment | Married | Unmarried |
| Less than High School | 0 (0.0%) | 0 (0.0%) |
| High School Diploma | 0 (0.0%) | 5 (100.0%) |
| College or Associate's Degree | 1 (100.0%) | 0 (0.0%) |
| Bachelor's Degree | 1 (100.0%) | 0 (0.0%) |
| Graduate Degree | 0 (0.0%) | 0 (0.0%) |
| Total | 2 (28.6%) | 5 (71.4%) |
Employment Characteristics in Huetter
Employment by Class of Employer in Huetter
Among the 92 employed individuals in Huetter, local government employees (42 | 45.7%), private company employees (39 | 42.4%), and federal government employees (5 | 5.4%) make up the most common classes of employment.
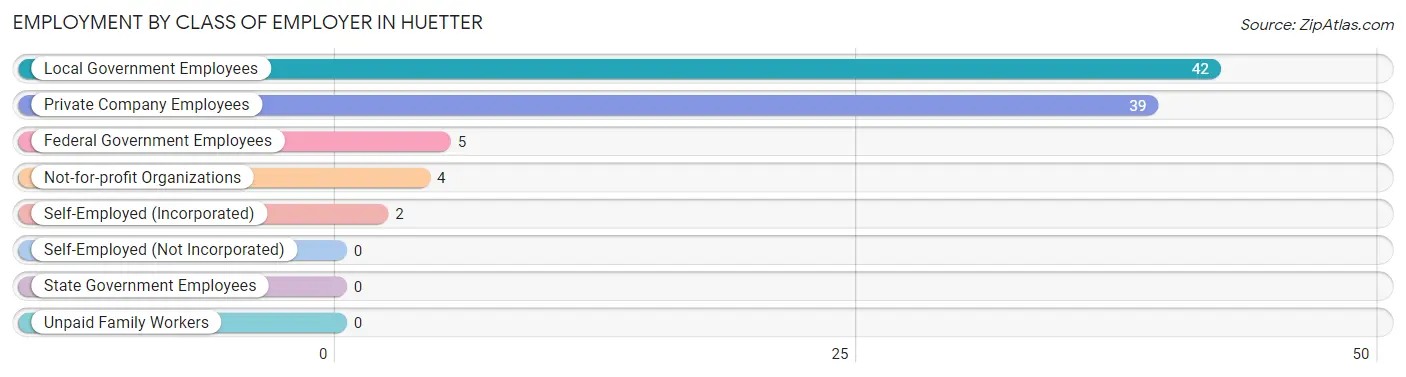
| Employer Class | # Employees | % Employees |
| Private Company Employees | 39 | 42.4% |
| Self-Employed (Incorporated) | 2 | 2.2% |
| Self-Employed (Not Incorporated) | 0 | 0.0% |
| Not-for-profit Organizations | 4 | 4.3% |
| Local Government Employees | 42 | 45.7% |
| State Government Employees | 0 | 0.0% |
| Federal Government Employees | 5 | 5.4% |
| Unpaid Family Workers | 0 | 0.0% |
| Total | 92 | 100.0% |
Employment Status by Age in Huetter
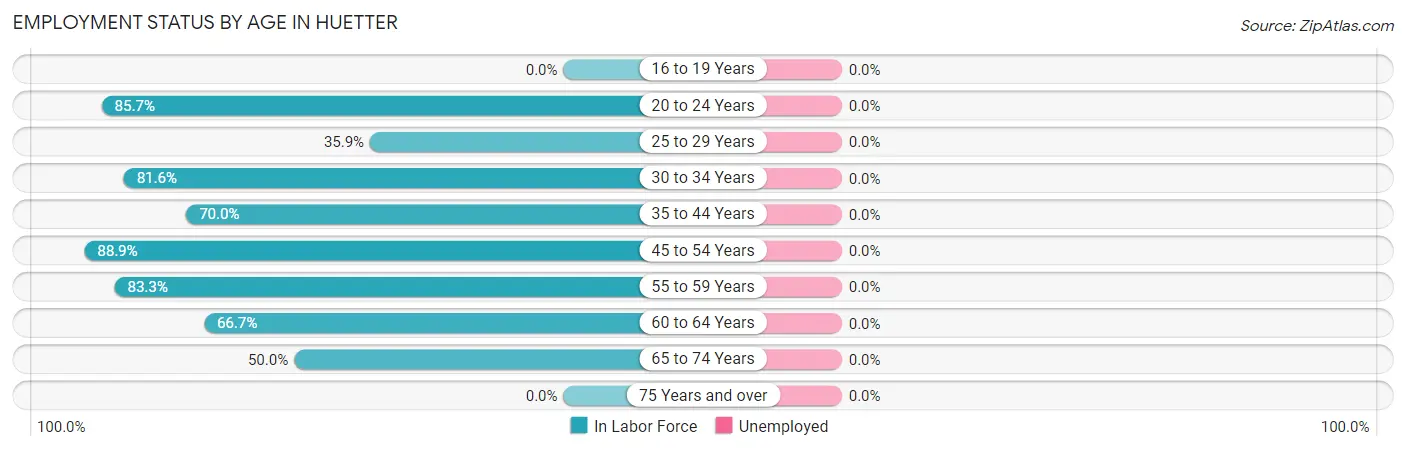
| Age Bracket | In Labor Force | Unemployed |
| 16 to 19 Years | 0 (0.0%) | 0 (0.0%) |
| 20 to 24 Years | 6 (85.7%) | 0 (0.0%) |
| 25 to 29 Years | 14 (35.9%) | 0 (0.0%) |
| 30 to 34 Years | 40 (81.6%) | 0 (0.0%) |
| 35 to 44 Years | 7 (70.0%) | 0 (0.0%) |
| 45 to 54 Years | 8 (88.9%) | 0 (0.0%) |
| 55 to 59 Years | 10 (83.3%) | 0 (0.0%) |
| 60 to 64 Years | 4 (66.7%) | 0 (0.0%) |
| 65 to 74 Years | 3 (50.0%) | 0 (0.0%) |
| 75 Years and over | 0 (0.0%) | 0 (0.0%) |
| Total | 92 (62.2%) | 0 (0.0%) |
Employment Status by Educational Attainment in Huetter
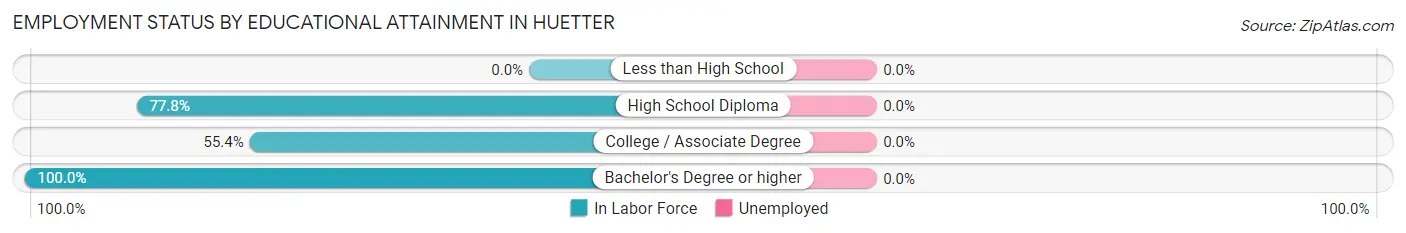
| Educational Attainment | In Labor Force | Unemployed |
| Less than High School | 0 (0.0%) | 0 (0.0%) |
| High School Diploma | 49 (77.8%) | 0 (0.0%) |
| College / Associate Degree | 31 (55.4%) | 0 (0.0%) |
| Bachelor's Degree or higher | 3 (100.0%) | 0 (0.0%) |
| Total | 83 (66.4%) | 0 (0.0%) |
Employment Occupations by Sex in Huetter
Management, Business, Science and Arts Occupations
The most common Management, Business, Science and Arts occupations in Huetter are Computers, Engineering & Science (5 | 5.4%), Life, Physical & Social Science (5 | 5.4%), Health Diagnosing & Treating (4 | 4.3%), Management (3 | 3.3%), and Health Technologists (2 | 2.2%).
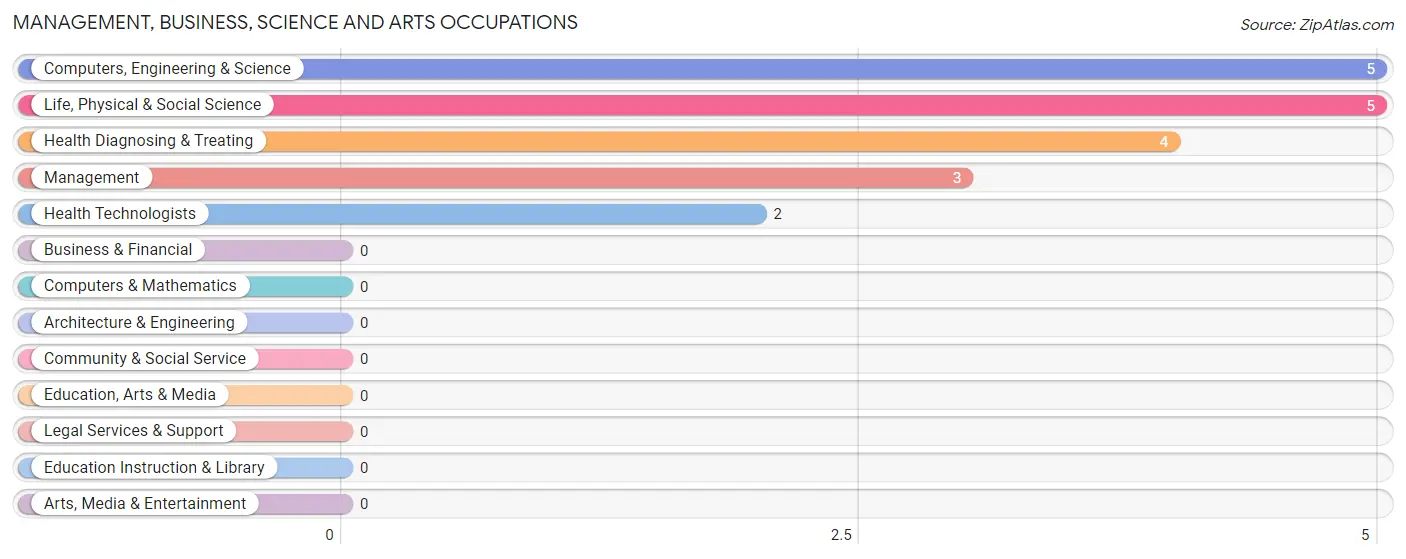
Management, Business, Science and Arts Occupations by Sex
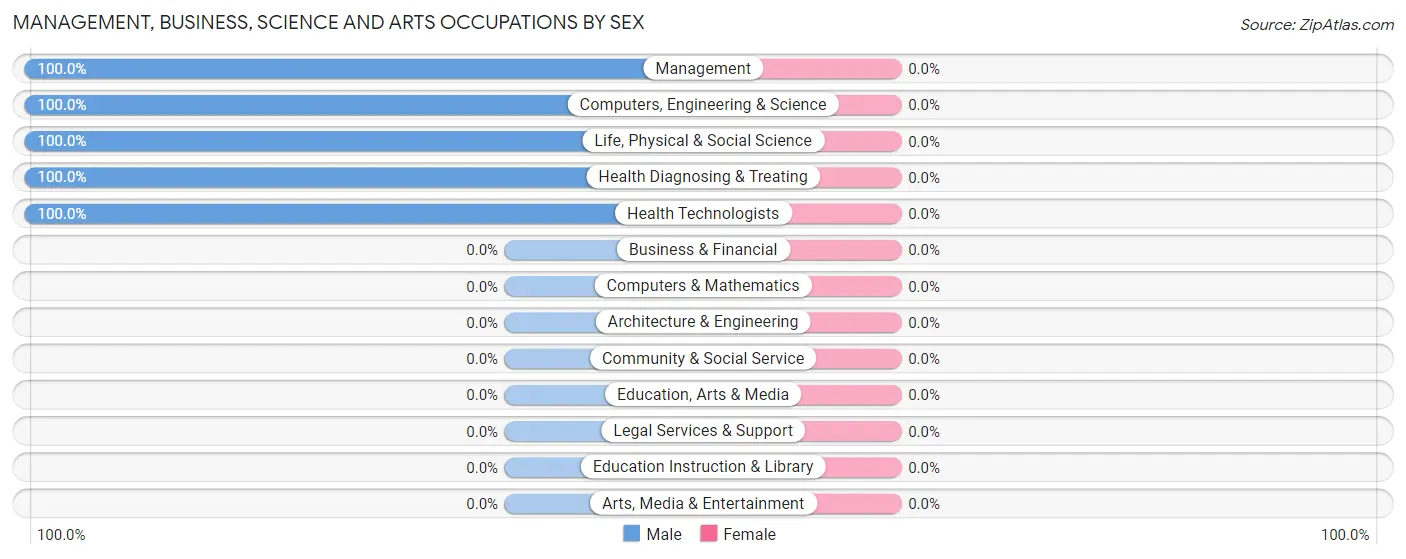
| Occupation | Male | Female |
| Management | 3 (100.0%) | 0 (0.0%) |
| Business & Financial | 0 (0.0%) | 0 (0.0%) |
| Computers, Engineering & Science | 5 (100.0%) | 0 (0.0%) |
| Computers & Mathematics | 0 (0.0%) | 0 (0.0%) |
| Architecture & Engineering | 0 (0.0%) | 0 (0.0%) |
| Life, Physical & Social Science | 5 (100.0%) | 0 (0.0%) |
| Community & Social Service | 0 (0.0%) | 0 (0.0%) |
| Education, Arts & Media | 0 (0.0%) | 0 (0.0%) |
| Legal Services & Support | 0 (0.0%) | 0 (0.0%) |
| Education Instruction & Library | 0 (0.0%) | 0 (0.0%) |
| Arts, Media & Entertainment | 0 (0.0%) | 0 (0.0%) |
| Health Diagnosing & Treating | 4 (100.0%) | 0 (0.0%) |
| Health Technologists | 2 (100.0%) | 0 (0.0%) |
| Total (Category) | 12 (100.0%) | 0 (0.0%) |
| Total (Overall) | 80 (87.0%) | 12 (13.0%) |
Services Occupations
The most common Services occupations in Huetter are Cleaning & Maintenance (39 | 42.4%), and Food Preparation & Serving (10 | 10.9%).
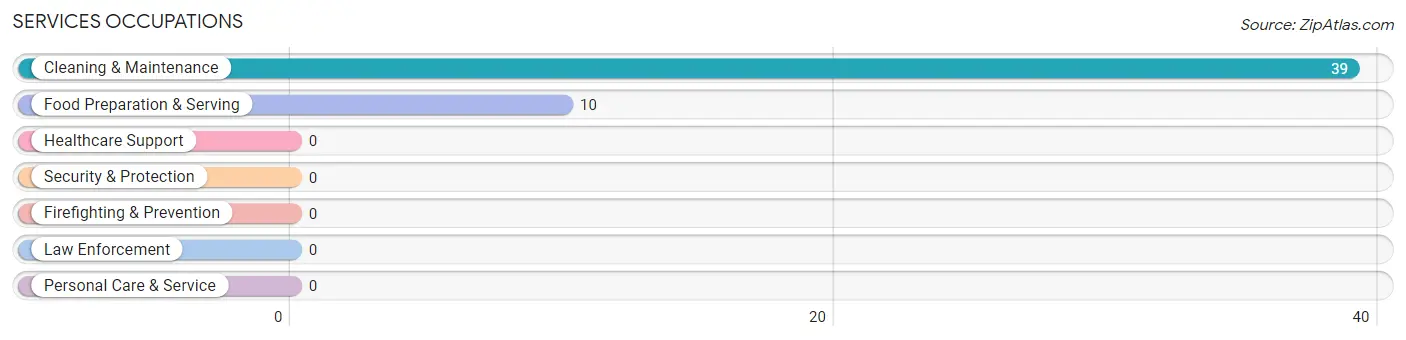
Services Occupations by Sex
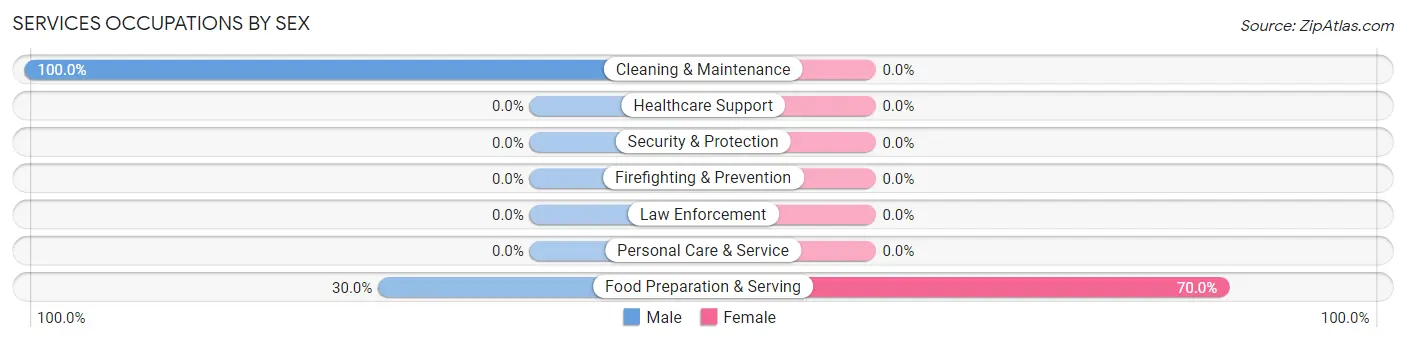
| Occupation | Male | Female |
| Healthcare Support | 0 (0.0%) | 0 (0.0%) |
| Security & Protection | 0 (0.0%) | 0 (0.0%) |
| Firefighting & Prevention | 0 (0.0%) | 0 (0.0%) |
| Law Enforcement | 0 (0.0%) | 0 (0.0%) |
| Food Preparation & Serving | 3 (30.0%) | 7 (70.0%) |
| Cleaning & Maintenance | 39 (100.0%) | 0 (0.0%) |
| Personal Care & Service | 0 (0.0%) | 0 (0.0%) |
| Total (Category) | 42 (85.7%) | 7 (14.3%) |
| Total (Overall) | 80 (87.0%) | 12 (13.0%) |
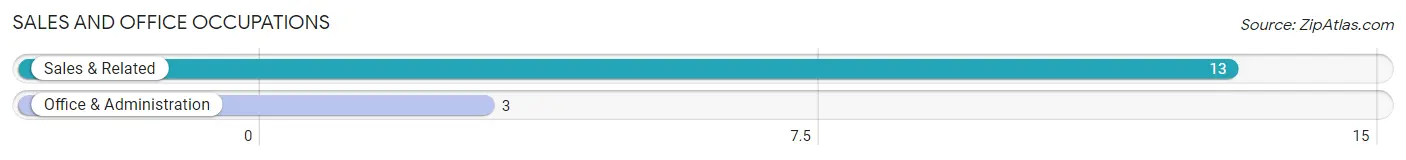
Sales and Office Occupations
The most common Sales and Office occupations in Huetter are Sales & Related (13 | 14.1%), and Office & Administration (3 | 3.3%).
Sales and Office Occupations by Sex
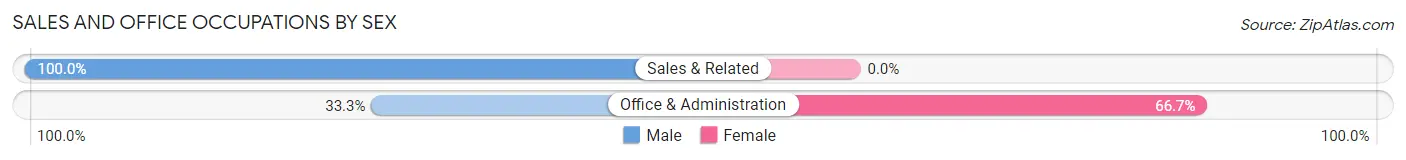
| Occupation | Male | Female |
| Sales & Related | 13 (100.0%) | 0 (0.0%) |
| Office & Administration | 1 (33.3%) | 2 (66.7%) |
| Total (Category) | 14 (87.5%) | 2 (12.5%) |
| Total (Overall) | 80 (87.0%) | 12 (13.0%) |
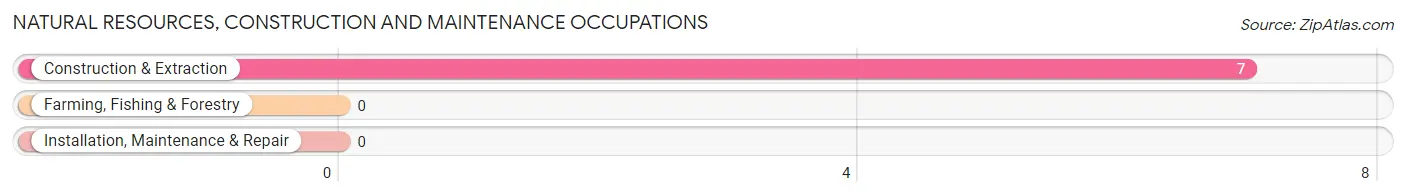
Natural Resources, Construction and Maintenance Occupations
The most common Natural Resources, Construction and Maintenance occupations in Huetter are , and Construction & Extraction (7 | 7.6%).
Natural Resources, Construction and Maintenance Occupations by Sex
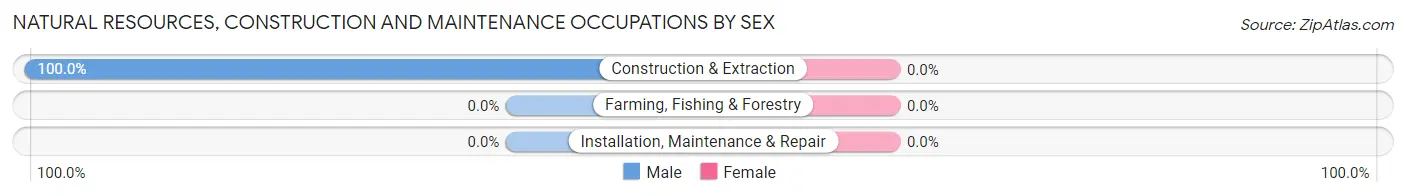
| Occupation | Male | Female |
| Farming, Fishing & Forestry | 0 (0.0%) | 0 (0.0%) |
| Construction & Extraction | 7 (100.0%) | 0 (0.0%) |
| Installation, Maintenance & Repair | 0 (0.0%) | 0 (0.0%) |
| Total (Category) | 7 (100.0%) | 0 (0.0%) |
| Total (Overall) | 80 (87.0%) | 12 (13.0%) |
Production, Transportation and Moving Occupations
The most common Production, Transportation and Moving occupations in Huetter are Production (4 | 4.3%), Material Moving (3 | 3.3%), and Transportation (1 | 1.1%).
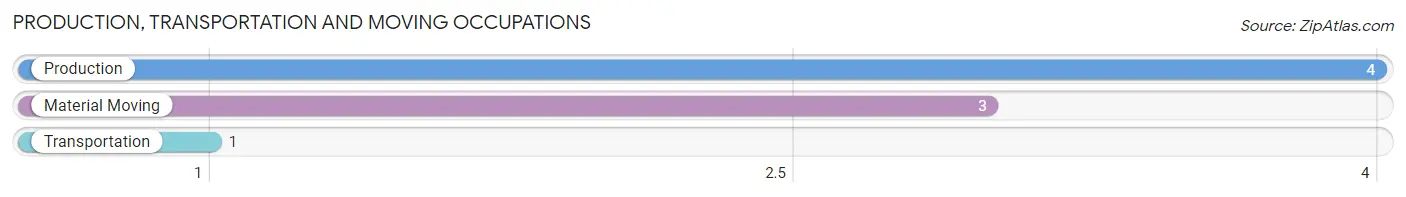
Production, Transportation and Moving Occupations by Sex
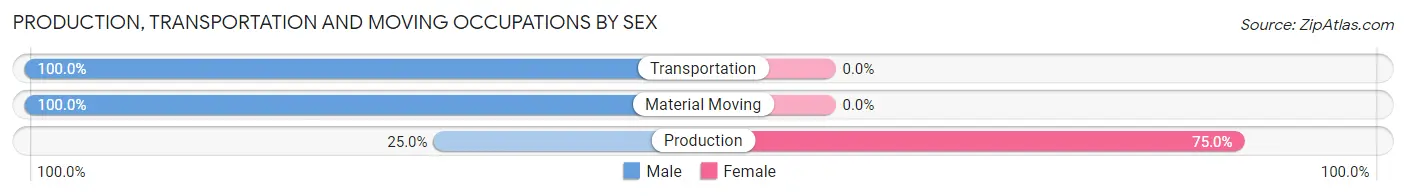
| Occupation | Male | Female |
| Production | 1 (25.0%) | 3 (75.0%) |
| Transportation | 1 (100.0%) | 0 (0.0%) |
| Material Moving | 3 (100.0%) | 0 (0.0%) |
| Total (Category) | 5 (62.5%) | 3 (37.5%) |
| Total (Overall) | 80 (87.0%) | 12 (13.0%) |
Employment Industries by Sex in Huetter
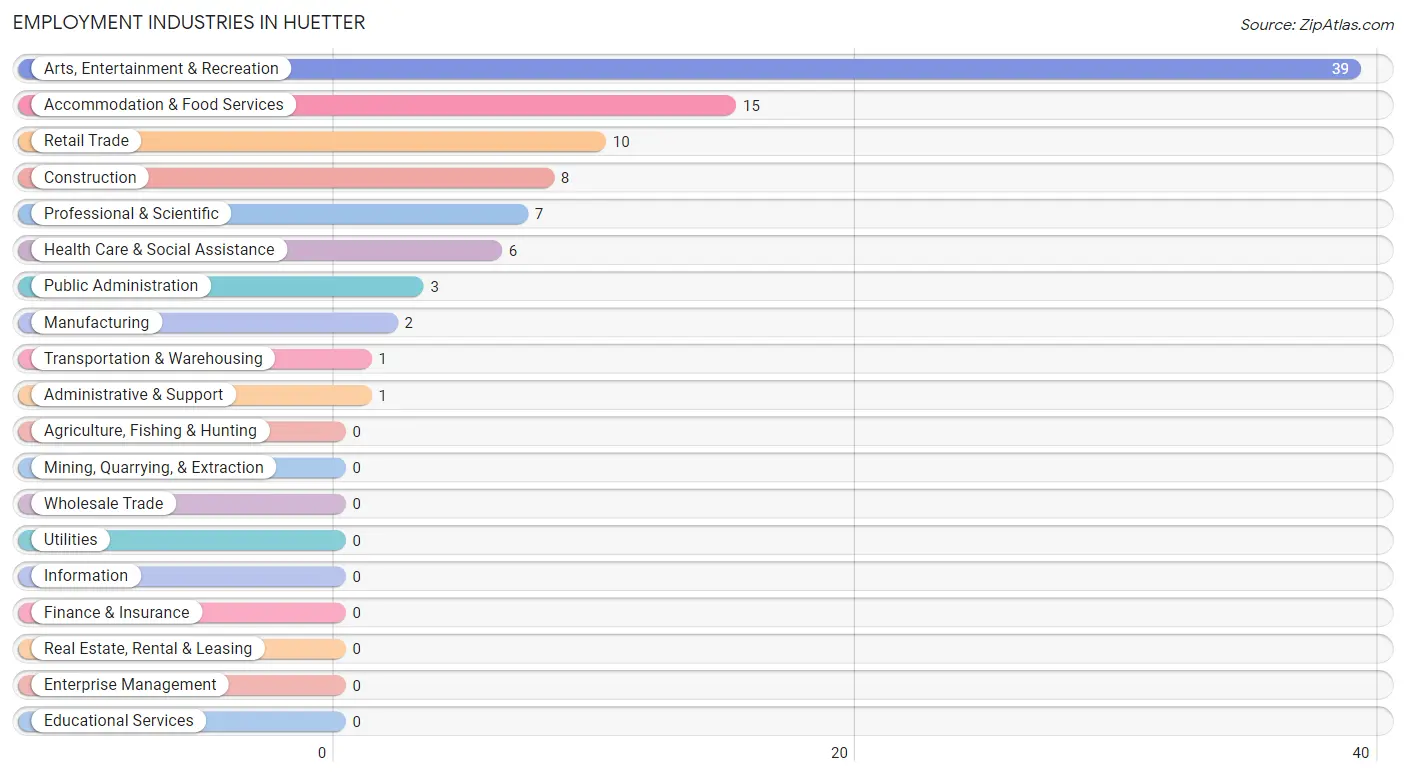
Employment Industries in Huetter
The major employment industries in Huetter include Arts, Entertainment & Recreation (39 | 42.4%), Accommodation & Food Services (15 | 16.3%), Retail Trade (10 | 10.9%), Construction (8 | 8.7%), and Professional & Scientific (7 | 7.6%).
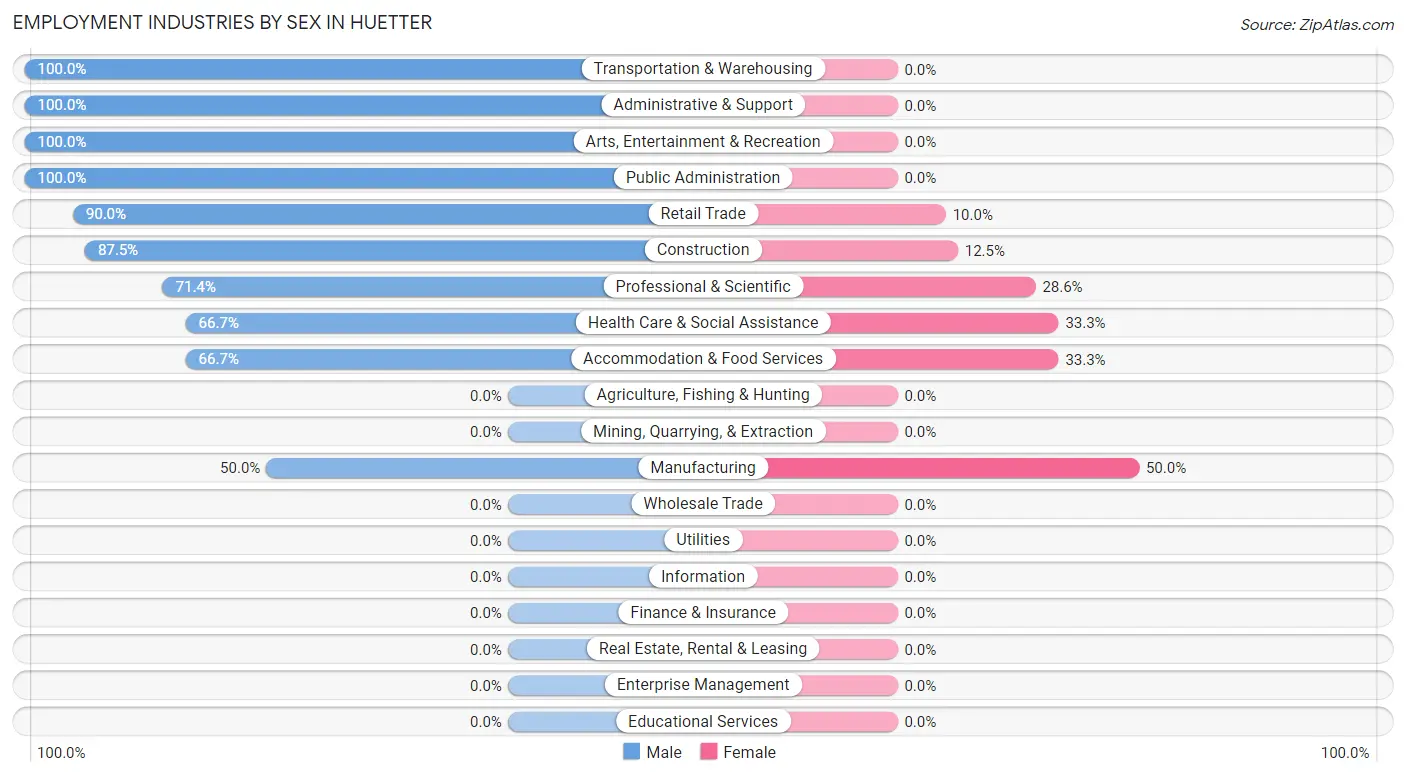
Employment Industries by Sex in Huetter
The Huetter industries that see more men than women are Transportation & Warehousing (100.0%), Administrative & Support (100.0%), and Arts, Entertainment & Recreation (100.0%), whereas the industries that tend to have a higher number of women are Manufacturing (50.0%), Health Care & Social Assistance (33.3%), and Accommodation & Food Services (33.3%).
| Industry | Male | Female |
| Agriculture, Fishing & Hunting | 0 (0.0%) | 0 (0.0%) |
| Mining, Quarrying, & Extraction | 0 (0.0%) | 0 (0.0%) |
| Construction | 7 (87.5%) | 1 (12.5%) |
| Manufacturing | 1 (50.0%) | 1 (50.0%) |
| Wholesale Trade | 0 (0.0%) | 0 (0.0%) |
| Retail Trade | 9 (90.0%) | 1 (10.0%) |
| Transportation & Warehousing | 1 (100.0%) | 0 (0.0%) |
| Utilities | 0 (0.0%) | 0 (0.0%) |
| Information | 0 (0.0%) | 0 (0.0%) |
| Finance & Insurance | 0 (0.0%) | 0 (0.0%) |
| Real Estate, Rental & Leasing | 0 (0.0%) | 0 (0.0%) |
| Professional & Scientific | 5 (71.4%) | 2 (28.6%) |
| Enterprise Management | 0 (0.0%) | 0 (0.0%) |
| Administrative & Support | 1 (100.0%) | 0 (0.0%) |
| Educational Services | 0 (0.0%) | 0 (0.0%) |
| Health Care & Social Assistance | 4 (66.7%) | 2 (33.3%) |
| Arts, Entertainment & Recreation | 39 (100.0%) | 0 (0.0%) |
| Accommodation & Food Services | 10 (66.7%) | 5 (33.3%) |
| Public Administration | 3 (100.0%) | 0 (0.0%) |
| Total | 80 (87.0%) | 12 (13.0%) |
Education in Huetter
School Enrollment in Huetter
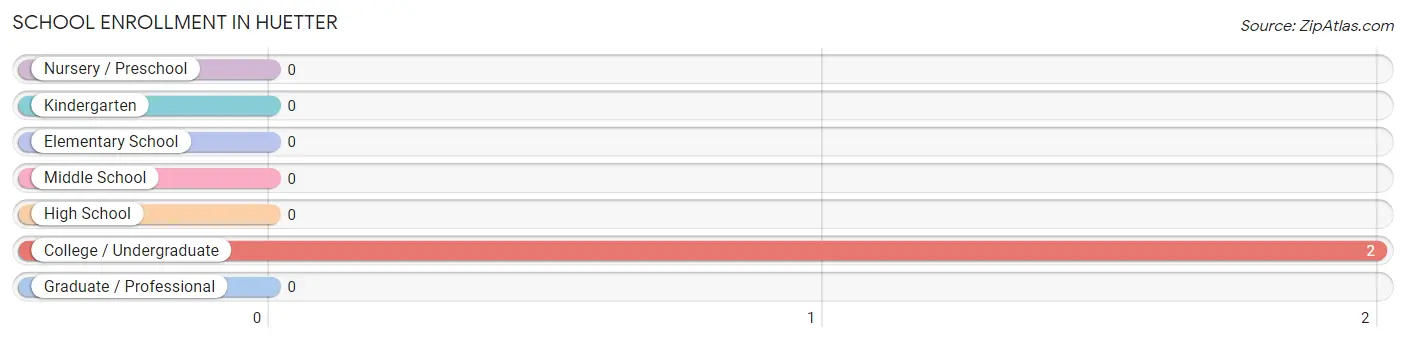
| School Level | # Students | % Students |
| Nursery / Preschool | 0 | 0.0% |
| Kindergarten | 0 | 0.0% |
| Elementary School | 0 | 0.0% |
| Middle School | 0 | 0.0% |
| High School | 0 | 0.0% |
| College / Undergraduate | 2 | 100.0% |
| Graduate / Professional | 0 | 0.0% |
| Total | 2 | 100.0% |
School Enrollment by Age by Funding Source in Huetter
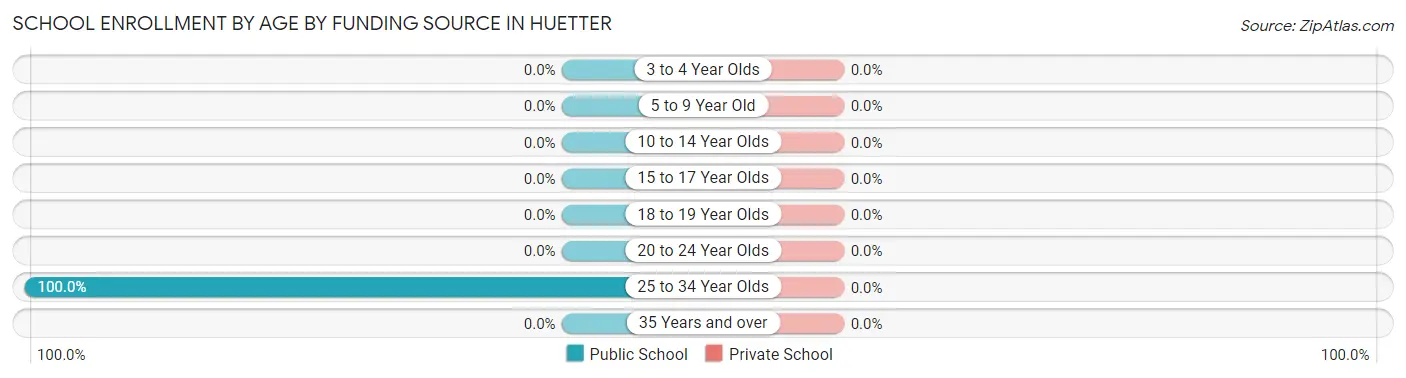
| Age Bracket | Public School | Private School |
| 3 to 4 Year Olds | 0 (0.0%) | 0 (0.0%) |
| 5 to 9 Year Old | 0 (0.0%) | 0 (0.0%) |
| 10 to 14 Year Olds | 0 (0.0%) | 0 (0.0%) |
| 15 to 17 Year Olds | 0 (0.0%) | 0 (0.0%) |
| 18 to 19 Year Olds | 0 (0.0%) | 0 (0.0%) |
| 20 to 24 Year Olds | 0 (0.0%) | 0 (0.0%) |
| 25 to 34 Year Olds | 2 (100.0%) | 0 (0.0%) |
| 35 Years and over | 0 (0.0%) | 0 (0.0%) |
| Total | 2 (100.0%) | 0 (0.0%) |
Educational Attainment by Field of Study in Huetter
Arts & humanities (2 | 66.7%), and business (1 | 33.3%) are the most common fields of study among 3 individuals in Huetter who have obtained a bachelor's degree or higher.
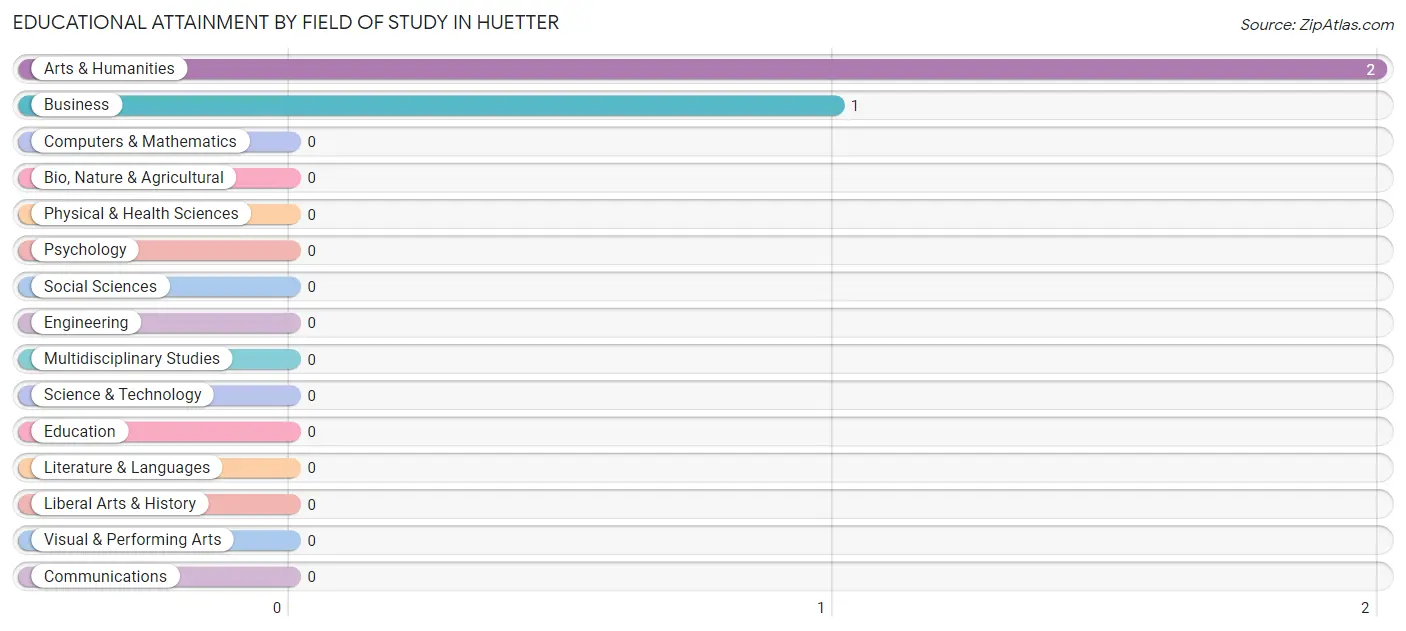
| Field of Study | # Graduates | % Graduates |
| Computers & Mathematics | 0 | 0.0% |
| Bio, Nature & Agricultural | 0 | 0.0% |
| Physical & Health Sciences | 0 | 0.0% |
| Psychology | 0 | 0.0% |
| Social Sciences | 0 | 0.0% |
| Engineering | 0 | 0.0% |
| Multidisciplinary Studies | 0 | 0.0% |
| Science & Technology | 0 | 0.0% |
| Business | 1 | 33.3% |
| Education | 0 | 0.0% |
| Literature & Languages | 0 | 0.0% |
| Liberal Arts & History | 0 | 0.0% |
| Visual & Performing Arts | 0 | 0.0% |
| Communications | 0 | 0.0% |
| Arts & Humanities | 2 | 66.7% |
| Total | 3 | 100.0% |
Transportation & Commute in Huetter
Vehicle Availability by Sex in Huetter
The most prevalent vehicle ownership categories in Huetter are males with no vehicle (46, accounting for 66.7%) and females with no vehicle (5, making up 383.3%).
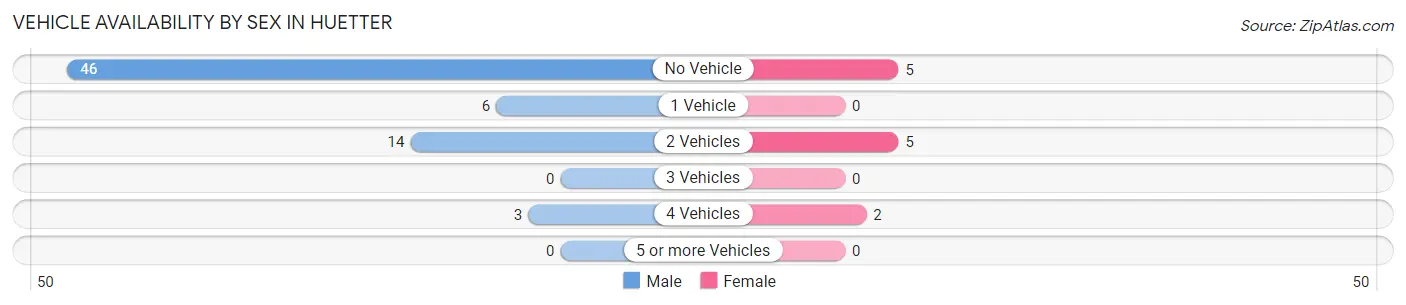
| Vehicles Available | Male | Female |
| No Vehicle | 46 (66.7%) | 5 (41.7%) |
| 1 Vehicle | 6 (8.7%) | 0 (0.0%) |
| 2 Vehicles | 14 (20.3%) | 5 (41.7%) |
| 3 Vehicles | 0 (0.0%) | 0 (0.0%) |
| 4 Vehicles | 3 (4.3%) | 2 (16.7%) |
| 5 or more Vehicles | 0 (0.0%) | 0 (0.0%) |
| Total | 69 (100.0%) | 12 (100.0%) |
Commute Time in Huetter
The most frequently occuring commute durations in Huetter are 10 to 14 minutes (46 commuters, 52.9%), 15 to 19 minutes (15 commuters, 17.2%), and 20 to 24 minutes (9 commuters, 10.3%).
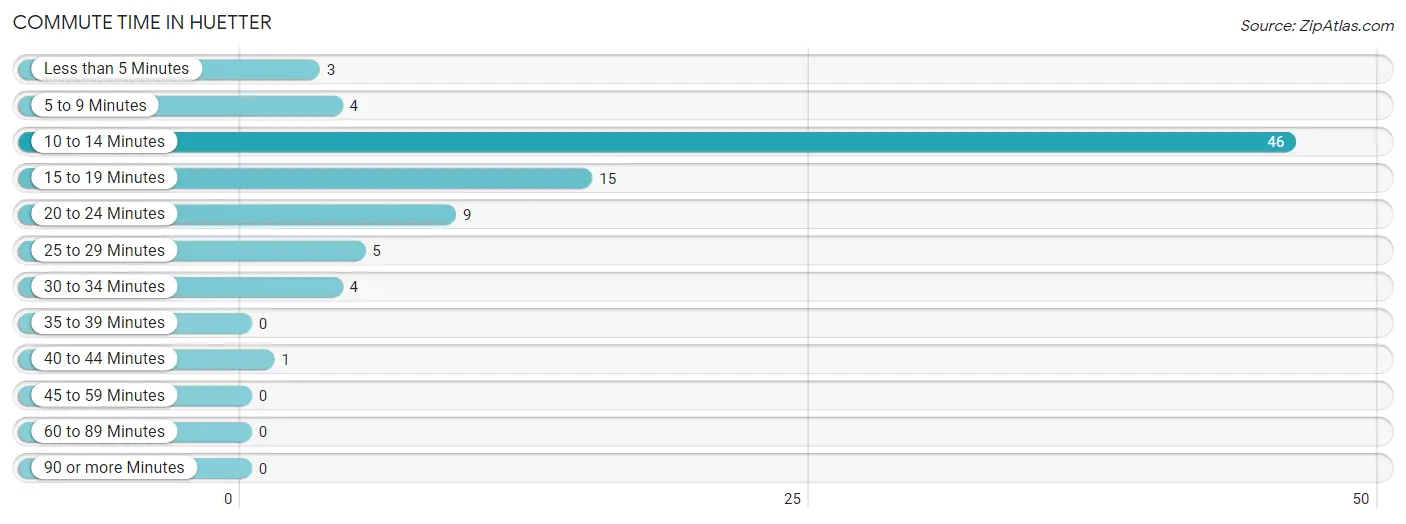
| Commute Time | # Commuters | % Commuters |
| Less than 5 Minutes | 3 | 3.5% |
| 5 to 9 Minutes | 4 | 4.6% |
| 10 to 14 Minutes | 46 | 52.9% |
| 15 to 19 Minutes | 15 | 17.2% |
| 20 to 24 Minutes | 9 | 10.3% |
| 25 to 29 Minutes | 5 | 5.8% |
| 30 to 34 Minutes | 4 | 4.6% |
| 35 to 39 Minutes | 0 | 0.0% |
| 40 to 44 Minutes | 1 | 1.1% |
| 45 to 59 Minutes | 0 | 0.0% |
| 60 to 89 Minutes | 0 | 0.0% |
| 90 or more Minutes | 0 | 0.0% |
Commute Time by Sex in Huetter
The most common commute times in Huetter are 10 to 14 minutes (43 commuters, 57.3%) for males and 15 to 19 minutes (8 commuters, 66.7%) for females.
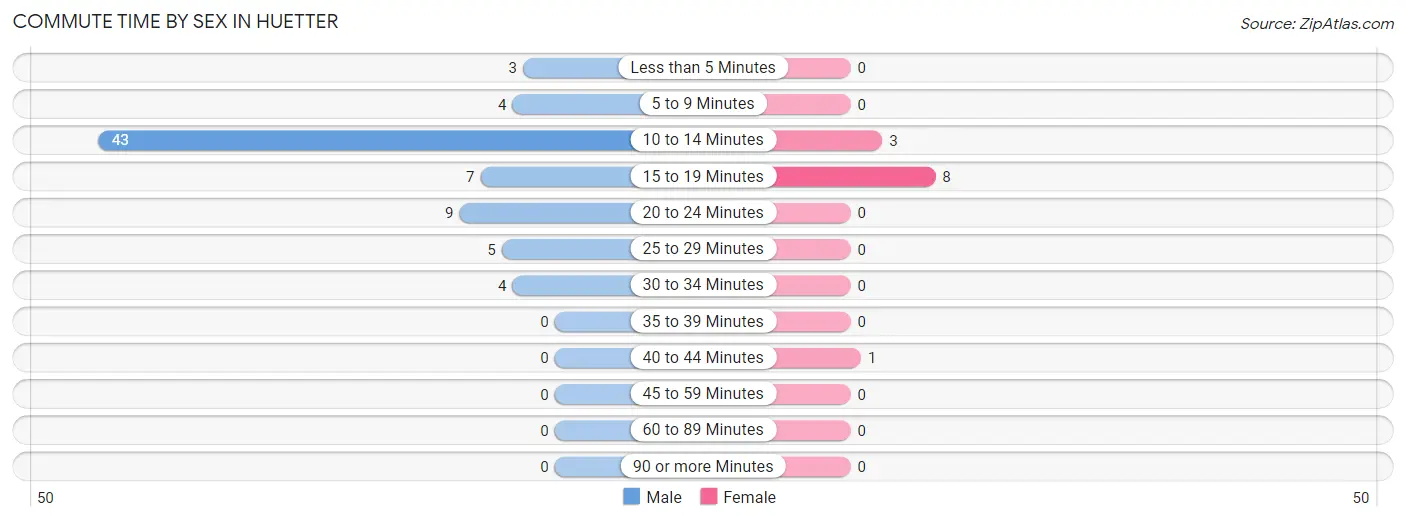
| Commute Time | Male | Female |
| Less than 5 Minutes | 3 (4.0%) | 0 (0.0%) |
| 5 to 9 Minutes | 4 (5.3%) | 0 (0.0%) |
| 10 to 14 Minutes | 43 (57.3%) | 3 (25.0%) |
| 15 to 19 Minutes | 7 (9.3%) | 8 (66.7%) |
| 20 to 24 Minutes | 9 (12.0%) | 0 (0.0%) |
| 25 to 29 Minutes | 5 (6.7%) | 0 (0.0%) |
| 30 to 34 Minutes | 4 (5.3%) | 0 (0.0%) |
| 35 to 39 Minutes | 0 (0.0%) | 0 (0.0%) |
| 40 to 44 Minutes | 0 (0.0%) | 1 (8.3%) |
| 45 to 59 Minutes | 0 (0.0%) | 0 (0.0%) |
| 60 to 89 Minutes | 0 (0.0%) | 0 (0.0%) |
| 90 or more Minutes | 0 (0.0%) | 0 (0.0%) |
Time of Departure to Work by Sex in Huetter
The most frequent times of departure to work in Huetter are 6:30 AM to 6:59 AM (39, 52.0%) for males and 7:00 AM to 7:29 AM (6, 50.0%) for females.
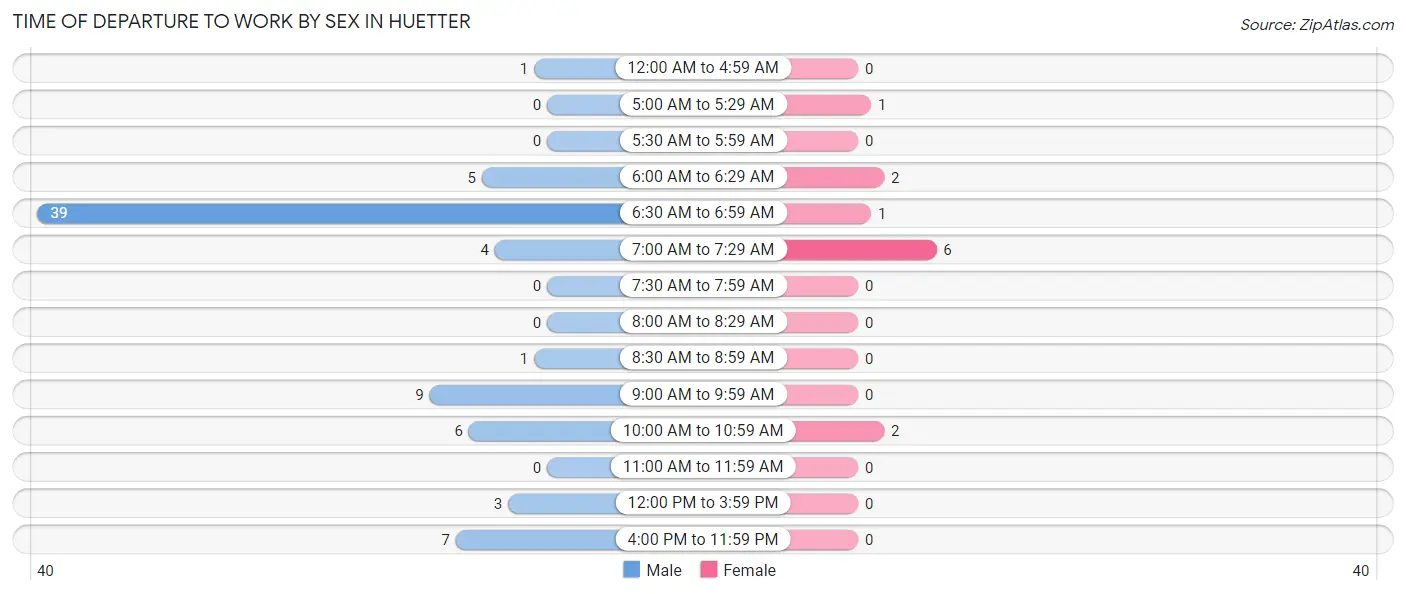
| Time of Departure | Male | Female |
| 12:00 AM to 4:59 AM | 1 (1.3%) | 0 (0.0%) |
| 5:00 AM to 5:29 AM | 0 (0.0%) | 1 (8.3%) |
| 5:30 AM to 5:59 AM | 0 (0.0%) | 0 (0.0%) |
| 6:00 AM to 6:29 AM | 5 (6.7%) | 2 (16.7%) |
| 6:30 AM to 6:59 AM | 39 (52.0%) | 1 (8.3%) |
| 7:00 AM to 7:29 AM | 4 (5.3%) | 6 (50.0%) |
| 7:30 AM to 7:59 AM | 0 (0.0%) | 0 (0.0%) |
| 8:00 AM to 8:29 AM | 0 (0.0%) | 0 (0.0%) |
| 8:30 AM to 8:59 AM | 1 (1.3%) | 0 (0.0%) |
| 9:00 AM to 9:59 AM | 9 (12.0%) | 0 (0.0%) |
| 10:00 AM to 10:59 AM | 6 (8.0%) | 2 (16.7%) |
| 11:00 AM to 11:59 AM | 0 (0.0%) | 0 (0.0%) |
| 12:00 PM to 3:59 PM | 3 (4.0%) | 0 (0.0%) |
| 4:00 PM to 11:59 PM | 7 (9.3%) | 0 (0.0%) |
| Total | 75 (100.0%) | 12 (100.0%) |
Housing Occupancy in Huetter
Occupancy by Ownership in Huetter
Of the total 68 dwellings in Huetter, owner-occupied units account for 14 (20.6%), while renter-occupied units make up 54 (79.4%).
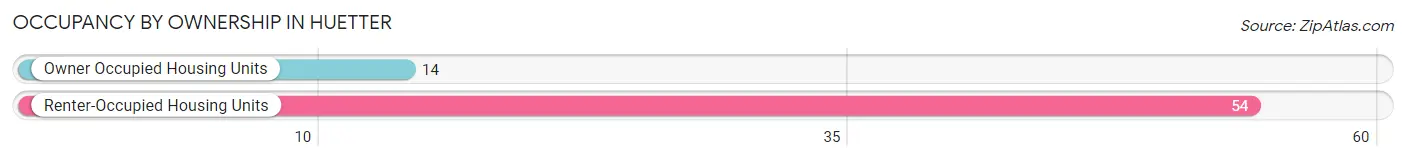
| Occupancy | # Housing Units | % Housing Units |
| Owner Occupied Housing Units | 14 | 20.6% |
| Renter-Occupied Housing Units | 54 | 79.4% |
| Total Occupied Housing Units | 68 | 100.0% |
Occupancy by Household Size in Huetter
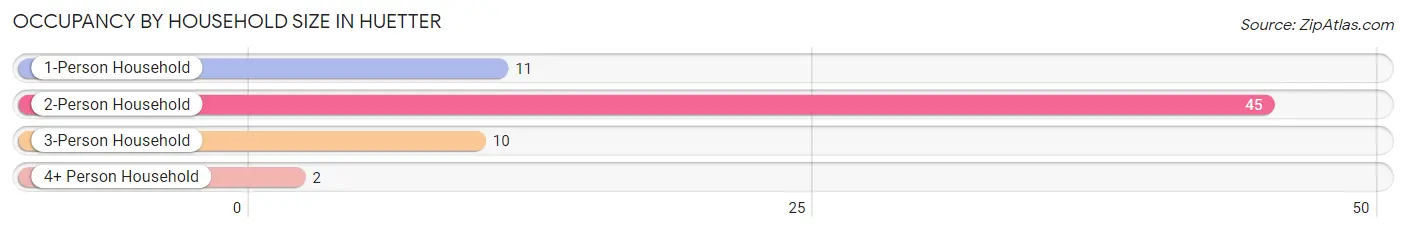
| Household Size | # Housing Units | % Housing Units |
| 1-Person Household | 11 | 16.2% |
| 2-Person Household | 45 | 66.2% |
| 3-Person Household | 10 | 14.7% |
| 4+ Person Household | 2 | 2.9% |
| Total Housing Units | 68 | 100.0% |
Occupancy by Ownership by Household Size in Huetter
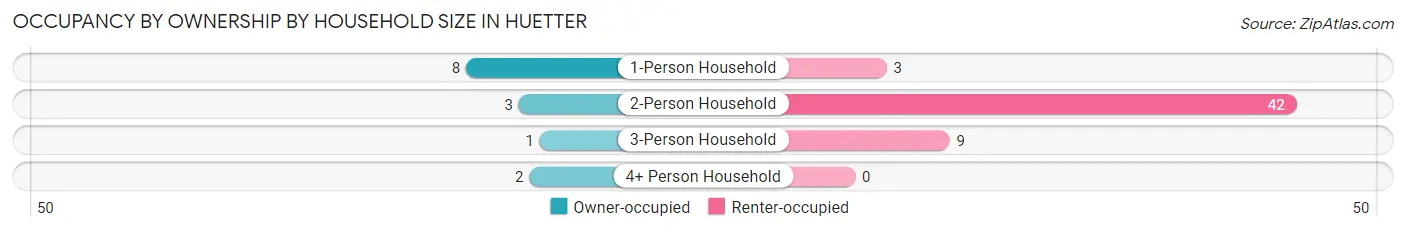
| Household Size | Owner-occupied | Renter-occupied |
| 1-Person Household | 8 (72.7%) | 3 (27.3%) |
| 2-Person Household | 3 (6.7%) | 42 (93.3%) |
| 3-Person Household | 1 (10.0%) | 9 (90.0%) |
| 4+ Person Household | 2 (100.0%) | 0 (0.0%) |
| Total Housing Units | 14 (20.6%) | 54 (79.4%) |
Occupancy by Educational Attainment in Huetter
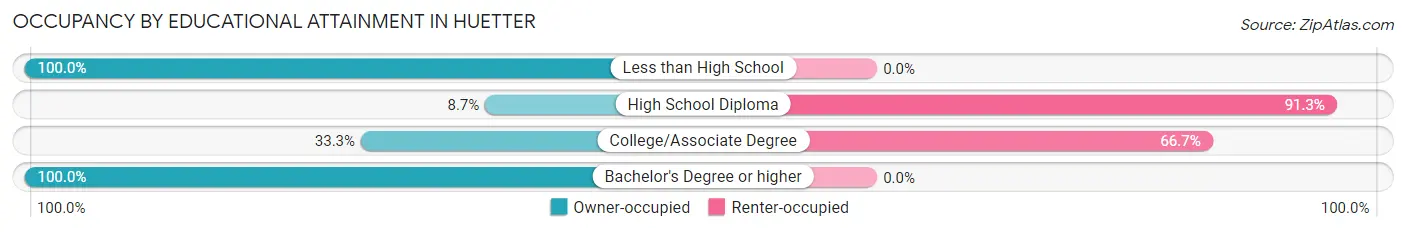
| Household Size | Owner-occupied | Renter-occupied |
| Less than High School | 1 (100.0%) | 0 (0.0%) |
| High School Diploma | 4 (8.7%) | 42 (91.3%) |
| College/Associate Degree | 6 (33.3%) | 12 (66.7%) |
| Bachelor's Degree or higher | 3 (100.0%) | 0 (0.0%) |
Occupancy by Age of Householder in Huetter
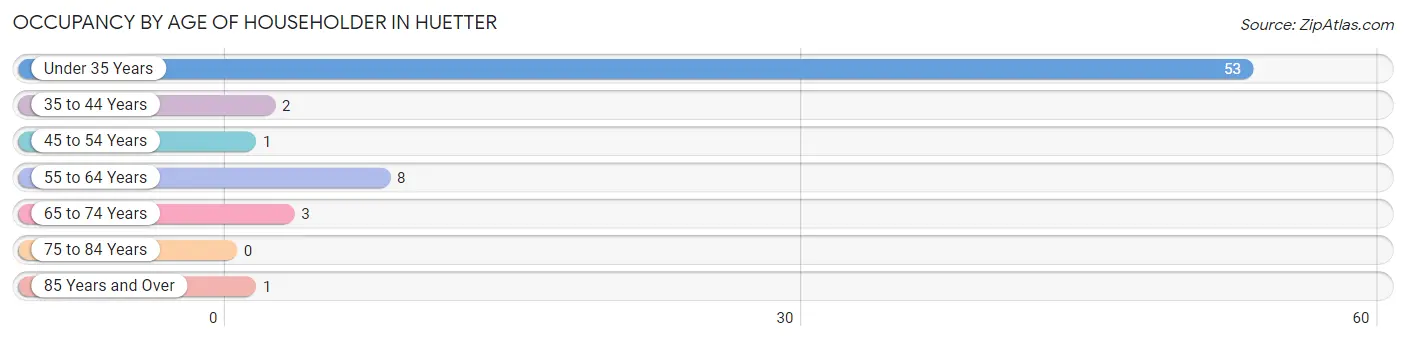
| Age Bracket | # Households | % Households |
| Under 35 Years | 53 | 77.9% |
| 35 to 44 Years | 2 | 2.9% |
| 45 to 54 Years | 1 | 1.5% |
| 55 to 64 Years | 8 | 11.8% |
| 65 to 74 Years | 3 | 4.4% |
| 75 to 84 Years | 0 | 0.0% |
| 85 Years and Over | 1 | 1.5% |
| Total | 68 | 100.0% |
Housing Finances in Huetter
Median Income by Occupancy in Huetter
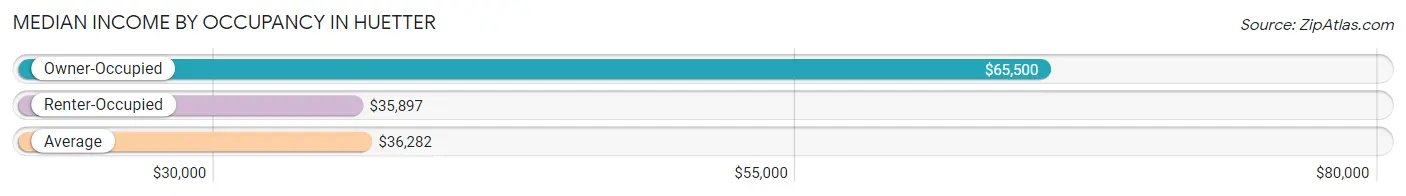
| Occupancy Type | # Households | Median Income |
| Owner-Occupied | 14 (20.6%) | $65,500 |
| Renter-Occupied | 54 (79.4%) | $35,897 |
| Average | 68 (100.0%) | $36,282 |
Occupancy by Householder Income Bracket in Huetter
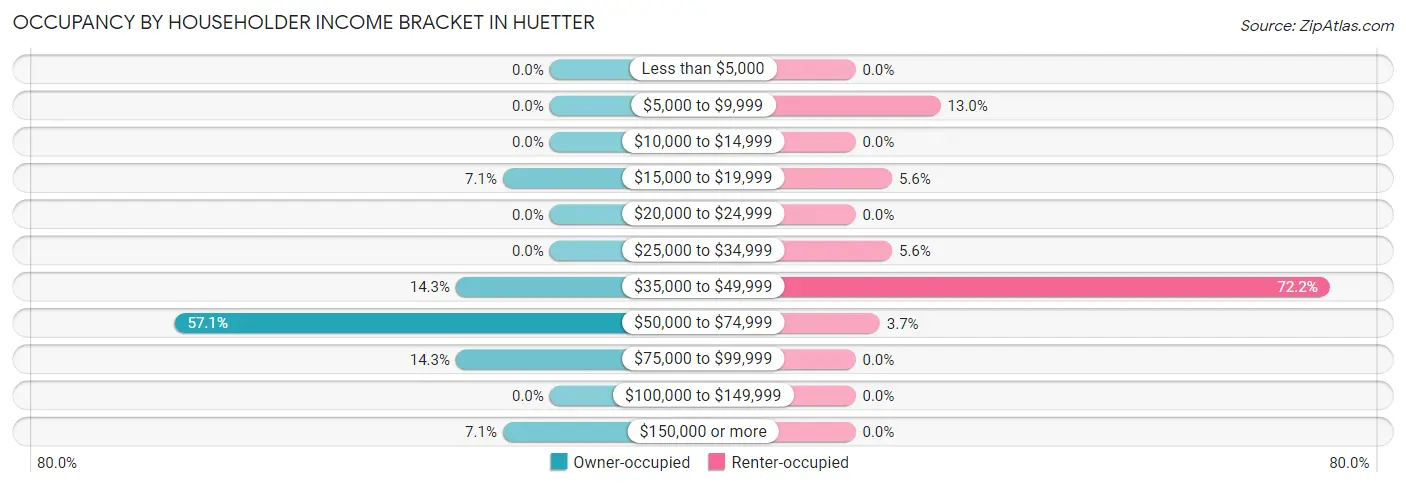
| Income Bracket | Owner-occupied | Renter-occupied |
| Less than $5,000 | 0 (0.0%) | 0 (0.0%) |
| $5,000 to $9,999 | 0 (0.0%) | 7 (13.0%) |
| $10,000 to $14,999 | 0 (0.0%) | 0 (0.0%) |
| $15,000 to $19,999 | 1 (7.1%) | 3 (5.6%) |
| $20,000 to $24,999 | 0 (0.0%) | 0 (0.0%) |
| $25,000 to $34,999 | 0 (0.0%) | 3 (5.6%) |
| $35,000 to $49,999 | 2 (14.3%) | 39 (72.2%) |
| $50,000 to $74,999 | 8 (57.1%) | 2 (3.7%) |
| $75,000 to $99,999 | 2 (14.3%) | 0 (0.0%) |
| $100,000 to $149,999 | 0 (0.0%) | 0 (0.0%) |
| $150,000 or more | 1 (7.1%) | 0 (0.0%) |
| Total | 14 (100.0%) | 54 (100.0%) |
Monthly Housing Cost Tiers in Huetter
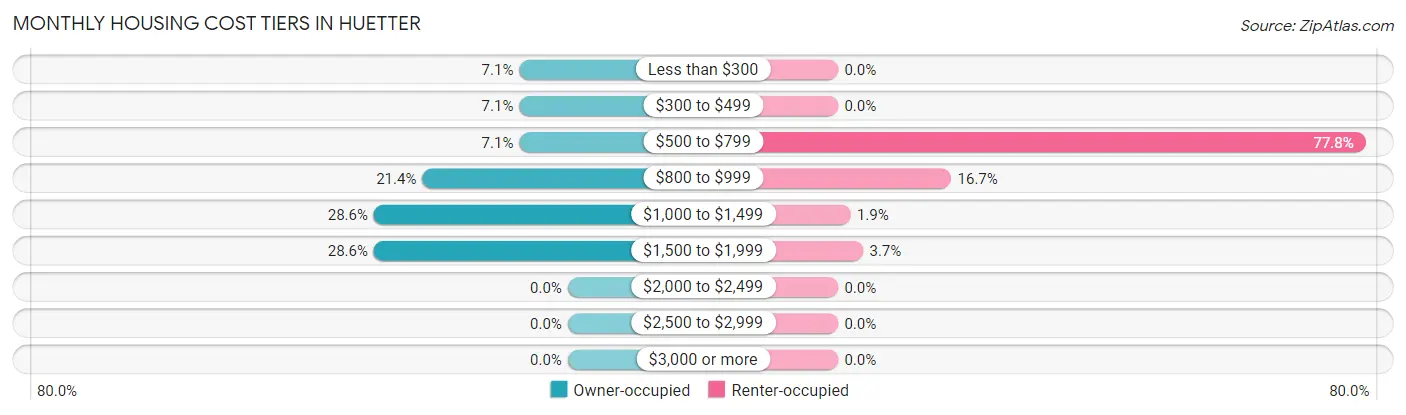
| Monthly Cost | Owner-occupied | Renter-occupied |
| Less than $300 | 1 (7.1%) | 0 (0.0%) |
| $300 to $499 | 1 (7.1%) | 0 (0.0%) |
| $500 to $799 | 1 (7.1%) | 42 (77.8%) |
| $800 to $999 | 3 (21.4%) | 9 (16.7%) |
| $1,000 to $1,499 | 4 (28.6%) | 1 (1.8%) |
| $1,500 to $1,999 | 4 (28.6%) | 2 (3.7%) |
| $2,000 to $2,499 | 0 (0.0%) | 0 (0.0%) |
| $2,500 to $2,999 | 0 (0.0%) | 0 (0.0%) |
| $3,000 or more | 0 (0.0%) | 0 (0.0%) |
| Total | 14 (100.0%) | 54 (100.0%) |
Physical Housing Characteristics in Huetter
Housing Structures in Huetter
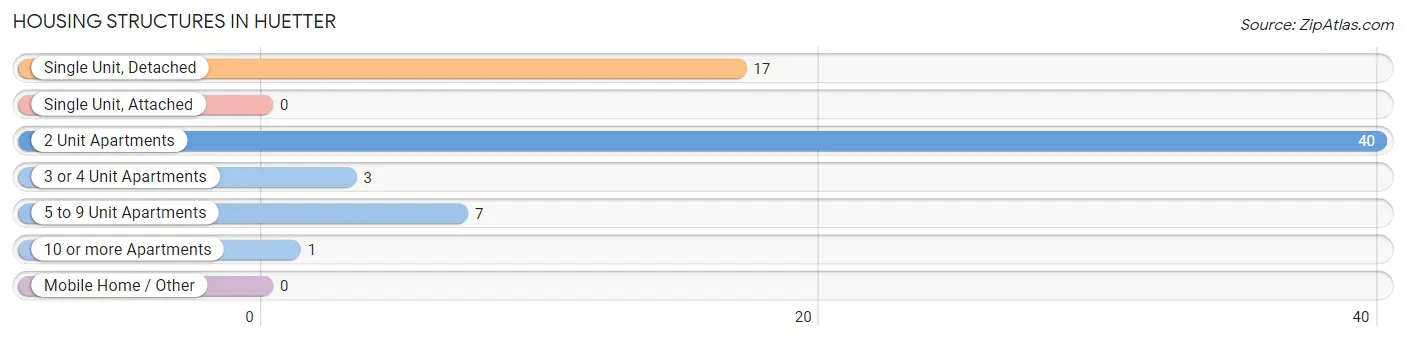
| Structure Type | # Housing Units | % Housing Units |
| Single Unit, Detached | 17 | 25.0% |
| Single Unit, Attached | 0 | 0.0% |
| 2 Unit Apartments | 40 | 58.8% |
| 3 or 4 Unit Apartments | 3 | 4.4% |
| 5 to 9 Unit Apartments | 7 | 10.3% |
| 10 or more Apartments | 1 | 1.5% |
| Mobile Home / Other | 0 | 0.0% |
| Total | 68 | 100.0% |
Housing Structures by Occupancy in Huetter
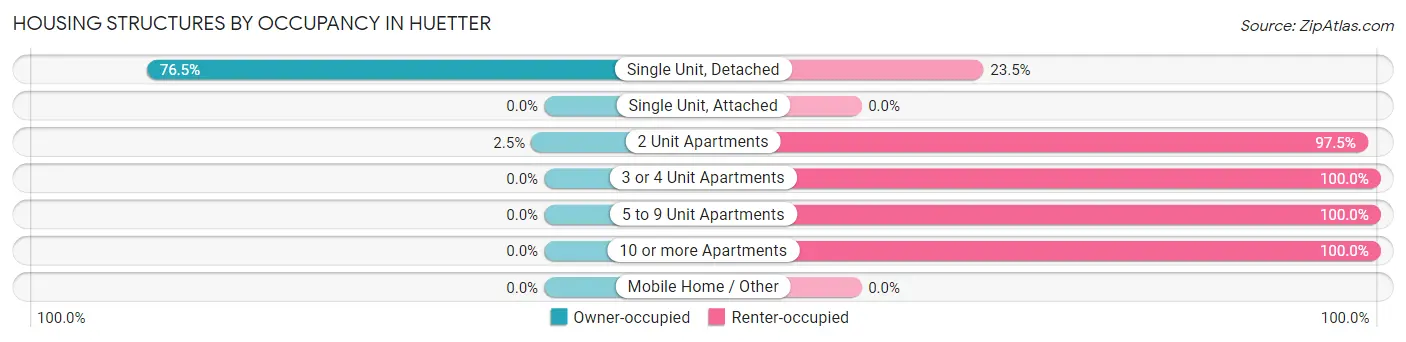
| Structure Type | Owner-occupied | Renter-occupied |
| Single Unit, Detached | 13 (76.5%) | 4 (23.5%) |
| Single Unit, Attached | 0 (0.0%) | 0 (0.0%) |
| 2 Unit Apartments | 1 (2.5%) | 39 (97.5%) |
| 3 or 4 Unit Apartments | 0 (0.0%) | 3 (100.0%) |
| 5 to 9 Unit Apartments | 0 (0.0%) | 7 (100.0%) |
| 10 or more Apartments | 0 (0.0%) | 1 (100.0%) |
| Mobile Home / Other | 0 (0.0%) | 0 (0.0%) |
| Total | 14 (20.6%) | 54 (79.4%) |
Housing Structures by Number of Rooms in Huetter
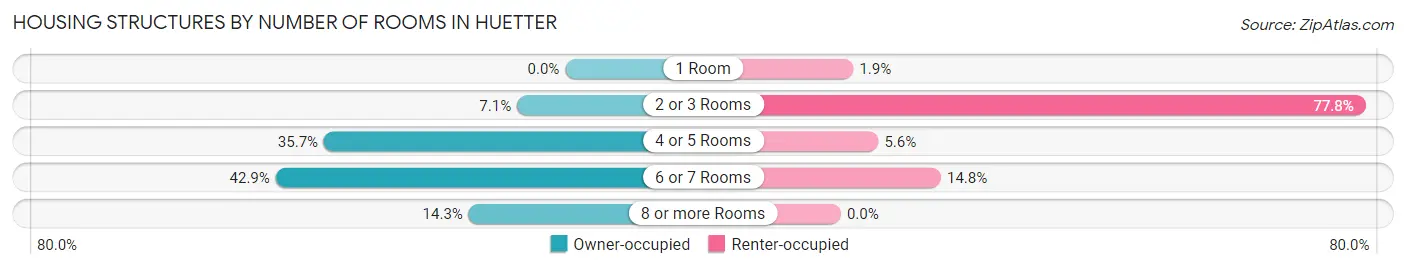
| Number of Rooms | Owner-occupied | Renter-occupied |
| 1 Room | 0 (0.0%) | 1 (1.8%) |
| 2 or 3 Rooms | 1 (7.1%) | 42 (77.8%) |
| 4 or 5 Rooms | 5 (35.7%) | 3 (5.6%) |
| 6 or 7 Rooms | 6 (42.9%) | 8 (14.8%) |
| 8 or more Rooms | 2 (14.3%) | 0 (0.0%) |
| Total | 14 (100.0%) | 54 (100.0%) |
Housing Structure by Heating Type in Huetter
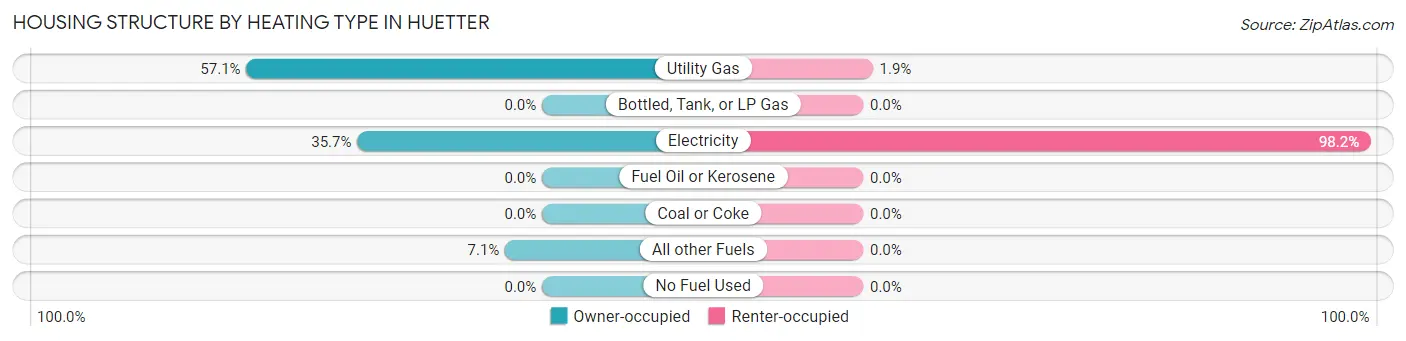
| Heating Type | Owner-occupied | Renter-occupied |
| Utility Gas | 8 (57.1%) | 1 (1.8%) |
| Bottled, Tank, or LP Gas | 0 (0.0%) | 0 (0.0%) |
| Electricity | 5 (35.7%) | 53 (98.2%) |
| Fuel Oil or Kerosene | 0 (0.0%) | 0 (0.0%) |
| Coal or Coke | 0 (0.0%) | 0 (0.0%) |
| All other Fuels | 1 (7.1%) | 0 (0.0%) |
| No Fuel Used | 0 (0.0%) | 0 (0.0%) |
| Total | 14 (100.0%) | 54 (100.0%) |
Household Vehicle Usage in Huetter
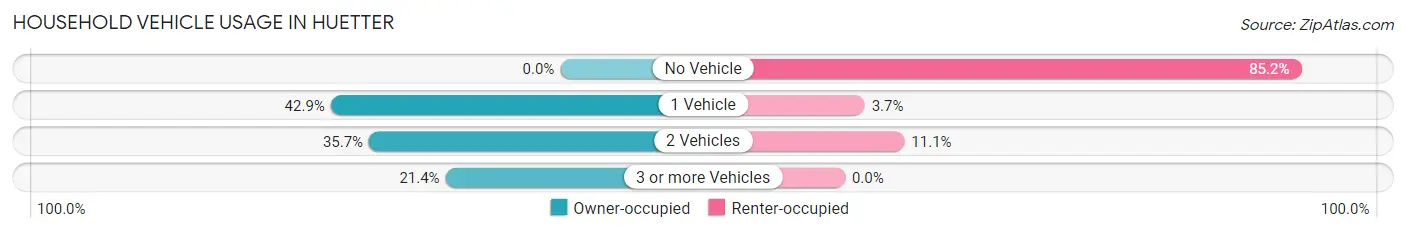
| Vehicles per Household | Owner-occupied | Renter-occupied |
| No Vehicle | 0 (0.0%) | 46 (85.2%) |
| 1 Vehicle | 6 (42.9%) | 2 (3.7%) |
| 2 Vehicles | 5 (35.7%) | 6 (11.1%) |
| 3 or more Vehicles | 3 (21.4%) | 0 (0.0%) |
| Total | 14 (100.0%) | 54 (100.0%) |
Real Estate & Mortgages in Huetter
Real Estate and Mortgage Overview in Huetter
| Characteristic | Without Mortgage | With Mortgage |
| Housing Units | 2 | 12 |
| Median Property Value | - | - |
| Median Household Income | - | - |
| Monthly Housing Costs | - | - |
| Real Estate Taxes | - | - |
Property Value by Mortgage Status in Huetter
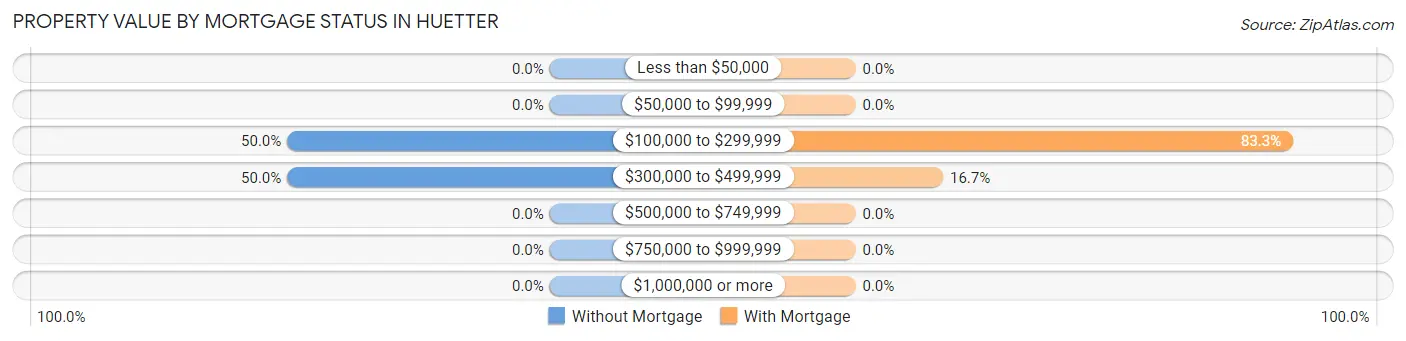
| Property Value | Without Mortgage | With Mortgage |
| Less than $50,000 | 0 (0.0%) | 0 (0.0%) |
| $50,000 to $99,999 | 0 (0.0%) | 0 (0.0%) |
| $100,000 to $299,999 | 1 (50.0%) | 10 (83.3%) |
| $300,000 to $499,999 | 1 (50.0%) | 2 (16.7%) |
| $500,000 to $749,999 | 0 (0.0%) | 0 (0.0%) |
| $750,000 to $999,999 | 0 (0.0%) | 0 (0.0%) |
| $1,000,000 or more | 0 (0.0%) | 0 (0.0%) |
| Total | 2 (100.0%) | 12 (100.0%) |
Household Income by Mortgage Status in Huetter
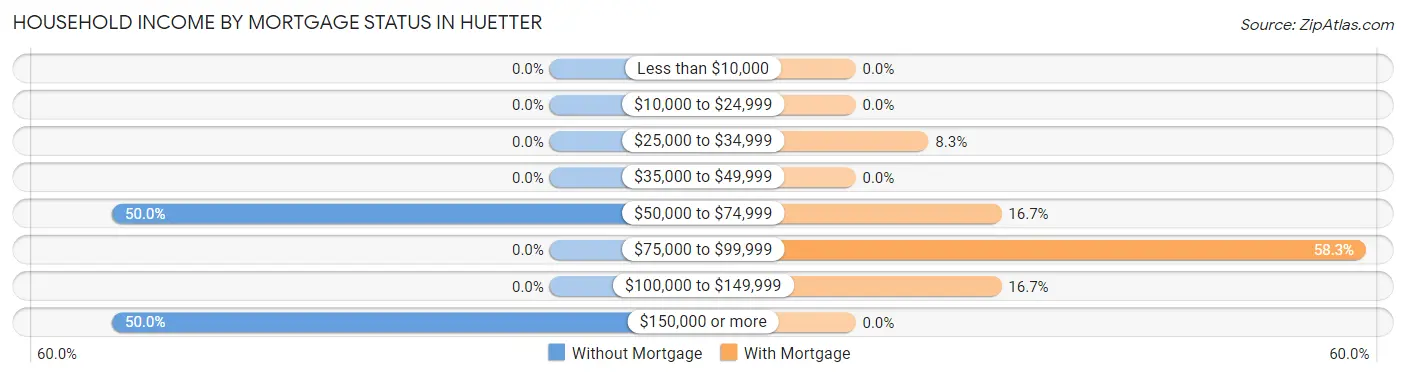
| Household Income | Without Mortgage | With Mortgage |
| Less than $10,000 | 0 (0.0%) | 0 (0.0%) |
| $10,000 to $24,999 | 0 (0.0%) | 0 (0.0%) |
| $25,000 to $34,999 | 0 (0.0%) | 1 (8.3%) |
| $35,000 to $49,999 | 0 (0.0%) | 0 (0.0%) |
| $50,000 to $74,999 | 1 (50.0%) | 2 (16.7%) |
| $75,000 to $99,999 | 0 (0.0%) | 7 (58.3%) |
| $100,000 to $149,999 | 0 (0.0%) | 2 (16.7%) |
| $150,000 or more | 1 (50.0%) | 0 (0.0%) |
| Total | 2 (100.0%) | 12 (100.0%) |
Property Value to Household Income Ratio in Huetter
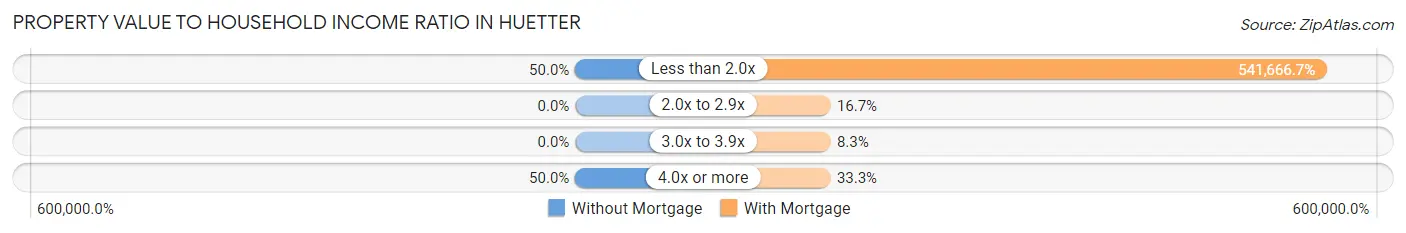
| Value-to-Income Ratio | Without Mortgage | With Mortgage |
| Less than 2.0x | 1 (50.0%) | 65,000 (541,666.7%) |
| 2.0x to 2.9x | 0 (0.0%) | 2 (16.7%) |
| 3.0x to 3.9x | 0 (0.0%) | 1 (8.3%) |
| 4.0x or more | 1 (50.0%) | 4 (33.3%) |
| Total | 2 (100.0%) | 12 (100.0%) |
Real Estate Taxes by Mortgage Status in Huetter
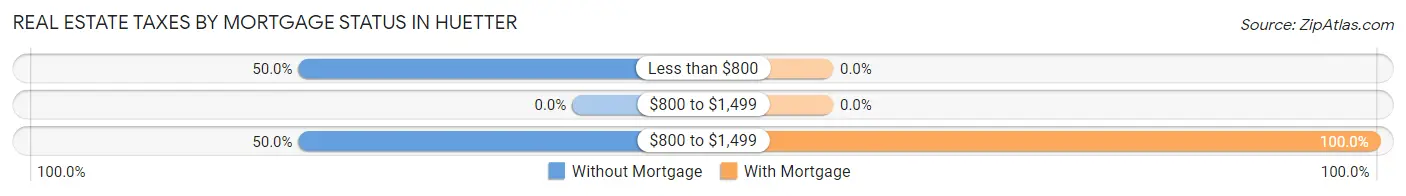
| Property Taxes | Without Mortgage | With Mortgage |
| Less than $800 | 1 (50.0%) | 0 (0.0%) |
| $800 to $1,499 | 0 (0.0%) | 0 (0.0%) |
| $800 to $1,499 | 1 (50.0%) | 12 (100.0%) |
| Total | 2 (100.0%) | 12 (100.0%) |
Health & Disability in Huetter
Health Insurance Coverage by Age in Huetter
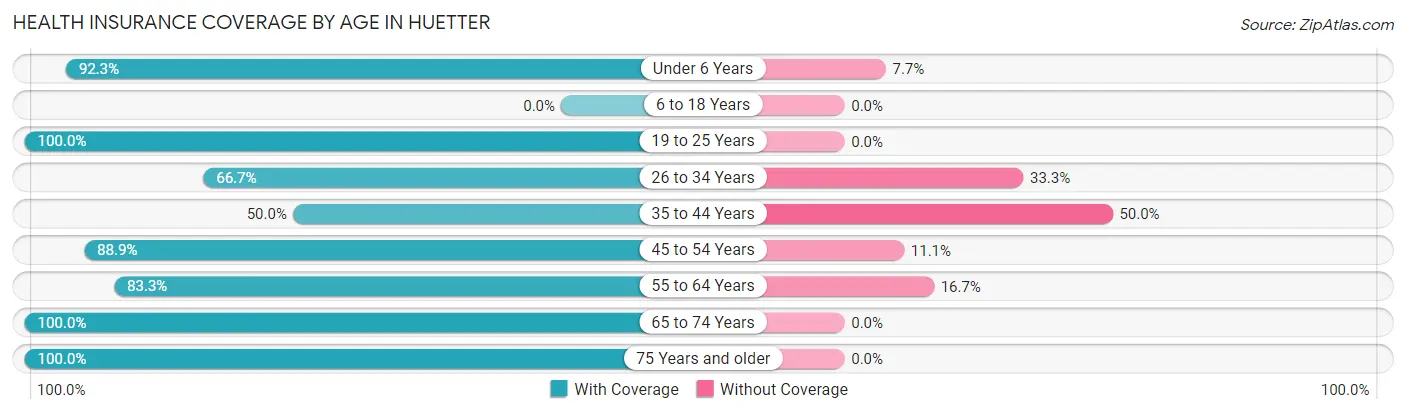
| Age Bracket | With Coverage | Without Coverage |
| Under 6 Years | 12 (92.3%) | 1 (7.7%) |
| 6 to 18 Years | 0 (0.0%) | 0 (0.0%) |
| 19 to 25 Years | 14 (100.0%) | 0 (0.0%) |
| 26 to 34 Years | 48 (66.7%) | 24 (33.3%) |
| 35 to 44 Years | 5 (50.0%) | 5 (50.0%) |
| 45 to 54 Years | 8 (88.9%) | 1 (11.1%) |
| 55 to 64 Years | 15 (83.3%) | 3 (16.7%) |
| 65 to 74 Years | 6 (100.0%) | 0 (0.0%) |
| 75 Years and older | 1 (100.0%) | 0 (0.0%) |
| Total | 109 (76.2%) | 34 (23.8%) |
Health Insurance Coverage by Citizenship Status in Huetter
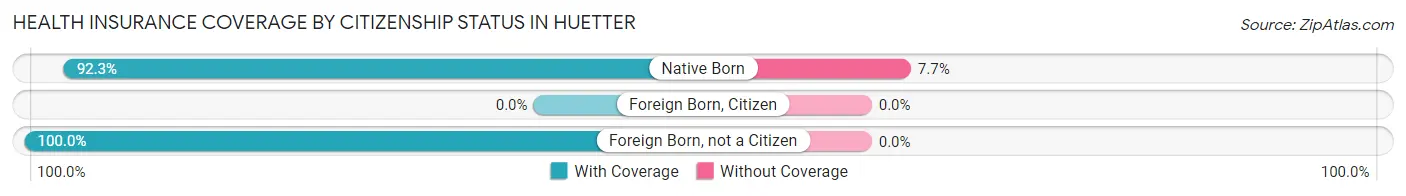
| Citizenship Status | With Coverage | Without Coverage |
| Native Born | 12 (92.3%) | 1 (7.7%) |
| Foreign Born, Citizen | 0 (0.0%) | 0 (0.0%) |
| Foreign Born, not a Citizen | 14 (100.0%) | 0 (0.0%) |
Health Insurance Coverage by Household Income in Huetter
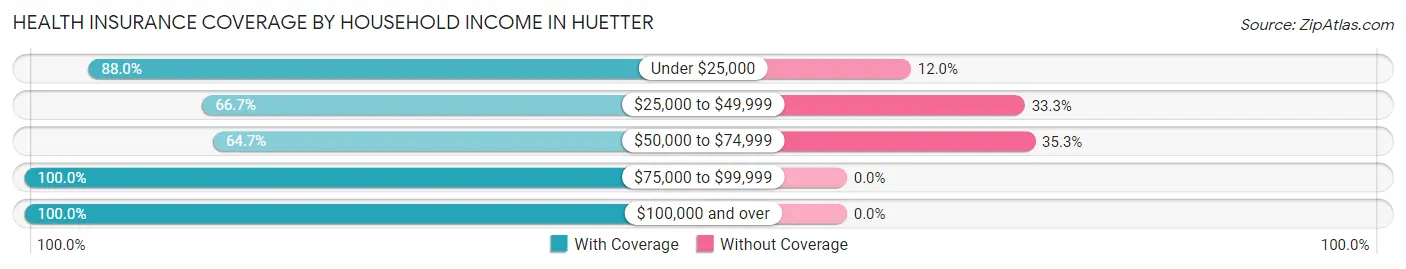
| Household Income | With Coverage | Without Coverage |
| Under $25,000 | 22 (88.0%) | 3 (12.0%) |
| $25,000 to $49,999 | 50 (66.7%) | 25 (33.3%) |
| $50,000 to $74,999 | 11 (64.7%) | 6 (35.3%) |
| $75,000 to $99,999 | 9 (100.0%) | 0 (0.0%) |
| $100,000 and over | 3 (100.0%) | 0 (0.0%) |
Public vs Private Health Insurance Coverage by Age in Huetter
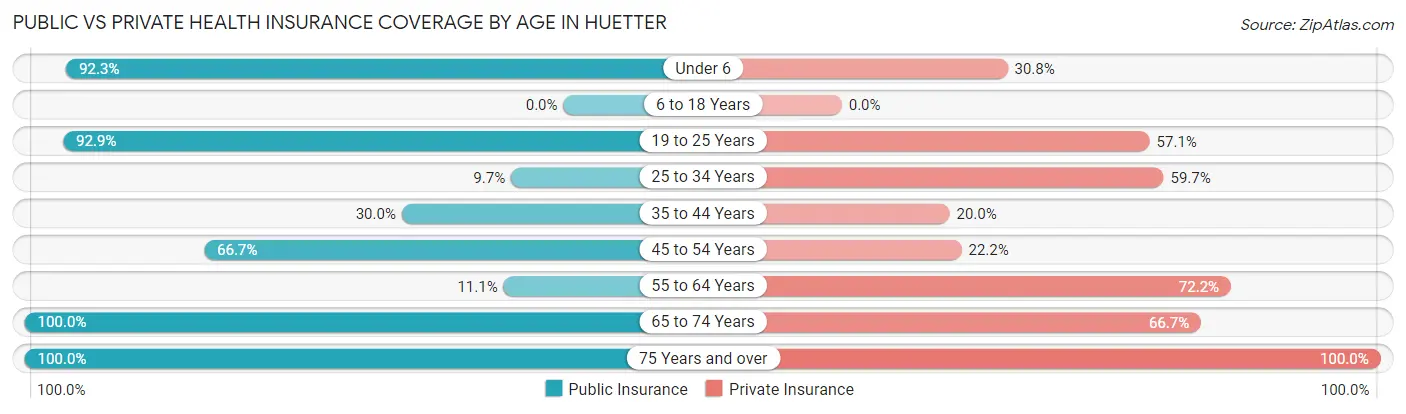
| Age Bracket | Public Insurance | Private Insurance |
| Under 6 | 12 (92.3%) | 4 (30.8%) |
| 6 to 18 Years | 0 (0.0%) | 0 (0.0%) |
| 19 to 25 Years | 13 (92.9%) | 8 (57.1%) |
| 25 to 34 Years | 7 (9.7%) | 43 (59.7%) |
| 35 to 44 Years | 3 (30.0%) | 2 (20.0%) |
| 45 to 54 Years | 6 (66.7%) | 2 (22.2%) |
| 55 to 64 Years | 2 (11.1%) | 13 (72.2%) |
| 65 to 74 Years | 6 (100.0%) | 4 (66.7%) |
| 75 Years and over | 1 (100.0%) | 1 (100.0%) |
| Total | 50 (35.0%) | 77 (53.8%) |
Disability Status by Sex by Age in Huetter
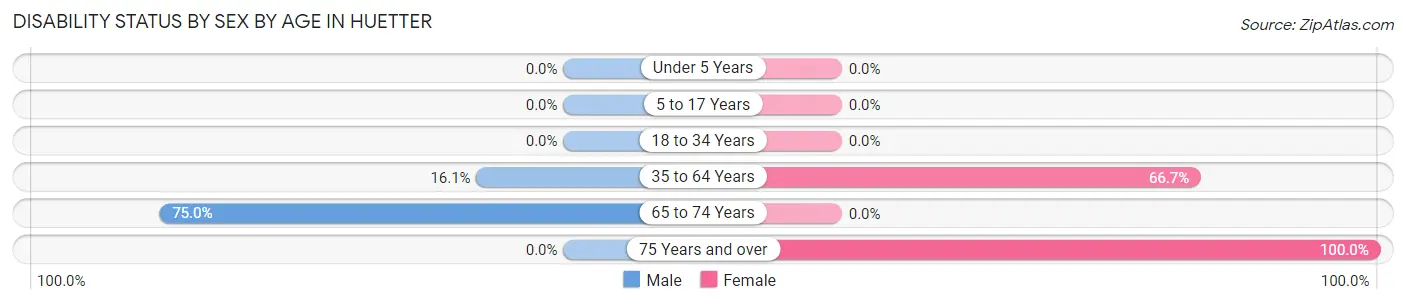
| Age Bracket | Male | Female |
| Under 5 Years | 0 (0.0%) | 0 (0.0%) |
| 5 to 17 Years | 0 (0.0%) | 0 (0.0%) |
| 18 to 34 Years | 0 (0.0%) | 0 (0.0%) |
| 35 to 64 Years | 5 (16.1%) | 4 (66.7%) |
| 65 to 74 Years | 3 (75.0%) | 0 (0.0%) |
| 75 Years and over | 0 (0.0%) | 1 (100.0%) |
Disability Class by Sex by Age in Huetter
Disability Class: Hearing Difficulty
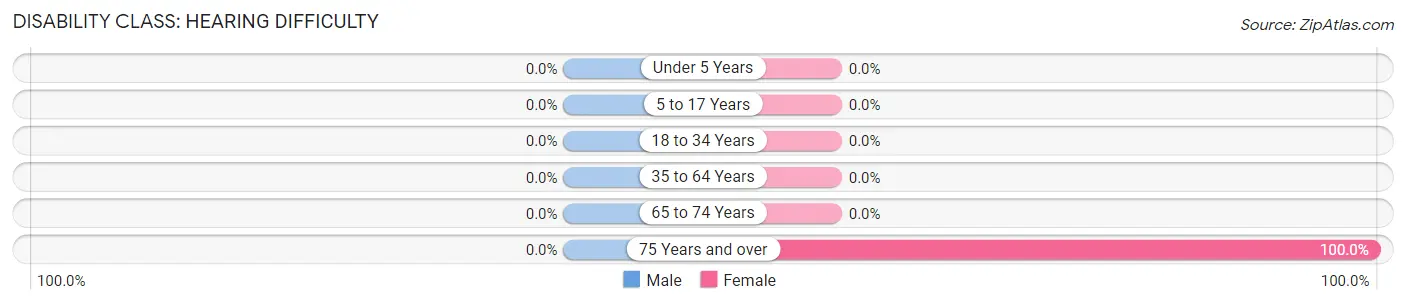
| Age Bracket | Male | Female |
| Under 5 Years | 0 (0.0%) | 0 (0.0%) |
| 5 to 17 Years | 0 (0.0%) | 0 (0.0%) |
| 18 to 34 Years | 0 (0.0%) | 0 (0.0%) |
| 35 to 64 Years | 0 (0.0%) | 0 (0.0%) |
| 65 to 74 Years | 0 (0.0%) | 0 (0.0%) |
| 75 Years and over | 0 (0.0%) | 1 (100.0%) |
Disability Class: Vision Difficulty
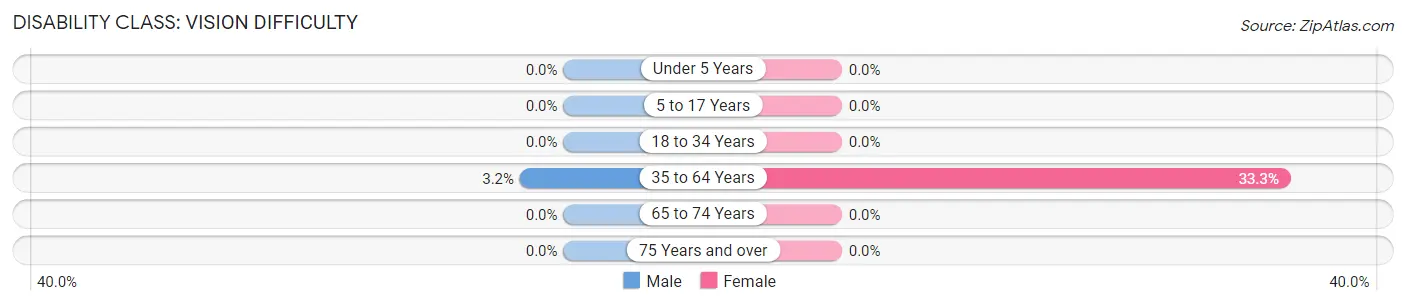
| Age Bracket | Male | Female |
| Under 5 Years | 0 (0.0%) | 0 (0.0%) |
| 5 to 17 Years | 0 (0.0%) | 0 (0.0%) |
| 18 to 34 Years | 0 (0.0%) | 0 (0.0%) |
| 35 to 64 Years | 1 (3.2%) | 2 (33.3%) |
| 65 to 74 Years | 0 (0.0%) | 0 (0.0%) |
| 75 Years and over | 0 (0.0%) | 0 (0.0%) |
Disability Class: Cognitive Difficulty
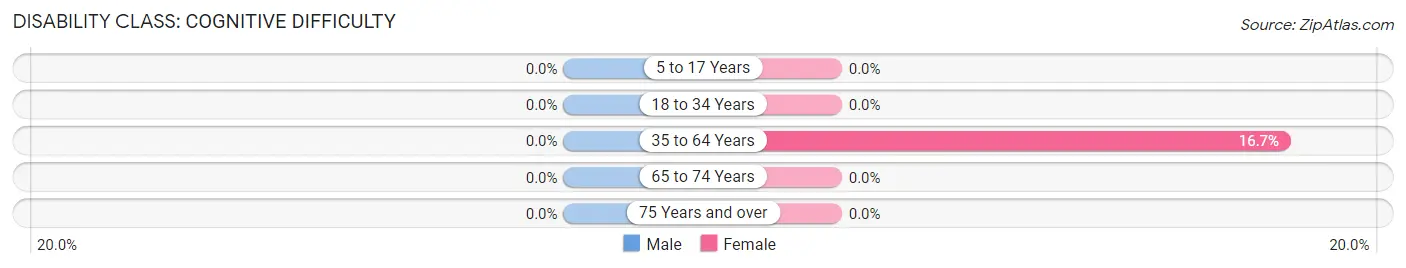
| Age Bracket | Male | Female |
| 5 to 17 Years | 0 (0.0%) | 0 (0.0%) |
| 18 to 34 Years | 0 (0.0%) | 0 (0.0%) |
| 35 to 64 Years | 0 (0.0%) | 1 (16.7%) |
| 65 to 74 Years | 0 (0.0%) | 0 (0.0%) |
| 75 Years and over | 0 (0.0%) | 0 (0.0%) |
Disability Class: Ambulatory Difficulty
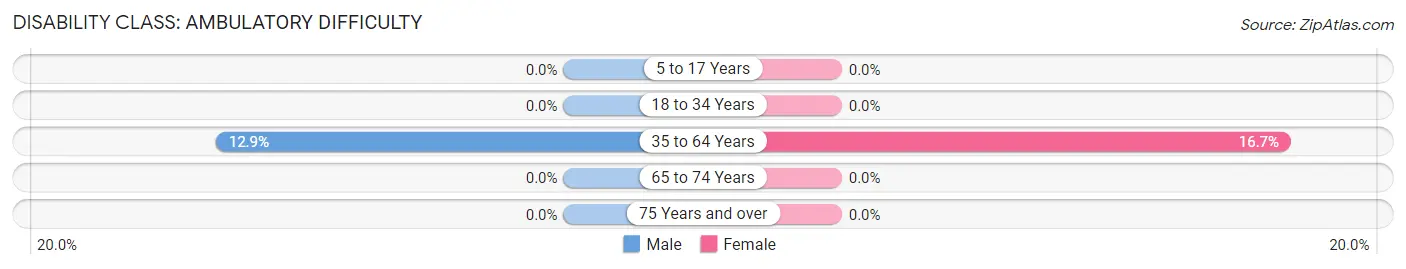
| Age Bracket | Male | Female |
| 5 to 17 Years | 0 (0.0%) | 0 (0.0%) |
| 18 to 34 Years | 0 (0.0%) | 0 (0.0%) |
| 35 to 64 Years | 4 (12.9%) | 1 (16.7%) |
| 65 to 74 Years | 0 (0.0%) | 0 (0.0%) |
| 75 Years and over | 0 (0.0%) | 0 (0.0%) |
Disability Class: Self-Care Difficulty
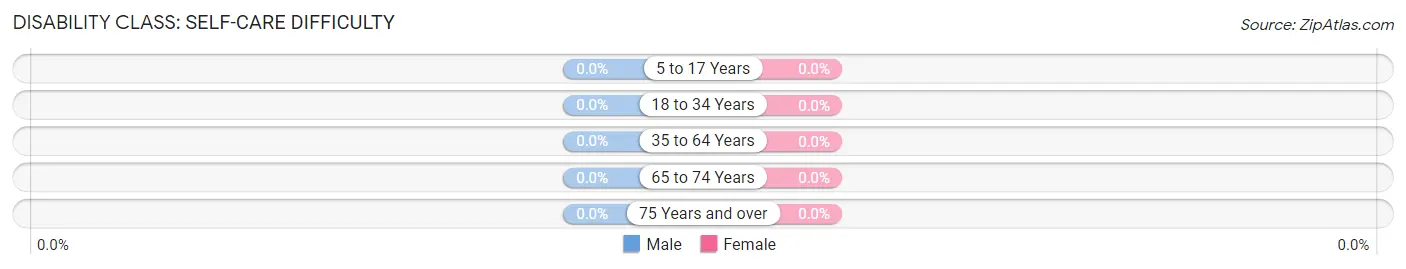
| Age Bracket | Male | Female |
| 5 to 17 Years | 0 (0.0%) | 0 (0.0%) |
| 18 to 34 Years | 0 (0.0%) | 0 (0.0%) |
| 35 to 64 Years | 0 (0.0%) | 0 (0.0%) |
| 65 to 74 Years | 0 (0.0%) | 0 (0.0%) |
| 75 Years and over | 0 (0.0%) | 0 (0.0%) |
Technology Access in Huetter
Computing Device Access in Huetter
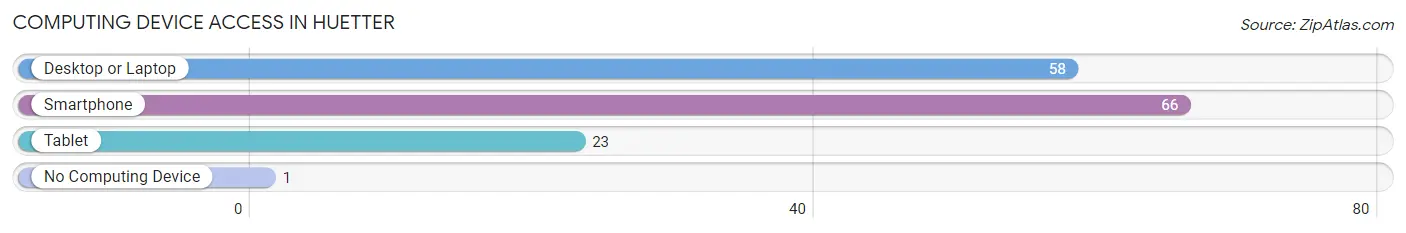
| Device Type | # Households | % Households |
| Desktop or Laptop | 58 | 85.3% |
| Smartphone | 66 | 97.1% |
| Tablet | 23 | 33.8% |
| No Computing Device | 1 | 1.5% |
| Total | 68 | 100.0% |
Internet Access in Huetter
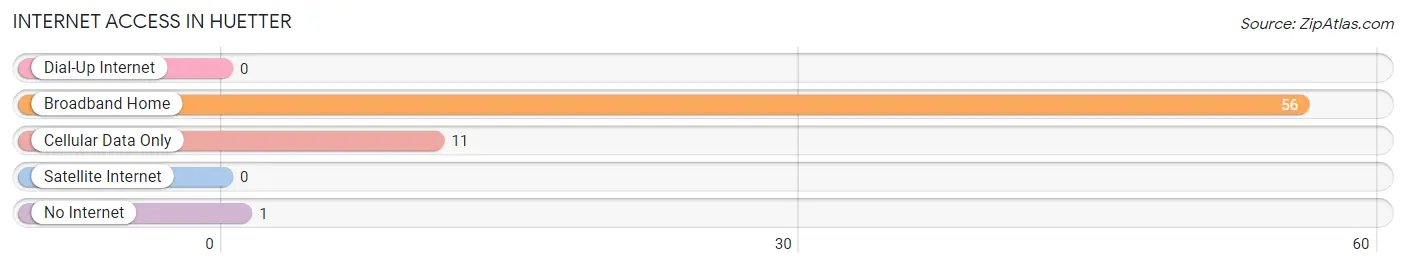
| Internet Type | # Households | % Households |
| Dial-Up Internet | 0 | 0.0% |
| Broadband Home | 56 | 82.4% |
| Cellular Data Only | 11 | 16.2% |
| Satellite Internet | 0 | 0.0% |
| No Internet | 1 | 1.5% |
| Total | 68 | 100.0% |
Huetter Summary
Idaho is a state located in the northwestern region of the United States. It is bordered by Montana to the east, Wyoming to the east, Nevada and Utah to the south, and Washington and Oregon to the west. Idaho is the 14th largest state in the US, with an area of 83,574 square miles, and the 39th most populous, with a population of 1.7 million as of 2019.
History
The area that is now Idaho has been inhabited by Native American tribes for thousands of years. The first Europeans to explore the area were members of the Lewis and Clark Expedition in 1805. The area was part of the Oregon Territory until 1863, when it became part of the Idaho Territory. Idaho became the 43rd state in the Union on July 3, 1890.
Geography
Idaho is located in the northwestern region of the United States. It is bordered by Montana to the east, Wyoming to the east, Nevada and Utah to the south, and Washington and Oregon to the west. Idaho is the 14th largest state in the US, with an area of 83,574 square miles.
The state is divided into two distinct regions: the Rocky Mountains in the north and the Great Basin in the south. The Rocky Mountains are home to some of the highest peaks in the country, including Mount Borah (12,662 feet) and Mount Heyburn (12,216 feet). The Great Basin is a large, arid region that is home to the Snake River Plain and the Snake River.
Economy
Idaho’s economy is largely based on agriculture, forestry, and mining. The state is the largest producer of potatoes in the US, and is also a major producer of wheat, barley, and other grains. Idaho is also home to a large timber industry, and is the second-largest producer of lumber in the US. Mining is also an important part of the state’s economy, with silver, gold, and phosphate being the most important minerals.
Idaho is also home to a growing technology sector, with many tech companies based in the state. Boise is home to a number of tech companies, including Hewlett-Packard, Micron Technology, and Clearwater Analytics.
Demographics
As of 2019, Idaho had a population of 1.7 million, making it the 39th most populous state in the US. The state is predominantly white, with 87.2% of the population identifying as white. The largest minority groups are Hispanic (7.3%), Native American (2.2%), and Asian (1.3%).
Idaho is also home to a large Mormon population, with nearly one-third of the state’s population identifying as members of the Church of Jesus Christ of Latter-day Saints. The state is also home to a large number of Native American tribes, including the Nez Perce, Shoshone-Bannock, and Coeur d’Alene.
Idaho is a largely rural state, with the majority of the population living in small towns and rural areas. The largest cities in the state are Boise, the state capital, and Nampa, the second-largest city. Other major cities include Pocatello, Idaho Falls, and Coeur d’Alene.
Common Questions
What is Per Capita Income in Huetter?
Per Capita income in Huetter is $20,309.
What is the Median Household income in Huetter?
Median Household Income in Huetter is $36,282.
What is Income or Wage Gap in Huetter?
Income or Wage Gap in Huetter is 92.3%.
Women in Huetter earn 7.7 cents for every dollar earned by a man.
What is Inequality or Gini Index in Huetter?
Inequality or Gini Index in Huetter is 0.26.
What is the Total Population of Huetter?
Total Population of Huetter is 161.
What is the Total Male Population of Huetter?
Total Male Population of Huetter is 109.
What is the Total Female Population of Huetter?
Total Female Population of Huetter is 52.
What is the Ratio of Males per 100 Females in Huetter?
There are 209.62 Males per 100 Females in Huetter.
What is the Ratio of Females per 100 Males in Huetter?
There are 47.71 Females per 100 Males in Huetter.
What is the Median Population Age in Huetter?
Median Population Age in Huetter is 32.2 Years.
What is the Average Family Size in Huetter
Average Family Size in Huetter is 2.6 People.
What is the Average Household Size in Huetter
Average Household Size in Huetter is 1.9 People.
How Large is the Labor Force in Huetter?
There are 92 People in the Labor Forcein in Huetter.
What is the Percentage of People in the Labor Force in Huetter?
62.2% of People are in the Labor Force in Huetter.