Victor, CO Map & Demographics
Victor Map
Victor Overview
$34,245
PER CAPITA INCOME
$73,625
AVG FAMILY INCOME
$57,679
AVG HOUSEHOLD INCOME
32.2%
WAGE / INCOME GAP [ % ]
67.8¢/ $1
WAGE / INCOME GAP [ $ ]
0.33
INEQUALITY / GINI INDEX
310
TOTAL POPULATION
164
MALE POPULATION
146
FEMALE POPULATION
112.33
MALES / 100 FEMALES
89.02
FEMALES / 100 MALES
49.3
MEDIAN AGE
3.0
AVG FAMILY SIZE
1.9
AVG HOUSEHOLD SIZE
174
LABOR FORCE [ PEOPLE ]
61.5%
PERCENT IN LABOR FORCE
5.7%
UNEMPLOYMENT RATE
Victor Zip Codes
Victor Area Codes
Income in Victor
Income Overview in Victor
Per Capita Income in Victor is $34,245, while median incomes of families and households are $73,625 and $57,679 respectively.
| Characteristic | Number | Measure |
| Per Capita Income | 310 | $34,245 |
| Median Family Income | 59 | $73,625 |
| Mean Family Income | 59 | $82,383 |
| Median Household Income | 165 | $57,679 |
| Mean Household Income | 165 | $65,082 |
| Income Deficit | 59 | $0 |
| Wage / Income Gap (%) | 310 | 32.17% |
| Wage / Income Gap ($) | 310 | 67.83¢ per $1 |
| Gini / Inequality Index | 310 | 0.33 |
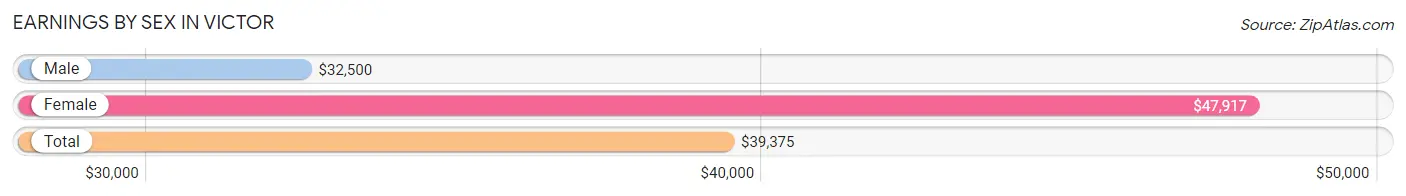
Earnings by Sex in Victor
Average Earnings in Victor are $39,375, $32,500 for men and $47,917 for women, a difference of 32.2%.
| Sex | Number | Average Earnings |
| Male | 102 (58.0%) | $32,500 |
| Female | 74 (42.0%) | $47,917 |
| Total | 176 (100.0%) | $39,375 |
Earnings by Sex by Income Bracket in Victor
The most common earnings brackets in Victor are $22,500 to $24,999 for men (25 | 24.5%) and $45,000 to $49,999 for women (20 | 27.0%).
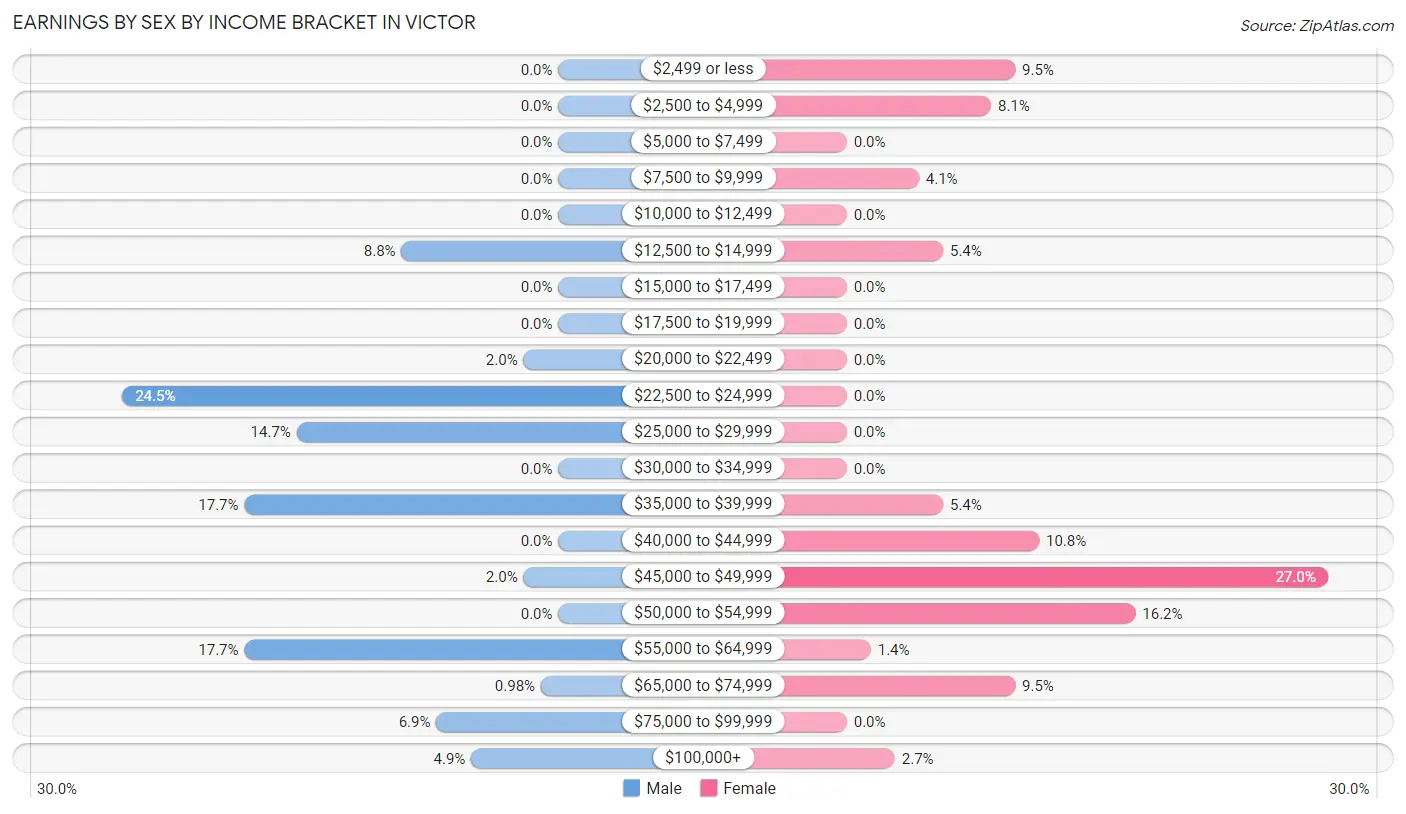
| Income | Male | Female |
| $2,499 or less | 0 (0.0%) | 7 (9.5%) |
| $2,500 to $4,999 | 0 (0.0%) | 6 (8.1%) |
| $5,000 to $7,499 | 0 (0.0%) | 0 (0.0%) |
| $7,500 to $9,999 | 0 (0.0%) | 3 (4.1%) |
| $10,000 to $12,499 | 0 (0.0%) | 0 (0.0%) |
| $12,500 to $14,999 | 9 (8.8%) | 4 (5.4%) |
| $15,000 to $17,499 | 0 (0.0%) | 0 (0.0%) |
| $17,500 to $19,999 | 0 (0.0%) | 0 (0.0%) |
| $20,000 to $22,499 | 2 (2.0%) | 0 (0.0%) |
| $22,500 to $24,999 | 25 (24.5%) | 0 (0.0%) |
| $25,000 to $29,999 | 15 (14.7%) | 0 (0.0%) |
| $30,000 to $34,999 | 0 (0.0%) | 0 (0.0%) |
| $35,000 to $39,999 | 18 (17.6%) | 4 (5.4%) |
| $40,000 to $44,999 | 0 (0.0%) | 8 (10.8%) |
| $45,000 to $49,999 | 2 (2.0%) | 20 (27.0%) |
| $50,000 to $54,999 | 0 (0.0%) | 12 (16.2%) |
| $55,000 to $64,999 | 18 (17.6%) | 1 (1.3%) |
| $65,000 to $74,999 | 1 (1.0%) | 7 (9.5%) |
| $75,000 to $99,999 | 7 (6.9%) | 0 (0.0%) |
| $100,000+ | 5 (4.9%) | 2 (2.7%) |
| Total | 102 (100.0%) | 74 (100.0%) |
Earnings by Sex by Educational Attainment in Victor
Average earnings in Victor are $39,375 for men and $48,194 for women, a difference of 18.3%. Men with an educational attainment of high school diploma enjoy the highest average annual earnings of $39,219, while those with high school diploma education earn the least with $39,219. Women with an educational attainment of high school diploma earn the most with the average annual earnings of $41,563, while those with high school diploma education have the smallest earnings of $41,563.
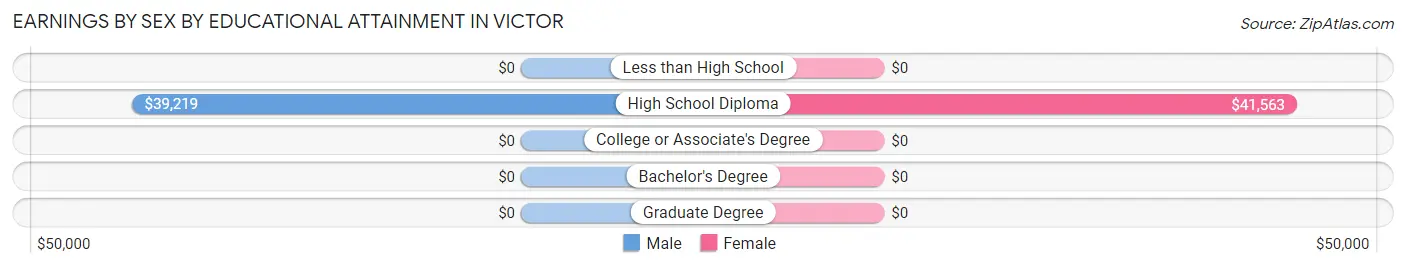
| Educational Attainment | Male Income | Female Income |
| Less than High School | - | - |
| High School Diploma | $39,219 | $41,563 |
| College or Associate's Degree | - | - |
| Bachelor's Degree | - | - |
| Graduate Degree | - | - |
| Total | $39,375 | $48,194 |
Family Income in Victor
Family Income Brackets in Victor
According to the Victor family income data, there are 28 families falling into the $50,000 to $74,999 income range, which is the most common income bracket and makes up 47.5% of all families.
| Income Bracket | # Families | % Families |
| Less than $10,000 | 0 | 0.0% |
| $10,000 to $14,999 | 0 | 0.0% |
| $15,000 to $24,999 | 0 | 0.0% |
| $25,000 to $34,999 | 0 | 0.0% |
| $35,000 to $49,999 | 7 | 11.9% |
| $50,000 to $74,999 | 28 | 47.5% |
| $75,000 to $99,999 | 4 | 6.8% |
| $100,000 to $149,999 | 20 | 33.9% |
| $150,000 to $199,999 | 0 | 0.0% |
| $200,000+ | 0 | 0.0% |
Family Income by Famaliy Size in Victor
4-person families (25 | 42.4%) account for the highest median family income in Victor with $115,096 per family, while 2-person families (34 | 57.6%) have the highest median income of $36,750 per family member.
| Income Bracket | # Families | Median Income |
| 2-Person Families | 34 (57.6%) | $73,500 |
| 3-Person Families | 0 (0.0%) | $0 |
| 4-Person Families | 25 (42.4%) | $115,096 |
| 5-Person Families | 0 (0.0%) | $0 |
| 6-Person Families | 0 (0.0%) | $0 |
| 7+ Person Families | 0 (0.0%) | $0 |
| Total | 59 (100.0%) | $73,625 |
Family Income by Number of Earners in Victor
| Number of Earners | # Families | Median Income |
| No Earners | 9 (15.2%) | $0 |
| 1 Earner | 30 (50.8%) | $115,962 |
| 2 Earners | 20 (33.9%) | $73,250 |
| 3+ Earners | 0 (0.0%) | $0 |
| Total | 59 (100.0%) | $73,625 |
Household Income in Victor
Household Income Brackets in Victor
With 48 households falling in the category, the $50,000 to $74,999 income range is the most frequent in Victor, accounting for 29.1% of all households.
| Income Bracket | # Households | % Households |
| Less than $10,000 | 4 | 2.4% |
| $10,000 to $14,999 | 11 | 6.7% |
| $15,000 to $24,999 | 12 | 7.3% |
| $25,000 to $34,999 | 12 | 7.3% |
| $35,000 to $49,999 | 28 | 17.0% |
| $50,000 to $74,999 | 48 | 29.1% |
| $75,000 to $99,999 | 12 | 7.3% |
| $100,000 to $149,999 | 35 | 21.2% |
| $150,000 to $199,999 | 0 | 0.0% |
| $200,000+ | 3 | 1.8% |
Household Income by Householder Age in Victor
The median household income in Victor is $57,679, with the highest median household income of $72,875 found in the 45 to 64 years age bracket for the primary householder. A total of 79 households (47.9%) fall into this category.
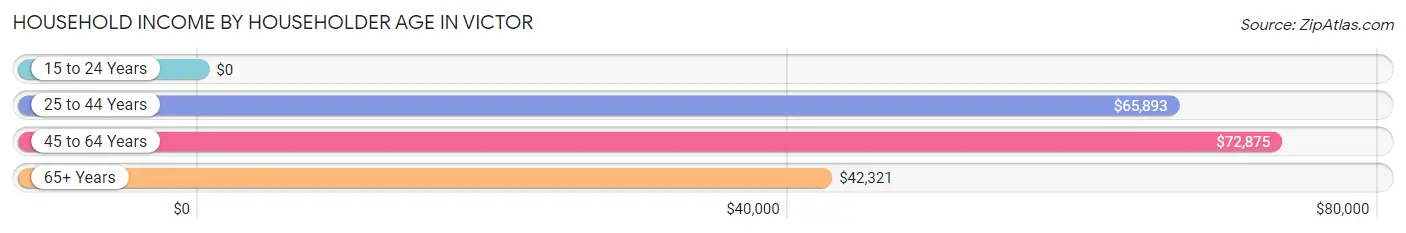
| Income Bracket | # Households | Median Income |
| 15 to 24 Years | 0 (0.0%) | $0 |
| 25 to 44 Years | 31 (18.8%) | $65,893 |
| 45 to 64 Years | 79 (47.9%) | $72,875 |
| 65+ Years | 55 (33.3%) | $42,321 |
| Total | 165 (100.0%) | $57,679 |
Poverty in Victor
Income Below Poverty by Sex and Age in Victor
With 2.5% poverty level for males and 11.0% for females among the residents of Victor, 65 to 74 year old males and 45 to 54 year old females are the most vulnerable to poverty, with 4 males (16.7%) and 12 females (33.3%) in their respective age groups living below the poverty level.
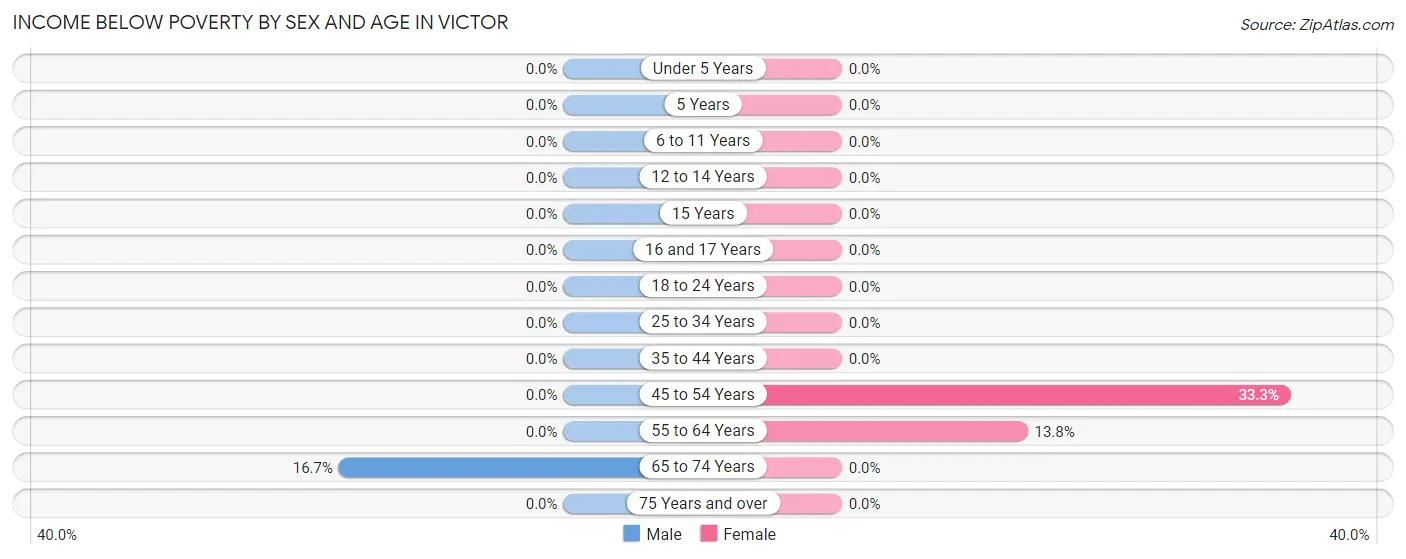
| Age Bracket | Male | Female |
| Under 5 Years | 0 (0.0%) | 0 (0.0%) |
| 5 Years | 0 (0.0%) | 0 (0.0%) |
| 6 to 11 Years | 0 (0.0%) | 0 (0.0%) |
| 12 to 14 Years | 0 (0.0%) | 0 (0.0%) |
| 15 Years | 0 (0.0%) | 0 (0.0%) |
| 16 and 17 Years | 0 (0.0%) | 0 (0.0%) |
| 18 to 24 Years | 0 (0.0%) | 0 (0.0%) |
| 25 to 34 Years | 0 (0.0%) | 0 (0.0%) |
| 35 to 44 Years | 0 (0.0%) | 0 (0.0%) |
| 45 to 54 Years | 0 (0.0%) | 12 (33.3%) |
| 55 to 64 Years | 0 (0.0%) | 4 (13.8%) |
| 65 to 74 Years | 4 (16.7%) | 0 (0.0%) |
| 75 Years and over | 0 (0.0%) | 0 (0.0%) |
| Total | 4 (2.5%) | 16 (11.0%) |
Income Above Poverty by Sex and Age in Victor
According to the poverty statistics in Victor, males aged under 5 years and females aged under 5 years are the age groups that are most secure financially, with 100.0% of males and 100.0% of females in these age groups living above the poverty line.
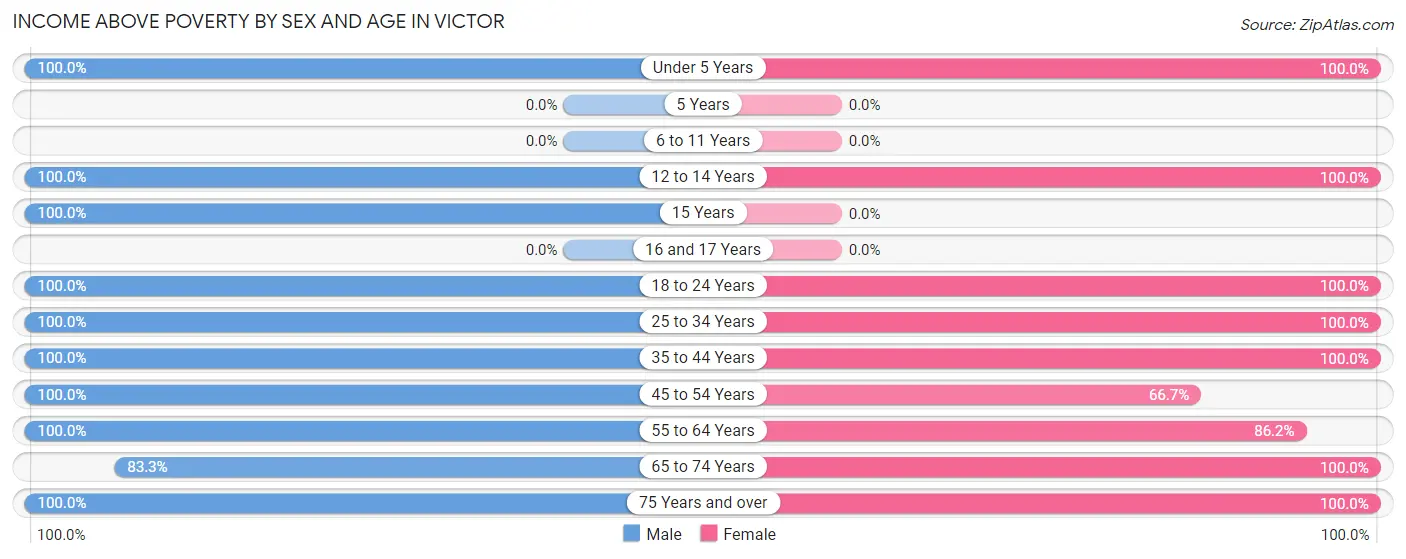
| Age Bracket | Male | Female |
| Under 5 Years | 10 (100.0%) | 3 (100.0%) |
| 5 Years | 0 (0.0%) | 0 (0.0%) |
| 6 to 11 Years | 0 (0.0%) | 0 (0.0%) |
| 12 to 14 Years | 6 (100.0%) | 3 (100.0%) |
| 15 Years | 4 (100.0%) | 0 (0.0%) |
| 16 and 17 Years | 0 (0.0%) | 0 (0.0%) |
| 18 to 24 Years | 28 (100.0%) | 4 (100.0%) |
| 25 to 34 Years | 11 (100.0%) | 38 (100.0%) |
| 35 to 44 Years | 25 (100.0%) | 6 (100.0%) |
| 45 to 54 Years | 23 (100.0%) | 24 (66.7%) |
| 55 to 64 Years | 19 (100.0%) | 25 (86.2%) |
| 65 to 74 Years | 20 (83.3%) | 20 (100.0%) |
| 75 Years and over | 13 (100.0%) | 7 (100.0%) |
| Total | 159 (97.6%) | 130 (89.0%) |
Income Below Poverty Among Married-Couple Families in Victor
| Children | Above Poverty | Below Poverty |
| No Children | 21 (100.0%) | 0 (0.0%) |
| 1 or 2 Children | 5 (100.0%) | 0 (0.0%) |
| 3 or 4 Children | 0 (0.0%) | 0 (0.0%) |
| 5 or more Children | 0 (0.0%) | 0 (0.0%) |
| Total | 26 (100.0%) | 0 (0.0%) |
Income Below Poverty Among Single-Parent Households in Victor
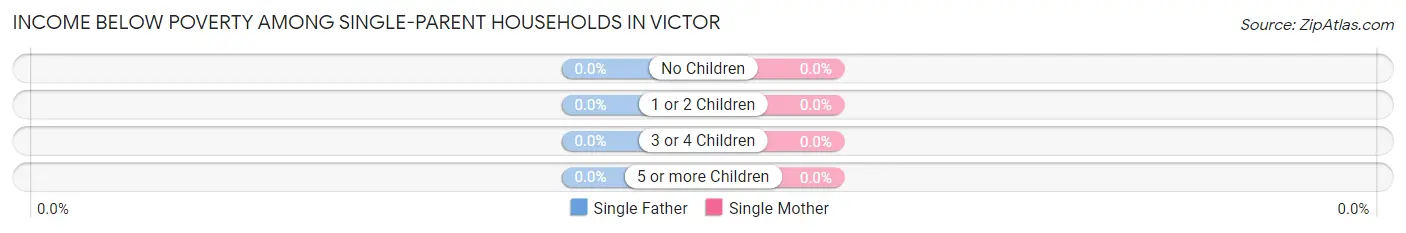
| Children | Single Father | Single Mother |
| No Children | 0 (0.0%) | 0 (0.0%) |
| 1 or 2 Children | 0 (0.0%) | 0 (0.0%) |
| 3 or 4 Children | 0 (0.0%) | 0 (0.0%) |
| 5 or more Children | 0 (0.0%) | 0 (0.0%) |
| Total | 0 (0.0%) | 0 (0.0%) |
Income Below Poverty Among Married-Couple vs Single-Parent Households in Victor
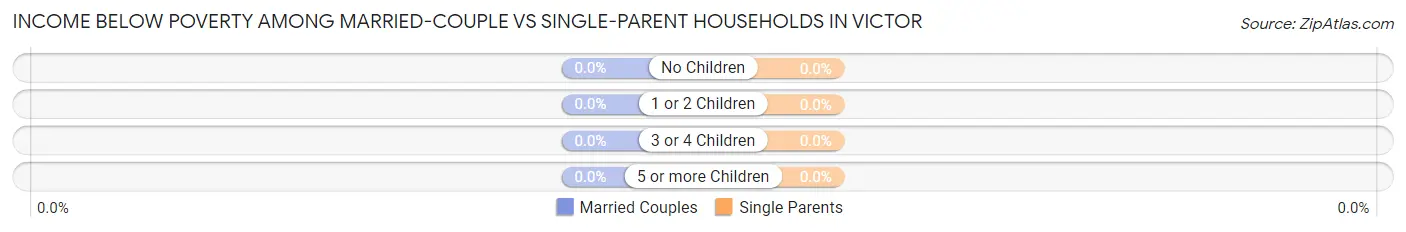
| Children | Married-Couple Families | Single-Parent Households |
| No Children | 0 (0.0%) | 0 (0.0%) |
| 1 or 2 Children | 0 (0.0%) | 0 (0.0%) |
| 3 or 4 Children | 0 (0.0%) | 0 (0.0%) |
| 5 or more Children | 0 (0.0%) | 0 (0.0%) |
| Total | 0 (0.0%) | 0 (0.0%) |
Race in Victor
The most populous races in Victor are White / Caucasian (247 | 79.7%), Hispanic or Latino (43 | 13.9%), and Two or more Races (43 | 13.9%).
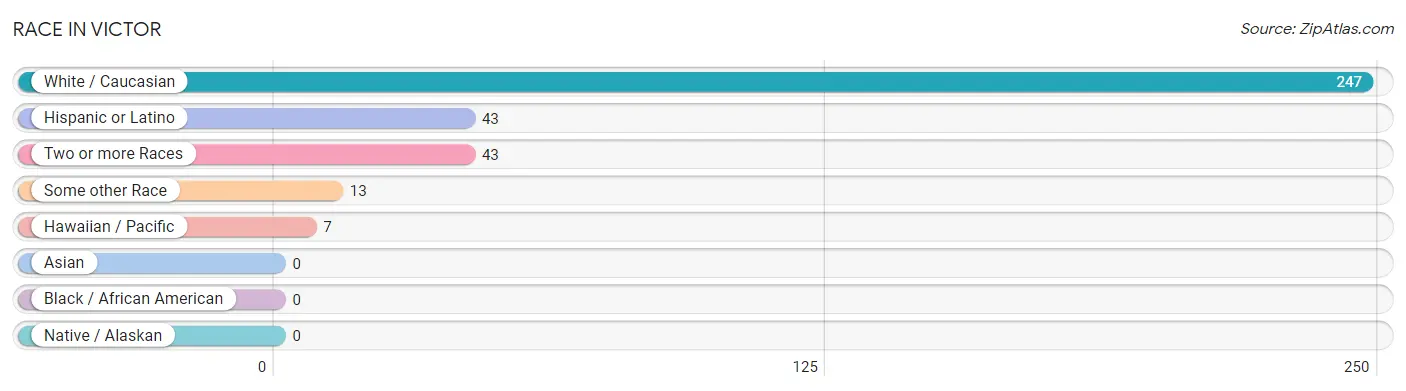
| Race | # Population | % Population |
| Asian | 0 | 0.0% |
| Black / African American | 0 | 0.0% |
| Hawaiian / Pacific | 7 | 2.3% |
| Hispanic or Latino | 43 | 13.9% |
| Native / Alaskan | 0 | 0.0% |
| White / Caucasian | 247 | 79.7% |
| Two or more Races | 43 | 13.9% |
| Some other Race | 13 | 4.2% |
| Total | 310 | 100.0% |
Ancestry in Victor
The most populous ancestries reported in Victor are German (75 | 24.2%), Irish (60 | 19.4%), Mexican (32 | 10.3%), American (31 | 10.0%), and English (28 | 9.0%), together accounting for 72.9% of all Victor residents.
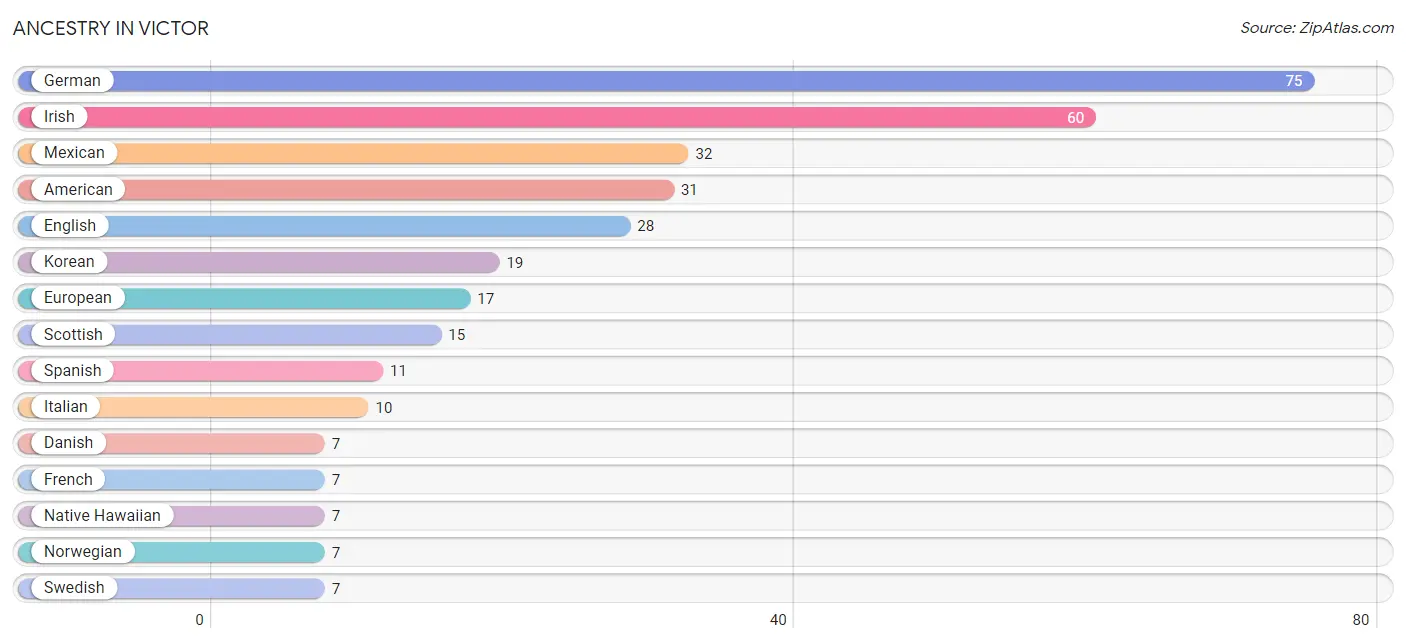
| Ancestry | # Population | % Population |
| American | 31 | 10.0% |
| Armenian | 3 | 1.0% |
| Cherokee | 5 | 1.6% |
| Danish | 7 | 2.3% |
| English | 28 | 9.0% |
| European | 17 | 5.5% |
| French | 7 | 2.3% |
| German | 75 | 24.2% |
| Irish | 60 | 19.4% |
| Italian | 10 | 3.2% |
| Korean | 19 | 6.1% |
| Mexican | 32 | 10.3% |
| Native Hawaiian | 7 | 2.3% |
| Norwegian | 7 | 2.3% |
| Pennsylvania German | 6 | 1.9% |
| Scandinavian | 2 | 0.6% |
| Scottish | 15 | 4.8% |
| Slovene | 1 | 0.3% |
| Spanish | 11 | 3.5% |
| Swedish | 7 | 2.3% |
| Swiss | 3 | 1.0% | View All 21 Rows |
Immigrants in Victor
The most numerous immigrant groups reported in Victor came from Europe (7 | 2.3%), Germany (7 | 2.3%), Western Europe (7 | 2.3%), Armenia (3 | 1.0%), and Asia (3 | 1.0%), together accounting for 8.7% of all Victor residents.
| Immigration Origin | # Population | % Population |
| Armenia | 3 | 1.0% |
| Asia | 3 | 1.0% |
| Europe | 7 | 2.3% |
| Germany | 7 | 2.3% |
| Western Asia | 3 | 1.0% |
| Western Europe | 7 | 2.3% | View All 6 Rows |
Sex and Age in Victor
Sex and Age in Victor
The most populous age groups in Victor are 20 to 24 Years (26 | 15.9%) for men and 30 to 34 Years (28 | 19.2%) for women.
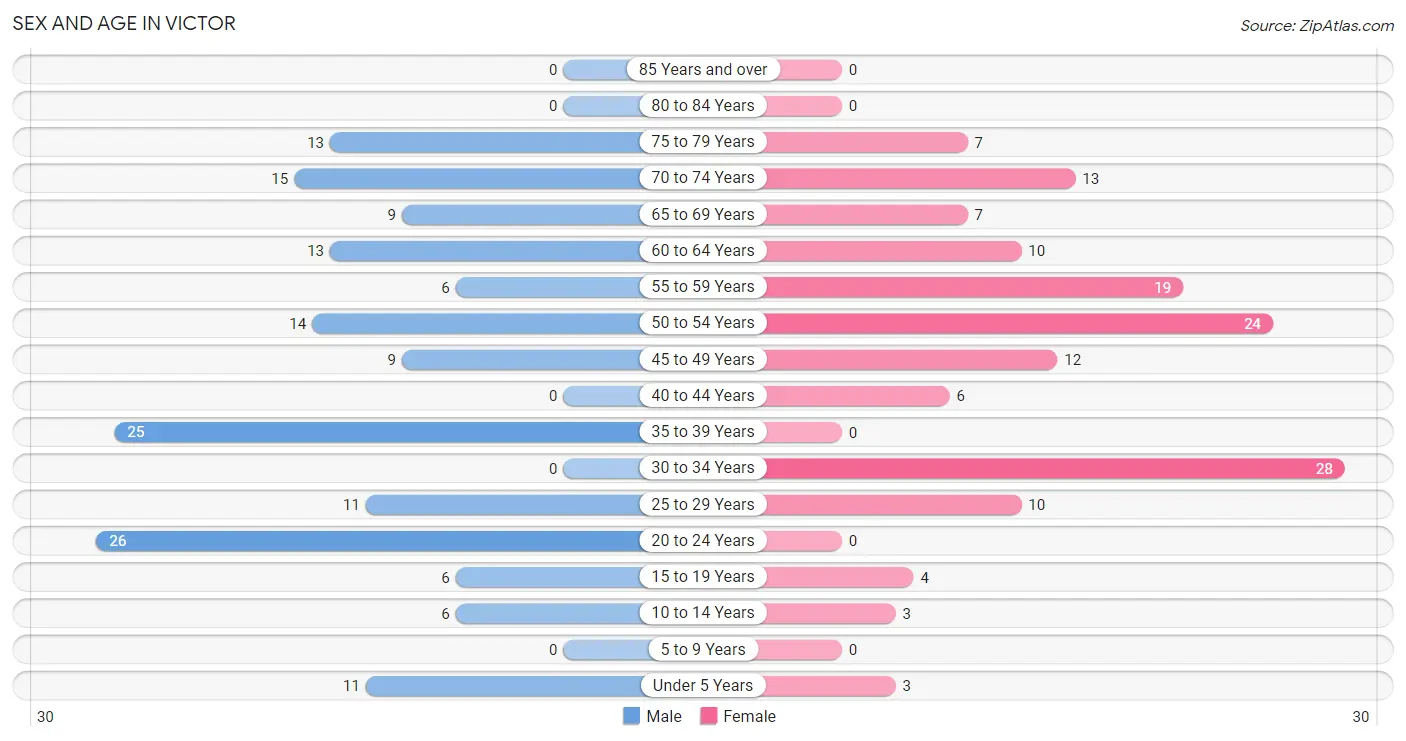
| Age Bracket | Male | Female |
| Under 5 Years | 11 (6.7%) | 3 (2.1%) |
| 5 to 9 Years | 0 (0.0%) | 0 (0.0%) |
| 10 to 14 Years | 6 (3.7%) | 3 (2.1%) |
| 15 to 19 Years | 6 (3.7%) | 4 (2.7%) |
| 20 to 24 Years | 26 (15.9%) | 0 (0.0%) |
| 25 to 29 Years | 11 (6.7%) | 10 (6.9%) |
| 30 to 34 Years | 0 (0.0%) | 28 (19.2%) |
| 35 to 39 Years | 25 (15.2%) | 0 (0.0%) |
| 40 to 44 Years | 0 (0.0%) | 6 (4.1%) |
| 45 to 49 Years | 9 (5.5%) | 12 (8.2%) |
| 50 to 54 Years | 14 (8.5%) | 24 (16.4%) |
| 55 to 59 Years | 6 (3.7%) | 19 (13.0%) |
| 60 to 64 Years | 13 (7.9%) | 10 (6.9%) |
| 65 to 69 Years | 9 (5.5%) | 7 (4.8%) |
| 70 to 74 Years | 15 (9.1%) | 13 (8.9%) |
| 75 to 79 Years | 13 (7.9%) | 7 (4.8%) |
| 80 to 84 Years | 0 (0.0%) | 0 (0.0%) |
| 85 Years and over | 0 (0.0%) | 0 (0.0%) |
| Total | 164 (100.0%) | 146 (100.0%) |
Families and Households in Victor
Median Family Size in Victor
The median family size in Victor is 3.03 persons per family, with single female/mother families (10 | 17.0%) accounting for the largest median family size of 3.3 persons per family. On the other hand, married-couple families (26 | 44.1%) represent the smallest median family size with 2.96 persons per family.
| Family Type | # Families | Family Size |
| Married-Couple | 26 (44.1%) | 2.96 |
| Single Male/Father | 23 (39.0%) | 3.00 |
| Single Female/Mother | 10 (17.0%) | 3.30 |
| Total Families | 59 (100.0%) | 3.03 |
Median Household Size in Victor
The median household size in Victor is 1.88 persons per household, with single female/mother households (10 | 6.1%) accounting for the largest median household size of 3.3 persons per household. non-family households (106 | 64.2%) represent the smallest median household size with 1.24 persons per household.
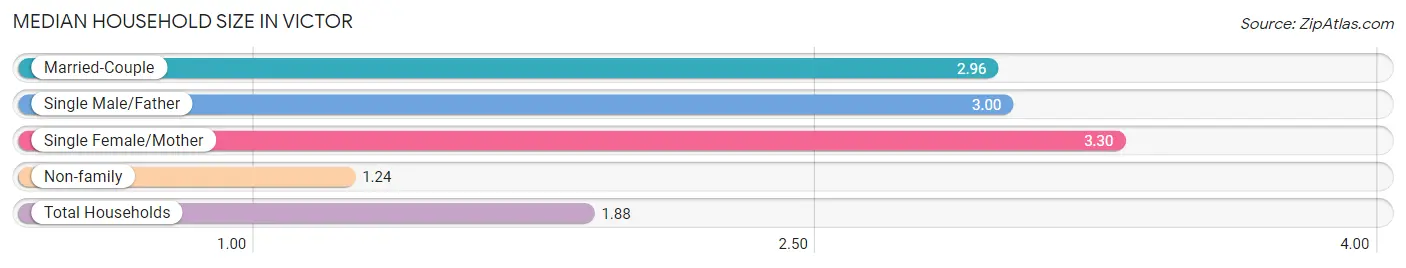
| Household Type | # Households | Household Size |
| Married-Couple | 26 (15.8%) | 2.96 |
| Single Male/Father | 23 (13.9%) | 3.00 |
| Single Female/Mother | 10 (6.1%) | 3.30 |
| Non-family | 106 (64.2%) | 1.24 |
| Total Households | 165 (100.0%) | 1.88 |
Household Size by Marriage Status in Victor
Out of a total of 165 households in Victor, 59 (35.8%) are family households, while 106 (64.2%) are nonfamily households. The most numerous type of family households are 2-person households, comprising 34, and the most common type of nonfamily households are 1-person households, comprising 77.
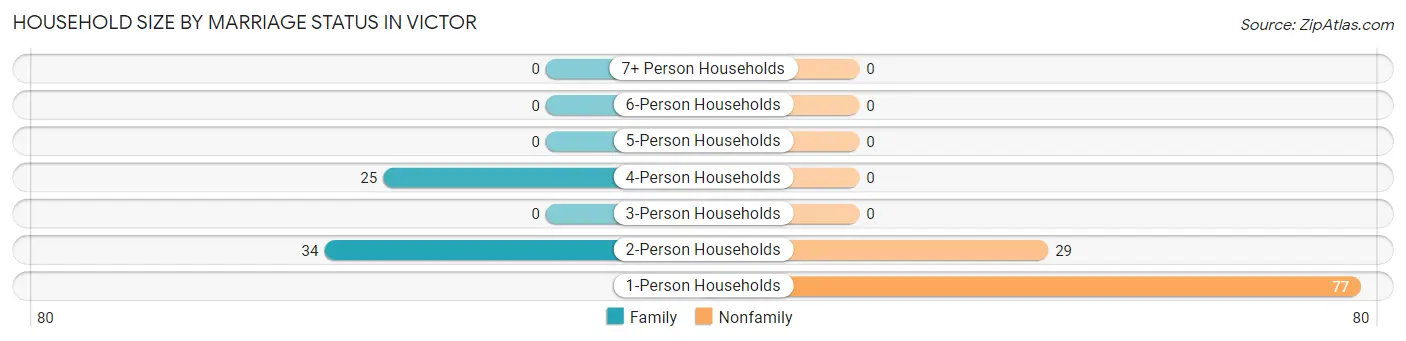
| Household Size | Family Households | Nonfamily Households |
| 1-Person Households | - | 77 (46.7%) |
| 2-Person Households | 34 (20.6%) | 29 (17.6%) |
| 3-Person Households | 0 (0.0%) | 0 (0.0%) |
| 4-Person Households | 25 (15.1%) | 0 (0.0%) |
| 5-Person Households | 0 (0.0%) | 0 (0.0%) |
| 6-Person Households | 0 (0.0%) | 0 (0.0%) |
| 7+ Person Households | 0 (0.0%) | 0 (0.0%) |
| Total | 59 (35.8%) | 106 (64.2%) |
Female Fertility in Victor
Fertility by Age in Victor
| Age Bracket | Women with Births | Births / 1,000 Women |
| 15 to 19 years | 0 (0.0%) | 0.0 |
| 20 to 34 years | 0 (0.0%) | 0.0 |
| 35 to 50 years | 0 (0.0%) | 0.0 |
| Total | 0 (0.0%) | 0.0 |
Fertility by Age by Marriage Status in Victor
| Age Bracket | Married | Unmarried |
| 15 to 19 years | 0 (0.0%) | 0 (0.0%) |
| 20 to 34 years | 0 (0.0%) | 0 (0.0%) |
| 35 to 50 years | 0 (0.0%) | 0 (0.0%) |
| Total | 0 (0.0%) | 0 (0.0%) |
Fertility by Education in Victor
| Educational Attainment | Women with Births | Births / 1,000 Women |
| Less than High School | 0 (0.0%) | 0.0 |
| High School Diploma | 0 (0.0%) | 0.0 |
| College or Associate's Degree | 0 (0.0%) | 0.0 |
| Bachelor's Degree | 0 (0.0%) | 0.0 |
| Graduate Degree | 0 (0.0%) | 0.0 |
| Total | 0 (0.0%) | 0.0 |
Fertility by Education by Marriage Status in Victor
| Educational Attainment | Married | Unmarried |
| Less than High School | 0 (0.0%) | 0 (0.0%) |
| High School Diploma | 0 (0.0%) | 0 (0.0%) |
| College or Associate's Degree | 0 (0.0%) | 0 (0.0%) |
| Bachelor's Degree | 0 (0.0%) | 0 (0.0%) |
| Graduate Degree | 0 (0.0%) | 0 (0.0%) |
| Total | 0 (0.0%) | 0 (0.0%) |
Employment Characteristics in Victor
Employment by Class of Employer in Victor
Among the 164 employed individuals in Victor, private company employees (122 | 74.4%), self-employed (not incorporated) (14 | 8.5%), and local government employees (14 | 8.5%) make up the most common classes of employment.
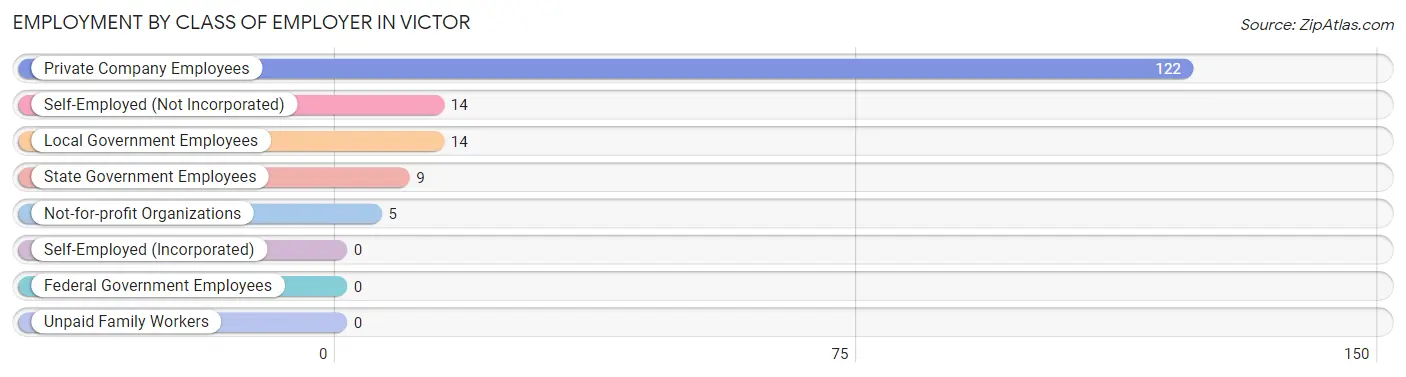
| Employer Class | # Employees | % Employees |
| Private Company Employees | 122 | 74.4% |
| Self-Employed (Incorporated) | 0 | 0.0% |
| Self-Employed (Not Incorporated) | 14 | 8.5% |
| Not-for-profit Organizations | 5 | 3.0% |
| Local Government Employees | 14 | 8.5% |
| State Government Employees | 9 | 5.5% |
| Federal Government Employees | 0 | 0.0% |
| Unpaid Family Workers | 0 | 0.0% |
| Total | 164 | 100.0% |
Employment Status by Age in Victor
According to the labor force statistics for Victor, out of the total population over 16 years of age (283), 61.5% or 174 individuals are in the labor force, with 5.7% or 10 of them unemployed. The age group with the highest labor force participation rate is 16 to 19 years, with 100.0% or 6 individuals in the labor force. Within the labor force, the 25 to 29 years age range has the highest percentage of unemployed individuals, with 47.6% or 10 of them being unemployed.
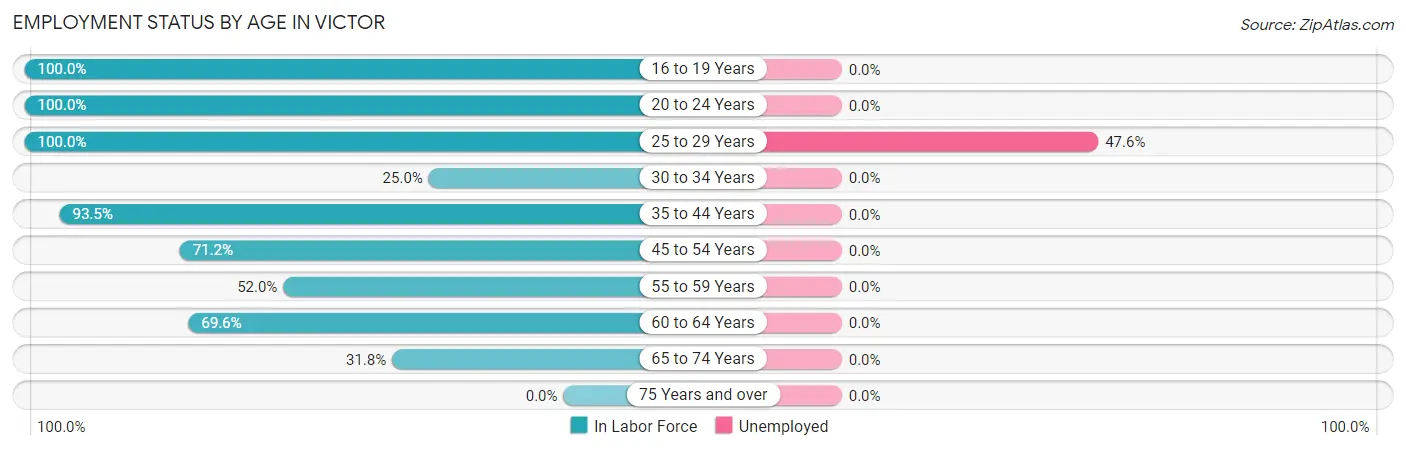
| Age Bracket | In Labor Force | Unemployed |
| 16 to 19 Years | 6 (100.0%) | 0 (0.0%) |
| 20 to 24 Years | 26 (100.0%) | 0 (0.0%) |
| 25 to 29 Years | 21 (100.0%) | 10 (47.6%) |
| 30 to 34 Years | 7 (25.0%) | 0 (0.0%) |
| 35 to 44 Years | 29 (93.5%) | 0 (0.0%) |
| 45 to 54 Years | 42 (71.2%) | 0 (0.0%) |
| 55 to 59 Years | 13 (52.0%) | 0 (0.0%) |
| 60 to 64 Years | 16 (69.6%) | 0 (0.0%) |
| 65 to 74 Years | 14 (31.8%) | 0 (0.0%) |
| 75 Years and over | 0 (0.0%) | 0 (0.0%) |
| Total | 174 (61.5%) | 10 (5.7%) |
Employment Status by Educational Attainment in Victor
According to labor force statistics for Victor, 68.4% of individuals (128) out of the total population between 25 and 64 years of age (187) are in the labor force, with 7.8% or 10 of them being unemployed. The group with the highest labor force participation rate are those with the educational attainment of less than high school, with 100.0% or 19 individuals in the labor force. Within the labor force, individuals with high school diploma education have the highest percentage of unemployment, with 14.3% or 10 of them being unemployed.
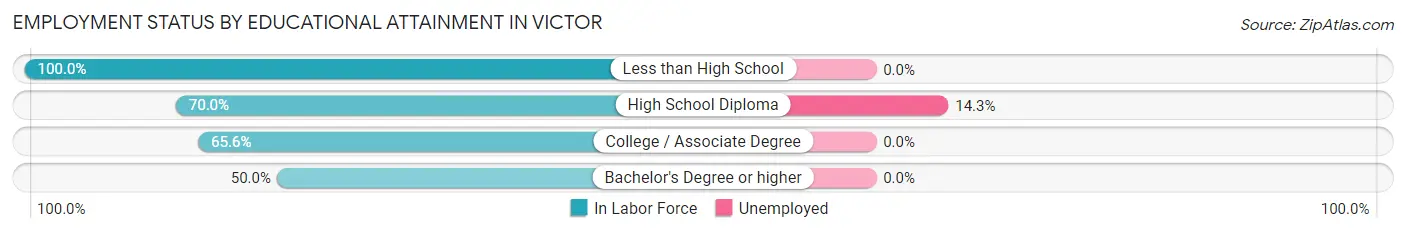
| Educational Attainment | In Labor Force | Unemployed |
| Less than High School | 19 (100.0%) | 0 (0.0%) |
| High School Diploma | 70 (70.0%) | 14 (14.3%) |
| College / Associate Degree | 21 (65.6%) | 0 (0.0%) |
| Bachelor's Degree or higher | 18 (50.0%) | 0 (0.0%) |
| Total | 128 (68.4%) | 15 (7.8%) |
Employment Occupations by Sex in Victor
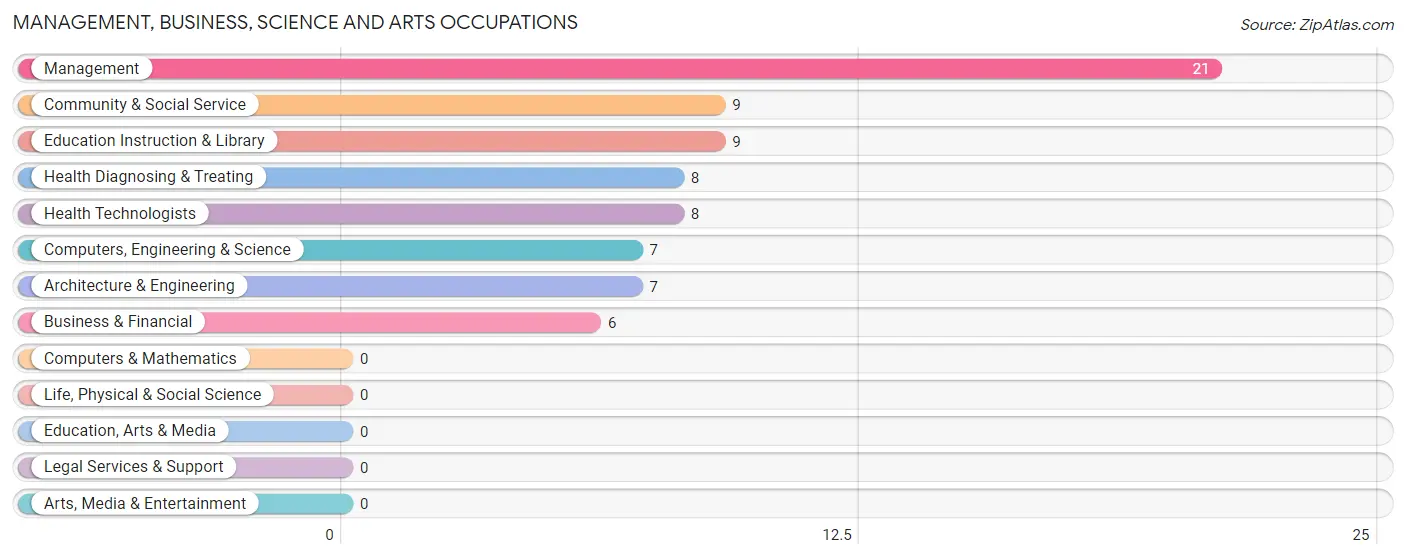
Management, Business, Science and Arts Occupations
The most common Management, Business, Science and Arts occupations in Victor are Management (21 | 12.8%), Community & Social Service (9 | 5.5%), Education Instruction & Library (9 | 5.5%), Health Diagnosing & Treating (8 | 4.9%), and Health Technologists (8 | 4.9%).
Management, Business, Science and Arts Occupations by Sex
Within the Management, Business, Science and Arts occupations in Victor, the most male-oriented occupations are Computers, Engineering & Science (100.0%), Architecture & Engineering (100.0%), and Community & Social Service (100.0%), while the most female-oriented occupations are Business & Financial (100.0%), Health Diagnosing & Treating (100.0%), and Health Technologists (100.0%).
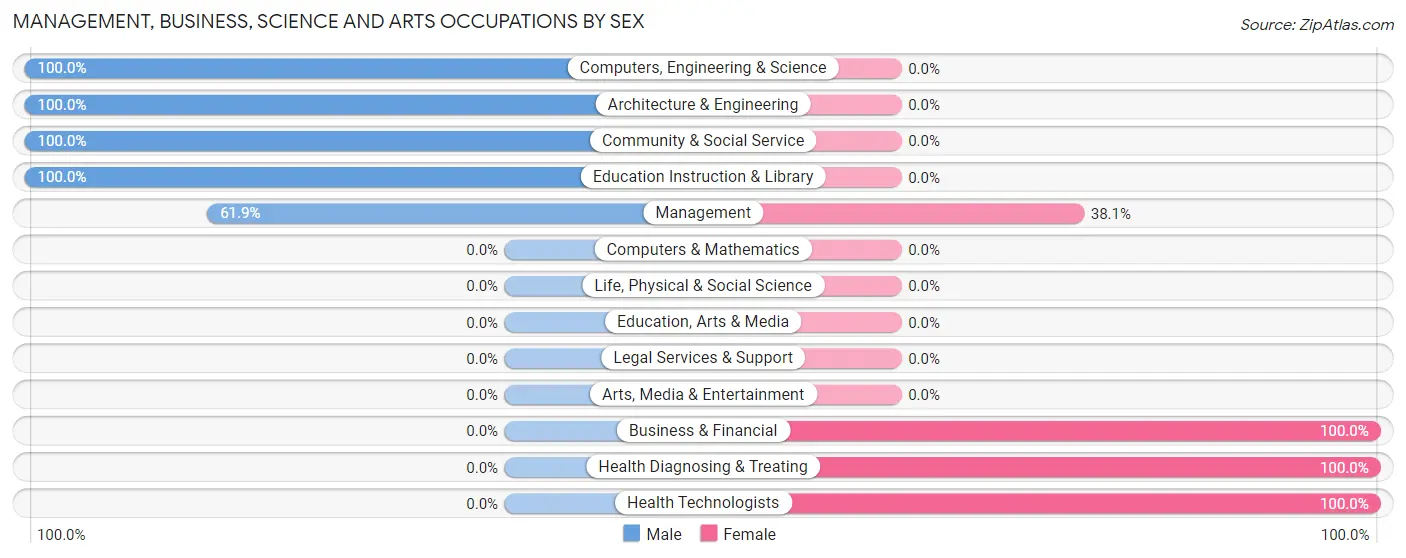
| Occupation | Male | Female |
| Management | 13 (61.9%) | 8 (38.1%) |
| Business & Financial | 0 (0.0%) | 6 (100.0%) |
| Computers, Engineering & Science | 7 (100.0%) | 0 (0.0%) |
| Computers & Mathematics | 0 (0.0%) | 0 (0.0%) |
| Architecture & Engineering | 7 (100.0%) | 0 (0.0%) |
| Life, Physical & Social Science | 0 (0.0%) | 0 (0.0%) |
| Community & Social Service | 9 (100.0%) | 0 (0.0%) |
| Education, Arts & Media | 0 (0.0%) | 0 (0.0%) |
| Legal Services & Support | 0 (0.0%) | 0 (0.0%) |
| Education Instruction & Library | 9 (100.0%) | 0 (0.0%) |
| Arts, Media & Entertainment | 0 (0.0%) | 0 (0.0%) |
| Health Diagnosing & Treating | 0 (0.0%) | 8 (100.0%) |
| Health Technologists | 0 (0.0%) | 8 (100.0%) |
| Total (Category) | 29 (56.9%) | 22 (43.1%) |
| Total (Overall) | 99 (60.4%) | 65 (39.6%) |
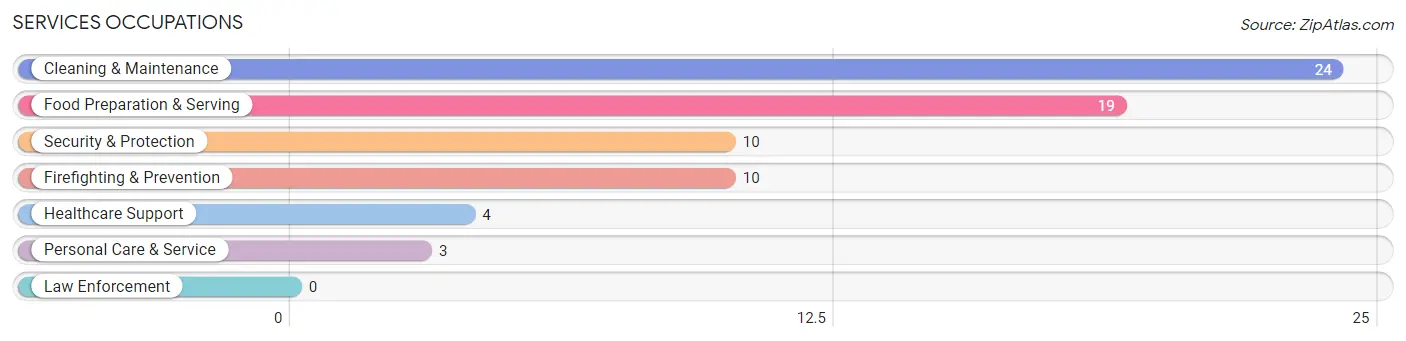
Services Occupations
The most common Services occupations in Victor are Cleaning & Maintenance (24 | 14.6%), Food Preparation & Serving (19 | 11.6%), Security & Protection (10 | 6.1%), Firefighting & Prevention (10 | 6.1%), and Healthcare Support (4 | 2.4%).
Services Occupations by Sex
Within the Services occupations in Victor, the most male-oriented occupations are Security & Protection (100.0%), Firefighting & Prevention (100.0%), and Cleaning & Maintenance (100.0%), while the most female-oriented occupations are Healthcare Support (100.0%), Food Preparation & Serving (100.0%), and Personal Care & Service (100.0%).
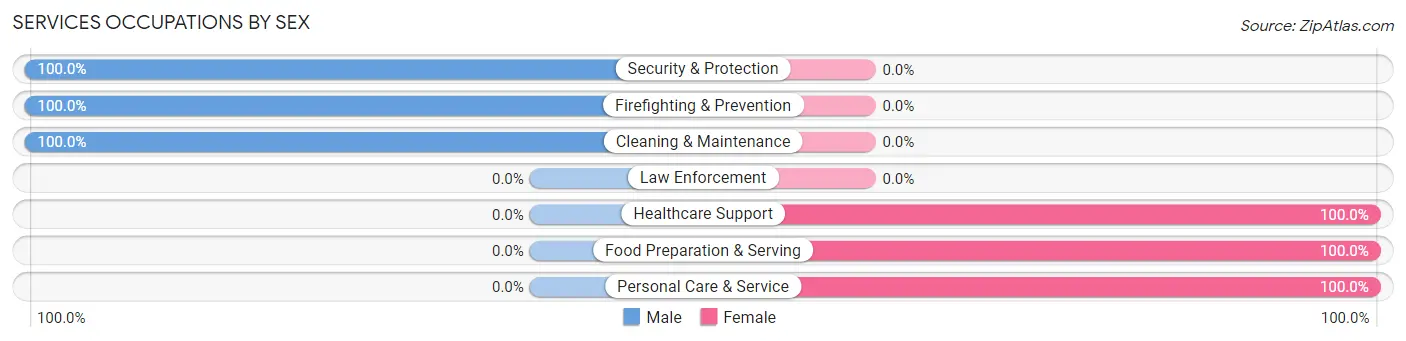
| Occupation | Male | Female |
| Healthcare Support | 0 (0.0%) | 4 (100.0%) |
| Security & Protection | 10 (100.0%) | 0 (0.0%) |
| Firefighting & Prevention | 10 (100.0%) | 0 (0.0%) |
| Law Enforcement | 0 (0.0%) | 0 (0.0%) |
| Food Preparation & Serving | 0 (0.0%) | 19 (100.0%) |
| Cleaning & Maintenance | 24 (100.0%) | 0 (0.0%) |
| Personal Care & Service | 0 (0.0%) | 3 (100.0%) |
| Total (Category) | 34 (56.7%) | 26 (43.3%) |
| Total (Overall) | 99 (60.4%) | 65 (39.6%) |
Sales and Office Occupations
The most common Sales and Office occupations in Victor are Office & Administration (16 | 9.8%), and Sales & Related (12 | 7.3%).
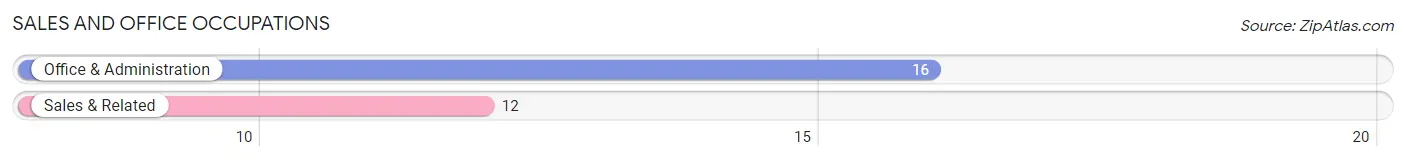
Sales and Office Occupations by Sex

| Occupation | Male | Female |
| Sales & Related | 12 (100.0%) | 0 (0.0%) |
| Office & Administration | 0 (0.0%) | 16 (100.0%) |
| Total (Category) | 12 (42.9%) | 16 (57.1%) |
| Total (Overall) | 99 (60.4%) | 65 (39.6%) |
Natural Resources, Construction and Maintenance Occupations
The most common Natural Resources, Construction and Maintenance occupations in Victor are Construction & Extraction (12 | 7.3%), and Installation, Maintenance & Repair (5 | 3.0%).
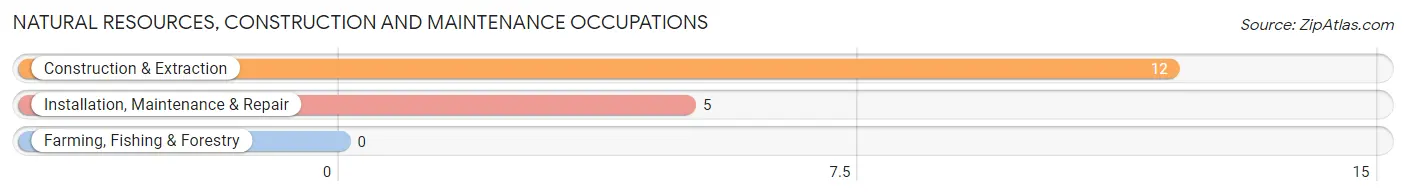
Natural Resources, Construction and Maintenance Occupations by Sex
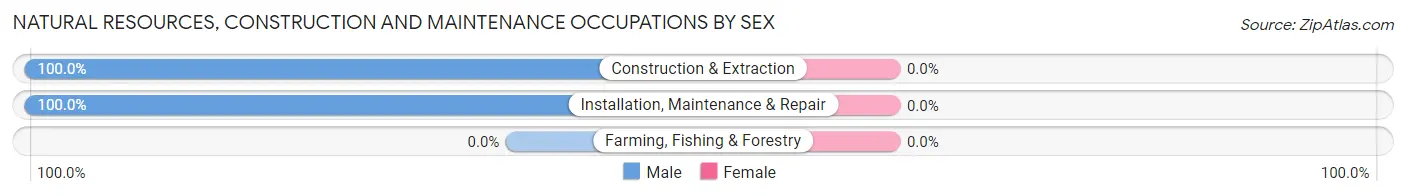
| Occupation | Male | Female |
| Farming, Fishing & Forestry | 0 (0.0%) | 0 (0.0%) |
| Construction & Extraction | 12 (100.0%) | 0 (0.0%) |
| Installation, Maintenance & Repair | 5 (100.0%) | 0 (0.0%) |
| Total (Category) | 17 (100.0%) | 0 (0.0%) |
| Total (Overall) | 99 (60.4%) | 65 (39.6%) |
Production, Transportation and Moving Occupations
The most common Production, Transportation and Moving occupations in Victor are , and Production (8 | 4.9%).
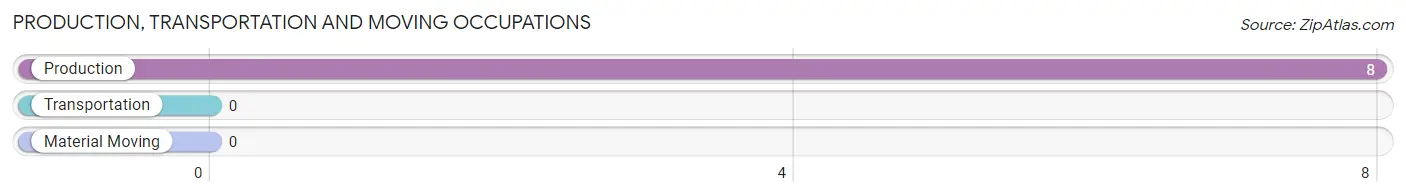
Production, Transportation and Moving Occupations by Sex
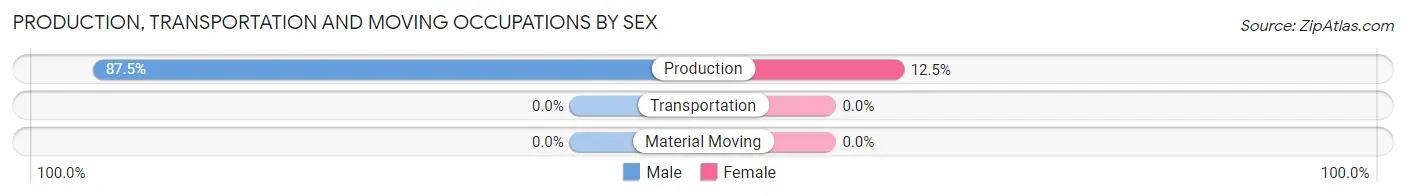
| Occupation | Male | Female |
| Production | 7 (87.5%) | 1 (12.5%) |
| Transportation | 0 (0.0%) | 0 (0.0%) |
| Material Moving | 0 (0.0%) | 0 (0.0%) |
| Total (Category) | 7 (87.5%) | 1 (12.5%) |
| Total (Overall) | 99 (60.4%) | 65 (39.6%) |
Employment Industries by Sex in Victor
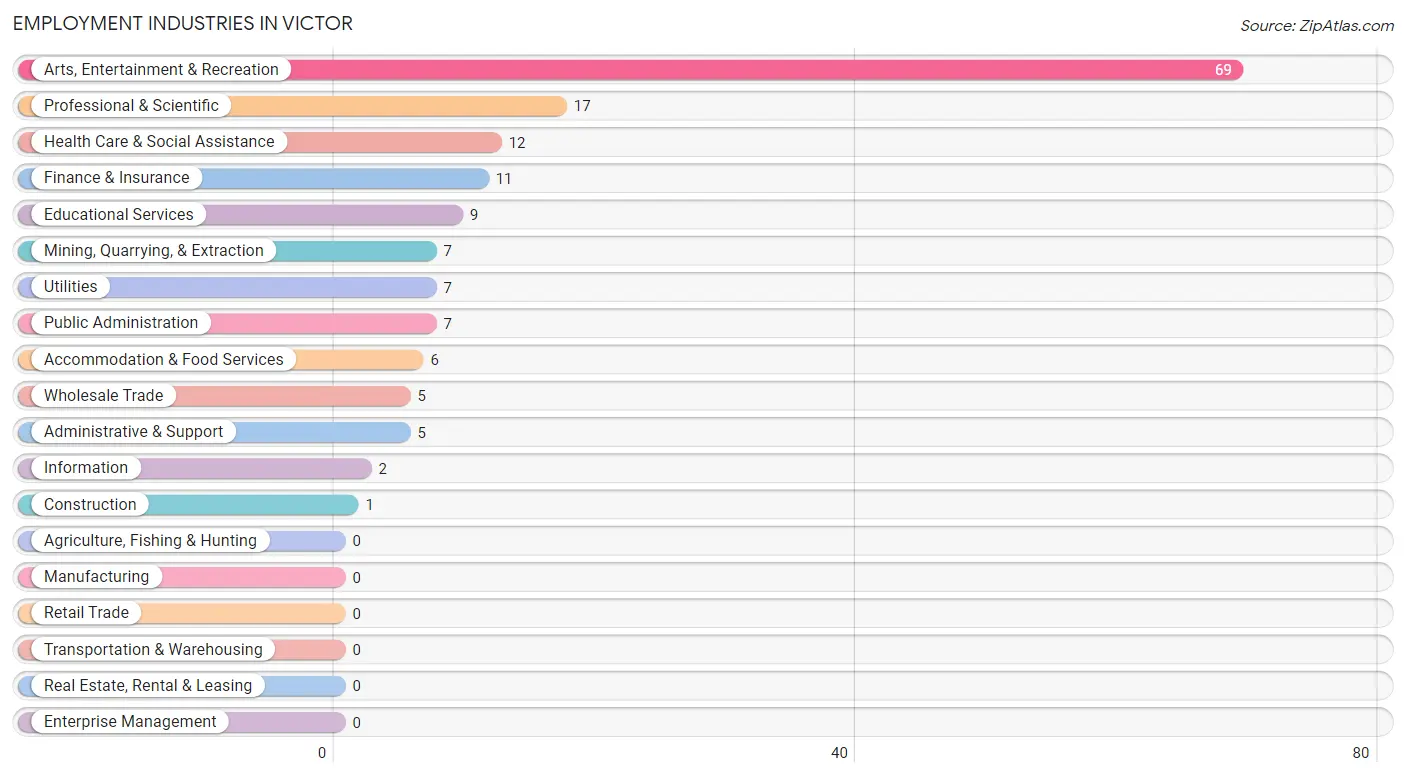
Employment Industries in Victor
The major employment industries in Victor include Arts, Entertainment & Recreation (69 | 42.1%), Professional & Scientific (17 | 10.4%), Health Care & Social Assistance (12 | 7.3%), Finance & Insurance (11 | 6.7%), and Educational Services (9 | 5.5%).
Employment Industries by Sex in Victor
The Victor industries that see more men than women are Mining, Quarrying, & Extraction (100.0%), Construction (100.0%), and Wholesale Trade (100.0%), whereas the industries that tend to have a higher number of women are Health Care & Social Assistance (100.0%), Accommodation & Food Services (100.0%), and Public Administration (71.4%).
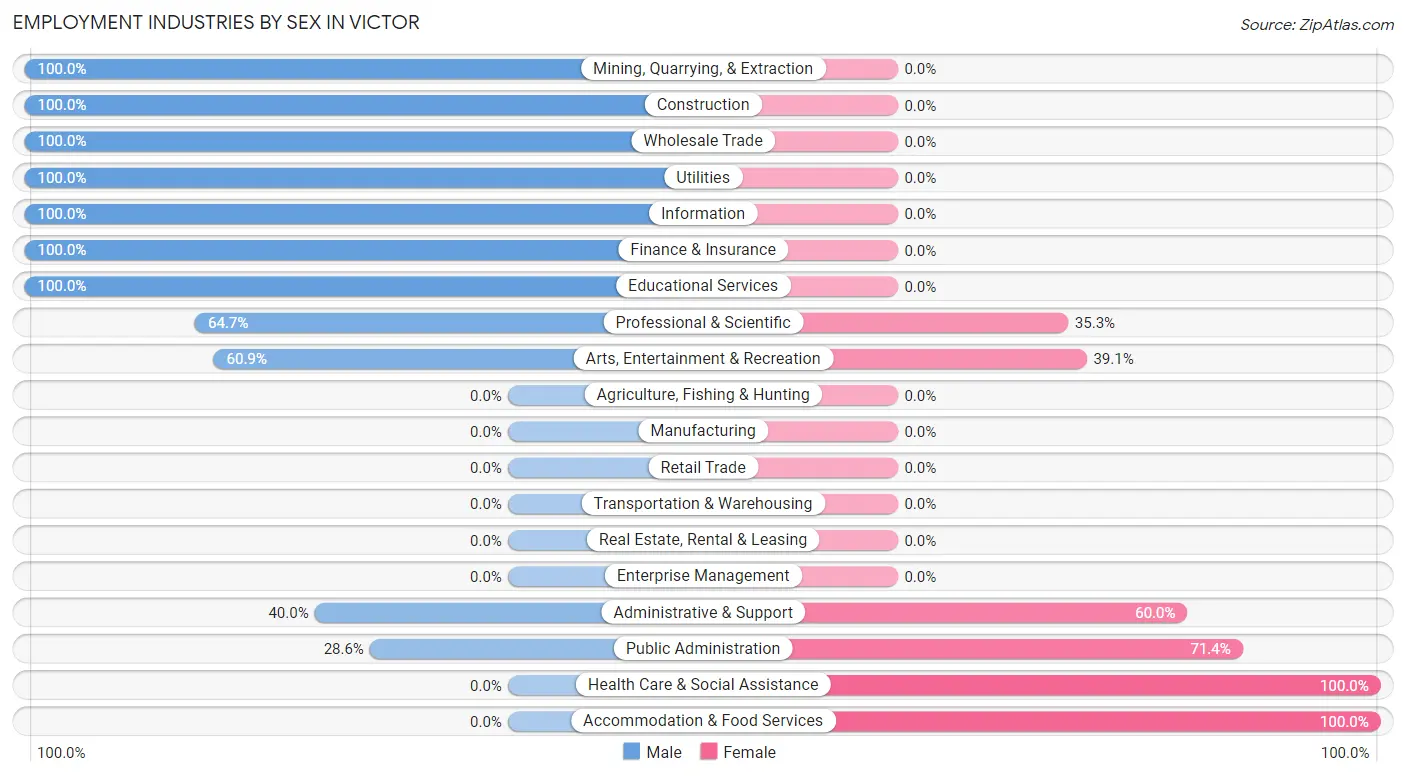
| Industry | Male | Female |
| Agriculture, Fishing & Hunting | 0 (0.0%) | 0 (0.0%) |
| Mining, Quarrying, & Extraction | 7 (100.0%) | 0 (0.0%) |
| Construction | 1 (100.0%) | 0 (0.0%) |
| Manufacturing | 0 (0.0%) | 0 (0.0%) |
| Wholesale Trade | 5 (100.0%) | 0 (0.0%) |
| Retail Trade | 0 (0.0%) | 0 (0.0%) |
| Transportation & Warehousing | 0 (0.0%) | 0 (0.0%) |
| Utilities | 7 (100.0%) | 0 (0.0%) |
| Information | 2 (100.0%) | 0 (0.0%) |
| Finance & Insurance | 11 (100.0%) | 0 (0.0%) |
| Real Estate, Rental & Leasing | 0 (0.0%) | 0 (0.0%) |
| Professional & Scientific | 11 (64.7%) | 6 (35.3%) |
| Enterprise Management | 0 (0.0%) | 0 (0.0%) |
| Administrative & Support | 2 (40.0%) | 3 (60.0%) |
| Educational Services | 9 (100.0%) | 0 (0.0%) |
| Health Care & Social Assistance | 0 (0.0%) | 12 (100.0%) |
| Arts, Entertainment & Recreation | 42 (60.9%) | 27 (39.1%) |
| Accommodation & Food Services | 0 (0.0%) | 6 (100.0%) |
| Public Administration | 2 (28.6%) | 5 (71.4%) |
| Total | 99 (60.4%) | 65 (39.6%) |
Education in Victor
School Enrollment in Victor
The most common levels of schooling among the 13 students in Victor are high school (10 | 76.9%), and middle school (3 | 23.1%).
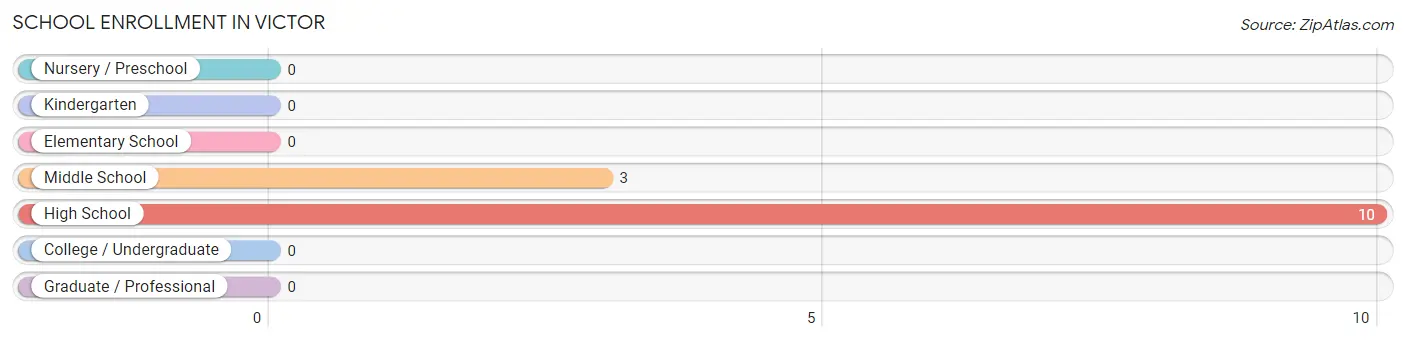
| School Level | # Students | % Students |
| Nursery / Preschool | 0 | 0.0% |
| Kindergarten | 0 | 0.0% |
| Elementary School | 0 | 0.0% |
| Middle School | 3 | 23.1% |
| High School | 10 | 76.9% |
| College / Undergraduate | 0 | 0.0% |
| Graduate / Professional | 0 | 0.0% |
| Total | 13 | 100.0% |
School Enrollment by Age by Funding Source in Victor
Out of a total of 13 students who are enrolled in schools in Victor, 6 (46.2%) attend a private institution, while the remaining 7 (53.8%) are enrolled in public schools. The age group of 10 to 14 year olds has the highest likelihood of being enrolled in private schools, with 6 (66.7% in the age bracket) enrolled. Conversely, the age group of 15 to 17 year olds has the lowest likelihood of being enrolled in a private school, with 4 (100.0% in the age bracket) attending a public institution.
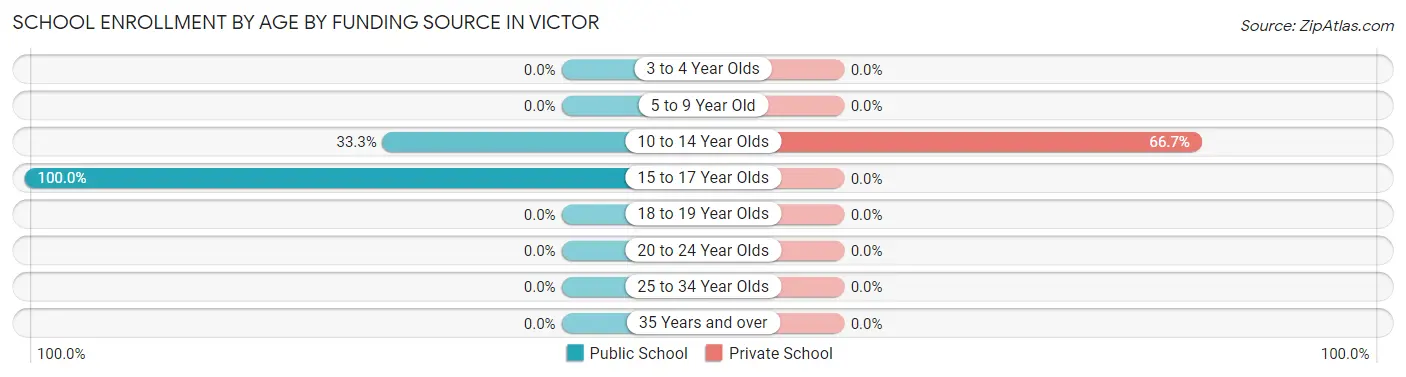
| Age Bracket | Public School | Private School |
| 3 to 4 Year Olds | 0 (0.0%) | 0 (0.0%) |
| 5 to 9 Year Old | 0 (0.0%) | 0 (0.0%) |
| 10 to 14 Year Olds | 3 (33.3%) | 6 (66.7%) |
| 15 to 17 Year Olds | 4 (100.0%) | 0 (0.0%) |
| 18 to 19 Year Olds | 0 (0.0%) | 0 (0.0%) |
| 20 to 24 Year Olds | 0 (0.0%) | 0 (0.0%) |
| 25 to 34 Year Olds | 0 (0.0%) | 0 (0.0%) |
| 35 Years and over | 0 (0.0%) | 0 (0.0%) |
| Total | 7 (53.8%) | 6 (46.2%) |
Educational Attainment by Field of Study in Victor
Arts & humanities (11 | 17.7%), literature & languages (9 | 14.5%), visual & performing arts (9 | 14.5%), science & technology (8 | 12.9%), and computers & mathematics (7 | 11.3%) are the most common fields of study among 62 individuals in Victor who have obtained a bachelor's degree or higher.
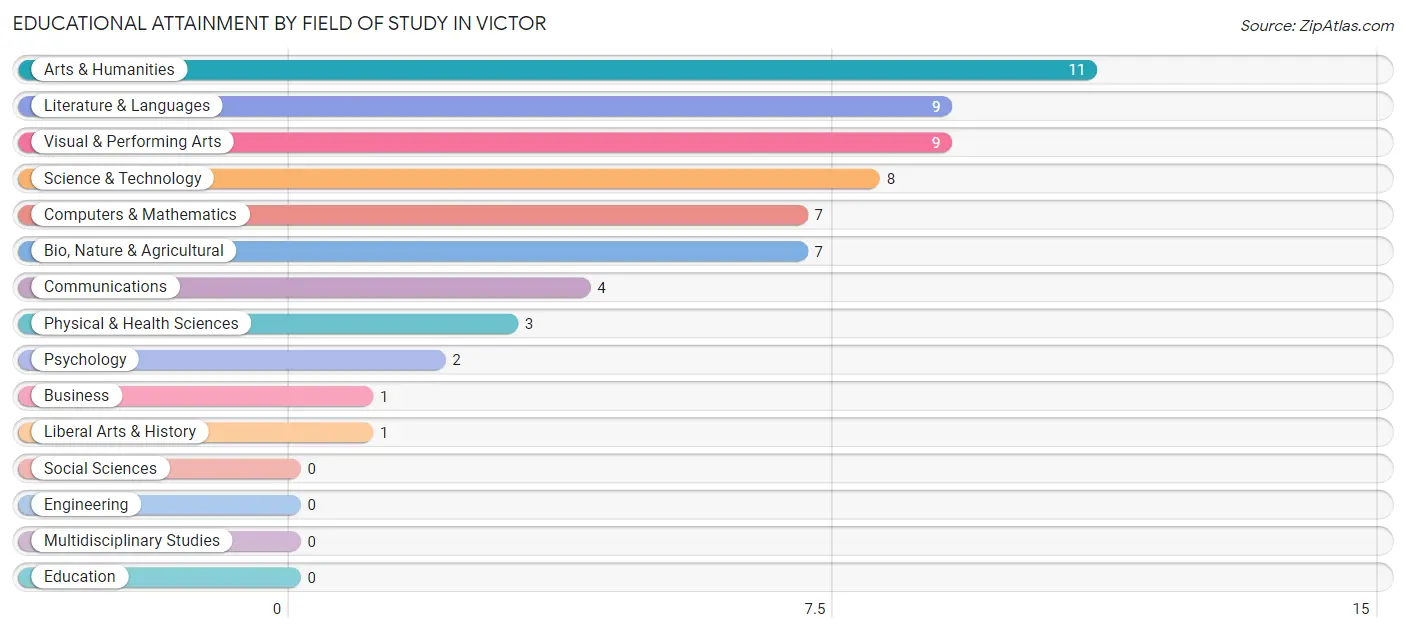
| Field of Study | # Graduates | % Graduates |
| Computers & Mathematics | 7 | 11.3% |
| Bio, Nature & Agricultural | 7 | 11.3% |
| Physical & Health Sciences | 3 | 4.8% |
| Psychology | 2 | 3.2% |
| Social Sciences | 0 | 0.0% |
| Engineering | 0 | 0.0% |
| Multidisciplinary Studies | 0 | 0.0% |
| Science & Technology | 8 | 12.9% |
| Business | 1 | 1.6% |
| Education | 0 | 0.0% |
| Literature & Languages | 9 | 14.5% |
| Liberal Arts & History | 1 | 1.6% |
| Visual & Performing Arts | 9 | 14.5% |
| Communications | 4 | 6.5% |
| Arts & Humanities | 11 | 17.7% |
| Total | 62 | 100.0% |
Transportation & Commute in Victor
Vehicle Availability by Sex in Victor
The most prevalent vehicle ownership categories in Victor are males with 2 vehicles (59, accounting for 59.6%) and females with 2 vehicles (25, making up 90.8%).
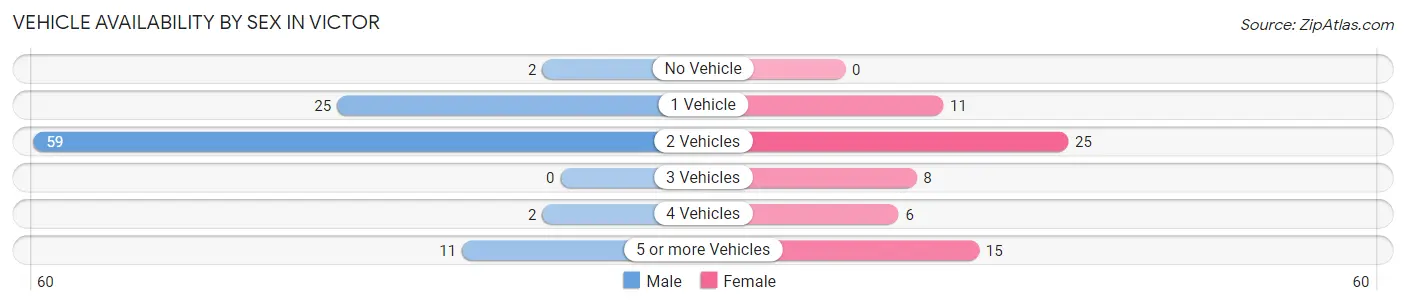
| Vehicles Available | Male | Female |
| No Vehicle | 2 (2.0%) | 0 (0.0%) |
| 1 Vehicle | 25 (25.3%) | 11 (16.9%) |
| 2 Vehicles | 59 (59.6%) | 25 (38.5%) |
| 3 Vehicles | 0 (0.0%) | 8 (12.3%) |
| 4 Vehicles | 2 (2.0%) | 6 (9.2%) |
| 5 or more Vehicles | 11 (11.1%) | 15 (23.1%) |
| Total | 99 (100.0%) | 65 (100.0%) |
Commute Time in Victor
The most frequently occuring commute durations in Victor are 5 to 9 minutes (46 commuters, 30.1%), 10 to 14 minutes (28 commuters, 18.3%), and 15 to 19 minutes (27 commuters, 17.6%).
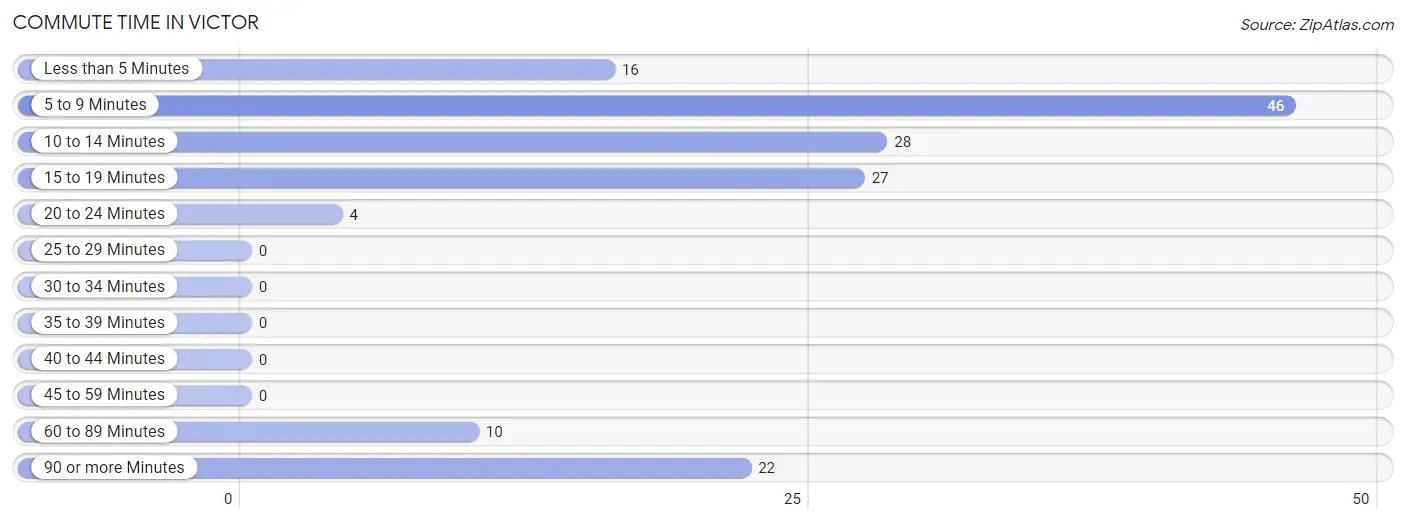
| Commute Time | # Commuters | % Commuters |
| Less than 5 Minutes | 16 | 10.5% |
| 5 to 9 Minutes | 46 | 30.1% |
| 10 to 14 Minutes | 28 | 18.3% |
| 15 to 19 Minutes | 27 | 17.6% |
| 20 to 24 Minutes | 4 | 2.6% |
| 25 to 29 Minutes | 0 | 0.0% |
| 30 to 34 Minutes | 0 | 0.0% |
| 35 to 39 Minutes | 0 | 0.0% |
| 40 to 44 Minutes | 0 | 0.0% |
| 45 to 59 Minutes | 0 | 0.0% |
| 60 to 89 Minutes | 10 | 6.5% |
| 90 or more Minutes | 22 | 14.4% |
Commute Time by Sex in Victor
The most common commute times in Victor are 5 to 9 minutes (22 commuters, 22.7%) for males and 5 to 9 minutes (24 commuters, 42.9%) for females.
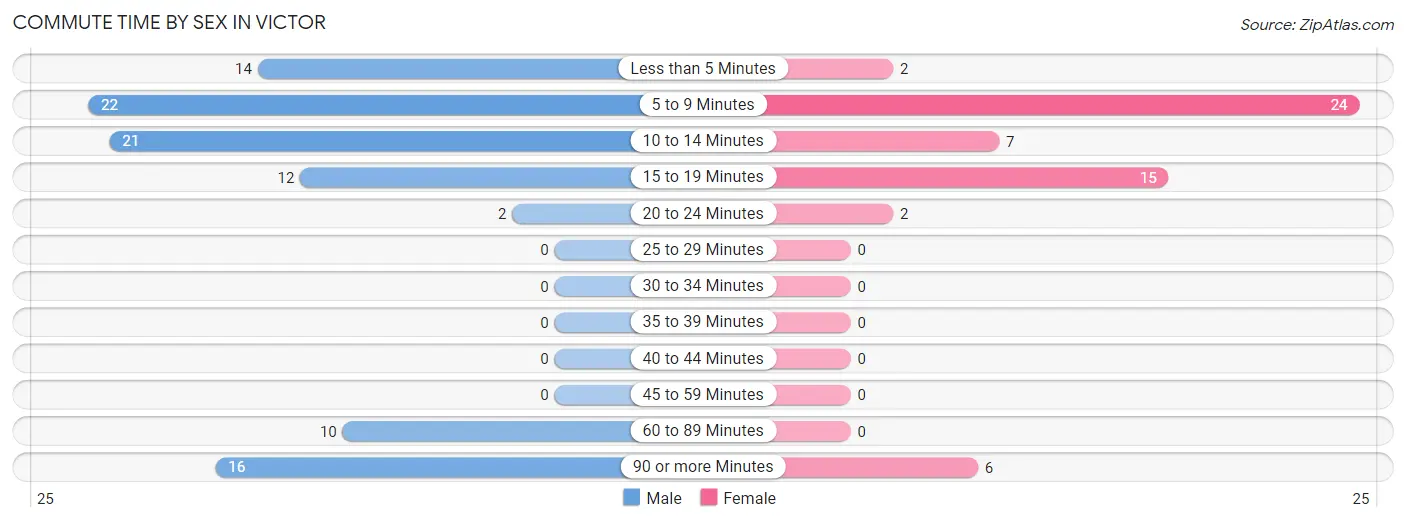
| Commute Time | Male | Female |
| Less than 5 Minutes | 14 (14.4%) | 2 (3.6%) |
| 5 to 9 Minutes | 22 (22.7%) | 24 (42.9%) |
| 10 to 14 Minutes | 21 (21.6%) | 7 (12.5%) |
| 15 to 19 Minutes | 12 (12.4%) | 15 (26.8%) |
| 20 to 24 Minutes | 2 (2.1%) | 2 (3.6%) |
| 25 to 29 Minutes | 0 (0.0%) | 0 (0.0%) |
| 30 to 34 Minutes | 0 (0.0%) | 0 (0.0%) |
| 35 to 39 Minutes | 0 (0.0%) | 0 (0.0%) |
| 40 to 44 Minutes | 0 (0.0%) | 0 (0.0%) |
| 45 to 59 Minutes | 0 (0.0%) | 0 (0.0%) |
| 60 to 89 Minutes | 10 (10.3%) | 0 (0.0%) |
| 90 or more Minutes | 16 (16.5%) | 6 (10.7%) |
Time of Departure to Work by Sex in Victor
The most frequent times of departure to work in Victor are 7:30 AM to 7:59 AM (25, 25.8%) for males and 9:00 AM to 9:59 AM (18, 32.1%) for females.
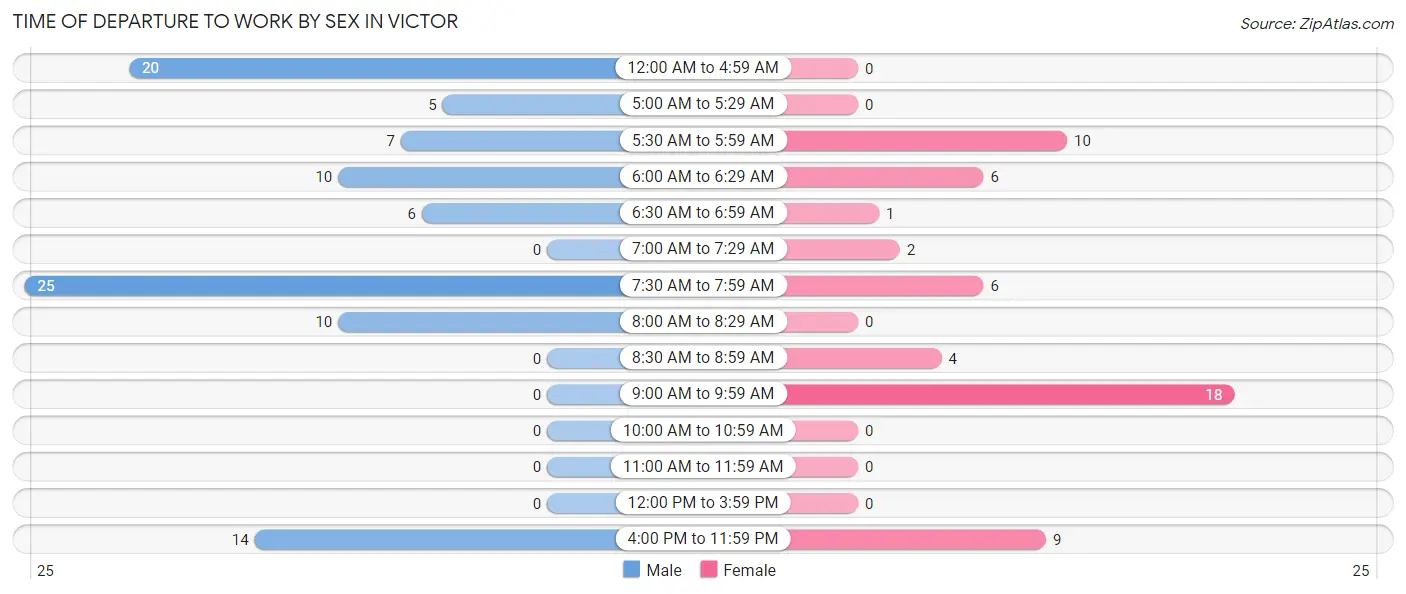
| Time of Departure | Male | Female |
| 12:00 AM to 4:59 AM | 20 (20.6%) | 0 (0.0%) |
| 5:00 AM to 5:29 AM | 5 (5.1%) | 0 (0.0%) |
| 5:30 AM to 5:59 AM | 7 (7.2%) | 10 (17.9%) |
| 6:00 AM to 6:29 AM | 10 (10.3%) | 6 (10.7%) |
| 6:30 AM to 6:59 AM | 6 (6.2%) | 1 (1.8%) |
| 7:00 AM to 7:29 AM | 0 (0.0%) | 2 (3.6%) |
| 7:30 AM to 7:59 AM | 25 (25.8%) | 6 (10.7%) |
| 8:00 AM to 8:29 AM | 10 (10.3%) | 0 (0.0%) |
| 8:30 AM to 8:59 AM | 0 (0.0%) | 4 (7.1%) |
| 9:00 AM to 9:59 AM | 0 (0.0%) | 18 (32.1%) |
| 10:00 AM to 10:59 AM | 0 (0.0%) | 0 (0.0%) |
| 11:00 AM to 11:59 AM | 0 (0.0%) | 0 (0.0%) |
| 12:00 PM to 3:59 PM | 0 (0.0%) | 0 (0.0%) |
| 4:00 PM to 11:59 PM | 14 (14.4%) | 9 (16.1%) |
| Total | 97 (100.0%) | 56 (100.0%) |
Housing Occupancy in Victor
Occupancy by Ownership in Victor
Of the total 165 dwellings in Victor, owner-occupied units account for 99 (60.0%), while renter-occupied units make up 66 (40.0%).
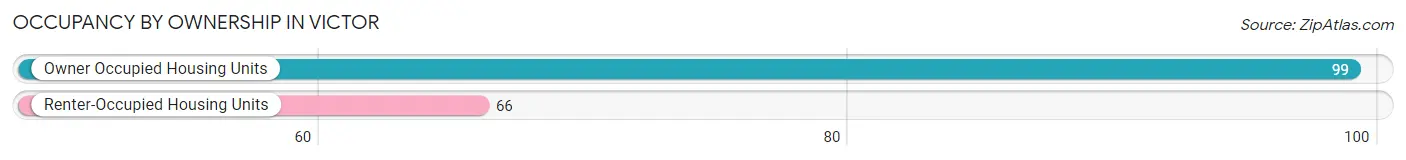
| Occupancy | # Housing Units | % Housing Units |
| Owner Occupied Housing Units | 99 | 60.0% |
| Renter-Occupied Housing Units | 66 | 40.0% |
| Total Occupied Housing Units | 165 | 100.0% |
Occupancy by Household Size in Victor
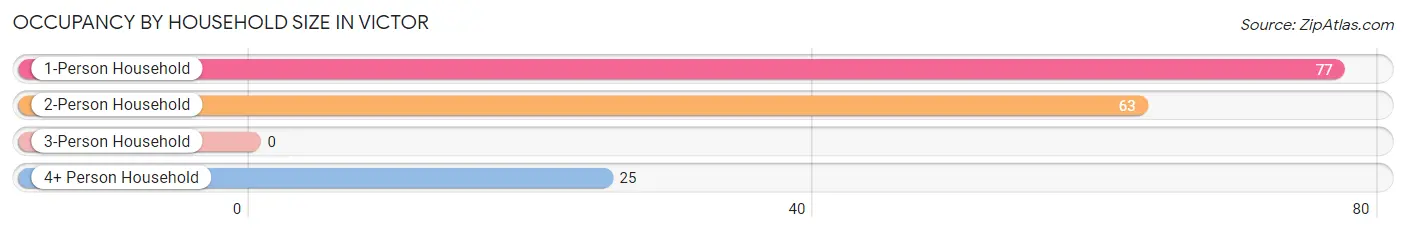
| Household Size | # Housing Units | % Housing Units |
| 1-Person Household | 77 | 46.7% |
| 2-Person Household | 63 | 38.2% |
| 3-Person Household | 0 | 0.0% |
| 4+ Person Household | 25 | 15.1% |
| Total Housing Units | 165 | 100.0% |
Occupancy by Ownership by Household Size in Victor
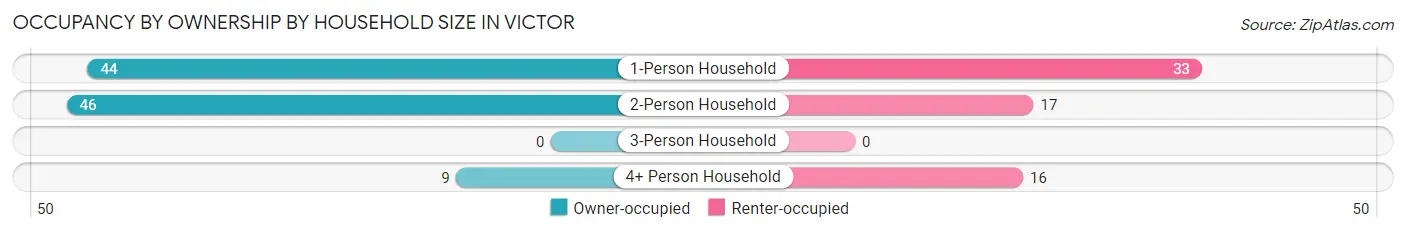
| Household Size | Owner-occupied | Renter-occupied |
| 1-Person Household | 44 (57.1%) | 33 (42.9%) |
| 2-Person Household | 46 (73.0%) | 17 (27.0%) |
| 3-Person Household | 0 (0.0%) | 0 (0.0%) |
| 4+ Person Household | 9 (36.0%) | 16 (64.0%) |
| Total Housing Units | 99 (60.0%) | 66 (40.0%) |
Occupancy by Educational Attainment in Victor
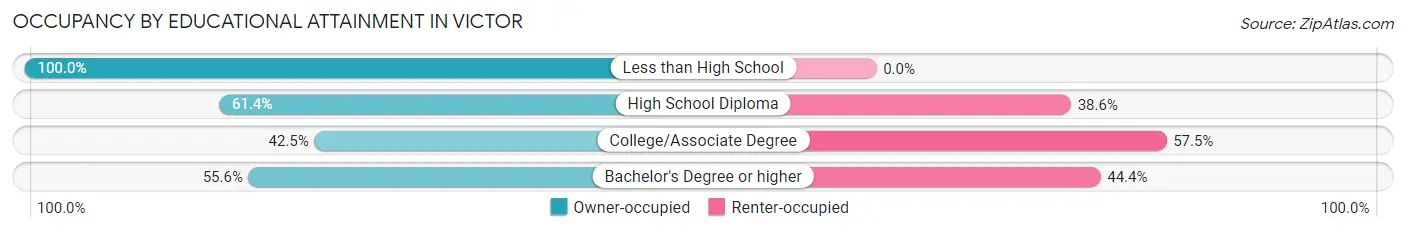
| Household Size | Owner-occupied | Renter-occupied |
| Less than High School | 19 (100.0%) | 0 (0.0%) |
| High School Diploma | 43 (61.4%) | 27 (38.6%) |
| College/Associate Degree | 17 (42.5%) | 23 (57.5%) |
| Bachelor's Degree or higher | 20 (55.6%) | 16 (44.4%) |
Occupancy by Age of Householder in Victor
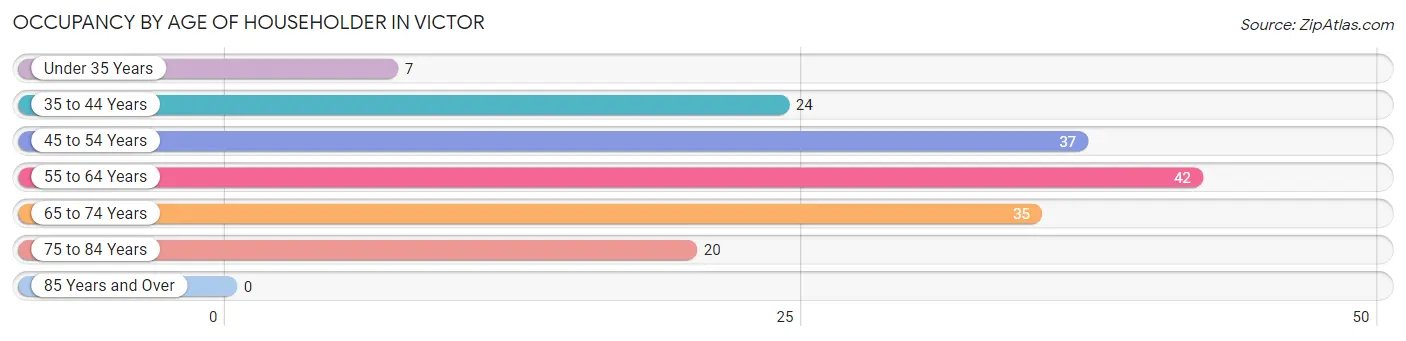
| Age Bracket | # Households | % Households |
| Under 35 Years | 7 | 4.2% |
| 35 to 44 Years | 24 | 14.5% |
| 45 to 54 Years | 37 | 22.4% |
| 55 to 64 Years | 42 | 25.5% |
| 65 to 74 Years | 35 | 21.2% |
| 75 to 84 Years | 20 | 12.1% |
| 85 Years and Over | 0 | 0.0% |
| Total | 165 | 100.0% |
Housing Finances in Victor
Median Income by Occupancy in Victor
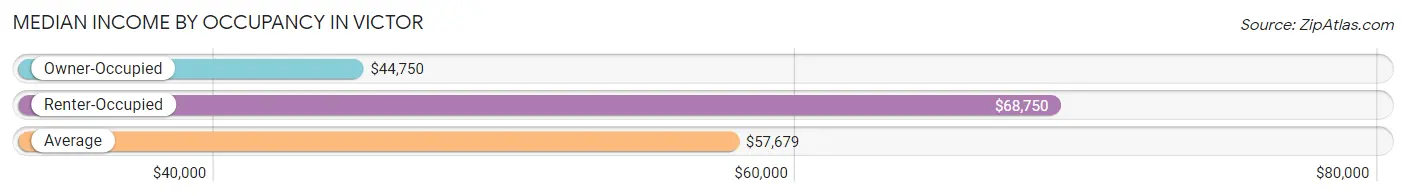
| Occupancy Type | # Households | Median Income |
| Owner-Occupied | 99 (60.0%) | $44,750 |
| Renter-Occupied | 66 (40.0%) | $68,750 |
| Average | 165 (100.0%) | $57,679 |
Occupancy by Householder Income Bracket in Victor
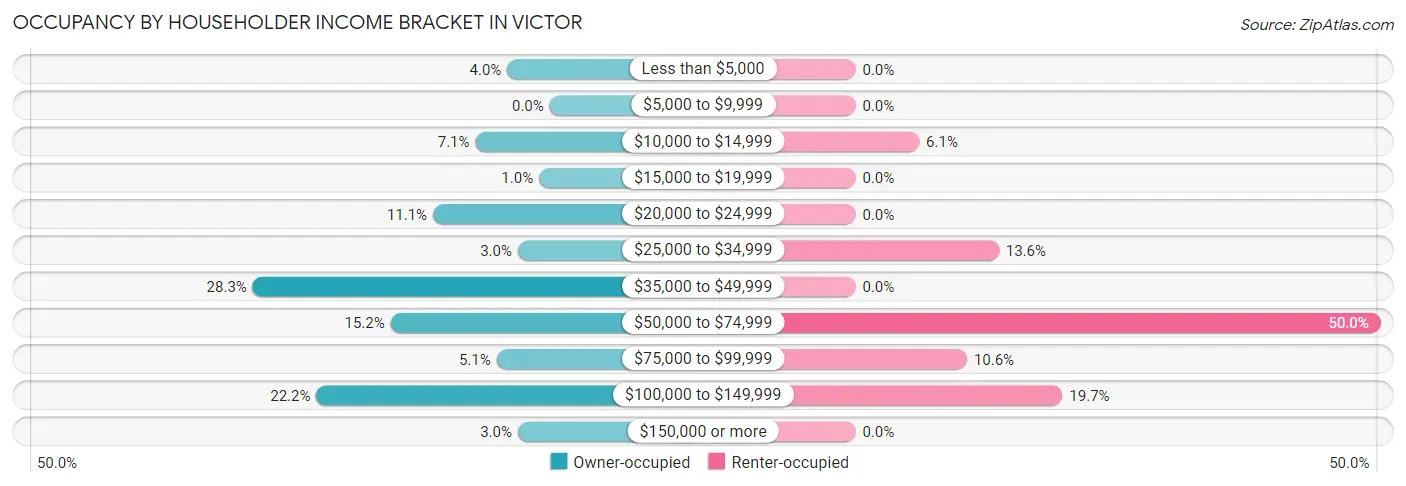
| Income Bracket | Owner-occupied | Renter-occupied |
| Less than $5,000 | 4 (4.0%) | 0 (0.0%) |
| $5,000 to $9,999 | 0 (0.0%) | 0 (0.0%) |
| $10,000 to $14,999 | 7 (7.1%) | 4 (6.1%) |
| $15,000 to $19,999 | 1 (1.0%) | 0 (0.0%) |
| $20,000 to $24,999 | 11 (11.1%) | 0 (0.0%) |
| $25,000 to $34,999 | 3 (3.0%) | 9 (13.6%) |
| $35,000 to $49,999 | 28 (28.3%) | 0 (0.0%) |
| $50,000 to $74,999 | 15 (15.1%) | 33 (50.0%) |
| $75,000 to $99,999 | 5 (5.1%) | 7 (10.6%) |
| $100,000 to $149,999 | 22 (22.2%) | 13 (19.7%) |
| $150,000 or more | 3 (3.0%) | 0 (0.0%) |
| Total | 99 (100.0%) | 66 (100.0%) |
Monthly Housing Cost Tiers in Victor
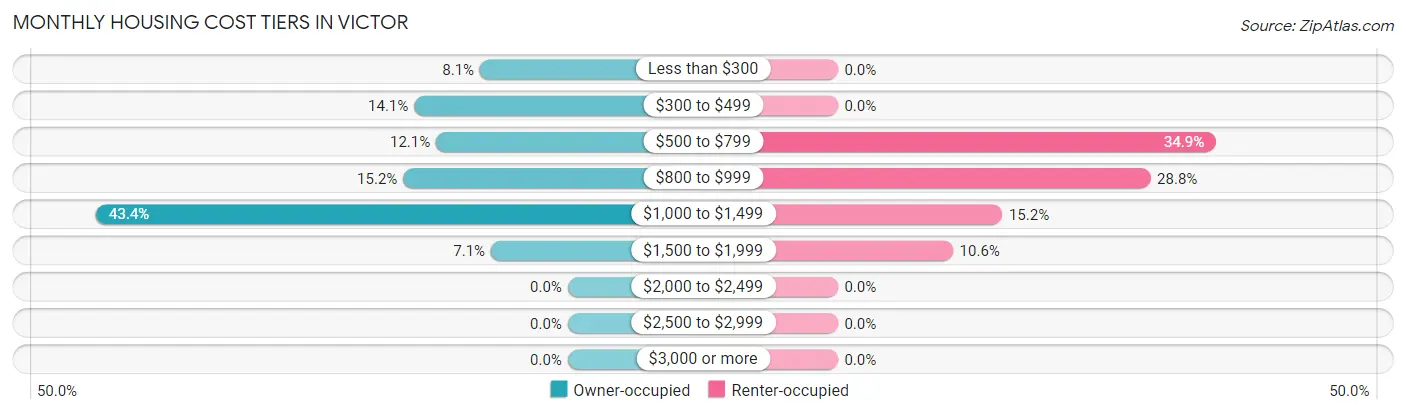
| Monthly Cost | Owner-occupied | Renter-occupied |
| Less than $300 | 8 (8.1%) | 0 (0.0%) |
| $300 to $499 | 14 (14.1%) | 0 (0.0%) |
| $500 to $799 | 12 (12.1%) | 23 (34.8%) |
| $800 to $999 | 15 (15.1%) | 19 (28.8%) |
| $1,000 to $1,499 | 43 (43.4%) | 10 (15.1%) |
| $1,500 to $1,999 | 7 (7.1%) | 7 (10.6%) |
| $2,000 to $2,499 | 0 (0.0%) | 0 (0.0%) |
| $2,500 to $2,999 | 0 (0.0%) | 0 (0.0%) |
| $3,000 or more | 0 (0.0%) | 0 (0.0%) |
| Total | 99 (100.0%) | 66 (100.0%) |
Physical Housing Characteristics in Victor
Housing Structures in Victor
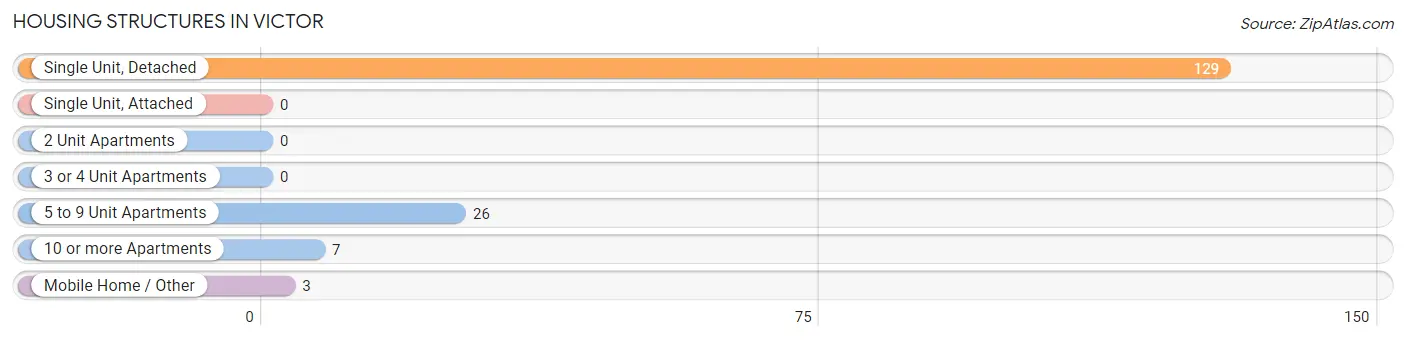
| Structure Type | # Housing Units | % Housing Units |
| Single Unit, Detached | 129 | 78.2% |
| Single Unit, Attached | 0 | 0.0% |
| 2 Unit Apartments | 0 | 0.0% |
| 3 or 4 Unit Apartments | 0 | 0.0% |
| 5 to 9 Unit Apartments | 26 | 15.8% |
| 10 or more Apartments | 7 | 4.2% |
| Mobile Home / Other | 3 | 1.8% |
| Total | 165 | 100.0% |
Housing Structures by Occupancy in Victor
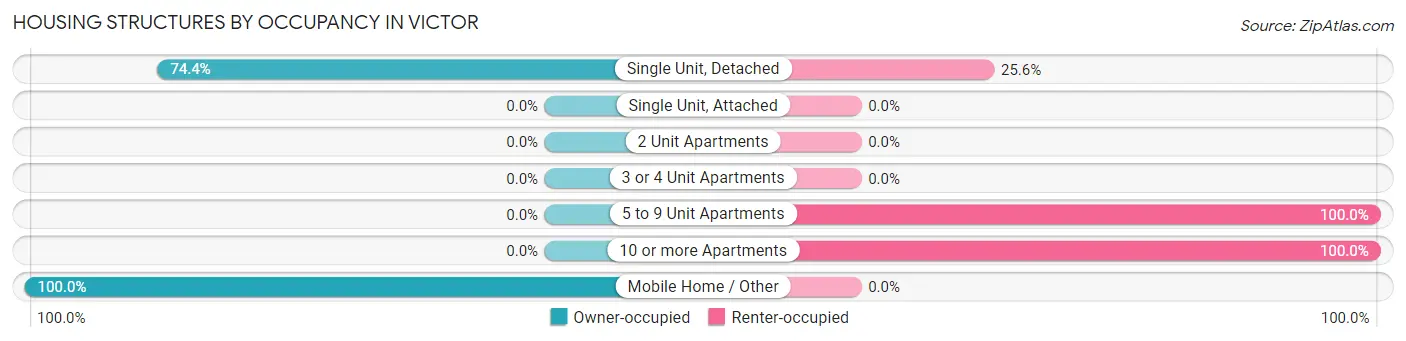
| Structure Type | Owner-occupied | Renter-occupied |
| Single Unit, Detached | 96 (74.4%) | 33 (25.6%) |
| Single Unit, Attached | 0 (0.0%) | 0 (0.0%) |
| 2 Unit Apartments | 0 (0.0%) | 0 (0.0%) |
| 3 or 4 Unit Apartments | 0 (0.0%) | 0 (0.0%) |
| 5 to 9 Unit Apartments | 0 (0.0%) | 26 (100.0%) |
| 10 or more Apartments | 0 (0.0%) | 7 (100.0%) |
| Mobile Home / Other | 3 (100.0%) | 0 (0.0%) |
| Total | 99 (60.0%) | 66 (40.0%) |
Housing Structures by Number of Rooms in Victor
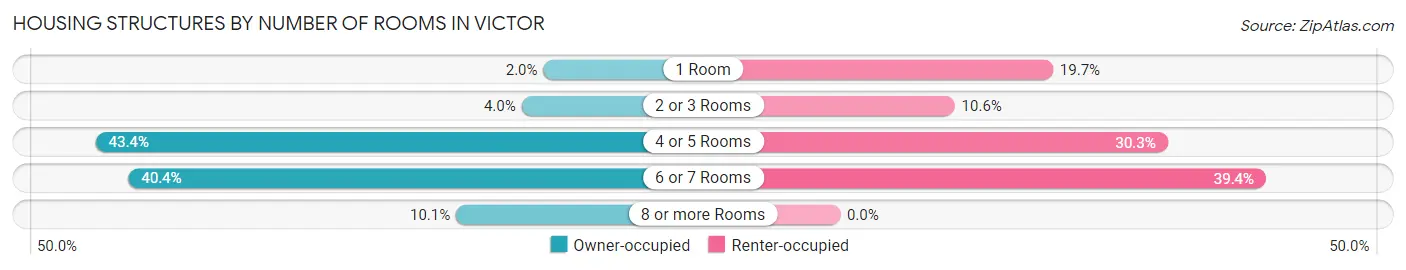
| Number of Rooms | Owner-occupied | Renter-occupied |
| 1 Room | 2 (2.0%) | 13 (19.7%) |
| 2 or 3 Rooms | 4 (4.0%) | 7 (10.6%) |
| 4 or 5 Rooms | 43 (43.4%) | 20 (30.3%) |
| 6 or 7 Rooms | 40 (40.4%) | 26 (39.4%) |
| 8 or more Rooms | 10 (10.1%) | 0 (0.0%) |
| Total | 99 (100.0%) | 66 (100.0%) |
Housing Structure by Heating Type in Victor
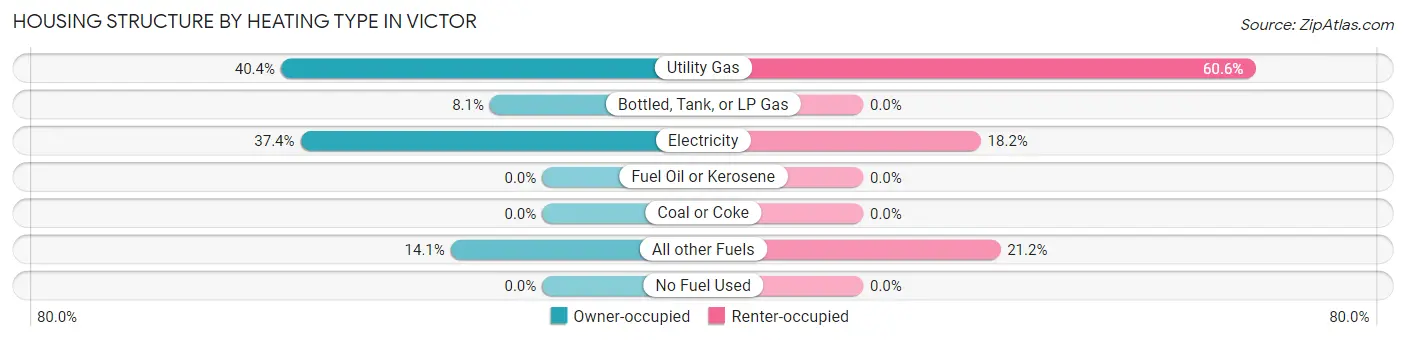
| Heating Type | Owner-occupied | Renter-occupied |
| Utility Gas | 40 (40.4%) | 40 (60.6%) |
| Bottled, Tank, or LP Gas | 8 (8.1%) | 0 (0.0%) |
| Electricity | 37 (37.4%) | 12 (18.2%) |
| Fuel Oil or Kerosene | 0 (0.0%) | 0 (0.0%) |
| Coal or Coke | 0 (0.0%) | 0 (0.0%) |
| All other Fuels | 14 (14.1%) | 14 (21.2%) |
| No Fuel Used | 0 (0.0%) | 0 (0.0%) |
| Total | 99 (100.0%) | 66 (100.0%) |
Household Vehicle Usage in Victor
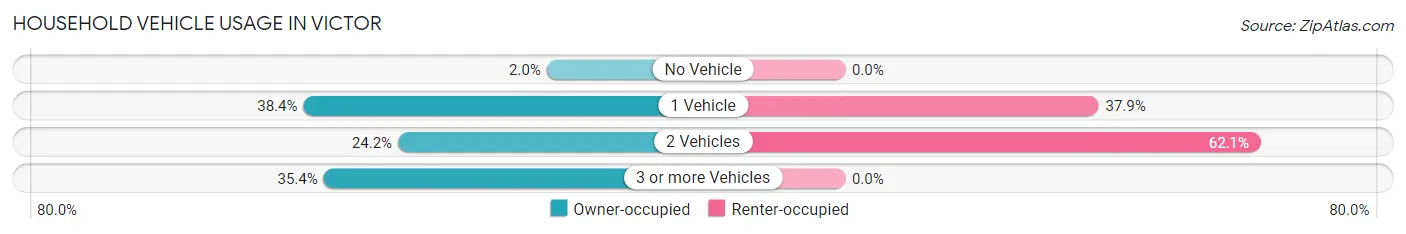
| Vehicles per Household | Owner-occupied | Renter-occupied |
| No Vehicle | 2 (2.0%) | 0 (0.0%) |
| 1 Vehicle | 38 (38.4%) | 25 (37.9%) |
| 2 Vehicles | 24 (24.2%) | 41 (62.1%) |
| 3 or more Vehicles | 35 (35.3%) | 0 (0.0%) |
| Total | 99 (100.0%) | 66 (100.0%) |
Real Estate & Mortgages in Victor
Real Estate and Mortgage Overview in Victor
| Characteristic | Without Mortgage | With Mortgage |
| Housing Units | 27 | 72 |
| Median Property Value | $158,600 | $195,000 |
| Median Household Income | $42,321 | $0 |
| Monthly Housing Costs | $339 | $0 |
| Real Estate Taxes | $289 | $0 |
Property Value by Mortgage Status in Victor
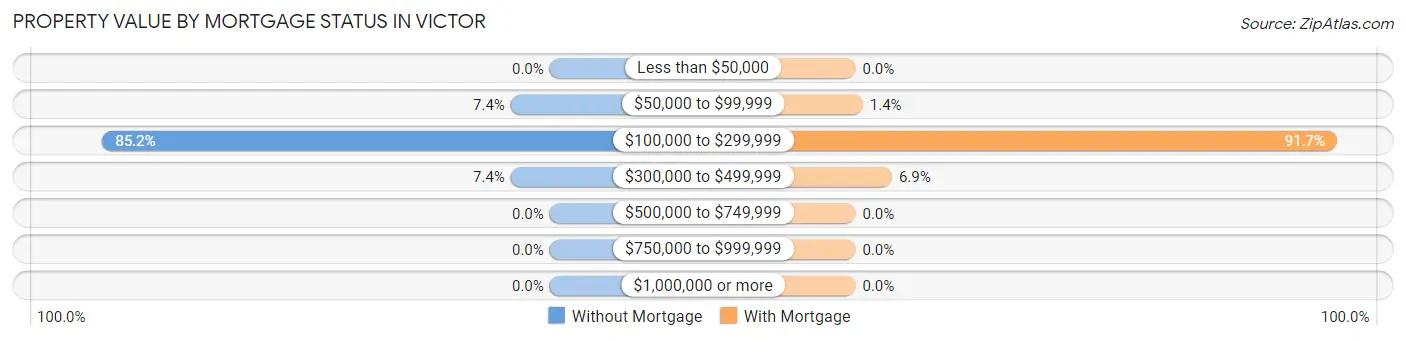
| Property Value | Without Mortgage | With Mortgage |
| Less than $50,000 | 0 (0.0%) | 0 (0.0%) |
| $50,000 to $99,999 | 2 (7.4%) | 1 (1.4%) |
| $100,000 to $299,999 | 23 (85.2%) | 66 (91.7%) |
| $300,000 to $499,999 | 2 (7.4%) | 5 (6.9%) |
| $500,000 to $749,999 | 0 (0.0%) | 0 (0.0%) |
| $750,000 to $999,999 | 0 (0.0%) | 0 (0.0%) |
| $1,000,000 or more | 0 (0.0%) | 0 (0.0%) |
| Total | 27 (100.0%) | 72 (100.0%) |
Household Income by Mortgage Status in Victor
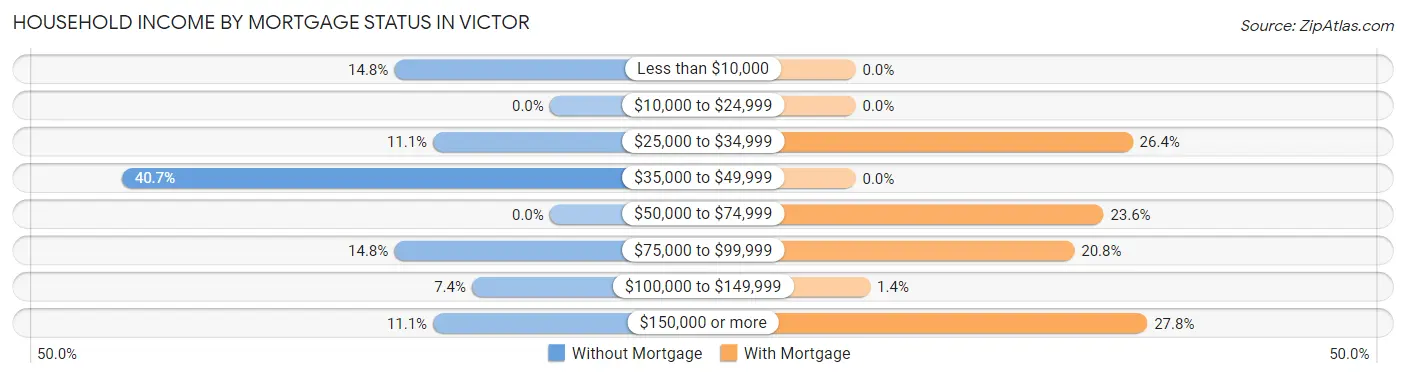
| Household Income | Without Mortgage | With Mortgage |
| Less than $10,000 | 4 (14.8%) | 0 (0.0%) |
| $10,000 to $24,999 | 0 (0.0%) | 0 (0.0%) |
| $25,000 to $34,999 | 3 (11.1%) | 19 (26.4%) |
| $35,000 to $49,999 | 11 (40.7%) | 0 (0.0%) |
| $50,000 to $74,999 | 0 (0.0%) | 17 (23.6%) |
| $75,000 to $99,999 | 4 (14.8%) | 15 (20.8%) |
| $100,000 to $149,999 | 2 (7.4%) | 1 (1.4%) |
| $150,000 or more | 3 (11.1%) | 20 (27.8%) |
| Total | 27 (100.0%) | 72 (100.0%) |
Property Value to Household Income Ratio in Victor

| Value-to-Income Ratio | Without Mortgage | With Mortgage |
| Less than 2.0x | 8 (29.6%) | 50,000 (69,444.4%) |
| 2.0x to 2.9x | 1 (3.7%) | 15 (20.8%) |
| 3.0x to 3.9x | 2 (7.4%) | 14 (19.4%) |
| 4.0x or more | 12 (44.4%) | 8 (11.1%) |
| Total | 27 (100.0%) | 72 (100.0%) |
Real Estate Taxes by Mortgage Status in Victor
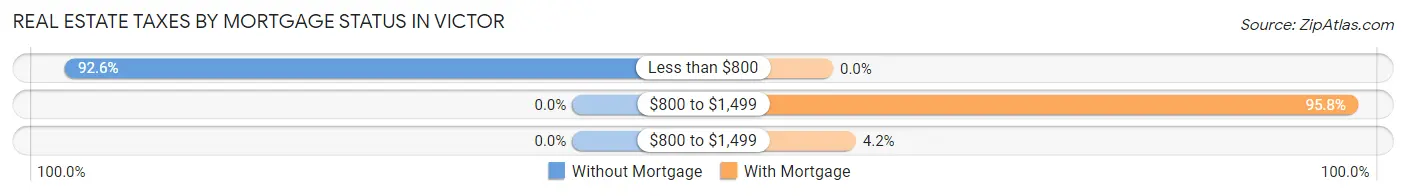
| Property Taxes | Without Mortgage | With Mortgage |
| Less than $800 | 25 (92.6%) | 0 (0.0%) |
| $800 to $1,499 | 0 (0.0%) | 69 (95.8%) |
| $800 to $1,499 | 0 (0.0%) | 3 (4.2%) |
| Total | 27 (100.0%) | 72 (100.0%) |
Health & Disability in Victor
Health Insurance Coverage by Age in Victor
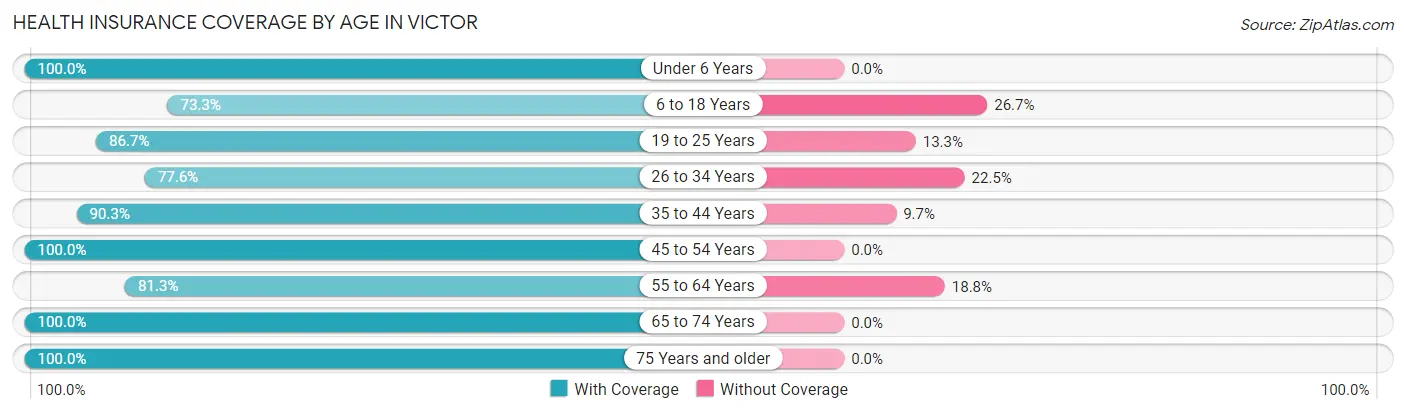
| Age Bracket | With Coverage | Without Coverage |
| Under 6 Years | 14 (100.0%) | 0 (0.0%) |
| 6 to 18 Years | 11 (73.3%) | 4 (26.7%) |
| 19 to 25 Years | 26 (86.7%) | 4 (13.3%) |
| 26 to 34 Years | 38 (77.5%) | 11 (22.5%) |
| 35 to 44 Years | 28 (90.3%) | 3 (9.7%) |
| 45 to 54 Years | 59 (100.0%) | 0 (0.0%) |
| 55 to 64 Years | 39 (81.2%) | 9 (18.8%) |
| 65 to 74 Years | 44 (100.0%) | 0 (0.0%) |
| 75 Years and older | 20 (100.0%) | 0 (0.0%) |
| Total | 279 (90.0%) | 31 (10.0%) |
Health Insurance Coverage by Citizenship Status in Victor
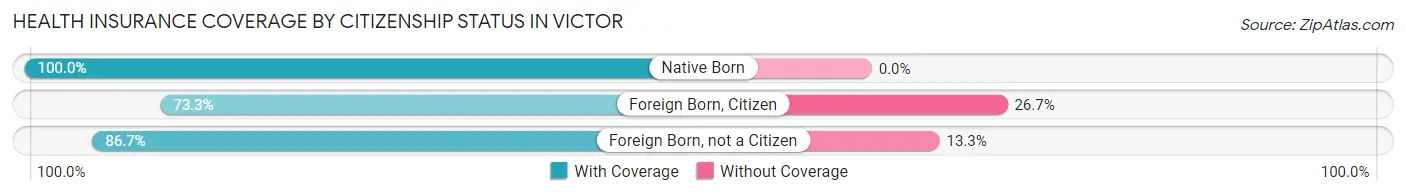
| Citizenship Status | With Coverage | Without Coverage |
| Native Born | 14 (100.0%) | 0 (0.0%) |
| Foreign Born, Citizen | 11 (73.3%) | 4 (26.7%) |
| Foreign Born, not a Citizen | 26 (86.7%) | 4 (13.3%) |
Health Insurance Coverage by Household Income in Victor
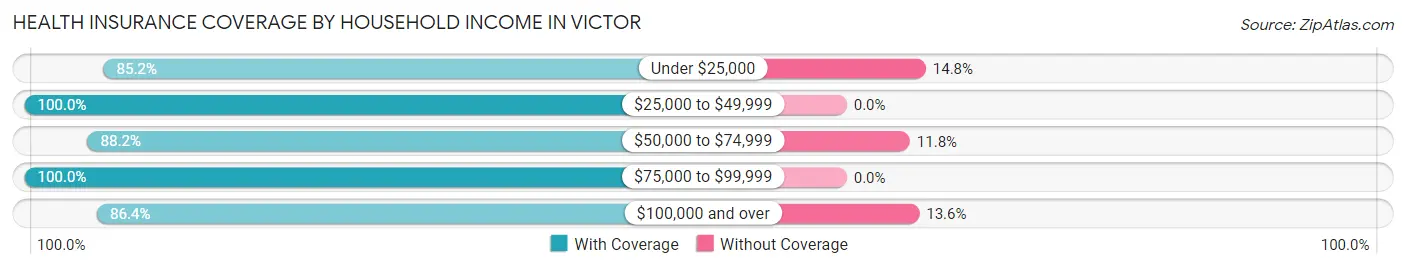
| Household Income | With Coverage | Without Coverage |
| Under $25,000 | 23 (85.2%) | 4 (14.8%) |
| $25,000 to $49,999 | 54 (100.0%) | 0 (0.0%) |
| $50,000 to $74,999 | 97 (88.2%) | 13 (11.8%) |
| $75,000 to $99,999 | 16 (100.0%) | 0 (0.0%) |
| $100,000 and over | 89 (86.4%) | 14 (13.6%) |
Public vs Private Health Insurance Coverage by Age in Victor
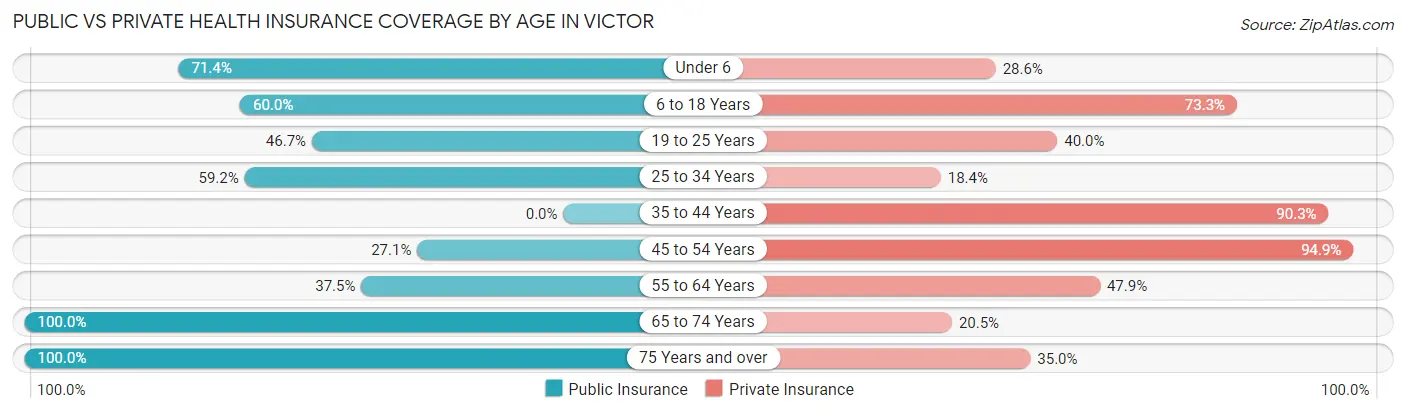
| Age Bracket | Public Insurance | Private Insurance |
| Under 6 | 10 (71.4%) | 4 (28.6%) |
| 6 to 18 Years | 9 (60.0%) | 11 (73.3%) |
| 19 to 25 Years | 14 (46.7%) | 12 (40.0%) |
| 25 to 34 Years | 29 (59.2%) | 9 (18.4%) |
| 35 to 44 Years | 0 (0.0%) | 28 (90.3%) |
| 45 to 54 Years | 16 (27.1%) | 56 (94.9%) |
| 55 to 64 Years | 18 (37.5%) | 23 (47.9%) |
| 65 to 74 Years | 44 (100.0%) | 9 (20.4%) |
| 75 Years and over | 20 (100.0%) | 7 (35.0%) |
| Total | 160 (51.6%) | 159 (51.3%) |
Disability Status by Sex by Age in Victor
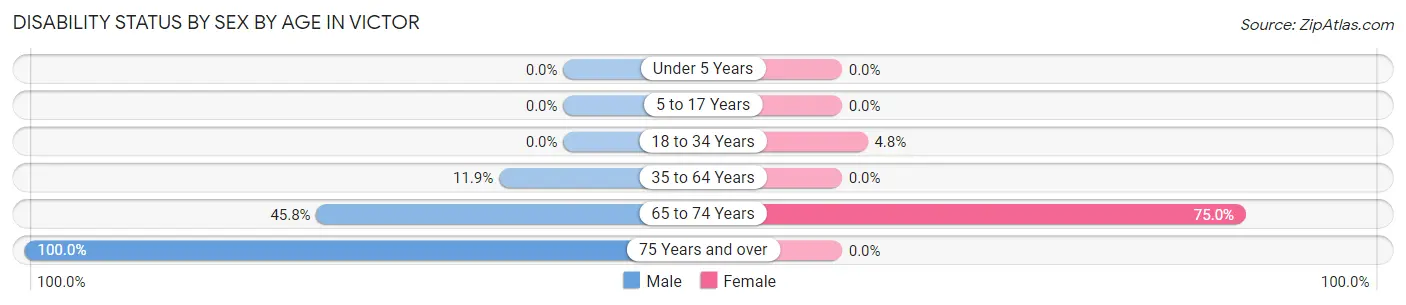
| Age Bracket | Male | Female |
| Under 5 Years | 0 (0.0%) | 0 (0.0%) |
| 5 to 17 Years | 0 (0.0%) | 0 (0.0%) |
| 18 to 34 Years | 0 (0.0%) | 2 (4.8%) |
| 35 to 64 Years | 8 (11.9%) | 0 (0.0%) |
| 65 to 74 Years | 11 (45.8%) | 15 (75.0%) |
| 75 Years and over | 13 (100.0%) | 0 (0.0%) |
Disability Class by Sex by Age in Victor
Disability Class: Hearing Difficulty
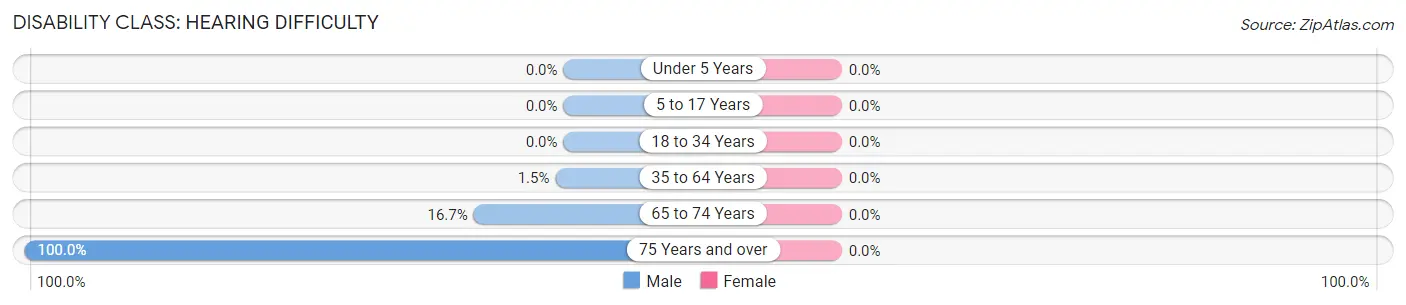
| Age Bracket | Male | Female |
| Under 5 Years | 0 (0.0%) | 0 (0.0%) |
| 5 to 17 Years | 0 (0.0%) | 0 (0.0%) |
| 18 to 34 Years | 0 (0.0%) | 0 (0.0%) |
| 35 to 64 Years | 1 (1.5%) | 0 (0.0%) |
| 65 to 74 Years | 4 (16.7%) | 0 (0.0%) |
| 75 Years and over | 13 (100.0%) | 0 (0.0%) |
Disability Class: Vision Difficulty
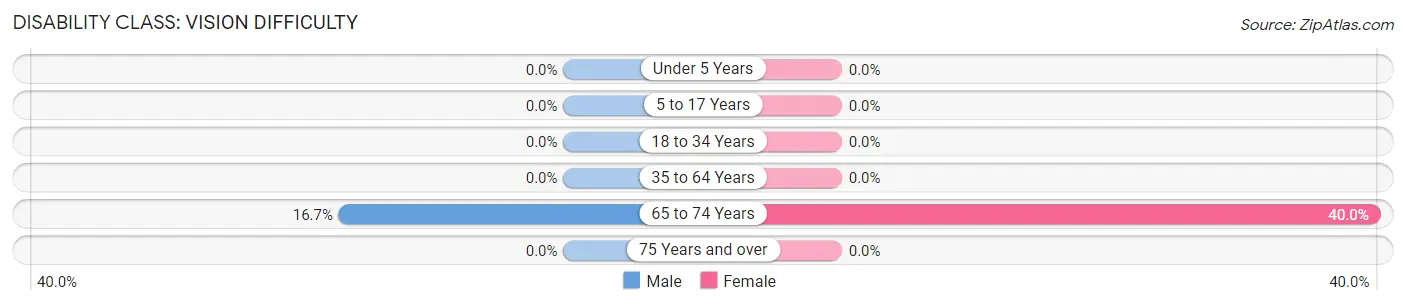
| Age Bracket | Male | Female |
| Under 5 Years | 0 (0.0%) | 0 (0.0%) |
| 5 to 17 Years | 0 (0.0%) | 0 (0.0%) |
| 18 to 34 Years | 0 (0.0%) | 0 (0.0%) |
| 35 to 64 Years | 0 (0.0%) | 0 (0.0%) |
| 65 to 74 Years | 4 (16.7%) | 8 (40.0%) |
| 75 Years and over | 0 (0.0%) | 0 (0.0%) |
Disability Class: Cognitive Difficulty
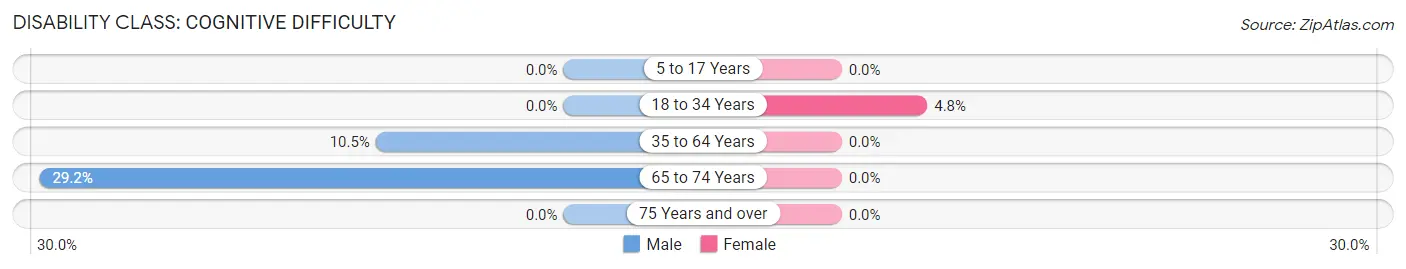
| Age Bracket | Male | Female |
| 5 to 17 Years | 0 (0.0%) | 0 (0.0%) |
| 18 to 34 Years | 0 (0.0%) | 2 (4.8%) |
| 35 to 64 Years | 7 (10.4%) | 0 (0.0%) |
| 65 to 74 Years | 7 (29.2%) | 0 (0.0%) |
| 75 Years and over | 0 (0.0%) | 0 (0.0%) |
Disability Class: Ambulatory Difficulty
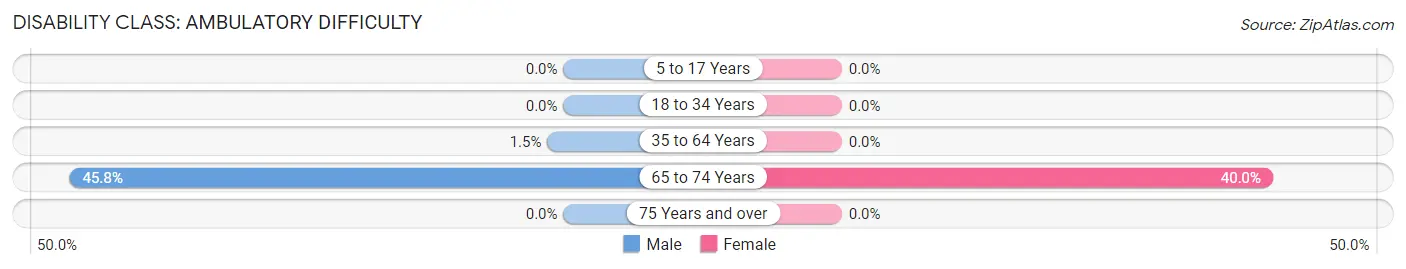
| Age Bracket | Male | Female |
| 5 to 17 Years | 0 (0.0%) | 0 (0.0%) |
| 18 to 34 Years | 0 (0.0%) | 0 (0.0%) |
| 35 to 64 Years | 1 (1.5%) | 0 (0.0%) |
| 65 to 74 Years | 11 (45.8%) | 8 (40.0%) |
| 75 Years and over | 0 (0.0%) | 0 (0.0%) |
Disability Class: Self-Care Difficulty
| Age Bracket | Male | Female |
| 5 to 17 Years | 0 (0.0%) | 0 (0.0%) |
| 18 to 34 Years | 0 (0.0%) | 0 (0.0%) |
| 35 to 64 Years | 0 (0.0%) | 0 (0.0%) |
| 65 to 74 Years | 0 (0.0%) | 0 (0.0%) |
| 75 Years and over | 0 (0.0%) | 0 (0.0%) |
Technology Access in Victor
Computing Device Access in Victor
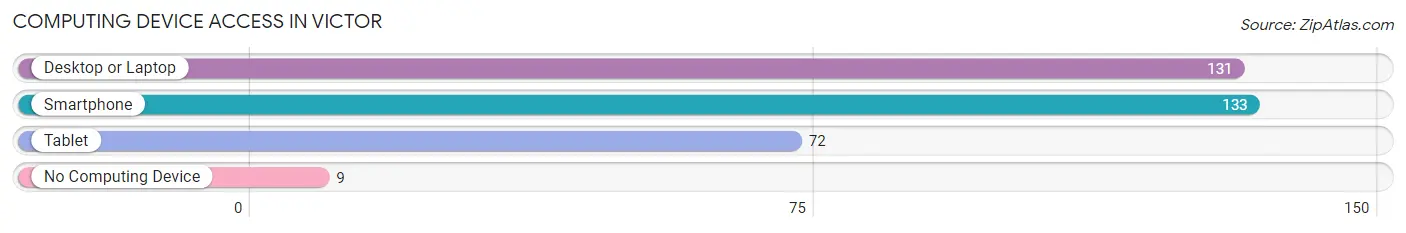
| Device Type | # Households | % Households |
| Desktop or Laptop | 131 | 79.4% |
| Smartphone | 133 | 80.6% |
| Tablet | 72 | 43.6% |
| No Computing Device | 9 | 5.4% |
| Total | 165 | 100.0% |
Internet Access in Victor
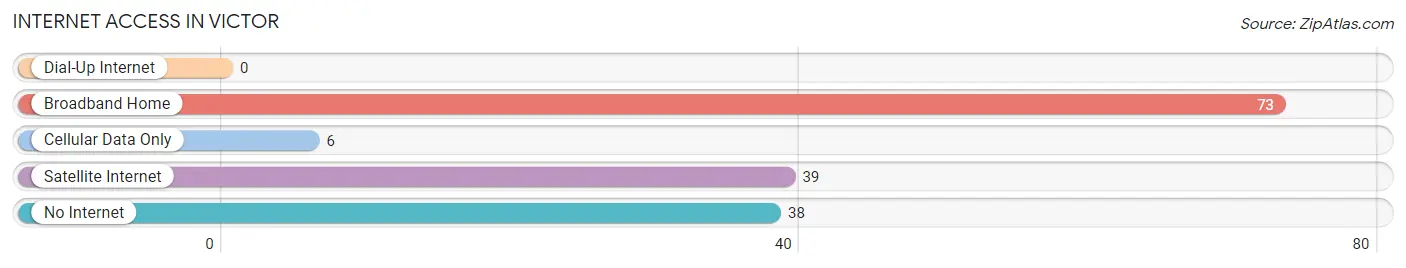
| Internet Type | # Households | % Households |
| Dial-Up Internet | 0 | 0.0% |
| Broadband Home | 73 | 44.2% |
| Cellular Data Only | 6 | 3.6% |
| Satellite Internet | 39 | 23.6% |
| No Internet | 38 | 23.0% |
| Total | 165 | 100.0% |
Victor Summary
Victor, Colorado is a small town located in the heart of the Rocky Mountains in Teller County. It is situated at an elevation of 8,400 feet and is surrounded by the majestic peaks of the Sawatch Range. The town was founded in 1891 by gold miners and is now home to a population of approximately 500 people.
Victor is located in the Wet Mountain Valley, which is a high mountain valley surrounded by the Sangre de Cristo Mountains to the east and the Wet Mountains to the west. The valley is known for its beautiful scenery and is a popular destination for outdoor recreation. The town is also located near the Arkansas River, which provides a variety of recreational activities such as fishing, rafting, and kayaking.
Victor has a rich history that dates back to the gold rush of the late 1800s. The town was founded by miners who were looking for gold in the nearby hills. The town quickly grew and became a bustling mining town with a population of over 1,000 people. The town was also home to a variety of businesses, including a hotel, saloon, and general store.
Victor’s economy is largely based on tourism and outdoor recreation. The town is home to a variety of attractions, including the Victor Lowell Thomas Museum, which is dedicated to the history of the town and the gold rush. The town is also home to a variety of outdoor activities, such as hiking, camping, fishing, and skiing. The town is also home to a variety of restaurants, shops, and galleries.
Victor’s demographics are largely made up of white, non-Hispanic residents. The town has a median age of 44.7 years and a median household income of $50,000. The town is also home to a variety of religious denominations, including Catholic, Protestant, and Mormon.
Victor is a small town with a rich history and a vibrant economy. The town is home to a variety of attractions and outdoor activities, making it a popular destination for tourists and outdoor enthusiasts alike. The town is also home to a variety of businesses, restaurants, and galleries, making it a great place to live and work.
Common Questions
What is Per Capita Income in Victor?
Per Capita income in Victor is $34,245.
What is the Median Family Income in Victor?
Median Family Income in Victor is $73,625.
What is the Median Household income in Victor?
Median Household Income in Victor is $57,679.
What is Income or Wage Gap in Victor?
Income or Wage Gap in Victor is 32.2%.
Women in Victor earn 67.8 cents for every dollar earned by a man.
What is Inequality or Gini Index in Victor?
Inequality or Gini Index in Victor is 0.33.
What is the Total Population of Victor?
Total Population of Victor is 310.
What is the Total Male Population of Victor?
Total Male Population of Victor is 164.
What is the Total Female Population of Victor?
Total Female Population of Victor is 146.
What is the Ratio of Males per 100 Females in Victor?
There are 112.33 Males per 100 Females in Victor.
What is the Ratio of Females per 100 Males in Victor?
There are 89.02 Females per 100 Males in Victor.
What is the Median Population Age in Victor?
Median Population Age in Victor is 49.3 Years.
What is the Average Family Size in Victor
Average Family Size in Victor is 3.0 People.
What is the Average Household Size in Victor
Average Household Size in Victor is 1.9 People.
How Large is the Labor Force in Victor?
There are 174 People in the Labor Forcein in Victor.
What is the Percentage of People in the Labor Force in Victor?
61.5% of People are in the Labor Force in Victor.
What is the Unemployment Rate in Victor?
Unemployment Rate in Victor is 5.7%.