Whiterocks, UT Map & Demographics
Whiterocks Map
Whiterocks Overview
$9,749
PER CAPITA INCOME
$34,432
AVG HOUSEHOLD INCOME
0.39
INEQUALITY / GINI INDEX
191
TOTAL POPULATION
69
MALE POPULATION
122
FEMALE POPULATION
56.56
MALES / 100 FEMALES
176.81
FEMALES / 100 MALES
13.0
MEDIAN AGE
4.5
AVG FAMILY SIZE
4.7
AVG HOUSEHOLD SIZE
45
LABOR FORCE [ PEOPLE ]
58.4%
PERCENT IN LABOR FORCE
42.2%
UNEMPLOYMENT RATE
Whiterocks Zip Codes
Whiterocks Area Codes
Income in Whiterocks
Income Overview in Whiterocks
| Characteristic | Number | Measure |
| Per Capita Income | 191 | $9,749 |
| Median Family Income | 41 | $0 |
| Mean Family Income | 41 | $43,685 |
| Median Household Income | 41 | $34,432 |
| Mean Household Income | 41 | $48,285 |
| Income Deficit | 41 | $0 |
| Wage / Income Gap (%) | 191 | 0.00% |
| Wage / Income Gap ($) | 191 | 100.00¢ per $1 |
| Gini / Inequality Index | 191 | 0.39 |
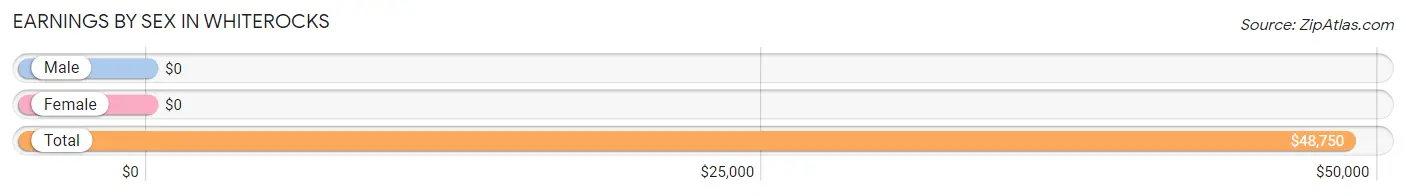
Earnings by Sex in Whiterocks
| Sex | Number | Average Earnings |
| Male | 18 (69.2%) | $0 |
| Female | 8 (30.8%) | $0 |
| Total | 26 (100.0%) | $48,750 |
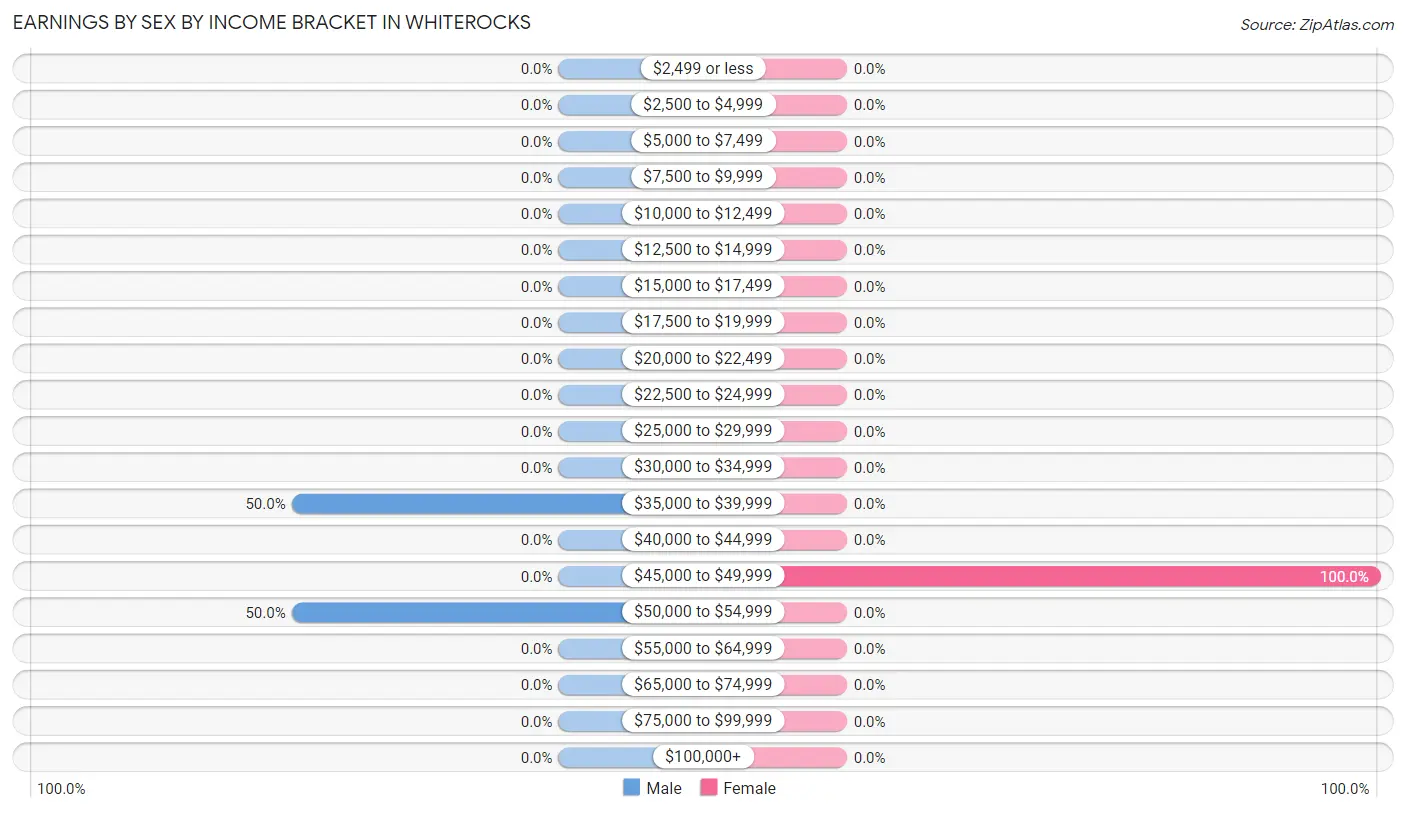
Earnings by Sex by Income Bracket in Whiterocks
The most common earnings brackets in Whiterocks are $35,000 to $39,999 for men (9 | 50.0%) and $45,000 to $49,999 for women (8 | 100.0%).
| Income | Male | Female |
| $2,499 or less | 0 (0.0%) | 0 (0.0%) |
| $2,500 to $4,999 | 0 (0.0%) | 0 (0.0%) |
| $5,000 to $7,499 | 0 (0.0%) | 0 (0.0%) |
| $7,500 to $9,999 | 0 (0.0%) | 0 (0.0%) |
| $10,000 to $12,499 | 0 (0.0%) | 0 (0.0%) |
| $12,500 to $14,999 | 0 (0.0%) | 0 (0.0%) |
| $15,000 to $17,499 | 0 (0.0%) | 0 (0.0%) |
| $17,500 to $19,999 | 0 (0.0%) | 0 (0.0%) |
| $20,000 to $22,499 | 0 (0.0%) | 0 (0.0%) |
| $22,500 to $24,999 | 0 (0.0%) | 0 (0.0%) |
| $25,000 to $29,999 | 0 (0.0%) | 0 (0.0%) |
| $30,000 to $34,999 | 0 (0.0%) | 0 (0.0%) |
| $35,000 to $39,999 | 9 (50.0%) | 0 (0.0%) |
| $40,000 to $44,999 | 0 (0.0%) | 0 (0.0%) |
| $45,000 to $49,999 | 0 (0.0%) | 8 (100.0%) |
| $50,000 to $54,999 | 9 (50.0%) | 0 (0.0%) |
| $55,000 to $64,999 | 0 (0.0%) | 0 (0.0%) |
| $65,000 to $74,999 | 0 (0.0%) | 0 (0.0%) |
| $75,000 to $99,999 | 0 (0.0%) | 0 (0.0%) |
| $100,000+ | 0 (0.0%) | 0 (0.0%) |
| Total | 18 (100.0%) | 8 (100.0%) |
Earnings by Sex by Educational Attainment in Whiterocks
| Educational Attainment | Male Income | Female Income |
| Less than High School | - | - |
| High School Diploma | - | - |
| College or Associate's Degree | - | - |
| Bachelor's Degree | - | - |
| Graduate Degree | - | - |
| Total | - | - |
Family Income in Whiterocks
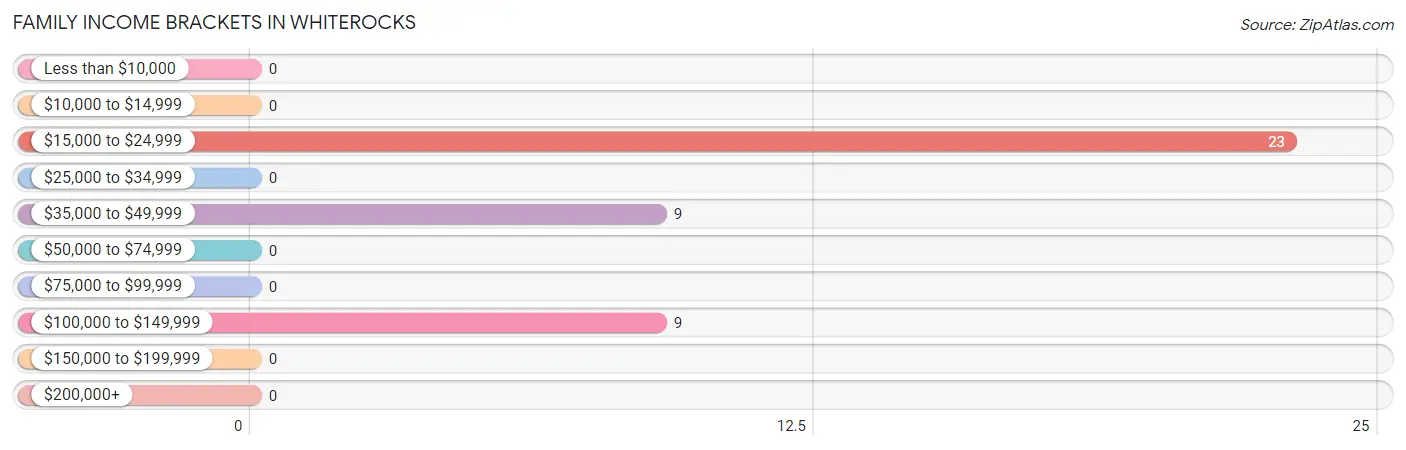
Family Income Brackets in Whiterocks
According to the Whiterocks family income data, there are 23 families falling into the $15,000 to $24,999 income range, which is the most common income bracket and makes up 56.1% of all families.
| Income Bracket | # Families | % Families |
| Less than $10,000 | 0 | 0.0% |
| $10,000 to $14,999 | 0 | 0.0% |
| $15,000 to $24,999 | 23 | 56.1% |
| $25,000 to $34,999 | 0 | 0.0% |
| $35,000 to $49,999 | 9 | 22.0% |
| $50,000 to $74,999 | 0 | 0.0% |
| $75,000 to $99,999 | 0 | 0.0% |
| $100,000 to $149,999 | 9 | 22.0% |
| $150,000 to $199,999 | 0 | 0.0% |
| $200,000+ | 0 | 0.0% |
Family Income by Famaliy Size in Whiterocks
| Income Bracket | # Families | Median Income |
| 2-Person Families | 0 (0.0%) | $0 |
| 3-Person Families | 9 (22.0%) | $0 |
| 4-Person Families | 9 (22.0%) | $0 |
| 5-Person Families | 12 (29.3%) | $0 |
| 6-Person Families | 0 (0.0%) | $0 |
| 7+ Person Families | 11 (26.8%) | $0 |
| Total | 41 (100.0%) | $0 |
Family Income by Number of Earners in Whiterocks
| Number of Earners | # Families | Median Income |
| No Earners | 23 (56.1%) | $0 |
| 1 Earner | 9 (22.0%) | $0 |
| 2 Earners | 9 (22.0%) | $0 |
| 3+ Earners | 0 (0.0%) | $0 |
| Total | 41 (100.0%) | $0 |
Household Income in Whiterocks
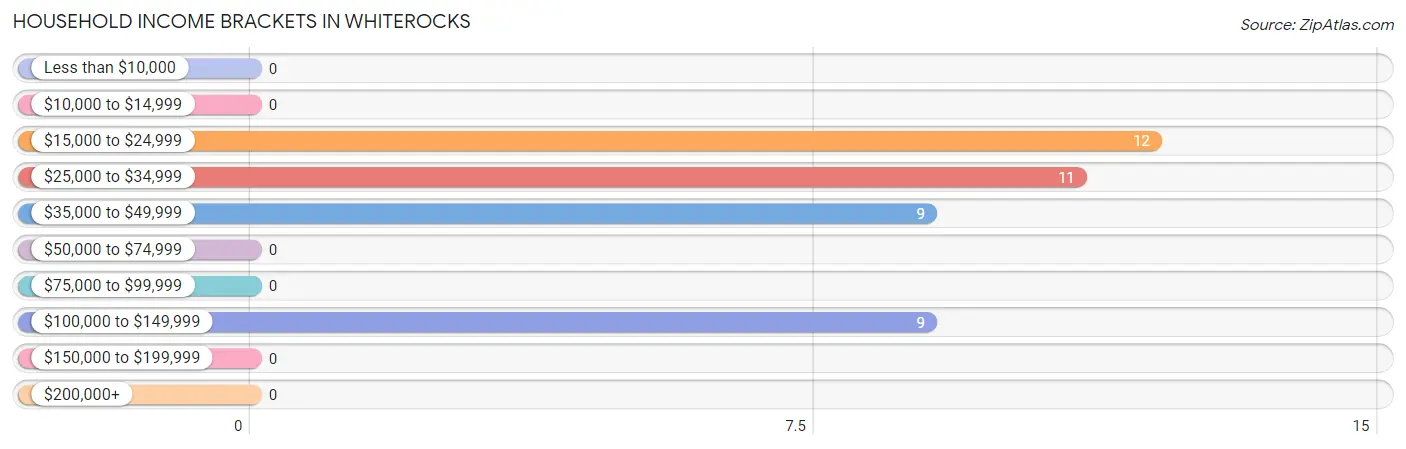
Household Income Brackets in Whiterocks
With 12 households falling in the category, the $15,000 to $24,999 income range is the most frequent in Whiterocks, accounting for 29.3% of all households.
| Income Bracket | # Households | % Households |
| Less than $10,000 | 0 | 0.0% |
| $10,000 to $14,999 | 0 | 0.0% |
| $15,000 to $24,999 | 12 | 29.3% |
| $25,000 to $34,999 | 11 | 26.8% |
| $35,000 to $49,999 | 9 | 22.0% |
| $50,000 to $74,999 | 0 | 0.0% |
| $75,000 to $99,999 | 0 | 0.0% |
| $100,000 to $149,999 | 9 | 22.0% |
| $150,000 to $199,999 | 0 | 0.0% |
| $200,000+ | 0 | 0.0% |
Household Income by Householder Age in Whiterocks
The median household income in Whiterocks is $34,432, with the highest median household income of $34,432 found in the 25 to 44 years age bracket for the primary householder. A total of 41 households (100.0%) fall into this category.
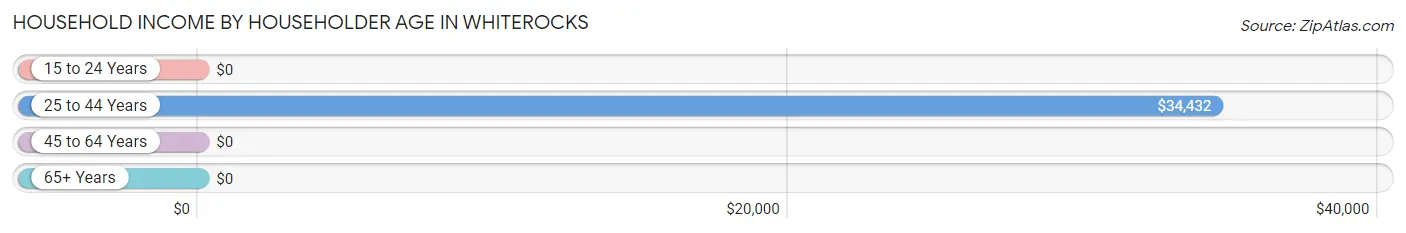
| Income Bracket | # Households | Median Income |
| 15 to 24 Years | 0 (0.0%) | $0 |
| 25 to 44 Years | 41 (100.0%) | $34,432 |
| 45 to 64 Years | 0 (0.0%) | $0 |
| 65+ Years | 0 (0.0%) | $0 |
| Total | 41 (100.0%) | $34,432 |
Poverty in Whiterocks
Income Below Poverty by Sex and Age in Whiterocks
With 53.6% poverty level for males and 73.0% for females among the residents of Whiterocks, 6 to 11 year old males and 12 to 14 year old females are the most vulnerable to poverty, with 28 males (100.0%) and 12 females (100.0%) in their respective age groups living below the poverty level.
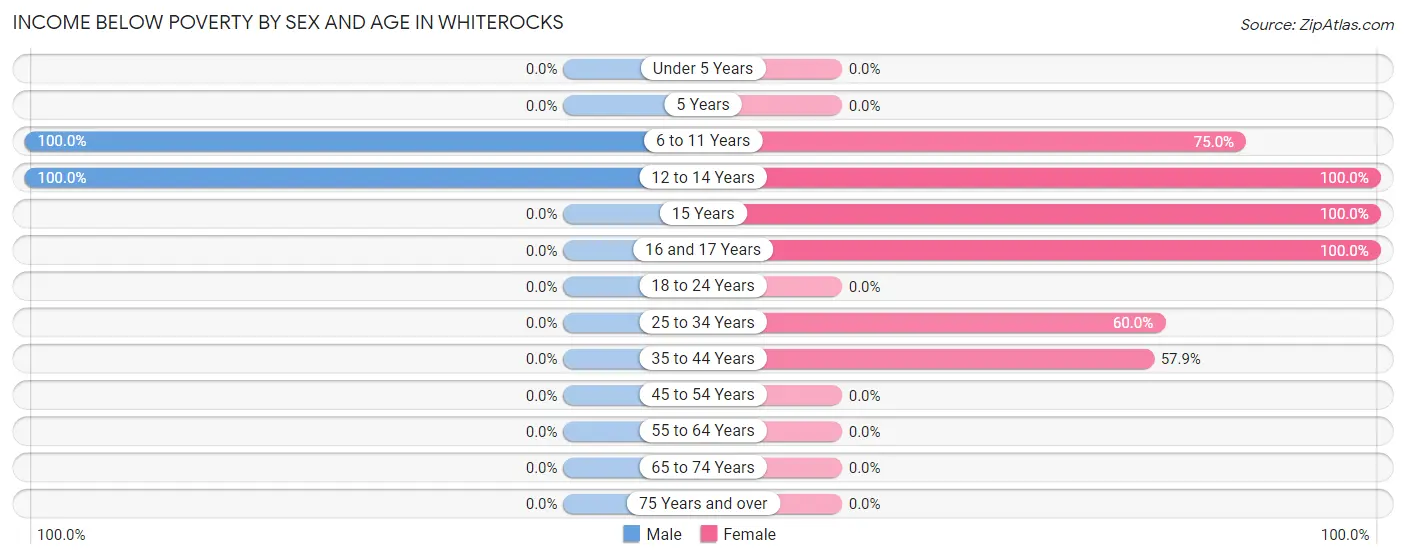
| Age Bracket | Male | Female |
| Under 5 Years | 0 (0.0%) | 0 (0.0%) |
| 5 Years | 0 (0.0%) | 0 (0.0%) |
| 6 to 11 Years | 28 (100.0%) | 30 (75.0%) |
| 12 to 14 Years | 9 (100.0%) | 12 (100.0%) |
| 15 Years | 0 (0.0%) | 12 (100.0%) |
| 16 and 17 Years | 0 (0.0%) | 12 (100.0%) |
| 18 to 24 Years | 0 (0.0%) | 0 (0.0%) |
| 25 to 34 Years | 0 (0.0%) | 12 (60.0%) |
| 35 to 44 Years | 0 (0.0%) | 11 (57.9%) |
| 45 to 54 Years | 0 (0.0%) | 0 (0.0%) |
| 55 to 64 Years | 0 (0.0%) | 0 (0.0%) |
| 65 to 74 Years | 0 (0.0%) | 0 (0.0%) |
| 75 Years and over | 0 (0.0%) | 0 (0.0%) |
| Total | 37 (53.6%) | 89 (73.0%) |
Income Above Poverty by Sex and Age in Whiterocks
According to the poverty statistics in Whiterocks, males aged under 5 years and females aged under 5 years are the age groups that are most secure financially, with 100.0% of males and 100.0% of females in these age groups living above the poverty line.
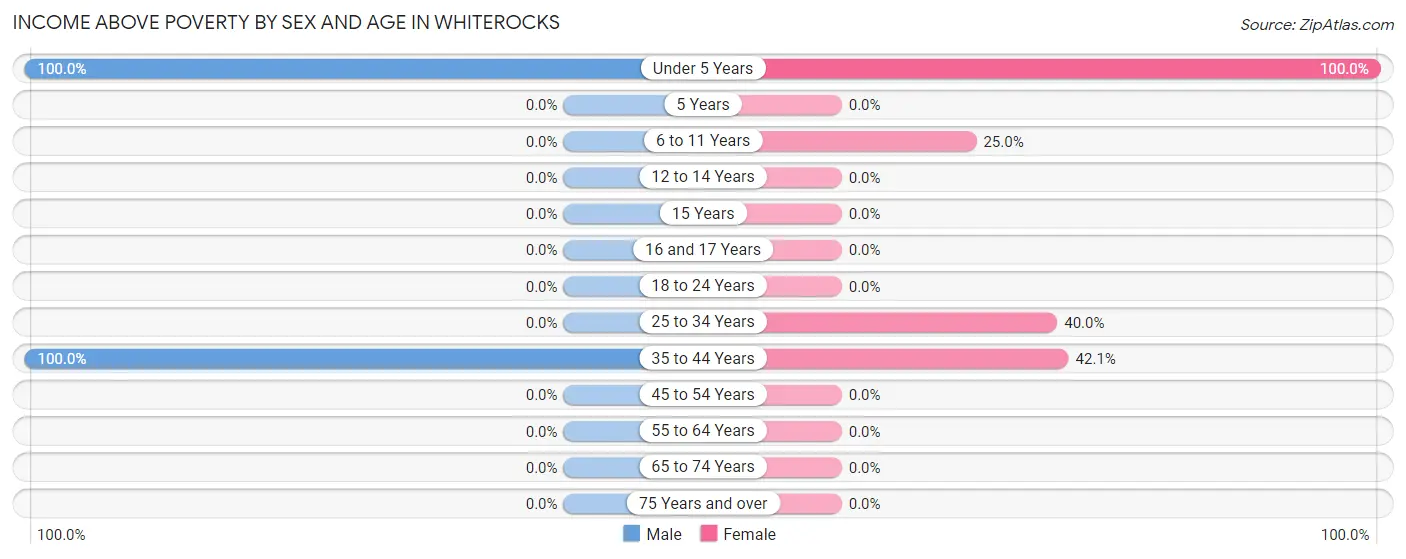
| Age Bracket | Male | Female |
| Under 5 Years | 6 (100.0%) | 7 (100.0%) |
| 5 Years | 0 (0.0%) | 0 (0.0%) |
| 6 to 11 Years | 0 (0.0%) | 10 (25.0%) |
| 12 to 14 Years | 0 (0.0%) | 0 (0.0%) |
| 15 Years | 0 (0.0%) | 0 (0.0%) |
| 16 and 17 Years | 0 (0.0%) | 0 (0.0%) |
| 18 to 24 Years | 0 (0.0%) | 0 (0.0%) |
| 25 to 34 Years | 0 (0.0%) | 8 (40.0%) |
| 35 to 44 Years | 26 (100.0%) | 8 (42.1%) |
| 45 to 54 Years | 0 (0.0%) | 0 (0.0%) |
| 55 to 64 Years | 0 (0.0%) | 0 (0.0%) |
| 65 to 74 Years | 0 (0.0%) | 0 (0.0%) |
| 75 Years and over | 0 (0.0%) | 0 (0.0%) |
| Total | 32 (46.4%) | 33 (27.1%) |
Income Below Poverty Among Married-Couple Families in Whiterocks
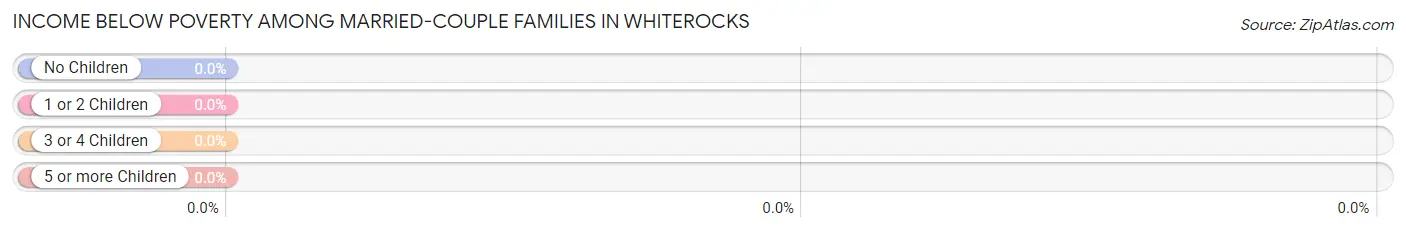
| Children | Above Poverty | Below Poverty |
| No Children | 0 (0.0%) | 0 (0.0%) |
| 1 or 2 Children | 18 (100.0%) | 0 (0.0%) |
| 3 or 4 Children | 0 (0.0%) | 0 (0.0%) |
| 5 or more Children | 0 (0.0%) | 0 (0.0%) |
| Total | 18 (100.0%) | 0 (0.0%) |
Income Below Poverty Among Single-Parent Households in Whiterocks
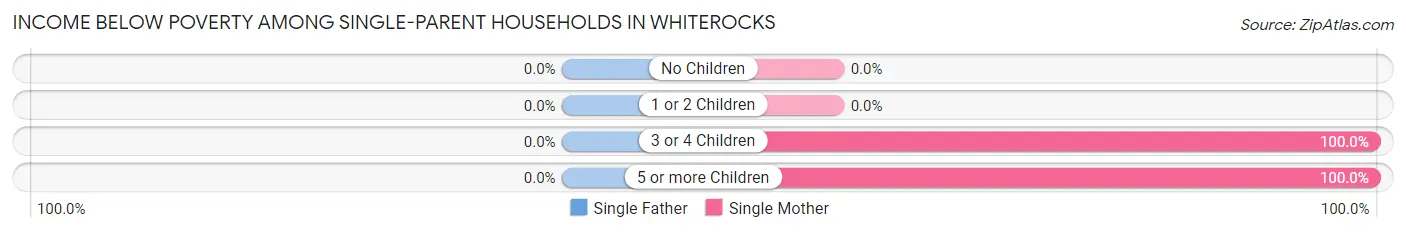
| Children | Single Father | Single Mother |
| No Children | 0 (0.0%) | 0 (0.0%) |
| 1 or 2 Children | 0 (0.0%) | 0 (0.0%) |
| 3 or 4 Children | 0 (0.0%) | 12 (100.0%) |
| 5 or more Children | 0 (0.0%) | 11 (100.0%) |
| Total | 0 (0.0%) | 23 (100.0%) |
Income Below Poverty Among Married-Couple vs Single-Parent Households in Whiterocks
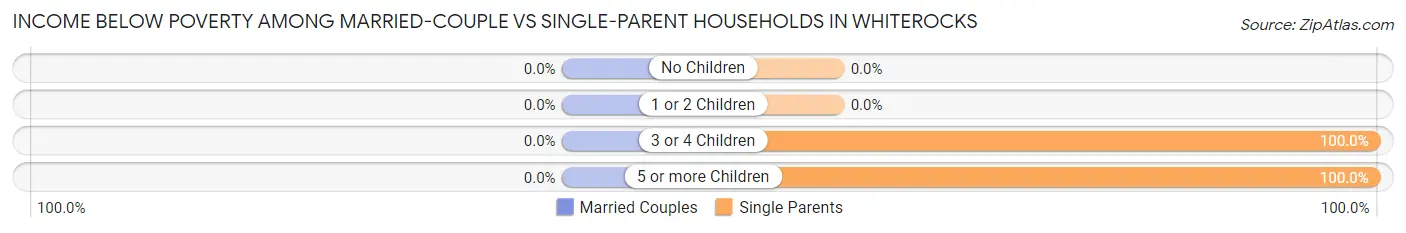
| Children | Married-Couple Families | Single-Parent Households |
| No Children | 0 (0.0%) | 0 (0.0%) |
| 1 or 2 Children | 0 (0.0%) | 0 (0.0%) |
| 3 or 4 Children | 0 (0.0%) | 12 (100.0%) |
| 5 or more Children | 0 (0.0%) | 11 (100.0%) |
| Total | 0 (0.0%) | 23 (100.0%) |
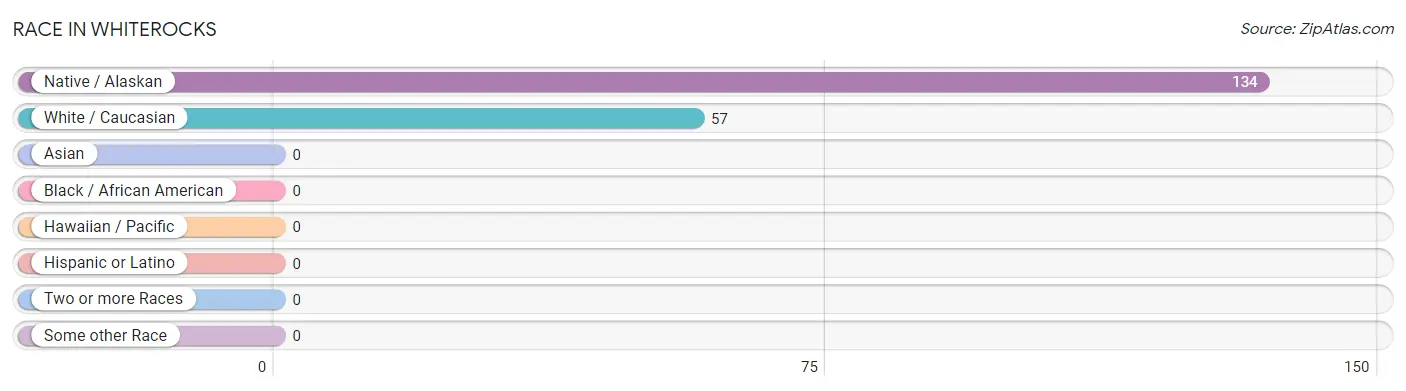
Race in Whiterocks
The most populous races in Whiterocks are Native / Alaskan (134 | 70.2%), and White / Caucasian (57 | 29.8%).
| Race | # Population | % Population |
| Asian | 0 | 0.0% |
| Black / African American | 0 | 0.0% |
| Hawaiian / Pacific | 0 | 0.0% |
| Hispanic or Latino | 0 | 0.0% |
| Native / Alaskan | 134 | 70.2% |
| White / Caucasian | 57 | 29.8% |
| Two or more Races | 0 | 0.0% |
| Some other Race | 0 | 0.0% |
| Total | 191 | 100.0% |
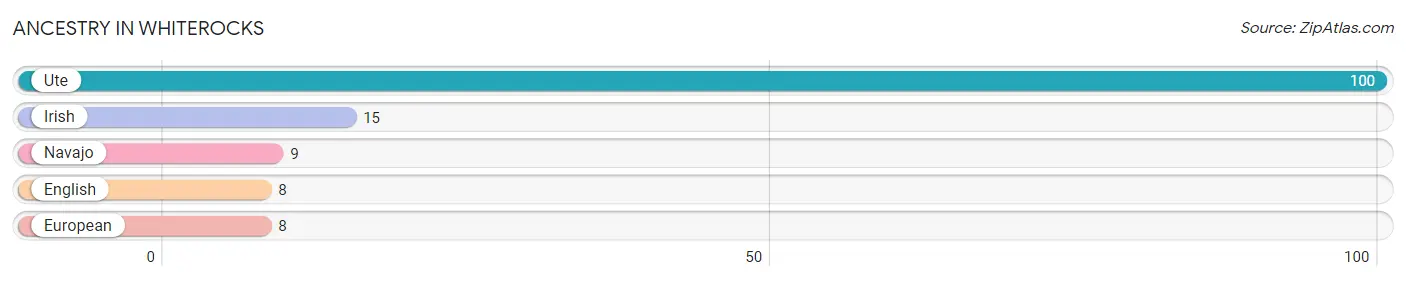
Ancestry in Whiterocks
The most populous ancestries reported in Whiterocks are Ute (100 | 52.4%), Irish (15 | 7.9%), Navajo (9 | 4.7%), English (8 | 4.2%), and European (8 | 4.2%), together accounting for 73.3% of all Whiterocks residents.
| Ancestry | # Population | % Population |
| English | 8 | 4.2% |
| European | 8 | 4.2% |
| Irish | 15 | 7.9% |
| Navajo | 9 | 4.7% |
| Ute | 100 | 52.4% | View All 5 Rows |
Immigrants in Whiterocks

| Immigration Origin | # Population | % Population | View All 0 Rows |
Sex and Age in Whiterocks
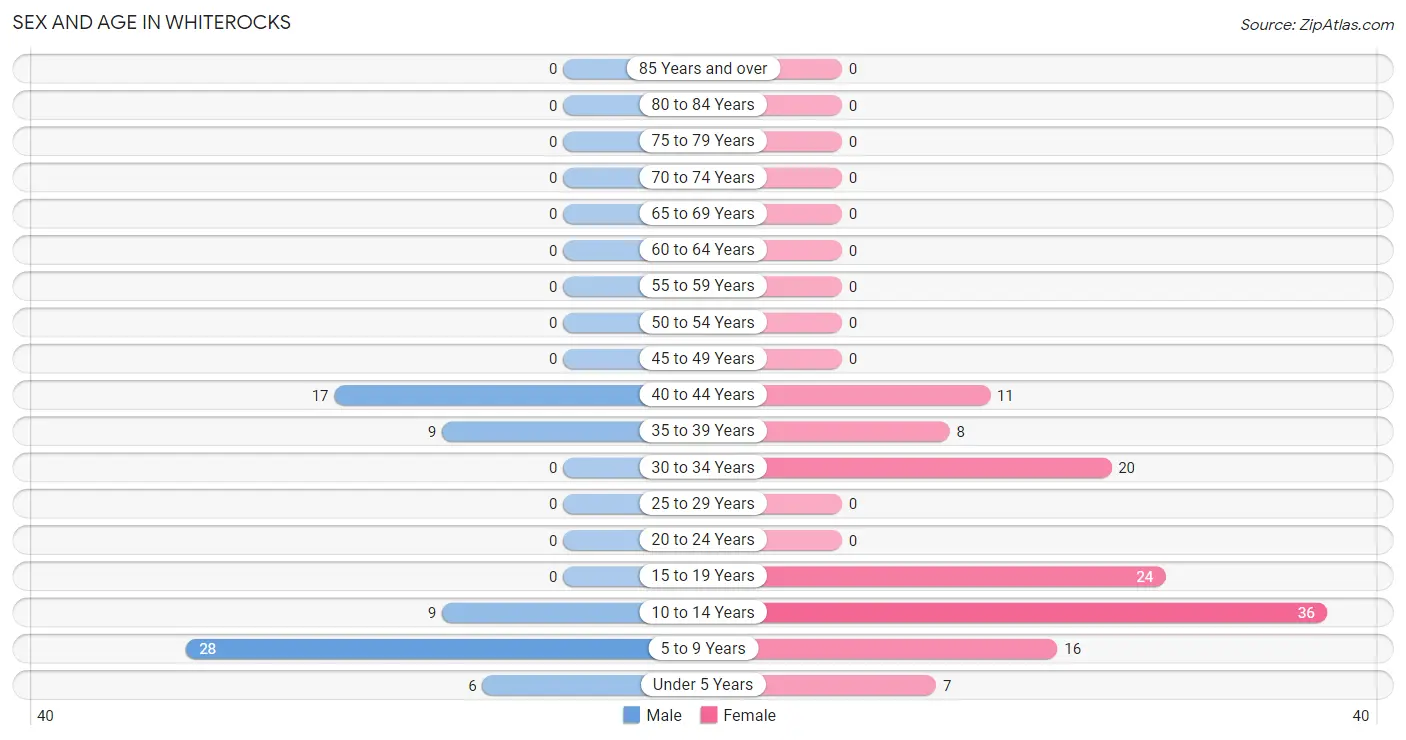
Sex and Age in Whiterocks
The most populous age groups in Whiterocks are 5 to 9 Years (28 | 40.6%) for men and 10 to 14 Years (36 | 29.5%) for women.
| Age Bracket | Male | Female |
| Under 5 Years | 6 (8.7%) | 7 (5.7%) |
| 5 to 9 Years | 28 (40.6%) | 16 (13.1%) |
| 10 to 14 Years | 9 (13.0%) | 36 (29.5%) |
| 15 to 19 Years | 0 (0.0%) | 24 (19.7%) |
| 20 to 24 Years | 0 (0.0%) | 0 (0.0%) |
| 25 to 29 Years | 0 (0.0%) | 0 (0.0%) |
| 30 to 34 Years | 0 (0.0%) | 20 (16.4%) |
| 35 to 39 Years | 9 (13.0%) | 8 (6.6%) |
| 40 to 44 Years | 17 (24.6%) | 11 (9.0%) |
| 45 to 49 Years | 0 (0.0%) | 0 (0.0%) |
| 50 to 54 Years | 0 (0.0%) | 0 (0.0%) |
| 55 to 59 Years | 0 (0.0%) | 0 (0.0%) |
| 60 to 64 Years | 0 (0.0%) | 0 (0.0%) |
| 65 to 69 Years | 0 (0.0%) | 0 (0.0%) |
| 70 to 74 Years | 0 (0.0%) | 0 (0.0%) |
| 75 to 79 Years | 0 (0.0%) | 0 (0.0%) |
| 80 to 84 Years | 0 (0.0%) | 0 (0.0%) |
| 85 Years and over | 0 (0.0%) | 0 (0.0%) |
| Total | 69 (100.0%) | 122 (100.0%) |
Families and Households in Whiterocks
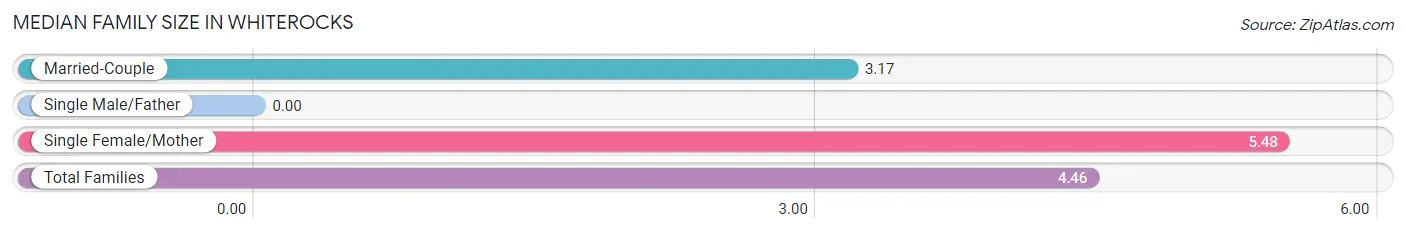
Median Family Size in Whiterocks
| Family Type | # Families | Family Size |
| Married-Couple | 18 (43.9%) | 3.17 |
| Single Male/Father | 0 (0.0%) | - |
| Single Female/Mother | 23 (56.1%) | 5.48 |
| Total Families | 41 (100.0%) | 4.46 |
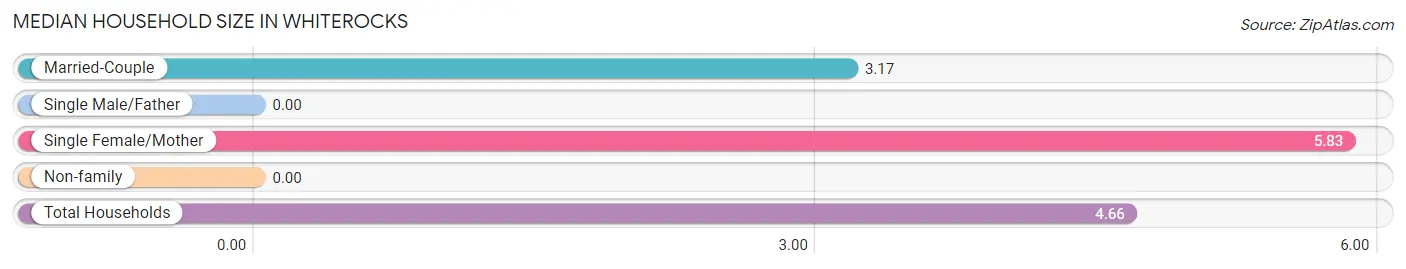
Median Household Size in Whiterocks
| Household Type | # Households | Household Size |
| Married-Couple | 18 (43.9%) | 3.17 |
| Single Male/Father | 0 (0.0%) | - |
| Single Female/Mother | 23 (56.1%) | 5.83 |
| Non-family | 0 (0.0%) | - |
| Total Households | 41 (100.0%) | 4.66 |
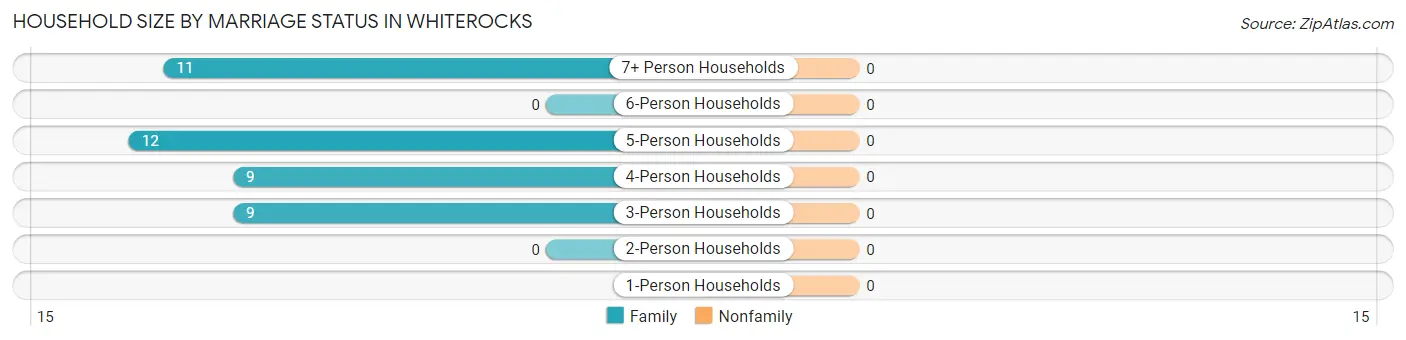
Household Size by Marriage Status in Whiterocks
| Household Size | Family Households | Nonfamily Households |
| 1-Person Households | - | 0 (0.0%) |
| 2-Person Households | 0 (0.0%) | 0 (0.0%) |
| 3-Person Households | 9 (22.0%) | 0 (0.0%) |
| 4-Person Households | 9 (22.0%) | 0 (0.0%) |
| 5-Person Households | 12 (29.3%) | 0 (0.0%) |
| 6-Person Households | 0 (0.0%) | 0 (0.0%) |
| 7+ Person Households | 11 (26.8%) | 0 (0.0%) |
| Total | 41 (100.0%) | 0 (0.0%) |
Female Fertility in Whiterocks
Fertility by Age in Whiterocks
Average fertility rate in Whiterocks is 127.0 births per 1,000 women. Women in the age bracket of 20 to 34 years have the highest fertility rate with 400.0 births per 1,000 women. Women in the age bracket of 20 to 34 years acount for 100.0% of all women with births.
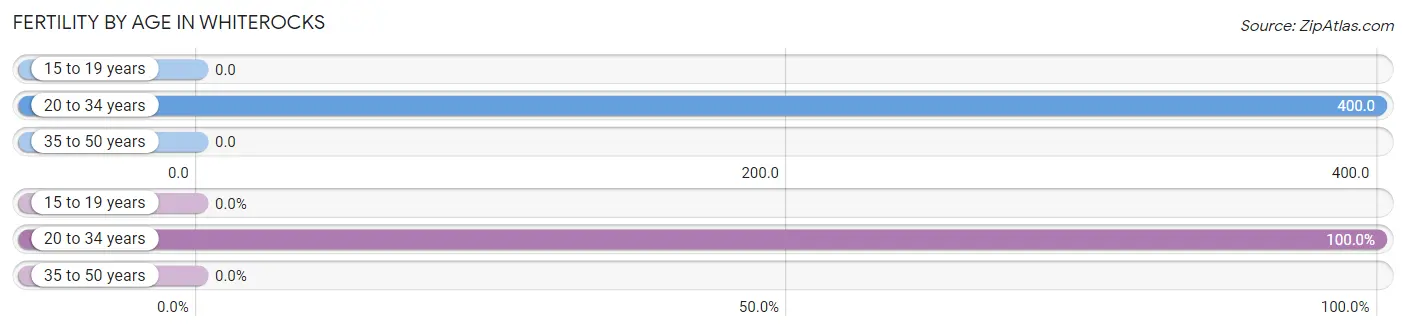
| Age Bracket | Women with Births | Births / 1,000 Women |
| 15 to 19 years | 0 (0.0%) | 0.0 |
| 20 to 34 years | 8 (100.0%) | 400.0 |
| 35 to 50 years | 0 (0.0%) | 0.0 |
| Total | 8 (100.0%) | 127.0 |
Fertility by Age by Marriage Status in Whiterocks
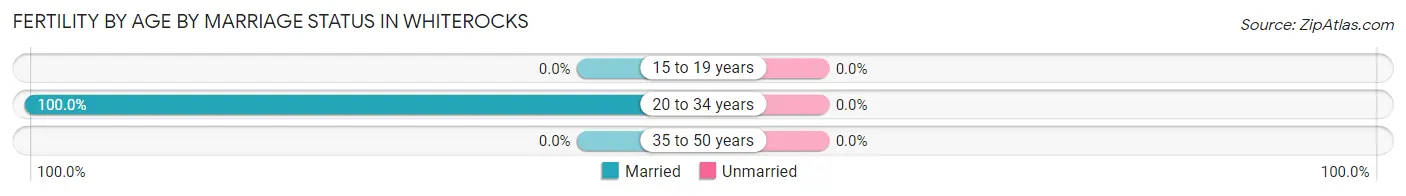
| Age Bracket | Married | Unmarried |
| 15 to 19 years | 0 (0.0%) | 0 (0.0%) |
| 20 to 34 years | 8 (100.0%) | 0 (0.0%) |
| 35 to 50 years | 0 (0.0%) | 0 (0.0%) |
| Total | 8 (100.0%) | 0 (0.0%) |
Fertility by Education in Whiterocks
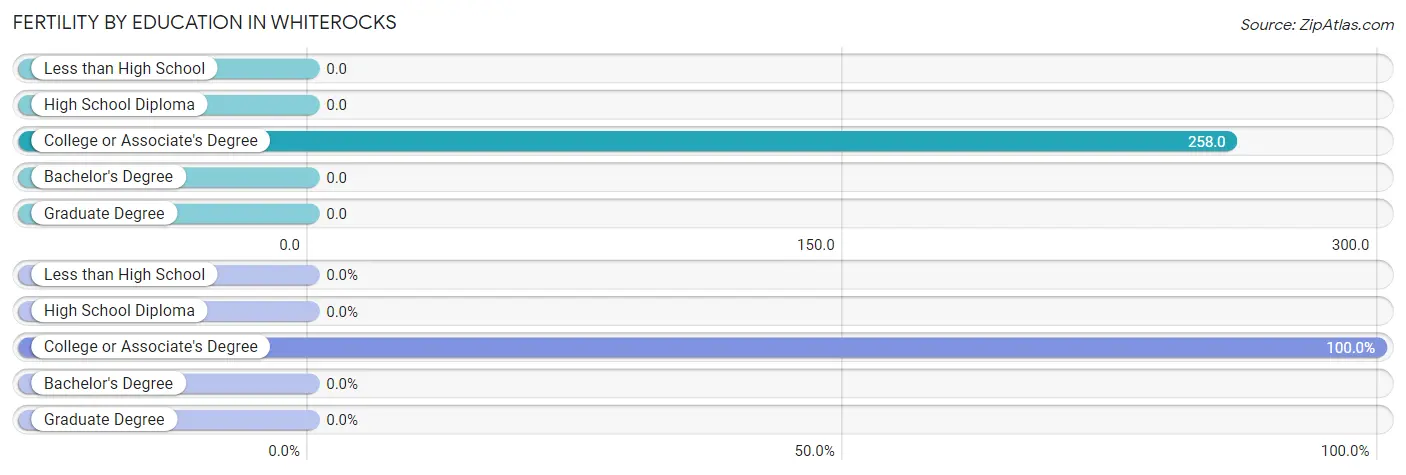
| Educational Attainment | Women with Births | Births / 1,000 Women |
| Less than High School | 0 (0.0%) | 0.0 |
| High School Diploma | 0 (0.0%) | 0.0 |
| College or Associate's Degree | 8 (100.0%) | 258.0 |
| Bachelor's Degree | 0 (0.0%) | 0.0 |
| Graduate Degree | 0 (0.0%) | 0.0 |
| Total | 8 (100.0%) | 127.0 |
Fertility by Education by Marriage Status in Whiterocks
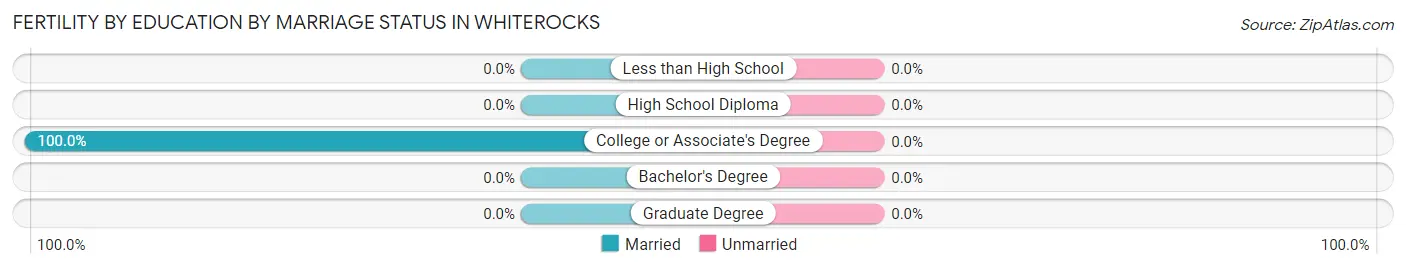
| Educational Attainment | Married | Unmarried |
| Less than High School | 0 (0.0%) | 0 (0.0%) |
| High School Diploma | 0 (0.0%) | 0 (0.0%) |
| College or Associate's Degree | 8 (100.0%) | 0 (0.0%) |
| Bachelor's Degree | 0 (0.0%) | 0 (0.0%) |
| Graduate Degree | 0 (0.0%) | 0 (0.0%) |
| Total | 8 (100.0%) | 0 (0.0%) |
Employment Characteristics in Whiterocks
Employment by Class of Employer in Whiterocks
Among the 26 employed individuals in Whiterocks, state government employees (18 | 69.2%), and private company employees (8 | 30.8%) make up the most common classes of employment.
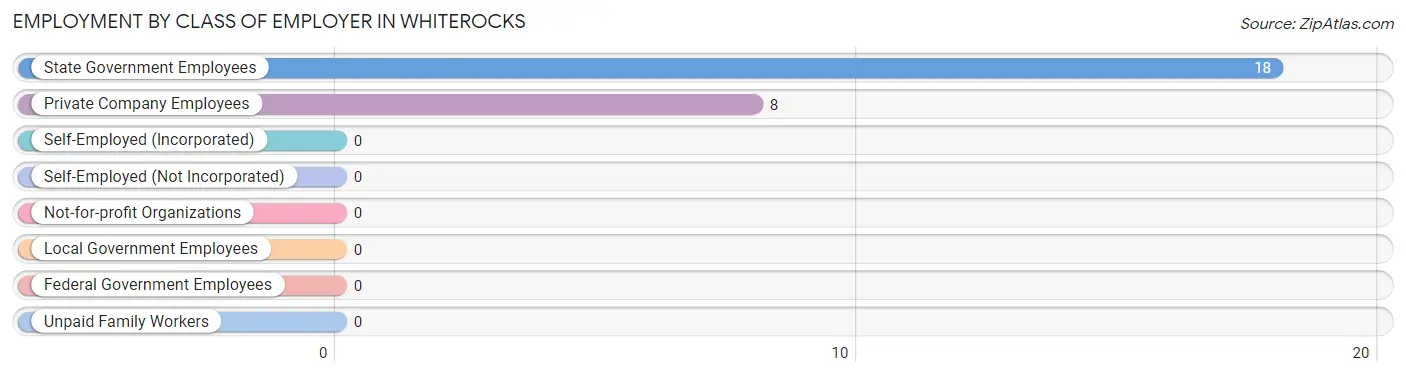
| Employer Class | # Employees | % Employees |
| Private Company Employees | 8 | 30.8% |
| Self-Employed (Incorporated) | 0 | 0.0% |
| Self-Employed (Not Incorporated) | 0 | 0.0% |
| Not-for-profit Organizations | 0 | 0.0% |
| Local Government Employees | 0 | 0.0% |
| State Government Employees | 18 | 69.2% |
| Federal Government Employees | 0 | 0.0% |
| Unpaid Family Workers | 0 | 0.0% |
| Total | 26 | 100.0% |
Employment Status by Age in Whiterocks
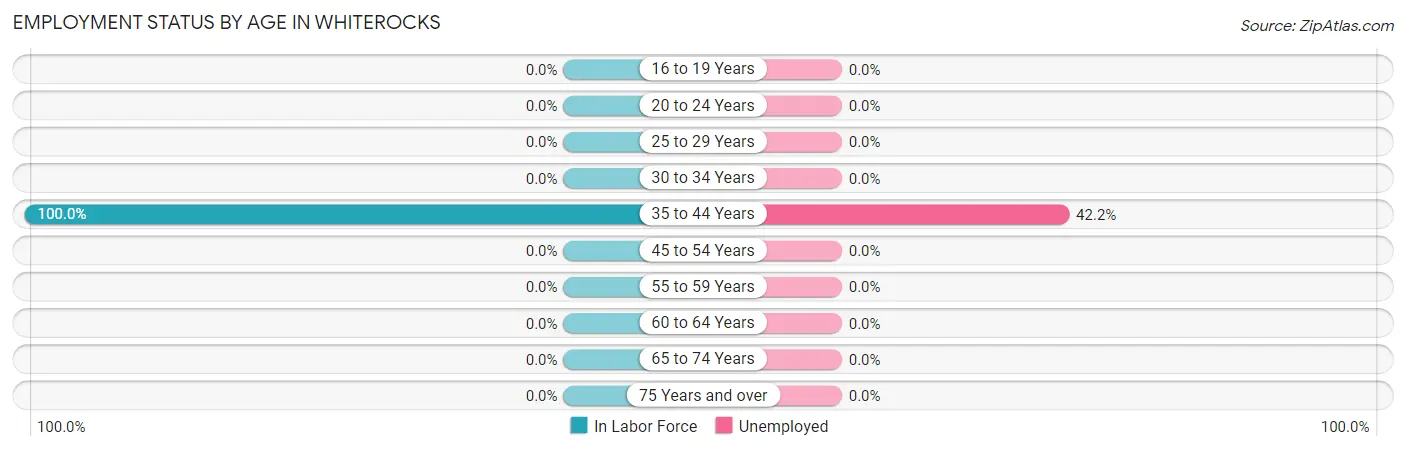
According to the labor force statistics for Whiterocks, out of the total population over 16 years of age (77), 58.4% or 45 individuals are in the labor force, with 42.2% or 19 of them unemployed. The age group with the highest labor force participation rate is 35 to 44 years, with 100.0% or 45 individuals in the labor force. Within the labor force, the 35 to 44 years age range has the highest percentage of unemployed individuals, with 42.2% or 19 of them being unemployed.
| Age Bracket | In Labor Force | Unemployed |
| 16 to 19 Years | 0 (0.0%) | 0 (0.0%) |
| 20 to 24 Years | 0 (0.0%) | 0 (0.0%) |
| 25 to 29 Years | 0 (0.0%) | 0 (0.0%) |
| 30 to 34 Years | 0 (0.0%) | 0 (0.0%) |
| 35 to 44 Years | 45 (100.0%) | 19 (42.2%) |
| 45 to 54 Years | 0 (0.0%) | 0 (0.0%) |
| 55 to 59 Years | 0 (0.0%) | 0 (0.0%) |
| 60 to 64 Years | 0 (0.0%) | 0 (0.0%) |
| 65 to 74 Years | 0 (0.0%) | 0 (0.0%) |
| 75 Years and over | 0 (0.0%) | 0 (0.0%) |
| Total | 45 (58.4%) | 19 (42.2%) |
Employment Status by Educational Attainment in Whiterocks
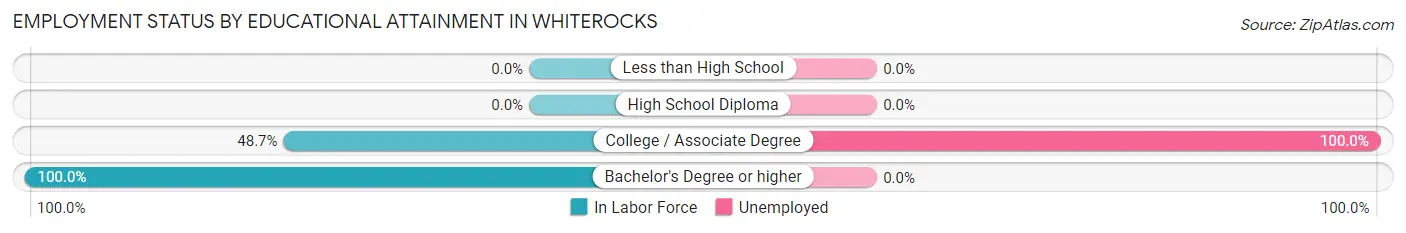
According to labor force statistics for Whiterocks, 69.2% of individuals (45) out of the total population between 25 and 64 years of age (65) are in the labor force, with 42.2% or 19 of them being unemployed. The group with the highest labor force participation rate are those with the educational attainment of bachelor's degree or higher, with 100.0% or 26 individuals in the labor force. Within the labor force, individuals with college / associate degree education have the highest percentage of unemployment, with 100.0% or 19 of them being unemployed.
| Educational Attainment | In Labor Force | Unemployed |
| Less than High School | 0 (0.0%) | 0 (0.0%) |
| High School Diploma | 0 (0.0%) | 0 (0.0%) |
| College / Associate Degree | 19 (48.7%) | 39 (100.0%) |
| Bachelor's Degree or higher | 26 (100.0%) | 0 (0.0%) |
| Total | 45 (69.2%) | 27 (42.2%) |
Employment Occupations by Sex in Whiterocks
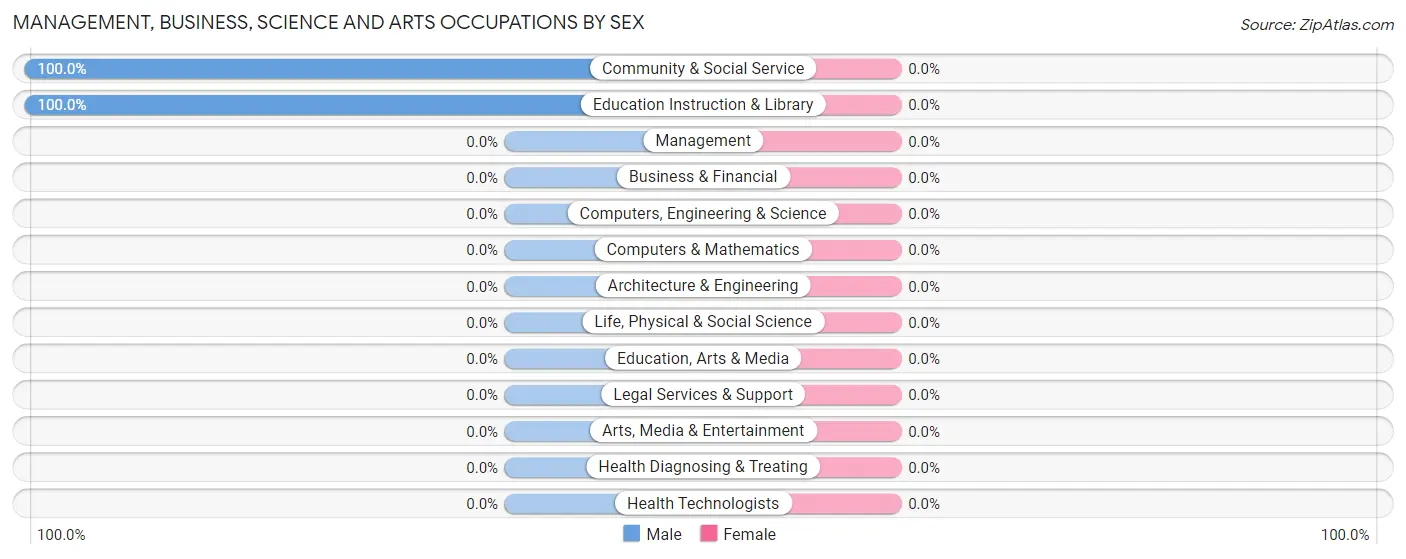
Management, Business, Science and Arts Occupations
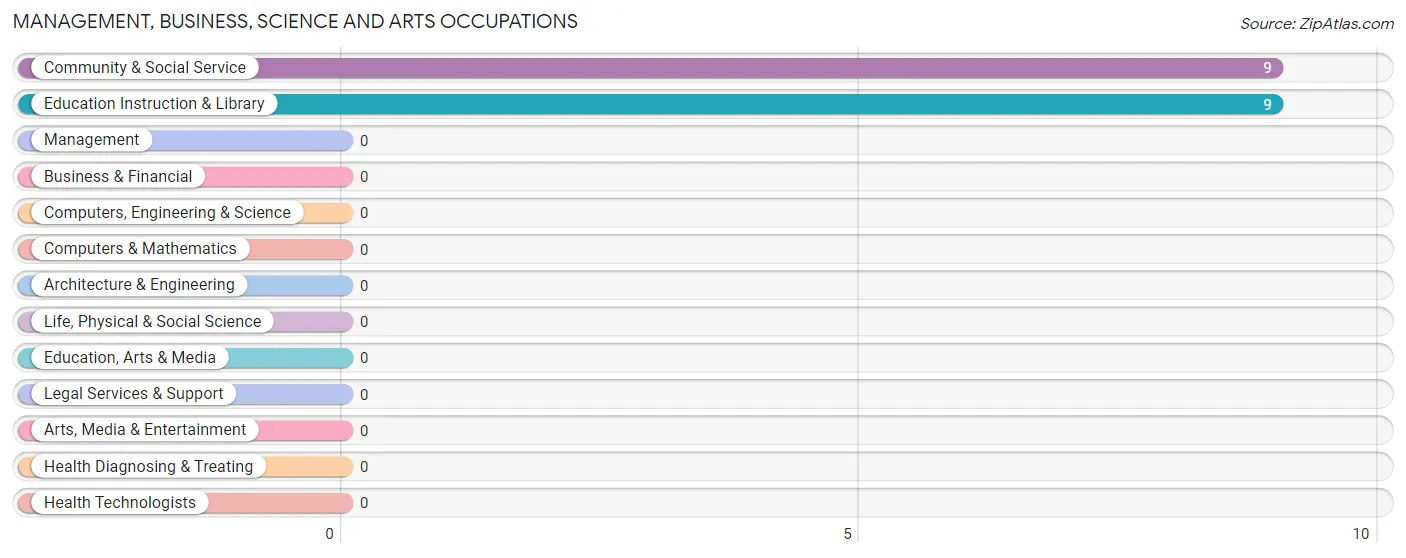
The most common Management, Business, Science and Arts occupations in Whiterocks are Community & Social Service (9 | 34.6%), and Education Instruction & Library (9 | 34.6%).
Management, Business, Science and Arts Occupations by Sex
| Occupation | Male | Female |
| Management | 0 (0.0%) | 0 (0.0%) |
| Business & Financial | 0 (0.0%) | 0 (0.0%) |
| Computers, Engineering & Science | 0 (0.0%) | 0 (0.0%) |
| Computers & Mathematics | 0 (0.0%) | 0 (0.0%) |
| Architecture & Engineering | 0 (0.0%) | 0 (0.0%) |
| Life, Physical & Social Science | 0 (0.0%) | 0 (0.0%) |
| Community & Social Service | 9 (100.0%) | 0 (0.0%) |
| Education, Arts & Media | 0 (0.0%) | 0 (0.0%) |
| Legal Services & Support | 0 (0.0%) | 0 (0.0%) |
| Education Instruction & Library | 9 (100.0%) | 0 (0.0%) |
| Arts, Media & Entertainment | 0 (0.0%) | 0 (0.0%) |
| Health Diagnosing & Treating | 0 (0.0%) | 0 (0.0%) |
| Health Technologists | 0 (0.0%) | 0 (0.0%) |
| Total (Category) | 9 (100.0%) | 0 (0.0%) |
| Total (Overall) | 18 (69.2%) | 8 (30.8%) |
Services Occupations
Services Occupations by Sex
| Occupation | Male | Female |
| Healthcare Support | 0 (0.0%) | 0 (0.0%) |
| Security & Protection | 0 (0.0%) | 0 (0.0%) |
| Firefighting & Prevention | 0 (0.0%) | 0 (0.0%) |
| Law Enforcement | 0 (0.0%) | 0 (0.0%) |
| Food Preparation & Serving | 0 (0.0%) | 0 (0.0%) |
| Cleaning & Maintenance | 0 (0.0%) | 0 (0.0%) |
| Personal Care & Service | 0 (0.0%) | 0 (0.0%) |
| Total (Category) | 0 (0.0%) | 0 (0.0%) |
| Total (Overall) | 18 (69.2%) | 8 (30.8%) |
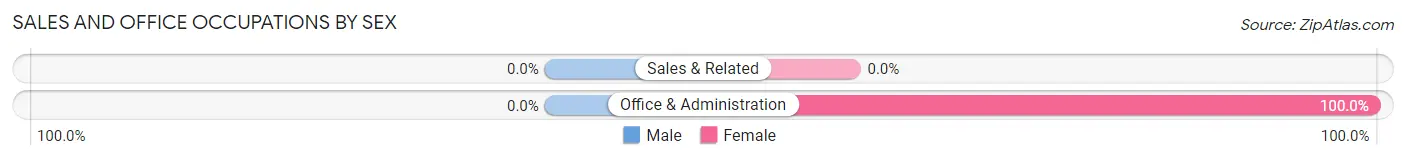
Sales and Office Occupations
The most common Sales and Office occupations in Whiterocks are , and Office & Administration (8 | 30.8%).
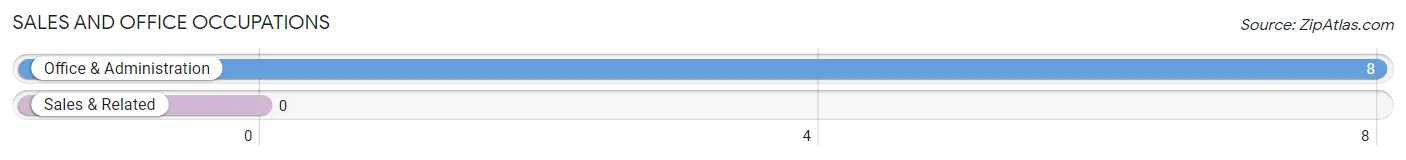
Sales and Office Occupations by Sex
| Occupation | Male | Female |
| Sales & Related | 0 (0.0%) | 0 (0.0%) |
| Office & Administration | 0 (0.0%) | 8 (100.0%) |
| Total (Category) | 0 (0.0%) | 8 (100.0%) |
| Total (Overall) | 18 (69.2%) | 8 (30.8%) |
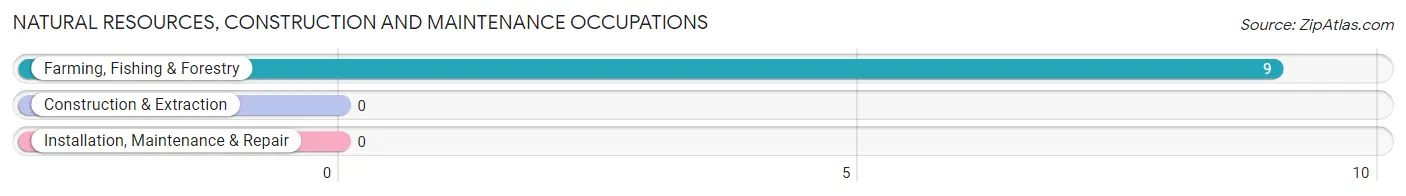
Natural Resources, Construction and Maintenance Occupations
The most common Natural Resources, Construction and Maintenance occupations in Whiterocks are , and Farming, Fishing & Forestry (9 | 34.6%).
Natural Resources, Construction and Maintenance Occupations by Sex
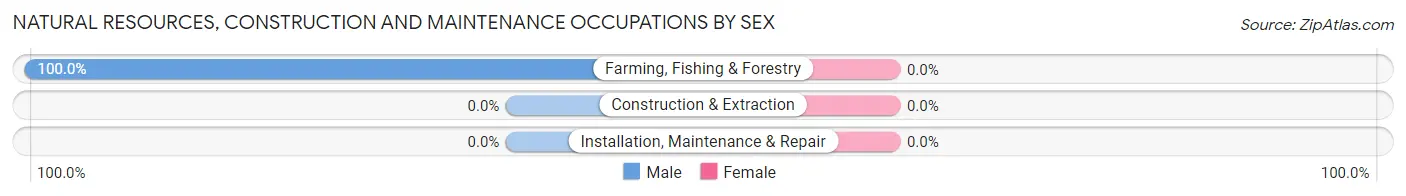
| Occupation | Male | Female |
| Farming, Fishing & Forestry | 9 (100.0%) | 0 (0.0%) |
| Construction & Extraction | 0 (0.0%) | 0 (0.0%) |
| Installation, Maintenance & Repair | 0 (0.0%) | 0 (0.0%) |
| Total (Category) | 9 (100.0%) | 0 (0.0%) |
| Total (Overall) | 18 (69.2%) | 8 (30.8%) |
Production, Transportation and Moving Occupations
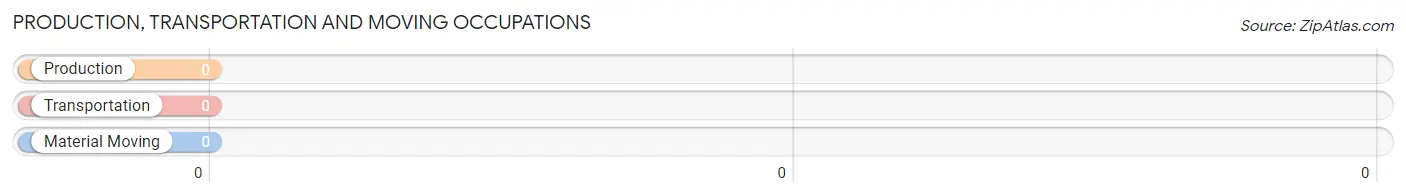
Production, Transportation and Moving Occupations by Sex
| Occupation | Male | Female |
| Production | 0 (0.0%) | 0 (0.0%) |
| Transportation | 0 (0.0%) | 0 (0.0%) |
| Material Moving | 0 (0.0%) | 0 (0.0%) |
| Total (Category) | 0 (0.0%) | 0 (0.0%) |
| Total (Overall) | 18 (69.2%) | 8 (30.8%) |
Employment Industries by Sex in Whiterocks
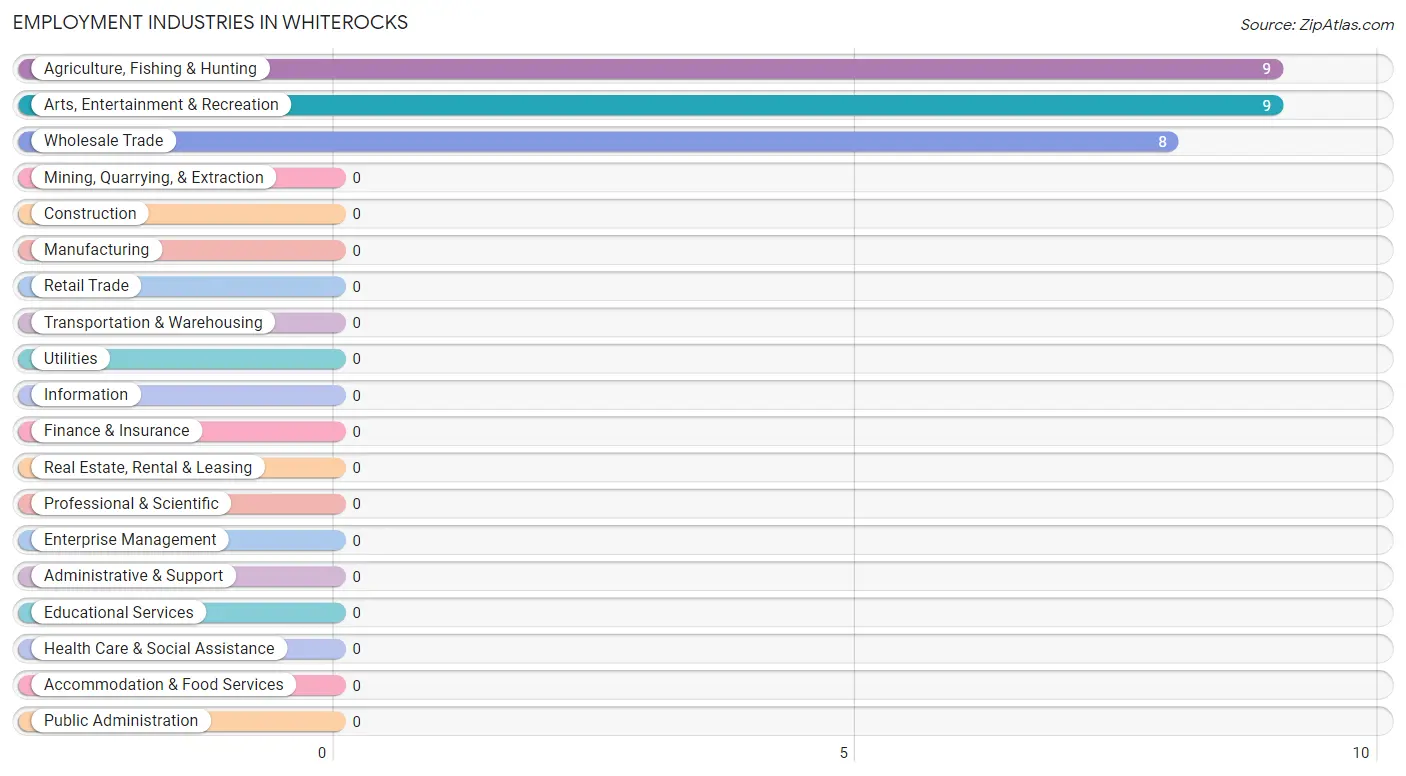
Employment Industries in Whiterocks
The major employment industries in Whiterocks include Agriculture, Fishing & Hunting (9 | 34.6%), Arts, Entertainment & Recreation (9 | 34.6%), and Wholesale Trade (8 | 30.8%).
Employment Industries by Sex in Whiterocks
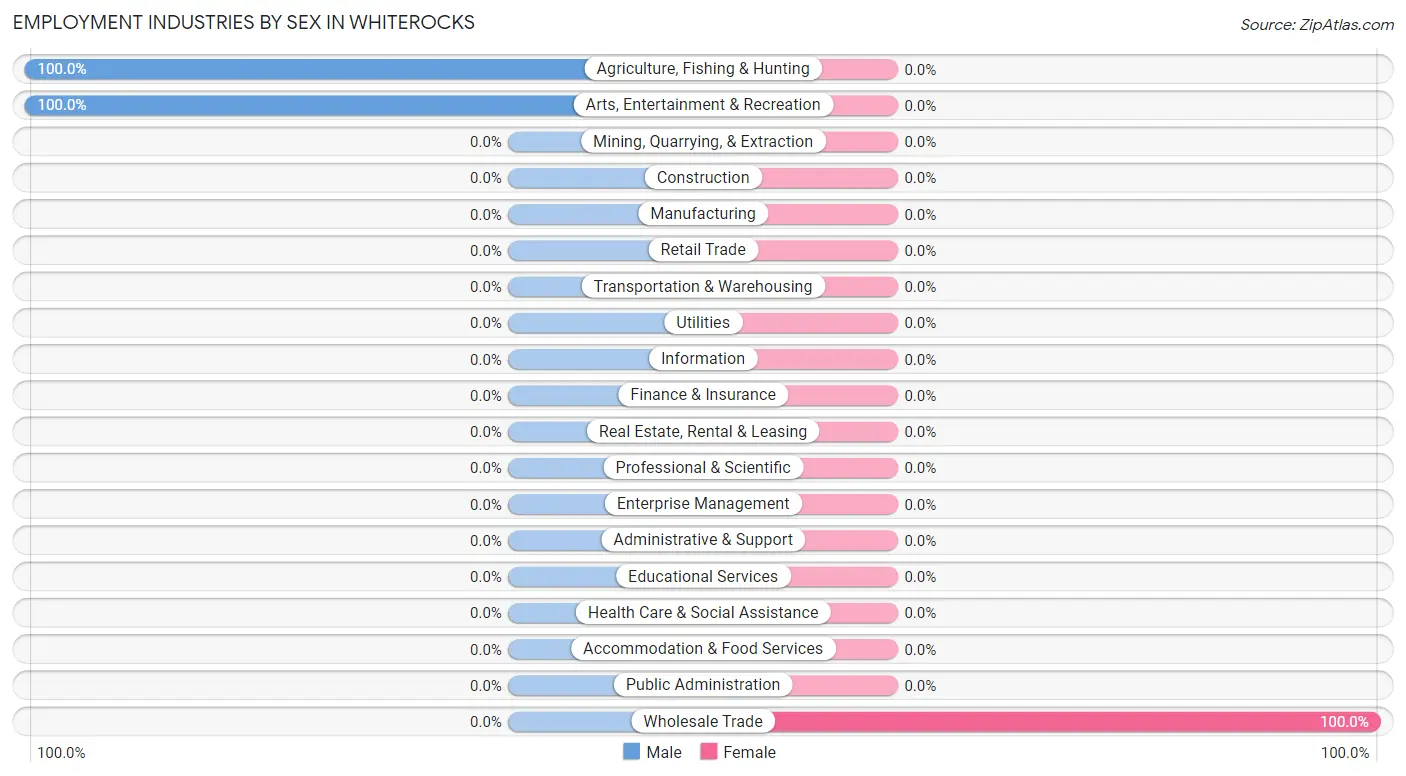
| Industry | Male | Female |
| Agriculture, Fishing & Hunting | 9 (100.0%) | 0 (0.0%) |
| Mining, Quarrying, & Extraction | 0 (0.0%) | 0 (0.0%) |
| Construction | 0 (0.0%) | 0 (0.0%) |
| Manufacturing | 0 (0.0%) | 0 (0.0%) |
| Wholesale Trade | 0 (0.0%) | 8 (100.0%) |
| Retail Trade | 0 (0.0%) | 0 (0.0%) |
| Transportation & Warehousing | 0 (0.0%) | 0 (0.0%) |
| Utilities | 0 (0.0%) | 0 (0.0%) |
| Information | 0 (0.0%) | 0 (0.0%) |
| Finance & Insurance | 0 (0.0%) | 0 (0.0%) |
| Real Estate, Rental & Leasing | 0 (0.0%) | 0 (0.0%) |
| Professional & Scientific | 0 (0.0%) | 0 (0.0%) |
| Enterprise Management | 0 (0.0%) | 0 (0.0%) |
| Administrative & Support | 0 (0.0%) | 0 (0.0%) |
| Educational Services | 0 (0.0%) | 0 (0.0%) |
| Health Care & Social Assistance | 0 (0.0%) | 0 (0.0%) |
| Arts, Entertainment & Recreation | 9 (100.0%) | 0 (0.0%) |
| Accommodation & Food Services | 0 (0.0%) | 0 (0.0%) |
| Public Administration | 0 (0.0%) | 0 (0.0%) |
| Total | 18 (69.2%) | 8 (30.8%) |
Education in Whiterocks
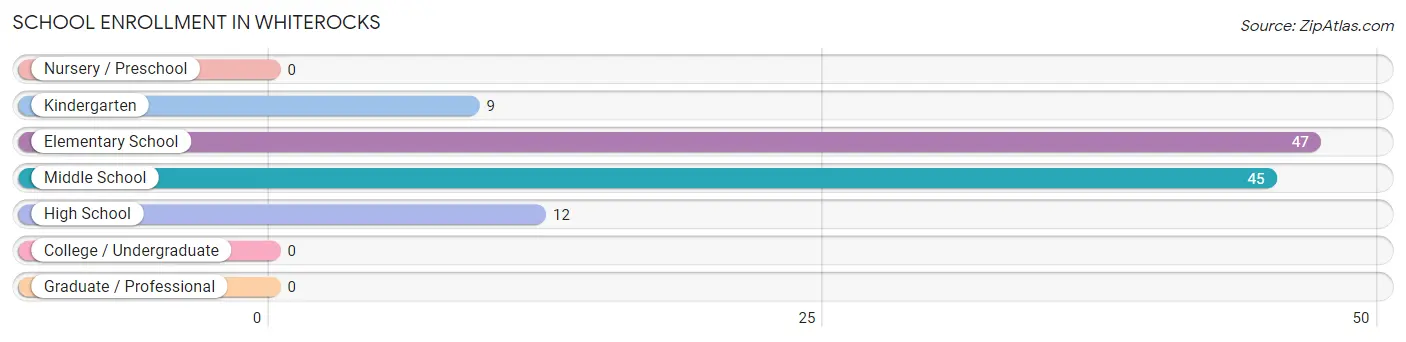
School Enrollment in Whiterocks
The most common levels of schooling among the 113 students in Whiterocks are elementary school (47 | 41.6%), middle school (45 | 39.8%), and high school (12 | 10.6%).
| School Level | # Students | % Students |
| Nursery / Preschool | 0 | 0.0% |
| Kindergarten | 9 | 8.0% |
| Elementary School | 47 | 41.6% |
| Middle School | 45 | 39.8% |
| High School | 12 | 10.6% |
| College / Undergraduate | 0 | 0.0% |
| Graduate / Professional | 0 | 0.0% |
| Total | 113 | 100.0% |
School Enrollment by Age by Funding Source in Whiterocks
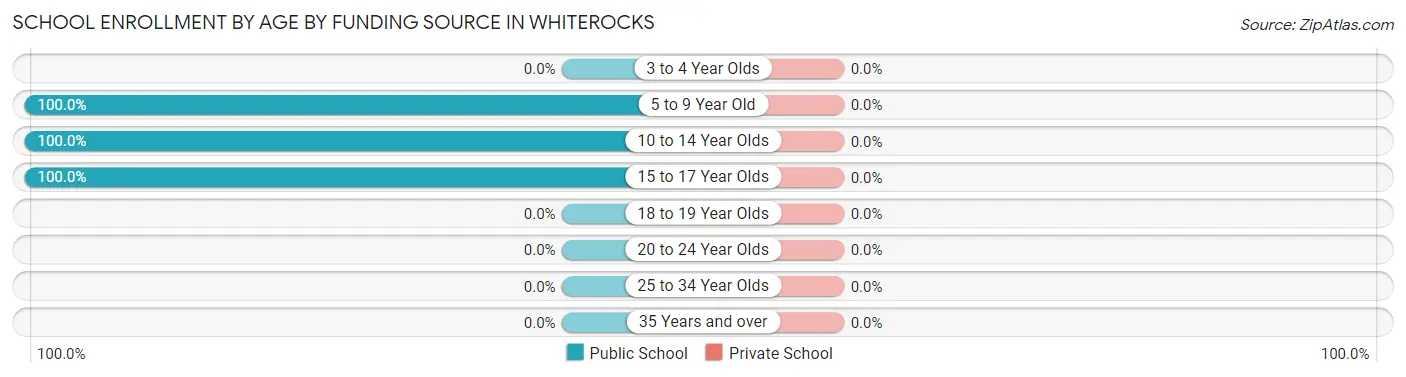
| Age Bracket | Public School | Private School |
| 3 to 4 Year Olds | 0 (0.0%) | 0 (0.0%) |
| 5 to 9 Year Old | 44 (100.0%) | 0 (0.0%) |
| 10 to 14 Year Olds | 45 (100.0%) | 0 (0.0%) |
| 15 to 17 Year Olds | 24 (100.0%) | 0 (0.0%) |
| 18 to 19 Year Olds | 0 (0.0%) | 0 (0.0%) |
| 20 to 24 Year Olds | 0 (0.0%) | 0 (0.0%) |
| 25 to 34 Year Olds | 0 (0.0%) | 0 (0.0%) |
| 35 Years and over | 0 (0.0%) | 0 (0.0%) |
| Total | 113 (100.0%) | 0 (0.0%) |
Educational Attainment by Field of Study in Whiterocks
Physical & health sciences (9 | 34.6%), multidisciplinary studies (9 | 34.6%), and business (8 | 30.8%) are the most common fields of study among 26 individuals in Whiterocks who have obtained a bachelor's degree or higher.
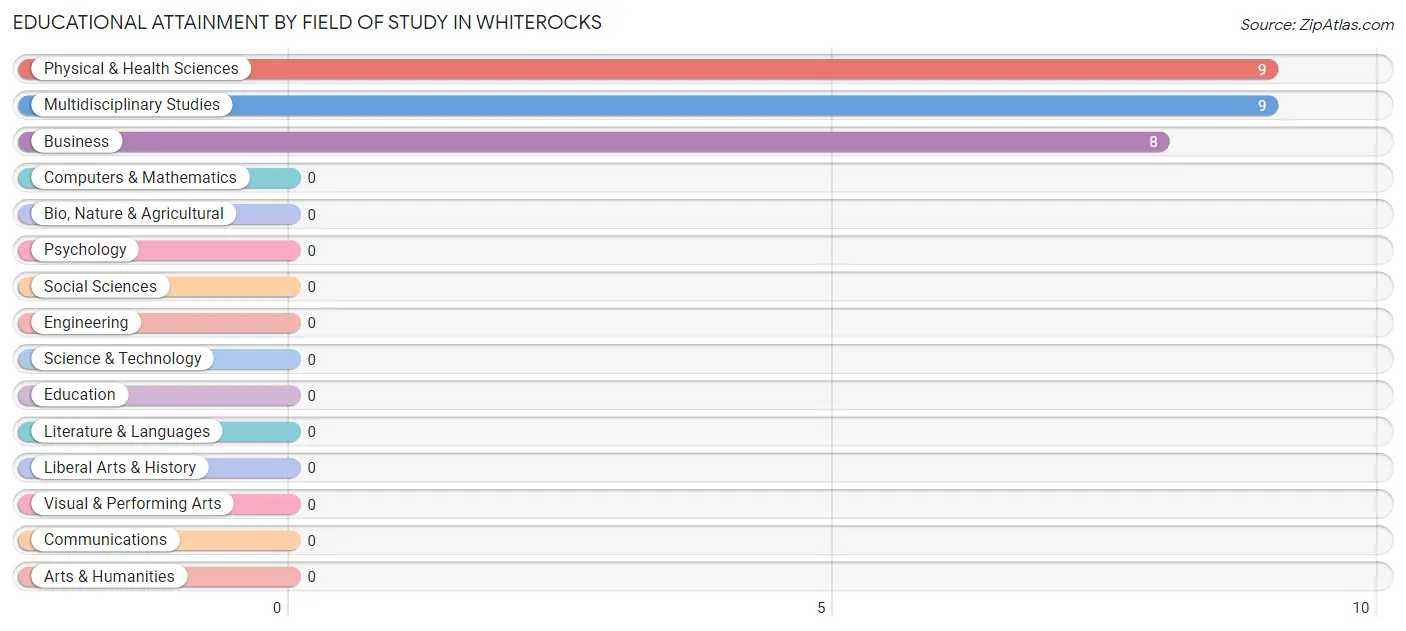
| Field of Study | # Graduates | % Graduates |
| Computers & Mathematics | 0 | 0.0% |
| Bio, Nature & Agricultural | 0 | 0.0% |
| Physical & Health Sciences | 9 | 34.6% |
| Psychology | 0 | 0.0% |
| Social Sciences | 0 | 0.0% |
| Engineering | 0 | 0.0% |
| Multidisciplinary Studies | 9 | 34.6% |
| Science & Technology | 0 | 0.0% |
| Business | 8 | 30.8% |
| Education | 0 | 0.0% |
| Literature & Languages | 0 | 0.0% |
| Liberal Arts & History | 0 | 0.0% |
| Visual & Performing Arts | 0 | 0.0% |
| Communications | 0 | 0.0% |
| Arts & Humanities | 0 | 0.0% |
| Total | 26 | 100.0% |
Transportation & Commute in Whiterocks
Vehicle Availability by Sex in Whiterocks
The most prevalent vehicle ownership categories in Whiterocks are males with 1 vehicle (9, accounting for 50.0%) and females with 1 vehicle (0, making up 112.5%).
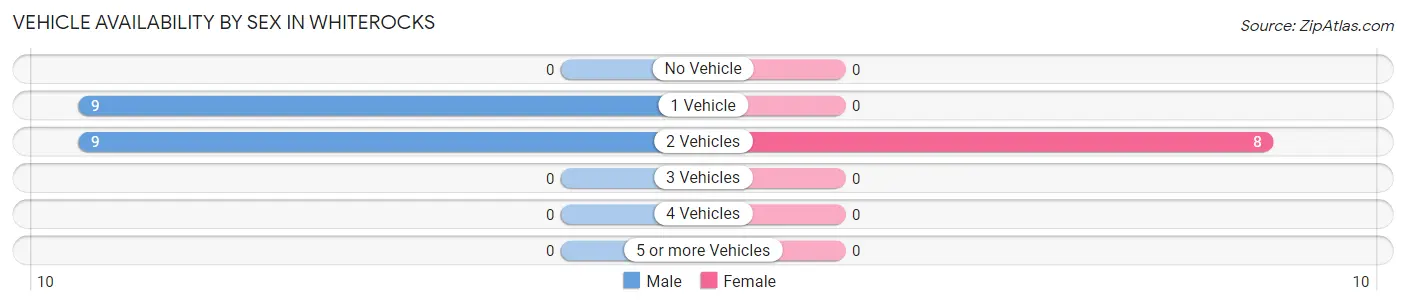
| Vehicles Available | Male | Female |
| No Vehicle | 0 (0.0%) | 0 (0.0%) |
| 1 Vehicle | 9 (50.0%) | 0 (0.0%) |
| 2 Vehicles | 9 (50.0%) | 8 (100.0%) |
| 3 Vehicles | 0 (0.0%) | 0 (0.0%) |
| 4 Vehicles | 0 (0.0%) | 0 (0.0%) |
| 5 or more Vehicles | 0 (0.0%) | 0 (0.0%) |
| Total | 18 (100.0%) | 8 (100.0%) |
Commute Time in Whiterocks
The most frequently occuring commute durations in Whiterocks are 5 to 9 minutes (18 commuters, 69.2%), 45 to 59 minutes (8 commuters, 30.8%), and less than 5 minutes (0 commuters, 0.0%).
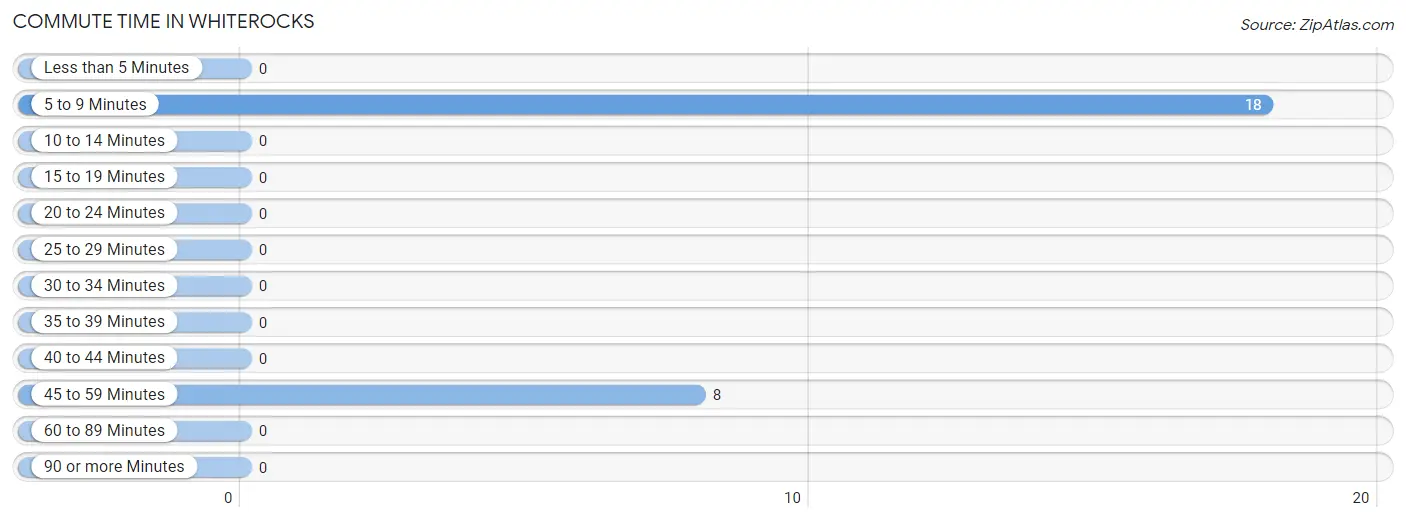
| Commute Time | # Commuters | % Commuters |
| Less than 5 Minutes | 0 | 0.0% |
| 5 to 9 Minutes | 18 | 69.2% |
| 10 to 14 Minutes | 0 | 0.0% |
| 15 to 19 Minutes | 0 | 0.0% |
| 20 to 24 Minutes | 0 | 0.0% |
| 25 to 29 Minutes | 0 | 0.0% |
| 30 to 34 Minutes | 0 | 0.0% |
| 35 to 39 Minutes | 0 | 0.0% |
| 40 to 44 Minutes | 0 | 0.0% |
| 45 to 59 Minutes | 8 | 30.8% |
| 60 to 89 Minutes | 0 | 0.0% |
| 90 or more Minutes | 0 | 0.0% |
Commute Time by Sex in Whiterocks
The most common commute times in Whiterocks are 5 to 9 minutes (18 commuters, 100.0%) for males and 45 to 59 minutes (8 commuters, 100.0%) for females.
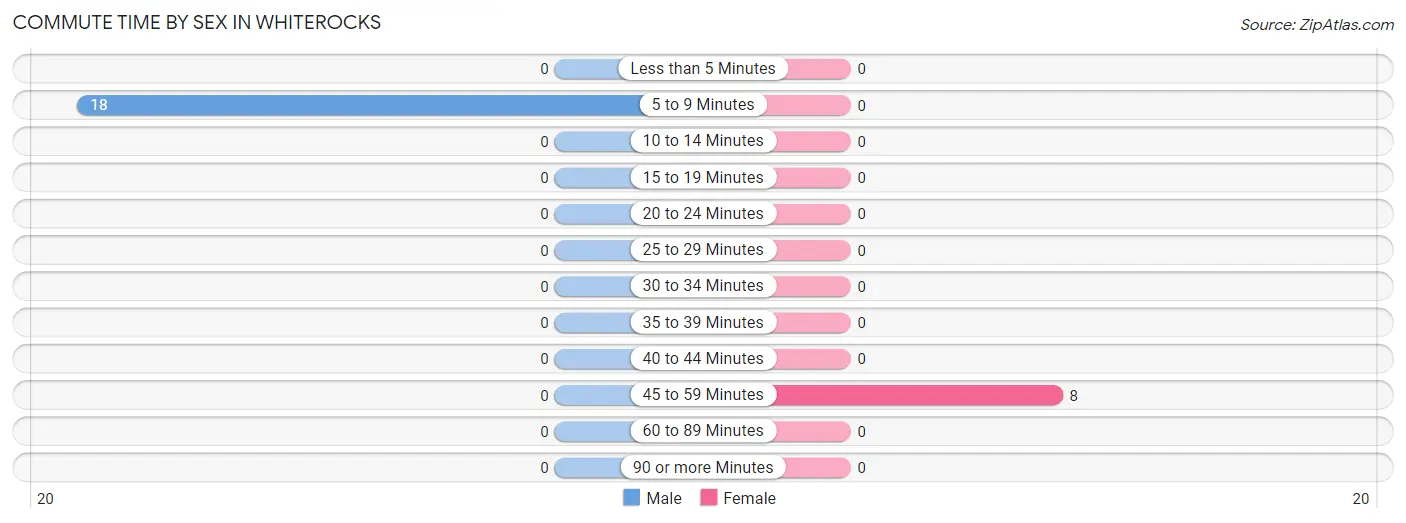
| Commute Time | Male | Female |
| Less than 5 Minutes | 0 (0.0%) | 0 (0.0%) |
| 5 to 9 Minutes | 18 (100.0%) | 0 (0.0%) |
| 10 to 14 Minutes | 0 (0.0%) | 0 (0.0%) |
| 15 to 19 Minutes | 0 (0.0%) | 0 (0.0%) |
| 20 to 24 Minutes | 0 (0.0%) | 0 (0.0%) |
| 25 to 29 Minutes | 0 (0.0%) | 0 (0.0%) |
| 30 to 34 Minutes | 0 (0.0%) | 0 (0.0%) |
| 35 to 39 Minutes | 0 (0.0%) | 0 (0.0%) |
| 40 to 44 Minutes | 0 (0.0%) | 0 (0.0%) |
| 45 to 59 Minutes | 0 (0.0%) | 8 (100.0%) |
| 60 to 89 Minutes | 0 (0.0%) | 0 (0.0%) |
| 90 or more Minutes | 0 (0.0%) | 0 (0.0%) |
Time of Departure to Work by Sex in Whiterocks
The most frequent times of departure to work in Whiterocks are 7:30 AM to 7:59 AM (18, 100.0%) for males and 8:00 AM to 8:29 AM (8, 100.0%) for females.
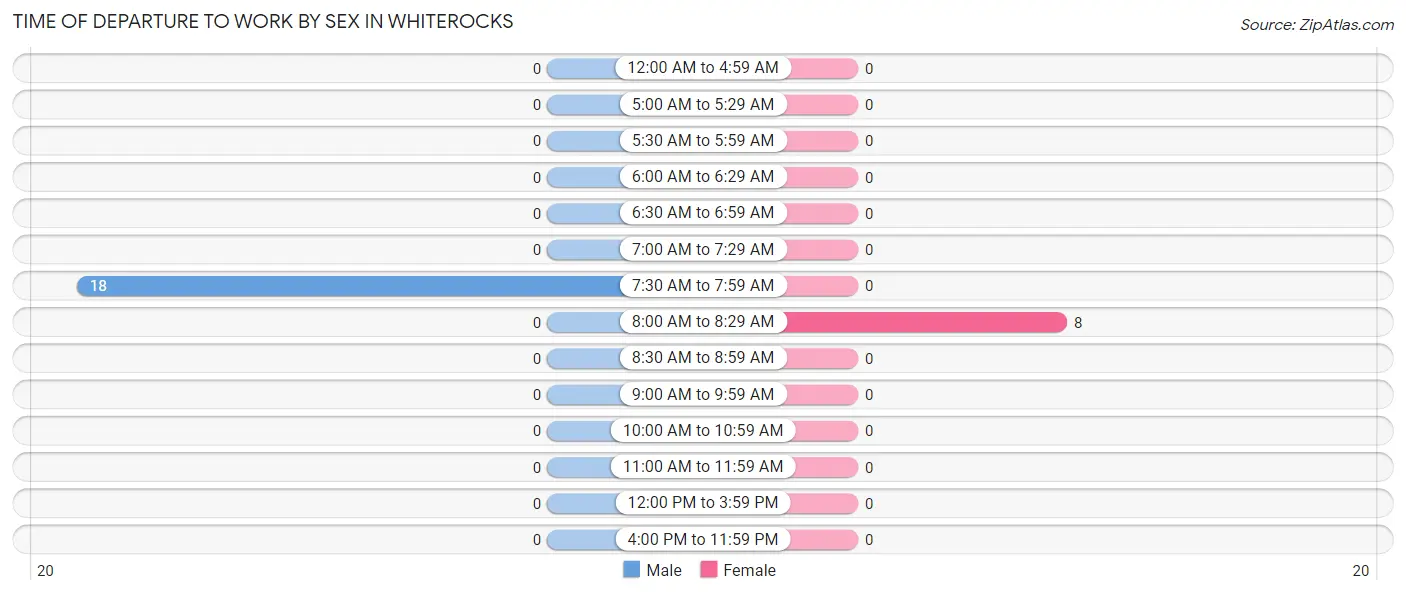
| Time of Departure | Male | Female |
| 12:00 AM to 4:59 AM | 0 (0.0%) | 0 (0.0%) |
| 5:00 AM to 5:29 AM | 0 (0.0%) | 0 (0.0%) |
| 5:30 AM to 5:59 AM | 0 (0.0%) | 0 (0.0%) |
| 6:00 AM to 6:29 AM | 0 (0.0%) | 0 (0.0%) |
| 6:30 AM to 6:59 AM | 0 (0.0%) | 0 (0.0%) |
| 7:00 AM to 7:29 AM | 0 (0.0%) | 0 (0.0%) |
| 7:30 AM to 7:59 AM | 18 (100.0%) | 0 (0.0%) |
| 8:00 AM to 8:29 AM | 0 (0.0%) | 8 (100.0%) |
| 8:30 AM to 8:59 AM | 0 (0.0%) | 0 (0.0%) |
| 9:00 AM to 9:59 AM | 0 (0.0%) | 0 (0.0%) |
| 10:00 AM to 10:59 AM | 0 (0.0%) | 0 (0.0%) |
| 11:00 AM to 11:59 AM | 0 (0.0%) | 0 (0.0%) |
| 12:00 PM to 3:59 PM | 0 (0.0%) | 0 (0.0%) |
| 4:00 PM to 11:59 PM | 0 (0.0%) | 0 (0.0%) |
| Total | 18 (100.0%) | 8 (100.0%) |
Housing Occupancy in Whiterocks
Occupancy by Ownership in Whiterocks
Of the total 41 dwellings in Whiterocks, owner-occupied units account for 11 (26.8%), while renter-occupied units make up 30 (73.2%).
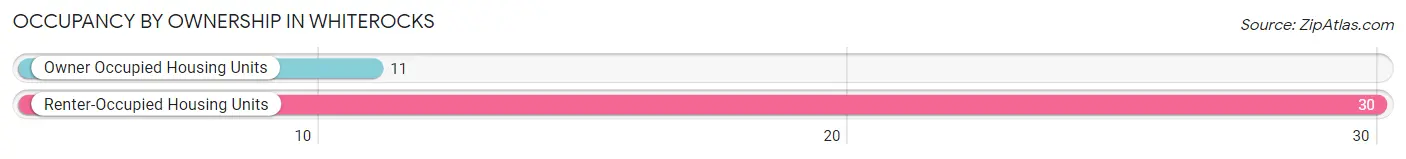
| Occupancy | # Housing Units | % Housing Units |
| Owner Occupied Housing Units | 11 | 26.8% |
| Renter-Occupied Housing Units | 30 | 73.2% |
| Total Occupied Housing Units | 41 | 100.0% |
Occupancy by Household Size in Whiterocks
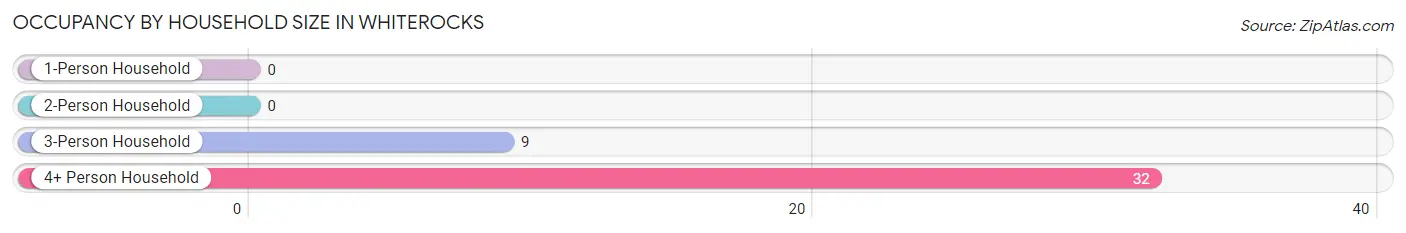
| Household Size | # Housing Units | % Housing Units |
| 1-Person Household | 0 | 0.0% |
| 2-Person Household | 0 | 0.0% |
| 3-Person Household | 9 | 22.0% |
| 4+ Person Household | 32 | 78.0% |
| Total Housing Units | 41 | 100.0% |
Occupancy by Ownership by Household Size in Whiterocks
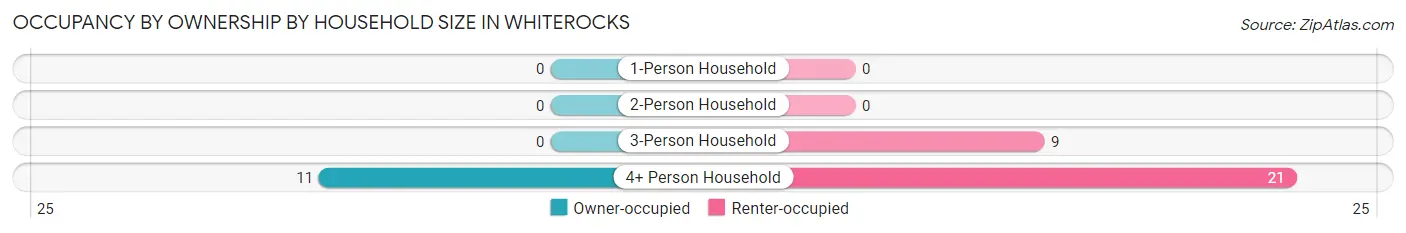
| Household Size | Owner-occupied | Renter-occupied |
| 1-Person Household | 0 (0.0%) | 0 (0.0%) |
| 2-Person Household | 0 (0.0%) | 0 (0.0%) |
| 3-Person Household | 0 (0.0%) | 9 (100.0%) |
| 4+ Person Household | 11 (34.4%) | 21 (65.6%) |
| Total Housing Units | 11 (26.8%) | 30 (73.2%) |
Occupancy by Educational Attainment in Whiterocks
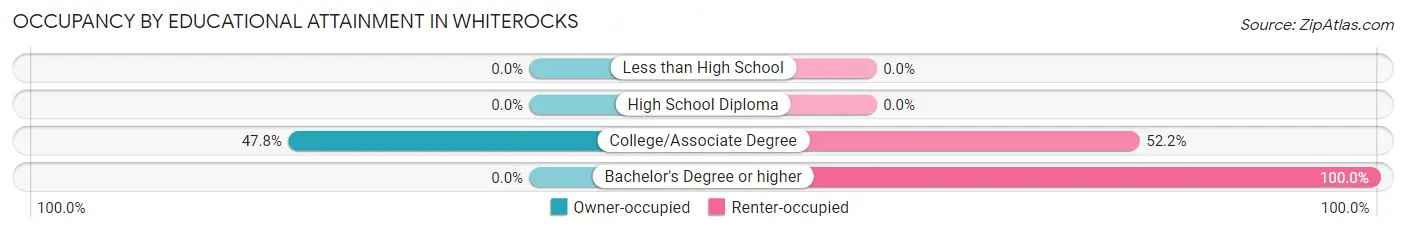
| Household Size | Owner-occupied | Renter-occupied |
| Less than High School | 0 (0.0%) | 0 (0.0%) |
| High School Diploma | 0 (0.0%) | 0 (0.0%) |
| College/Associate Degree | 11 (47.8%) | 12 (52.2%) |
| Bachelor's Degree or higher | 0 (0.0%) | 18 (100.0%) |
Occupancy by Age of Householder in Whiterocks
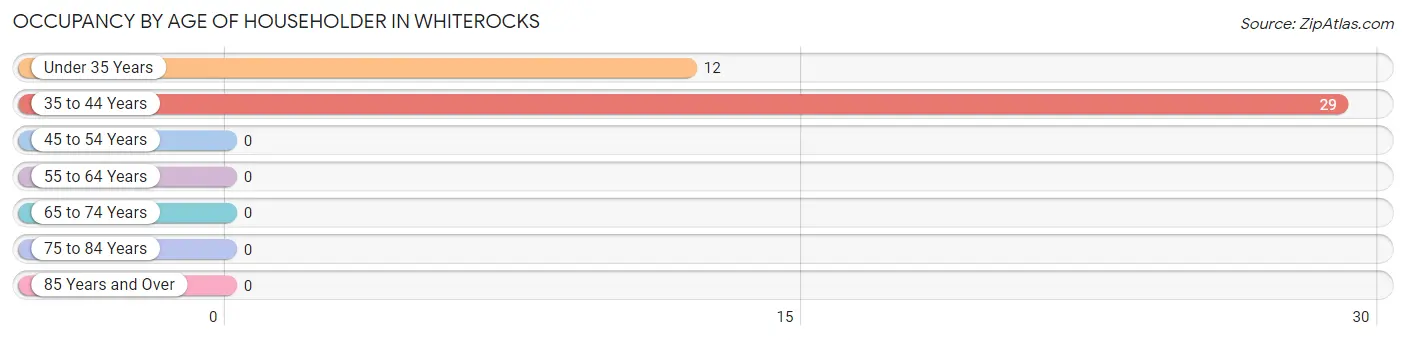
| Age Bracket | # Households | % Households |
| Under 35 Years | 12 | 29.3% |
| 35 to 44 Years | 29 | 70.7% |
| 45 to 54 Years | 0 | 0.0% |
| 55 to 64 Years | 0 | 0.0% |
| 65 to 74 Years | 0 | 0.0% |
| 75 to 84 Years | 0 | 0.0% |
| 85 Years and Over | 0 | 0.0% |
| Total | 41 | 100.0% |
Housing Finances in Whiterocks
Median Income by Occupancy in Whiterocks
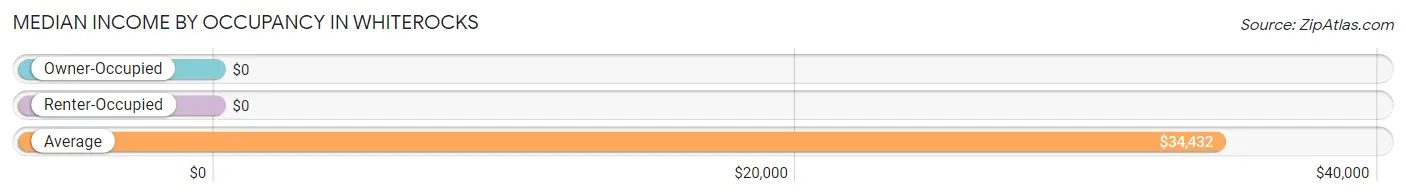
| Occupancy Type | # Households | Median Income |
| Owner-Occupied | 11 (26.8%) | $0 |
| Renter-Occupied | 30 (73.2%) | $0 |
| Average | 41 (100.0%) | $34,432 |
Occupancy by Householder Income Bracket in Whiterocks
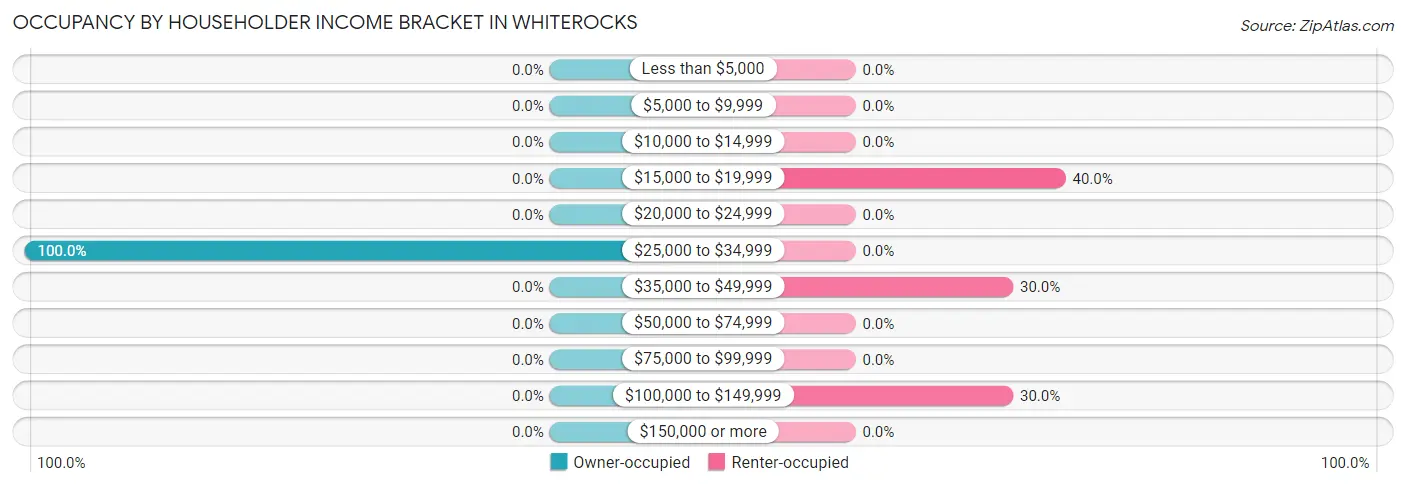
| Income Bracket | Owner-occupied | Renter-occupied |
| Less than $5,000 | 0 (0.0%) | 0 (0.0%) |
| $5,000 to $9,999 | 0 (0.0%) | 0 (0.0%) |
| $10,000 to $14,999 | 0 (0.0%) | 0 (0.0%) |
| $15,000 to $19,999 | 0 (0.0%) | 12 (40.0%) |
| $20,000 to $24,999 | 0 (0.0%) | 0 (0.0%) |
| $25,000 to $34,999 | 11 (100.0%) | 0 (0.0%) |
| $35,000 to $49,999 | 0 (0.0%) | 9 (30.0%) |
| $50,000 to $74,999 | 0 (0.0%) | 0 (0.0%) |
| $75,000 to $99,999 | 0 (0.0%) | 0 (0.0%) |
| $100,000 to $149,999 | 0 (0.0%) | 9 (30.0%) |
| $150,000 or more | 0 (0.0%) | 0 (0.0%) |
| Total | 11 (100.0%) | 30 (100.0%) |
Monthly Housing Cost Tiers in Whiterocks
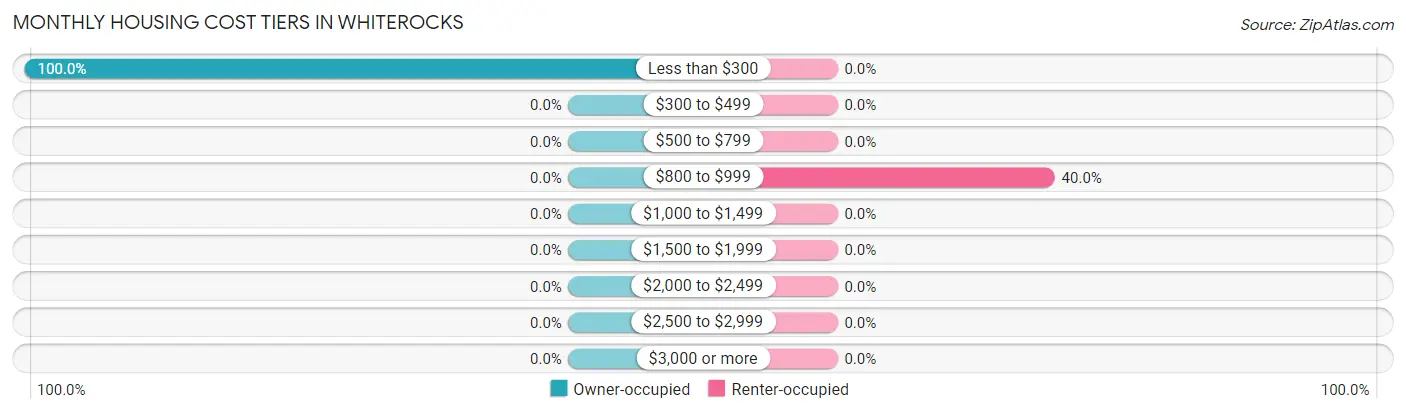
| Monthly Cost | Owner-occupied | Renter-occupied |
| Less than $300 | 11 (100.0%) | 0 (0.0%) |
| $300 to $499 | 0 (0.0%) | 0 (0.0%) |
| $500 to $799 | 0 (0.0%) | 0 (0.0%) |
| $800 to $999 | 0 (0.0%) | 12 (40.0%) |
| $1,000 to $1,499 | 0 (0.0%) | 0 (0.0%) |
| $1,500 to $1,999 | 0 (0.0%) | 0 (0.0%) |
| $2,000 to $2,499 | 0 (0.0%) | 0 (0.0%) |
| $2,500 to $2,999 | 0 (0.0%) | 0 (0.0%) |
| $3,000 or more | 0 (0.0%) | 0 (0.0%) |
| Total | 11 (100.0%) | 30 (100.0%) |
Physical Housing Characteristics in Whiterocks
Housing Structures in Whiterocks
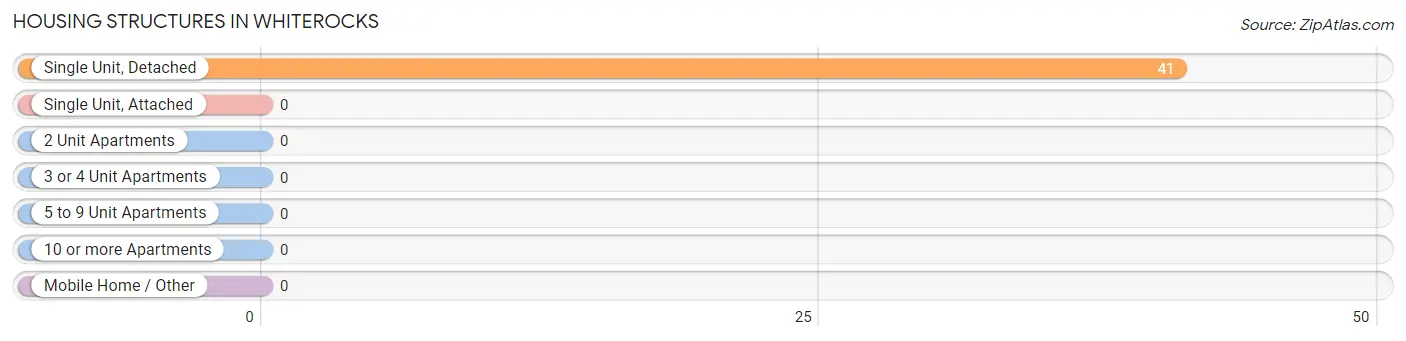
| Structure Type | # Housing Units | % Housing Units |
| Single Unit, Detached | 41 | 100.0% |
| Single Unit, Attached | 0 | 0.0% |
| 2 Unit Apartments | 0 | 0.0% |
| 3 or 4 Unit Apartments | 0 | 0.0% |
| 5 to 9 Unit Apartments | 0 | 0.0% |
| 10 or more Apartments | 0 | 0.0% |
| Mobile Home / Other | 0 | 0.0% |
| Total | 41 | 100.0% |
Housing Structures by Occupancy in Whiterocks
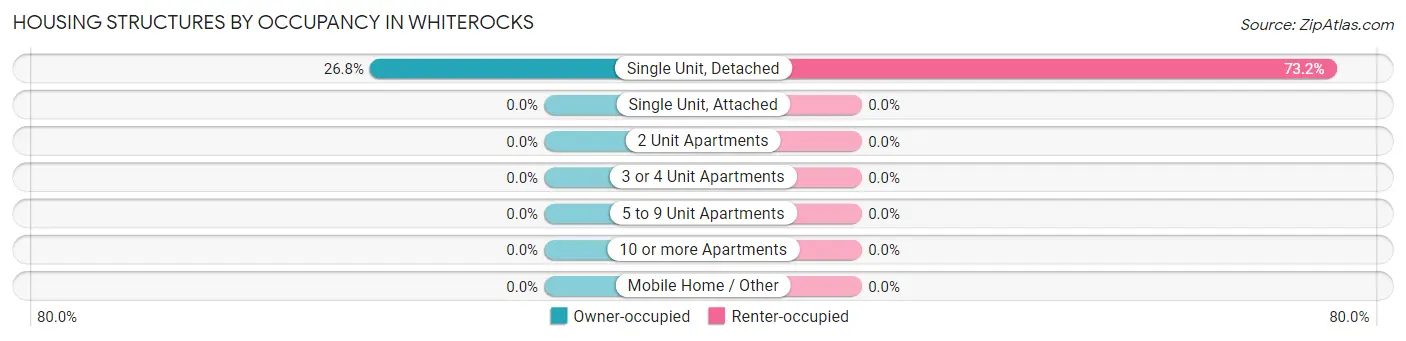
| Structure Type | Owner-occupied | Renter-occupied |
| Single Unit, Detached | 11 (26.8%) | 30 (73.2%) |
| Single Unit, Attached | 0 (0.0%) | 0 (0.0%) |
| 2 Unit Apartments | 0 (0.0%) | 0 (0.0%) |
| 3 or 4 Unit Apartments | 0 (0.0%) | 0 (0.0%) |
| 5 to 9 Unit Apartments | 0 (0.0%) | 0 (0.0%) |
| 10 or more Apartments | 0 (0.0%) | 0 (0.0%) |
| Mobile Home / Other | 0 (0.0%) | 0 (0.0%) |
| Total | 11 (26.8%) | 30 (73.2%) |
Housing Structures by Number of Rooms in Whiterocks
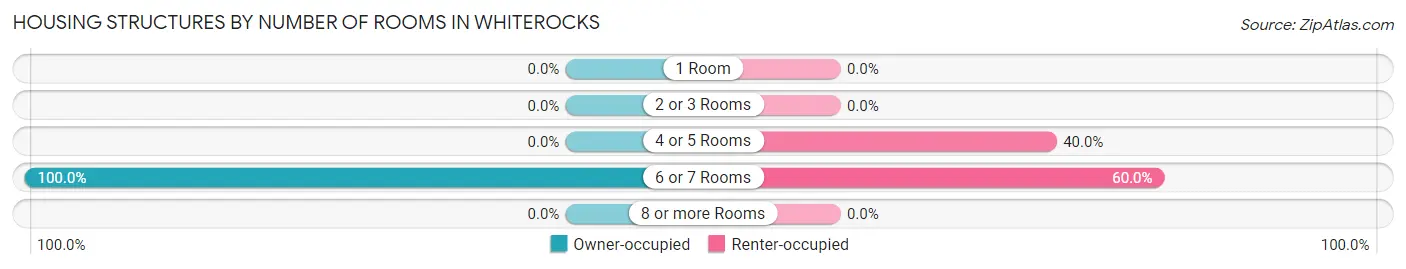
| Number of Rooms | Owner-occupied | Renter-occupied |
| 1 Room | 0 (0.0%) | 0 (0.0%) |
| 2 or 3 Rooms | 0 (0.0%) | 0 (0.0%) |
| 4 or 5 Rooms | 0 (0.0%) | 12 (40.0%) |
| 6 or 7 Rooms | 11 (100.0%) | 18 (60.0%) |
| 8 or more Rooms | 0 (0.0%) | 0 (0.0%) |
| Total | 11 (100.0%) | 30 (100.0%) |
Housing Structure by Heating Type in Whiterocks
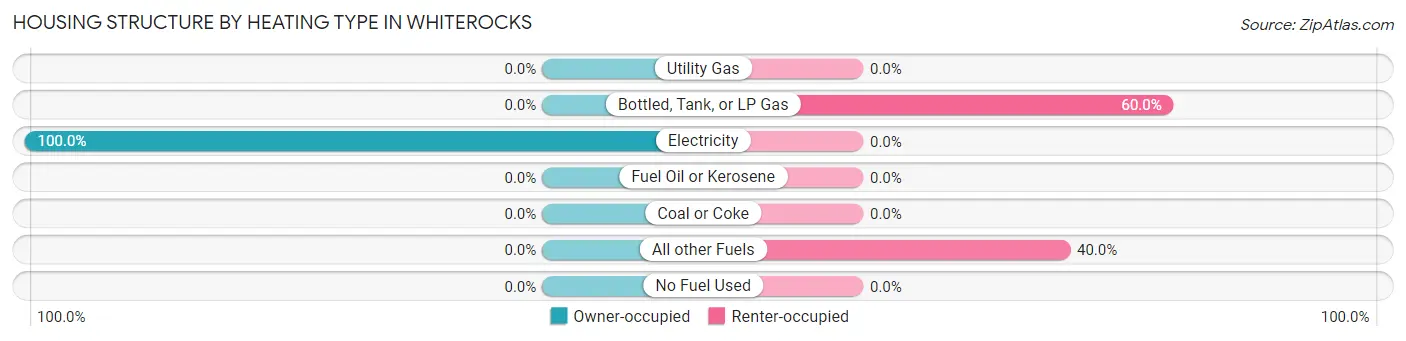
| Heating Type | Owner-occupied | Renter-occupied |
| Utility Gas | 0 (0.0%) | 0 (0.0%) |
| Bottled, Tank, or LP Gas | 0 (0.0%) | 18 (60.0%) |
| Electricity | 11 (100.0%) | 0 (0.0%) |
| Fuel Oil or Kerosene | 0 (0.0%) | 0 (0.0%) |
| Coal or Coke | 0 (0.0%) | 0 (0.0%) |
| All other Fuels | 0 (0.0%) | 12 (40.0%) |
| No Fuel Used | 0 (0.0%) | 0 (0.0%) |
| Total | 11 (100.0%) | 30 (100.0%) |
Household Vehicle Usage in Whiterocks
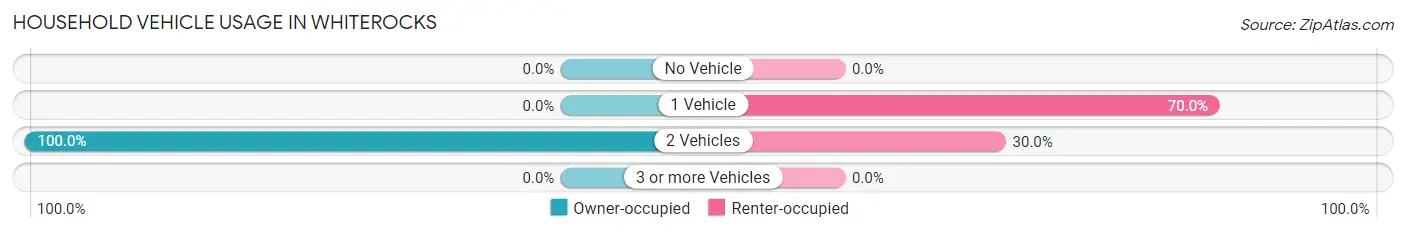
| Vehicles per Household | Owner-occupied | Renter-occupied |
| No Vehicle | 0 (0.0%) | 0 (0.0%) |
| 1 Vehicle | 0 (0.0%) | 21 (70.0%) |
| 2 Vehicles | 11 (100.0%) | 9 (30.0%) |
| 3 or more Vehicles | 0 (0.0%) | 0 (0.0%) |
| Total | 11 (100.0%) | 30 (100.0%) |
Real Estate & Mortgages in Whiterocks
Real Estate and Mortgage Overview in Whiterocks
| Characteristic | Without Mortgage | With Mortgage |
| Housing Units | 11 | 0 |
| Median Property Value | - | - |
| Median Household Income | - | - |
| Monthly Housing Costs | - | - |
| Real Estate Taxes | - | - |
Property Value by Mortgage Status in Whiterocks
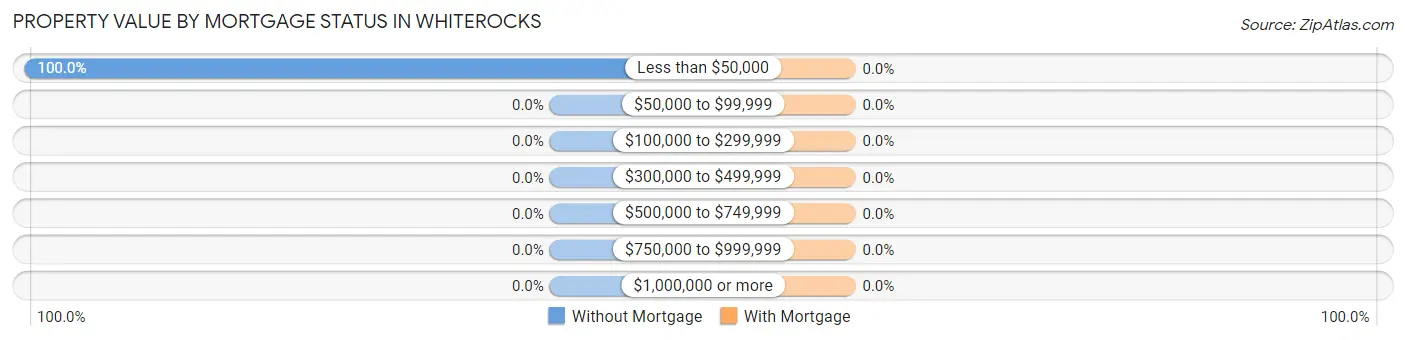
| Property Value | Without Mortgage | With Mortgage |
| Less than $50,000 | 11 (100.0%) | 0 (0.0%) |
| $50,000 to $99,999 | 0 (0.0%) | 0 (0.0%) |
| $100,000 to $299,999 | 0 (0.0%) | 0 (0.0%) |
| $300,000 to $499,999 | 0 (0.0%) | 0 (0.0%) |
| $500,000 to $749,999 | 0 (0.0%) | 0 (0.0%) |
| $750,000 to $999,999 | 0 (0.0%) | 0 (0.0%) |
| $1,000,000 or more | 0 (0.0%) | 0 (0.0%) |
| Total | 11 (100.0%) | 0 (0.0%) |
Household Income by Mortgage Status in Whiterocks
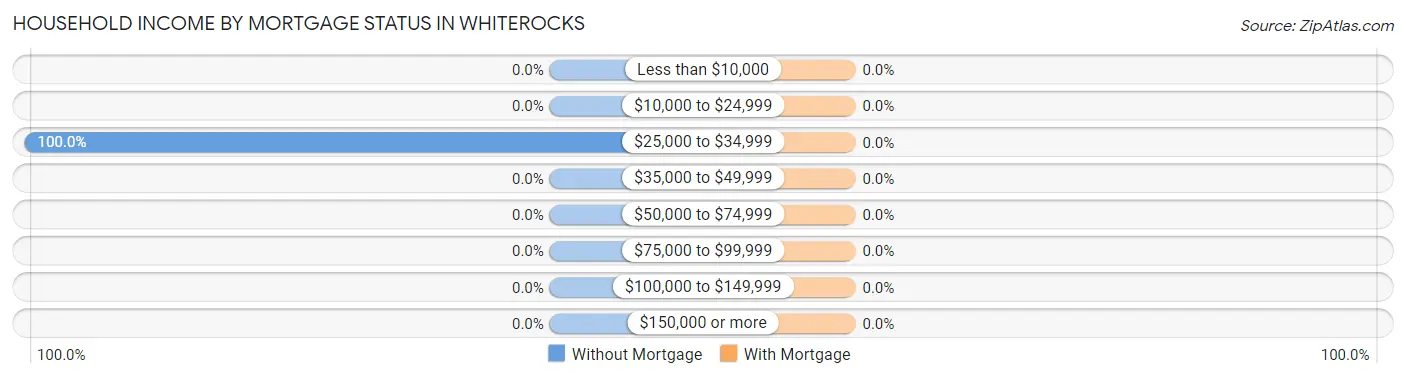
| Household Income | Without Mortgage | With Mortgage |
| Less than $10,000 | 0 (0.0%) | 0 (0.0%) |
| $10,000 to $24,999 | 0 (0.0%) | 0 (0.0%) |
| $25,000 to $34,999 | 11 (100.0%) | 0 (0.0%) |
| $35,000 to $49,999 | 0 (0.0%) | 0 (0.0%) |
| $50,000 to $74,999 | 0 (0.0%) | 0 (0.0%) |
| $75,000 to $99,999 | 0 (0.0%) | 0 (0.0%) |
| $100,000 to $149,999 | 0 (0.0%) | 0 (0.0%) |
| $150,000 or more | 0 (0.0%) | 0 (0.0%) |
| Total | 11 (100.0%) | 0 (0.0%) |
Property Value to Household Income Ratio in Whiterocks
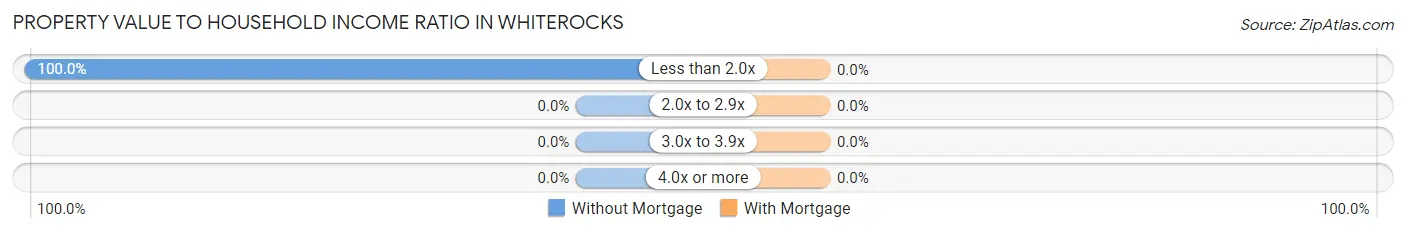
| Value-to-Income Ratio | Without Mortgage | With Mortgage |
| Less than 2.0x | 11 (100.0%) | 0 (0.0%) |
| 2.0x to 2.9x | 0 (0.0%) | 0 (0.0%) |
| 3.0x to 3.9x | 0 (0.0%) | 0 (0.0%) |
| 4.0x or more | 0 (0.0%) | 0 (0.0%) |
| Total | 11 (100.0%) | 0 (0.0%) |
Real Estate Taxes by Mortgage Status in Whiterocks
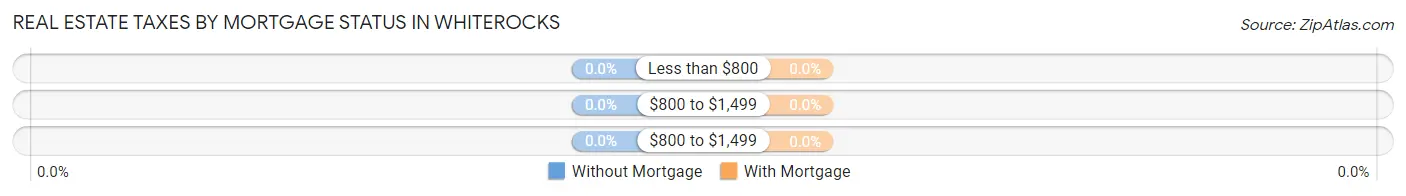
| Property Taxes | Without Mortgage | With Mortgage |
| Less than $800 | 0 (0.0%) | 0 (0.0%) |
| $800 to $1,499 | 0 (0.0%) | 0 (0.0%) |
| $800 to $1,499 | 0 (0.0%) | 0 (0.0%) |
| Total | 11 (100.0%) | 0 (0.0%) |
Health & Disability in Whiterocks
Health Insurance Coverage by Age in Whiterocks
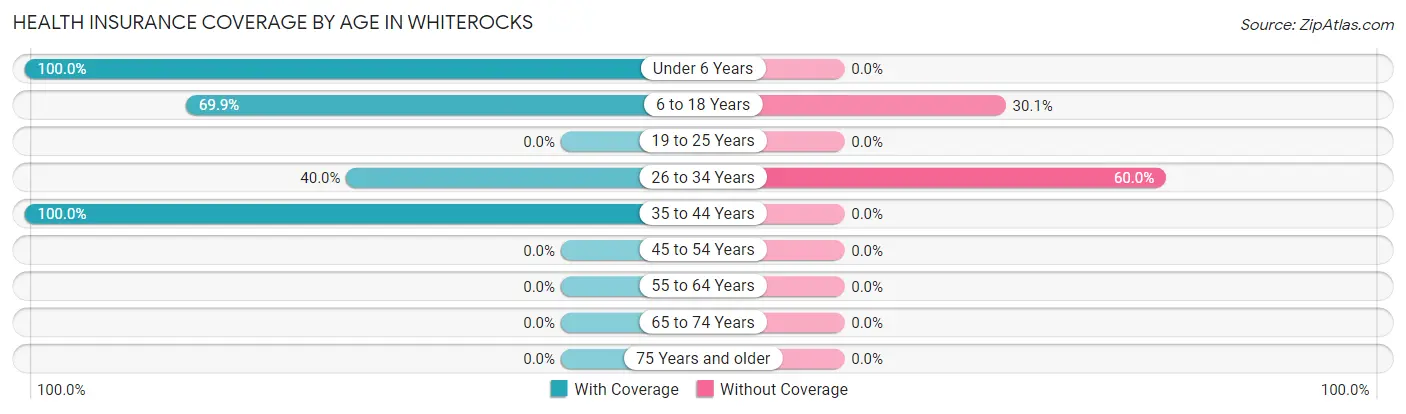
| Age Bracket | With Coverage | Without Coverage |
| Under 6 Years | 13 (100.0%) | 0 (0.0%) |
| 6 to 18 Years | 79 (69.9%) | 34 (30.1%) |
| 19 to 25 Years | 0 (0.0%) | 0 (0.0%) |
| 26 to 34 Years | 8 (40.0%) | 12 (60.0%) |
| 35 to 44 Years | 45 (100.0%) | 0 (0.0%) |
| 45 to 54 Years | 0 (0.0%) | 0 (0.0%) |
| 55 to 64 Years | 0 (0.0%) | 0 (0.0%) |
| 65 to 74 Years | 0 (0.0%) | 0 (0.0%) |
| 75 Years and older | 0 (0.0%) | 0 (0.0%) |
| Total | 145 (75.9%) | 46 (24.1%) |
Health Insurance Coverage by Citizenship Status in Whiterocks
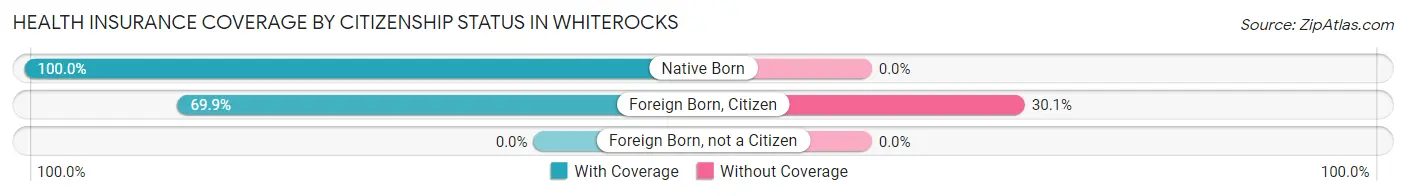
| Citizenship Status | With Coverage | Without Coverage |
| Native Born | 13 (100.0%) | 0 (0.0%) |
| Foreign Born, Citizen | 79 (69.9%) | 34 (30.1%) |
| Foreign Born, not a Citizen | 0 (0.0%) | 0 (0.0%) |
Health Insurance Coverage by Household Income in Whiterocks
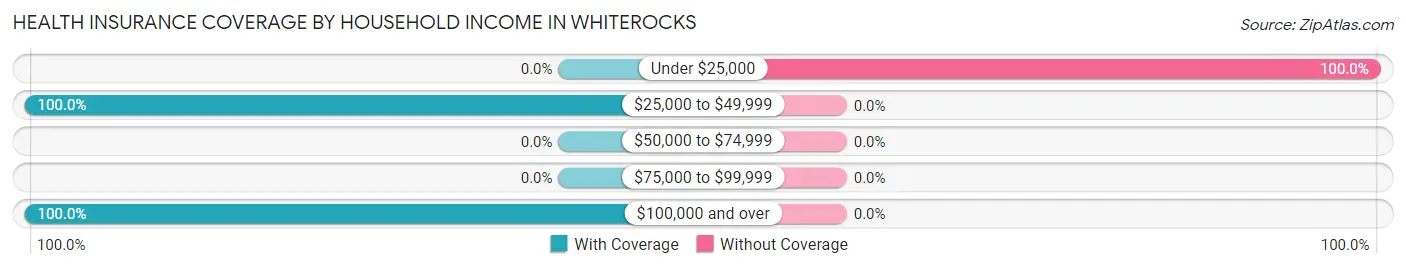
| Household Income | With Coverage | Without Coverage |
| Under $25,000 | 0 (0.0%) | 46 (100.0%) |
| $25,000 to $49,999 | 122 (100.0%) | 0 (0.0%) |
| $50,000 to $74,999 | 0 (0.0%) | 0 (0.0%) |
| $75,000 to $99,999 | 0 (0.0%) | 0 (0.0%) |
| $100,000 and over | 23 (100.0%) | 0 (0.0%) |
Public vs Private Health Insurance Coverage by Age in Whiterocks
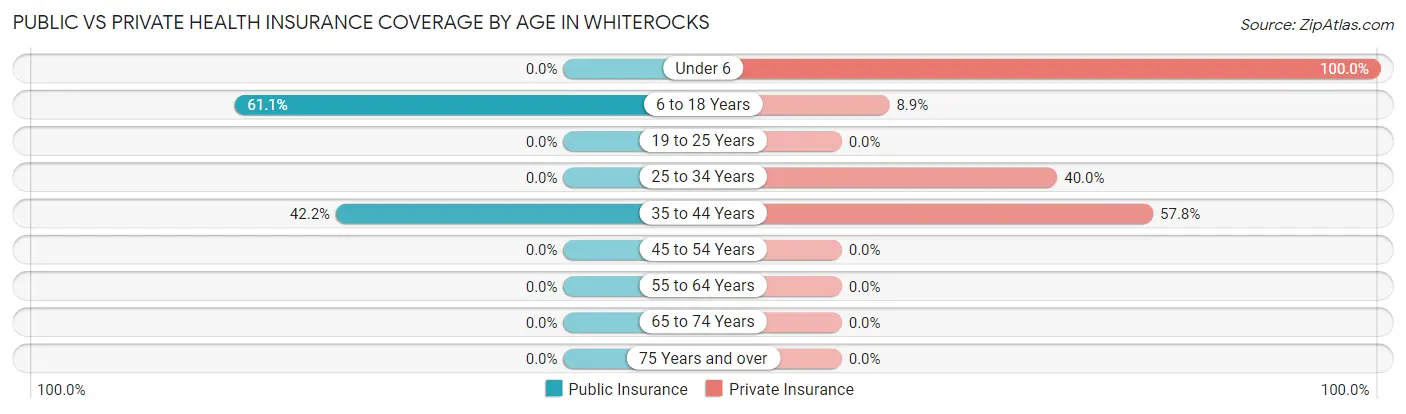
| Age Bracket | Public Insurance | Private Insurance |
| Under 6 | 0 (0.0%) | 13 (100.0%) |
| 6 to 18 Years | 69 (61.1%) | 10 (8.8%) |
| 19 to 25 Years | 0 (0.0%) | 0 (0.0%) |
| 25 to 34 Years | 0 (0.0%) | 8 (40.0%) |
| 35 to 44 Years | 19 (42.2%) | 26 (57.8%) |
| 45 to 54 Years | 0 (0.0%) | 0 (0.0%) |
| 55 to 64 Years | 0 (0.0%) | 0 (0.0%) |
| 65 to 74 Years | 0 (0.0%) | 0 (0.0%) |
| 75 Years and over | 0 (0.0%) | 0 (0.0%) |
| Total | 88 (46.1%) | 57 (29.8%) |
Disability Status by Sex by Age in Whiterocks
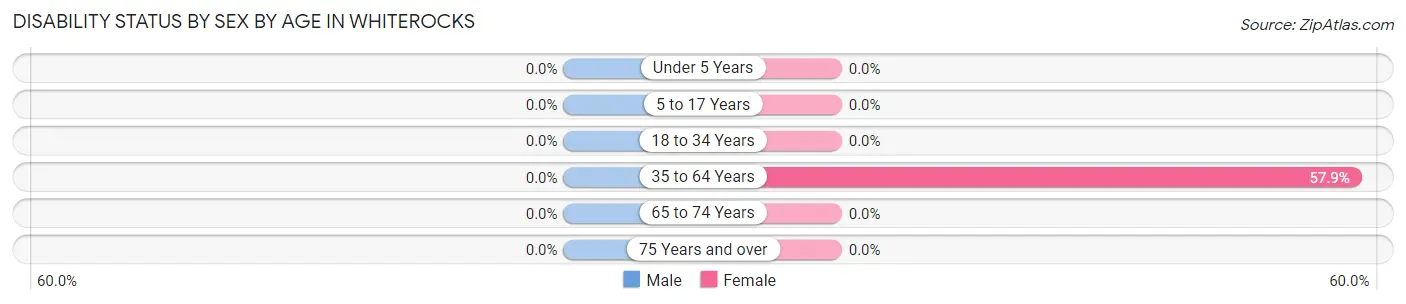
| Age Bracket | Male | Female |
| Under 5 Years | 0 (0.0%) | 0 (0.0%) |
| 5 to 17 Years | 0 (0.0%) | 0 (0.0%) |
| 18 to 34 Years | 0 (0.0%) | 0 (0.0%) |
| 35 to 64 Years | 0 (0.0%) | 11 (57.9%) |
| 65 to 74 Years | 0 (0.0%) | 0 (0.0%) |
| 75 Years and over | 0 (0.0%) | 0 (0.0%) |
Disability Class by Sex by Age in Whiterocks
Disability Class: Hearing Difficulty
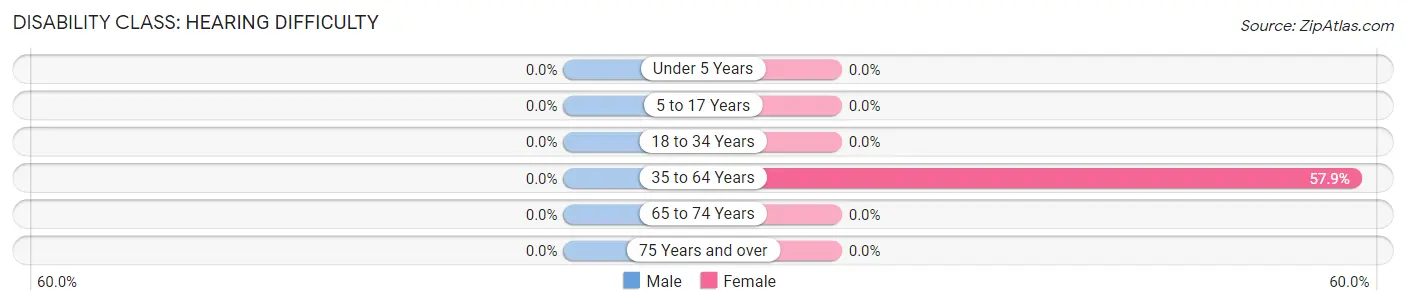
| Age Bracket | Male | Female |
| Under 5 Years | 0 (0.0%) | 0 (0.0%) |
| 5 to 17 Years | 0 (0.0%) | 0 (0.0%) |
| 18 to 34 Years | 0 (0.0%) | 0 (0.0%) |
| 35 to 64 Years | 0 (0.0%) | 11 (57.9%) |
| 65 to 74 Years | 0 (0.0%) | 0 (0.0%) |
| 75 Years and over | 0 (0.0%) | 0 (0.0%) |
Disability Class: Vision Difficulty
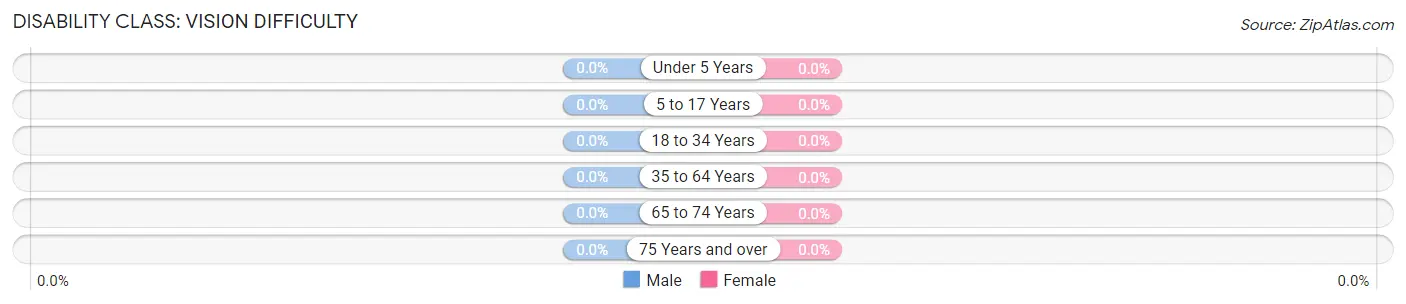
| Age Bracket | Male | Female |
| Under 5 Years | 0 (0.0%) | 0 (0.0%) |
| 5 to 17 Years | 0 (0.0%) | 0 (0.0%) |
| 18 to 34 Years | 0 (0.0%) | 0 (0.0%) |
| 35 to 64 Years | 0 (0.0%) | 0 (0.0%) |
| 65 to 74 Years | 0 (0.0%) | 0 (0.0%) |
| 75 Years and over | 0 (0.0%) | 0 (0.0%) |
Disability Class: Cognitive Difficulty
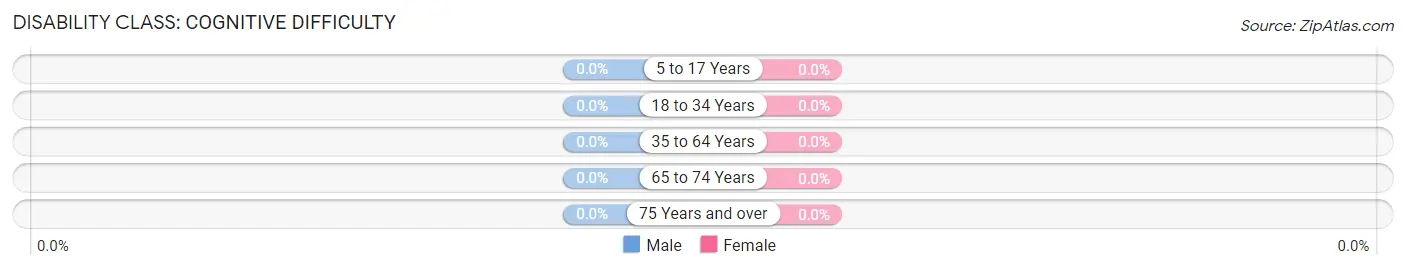
| Age Bracket | Male | Female |
| 5 to 17 Years | 0 (0.0%) | 0 (0.0%) |
| 18 to 34 Years | 0 (0.0%) | 0 (0.0%) |
| 35 to 64 Years | 0 (0.0%) | 0 (0.0%) |
| 65 to 74 Years | 0 (0.0%) | 0 (0.0%) |
| 75 Years and over | 0 (0.0%) | 0 (0.0%) |
Disability Class: Ambulatory Difficulty
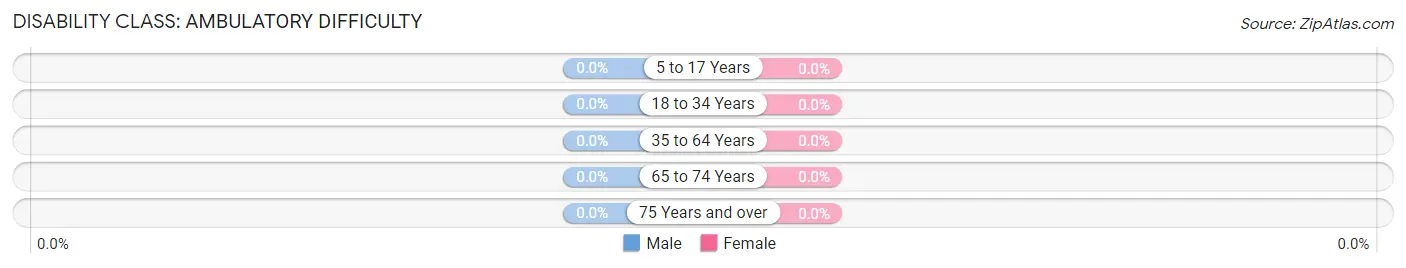
| Age Bracket | Male | Female |
| 5 to 17 Years | 0 (0.0%) | 0 (0.0%) |
| 18 to 34 Years | 0 (0.0%) | 0 (0.0%) |
| 35 to 64 Years | 0 (0.0%) | 0 (0.0%) |
| 65 to 74 Years | 0 (0.0%) | 0 (0.0%) |
| 75 Years and over | 0 (0.0%) | 0 (0.0%) |
Disability Class: Self-Care Difficulty
| Age Bracket | Male | Female |
| 5 to 17 Years | 0 (0.0%) | 0 (0.0%) |
| 18 to 34 Years | 0 (0.0%) | 0 (0.0%) |
| 35 to 64 Years | 0 (0.0%) | 0 (0.0%) |
| 65 to 74 Years | 0 (0.0%) | 0 (0.0%) |
| 75 Years and over | 0 (0.0%) | 0 (0.0%) |
Technology Access in Whiterocks
Computing Device Access in Whiterocks
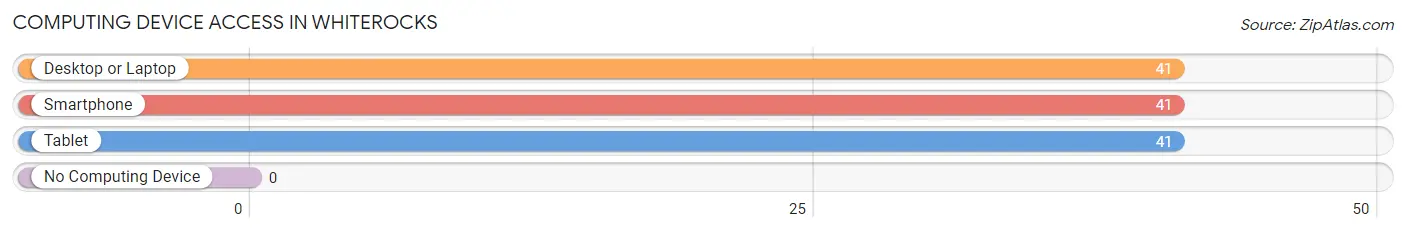
| Device Type | # Households | % Households |
| Desktop or Laptop | 41 | 100.0% |
| Smartphone | 41 | 100.0% |
| Tablet | 41 | 100.0% |
| No Computing Device | 0 | 0.0% |
| Total | 41 | 100.0% |
Internet Access in Whiterocks
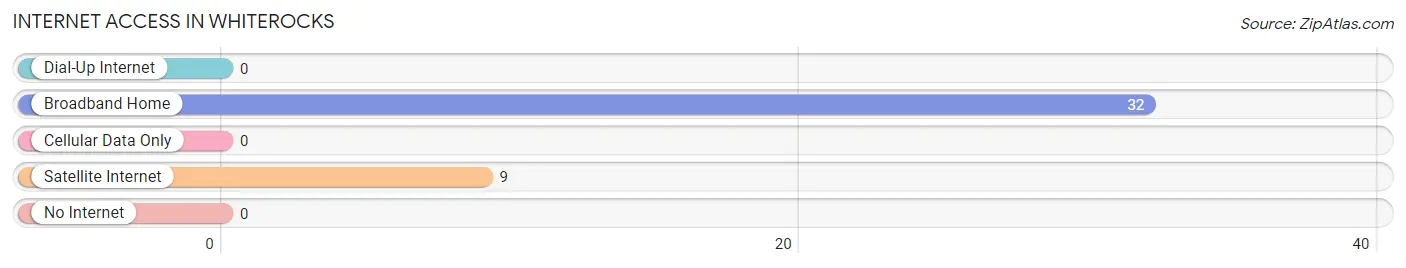
| Internet Type | # Households | % Households |
| Dial-Up Internet | 0 | 0.0% |
| Broadband Home | 32 | 78.0% |
| Cellular Data Only | 0 | 0.0% |
| Satellite Internet | 9 | 22.0% |
| No Internet | 0 | 0.0% |
| Total | 41 | 100.0% |
Whiterocks Summary
Whiterocks is a small unincorporated community located in the Uintah and Ouray Indian Reservation in Uintah County, Utah. It is located in the northeastern corner of the state, approximately 20 miles south of the Wyoming border. The population of Whiterocks was estimated to be around 200 people in 2020.
History
Whiterocks was first settled in the late 1800s by members of the Ute Tribe. The Ute Tribe had been living in the area for centuries prior to the arrival of European settlers. The Ute Tribe was relocated to the Uintah and Ouray Indian Reservation in 1881. The reservation was established by the US government in order to protect the Ute Tribe from further encroachment by settlers.
Whiterocks was officially established in 1883 when the first post office was opened. The town was named after the nearby White Rocks, a large outcropping of white sandstone. The town grew slowly over the years, but remained relatively small.
Geography
Whiterocks is located in the northeastern corner of Utah, approximately 20 miles south of the Wyoming border. The town is situated in the Uintah Basin, a large basin that is surrounded by the Uintah Mountains to the east and the Wasatch Mountains to the west. The town is located at an elevation of 5,400 feet above sea level.
The climate in Whiterocks is semi-arid, with hot summers and cold winters. The average annual temperature is around 50 degrees Fahrenheit. The average annual precipitation is around 10 inches.
Economy
The economy of Whiterocks is largely based on agriculture and tourism. The town is home to several farms that produce hay, alfalfa, and other crops. The town is also home to several tourist attractions, including the White Rocks National Monument, which is a popular destination for hikers and rock climbers.
The town is also home to several small businesses, including a gas station, a grocery store, and a few restaurants. The town is also home to a small casino, which is owned and operated by the Ute Tribe.
Demographics
As of the 2020 census, the population of Whiterocks was estimated to be around 200 people. The racial makeup of the town was 95.5% Native American, 2.5% White, and 2% other. The median household income was $25,000, and the median age was 33.
Whiterocks is a small, rural community with a close-knit population. The town is home to several churches, including the Church of Jesus Christ of Latter-day Saints, the Catholic Church, and the United Methodist Church. The town is also home to a small library and a community center.
Common Questions
What is Per Capita Income in Whiterocks?
Per Capita income in Whiterocks is $9,749.
What is the Median Household income in Whiterocks?
Median Household Income in Whiterocks is $34,432.
What is Inequality or Gini Index in Whiterocks?
Inequality or Gini Index in Whiterocks is 0.39.
What is the Total Population of Whiterocks?
Total Population of Whiterocks is 191.
What is the Total Male Population of Whiterocks?
Total Male Population of Whiterocks is 69.
What is the Total Female Population of Whiterocks?
Total Female Population of Whiterocks is 122.
What is the Ratio of Males per 100 Females in Whiterocks?
There are 56.56 Males per 100 Females in Whiterocks.
What is the Ratio of Females per 100 Males in Whiterocks?
There are 176.81 Females per 100 Males in Whiterocks.
What is the Median Population Age in Whiterocks?
Median Population Age in Whiterocks is 13.0 Years.
What is the Average Family Size in Whiterocks
Average Family Size in Whiterocks is 4.5 People.
What is the Average Household Size in Whiterocks
Average Household Size in Whiterocks is 4.7 People.
How Large is the Labor Force in Whiterocks?
There are 45 People in the Labor Forcein in Whiterocks.
What is the Percentage of People in the Labor Force in Whiterocks?
58.4% of People are in the Labor Force in Whiterocks.
What is the Unemployment Rate in Whiterocks?
Unemployment Rate in Whiterocks is 42.2%.