Goldfield, CO Map & Demographics
Goldfield Map
Goldfield Overview
$31,873
PER CAPITA INCOME
0.29
INEQUALITY / GINI INDEX
166
TOTAL POPULATION
111
MALE POPULATION
55
FEMALE POPULATION
201.82
MALES / 100 FEMALES
49.55
FEMALES / 100 MALES
61.5
MEDIAN AGE
2.7
AVG FAMILY SIZE
1.6
AVG HOUSEHOLD SIZE
149
LABOR FORCE [ PEOPLE ]
89.8%
PERCENT IN LABOR FORCE
Income in Goldfield
Income Overview in Goldfield
| Characteristic | Number | Measure |
| Per Capita Income | 166 | $31,873 |
| Median Family Income | 32 | $0 |
| Mean Family Income | 32 | $0 |
| Median Household Income | 107 | $0 |
| Mean Household Income | 107 | $52,504 |
| Income Deficit | 32 | $0 |
| Wage / Income Gap (%) | 166 | 0.00% |
| Wage / Income Gap ($) | 166 | 100.00¢ per $1 |
| Gini / Inequality Index | 166 | 0.29 |
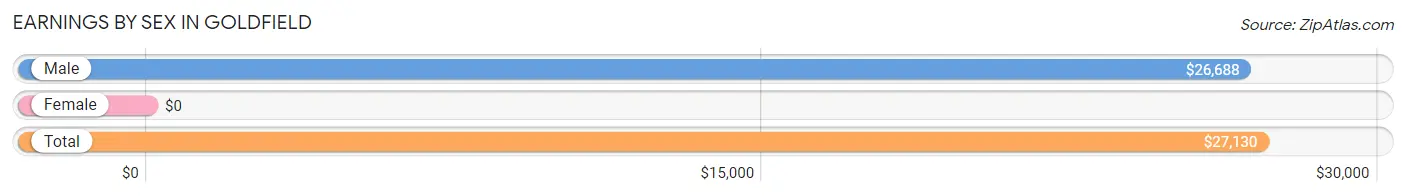
Earnings by Sex in Goldfield
| Sex | Number | Average Earnings |
| Male | 109 (73.2%) | $26,688 |
| Female | 40 (26.9%) | $0 |
| Total | 149 (100.0%) | $27,130 |
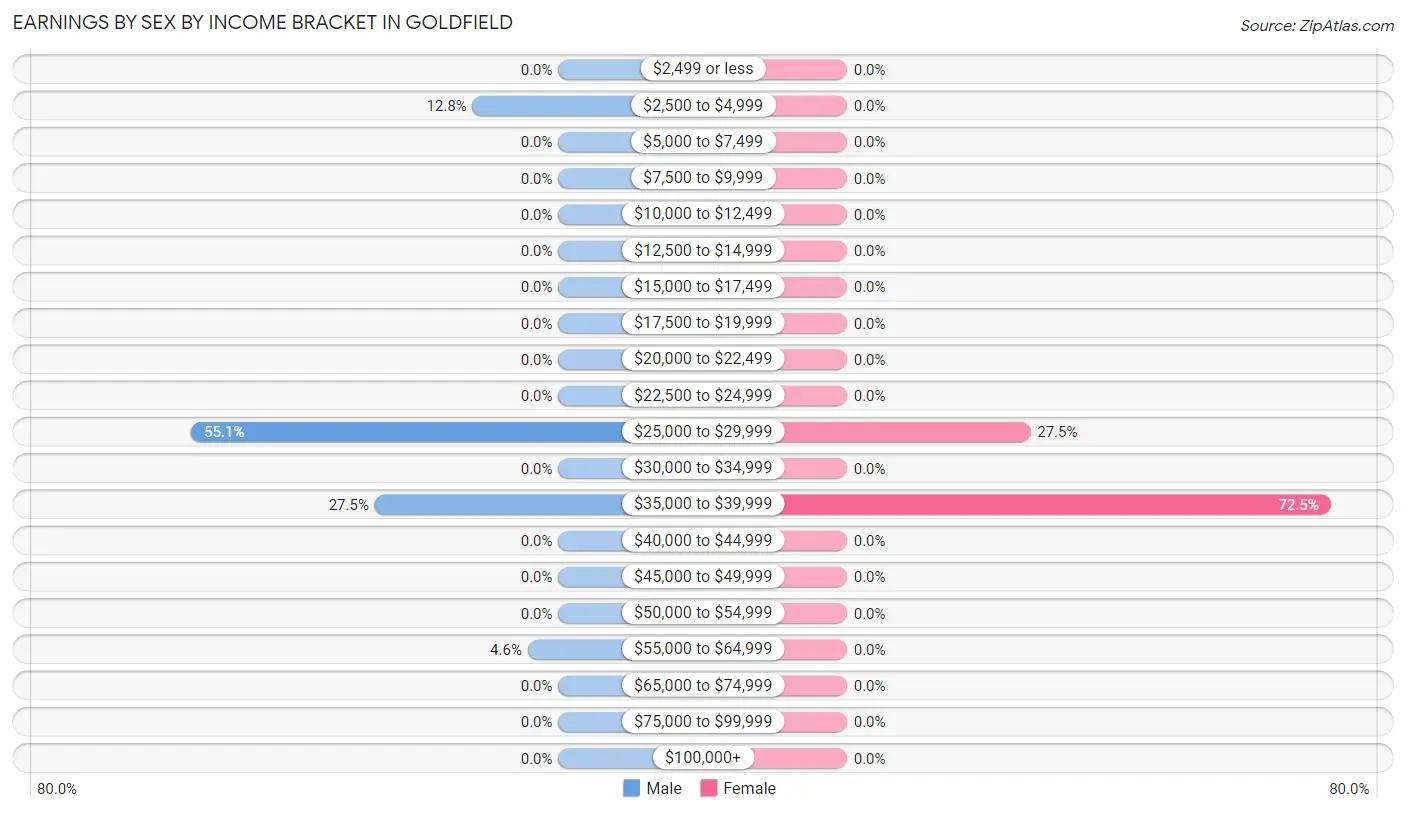
Earnings by Sex by Income Bracket in Goldfield
The most common earnings brackets in Goldfield are $25,000 to $29,999 for men (60 | 55.0%) and $35,000 to $39,999 for women (29 | 72.5%).
| Income | Male | Female |
| $2,499 or less | 0 (0.0%) | 0 (0.0%) |
| $2,500 to $4,999 | 14 (12.8%) | 0 (0.0%) |
| $5,000 to $7,499 | 0 (0.0%) | 0 (0.0%) |
| $7,500 to $9,999 | 0 (0.0%) | 0 (0.0%) |
| $10,000 to $12,499 | 0 (0.0%) | 0 (0.0%) |
| $12,500 to $14,999 | 0 (0.0%) | 0 (0.0%) |
| $15,000 to $17,499 | 0 (0.0%) | 0 (0.0%) |
| $17,500 to $19,999 | 0 (0.0%) | 0 (0.0%) |
| $20,000 to $22,499 | 0 (0.0%) | 0 (0.0%) |
| $22,500 to $24,999 | 0 (0.0%) | 0 (0.0%) |
| $25,000 to $29,999 | 60 (55.0%) | 11 (27.5%) |
| $30,000 to $34,999 | 0 (0.0%) | 0 (0.0%) |
| $35,000 to $39,999 | 30 (27.5%) | 29 (72.5%) |
| $40,000 to $44,999 | 0 (0.0%) | 0 (0.0%) |
| $45,000 to $49,999 | 0 (0.0%) | 0 (0.0%) |
| $50,000 to $54,999 | 0 (0.0%) | 0 (0.0%) |
| $55,000 to $64,999 | 5 (4.6%) | 0 (0.0%) |
| $65,000 to $74,999 | 0 (0.0%) | 0 (0.0%) |
| $75,000 to $99,999 | 0 (0.0%) | 0 (0.0%) |
| $100,000+ | 0 (0.0%) | 0 (0.0%) |
| Total | 109 (100.0%) | 40 (100.0%) |
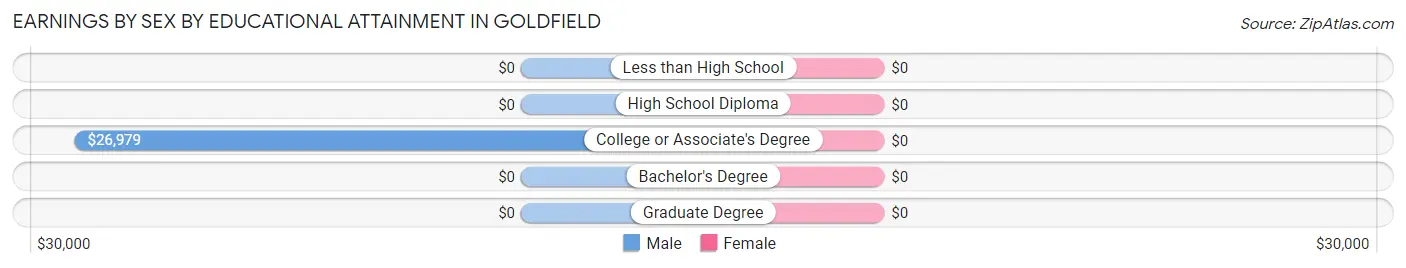
Earnings by Sex by Educational Attainment in Goldfield
| Educational Attainment | Male Income | Female Income |
| Less than High School | - | - |
| High School Diploma | - | - |
| College or Associate's Degree | $26,979 | $0 |
| Bachelor's Degree | - | - |
| Graduate Degree | - | - |
| Total | $26,979 | $0 |
Family Income in Goldfield
Family Income Brackets in Goldfield
According to the Goldfield family income data, there are 30 families falling into the $75,000 to $99,999 income range, which is the most common income bracket and makes up 93.8% of all families.
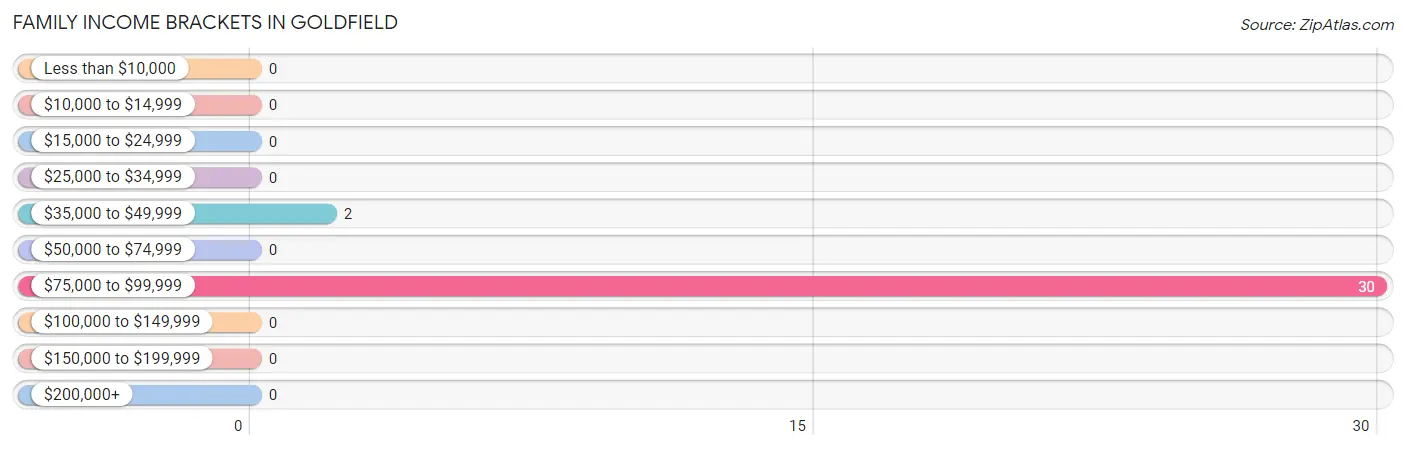
| Income Bracket | # Families | % Families |
| Less than $10,000 | 0 | 0.0% |
| $10,000 to $14,999 | 0 | 0.0% |
| $15,000 to $24,999 | 0 | 0.0% |
| $25,000 to $34,999 | 0 | 0.0% |
| $35,000 to $49,999 | 2 | 6.3% |
| $50,000 to $74,999 | 0 | 0.0% |
| $75,000 to $99,999 | 30 | 93.8% |
| $100,000 to $149,999 | 0 | 0.0% |
| $150,000 to $199,999 | 0 | 0.0% |
| $200,000+ | 0 | 0.0% |
Family Income by Famaliy Size in Goldfield
| Income Bracket | # Families | Median Income |
| 2-Person Families | 30 (93.8%) | $0 |
| 3-Person Families | 2 (6.2%) | $0 |
| 4-Person Families | 0 (0.0%) | $0 |
| 5-Person Families | 0 (0.0%) | $0 |
| 6-Person Families | 0 (0.0%) | $0 |
| 7+ Person Families | 0 (0.0%) | $0 |
| Total | 32 (100.0%) | $0 |
Family Income by Number of Earners in Goldfield
| Number of Earners | # Families | Median Income |
| No Earners | 0 (0.0%) | $0 |
| 1 Earner | 0 (0.0%) | $0 |
| 2 Earners | 32 (100.0%) | $0 |
| 3+ Earners | 0 (0.0%) | $0 |
| Total | 32 (100.0%) | $0 |
Household Income in Goldfield
Household Income Brackets in Goldfield
With 60 households falling in the category, the $25,000 to $34,999 income range is the most frequent in Goldfield, accounting for 56.1% of all households.
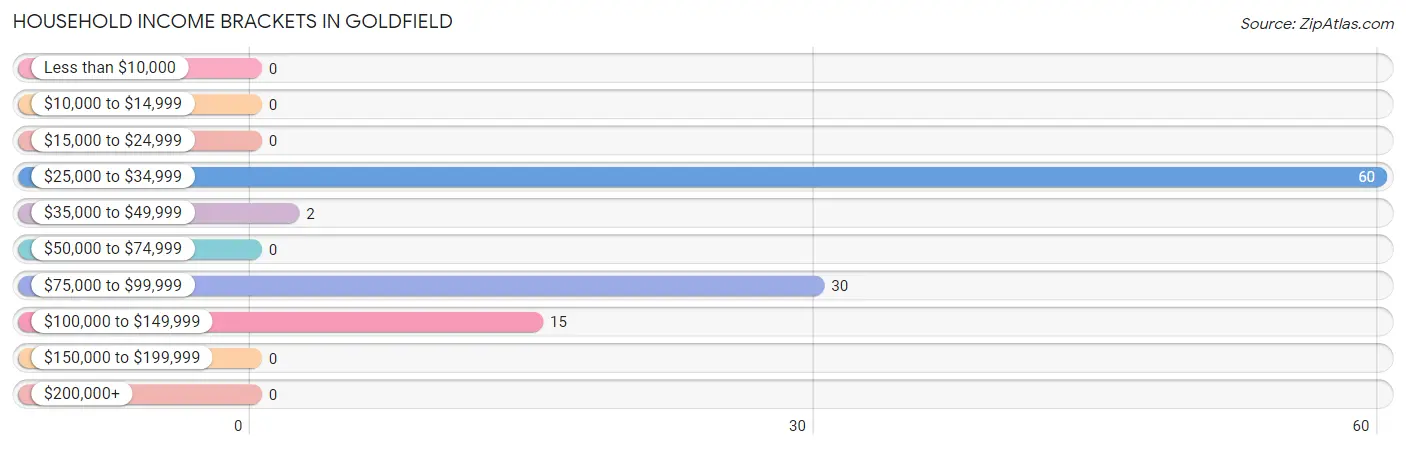
| Income Bracket | # Households | % Households |
| Less than $10,000 | 0 | 0.0% |
| $10,000 to $14,999 | 0 | 0.0% |
| $15,000 to $24,999 | 0 | 0.0% |
| $25,000 to $34,999 | 60 | 56.1% |
| $35,000 to $49,999 | 2 | 1.9% |
| $50,000 to $74,999 | 0 | 0.0% |
| $75,000 to $99,999 | 30 | 28.0% |
| $100,000 to $149,999 | 15 | 14.0% |
| $150,000 to $199,999 | 0 | 0.0% |
| $200,000+ | 0 | 0.0% |
Household Income by Householder Age in Goldfield
| Income Bracket | # Households | Median Income |
| 15 to 24 Years | 0 (0.0%) | $0 |
| 25 to 44 Years | 0 (0.0%) | $0 |
| 45 to 64 Years | 90 (84.1%) | $0 |
| 65+ Years | 17 (15.9%) | $0 |
| Total | 107 (100.0%) | $0 |
Poverty in Goldfield
Income Below Poverty by Sex and Age in Goldfield
| Age Bracket | Male | Female |
| Under 5 Years | 0 (0.0%) | 0 (0.0%) |
| 5 Years | 0 (0.0%) | 0 (0.0%) |
| 6 to 11 Years | 0 (0.0%) | 0 (0.0%) |
| 12 to 14 Years | 0 (0.0%) | 0 (0.0%) |
| 15 Years | 0 (0.0%) | 0 (0.0%) |
| 16 and 17 Years | 0 (0.0%) | 0 (0.0%) |
| 18 to 24 Years | 0 (0.0%) | 0 (0.0%) |
| 25 to 34 Years | 0 (0.0%) | 0 (0.0%) |
| 35 to 44 Years | 0 (0.0%) | 0 (0.0%) |
| 45 to 54 Years | 0 (0.0%) | 0 (0.0%) |
| 55 to 64 Years | 0 (0.0%) | 0 (0.0%) |
| 65 to 74 Years | 0 (0.0%) | 0 (0.0%) |
| 75 Years and over | 0 (0.0%) | 0 (0.0%) |
| Total | 0 (0.0%) | 0 (0.0%) |
Income Above Poverty by Sex and Age in Goldfield
According to the poverty statistics in Goldfield, males aged 16 and 17 years and females aged 45 to 54 years are the age groups that are most secure financially, with 100.0% of males and 100.0% of females in these age groups living above the poverty line.
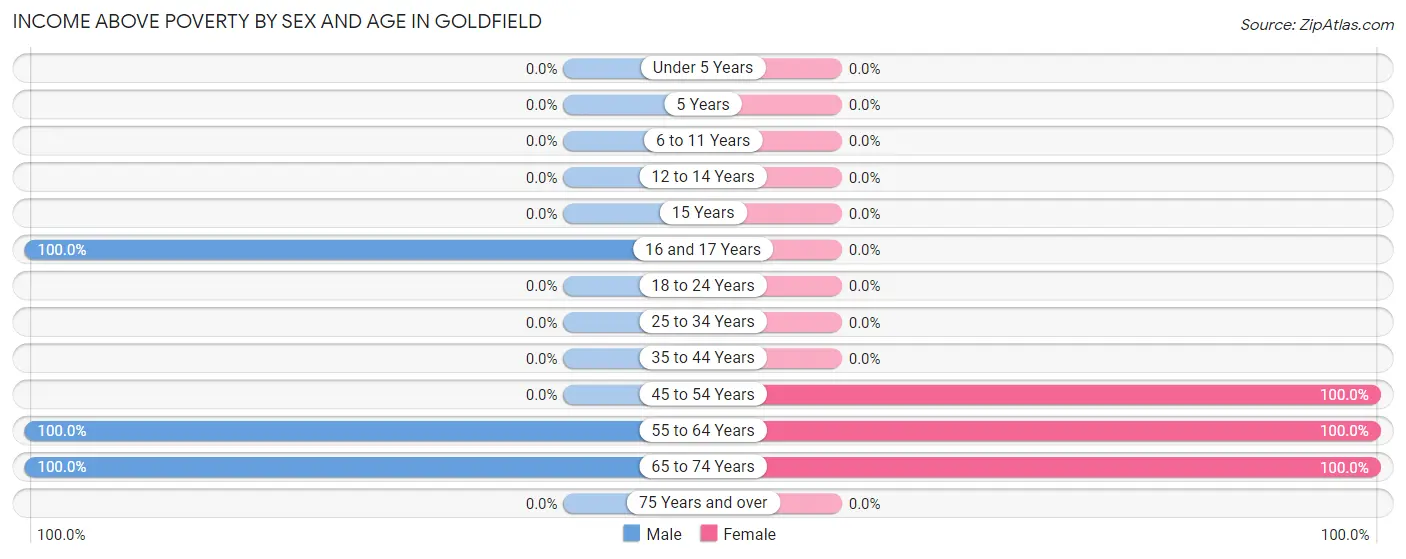
| Age Bracket | Male | Female |
| Under 5 Years | 0 (0.0%) | 0 (0.0%) |
| 5 Years | 0 (0.0%) | 0 (0.0%) |
| 6 to 11 Years | 0 (0.0%) | 0 (0.0%) |
| 12 to 14 Years | 0 (0.0%) | 0 (0.0%) |
| 15 Years | 0 (0.0%) | 0 (0.0%) |
| 16 and 17 Years | 14 (100.0%) | 0 (0.0%) |
| 18 to 24 Years | 0 (0.0%) | 0 (0.0%) |
| 25 to 34 Years | 0 (0.0%) | 0 (0.0%) |
| 35 to 44 Years | 0 (0.0%) | 0 (0.0%) |
| 45 to 54 Years | 0 (0.0%) | 11 (100.0%) |
| 55 to 64 Years | 95 (100.0%) | 29 (100.0%) |
| 65 to 74 Years | 2 (100.0%) | 15 (100.0%) |
| 75 Years and over | 0 (0.0%) | 0 (0.0%) |
| Total | 111 (100.0%) | 55 (100.0%) |
Income Below Poverty Among Married-Couple Families in Goldfield
| Children | Above Poverty | Below Poverty |
| No Children | 30 (100.0%) | 0 (0.0%) |
| 1 or 2 Children | 2 (100.0%) | 0 (0.0%) |
| 3 or 4 Children | 0 (0.0%) | 0 (0.0%) |
| 5 or more Children | 0 (0.0%) | 0 (0.0%) |
| Total | 32 (100.0%) | 0 (0.0%) |
Income Below Poverty Among Single-Parent Households in Goldfield
| Children | Single Father | Single Mother |
| No Children | 0 (0.0%) | 0 (0.0%) |
| 1 or 2 Children | 0 (0.0%) | 0 (0.0%) |
| 3 or 4 Children | 0 (0.0%) | 0 (0.0%) |
| 5 or more Children | 0 (0.0%) | 0 (0.0%) |
| Total | 0 (0.0%) | 0 (0.0%) |
Income Below Poverty Among Married-Couple vs Single-Parent Households in Goldfield
| Children | Married-Couple Families | Single-Parent Households |
| No Children | 0 (0.0%) | 0 (0.0%) |
| 1 or 2 Children | 0 (0.0%) | 0 (0.0%) |
| 3 or 4 Children | 0 (0.0%) | 0 (0.0%) |
| 5 or more Children | 0 (0.0%) | 0 (0.0%) |
| Total | 0 (0.0%) | 0 (0.0%) |
Race in Goldfield
The most populous races in Goldfield are , and White / Caucasian (166 | 100.0%).
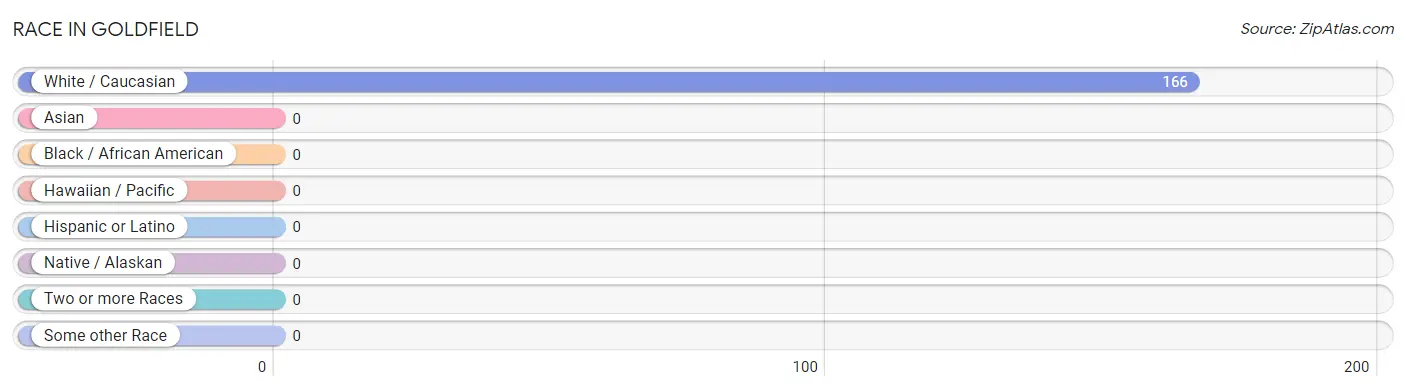
| Race | # Population | % Population |
| Asian | 0 | 0.0% |
| Black / African American | 0 | 0.0% |
| Hawaiian / Pacific | 0 | 0.0% |
| Hispanic or Latino | 0 | 0.0% |
| Native / Alaskan | 0 | 0.0% |
| White / Caucasian | 166 | 100.0% |
| Two or more Races | 0 | 0.0% |
| Some other Race | 0 | 0.0% |
| Total | 166 | 100.0% |
Ancestry in Goldfield
The most populous ancestries reported in Goldfield are Czech (60 | 36.1%), Italian (60 | 36.1%), Scotch-Irish (59 | 35.5%), and Northern European (27 | 16.3%), together accounting for 124.1% of all Goldfield residents.
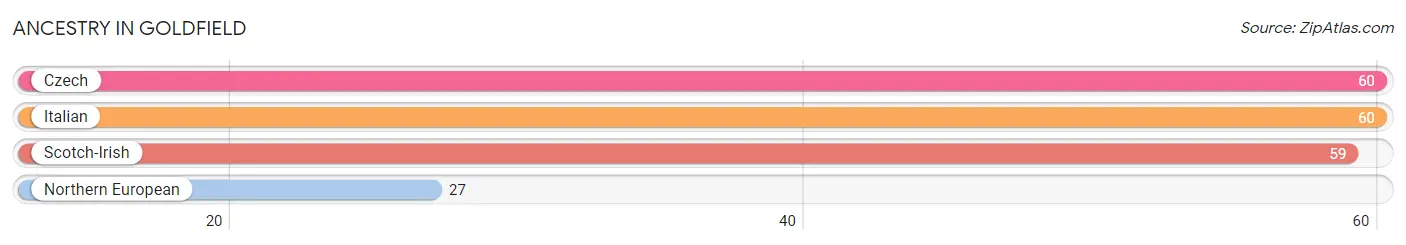
| Ancestry | # Population | % Population |
| Czech | 60 | 36.1% |
| Italian | 60 | 36.1% |
| Northern European | 27 | 16.3% |
| Scotch-Irish | 59 | 35.5% | View All 4 Rows |
Immigrants in Goldfield

| Immigration Origin | # Population | % Population | View All 0 Rows |
Sex and Age in Goldfield
Sex and Age in Goldfield
The most populous age groups in Goldfield are 60 to 64 Years (95 | 85.6%) for men and 55 to 59 Years (29 | 52.7%) for women.
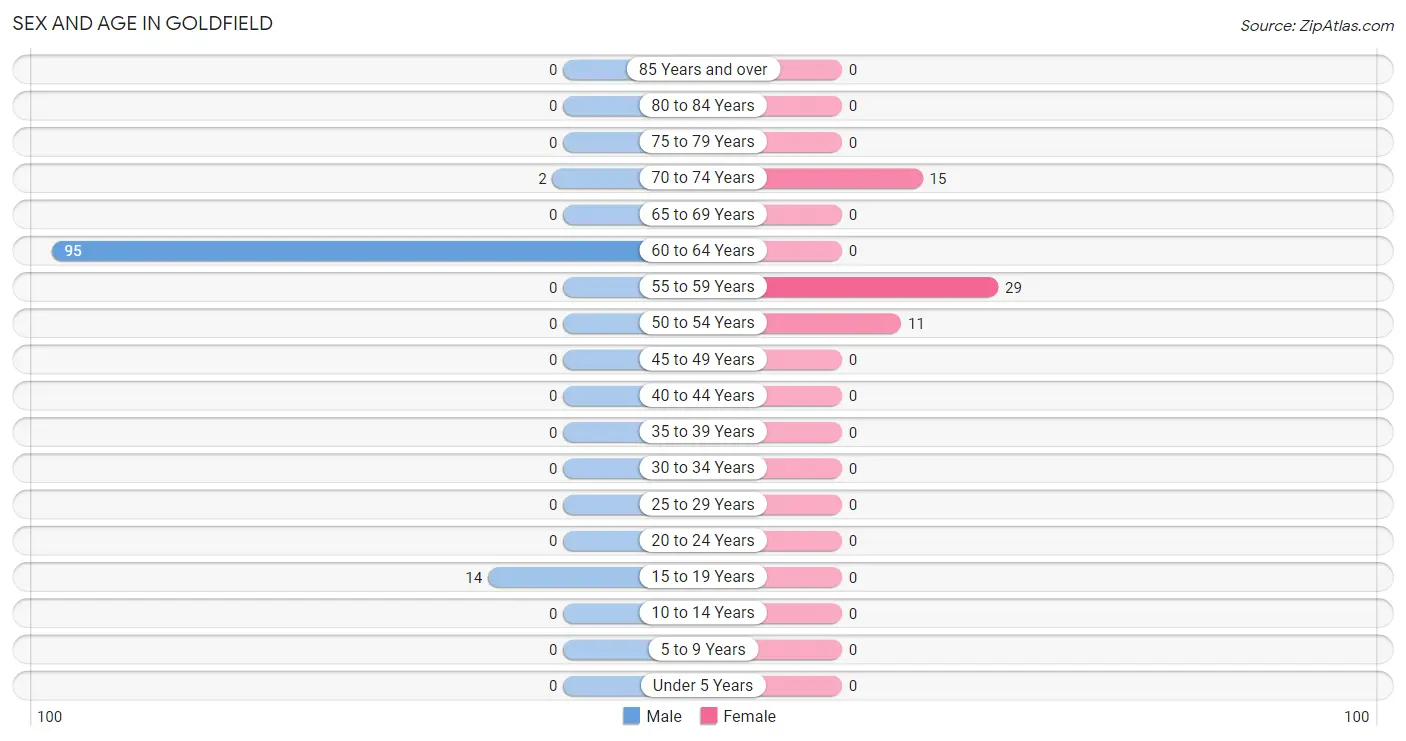
| Age Bracket | Male | Female |
| Under 5 Years | 0 (0.0%) | 0 (0.0%) |
| 5 to 9 Years | 0 (0.0%) | 0 (0.0%) |
| 10 to 14 Years | 0 (0.0%) | 0 (0.0%) |
| 15 to 19 Years | 14 (12.6%) | 0 (0.0%) |
| 20 to 24 Years | 0 (0.0%) | 0 (0.0%) |
| 25 to 29 Years | 0 (0.0%) | 0 (0.0%) |
| 30 to 34 Years | 0 (0.0%) | 0 (0.0%) |
| 35 to 39 Years | 0 (0.0%) | 0 (0.0%) |
| 40 to 44 Years | 0 (0.0%) | 0 (0.0%) |
| 45 to 49 Years | 0 (0.0%) | 0 (0.0%) |
| 50 to 54 Years | 0 (0.0%) | 11 (20.0%) |
| 55 to 59 Years | 0 (0.0%) | 29 (52.7%) |
| 60 to 64 Years | 95 (85.6%) | 0 (0.0%) |
| 65 to 69 Years | 0 (0.0%) | 0 (0.0%) |
| 70 to 74 Years | 2 (1.8%) | 15 (27.3%) |
| 75 to 79 Years | 0 (0.0%) | 0 (0.0%) |
| 80 to 84 Years | 0 (0.0%) | 0 (0.0%) |
| 85 Years and over | 0 (0.0%) | 0 (0.0%) |
| Total | 111 (100.0%) | 55 (100.0%) |
Families and Households in Goldfield
Median Family Size in Goldfield
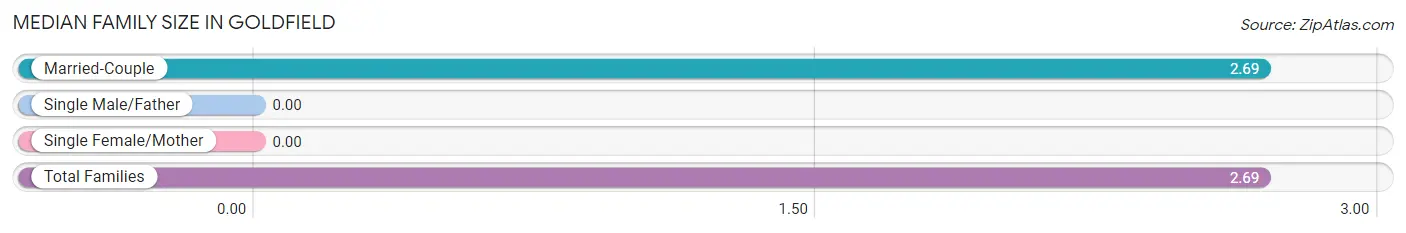
| Family Type | # Families | Family Size |
| Married-Couple | 32 (100.0%) | 2.69 |
| Single Male/Father | 0 (0.0%) | - |
| Single Female/Mother | 0 (0.0%) | - |
| Total Families | 32 (100.0%) | 2.69 |
Median Household Size in Goldfield
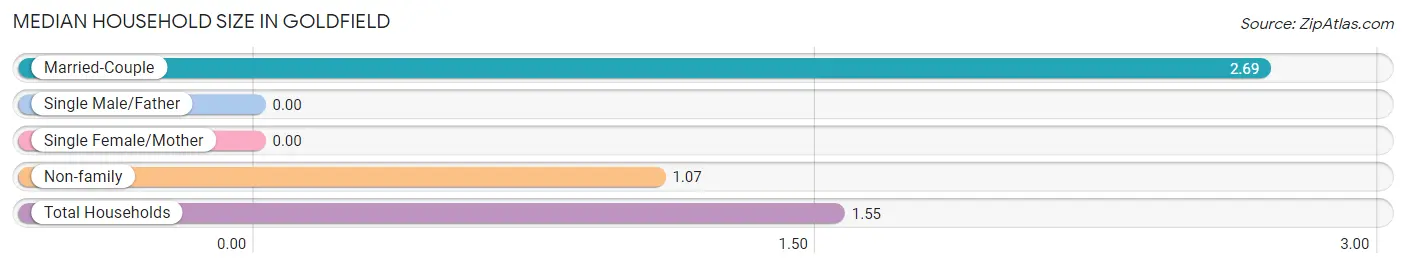
| Household Type | # Households | Household Size |
| Married-Couple | 32 (29.9%) | 2.69 |
| Single Male/Father | 0 (0.0%) | - |
| Single Female/Mother | 0 (0.0%) | - |
| Non-family | 75 (70.1%) | 1.07 |
| Total Households | 107 (100.0%) | 1.55 |
Household Size by Marriage Status in Goldfield
Out of a total of 107 households in Goldfield, 32 (29.9%) are family households, while 75 (70.1%) are nonfamily households. The most numerous type of family households are 2-person households, comprising 30, and the most common type of nonfamily households are 1-person households, comprising 60.
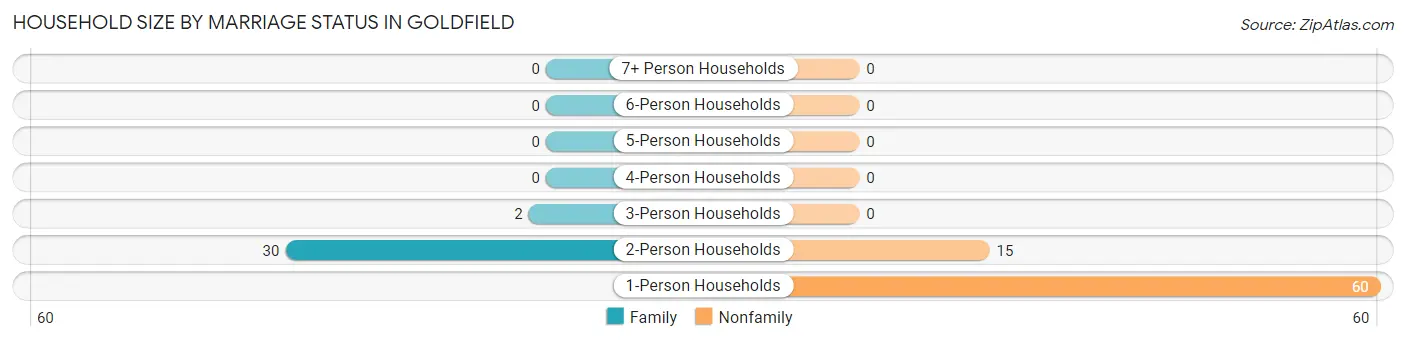
| Household Size | Family Households | Nonfamily Households |
| 1-Person Households | - | 60 (56.1%) |
| 2-Person Households | 30 (28.0%) | 15 (14.0%) |
| 3-Person Households | 2 (1.9%) | 0 (0.0%) |
| 4-Person Households | 0 (0.0%) | 0 (0.0%) |
| 5-Person Households | 0 (0.0%) | 0 (0.0%) |
| 6-Person Households | 0 (0.0%) | 0 (0.0%) |
| 7+ Person Households | 0 (0.0%) | 0 (0.0%) |
| Total | 32 (29.9%) | 75 (70.1%) |
Female Fertility in Goldfield
Fertility by Age in Goldfield
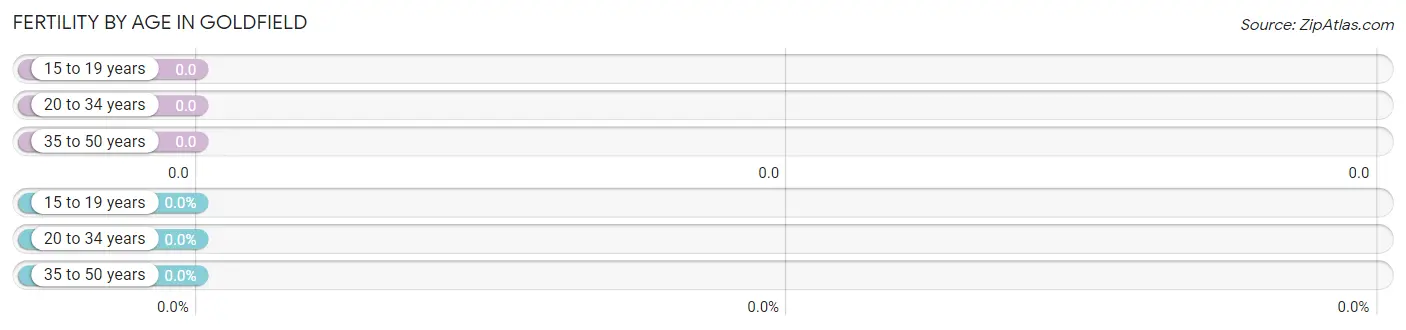
| Age Bracket | Women with Births | Births / 1,000 Women |
| 15 to 19 years | 0 (0.0%) | 0.0 |
| 20 to 34 years | 0 (0.0%) | 0.0 |
| 35 to 50 years | 0 (0.0%) | 0.0 |
| Total | 0 (0.0%) | 0.0 |
Fertility by Age by Marriage Status in Goldfield
| Age Bracket | Married | Unmarried |
| 15 to 19 years | 0 (0.0%) | 0 (0.0%) |
| 20 to 34 years | 0 (0.0%) | 0 (0.0%) |
| 35 to 50 years | 0 (0.0%) | 0 (0.0%) |
| Total | 0 (0.0%) | 0 (0.0%) |
Fertility by Education in Goldfield
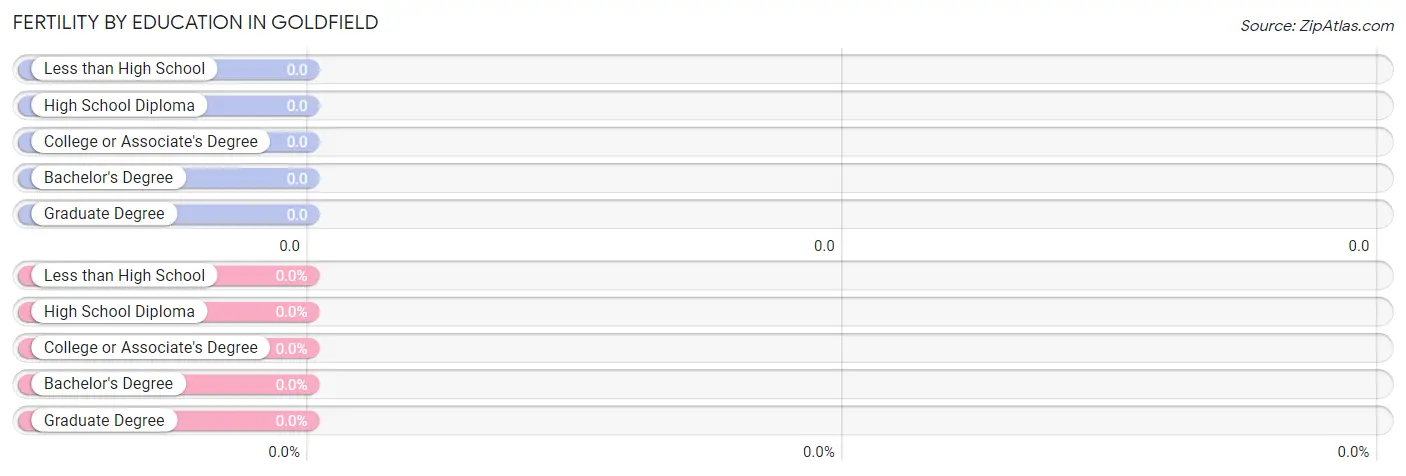
| Educational Attainment | Women with Births | Births / 1,000 Women |
| Less than High School | 0 (0.0%) | 0.0 |
| High School Diploma | 0 (0.0%) | 0.0 |
| College or Associate's Degree | 0 (0.0%) | 0.0 |
| Bachelor's Degree | 0 (0.0%) | 0.0 |
| Graduate Degree | 0 (0.0%) | 0.0 |
| Total | 0 (0.0%) | 0.0 |
Fertility by Education by Marriage Status in Goldfield
| Educational Attainment | Married | Unmarried |
| Less than High School | 0 (0.0%) | 0 (0.0%) |
| High School Diploma | 0 (0.0%) | 0 (0.0%) |
| College or Associate's Degree | 0 (0.0%) | 0 (0.0%) |
| Bachelor's Degree | 0 (0.0%) | 0 (0.0%) |
| Graduate Degree | 0 (0.0%) | 0 (0.0%) |
| Total | 0 (0.0%) | 0 (0.0%) |
Employment Characteristics in Goldfield
Employment by Class of Employer in Goldfield
Among the 149 employed individuals in Goldfield, private company employees (144 | 96.6%), and local government employees (5 | 3.4%) make up the most common classes of employment.
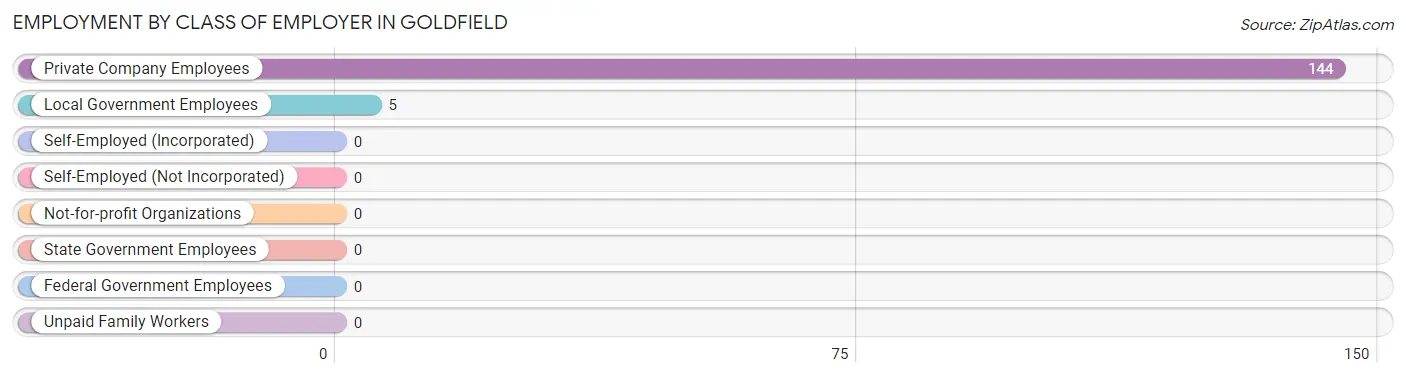
| Employer Class | # Employees | % Employees |
| Private Company Employees | 144 | 96.6% |
| Self-Employed (Incorporated) | 0 | 0.0% |
| Self-Employed (Not Incorporated) | 0 | 0.0% |
| Not-for-profit Organizations | 0 | 0.0% |
| Local Government Employees | 5 | 3.4% |
| State Government Employees | 0 | 0.0% |
| Federal Government Employees | 0 | 0.0% |
| Unpaid Family Workers | 0 | 0.0% |
| Total | 149 | 100.0% |
Employment Status by Age in Goldfield
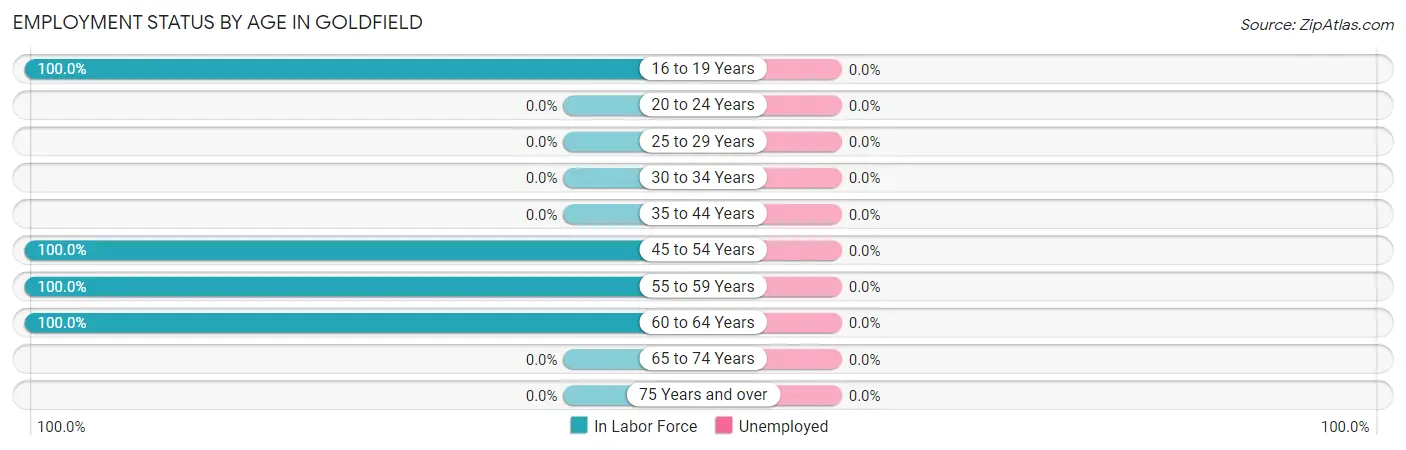
| Age Bracket | In Labor Force | Unemployed |
| 16 to 19 Years | 14 (100.0%) | 0 (0.0%) |
| 20 to 24 Years | 0 (0.0%) | 0 (0.0%) |
| 25 to 29 Years | 0 (0.0%) | 0 (0.0%) |
| 30 to 34 Years | 0 (0.0%) | 0 (0.0%) |
| 35 to 44 Years | 0 (0.0%) | 0 (0.0%) |
| 45 to 54 Years | 11 (100.0%) | 0 (0.0%) |
| 55 to 59 Years | 29 (100.0%) | 0 (0.0%) |
| 60 to 64 Years | 95 (100.0%) | 0 (0.0%) |
| 65 to 74 Years | 0 (0.0%) | 0 (0.0%) |
| 75 Years and over | 0 (0.0%) | 0 (0.0%) |
| Total | 149 (89.8%) | 0 (0.0%) |
Employment Status by Educational Attainment in Goldfield
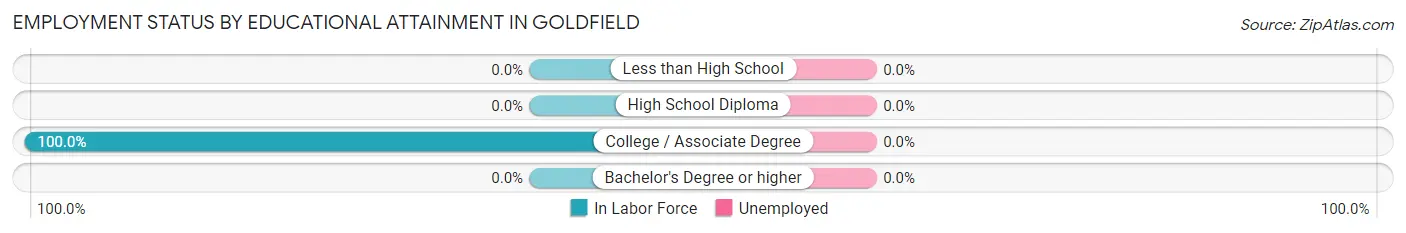
| Educational Attainment | In Labor Force | Unemployed |
| Less than High School | 0 (0.0%) | 0 (0.0%) |
| High School Diploma | 0 (0.0%) | 0 (0.0%) |
| College / Associate Degree | 135 (100.0%) | 0 (0.0%) |
| Bachelor's Degree or higher | 0 (0.0%) | 0 (0.0%) |
| Total | 135 (100.0%) | 0 (0.0%) |
Employment Occupations by Sex in Goldfield
Management, Business, Science and Arts Occupations
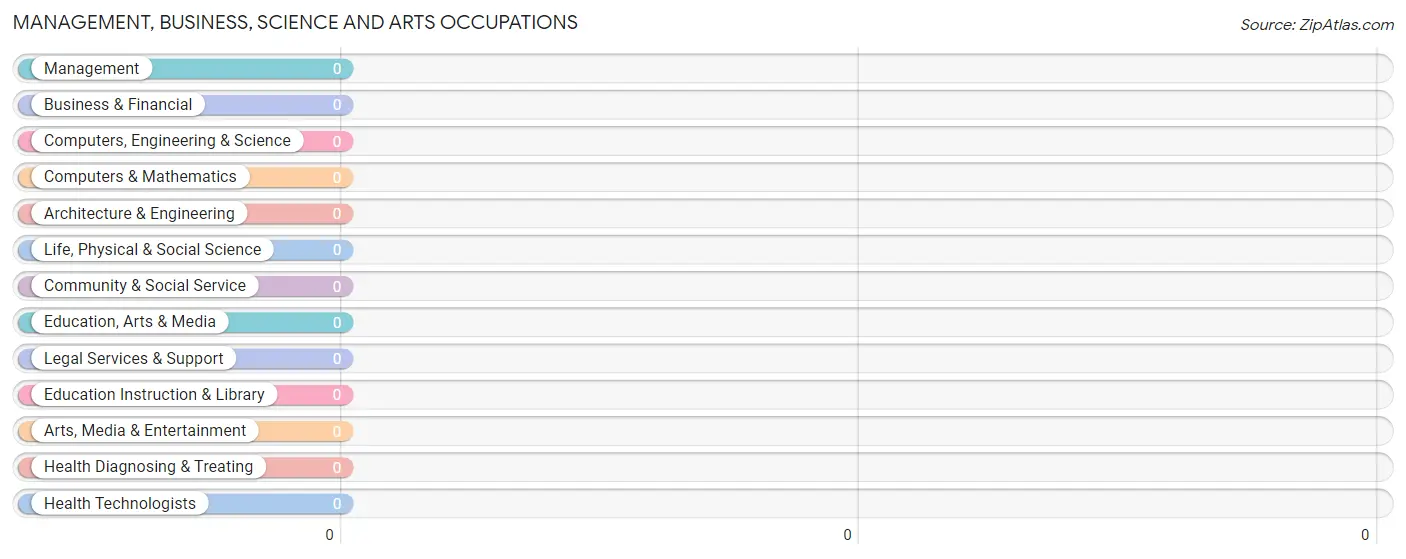
Management, Business, Science and Arts Occupations by Sex
| Occupation | Male | Female |
| Management | 0 (0.0%) | 0 (0.0%) |
| Business & Financial | 0 (0.0%) | 0 (0.0%) |
| Computers, Engineering & Science | 0 (0.0%) | 0 (0.0%) |
| Computers & Mathematics | 0 (0.0%) | 0 (0.0%) |
| Architecture & Engineering | 0 (0.0%) | 0 (0.0%) |
| Life, Physical & Social Science | 0 (0.0%) | 0 (0.0%) |
| Community & Social Service | 0 (0.0%) | 0 (0.0%) |
| Education, Arts & Media | 0 (0.0%) | 0 (0.0%) |
| Legal Services & Support | 0 (0.0%) | 0 (0.0%) |
| Education Instruction & Library | 0 (0.0%) | 0 (0.0%) |
| Arts, Media & Entertainment | 0 (0.0%) | 0 (0.0%) |
| Health Diagnosing & Treating | 0 (0.0%) | 0 (0.0%) |
| Health Technologists | 0 (0.0%) | 0 (0.0%) |
| Total (Category) | 0 (0.0%) | 0 (0.0%) |
| Total (Overall) | 109 (73.2%) | 40 (26.9%) |
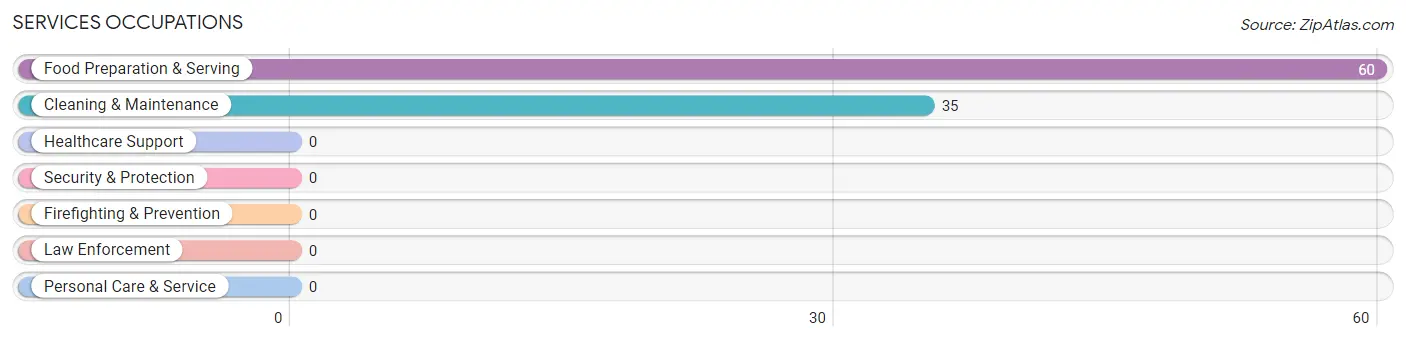
Services Occupations
The most common Services occupations in Goldfield are Food Preparation & Serving (60 | 40.3%), and Cleaning & Maintenance (35 | 23.5%).
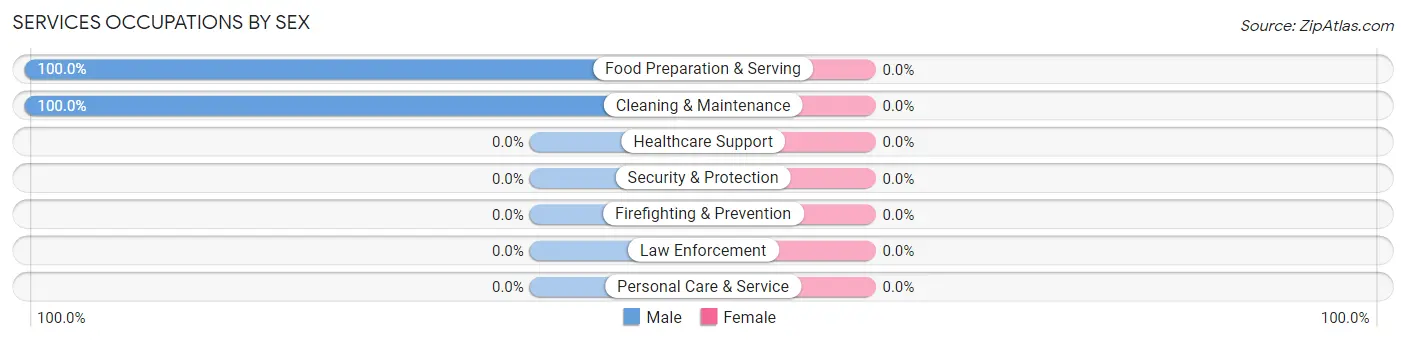
Services Occupations by Sex
| Occupation | Male | Female |
| Healthcare Support | 0 (0.0%) | 0 (0.0%) |
| Security & Protection | 0 (0.0%) | 0 (0.0%) |
| Firefighting & Prevention | 0 (0.0%) | 0 (0.0%) |
| Law Enforcement | 0 (0.0%) | 0 (0.0%) |
| Food Preparation & Serving | 60 (100.0%) | 0 (0.0%) |
| Cleaning & Maintenance | 35 (100.0%) | 0 (0.0%) |
| Personal Care & Service | 0 (0.0%) | 0 (0.0%) |
| Total (Category) | 95 (100.0%) | 0 (0.0%) |
| Total (Overall) | 109 (73.2%) | 40 (26.9%) |
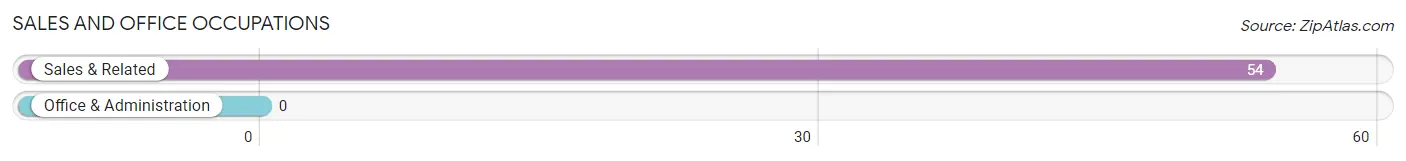
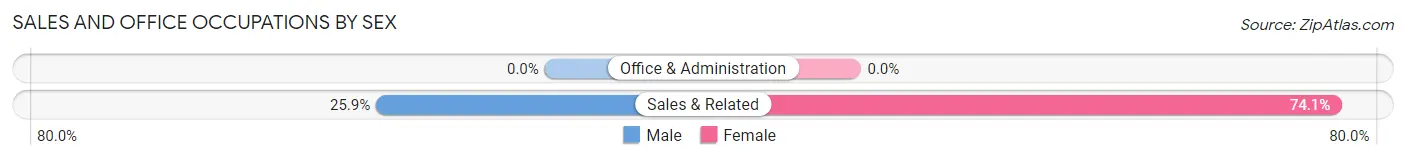
Sales and Office Occupations
The most common Sales and Office occupations in Goldfield are , and Sales & Related (54 | 36.2%).
Sales and Office Occupations by Sex
| Occupation | Male | Female |
| Sales & Related | 14 (25.9%) | 40 (74.1%) |
| Office & Administration | 0 (0.0%) | 0 (0.0%) |
| Total (Category) | 14 (25.9%) | 40 (74.1%) |
| Total (Overall) | 109 (73.2%) | 40 (26.9%) |
Natural Resources, Construction and Maintenance Occupations
Natural Resources, Construction and Maintenance Occupations by Sex
| Occupation | Male | Female |
| Farming, Fishing & Forestry | 0 (0.0%) | 0 (0.0%) |
| Construction & Extraction | 0 (0.0%) | 0 (0.0%) |
| Installation, Maintenance & Repair | 0 (0.0%) | 0 (0.0%) |
| Total (Category) | 0 (0.0%) | 0 (0.0%) |
| Total (Overall) | 109 (73.2%) | 40 (26.9%) |
Production, Transportation and Moving Occupations
Production, Transportation and Moving Occupations by Sex
| Occupation | Male | Female |
| Production | 0 (0.0%) | 0 (0.0%) |
| Transportation | 0 (0.0%) | 0 (0.0%) |
| Material Moving | 0 (0.0%) | 0 (0.0%) |
| Total (Category) | 0 (0.0%) | 0 (0.0%) |
| Total (Overall) | 109 (73.2%) | 40 (26.9%) |
Employment Industries by Sex in Goldfield
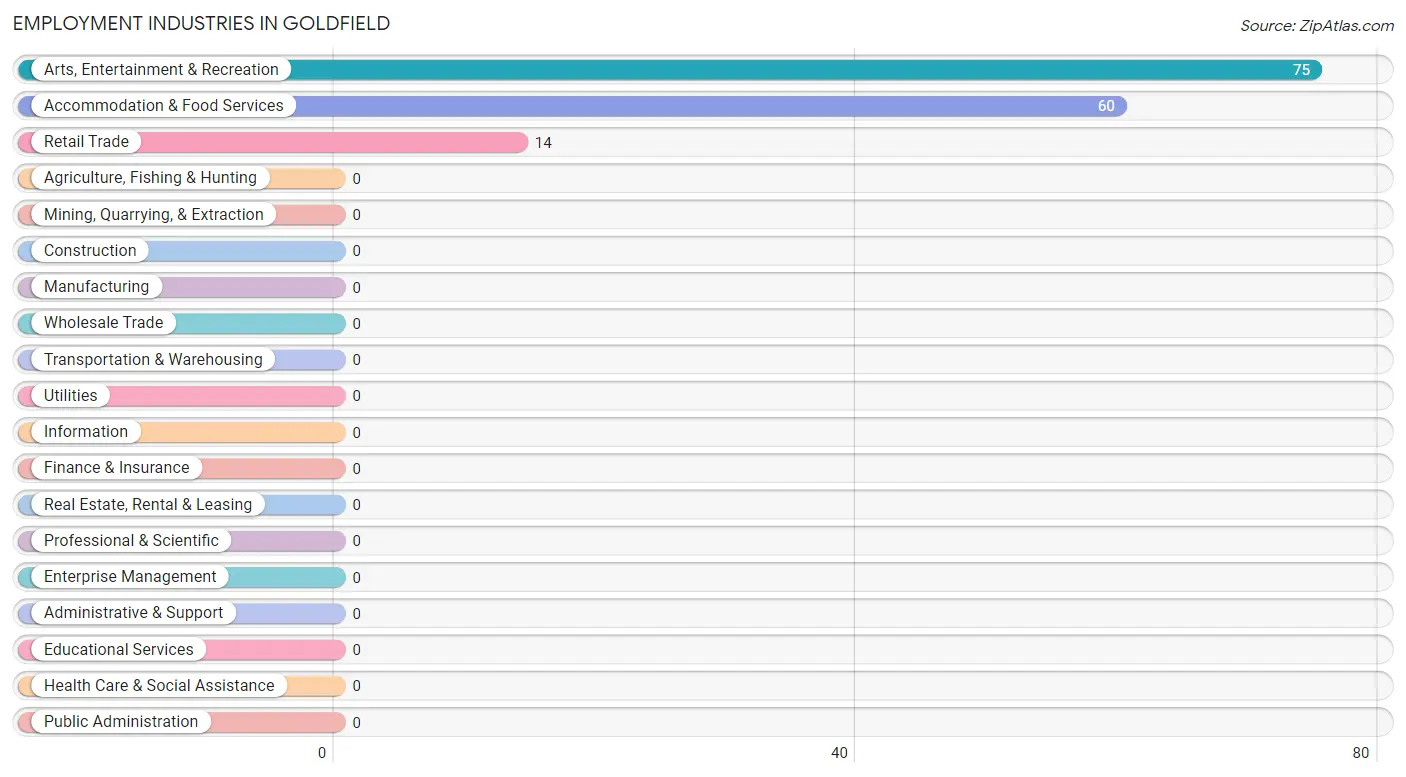
Employment Industries in Goldfield
The major employment industries in Goldfield include Arts, Entertainment & Recreation (75 | 50.3%), Accommodation & Food Services (60 | 40.3%), and Retail Trade (14 | 9.4%).
Employment Industries by Sex in Goldfield
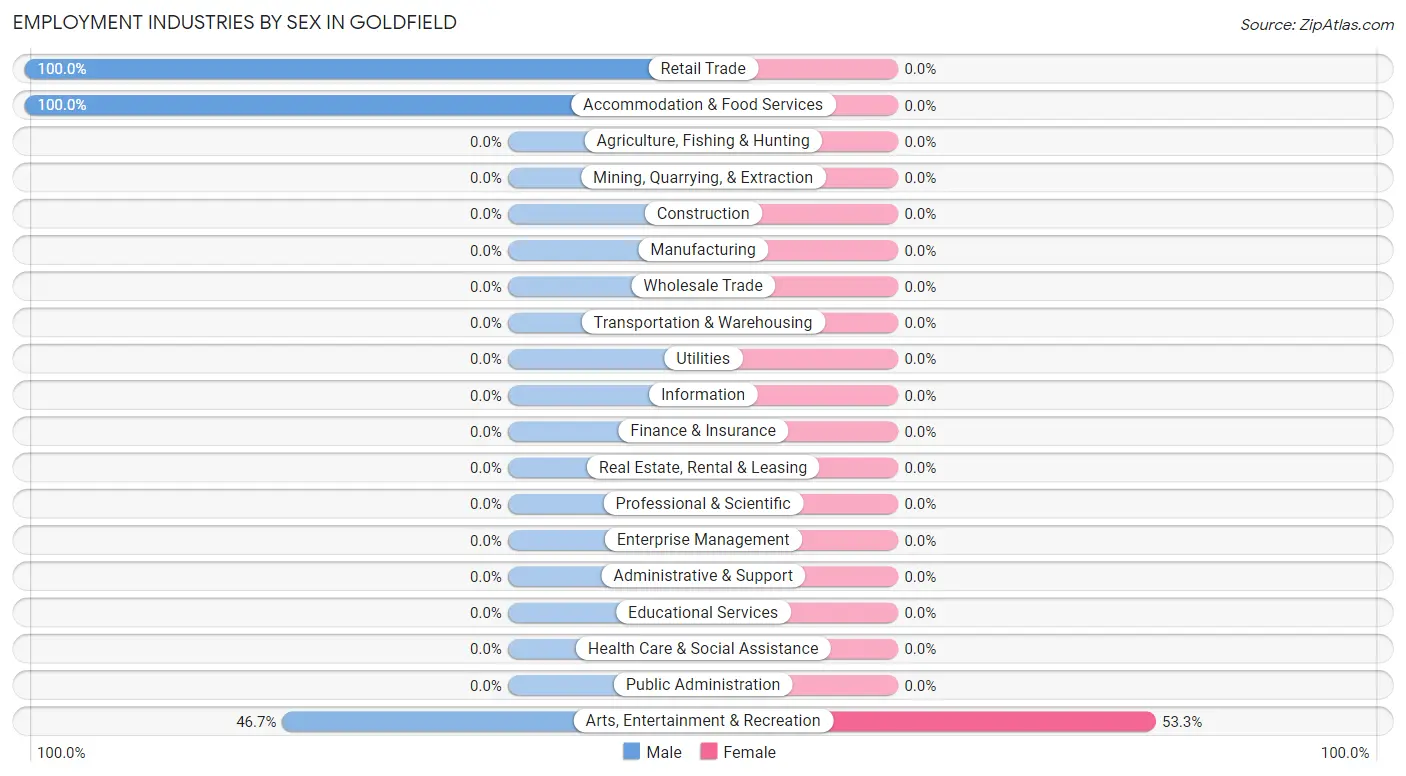
| Industry | Male | Female |
| Agriculture, Fishing & Hunting | 0 (0.0%) | 0 (0.0%) |
| Mining, Quarrying, & Extraction | 0 (0.0%) | 0 (0.0%) |
| Construction | 0 (0.0%) | 0 (0.0%) |
| Manufacturing | 0 (0.0%) | 0 (0.0%) |
| Wholesale Trade | 0 (0.0%) | 0 (0.0%) |
| Retail Trade | 14 (100.0%) | 0 (0.0%) |
| Transportation & Warehousing | 0 (0.0%) | 0 (0.0%) |
| Utilities | 0 (0.0%) | 0 (0.0%) |
| Information | 0 (0.0%) | 0 (0.0%) |
| Finance & Insurance | 0 (0.0%) | 0 (0.0%) |
| Real Estate, Rental & Leasing | 0 (0.0%) | 0 (0.0%) |
| Professional & Scientific | 0 (0.0%) | 0 (0.0%) |
| Enterprise Management | 0 (0.0%) | 0 (0.0%) |
| Administrative & Support | 0 (0.0%) | 0 (0.0%) |
| Educational Services | 0 (0.0%) | 0 (0.0%) |
| Health Care & Social Assistance | 0 (0.0%) | 0 (0.0%) |
| Arts, Entertainment & Recreation | 35 (46.7%) | 40 (53.3%) |
| Accommodation & Food Services | 60 (100.0%) | 0 (0.0%) |
| Public Administration | 0 (0.0%) | 0 (0.0%) |
| Total | 109 (73.2%) | 40 (26.9%) |
Education in Goldfield
School Enrollment in Goldfield
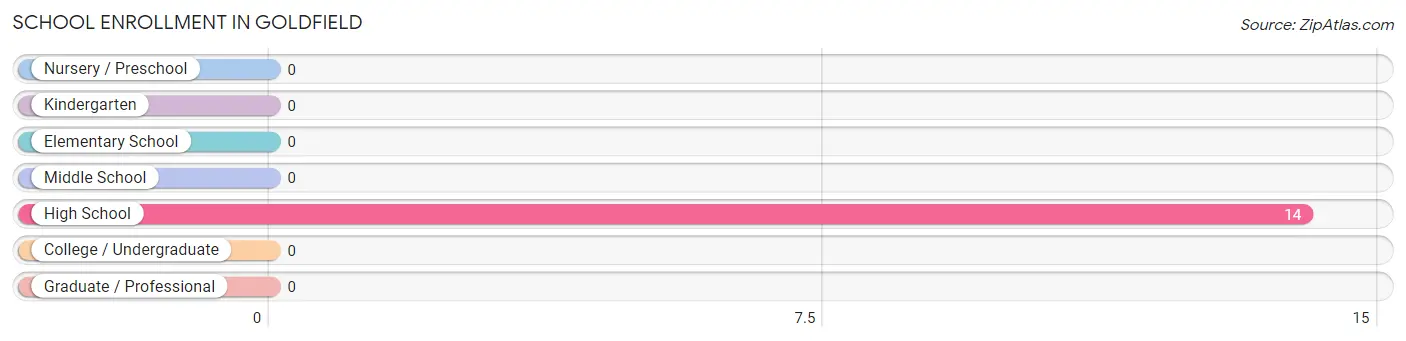
| School Level | # Students | % Students |
| Nursery / Preschool | 0 | 0.0% |
| Kindergarten | 0 | 0.0% |
| Elementary School | 0 | 0.0% |
| Middle School | 0 | 0.0% |
| High School | 14 | 100.0% |
| College / Undergraduate | 0 | 0.0% |
| Graduate / Professional | 0 | 0.0% |
| Total | 14 | 100.0% |
School Enrollment by Age by Funding Source in Goldfield
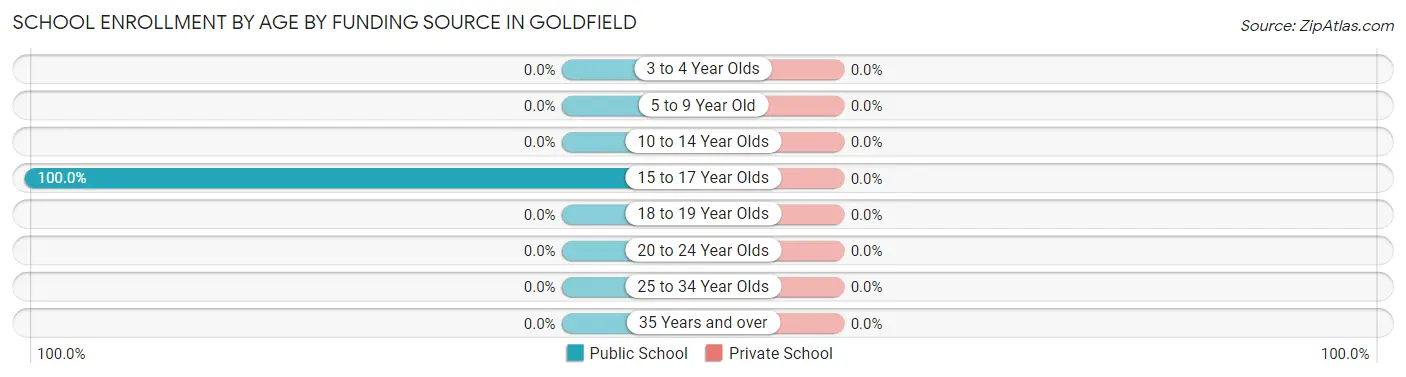
| Age Bracket | Public School | Private School |
| 3 to 4 Year Olds | 0 (0.0%) | 0 (0.0%) |
| 5 to 9 Year Old | 0 (0.0%) | 0 (0.0%) |
| 10 to 14 Year Olds | 0 (0.0%) | 0 (0.0%) |
| 15 to 17 Year Olds | 14 (100.0%) | 0 (0.0%) |
| 18 to 19 Year Olds | 0 (0.0%) | 0 (0.0%) |
| 20 to 24 Year Olds | 0 (0.0%) | 0 (0.0%) |
| 25 to 34 Year Olds | 0 (0.0%) | 0 (0.0%) |
| 35 Years and over | 0 (0.0%) | 0 (0.0%) |
| Total | 14 (100.0%) | 0 (0.0%) |
Educational Attainment by Field of Study in Goldfield
, and bio, nature & agricultural (15 | 100.0%) are the most common fields of study among 15 individuals in Goldfield who have obtained a bachelor's degree or higher.
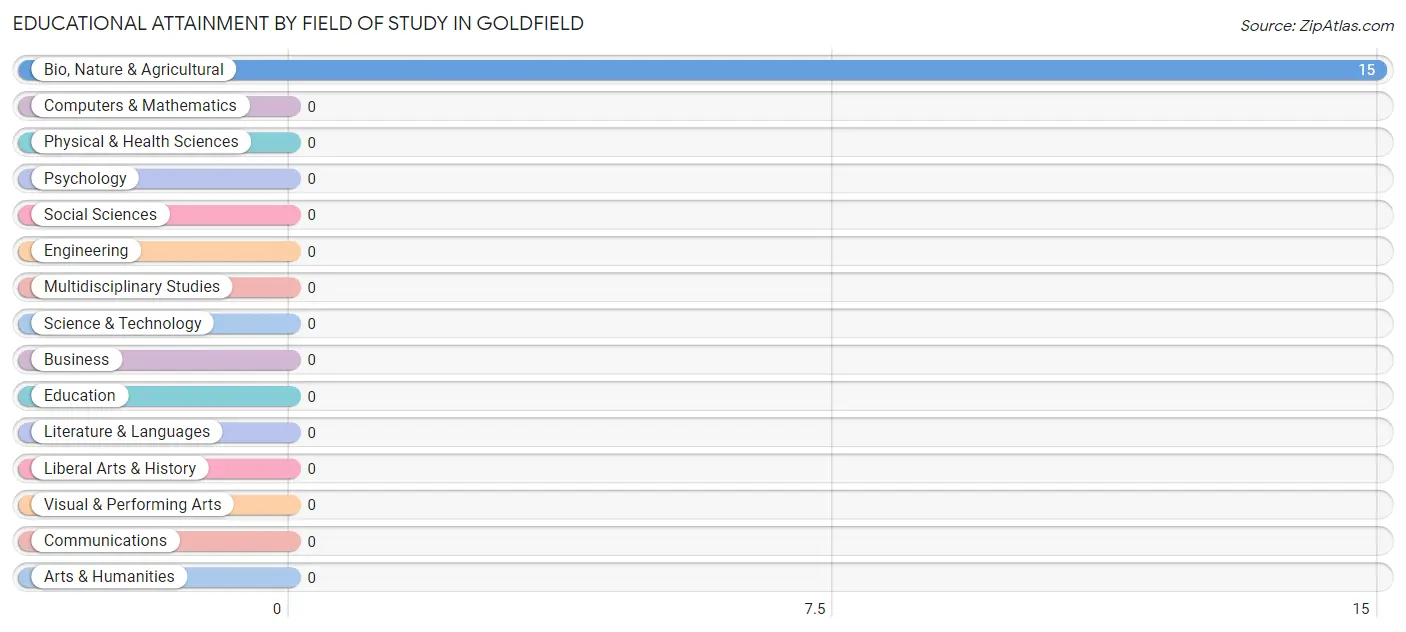
| Field of Study | # Graduates | % Graduates |
| Computers & Mathematics | 0 | 0.0% |
| Bio, Nature & Agricultural | 15 | 100.0% |
| Physical & Health Sciences | 0 | 0.0% |
| Psychology | 0 | 0.0% |
| Social Sciences | 0 | 0.0% |
| Engineering | 0 | 0.0% |
| Multidisciplinary Studies | 0 | 0.0% |
| Science & Technology | 0 | 0.0% |
| Business | 0 | 0.0% |
| Education | 0 | 0.0% |
| Literature & Languages | 0 | 0.0% |
| Liberal Arts & History | 0 | 0.0% |
| Visual & Performing Arts | 0 | 0.0% |
| Communications | 0 | 0.0% |
| Arts & Humanities | 0 | 0.0% |
| Total | 15 | 100.0% |
Transportation & Commute in Goldfield
Vehicle Availability by Sex in Goldfield
The most prevalent vehicle ownership categories in Goldfield are males with 4 vehicles (60, accounting for 55.0%) and females with 4 vehicles (0, making up 150.0%).
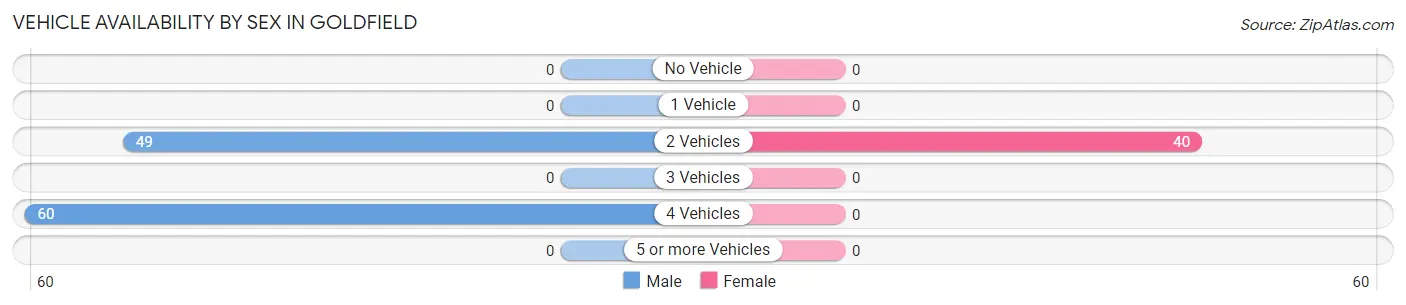
| Vehicles Available | Male | Female |
| No Vehicle | 0 (0.0%) | 0 (0.0%) |
| 1 Vehicle | 0 (0.0%) | 0 (0.0%) |
| 2 Vehicles | 49 (45.0%) | 40 (100.0%) |
| 3 Vehicles | 0 (0.0%) | 0 (0.0%) |
| 4 Vehicles | 60 (55.0%) | 0 (0.0%) |
| 5 or more Vehicles | 0 (0.0%) | 0 (0.0%) |
| Total | 109 (100.0%) | 40 (100.0%) |
Commute Time in Goldfield
The most frequently occuring commute durations in Goldfield are 15 to 19 minutes (89 commuters, 59.7%), 10 to 14 minutes (41 commuters, 27.5%), and 60 to 89 minutes (14 commuters, 9.4%).
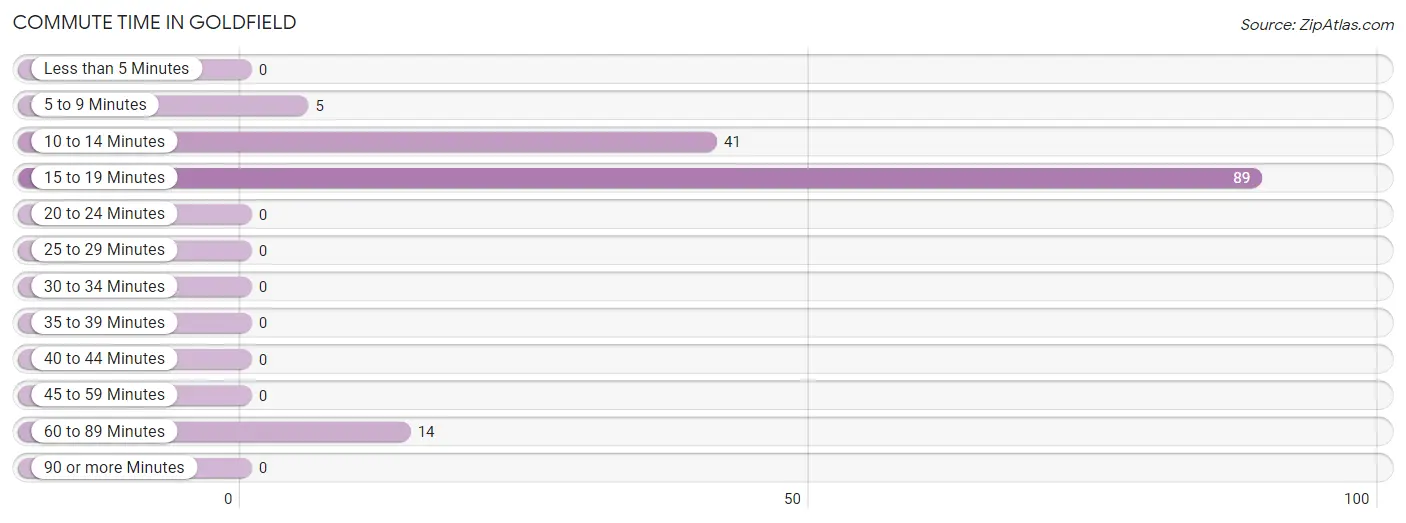
| Commute Time | # Commuters | % Commuters |
| Less than 5 Minutes | 0 | 0.0% |
| 5 to 9 Minutes | 5 | 3.4% |
| 10 to 14 Minutes | 41 | 27.5% |
| 15 to 19 Minutes | 89 | 59.7% |
| 20 to 24 Minutes | 0 | 0.0% |
| 25 to 29 Minutes | 0 | 0.0% |
| 30 to 34 Minutes | 0 | 0.0% |
| 35 to 39 Minutes | 0 | 0.0% |
| 40 to 44 Minutes | 0 | 0.0% |
| 45 to 59 Minutes | 0 | 0.0% |
| 60 to 89 Minutes | 14 | 9.4% |
| 90 or more Minutes | 0 | 0.0% |
Commute Time by Sex in Goldfield
The most common commute times in Goldfield are 15 to 19 minutes (60 commuters, 55.0%) for males and 15 to 19 minutes (29 commuters, 72.5%) for females.
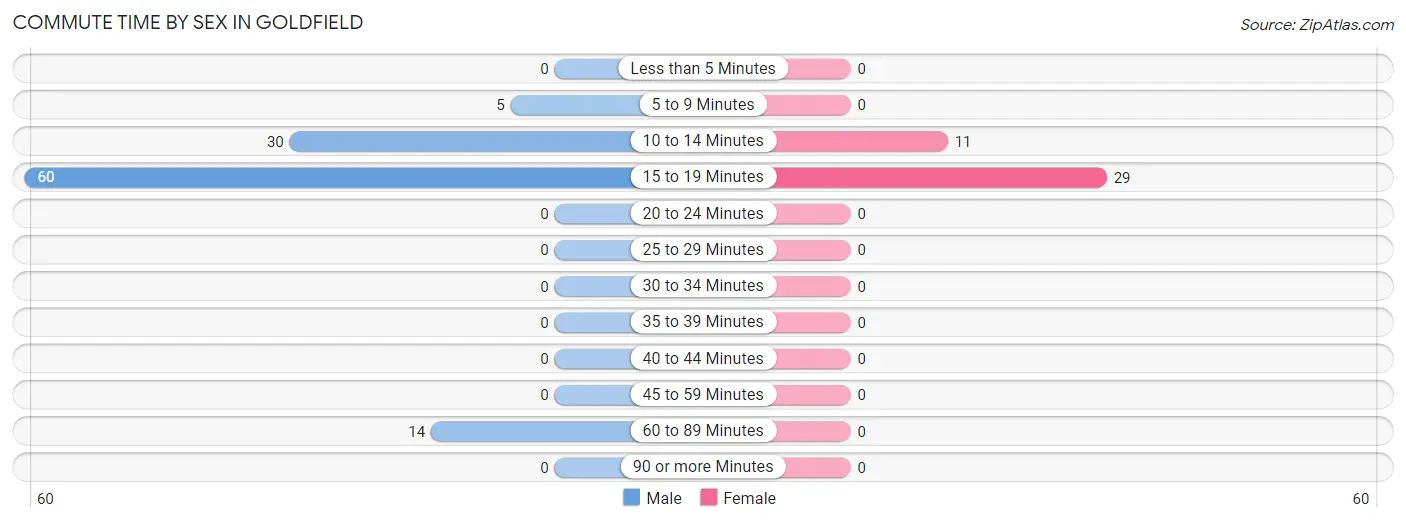
| Commute Time | Male | Female |
| Less than 5 Minutes | 0 (0.0%) | 0 (0.0%) |
| 5 to 9 Minutes | 5 (4.6%) | 0 (0.0%) |
| 10 to 14 Minutes | 30 (27.5%) | 11 (27.5%) |
| 15 to 19 Minutes | 60 (55.0%) | 29 (72.5%) |
| 20 to 24 Minutes | 0 (0.0%) | 0 (0.0%) |
| 25 to 29 Minutes | 0 (0.0%) | 0 (0.0%) |
| 30 to 34 Minutes | 0 (0.0%) | 0 (0.0%) |
| 35 to 39 Minutes | 0 (0.0%) | 0 (0.0%) |
| 40 to 44 Minutes | 0 (0.0%) | 0 (0.0%) |
| 45 to 59 Minutes | 0 (0.0%) | 0 (0.0%) |
| 60 to 89 Minutes | 14 (12.8%) | 0 (0.0%) |
| 90 or more Minutes | 0 (0.0%) | 0 (0.0%) |
Time of Departure to Work by Sex in Goldfield
The most frequent times of departure to work in Goldfield are 7:30 AM to 7:59 AM (60, 55.0%) for males and 12:00 AM to 4:59 AM (29, 72.5%) for females.
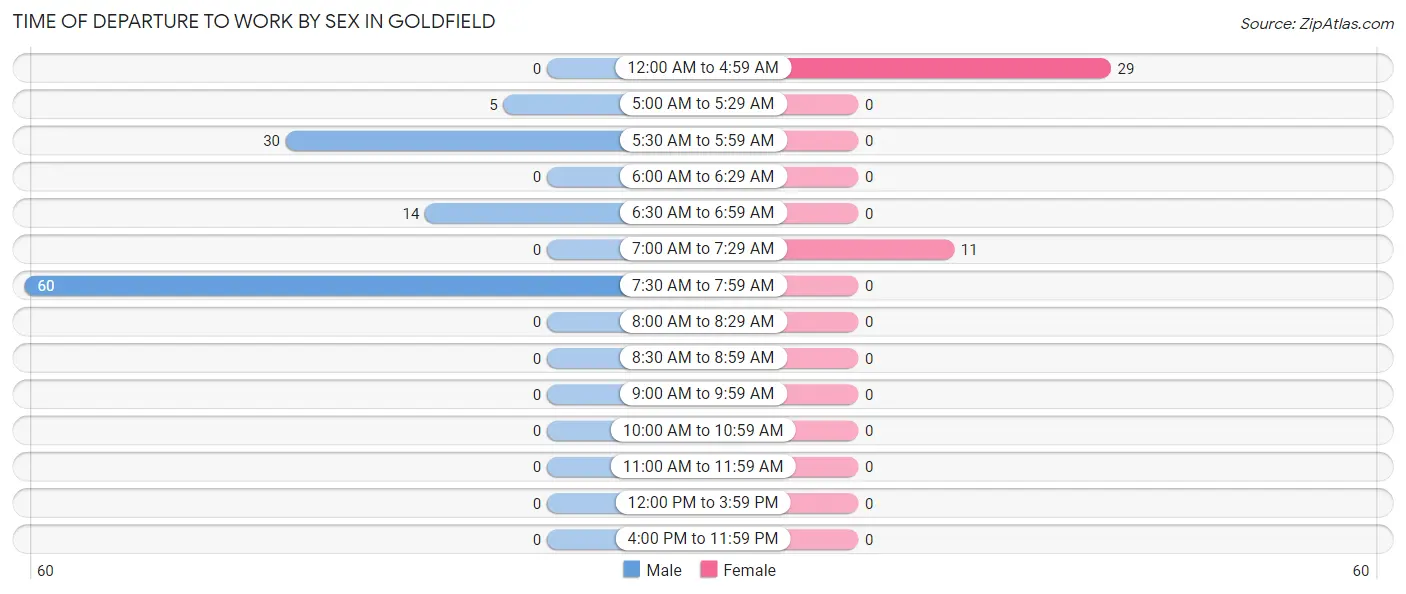
| Time of Departure | Male | Female |
| 12:00 AM to 4:59 AM | 0 (0.0%) | 29 (72.5%) |
| 5:00 AM to 5:29 AM | 5 (4.6%) | 0 (0.0%) |
| 5:30 AM to 5:59 AM | 30 (27.5%) | 0 (0.0%) |
| 6:00 AM to 6:29 AM | 0 (0.0%) | 0 (0.0%) |
| 6:30 AM to 6:59 AM | 14 (12.8%) | 0 (0.0%) |
| 7:00 AM to 7:29 AM | 0 (0.0%) | 11 (27.5%) |
| 7:30 AM to 7:59 AM | 60 (55.0%) | 0 (0.0%) |
| 8:00 AM to 8:29 AM | 0 (0.0%) | 0 (0.0%) |
| 8:30 AM to 8:59 AM | 0 (0.0%) | 0 (0.0%) |
| 9:00 AM to 9:59 AM | 0 (0.0%) | 0 (0.0%) |
| 10:00 AM to 10:59 AM | 0 (0.0%) | 0 (0.0%) |
| 11:00 AM to 11:59 AM | 0 (0.0%) | 0 (0.0%) |
| 12:00 PM to 3:59 PM | 0 (0.0%) | 0 (0.0%) |
| 4:00 PM to 11:59 PM | 0 (0.0%) | 0 (0.0%) |
| Total | 109 (100.0%) | 40 (100.0%) |
Housing Occupancy in Goldfield
Occupancy by Ownership in Goldfield
Of the total 107 dwellings in Goldfield, owner-occupied units account for 47 (43.9%), while renter-occupied units make up 60 (56.1%).
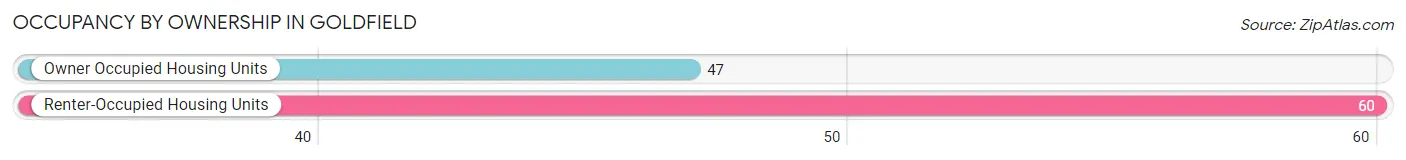
| Occupancy | # Housing Units | % Housing Units |
| Owner Occupied Housing Units | 47 | 43.9% |
| Renter-Occupied Housing Units | 60 | 56.1% |
| Total Occupied Housing Units | 107 | 100.0% |
Occupancy by Household Size in Goldfield
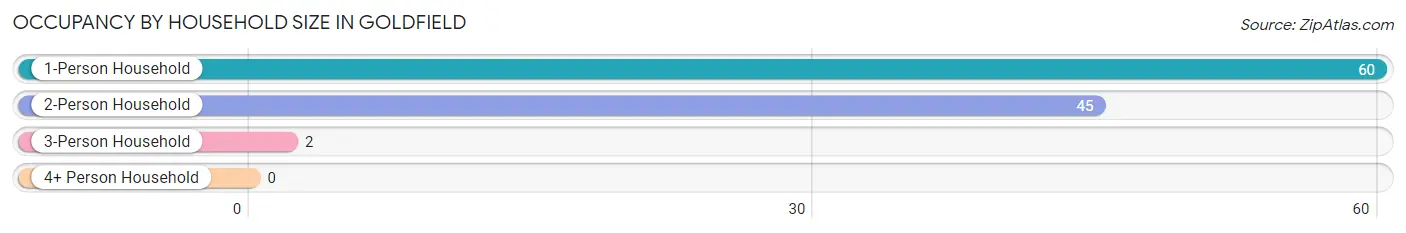
| Household Size | # Housing Units | % Housing Units |
| 1-Person Household | 60 | 56.1% |
| 2-Person Household | 45 | 42.1% |
| 3-Person Household | 2 | 1.9% |
| 4+ Person Household | 0 | 0.0% |
| Total Housing Units | 107 | 100.0% |
Occupancy by Ownership by Household Size in Goldfield
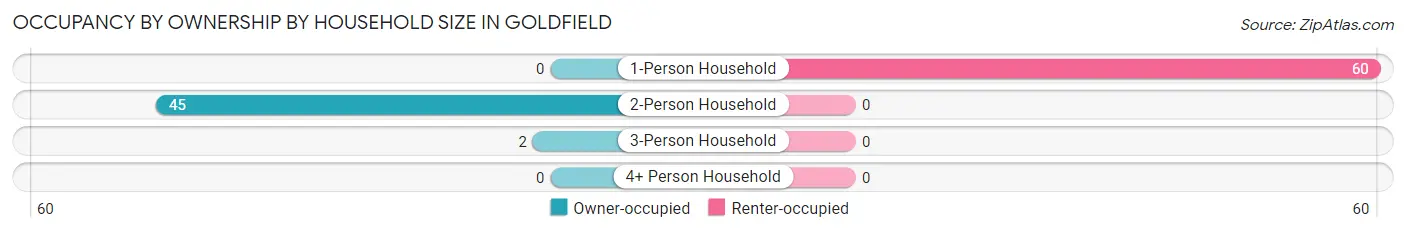
| Household Size | Owner-occupied | Renter-occupied |
| 1-Person Household | 0 (0.0%) | 60 (100.0%) |
| 2-Person Household | 45 (100.0%) | 0 (0.0%) |
| 3-Person Household | 2 (100.0%) | 0 (0.0%) |
| 4+ Person Household | 0 (0.0%) | 0 (0.0%) |
| Total Housing Units | 47 (43.9%) | 60 (56.1%) |
Occupancy by Educational Attainment in Goldfield
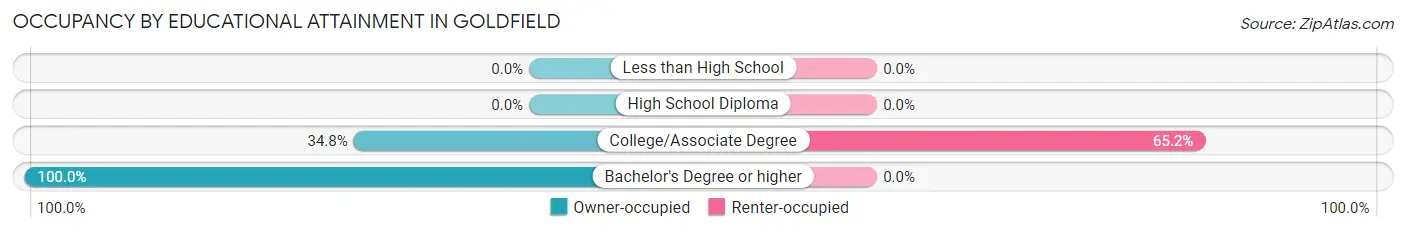
| Household Size | Owner-occupied | Renter-occupied |
| Less than High School | 0 (0.0%) | 0 (0.0%) |
| High School Diploma | 0 (0.0%) | 0 (0.0%) |
| College/Associate Degree | 32 (34.8%) | 60 (65.2%) |
| Bachelor's Degree or higher | 15 (100.0%) | 0 (0.0%) |
Occupancy by Age of Householder in Goldfield
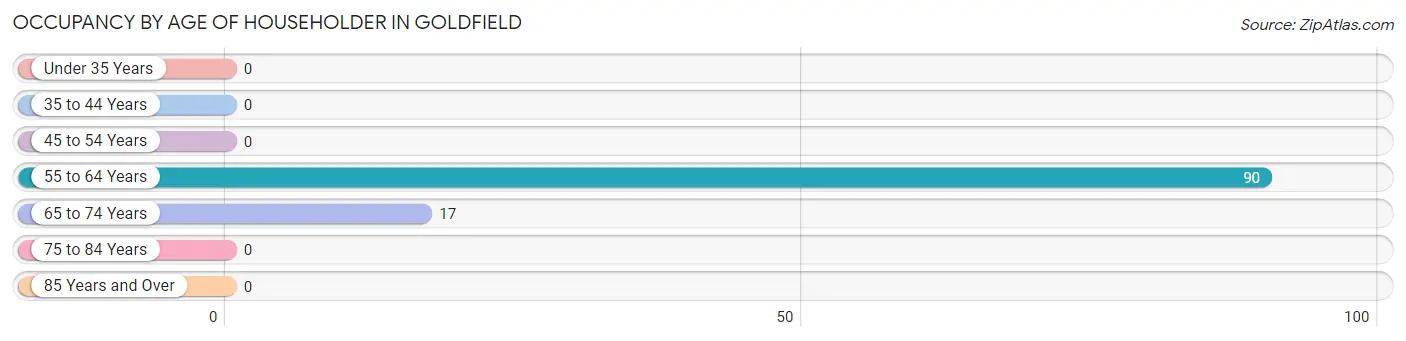
| Age Bracket | # Households | % Households |
| Under 35 Years | 0 | 0.0% |
| 35 to 44 Years | 0 | 0.0% |
| 45 to 54 Years | 0 | 0.0% |
| 55 to 64 Years | 90 | 84.1% |
| 65 to 74 Years | 17 | 15.9% |
| 75 to 84 Years | 0 | 0.0% |
| 85 Years and Over | 0 | 0.0% |
| Total | 107 | 100.0% |
Housing Finances in Goldfield
Median Income by Occupancy in Goldfield
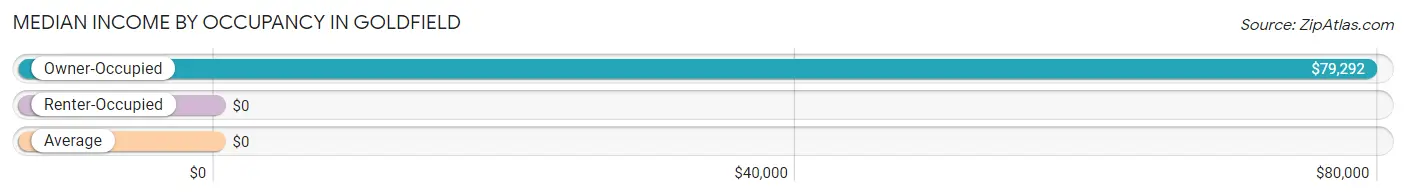
| Occupancy Type | # Households | Median Income |
| Owner-Occupied | 47 (43.9%) | $79,292 |
| Renter-Occupied | 60 (56.1%) | $0 |
| Average | 107 (100.0%) | $0 |
Occupancy by Householder Income Bracket in Goldfield
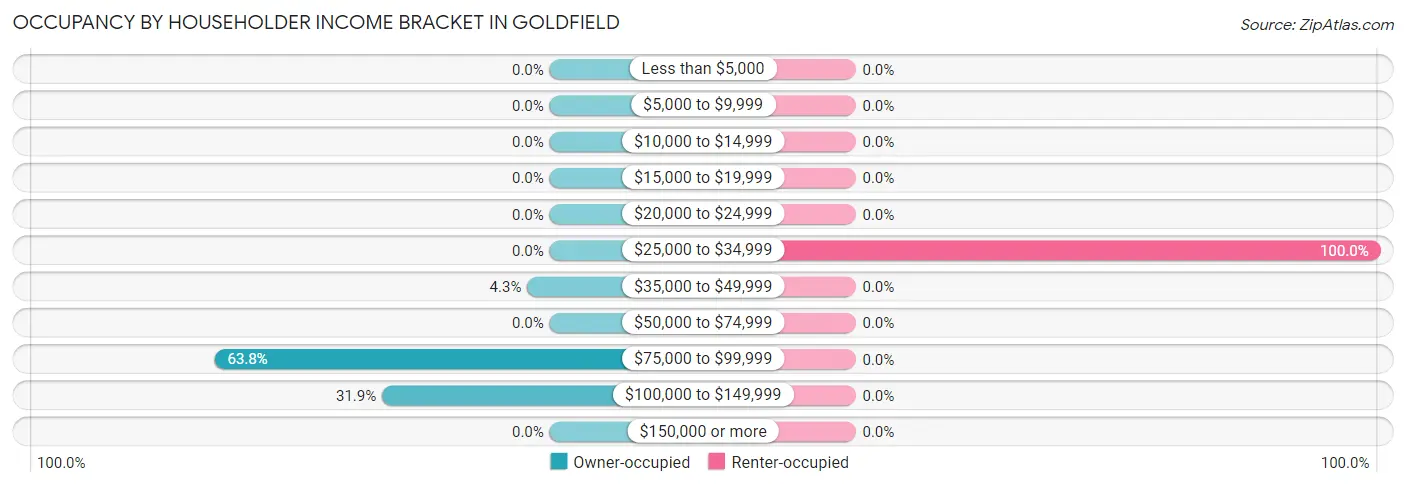
| Income Bracket | Owner-occupied | Renter-occupied |
| Less than $5,000 | 0 (0.0%) | 0 (0.0%) |
| $5,000 to $9,999 | 0 (0.0%) | 0 (0.0%) |
| $10,000 to $14,999 | 0 (0.0%) | 0 (0.0%) |
| $15,000 to $19,999 | 0 (0.0%) | 0 (0.0%) |
| $20,000 to $24,999 | 0 (0.0%) | 0 (0.0%) |
| $25,000 to $34,999 | 0 (0.0%) | 60 (100.0%) |
| $35,000 to $49,999 | 2 (4.3%) | 0 (0.0%) |
| $50,000 to $74,999 | 0 (0.0%) | 0 (0.0%) |
| $75,000 to $99,999 | 30 (63.8%) | 0 (0.0%) |
| $100,000 to $149,999 | 15 (31.9%) | 0 (0.0%) |
| $150,000 or more | 0 (0.0%) | 0 (0.0%) |
| Total | 47 (100.0%) | 60 (100.0%) |
Monthly Housing Cost Tiers in Goldfield
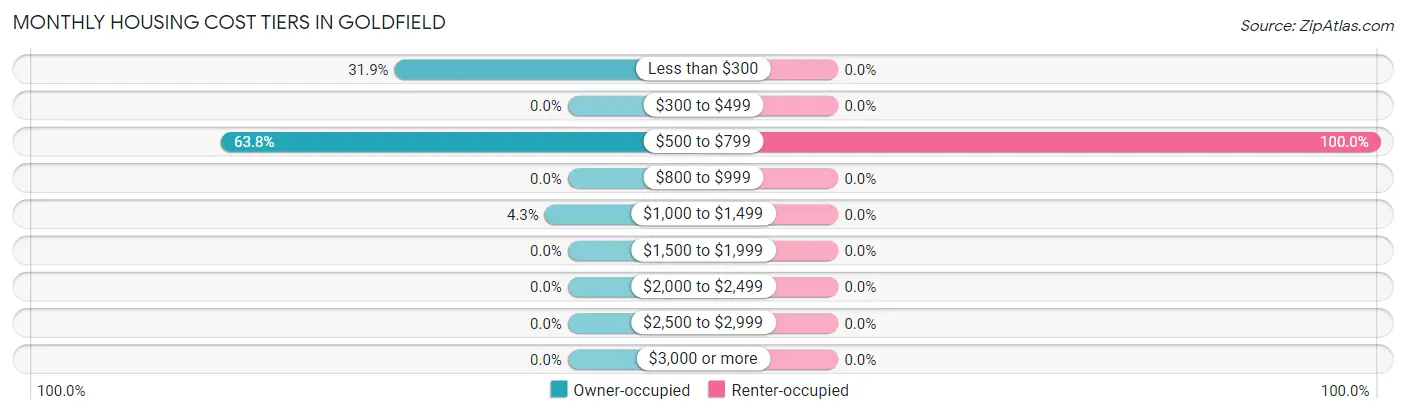
| Monthly Cost | Owner-occupied | Renter-occupied |
| Less than $300 | 15 (31.9%) | 0 (0.0%) |
| $300 to $499 | 0 (0.0%) | 0 (0.0%) |
| $500 to $799 | 30 (63.8%) | 60 (100.0%) |
| $800 to $999 | 0 (0.0%) | 0 (0.0%) |
| $1,000 to $1,499 | 2 (4.3%) | 0 (0.0%) |
| $1,500 to $1,999 | 0 (0.0%) | 0 (0.0%) |
| $2,000 to $2,499 | 0 (0.0%) | 0 (0.0%) |
| $2,500 to $2,999 | 0 (0.0%) | 0 (0.0%) |
| $3,000 or more | 0 (0.0%) | 0 (0.0%) |
| Total | 47 (100.0%) | 60 (100.0%) |
Physical Housing Characteristics in Goldfield
Housing Structures in Goldfield
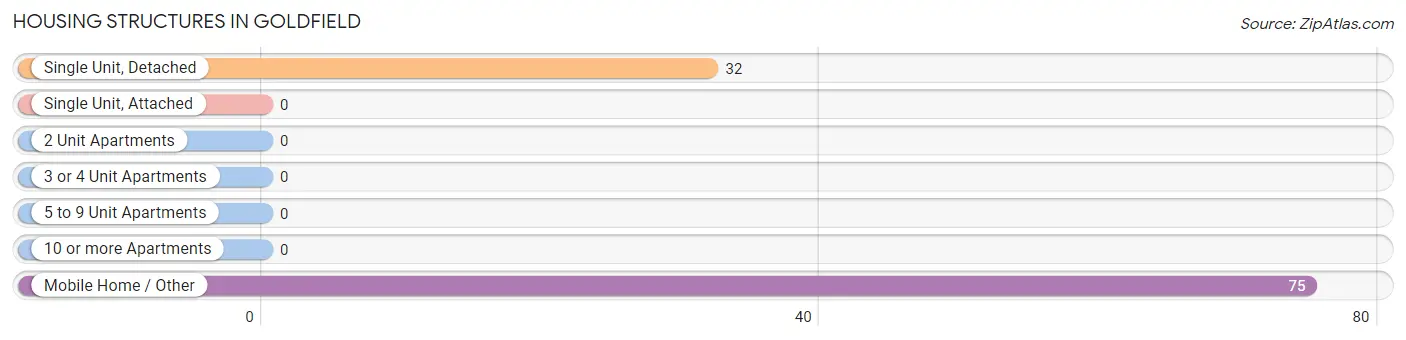
| Structure Type | # Housing Units | % Housing Units |
| Single Unit, Detached | 32 | 29.9% |
| Single Unit, Attached | 0 | 0.0% |
| 2 Unit Apartments | 0 | 0.0% |
| 3 or 4 Unit Apartments | 0 | 0.0% |
| 5 to 9 Unit Apartments | 0 | 0.0% |
| 10 or more Apartments | 0 | 0.0% |
| Mobile Home / Other | 75 | 70.1% |
| Total | 107 | 100.0% |
Housing Structures by Occupancy in Goldfield
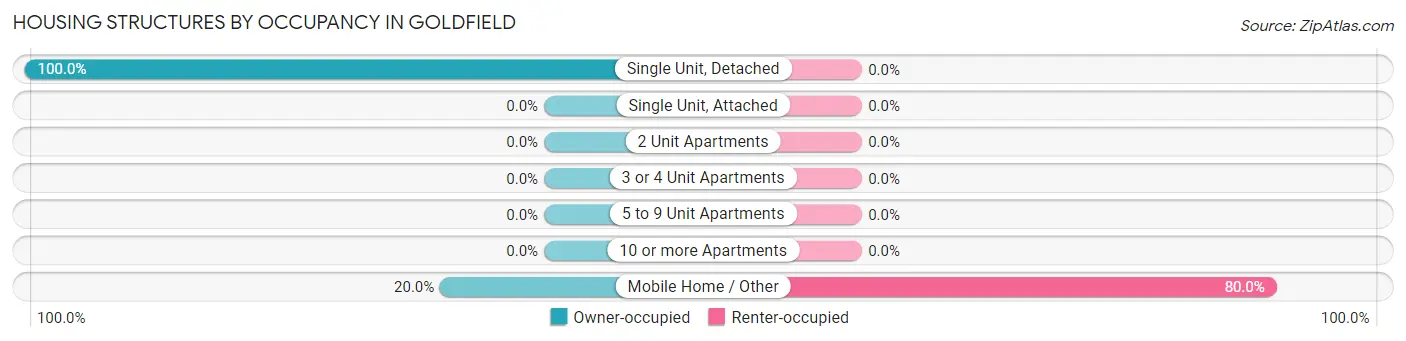
| Structure Type | Owner-occupied | Renter-occupied |
| Single Unit, Detached | 32 (100.0%) | 0 (0.0%) |
| Single Unit, Attached | 0 (0.0%) | 0 (0.0%) |
| 2 Unit Apartments | 0 (0.0%) | 0 (0.0%) |
| 3 or 4 Unit Apartments | 0 (0.0%) | 0 (0.0%) |
| 5 to 9 Unit Apartments | 0 (0.0%) | 0 (0.0%) |
| 10 or more Apartments | 0 (0.0%) | 0 (0.0%) |
| Mobile Home / Other | 15 (20.0%) | 60 (80.0%) |
| Total | 47 (43.9%) | 60 (56.1%) |
Housing Structures by Number of Rooms in Goldfield
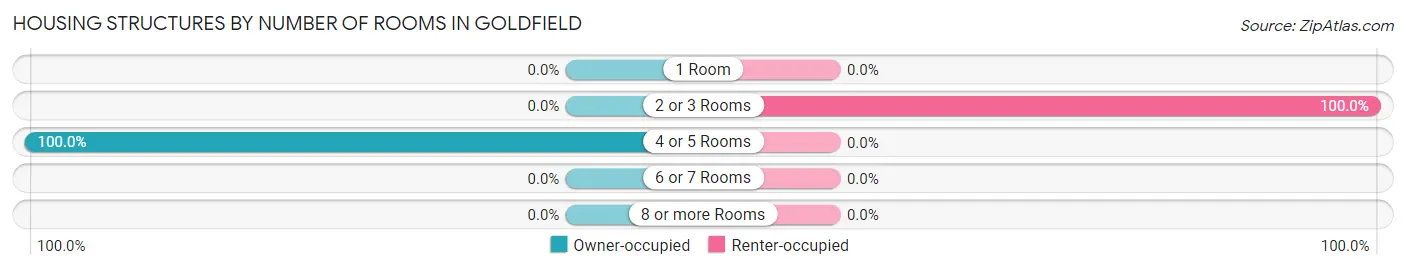
| Number of Rooms | Owner-occupied | Renter-occupied |
| 1 Room | 0 (0.0%) | 0 (0.0%) |
| 2 or 3 Rooms | 0 (0.0%) | 60 (100.0%) |
| 4 or 5 Rooms | 47 (100.0%) | 0 (0.0%) |
| 6 or 7 Rooms | 0 (0.0%) | 0 (0.0%) |
| 8 or more Rooms | 0 (0.0%) | 0 (0.0%) |
| Total | 47 (100.0%) | 60 (100.0%) |
Housing Structure by Heating Type in Goldfield
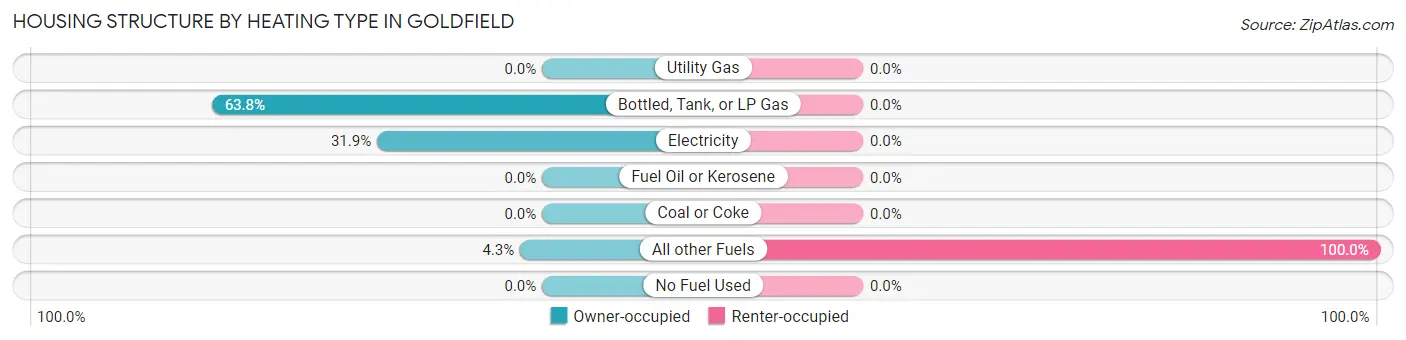
| Heating Type | Owner-occupied | Renter-occupied |
| Utility Gas | 0 (0.0%) | 0 (0.0%) |
| Bottled, Tank, or LP Gas | 30 (63.8%) | 0 (0.0%) |
| Electricity | 15 (31.9%) | 0 (0.0%) |
| Fuel Oil or Kerosene | 0 (0.0%) | 0 (0.0%) |
| Coal or Coke | 0 (0.0%) | 0 (0.0%) |
| All other Fuels | 2 (4.3%) | 60 (100.0%) |
| No Fuel Used | 0 (0.0%) | 0 (0.0%) |
| Total | 47 (100.0%) | 60 (100.0%) |
Household Vehicle Usage in Goldfield
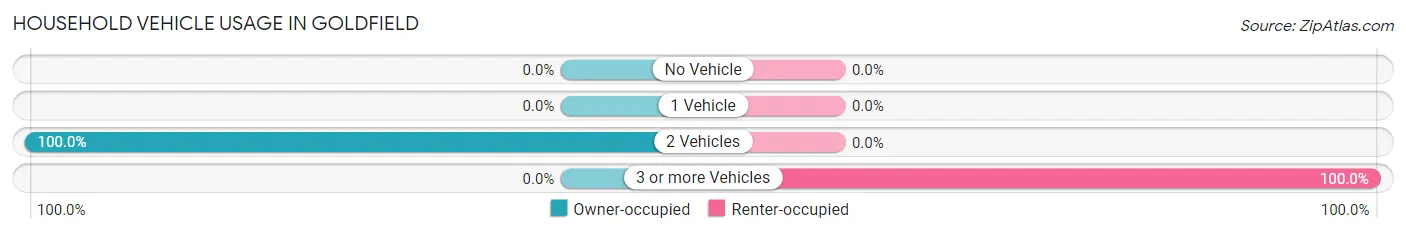
| Vehicles per Household | Owner-occupied | Renter-occupied |
| No Vehicle | 0 (0.0%) | 0 (0.0%) |
| 1 Vehicle | 0 (0.0%) | 0 (0.0%) |
| 2 Vehicles | 47 (100.0%) | 0 (0.0%) |
| 3 or more Vehicles | 0 (0.0%) | 60 (100.0%) |
| Total | 47 (100.0%) | 60 (100.0%) |
Real Estate & Mortgages in Goldfield
Real Estate and Mortgage Overview in Goldfield
| Characteristic | Without Mortgage | With Mortgage |
| Housing Units | 15 | 32 |
| Median Property Value | - | - |
| Median Household Income | - | - |
| Monthly Housing Costs | - | - |
| Real Estate Taxes | - | - |
Property Value by Mortgage Status in Goldfield
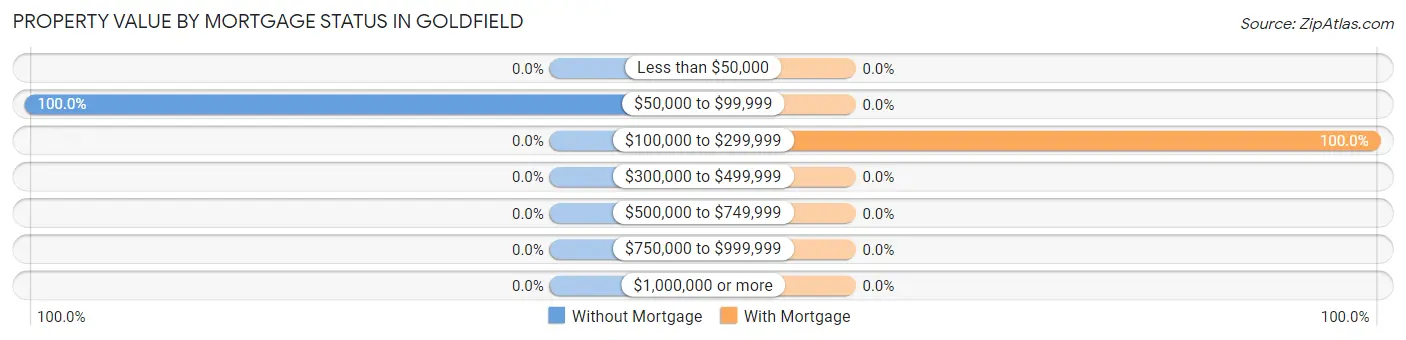
| Property Value | Without Mortgage | With Mortgage |
| Less than $50,000 | 0 (0.0%) | 0 (0.0%) |
| $50,000 to $99,999 | 15 (100.0%) | 0 (0.0%) |
| $100,000 to $299,999 | 0 (0.0%) | 32 (100.0%) |
| $300,000 to $499,999 | 0 (0.0%) | 0 (0.0%) |
| $500,000 to $749,999 | 0 (0.0%) | 0 (0.0%) |
| $750,000 to $999,999 | 0 (0.0%) | 0 (0.0%) |
| $1,000,000 or more | 0 (0.0%) | 0 (0.0%) |
| Total | 15 (100.0%) | 32 (100.0%) |
Household Income by Mortgage Status in Goldfield
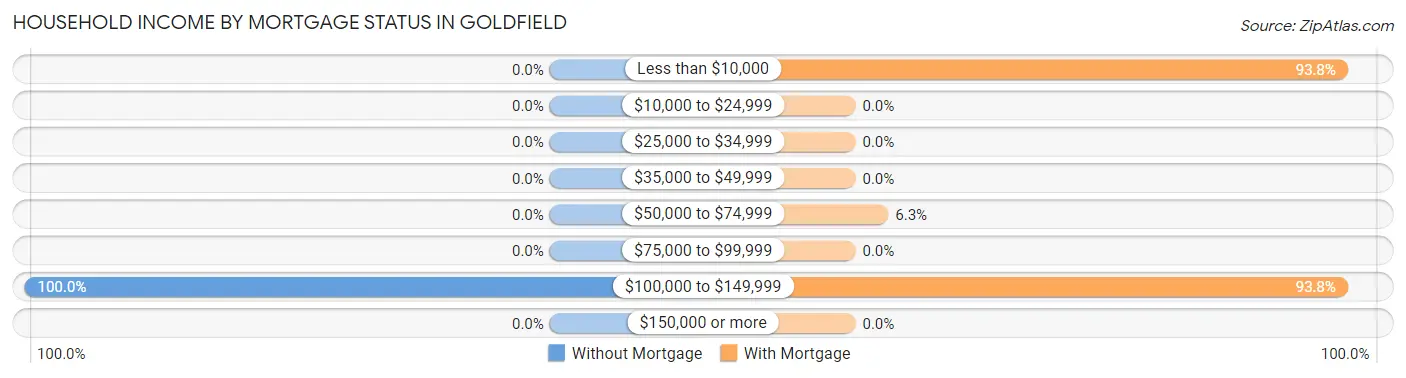
| Household Income | Without Mortgage | With Mortgage |
| Less than $10,000 | 0 (0.0%) | 30 (93.8%) |
| $10,000 to $24,999 | 0 (0.0%) | 0 (0.0%) |
| $25,000 to $34,999 | 0 (0.0%) | 0 (0.0%) |
| $35,000 to $49,999 | 0 (0.0%) | 0 (0.0%) |
| $50,000 to $74,999 | 0 (0.0%) | 2 (6.2%) |
| $75,000 to $99,999 | 0 (0.0%) | 0 (0.0%) |
| $100,000 to $149,999 | 15 (100.0%) | 30 (93.8%) |
| $150,000 or more | 0 (0.0%) | 0 (0.0%) |
| Total | 15 (100.0%) | 32 (100.0%) |
Property Value to Household Income Ratio in Goldfield
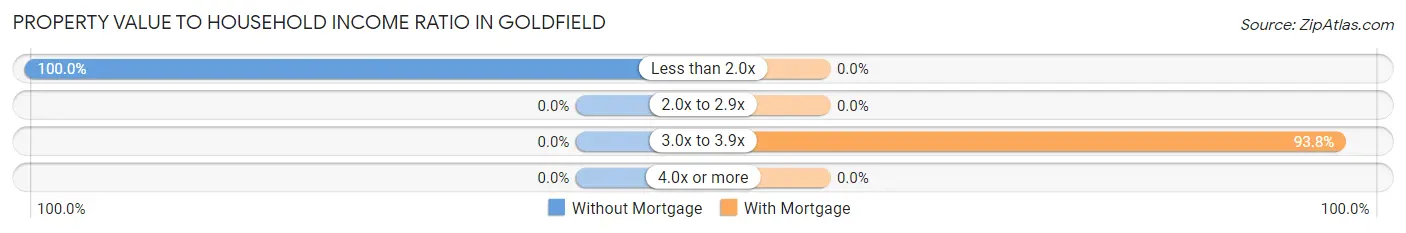
| Value-to-Income Ratio | Without Mortgage | With Mortgage |
| Less than 2.0x | 15 (100.0%) | 0 (0.0%) |
| 2.0x to 2.9x | 0 (0.0%) | 0 (0.0%) |
| 3.0x to 3.9x | 0 (0.0%) | 30 (93.8%) |
| 4.0x or more | 0 (0.0%) | 0 (0.0%) |
| Total | 15 (100.0%) | 32 (100.0%) |
Real Estate Taxes by Mortgage Status in Goldfield
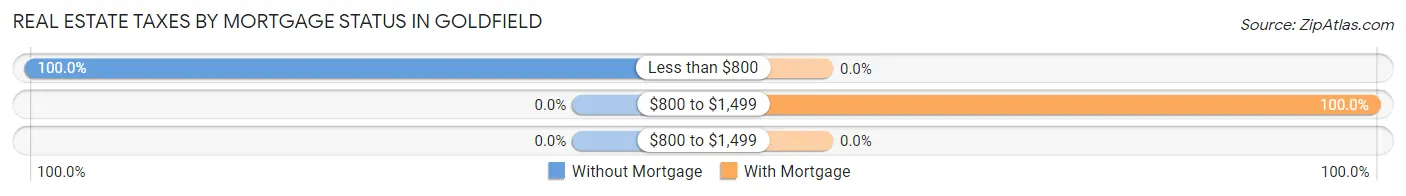
| Property Taxes | Without Mortgage | With Mortgage |
| Less than $800 | 15 (100.0%) | 0 (0.0%) |
| $800 to $1,499 | 0 (0.0%) | 32 (100.0%) |
| $800 to $1,499 | 0 (0.0%) | 0 (0.0%) |
| Total | 15 (100.0%) | 32 (100.0%) |
Health & Disability in Goldfield
Health Insurance Coverage by Age in Goldfield
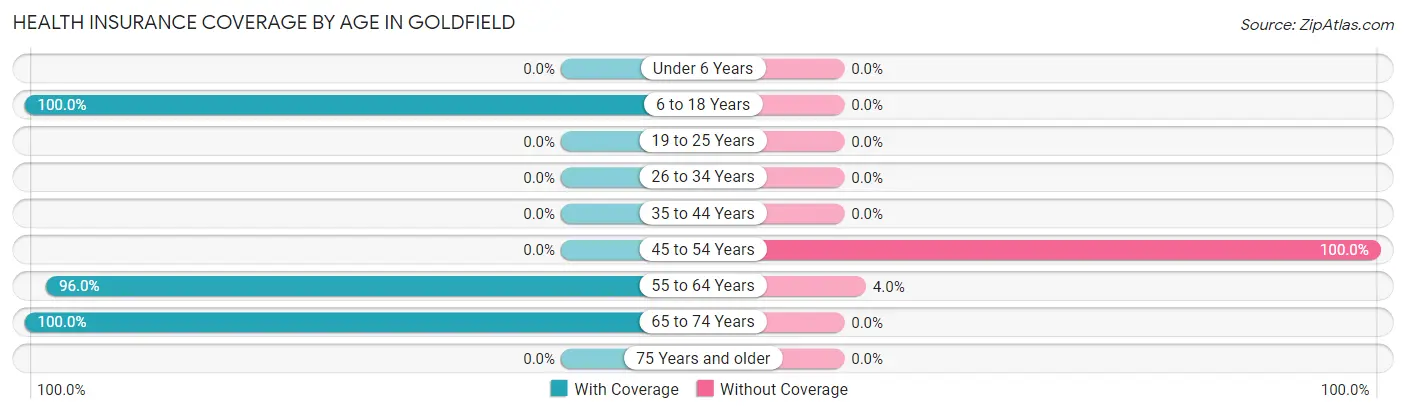
| Age Bracket | With Coverage | Without Coverage |
| Under 6 Years | 0 (0.0%) | 0 (0.0%) |
| 6 to 18 Years | 14 (100.0%) | 0 (0.0%) |
| 19 to 25 Years | 0 (0.0%) | 0 (0.0%) |
| 26 to 34 Years | 0 (0.0%) | 0 (0.0%) |
| 35 to 44 Years | 0 (0.0%) | 0 (0.0%) |
| 45 to 54 Years | 0 (0.0%) | 11 (100.0%) |
| 55 to 64 Years | 119 (96.0%) | 5 (4.0%) |
| 65 to 74 Years | 17 (100.0%) | 0 (0.0%) |
| 75 Years and older | 0 (0.0%) | 0 (0.0%) |
| Total | 150 (90.4%) | 16 (9.6%) |
Health Insurance Coverage by Citizenship Status in Goldfield
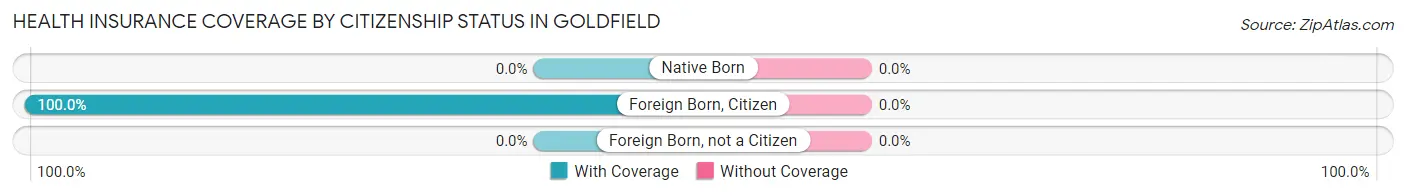
| Citizenship Status | With Coverage | Without Coverage |
| Native Born | 0 (0.0%) | 0 (0.0%) |
| Foreign Born, Citizen | 14 (100.0%) | 0 (0.0%) |
| Foreign Born, not a Citizen | 0 (0.0%) | 0 (0.0%) |
Health Insurance Coverage by Household Income in Goldfield
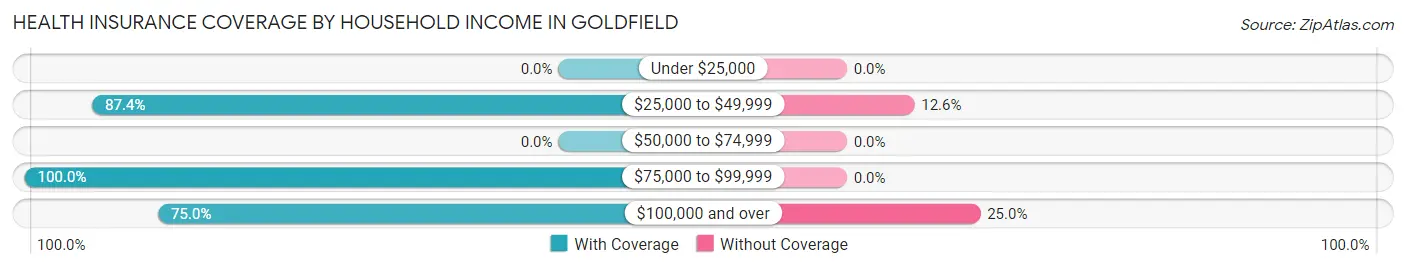
| Household Income | With Coverage | Without Coverage |
| Under $25,000 | 0 (0.0%) | 0 (0.0%) |
| $25,000 to $49,999 | 76 (87.4%) | 11 (12.6%) |
| $50,000 to $74,999 | 0 (0.0%) | 0 (0.0%) |
| $75,000 to $99,999 | 59 (100.0%) | 0 (0.0%) |
| $100,000 and over | 15 (75.0%) | 5 (25.0%) |
Public vs Private Health Insurance Coverage by Age in Goldfield
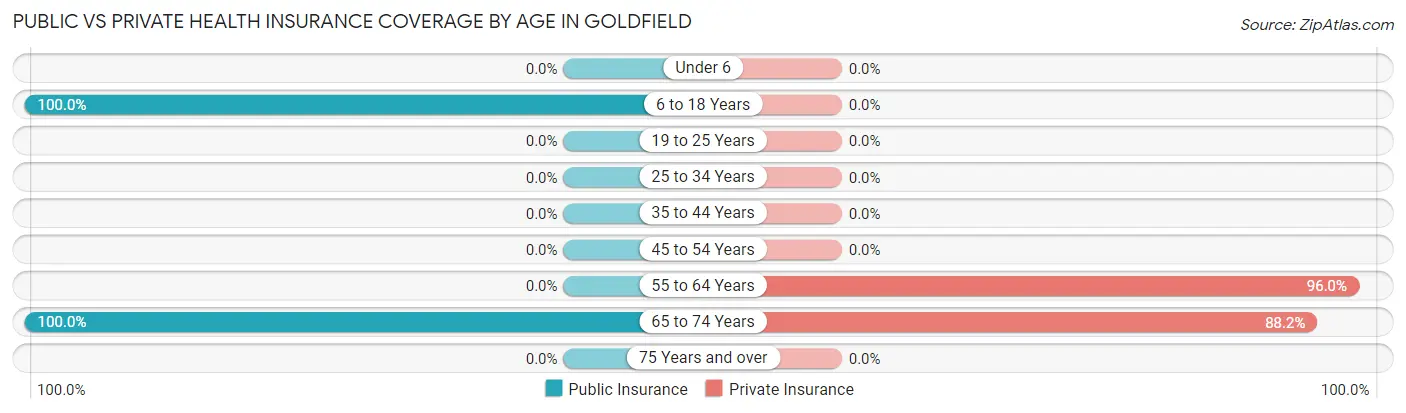
| Age Bracket | Public Insurance | Private Insurance |
| Under 6 | 0 (0.0%) | 0 (0.0%) |
| 6 to 18 Years | 14 (100.0%) | 0 (0.0%) |
| 19 to 25 Years | 0 (0.0%) | 0 (0.0%) |
| 25 to 34 Years | 0 (0.0%) | 0 (0.0%) |
| 35 to 44 Years | 0 (0.0%) | 0 (0.0%) |
| 45 to 54 Years | 0 (0.0%) | 0 (0.0%) |
| 55 to 64 Years | 0 (0.0%) | 119 (96.0%) |
| 65 to 74 Years | 17 (100.0%) | 15 (88.2%) |
| 75 Years and over | 0 (0.0%) | 0 (0.0%) |
| Total | 31 (18.7%) | 134 (80.7%) |
Disability Status by Sex by Age in Goldfield
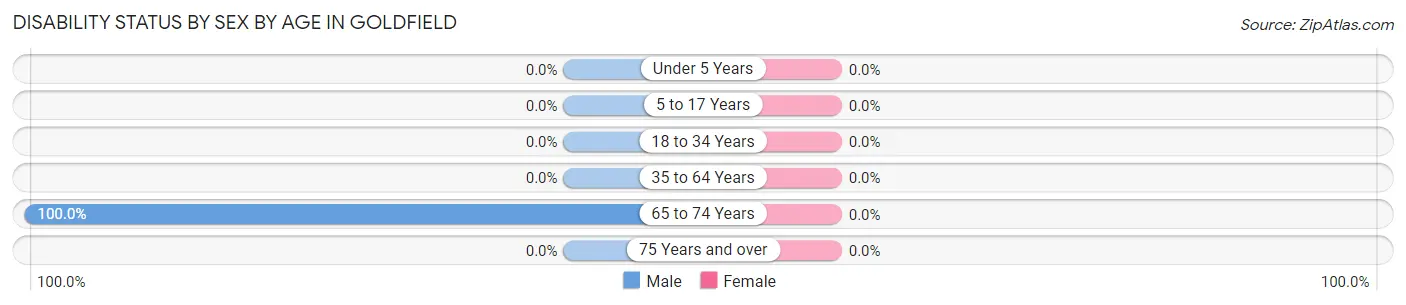
| Age Bracket | Male | Female |
| Under 5 Years | 0 (0.0%) | 0 (0.0%) |
| 5 to 17 Years | 0 (0.0%) | 0 (0.0%) |
| 18 to 34 Years | 0 (0.0%) | 0 (0.0%) |
| 35 to 64 Years | 0 (0.0%) | 0 (0.0%) |
| 65 to 74 Years | 2 (100.0%) | 0 (0.0%) |
| 75 Years and over | 0 (0.0%) | 0 (0.0%) |
Disability Class by Sex by Age in Goldfield
Disability Class: Hearing Difficulty
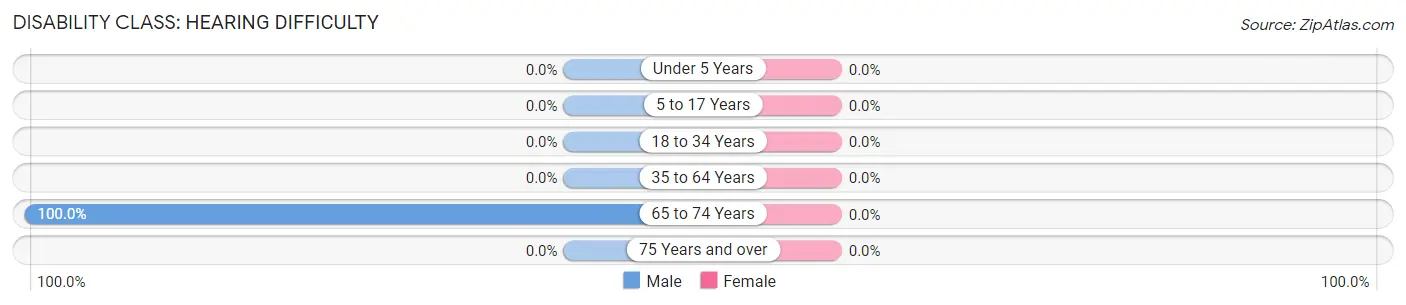
| Age Bracket | Male | Female |
| Under 5 Years | 0 (0.0%) | 0 (0.0%) |
| 5 to 17 Years | 0 (0.0%) | 0 (0.0%) |
| 18 to 34 Years | 0 (0.0%) | 0 (0.0%) |
| 35 to 64 Years | 0 (0.0%) | 0 (0.0%) |
| 65 to 74 Years | 2 (100.0%) | 0 (0.0%) |
| 75 Years and over | 0 (0.0%) | 0 (0.0%) |
Disability Class: Vision Difficulty
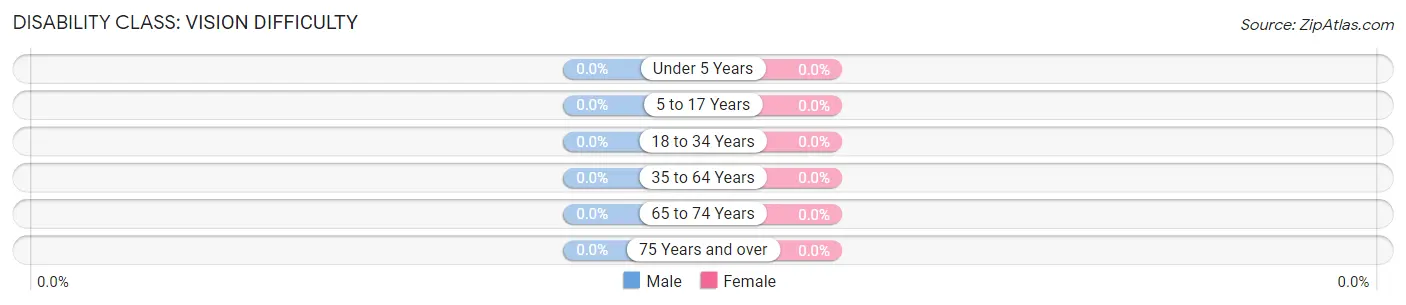
| Age Bracket | Male | Female |
| Under 5 Years | 0 (0.0%) | 0 (0.0%) |
| 5 to 17 Years | 0 (0.0%) | 0 (0.0%) |
| 18 to 34 Years | 0 (0.0%) | 0 (0.0%) |
| 35 to 64 Years | 0 (0.0%) | 0 (0.0%) |
| 65 to 74 Years | 0 (0.0%) | 0 (0.0%) |
| 75 Years and over | 0 (0.0%) | 0 (0.0%) |
Disability Class: Cognitive Difficulty
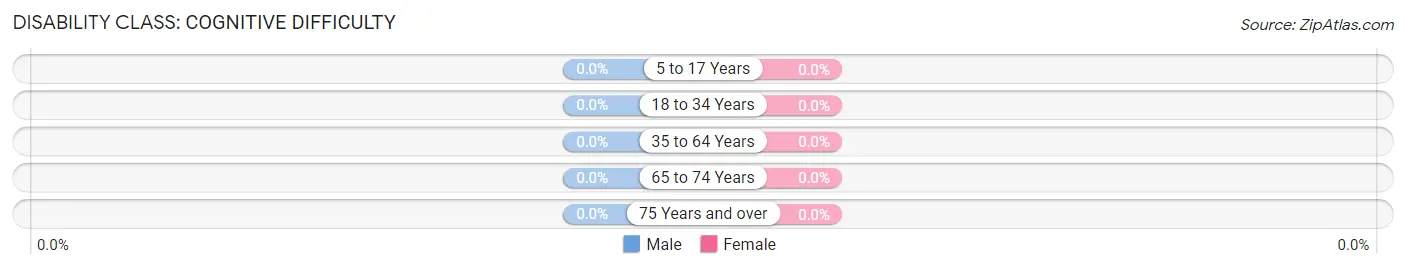
| Age Bracket | Male | Female |
| 5 to 17 Years | 0 (0.0%) | 0 (0.0%) |
| 18 to 34 Years | 0 (0.0%) | 0 (0.0%) |
| 35 to 64 Years | 0 (0.0%) | 0 (0.0%) |
| 65 to 74 Years | 0 (0.0%) | 0 (0.0%) |
| 75 Years and over | 0 (0.0%) | 0 (0.0%) |
Disability Class: Ambulatory Difficulty
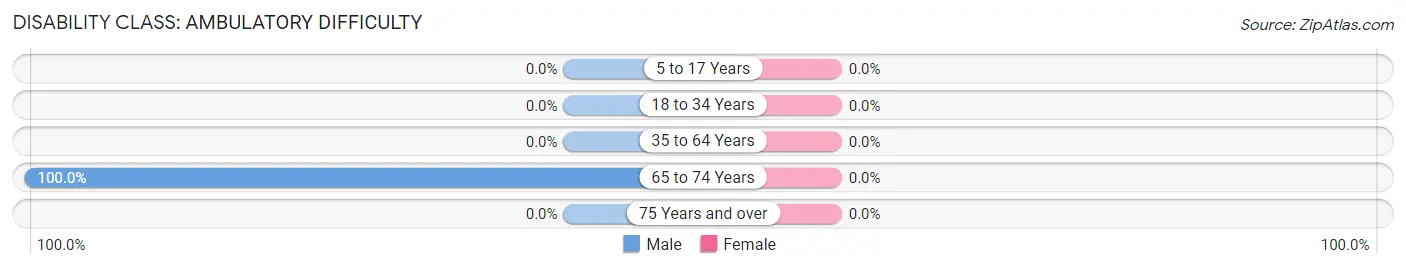
| Age Bracket | Male | Female |
| 5 to 17 Years | 0 (0.0%) | 0 (0.0%) |
| 18 to 34 Years | 0 (0.0%) | 0 (0.0%) |
| 35 to 64 Years | 0 (0.0%) | 0 (0.0%) |
| 65 to 74 Years | 2 (100.0%) | 0 (0.0%) |
| 75 Years and over | 0 (0.0%) | 0 (0.0%) |
Disability Class: Self-Care Difficulty

| Age Bracket | Male | Female |
| 5 to 17 Years | 0 (0.0%) | 0 (0.0%) |
| 18 to 34 Years | 0 (0.0%) | 0 (0.0%) |
| 35 to 64 Years | 0 (0.0%) | 0 (0.0%) |
| 65 to 74 Years | 0 (0.0%) | 0 (0.0%) |
| 75 Years and over | 0 (0.0%) | 0 (0.0%) |
Technology Access in Goldfield
Computing Device Access in Goldfield
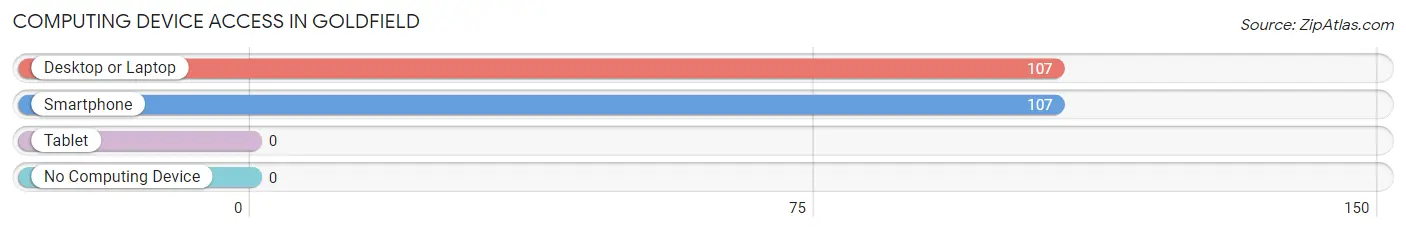
| Device Type | # Households | % Households |
| Desktop or Laptop | 107 | 100.0% |
| Smartphone | 107 | 100.0% |
| Tablet | 0 | 0.0% |
| No Computing Device | 0 | 0.0% |
| Total | 107 | 100.0% |
Internet Access in Goldfield
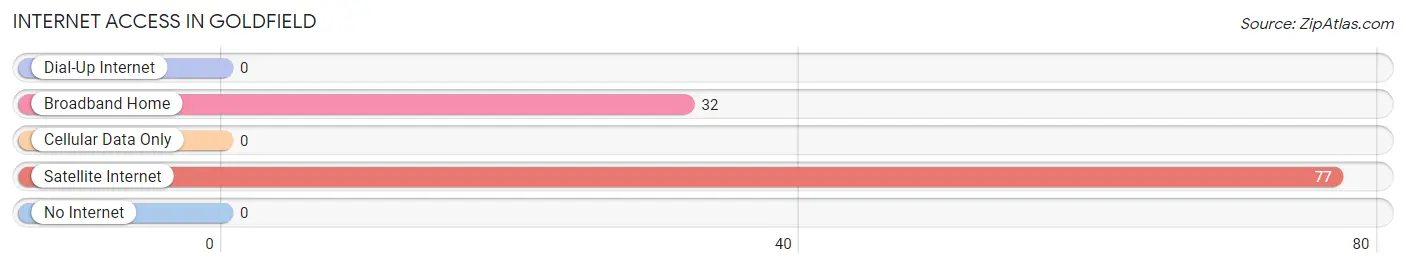
| Internet Type | # Households | % Households |
| Dial-Up Internet | 0 | 0.0% |
| Broadband Home | 32 | 29.9% |
| Cellular Data Only | 0 | 0.0% |
| Satellite Internet | 77 | 72.0% |
| No Internet | 0 | 0.0% |
| Total | 107 | 100.0% |
Goldfield Summary
Goldfield, Colorado is a small, unincorporated community located in the San Juan Mountains of southwestern Colorado. It is situated in Hinsdale County, approximately 25 miles south of Lake City and about 40 miles north of Durango. The town was founded in 1891 by prospectors who were searching for gold in the area. The town was named after the gold that was discovered in the area.
History
Goldfield was founded in 1891 by prospectors who were searching for gold in the area. The town was named after the gold that was discovered in the area. The town quickly grew to a population of over 1,000 people and had a post office, a school, a hotel, a saloon, and several stores. The town was a bustling mining community until the early 1900s when the gold began to run out. By the 1920s, the population had dwindled to only a few hundred people.
The town was largely abandoned until the 1970s when it was rediscovered by a group of hippies who were looking for a place to live off the grid. The hippies began to restore the old buildings and the town slowly began to come back to life. Today, Goldfield is a small, unincorporated community with a population of around 200 people.
Geography
Goldfield is located in the San Juan Mountains of southwestern Colorado. It is situated in Hinsdale County, approximately 25 miles south of Lake City and about 40 miles north of Durango. The town is located at an elevation of 8,800 feet and is surrounded by the San Juan National Forest. The area is known for its rugged beauty and is a popular destination for hikers, campers, and other outdoor enthusiasts.
Economy
The economy of Goldfield is largely based on tourism. The town is a popular destination for hikers, campers, and other outdoor enthusiasts. There are several restaurants, shops, and other businesses in the town that cater to tourists. The town also has a small mining industry, with several small mines in the area.
Demographics
As of the 2010 census, the population of Goldfield was 200 people. The racial makeup of the town was 97.5% White, 0.5% Native American, 0.5% Asian, and 1.5% from other races. The median household income was $37,500 and the median family income was $41,250. The per capita income was $19,000.
Conclusion
Goldfield, Colorado is a small, unincorporated community located in the San Juan Mountains of southwestern Colorado. It was founded in 1891 by prospectors who were searching for gold in the area and quickly grew to a population of over 1,000 people. The town was largely abandoned until the 1970s when it was rediscovered by a group of hippies who were looking for a place to live off the grid. Today, Goldfield is a small, unincorporated community with a population of around 200 people. The economy of Goldfield is largely based on tourism and the town is a popular destination for hikers, campers, and other outdoor enthusiasts.
Common Questions
What is Per Capita Income in Goldfield?
Per Capita income in Goldfield is $31,873.
What is Inequality or Gini Index in Goldfield?
Inequality or Gini Index in Goldfield is 0.29.
What is the Total Population of Goldfield?
Total Population of Goldfield is 166.
What is the Total Male Population of Goldfield?
Total Male Population of Goldfield is 111.
What is the Total Female Population of Goldfield?
Total Female Population of Goldfield is 55.
What is the Ratio of Males per 100 Females in Goldfield?
There are 201.82 Males per 100 Females in Goldfield.
What is the Ratio of Females per 100 Males in Goldfield?
There are 49.55 Females per 100 Males in Goldfield.
What is the Median Population Age in Goldfield?
Median Population Age in Goldfield is 61.5 Years.
What is the Average Family Size in Goldfield
Average Family Size in Goldfield is 2.7 People.
What is the Average Household Size in Goldfield
Average Household Size in Goldfield is 1.6 People.
How Large is the Labor Force in Goldfield?
There are 149 People in the Labor Forcein in Goldfield.
What is the Percentage of People in the Labor Force in Goldfield?
89.8% of People are in the Labor Force in Goldfield.