Cane Beds, AZ Map & Demographics
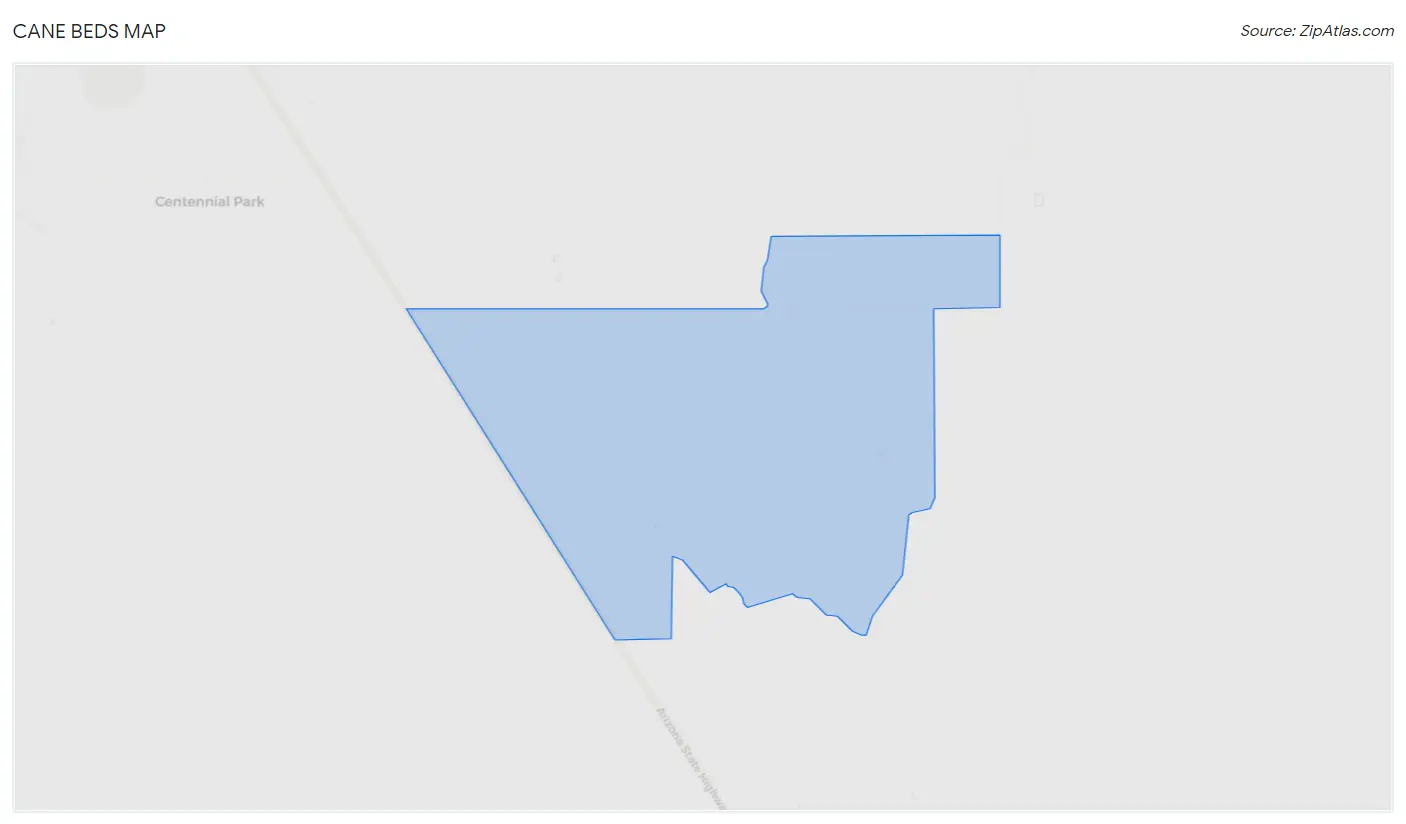
Cane Beds Map
Cane Beds Overview
$26,289
PER CAPITA INCOME
0.43
INEQUALITY / GINI INDEX
246
TOTAL POPULATION
166
MALE POPULATION
80
FEMALE POPULATION
207.50
MALES / 100 FEMALES
48.19
FEMALES / 100 MALES
27.6
MEDIAN AGE
6.7
AVG FAMILY SIZE
3.8
AVG HOUSEHOLD SIZE
113
LABOR FORCE [ PEOPLE ]
70.6%
PERCENT IN LABOR FORCE
Cane Beds Area Codes
Income in Cane Beds
Income Overview in Cane Beds
| Characteristic | Number | Measure |
| Per Capita Income | 246 | $26,289 |
| Median Family Income | 17 | $0 |
| Mean Family Income | 17 | $0 |
| Median Household Income | 64 | $0 |
| Mean Household Income | 64 | $97,872 |
| Income Deficit | 17 | $0 |
| Wage / Income Gap (%) | 246 | 0.00% |
| Wage / Income Gap ($) | 246 | 100.00¢ per $1 |
| Gini / Inequality Index | 246 | 0.43 |
Earnings by Sex in Cane Beds
| Sex | Number | Average Earnings |
| Male | 34 (30.1%) | $0 |
| Female | 79 (69.9%) | $0 |
| Total | 113 (100.0%) | $0 |
Earnings by Sex by Income Bracket in Cane Beds
The most common earnings brackets in Cane Beds are $55,000 to $64,999 for men (34 | 100.0%) and $10,000 to $12,499 for women (62 | 78.5%).
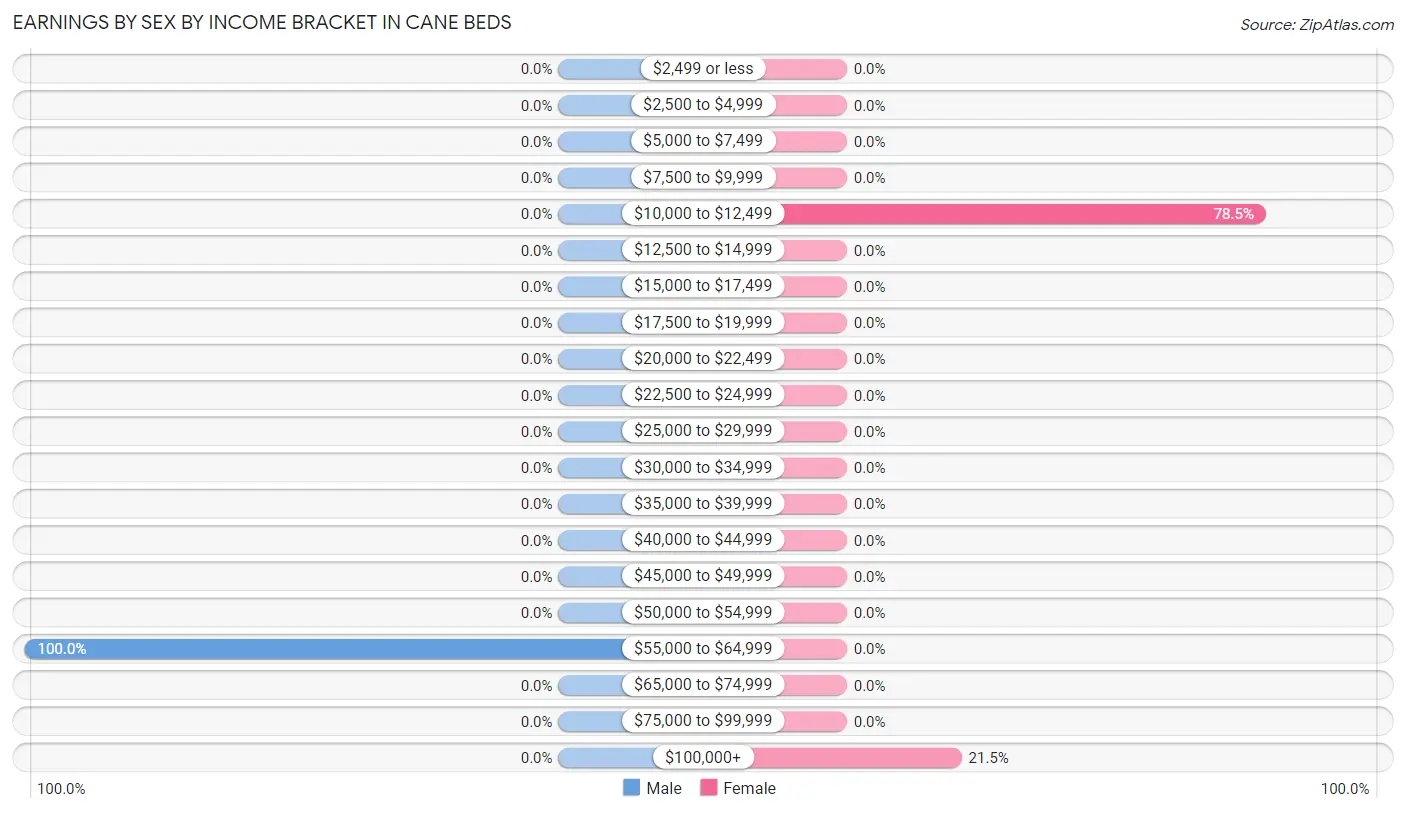
| Income | Male | Female |
| $2,499 or less | 0 (0.0%) | 0 (0.0%) |
| $2,500 to $4,999 | 0 (0.0%) | 0 (0.0%) |
| $5,000 to $7,499 | 0 (0.0%) | 0 (0.0%) |
| $7,500 to $9,999 | 0 (0.0%) | 0 (0.0%) |
| $10,000 to $12,499 | 0 (0.0%) | 62 (78.5%) |
| $12,500 to $14,999 | 0 (0.0%) | 0 (0.0%) |
| $15,000 to $17,499 | 0 (0.0%) | 0 (0.0%) |
| $17,500 to $19,999 | 0 (0.0%) | 0 (0.0%) |
| $20,000 to $22,499 | 0 (0.0%) | 0 (0.0%) |
| $22,500 to $24,999 | 0 (0.0%) | 0 (0.0%) |
| $25,000 to $29,999 | 0 (0.0%) | 0 (0.0%) |
| $30,000 to $34,999 | 0 (0.0%) | 0 (0.0%) |
| $35,000 to $39,999 | 0 (0.0%) | 0 (0.0%) |
| $40,000 to $44,999 | 0 (0.0%) | 0 (0.0%) |
| $45,000 to $49,999 | 0 (0.0%) | 0 (0.0%) |
| $50,000 to $54,999 | 0 (0.0%) | 0 (0.0%) |
| $55,000 to $64,999 | 34 (100.0%) | 0 (0.0%) |
| $65,000 to $74,999 | 0 (0.0%) | 0 (0.0%) |
| $75,000 to $99,999 | 0 (0.0%) | 0 (0.0%) |
| $100,000+ | 0 (0.0%) | 17 (21.5%) |
| Total | 34 (100.0%) | 79 (100.0%) |
Earnings by Sex by Educational Attainment in Cane Beds
| Educational Attainment | Male Income | Female Income |
| Less than High School | - | - |
| High School Diploma | - | - |
| College or Associate's Degree | - | - |
| Bachelor's Degree | - | - |
| Graduate Degree | - | - |
| Total | - | - |
Family Income in Cane Beds
Family Income Brackets in Cane Beds
According to the Cane Beds family income data, there are 17 families falling into the $200,000+ income range, which is the most common income bracket and makes up 100.0% of all families.
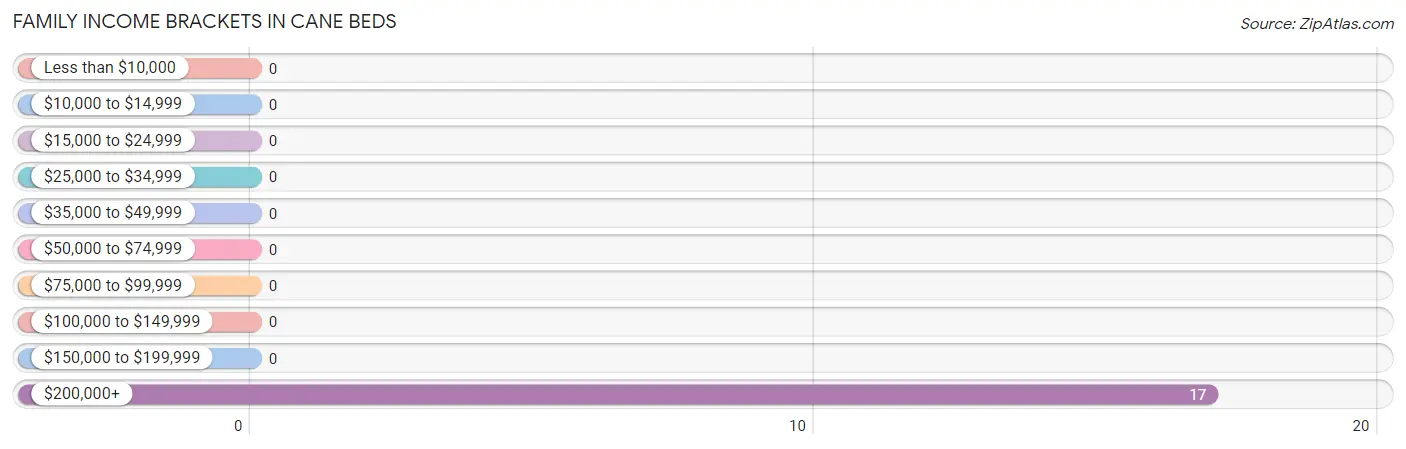
| Income Bracket | # Families | % Families |
| Less than $10,000 | 0 | 0.0% |
| $10,000 to $14,999 | 0 | 0.0% |
| $15,000 to $24,999 | 0 | 0.0% |
| $25,000 to $34,999 | 0 | 0.0% |
| $35,000 to $49,999 | 0 | 0.0% |
| $50,000 to $74,999 | 0 | 0.0% |
| $75,000 to $99,999 | 0 | 0.0% |
| $100,000 to $149,999 | 0 | 0.0% |
| $150,000 to $199,999 | 0 | 0.0% |
| $200,000+ | 17 | 100.0% |
Family Income by Famaliy Size in Cane Beds
| Income Bracket | # Families | Median Income |
| 2-Person Families | 0 (0.0%) | $0 |
| 3-Person Families | 0 (0.0%) | $0 |
| 4-Person Families | 17 (100.0%) | $0 |
| 5-Person Families | 0 (0.0%) | $0 |
| 6-Person Families | 0 (0.0%) | $0 |
| 7+ Person Families | 0 (0.0%) | $0 |
| Total | 17 (100.0%) | $0 |
Family Income by Number of Earners in Cane Beds
| Number of Earners | # Families | Median Income |
| No Earners | 0 (0.0%) | $0 |
| 1 Earner | 0 (0.0%) | $0 |
| 2 Earners | 17 (100.0%) | $0 |
| 3+ Earners | 0 (0.0%) | $0 |
| Total | 17 (100.0%) | $0 |
Household Income in Cane Beds
Household Income Brackets in Cane Beds
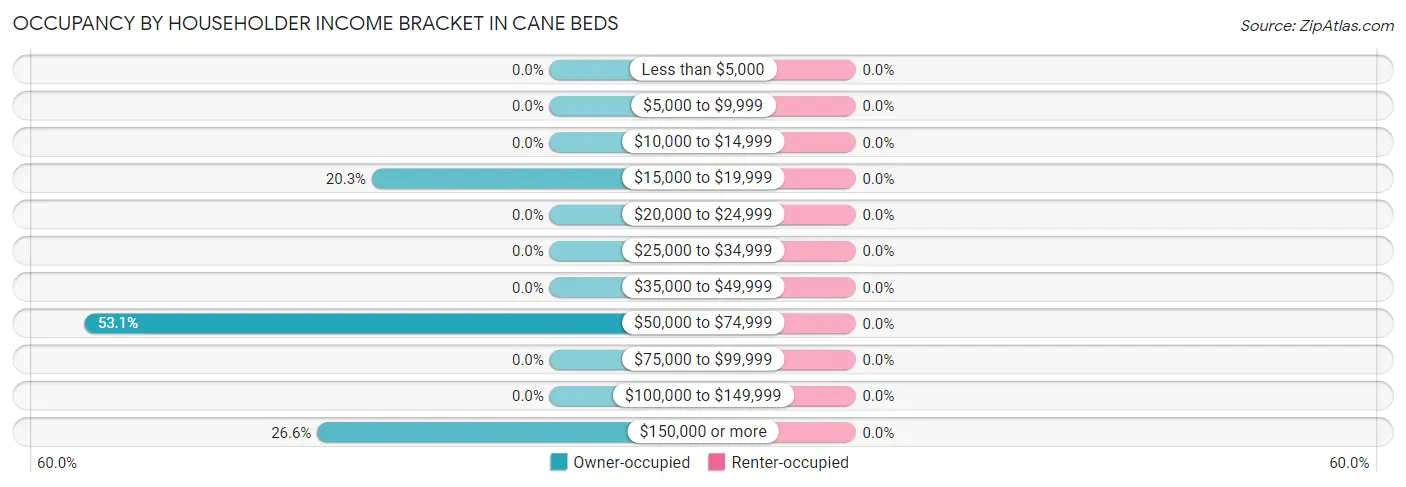
With 34 households falling in the category, the $50,000 to $74,999 income range is the most frequent in Cane Beds, accounting for 53.1% of all households.
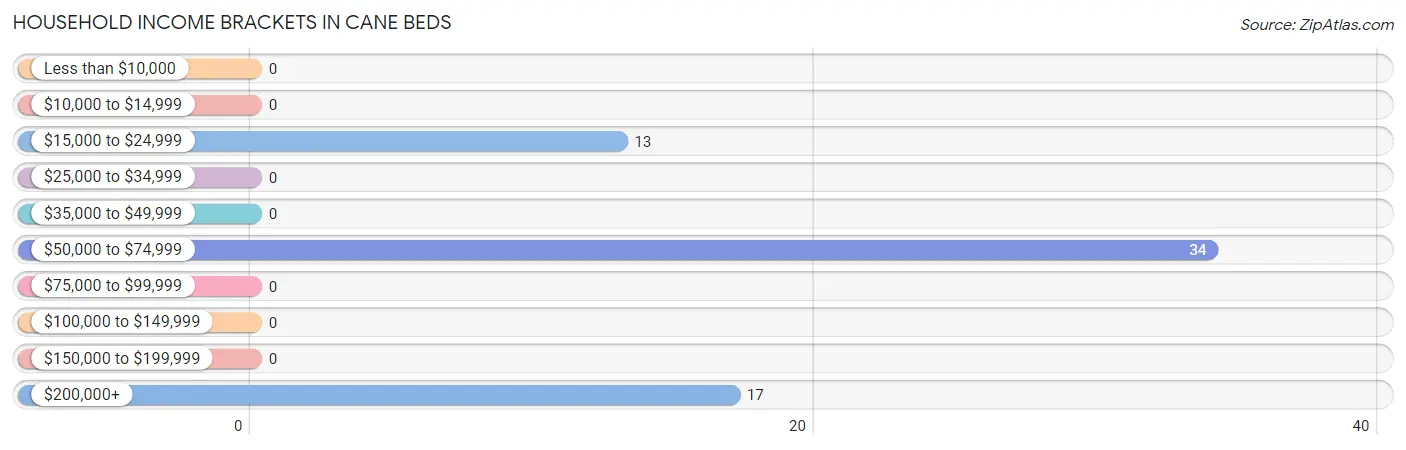
| Income Bracket | # Households | % Households |
| Less than $10,000 | 0 | 0.0% |
| $10,000 to $14,999 | 0 | 0.0% |
| $15,000 to $24,999 | 13 | 20.3% |
| $25,000 to $34,999 | 0 | 0.0% |
| $35,000 to $49,999 | 0 | 0.0% |
| $50,000 to $74,999 | 34 | 53.1% |
| $75,000 to $99,999 | 0 | 0.0% |
| $100,000 to $149,999 | 0 | 0.0% |
| $150,000 to $199,999 | 0 | 0.0% |
| $200,000+ | 17 | 26.6% |
Household Income by Householder Age in Cane Beds
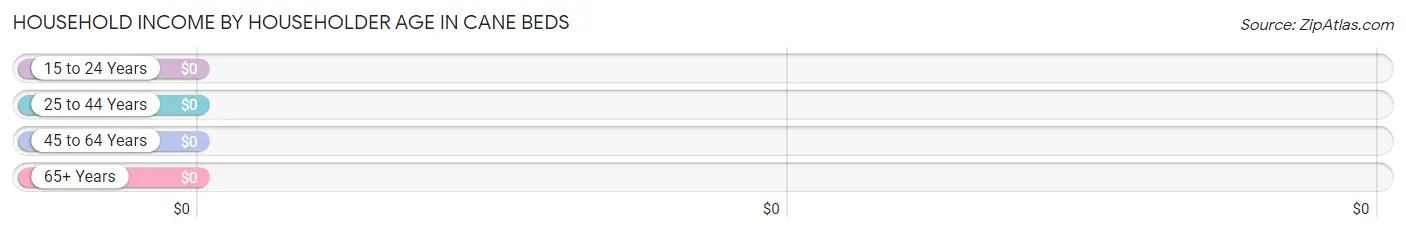
| Income Bracket | # Households | Median Income |
| 15 to 24 Years | 0 (0.0%) | $0 |
| 25 to 44 Years | 34 (53.1%) | $0 |
| 45 to 64 Years | 17 (26.6%) | $0 |
| 65+ Years | 13 (20.3%) | $0 |
| Total | 64 (100.0%) | $0 |
Poverty in Cane Beds
Income Below Poverty by Sex and Age in Cane Beds
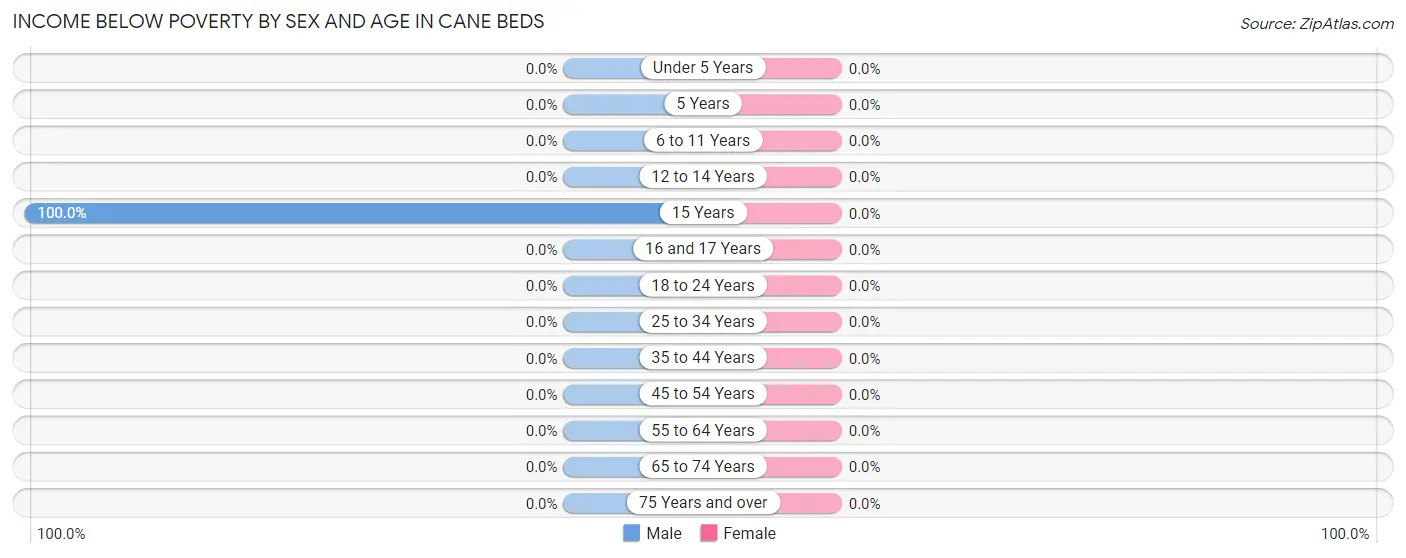
| Age Bracket | Male | Female |
| Under 5 Years | 0 (0.0%) | 0 (0.0%) |
| 5 Years | 0 (0.0%) | 0 (0.0%) |
| 6 to 11 Years | 0 (0.0%) | 0 (0.0%) |
| 12 to 14 Years | 0 (0.0%) | 0 (0.0%) |
| 15 Years | 86 (100.0%) | 0 (0.0%) |
| 16 and 17 Years | 0 (0.0%) | 0 (0.0%) |
| 18 to 24 Years | 0 (0.0%) | 0 (0.0%) |
| 25 to 34 Years | 0 (0.0%) | 0 (0.0%) |
| 35 to 44 Years | 0 (0.0%) | 0 (0.0%) |
| 45 to 54 Years | 0 (0.0%) | 0 (0.0%) |
| 55 to 64 Years | 0 (0.0%) | 0 (0.0%) |
| 65 to 74 Years | 0 (0.0%) | 0 (0.0%) |
| 75 Years and over | 0 (0.0%) | 0 (0.0%) |
| Total | 86 (51.8%) | 0 (0.0%) |
Income Above Poverty by Sex and Age in Cane Beds
According to the poverty statistics in Cane Beds, males aged 25 to 34 years and females aged 25 to 34 years are the age groups that are most secure financially, with 100.0% of males and 100.0% of females in these age groups living above the poverty line.
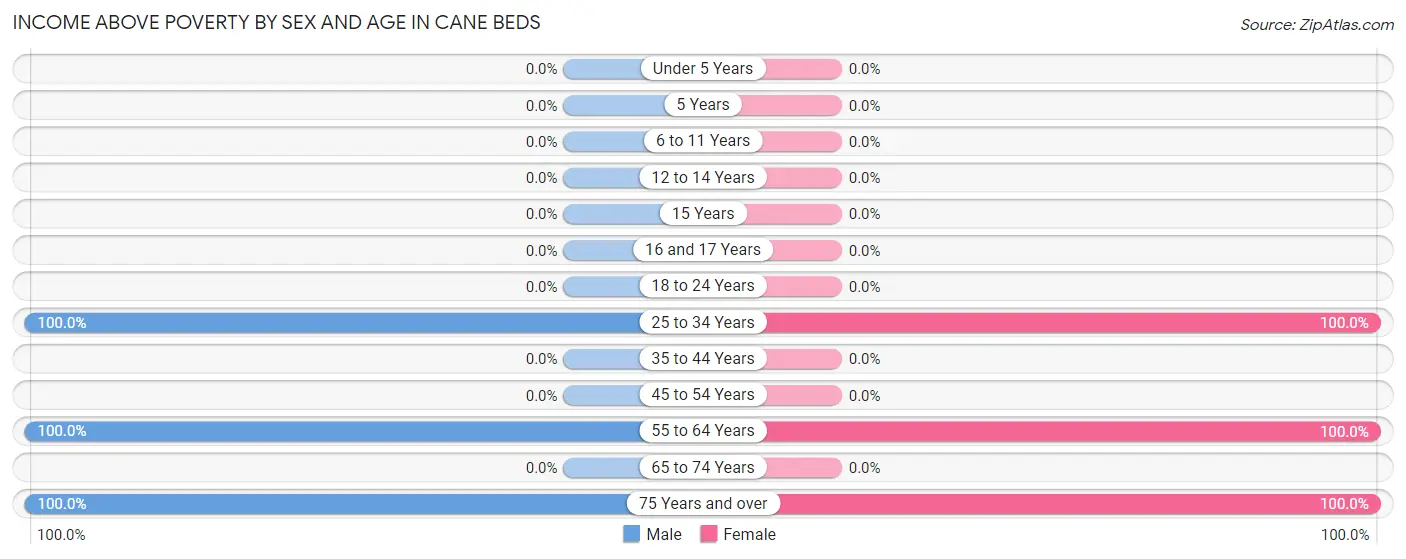
| Age Bracket | Male | Female |
| Under 5 Years | 0 (0.0%) | 0 (0.0%) |
| 5 Years | 0 (0.0%) | 0 (0.0%) |
| 6 to 11 Years | 0 (0.0%) | 0 (0.0%) |
| 12 to 14 Years | 0 (0.0%) | 0 (0.0%) |
| 15 Years | 0 (0.0%) | 0 (0.0%) |
| 16 and 17 Years | 0 (0.0%) | 0 (0.0%) |
| 18 to 24 Years | 0 (0.0%) | 0 (0.0%) |
| 25 to 34 Years | 34 (100.0%) | 62 (100.0%) |
| 35 to 44 Years | 0 (0.0%) | 0 (0.0%) |
| 45 to 54 Years | 0 (0.0%) | 0 (0.0%) |
| 55 to 64 Years | 33 (100.0%) | 17 (100.0%) |
| 65 to 74 Years | 0 (0.0%) | 0 (0.0%) |
| 75 Years and over | 13 (100.0%) | 1 (100.0%) |
| Total | 80 (48.2%) | 80 (100.0%) |
Income Below Poverty Among Married-Couple Families in Cane Beds
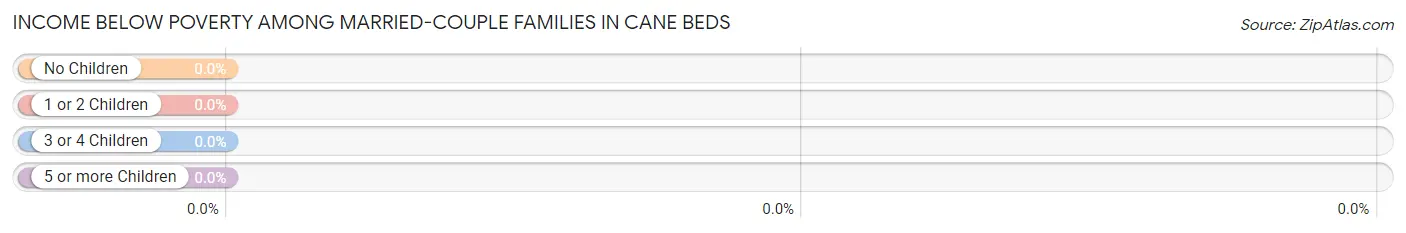
| Children | Above Poverty | Below Poverty |
| No Children | 17 (100.0%) | 0 (0.0%) |
| 1 or 2 Children | 0 (0.0%) | 0 (0.0%) |
| 3 or 4 Children | 0 (0.0%) | 0 (0.0%) |
| 5 or more Children | 0 (0.0%) | 0 (0.0%) |
| Total | 17 (100.0%) | 0 (0.0%) |
Income Below Poverty Among Single-Parent Households in Cane Beds
| Children | Single Father | Single Mother |
| No Children | 0 (0.0%) | 0 (0.0%) |
| 1 or 2 Children | 0 (0.0%) | 0 (0.0%) |
| 3 or 4 Children | 0 (0.0%) | 0 (0.0%) |
| 5 or more Children | 0 (0.0%) | 0 (0.0%) |
| Total | 0 (0.0%) | 0 (0.0%) |
Income Below Poverty Among Married-Couple vs Single-Parent Households in Cane Beds
| Children | Married-Couple Families | Single-Parent Households |
| No Children | 0 (0.0%) | 0 (0.0%) |
| 1 or 2 Children | 0 (0.0%) | 0 (0.0%) |
| 3 or 4 Children | 0 (0.0%) | 0 (0.0%) |
| 5 or more Children | 0 (0.0%) | 0 (0.0%) |
| Total | 0 (0.0%) | 0 (0.0%) |
Race in Cane Beds
The most populous races in Cane Beds are White / Caucasian (166 | 67.5%), and Two or more Races (80 | 32.5%).
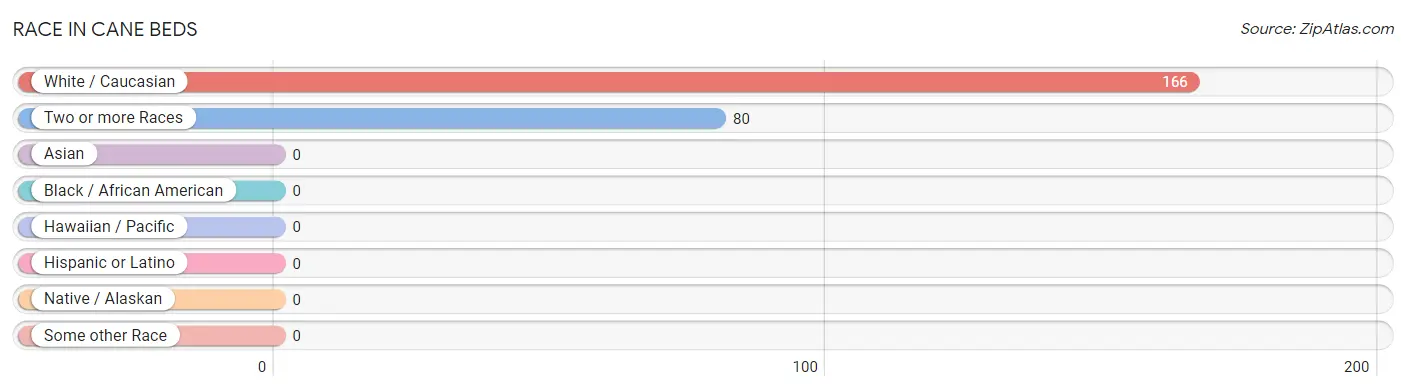
| Race | # Population | % Population |
| Asian | 0 | 0.0% |
| Black / African American | 0 | 0.0% |
| Hawaiian / Pacific | 0 | 0.0% |
| Hispanic or Latino | 0 | 0.0% |
| Native / Alaskan | 0 | 0.0% |
| White / Caucasian | 166 | 67.5% |
| Two or more Races | 80 | 32.5% |
| Some other Race | 0 | 0.0% |
| Total | 246 | 100.0% |
Ancestry in Cane Beds
The most populous ancestries reported in Cane Beds are European (199 | 80.9%), and American (13 | 5.3%), together accounting for 86.2% of all Cane Beds residents.
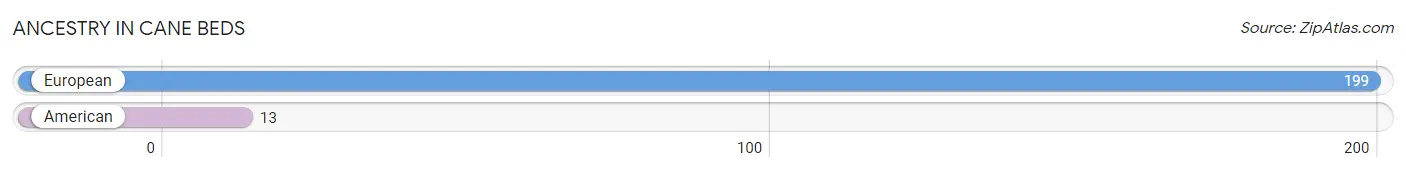
| Ancestry | # Population | % Population |
| American | 13 | 5.3% |
| European | 199 | 80.9% | View All 2 Rows |
Immigrants in Cane Beds

| Immigration Origin | # Population | % Population | View All 0 Rows |
Sex and Age in Cane Beds
Sex and Age in Cane Beds
The most populous age groups in Cane Beds are 15 to 19 Years (86 | 51.8%) for men and 25 to 29 Years (62 | 77.5%) for women.
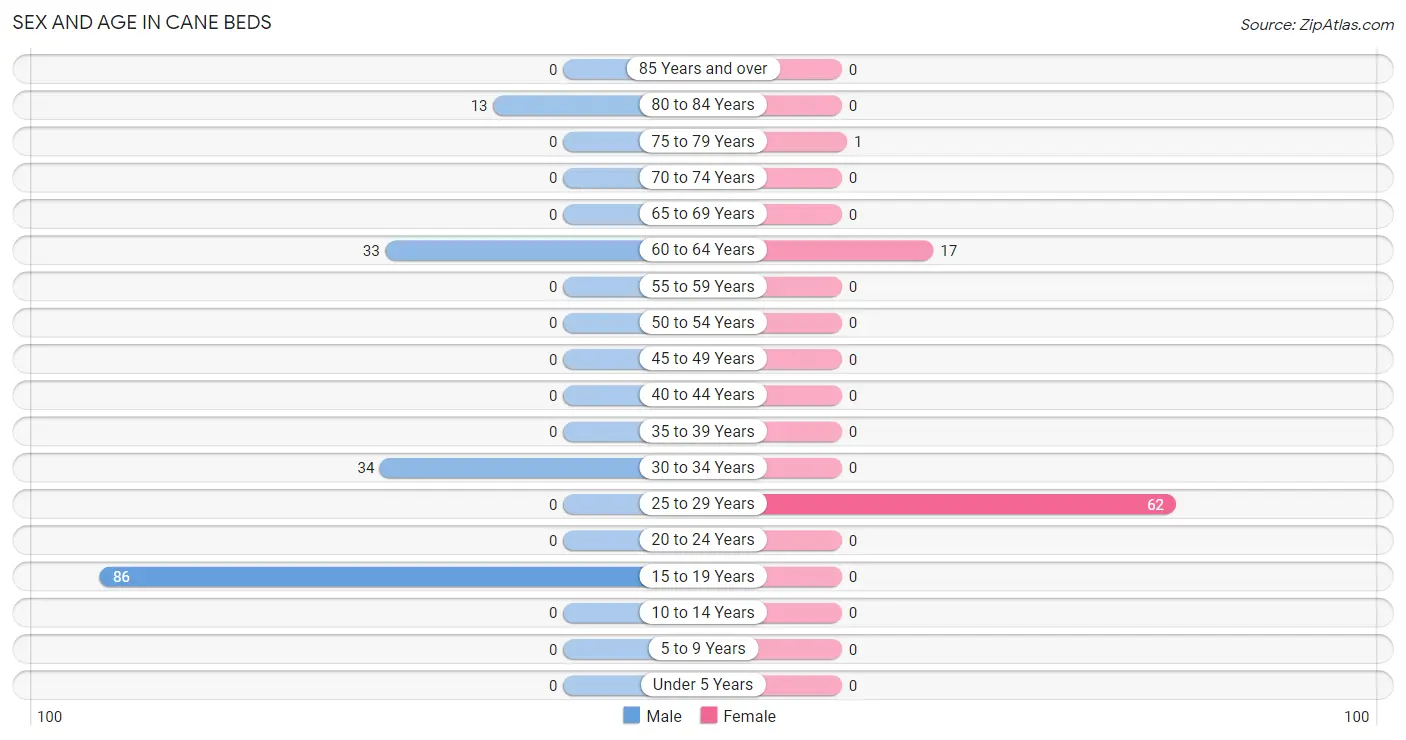
| Age Bracket | Male | Female |
| Under 5 Years | 0 (0.0%) | 0 (0.0%) |
| 5 to 9 Years | 0 (0.0%) | 0 (0.0%) |
| 10 to 14 Years | 0 (0.0%) | 0 (0.0%) |
| 15 to 19 Years | 86 (51.8%) | 0 (0.0%) |
| 20 to 24 Years | 0 (0.0%) | 0 (0.0%) |
| 25 to 29 Years | 0 (0.0%) | 62 (77.5%) |
| 30 to 34 Years | 34 (20.5%) | 0 (0.0%) |
| 35 to 39 Years | 0 (0.0%) | 0 (0.0%) |
| 40 to 44 Years | 0 (0.0%) | 0 (0.0%) |
| 45 to 49 Years | 0 (0.0%) | 0 (0.0%) |
| 50 to 54 Years | 0 (0.0%) | 0 (0.0%) |
| 55 to 59 Years | 0 (0.0%) | 0 (0.0%) |
| 60 to 64 Years | 33 (19.9%) | 17 (21.2%) |
| 65 to 69 Years | 0 (0.0%) | 0 (0.0%) |
| 70 to 74 Years | 0 (0.0%) | 0 (0.0%) |
| 75 to 79 Years | 0 (0.0%) | 1 (1.3%) |
| 80 to 84 Years | 13 (7.8%) | 0 (0.0%) |
| 85 Years and over | 0 (0.0%) | 0 (0.0%) |
| Total | 166 (100.0%) | 80 (100.0%) |
Families and Households in Cane Beds
Median Family Size in Cane Beds
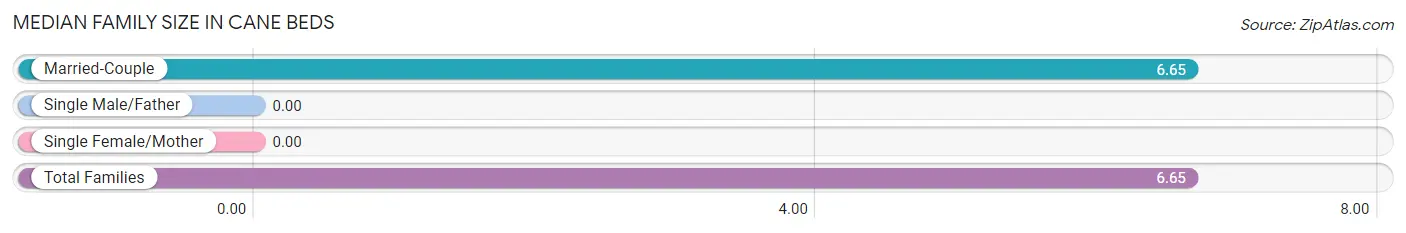
| Family Type | # Families | Family Size |
| Married-Couple | 17 (100.0%) | 6.65 |
| Single Male/Father | 0 (0.0%) | - |
| Single Female/Mother | 0 (0.0%) | - |
| Total Families | 17 (100.0%) | 6.65 |
Median Household Size in Cane Beds
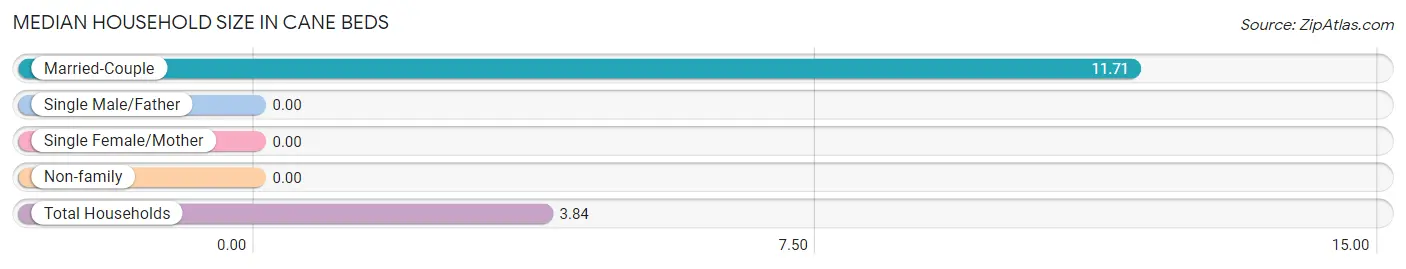
| Household Type | # Households | Household Size |
| Married-Couple | 17 (26.6%) | 11.71 |
| Single Male/Father | 0 (0.0%) | - |
| Single Female/Mother | 0 (0.0%) | - |
| Non-family | 47 (73.4%) | - |
| Total Households | 64 (100.0%) | 3.84 |
Household Size by Marriage Status in Cane Beds
Out of a total of 64 households in Cane Beds, 17 (26.6%) are family households, while 47 (73.4%) are nonfamily households. The most numerous type of family households are 5-person households, comprising 17, and the most common type of nonfamily households are 1-person households, comprising 47.
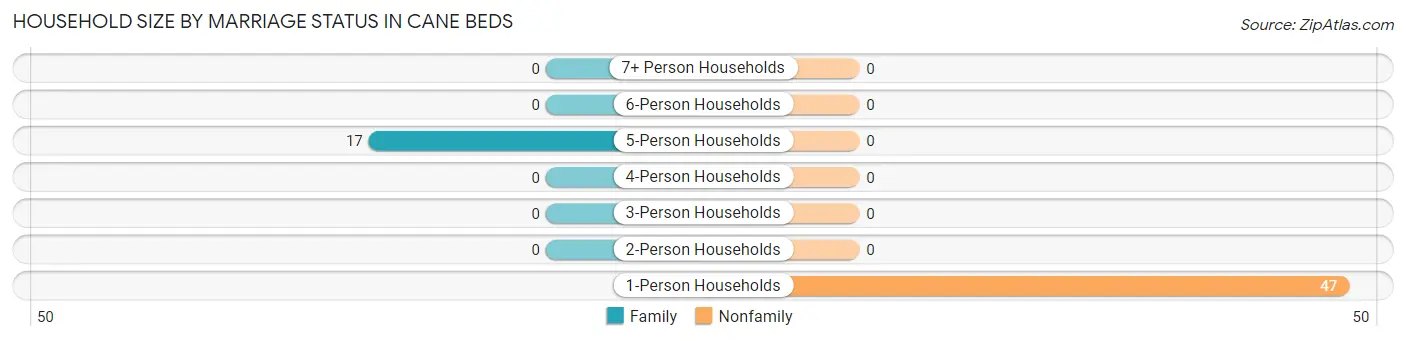
| Household Size | Family Households | Nonfamily Households |
| 1-Person Households | - | 47 (73.4%) |
| 2-Person Households | 0 (0.0%) | 0 (0.0%) |
| 3-Person Households | 0 (0.0%) | 0 (0.0%) |
| 4-Person Households | 0 (0.0%) | 0 (0.0%) |
| 5-Person Households | 17 (26.6%) | 0 (0.0%) |
| 6-Person Households | 0 (0.0%) | 0 (0.0%) |
| 7+ Person Households | 0 (0.0%) | 0 (0.0%) |
| Total | 17 (26.6%) | 47 (73.4%) |
Female Fertility in Cane Beds
Fertility by Age in Cane Beds
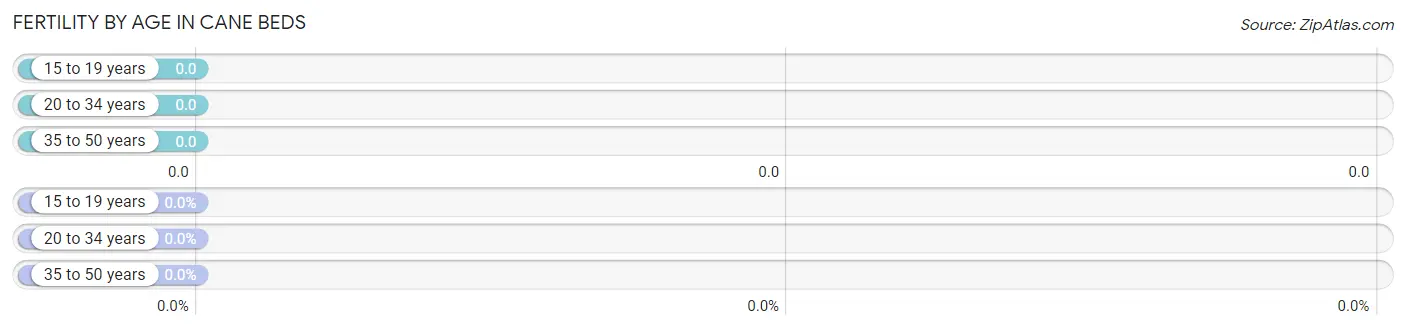
| Age Bracket | Women with Births | Births / 1,000 Women |
| 15 to 19 years | 0 (0.0%) | 0.0 |
| 20 to 34 years | 0 (0.0%) | 0.0 |
| 35 to 50 years | 0 (0.0%) | 0.0 |
| Total | 0 (0.0%) | 0.0 |
Fertility by Age by Marriage Status in Cane Beds
| Age Bracket | Married | Unmarried |
| 15 to 19 years | 0 (0.0%) | 0 (0.0%) |
| 20 to 34 years | 0 (0.0%) | 0 (0.0%) |
| 35 to 50 years | 0 (0.0%) | 0 (0.0%) |
| Total | 0 (0.0%) | 0 (0.0%) |
Fertility by Education in Cane Beds
| Educational Attainment | Women with Births | Births / 1,000 Women |
| Less than High School | 0 (0.0%) | 0.0 |
| High School Diploma | 0 (0.0%) | 0.0 |
| College or Associate's Degree | 0 (0.0%) | 0.0 |
| Bachelor's Degree | 0 (0.0%) | 0.0 |
| Graduate Degree | 0 (0.0%) | 0.0 |
| Total | 0 (0.0%) | 0.0 |
Fertility by Education by Marriage Status in Cane Beds
| Educational Attainment | Married | Unmarried |
| Less than High School | 0 (0.0%) | 0 (0.0%) |
| High School Diploma | 0 (0.0%) | 0 (0.0%) |
| College or Associate's Degree | 0 (0.0%) | 0 (0.0%) |
| Bachelor's Degree | 0 (0.0%) | 0 (0.0%) |
| Graduate Degree | 0 (0.0%) | 0 (0.0%) |
| Total | 0 (0.0%) | 0 (0.0%) |
Employment Characteristics in Cane Beds
Employment by Class of Employer in Cane Beds
Among the 113 employed individuals in Cane Beds, private company employees (96 | 85.0%), and self-employed (incorporated) (17 | 15.0%) make up the most common classes of employment.
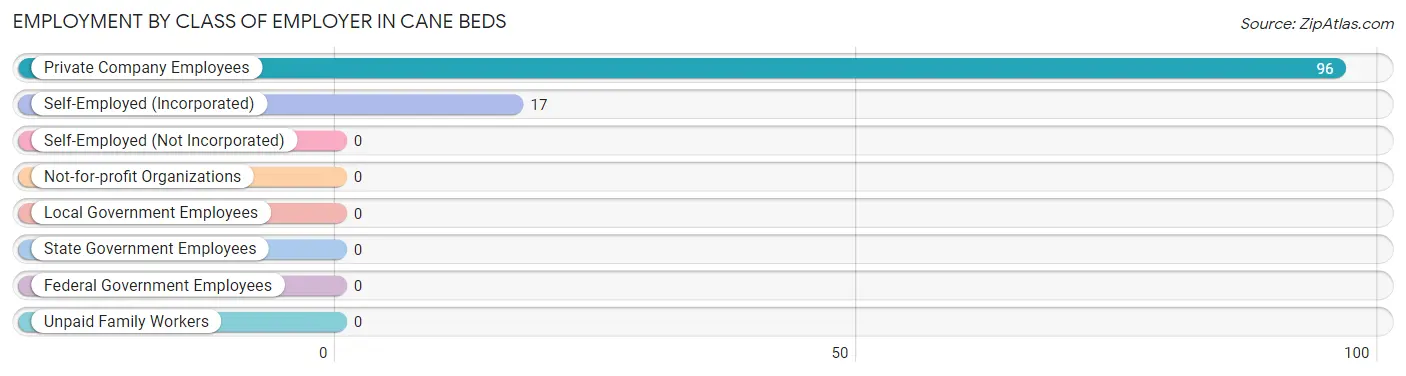
| Employer Class | # Employees | % Employees |
| Private Company Employees | 96 | 85.0% |
| Self-Employed (Incorporated) | 17 | 15.0% |
| Self-Employed (Not Incorporated) | 0 | 0.0% |
| Not-for-profit Organizations | 0 | 0.0% |
| Local Government Employees | 0 | 0.0% |
| State Government Employees | 0 | 0.0% |
| Federal Government Employees | 0 | 0.0% |
| Unpaid Family Workers | 0 | 0.0% |
| Total | 113 | 100.0% |
Employment Status by Age in Cane Beds
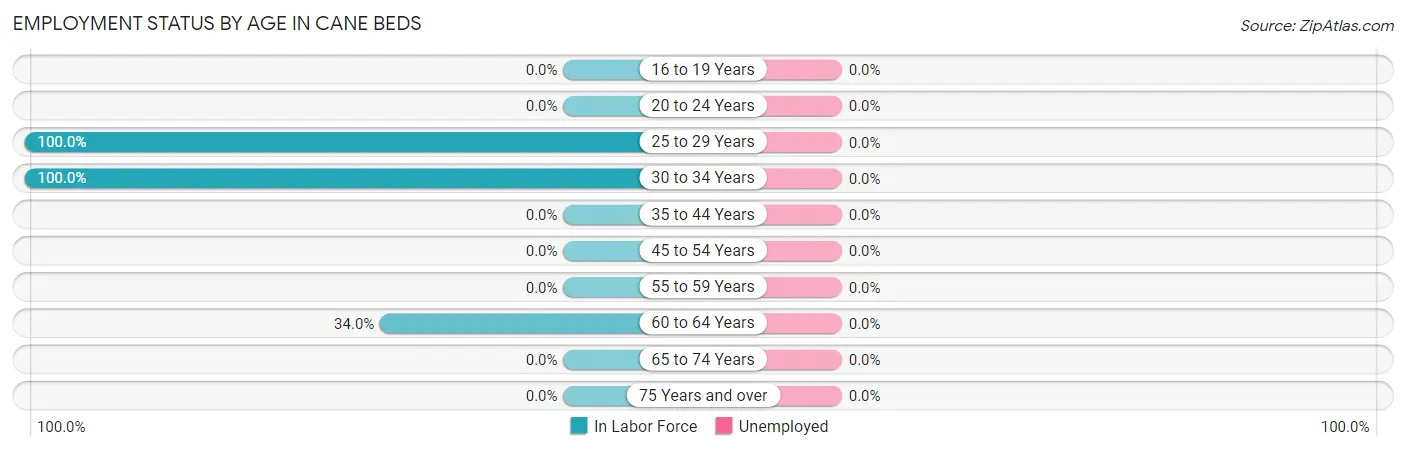
| Age Bracket | In Labor Force | Unemployed |
| 16 to 19 Years | 0 (0.0%) | 0 (0.0%) |
| 20 to 24 Years | 0 (0.0%) | 0 (0.0%) |
| 25 to 29 Years | 62 (100.0%) | 0 (0.0%) |
| 30 to 34 Years | 34 (100.0%) | 0 (0.0%) |
| 35 to 44 Years | 0 (0.0%) | 0 (0.0%) |
| 45 to 54 Years | 0 (0.0%) | 0 (0.0%) |
| 55 to 59 Years | 0 (0.0%) | 0 (0.0%) |
| 60 to 64 Years | 17 (34.0%) | 0 (0.0%) |
| 65 to 74 Years | 0 (0.0%) | 0 (0.0%) |
| 75 Years and over | 0 (0.0%) | 0 (0.0%) |
| Total | 113 (70.6%) | 0 (0.0%) |
Employment Status by Educational Attainment in Cane Beds
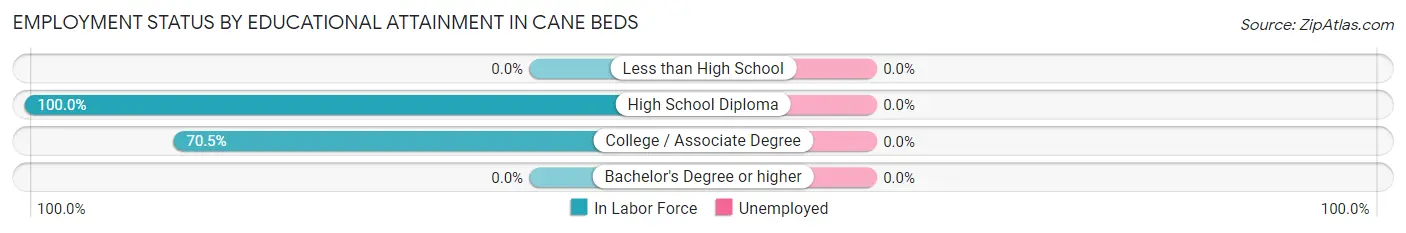
| Educational Attainment | In Labor Force | Unemployed |
| Less than High School | 0 (0.0%) | 0 (0.0%) |
| High School Diploma | 34 (100.0%) | 0 (0.0%) |
| College / Associate Degree | 79 (70.5%) | 0 (0.0%) |
| Bachelor's Degree or higher | 0 (0.0%) | 0 (0.0%) |
| Total | 113 (77.4%) | 0 (0.0%) |
Employment Occupations by Sex in Cane Beds
Management, Business, Science and Arts Occupations
The most common Management, Business, Science and Arts occupations in Cane Beds are , and Management (17 | 15.0%).
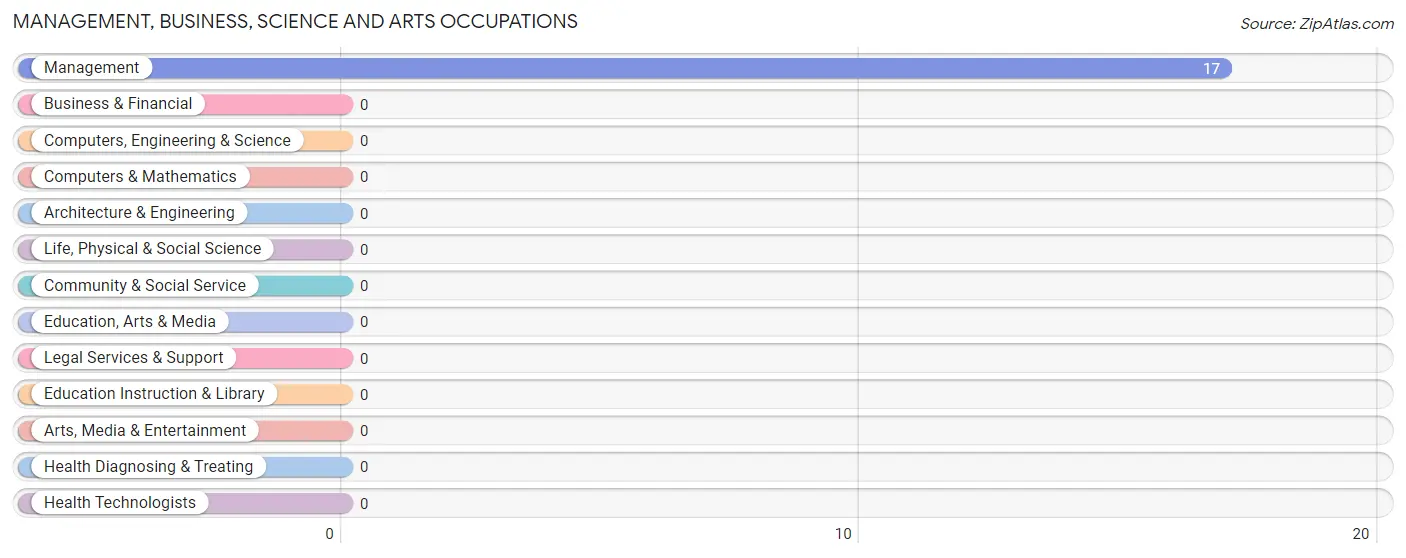
Management, Business, Science and Arts Occupations by Sex
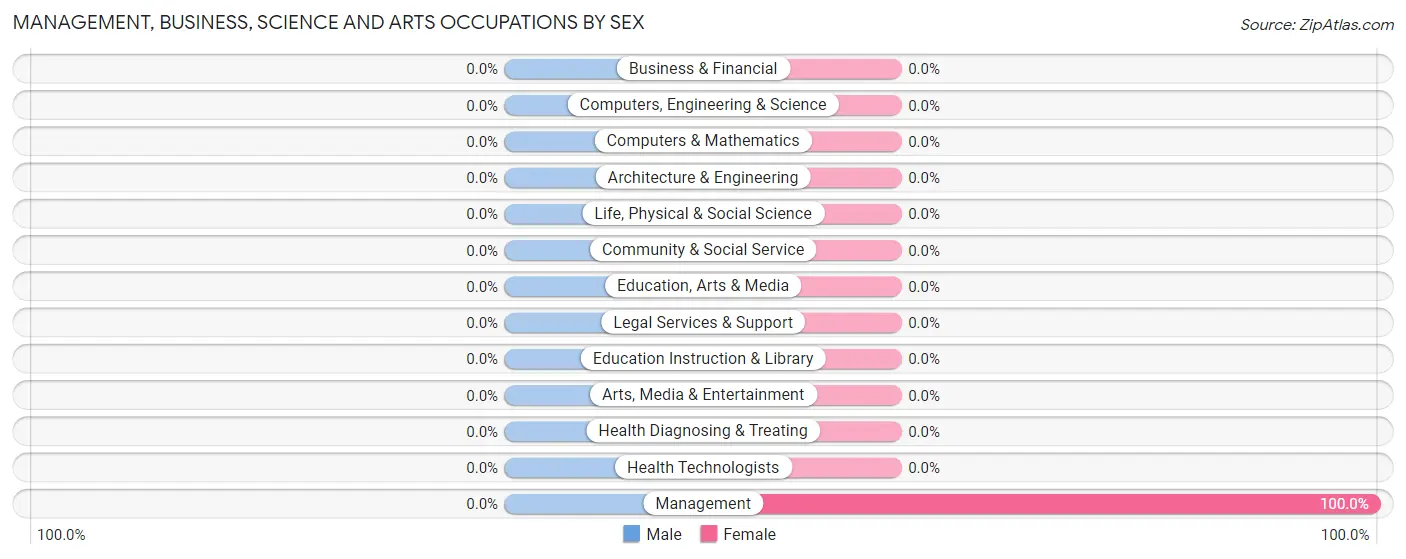
| Occupation | Male | Female |
| Management | 0 (0.0%) | 17 (100.0%) |
| Business & Financial | 0 (0.0%) | 0 (0.0%) |
| Computers, Engineering & Science | 0 (0.0%) | 0 (0.0%) |
| Computers & Mathematics | 0 (0.0%) | 0 (0.0%) |
| Architecture & Engineering | 0 (0.0%) | 0 (0.0%) |
| Life, Physical & Social Science | 0 (0.0%) | 0 (0.0%) |
| Community & Social Service | 0 (0.0%) | 0 (0.0%) |
| Education, Arts & Media | 0 (0.0%) | 0 (0.0%) |
| Legal Services & Support | 0 (0.0%) | 0 (0.0%) |
| Education Instruction & Library | 0 (0.0%) | 0 (0.0%) |
| Arts, Media & Entertainment | 0 (0.0%) | 0 (0.0%) |
| Health Diagnosing & Treating | 0 (0.0%) | 0 (0.0%) |
| Health Technologists | 0 (0.0%) | 0 (0.0%) |
| Total (Category) | 0 (0.0%) | 17 (100.0%) |
| Total (Overall) | 34 (30.1%) | 79 (69.9%) |
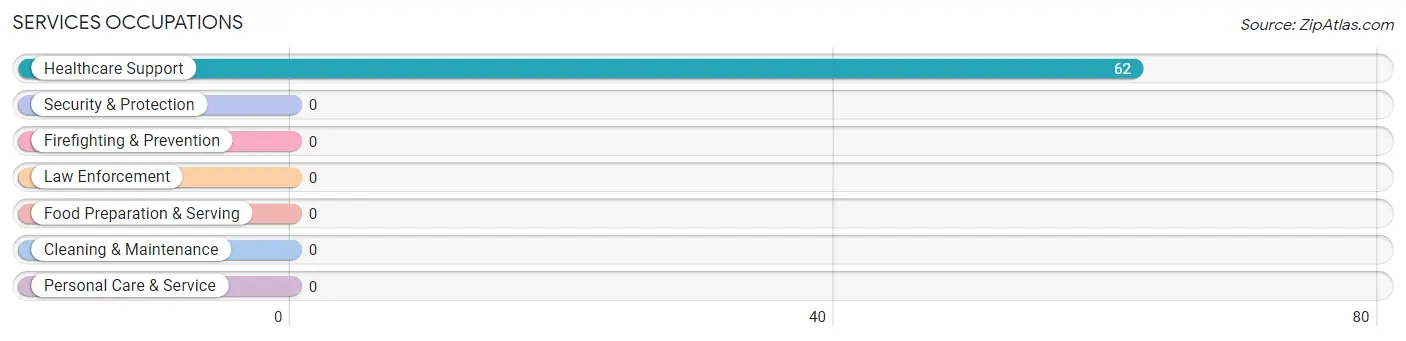
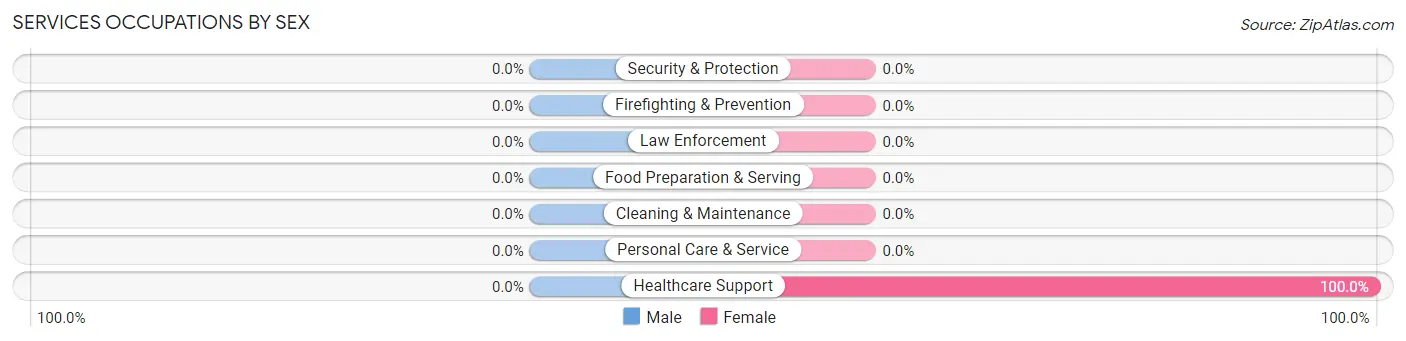
Services Occupations
The most common Services occupations in Cane Beds are , and Healthcare Support (62 | 54.9%).
Services Occupations by Sex
| Occupation | Male | Female |
| Healthcare Support | 0 (0.0%) | 62 (100.0%) |
| Security & Protection | 0 (0.0%) | 0 (0.0%) |
| Firefighting & Prevention | 0 (0.0%) | 0 (0.0%) |
| Law Enforcement | 0 (0.0%) | 0 (0.0%) |
| Food Preparation & Serving | 0 (0.0%) | 0 (0.0%) |
| Cleaning & Maintenance | 0 (0.0%) | 0 (0.0%) |
| Personal Care & Service | 0 (0.0%) | 0 (0.0%) |
| Total (Category) | 0 (0.0%) | 62 (100.0%) |
| Total (Overall) | 34 (30.1%) | 79 (69.9%) |
Sales and Office Occupations
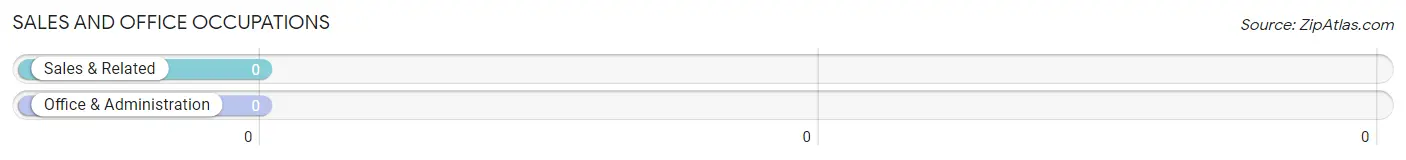
Sales and Office Occupations by Sex
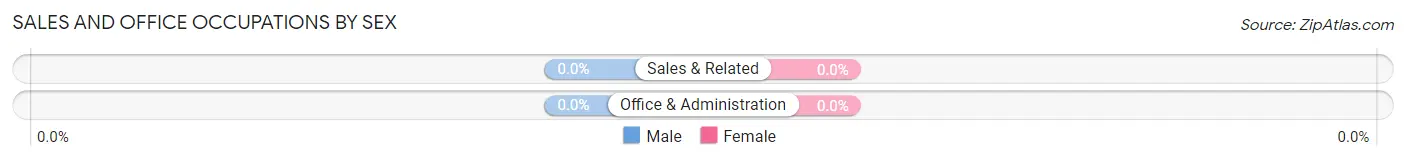
| Occupation | Male | Female |
| Sales & Related | 0 (0.0%) | 0 (0.0%) |
| Office & Administration | 0 (0.0%) | 0 (0.0%) |
| Total (Category) | 0 (0.0%) | 0 (0.0%) |
| Total (Overall) | 34 (30.1%) | 79 (69.9%) |
Natural Resources, Construction and Maintenance Occupations
The most common Natural Resources, Construction and Maintenance occupations in Cane Beds are , and Construction & Extraction (34 | 30.1%).
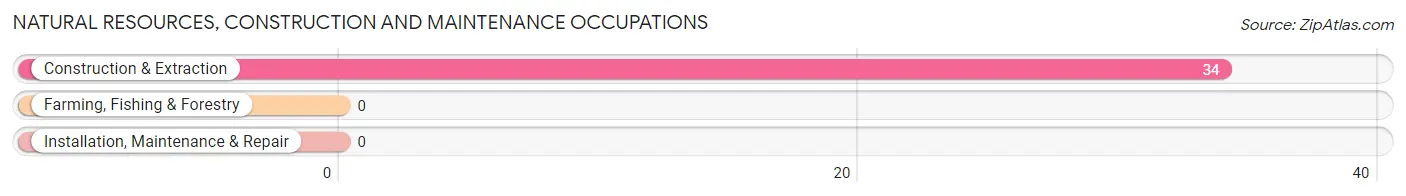
Natural Resources, Construction and Maintenance Occupations by Sex
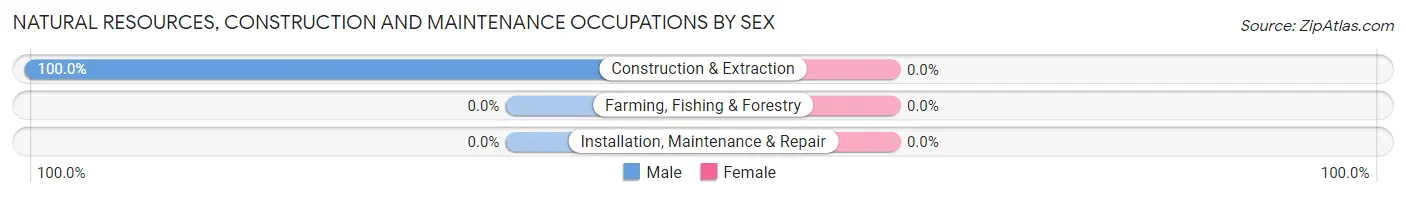
| Occupation | Male | Female |
| Farming, Fishing & Forestry | 0 (0.0%) | 0 (0.0%) |
| Construction & Extraction | 34 (100.0%) | 0 (0.0%) |
| Installation, Maintenance & Repair | 0 (0.0%) | 0 (0.0%) |
| Total (Category) | 34 (100.0%) | 0 (0.0%) |
| Total (Overall) | 34 (30.1%) | 79 (69.9%) |
Production, Transportation and Moving Occupations
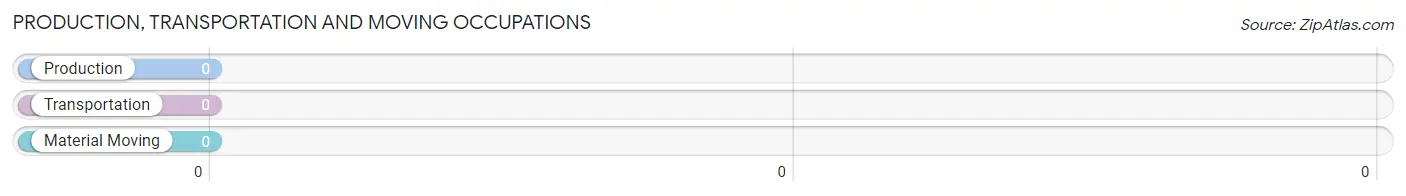
Production, Transportation and Moving Occupations by Sex
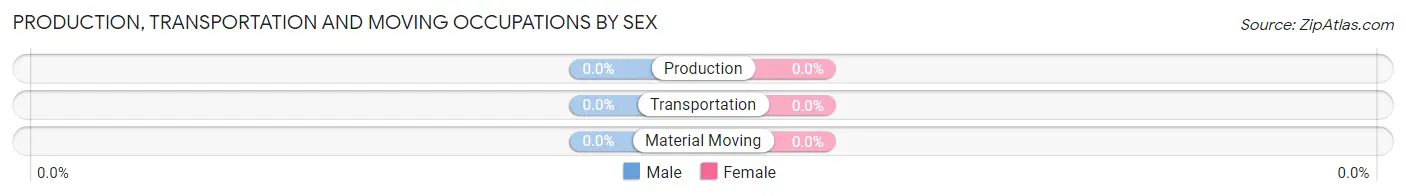
| Occupation | Male | Female |
| Production | 0 (0.0%) | 0 (0.0%) |
| Transportation | 0 (0.0%) | 0 (0.0%) |
| Material Moving | 0 (0.0%) | 0 (0.0%) |
| Total (Category) | 0 (0.0%) | 0 (0.0%) |
| Total (Overall) | 34 (30.1%) | 79 (69.9%) |
Employment Industries by Sex in Cane Beds
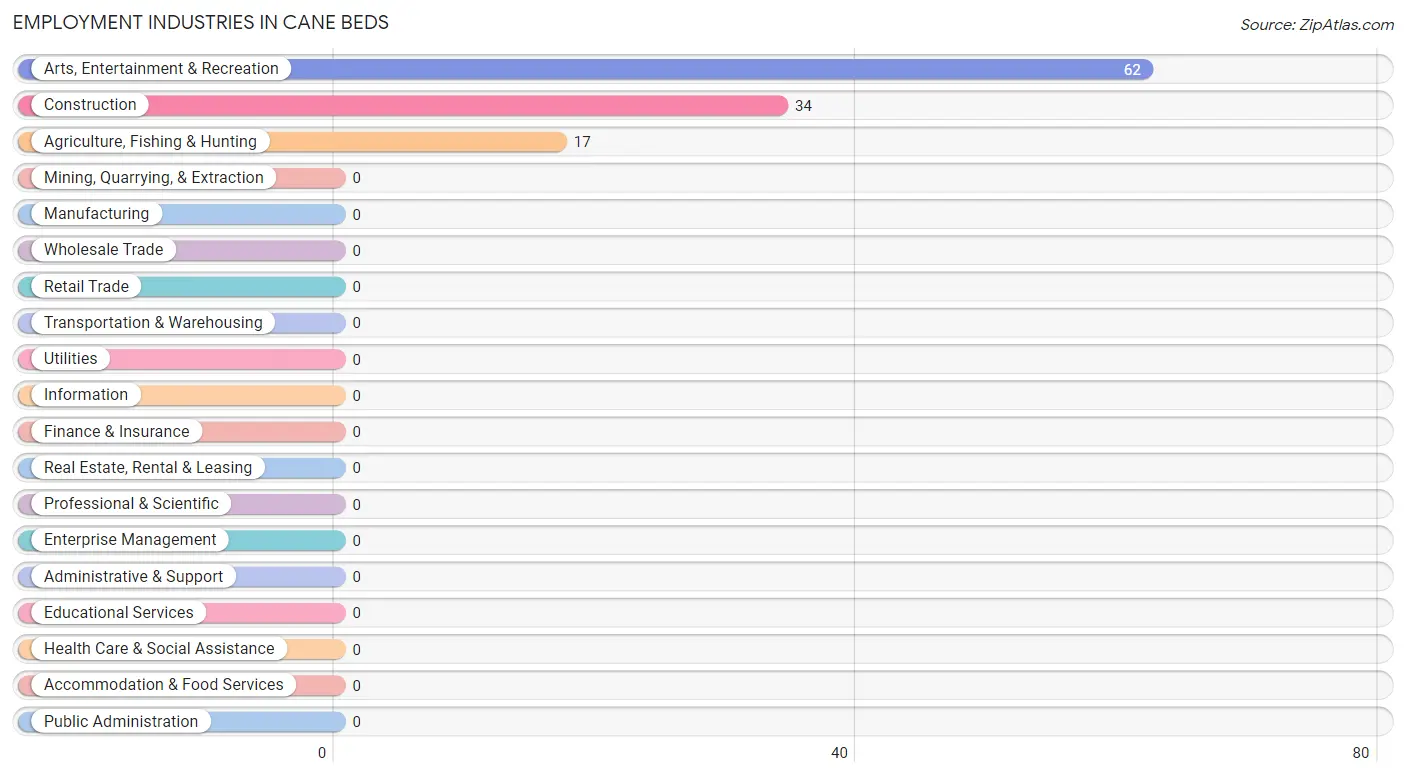
Employment Industries in Cane Beds
The major employment industries in Cane Beds include Arts, Entertainment & Recreation (62 | 54.9%), Construction (34 | 30.1%), and Agriculture, Fishing & Hunting (17 | 15.0%).
Employment Industries by Sex in Cane Beds
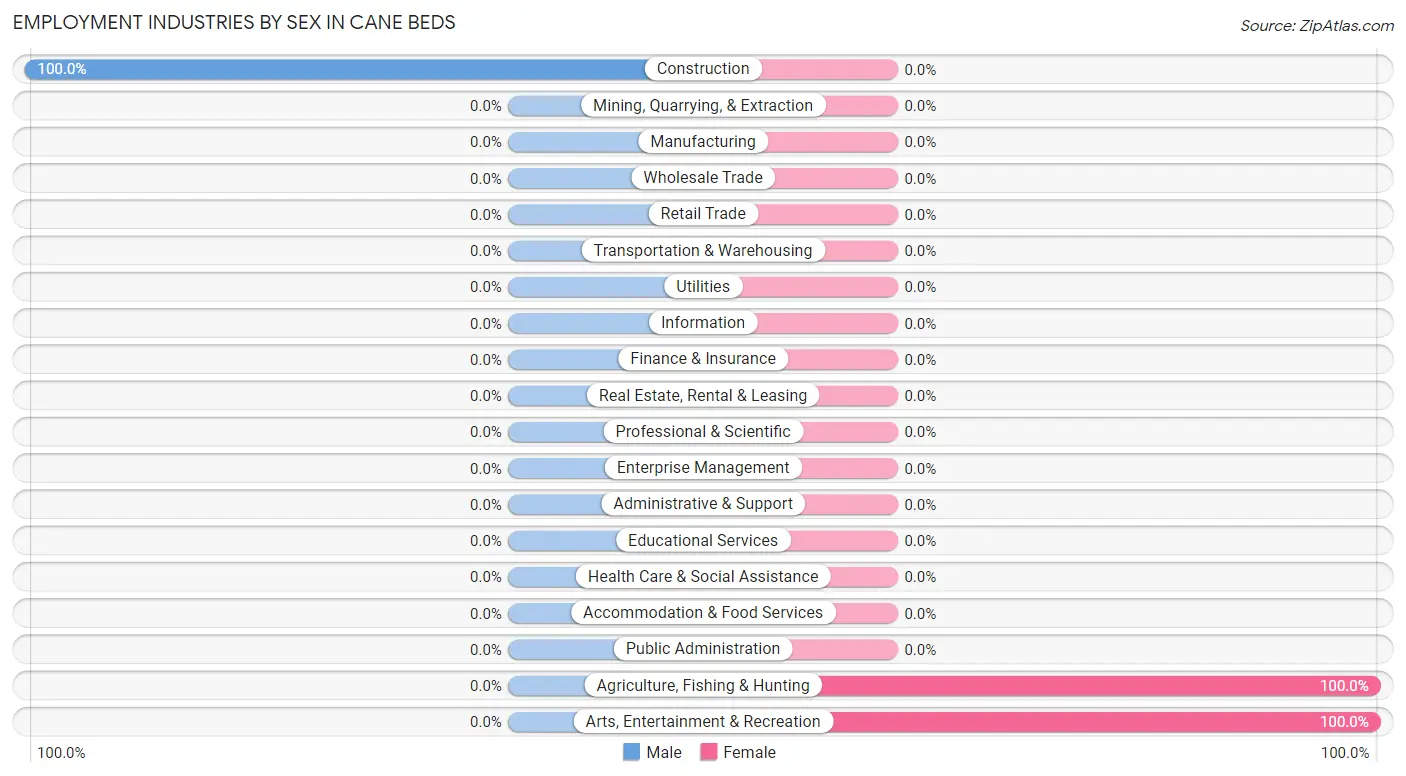
| Industry | Male | Female |
| Agriculture, Fishing & Hunting | 0 (0.0%) | 17 (100.0%) |
| Mining, Quarrying, & Extraction | 0 (0.0%) | 0 (0.0%) |
| Construction | 34 (100.0%) | 0 (0.0%) |
| Manufacturing | 0 (0.0%) | 0 (0.0%) |
| Wholesale Trade | 0 (0.0%) | 0 (0.0%) |
| Retail Trade | 0 (0.0%) | 0 (0.0%) |
| Transportation & Warehousing | 0 (0.0%) | 0 (0.0%) |
| Utilities | 0 (0.0%) | 0 (0.0%) |
| Information | 0 (0.0%) | 0 (0.0%) |
| Finance & Insurance | 0 (0.0%) | 0 (0.0%) |
| Real Estate, Rental & Leasing | 0 (0.0%) | 0 (0.0%) |
| Professional & Scientific | 0 (0.0%) | 0 (0.0%) |
| Enterprise Management | 0 (0.0%) | 0 (0.0%) |
| Administrative & Support | 0 (0.0%) | 0 (0.0%) |
| Educational Services | 0 (0.0%) | 0 (0.0%) |
| Health Care & Social Assistance | 0 (0.0%) | 0 (0.0%) |
| Arts, Entertainment & Recreation | 0 (0.0%) | 62 (100.0%) |
| Accommodation & Food Services | 0 (0.0%) | 0 (0.0%) |
| Public Administration | 0 (0.0%) | 0 (0.0%) |
| Total | 34 (30.1%) | 79 (69.9%) |
Education in Cane Beds
School Enrollment in Cane Beds
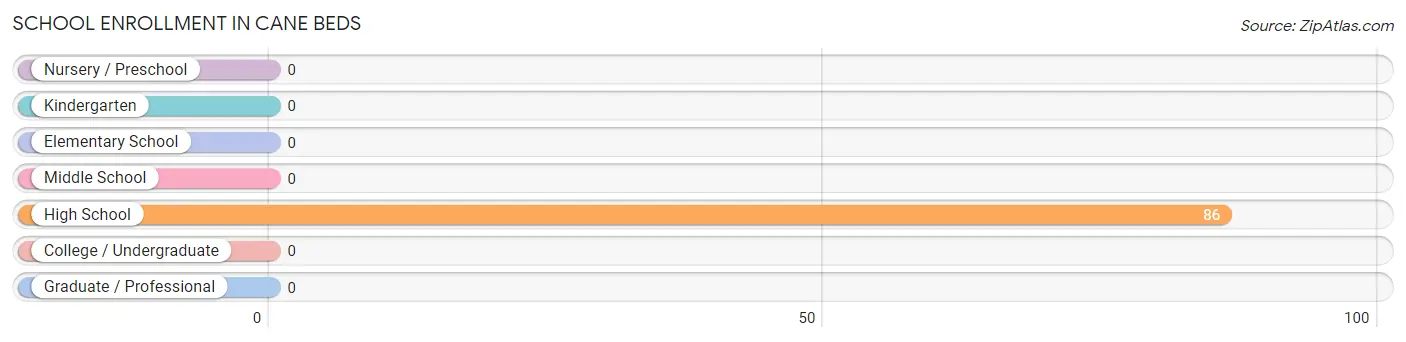
| School Level | # Students | % Students |
| Nursery / Preschool | 0 | 0.0% |
| Kindergarten | 0 | 0.0% |
| Elementary School | 0 | 0.0% |
| Middle School | 0 | 0.0% |
| High School | 86 | 100.0% |
| College / Undergraduate | 0 | 0.0% |
| Graduate / Professional | 0 | 0.0% |
| Total | 86 | 100.0% |
School Enrollment by Age by Funding Source in Cane Beds
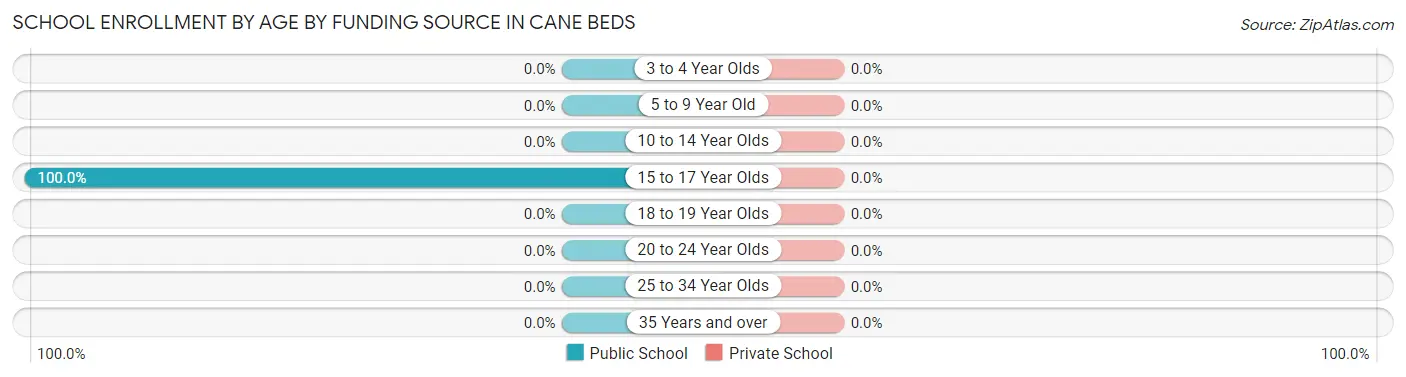
| Age Bracket | Public School | Private School |
| 3 to 4 Year Olds | 0 (0.0%) | 0 (0.0%) |
| 5 to 9 Year Old | 0 (0.0%) | 0 (0.0%) |
| 10 to 14 Year Olds | 0 (0.0%) | 0 (0.0%) |
| 15 to 17 Year Olds | 86 (100.0%) | 0 (0.0%) |
| 18 to 19 Year Olds | 0 (0.0%) | 0 (0.0%) |
| 20 to 24 Year Olds | 0 (0.0%) | 0 (0.0%) |
| 25 to 34 Year Olds | 0 (0.0%) | 0 (0.0%) |
| 35 Years and over | 0 (0.0%) | 0 (0.0%) |
| Total | 86 (100.0%) | 0 (0.0%) |
Educational Attainment by Field of Study in Cane Beds
| Field of Study | # Graduates | % Graduates |
| Computers & Mathematics | 0 | 0.0% |
| Bio, Nature & Agricultural | 0 | 0.0% |
| Physical & Health Sciences | 0 | 0.0% |
| Psychology | 0 | 0.0% |
| Social Sciences | 0 | 0.0% |
| Engineering | 0 | 0.0% |
| Multidisciplinary Studies | 0 | 0.0% |
| Science & Technology | 0 | 0.0% |
| Business | 0 | 0.0% |
| Education | 0 | 0.0% |
| Literature & Languages | 0 | 0.0% |
| Liberal Arts & History | 0 | 0.0% |
| Visual & Performing Arts | 0 | 0.0% |
| Communications | 0 | 0.0% |
| Arts & Humanities | 0 | 0.0% |
| Total | 0 | 0.0% |
Transportation & Commute in Cane Beds
Vehicle Availability by Sex in Cane Beds
The most prevalent vehicle ownership categories in Cane Beds are males with 1 vehicle (34, accounting for 100.0%) and females with 1 vehicle (0, making up 43.0%).
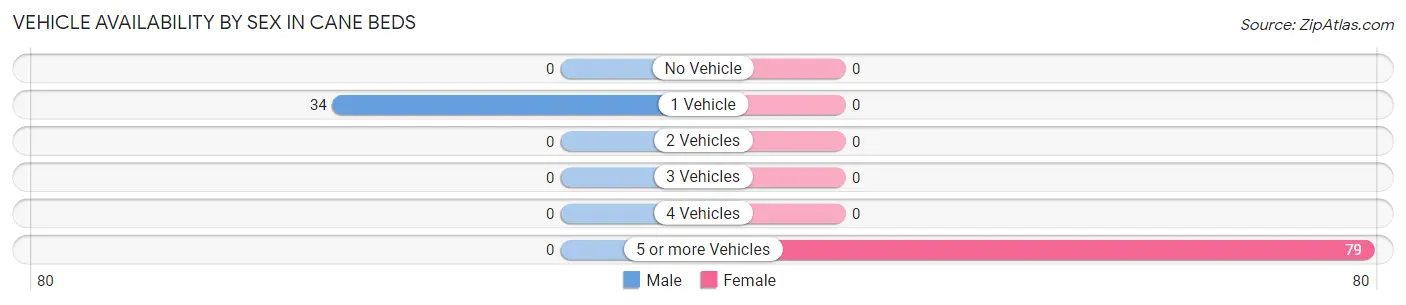
| Vehicles Available | Male | Female |
| No Vehicle | 0 (0.0%) | 0 (0.0%) |
| 1 Vehicle | 34 (100.0%) | 0 (0.0%) |
| 2 Vehicles | 0 (0.0%) | 0 (0.0%) |
| 3 Vehicles | 0 (0.0%) | 0 (0.0%) |
| 4 Vehicles | 0 (0.0%) | 0 (0.0%) |
| 5 or more Vehicles | 0 (0.0%) | 79 (100.0%) |
| Total | 34 (100.0%) | 79 (100.0%) |
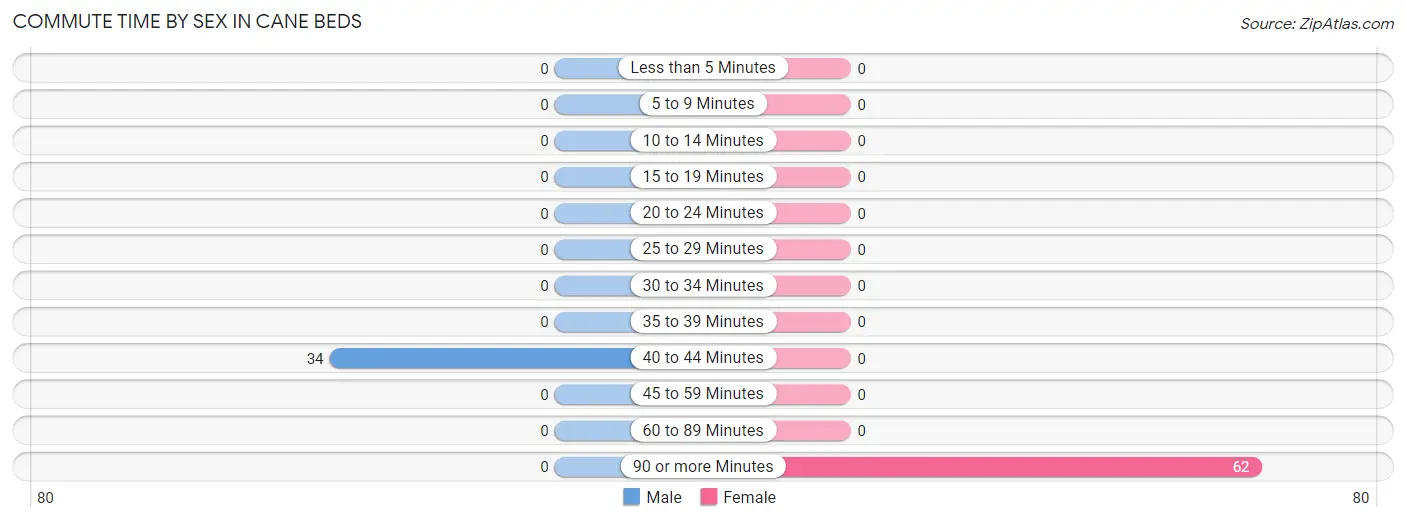
Commute Time in Cane Beds
The most frequently occuring commute durations in Cane Beds are 90 or more minutes (62 commuters, 64.6%), 40 to 44 minutes (34 commuters, 35.4%), and less than 5 minutes (0 commuters, 0.0%).
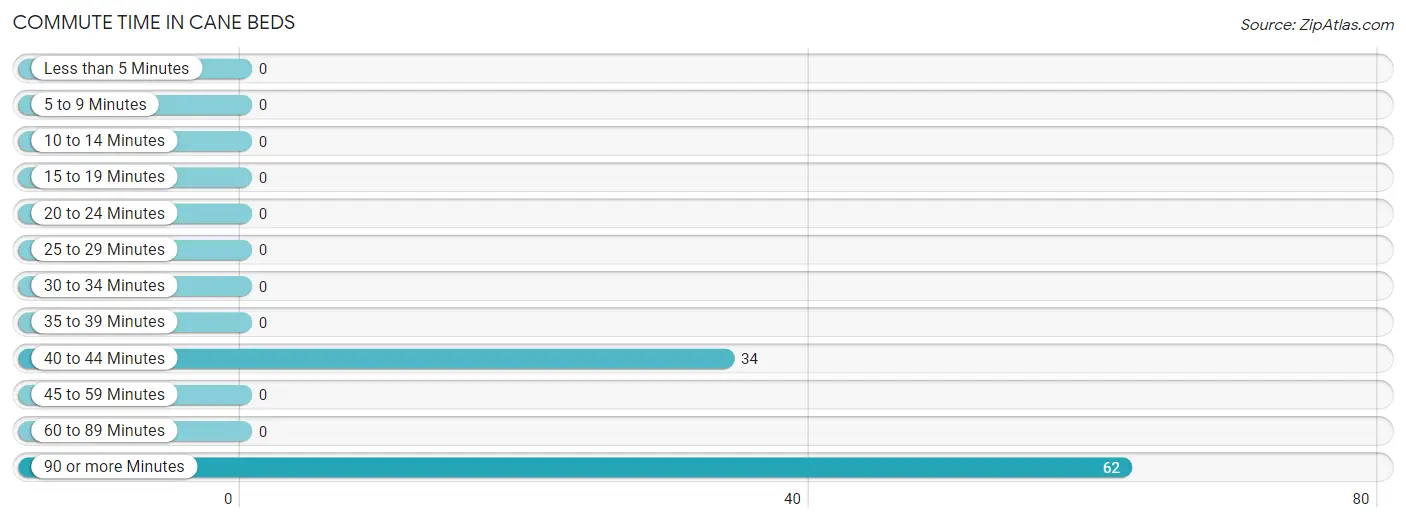
| Commute Time | # Commuters | % Commuters |
| Less than 5 Minutes | 0 | 0.0% |
| 5 to 9 Minutes | 0 | 0.0% |
| 10 to 14 Minutes | 0 | 0.0% |
| 15 to 19 Minutes | 0 | 0.0% |
| 20 to 24 Minutes | 0 | 0.0% |
| 25 to 29 Minutes | 0 | 0.0% |
| 30 to 34 Minutes | 0 | 0.0% |
| 35 to 39 Minutes | 0 | 0.0% |
| 40 to 44 Minutes | 34 | 35.4% |
| 45 to 59 Minutes | 0 | 0.0% |
| 60 to 89 Minutes | 0 | 0.0% |
| 90 or more Minutes | 62 | 64.6% |
Commute Time by Sex in Cane Beds
The most common commute times in Cane Beds are 40 to 44 minutes (34 commuters, 100.0%) for males and 90 or more minutes (62 commuters, 100.0%) for females.
| Commute Time | Male | Female |
| Less than 5 Minutes | 0 (0.0%) | 0 (0.0%) |
| 5 to 9 Minutes | 0 (0.0%) | 0 (0.0%) |
| 10 to 14 Minutes | 0 (0.0%) | 0 (0.0%) |
| 15 to 19 Minutes | 0 (0.0%) | 0 (0.0%) |
| 20 to 24 Minutes | 0 (0.0%) | 0 (0.0%) |
| 25 to 29 Minutes | 0 (0.0%) | 0 (0.0%) |
| 30 to 34 Minutes | 0 (0.0%) | 0 (0.0%) |
| 35 to 39 Minutes | 0 (0.0%) | 0 (0.0%) |
| 40 to 44 Minutes | 34 (100.0%) | 0 (0.0%) |
| 45 to 59 Minutes | 0 (0.0%) | 0 (0.0%) |
| 60 to 89 Minutes | 0 (0.0%) | 0 (0.0%) |
| 90 or more Minutes | 0 (0.0%) | 62 (100.0%) |
Time of Departure to Work by Sex in Cane Beds
The most frequent times of departure to work in Cane Beds are 9:00 AM to 9:59 AM (34, 100.0%) for males and 7:00 AM to 7:29 AM (62, 100.0%) for females.
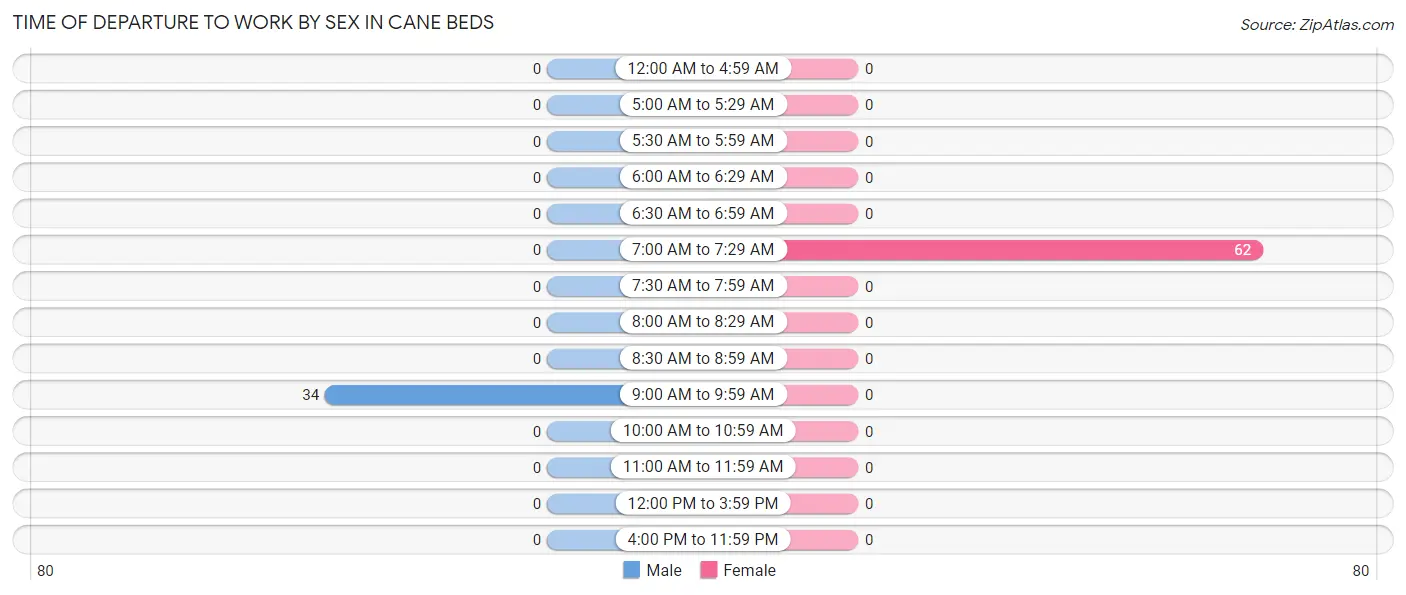
| Time of Departure | Male | Female |
| 12:00 AM to 4:59 AM | 0 (0.0%) | 0 (0.0%) |
| 5:00 AM to 5:29 AM | 0 (0.0%) | 0 (0.0%) |
| 5:30 AM to 5:59 AM | 0 (0.0%) | 0 (0.0%) |
| 6:00 AM to 6:29 AM | 0 (0.0%) | 0 (0.0%) |
| 6:30 AM to 6:59 AM | 0 (0.0%) | 0 (0.0%) |
| 7:00 AM to 7:29 AM | 0 (0.0%) | 62 (100.0%) |
| 7:30 AM to 7:59 AM | 0 (0.0%) | 0 (0.0%) |
| 8:00 AM to 8:29 AM | 0 (0.0%) | 0 (0.0%) |
| 8:30 AM to 8:59 AM | 0 (0.0%) | 0 (0.0%) |
| 9:00 AM to 9:59 AM | 34 (100.0%) | 0 (0.0%) |
| 10:00 AM to 10:59 AM | 0 (0.0%) | 0 (0.0%) |
| 11:00 AM to 11:59 AM | 0 (0.0%) | 0 (0.0%) |
| 12:00 PM to 3:59 PM | 0 (0.0%) | 0 (0.0%) |
| 4:00 PM to 11:59 PM | 0 (0.0%) | 0 (0.0%) |
| Total | 34 (100.0%) | 62 (100.0%) |
Housing Occupancy in Cane Beds
Occupancy by Ownership in Cane Beds
Of the total 64 dwellings in Cane Beds, owner-occupied units account for 64 (100.0%), while renter-occupied units make up 0 (0.0%).
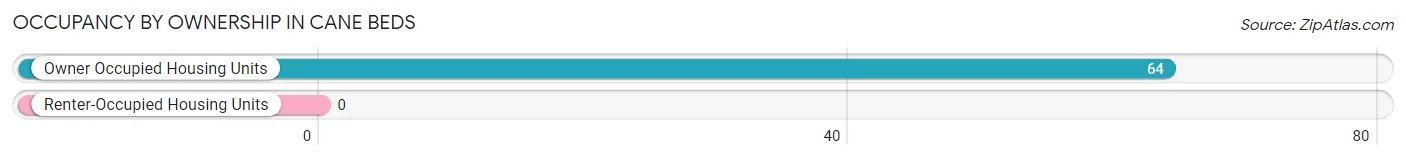
| Occupancy | # Housing Units | % Housing Units |
| Owner Occupied Housing Units | 64 | 100.0% |
| Renter-Occupied Housing Units | 0 | 0.0% |
| Total Occupied Housing Units | 64 | 100.0% |
Occupancy by Household Size in Cane Beds
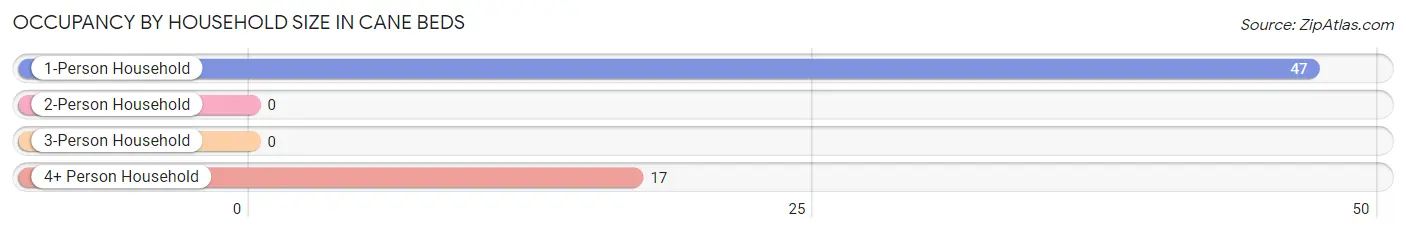
| Household Size | # Housing Units | % Housing Units |
| 1-Person Household | 47 | 73.4% |
| 2-Person Household | 0 | 0.0% |
| 3-Person Household | 0 | 0.0% |
| 4+ Person Household | 17 | 26.6% |
| Total Housing Units | 64 | 100.0% |
Occupancy by Ownership by Household Size in Cane Beds
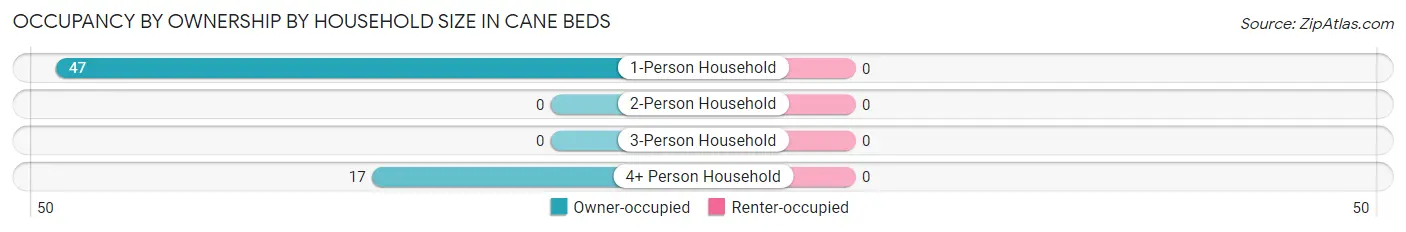
| Household Size | Owner-occupied | Renter-occupied |
| 1-Person Household | 47 (100.0%) | 0 (0.0%) |
| 2-Person Household | 0 (0.0%) | 0 (0.0%) |
| 3-Person Household | 0 (0.0%) | 0 (0.0%) |
| 4+ Person Household | 17 (100.0%) | 0 (0.0%) |
| Total Housing Units | 64 (100.0%) | 0 (0.0%) |
Occupancy by Educational Attainment in Cane Beds
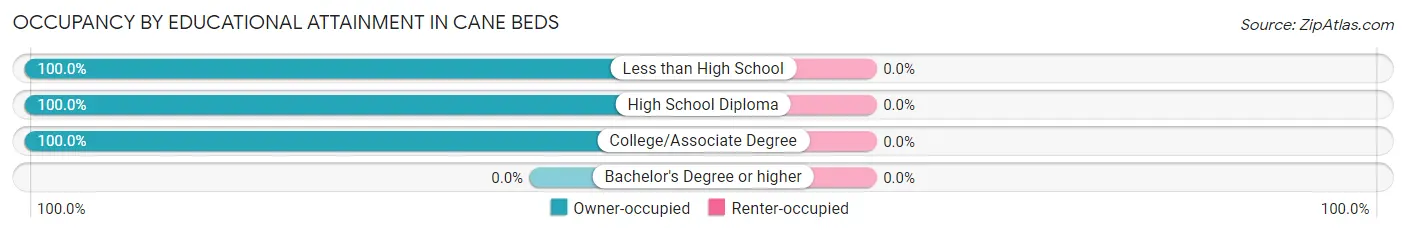
| Household Size | Owner-occupied | Renter-occupied |
| Less than High School | 13 (100.0%) | 0 (0.0%) |
| High School Diploma | 34 (100.0%) | 0 (0.0%) |
| College/Associate Degree | 17 (100.0%) | 0 (0.0%) |
| Bachelor's Degree or higher | 0 (0.0%) | 0 (0.0%) |
Occupancy by Age of Householder in Cane Beds
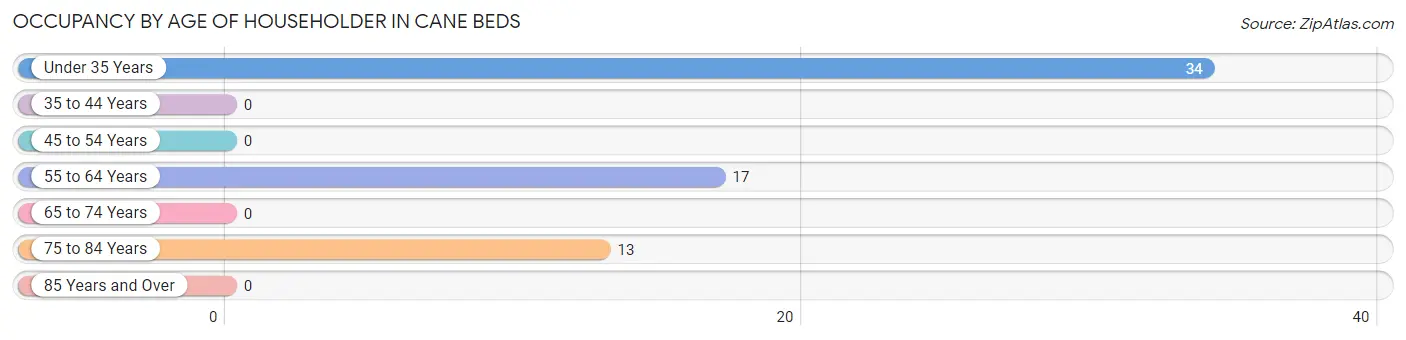
| Age Bracket | # Households | % Households |
| Under 35 Years | 34 | 53.1% |
| 35 to 44 Years | 0 | 0.0% |
| 45 to 54 Years | 0 | 0.0% |
| 55 to 64 Years | 17 | 26.6% |
| 65 to 74 Years | 0 | 0.0% |
| 75 to 84 Years | 13 | 20.3% |
| 85 Years and Over | 0 | 0.0% |
| Total | 64 | 100.0% |
Housing Finances in Cane Beds
Median Income by Occupancy in Cane Beds
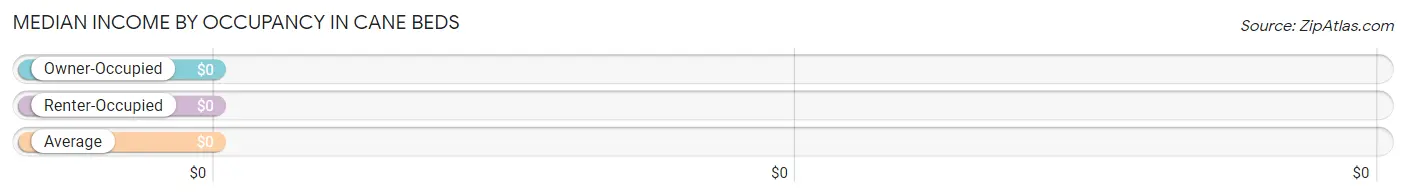
| Occupancy Type | # Households | Median Income |
| Owner-Occupied | 64 (100.0%) | $0 |
| Renter-Occupied | 0 (0.0%) | $0 |
| Average | 64 (100.0%) | $0 |
Occupancy by Householder Income Bracket in Cane Beds
| Income Bracket | Owner-occupied | Renter-occupied |
| Less than $5,000 | 0 (0.0%) | 0 (0.0%) |
| $5,000 to $9,999 | 0 (0.0%) | 0 (0.0%) |
| $10,000 to $14,999 | 0 (0.0%) | 0 (0.0%) |
| $15,000 to $19,999 | 13 (20.3%) | 0 (0.0%) |
| $20,000 to $24,999 | 0 (0.0%) | 0 (0.0%) |
| $25,000 to $34,999 | 0 (0.0%) | 0 (0.0%) |
| $35,000 to $49,999 | 0 (0.0%) | 0 (0.0%) |
| $50,000 to $74,999 | 34 (53.1%) | 0 (0.0%) |
| $75,000 to $99,999 | 0 (0.0%) | 0 (0.0%) |
| $100,000 to $149,999 | 0 (0.0%) | 0 (0.0%) |
| $150,000 or more | 17 (26.6%) | 0 (0.0%) |
| Total | 64 (100.0%) | 0 (0.0%) |
Monthly Housing Cost Tiers in Cane Beds
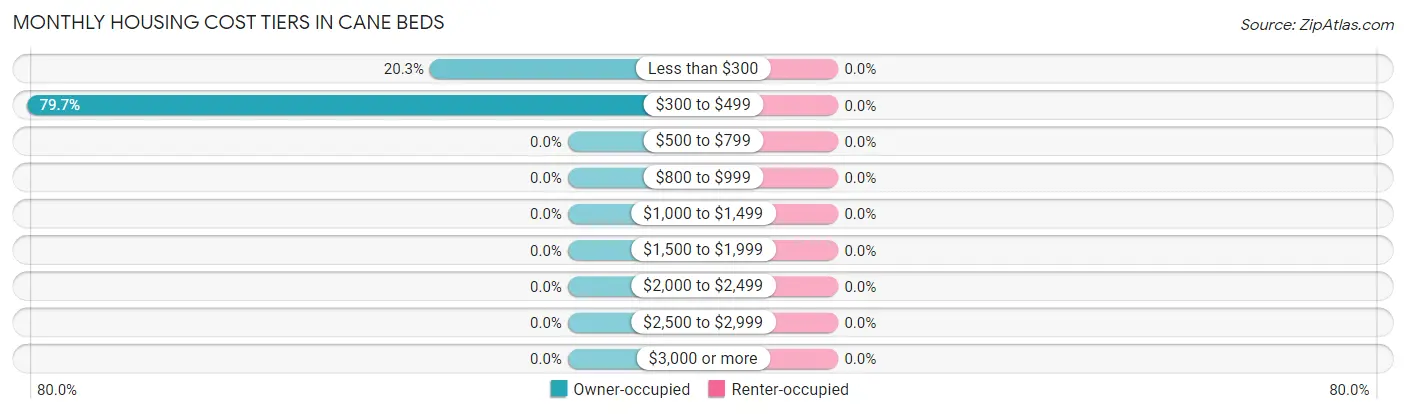
| Monthly Cost | Owner-occupied | Renter-occupied |
| Less than $300 | 13 (20.3%) | 0 (0.0%) |
| $300 to $499 | 51 (79.7%) | 0 (0.0%) |
| $500 to $799 | 0 (0.0%) | 0 (0.0%) |
| $800 to $999 | 0 (0.0%) | 0 (0.0%) |
| $1,000 to $1,499 | 0 (0.0%) | 0 (0.0%) |
| $1,500 to $1,999 | 0 (0.0%) | 0 (0.0%) |
| $2,000 to $2,499 | 0 (0.0%) | 0 (0.0%) |
| $2,500 to $2,999 | 0 (0.0%) | 0 (0.0%) |
| $3,000 or more | 0 (0.0%) | 0 (0.0%) |
| Total | 64 (100.0%) | 0 (0.0%) |
Physical Housing Characteristics in Cane Beds
Housing Structures in Cane Beds
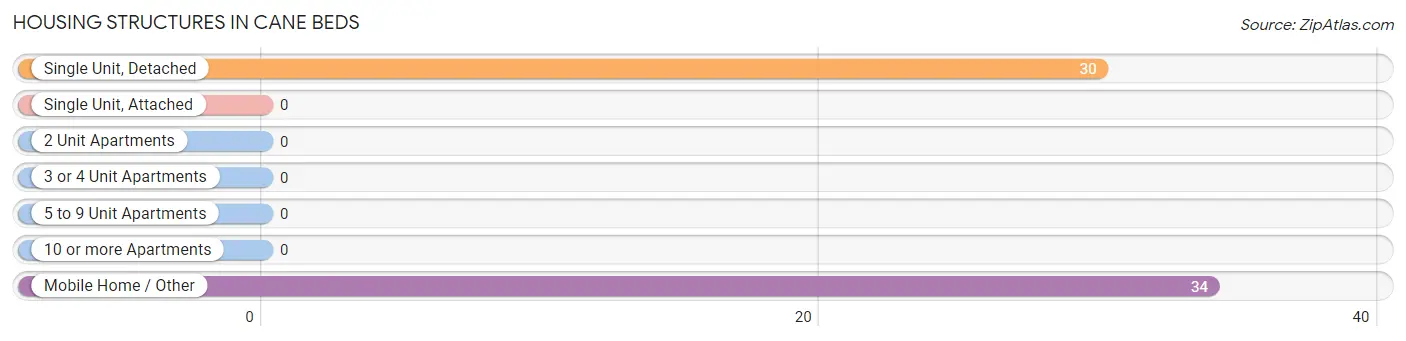
| Structure Type | # Housing Units | % Housing Units |
| Single Unit, Detached | 30 | 46.9% |
| Single Unit, Attached | 0 | 0.0% |
| 2 Unit Apartments | 0 | 0.0% |
| 3 or 4 Unit Apartments | 0 | 0.0% |
| 5 to 9 Unit Apartments | 0 | 0.0% |
| 10 or more Apartments | 0 | 0.0% |
| Mobile Home / Other | 34 | 53.1% |
| Total | 64 | 100.0% |
Housing Structures by Occupancy in Cane Beds
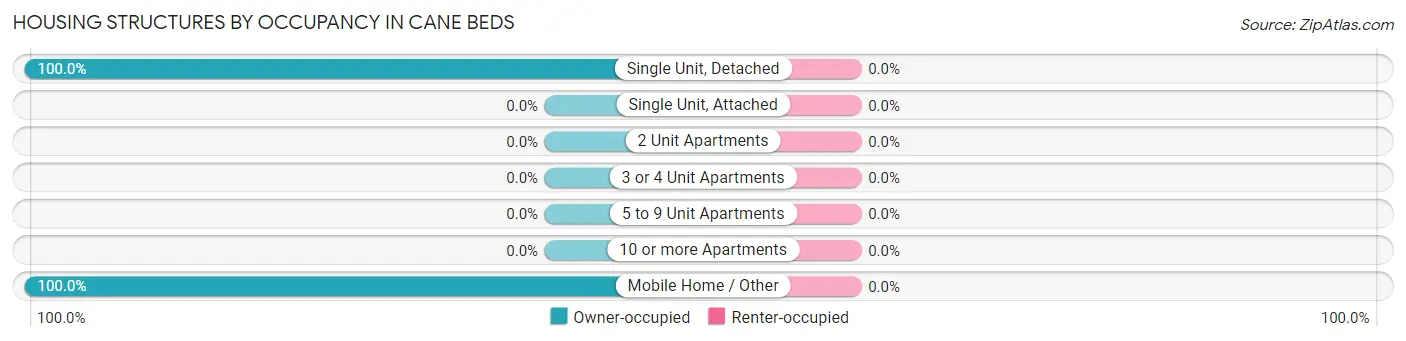
| Structure Type | Owner-occupied | Renter-occupied |
| Single Unit, Detached | 30 (100.0%) | 0 (0.0%) |
| Single Unit, Attached | 0 (0.0%) | 0 (0.0%) |
| 2 Unit Apartments | 0 (0.0%) | 0 (0.0%) |
| 3 or 4 Unit Apartments | 0 (0.0%) | 0 (0.0%) |
| 5 to 9 Unit Apartments | 0 (0.0%) | 0 (0.0%) |
| 10 or more Apartments | 0 (0.0%) | 0 (0.0%) |
| Mobile Home / Other | 34 (100.0%) | 0 (0.0%) |
| Total | 64 (100.0%) | 0 (0.0%) |
Housing Structures by Number of Rooms in Cane Beds
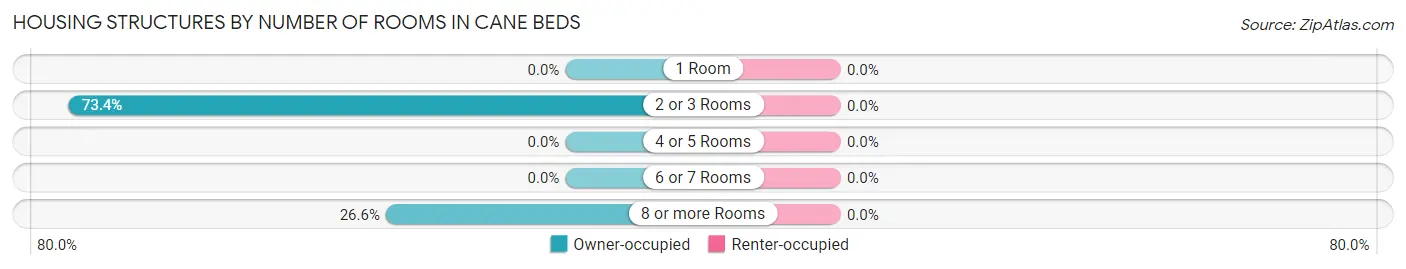
| Number of Rooms | Owner-occupied | Renter-occupied |
| 1 Room | 0 (0.0%) | 0 (0.0%) |
| 2 or 3 Rooms | 47 (73.4%) | 0 (0.0%) |
| 4 or 5 Rooms | 0 (0.0%) | 0 (0.0%) |
| 6 or 7 Rooms | 0 (0.0%) | 0 (0.0%) |
| 8 or more Rooms | 17 (26.6%) | 0 (0.0%) |
| Total | 64 (100.0%) | 0 (0.0%) |
Housing Structure by Heating Type in Cane Beds
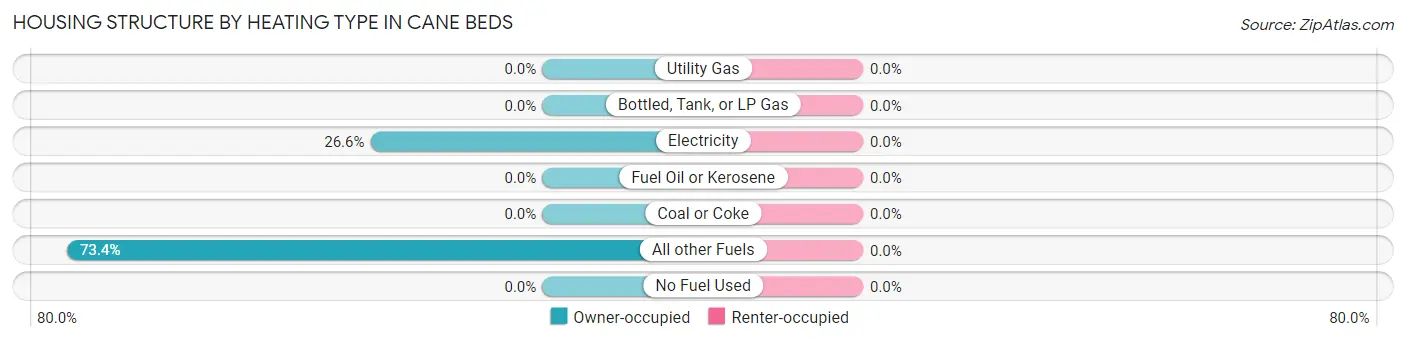
| Heating Type | Owner-occupied | Renter-occupied |
| Utility Gas | 0 (0.0%) | 0 (0.0%) |
| Bottled, Tank, or LP Gas | 0 (0.0%) | 0 (0.0%) |
| Electricity | 17 (26.6%) | 0 (0.0%) |
| Fuel Oil or Kerosene | 0 (0.0%) | 0 (0.0%) |
| Coal or Coke | 0 (0.0%) | 0 (0.0%) |
| All other Fuels | 47 (73.4%) | 0 (0.0%) |
| No Fuel Used | 0 (0.0%) | 0 (0.0%) |
| Total | 64 (100.0%) | 0 (0.0%) |
Household Vehicle Usage in Cane Beds
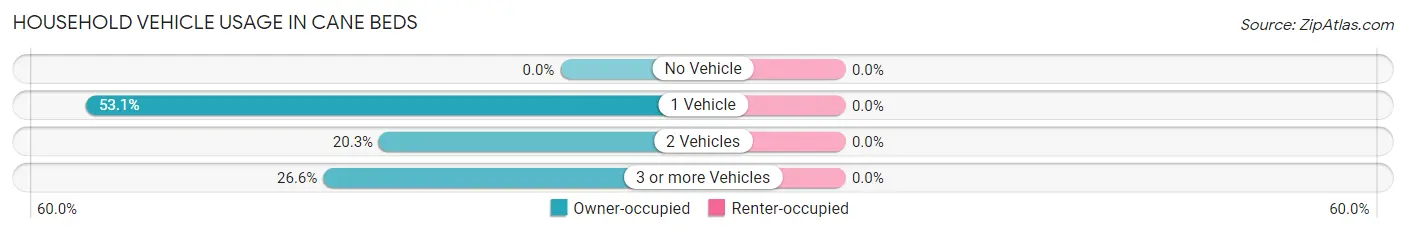
| Vehicles per Household | Owner-occupied | Renter-occupied |
| No Vehicle | 0 (0.0%) | 0 (0.0%) |
| 1 Vehicle | 34 (53.1%) | 0 (0.0%) |
| 2 Vehicles | 13 (20.3%) | 0 (0.0%) |
| 3 or more Vehicles | 17 (26.6%) | 0 (0.0%) |
| Total | 64 (100.0%) | 0 (0.0%) |
Real Estate & Mortgages in Cane Beds
Real Estate and Mortgage Overview in Cane Beds
| Characteristic | Without Mortgage | With Mortgage |
| Housing Units | 64 | 0 |
| Median Property Value | - | - |
| Median Household Income | - | - |
| Monthly Housing Costs | $406 | $0 |
| Real Estate Taxes | - | - |
Property Value by Mortgage Status in Cane Beds
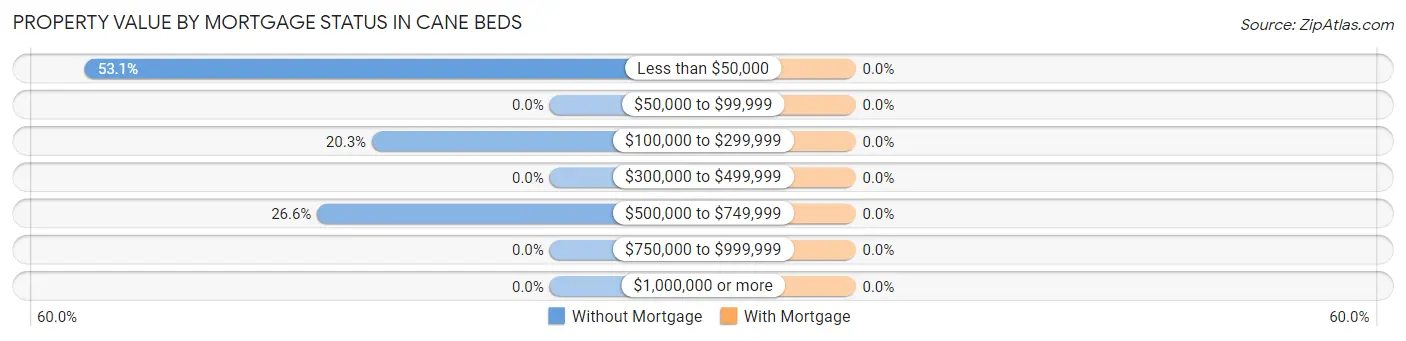
| Property Value | Without Mortgage | With Mortgage |
| Less than $50,000 | 34 (53.1%) | 0 (0.0%) |
| $50,000 to $99,999 | 0 (0.0%) | 0 (0.0%) |
| $100,000 to $299,999 | 13 (20.3%) | 0 (0.0%) |
| $300,000 to $499,999 | 0 (0.0%) | 0 (0.0%) |
| $500,000 to $749,999 | 17 (26.6%) | 0 (0.0%) |
| $750,000 to $999,999 | 0 (0.0%) | 0 (0.0%) |
| $1,000,000 or more | 0 (0.0%) | 0 (0.0%) |
| Total | 64 (100.0%) | 0 (0.0%) |
Household Income by Mortgage Status in Cane Beds
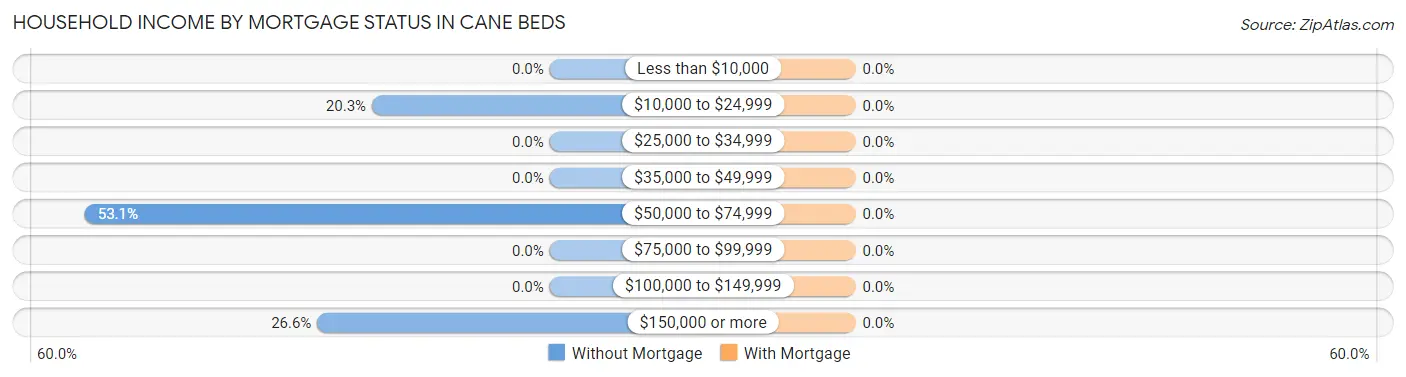
| Household Income | Without Mortgage | With Mortgage |
| Less than $10,000 | 0 (0.0%) | 0 (0.0%) |
| $10,000 to $24,999 | 13 (20.3%) | 0 (0.0%) |
| $25,000 to $34,999 | 0 (0.0%) | 0 (0.0%) |
| $35,000 to $49,999 | 0 (0.0%) | 0 (0.0%) |
| $50,000 to $74,999 | 34 (53.1%) | 0 (0.0%) |
| $75,000 to $99,999 | 0 (0.0%) | 0 (0.0%) |
| $100,000 to $149,999 | 0 (0.0%) | 0 (0.0%) |
| $150,000 or more | 17 (26.6%) | 0 (0.0%) |
| Total | 64 (100.0%) | 0 (0.0%) |
Property Value to Household Income Ratio in Cane Beds
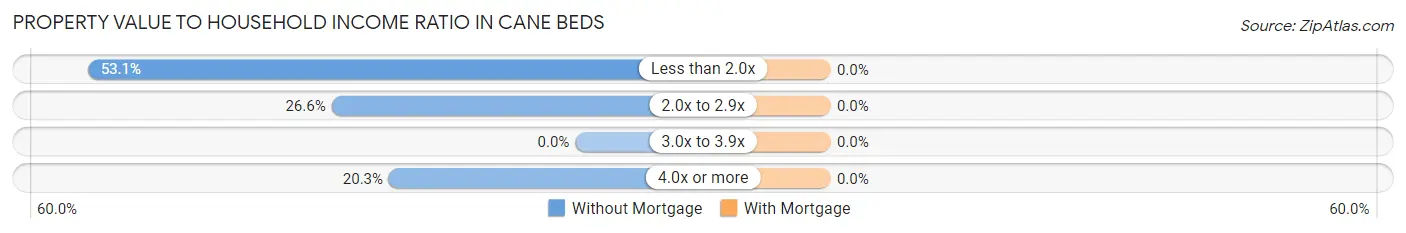
| Value-to-Income Ratio | Without Mortgage | With Mortgage |
| Less than 2.0x | 34 (53.1%) | 0 (0.0%) |
| 2.0x to 2.9x | 17 (26.6%) | 0 (0.0%) |
| 3.0x to 3.9x | 0 (0.0%) | 0 (0.0%) |
| 4.0x or more | 13 (20.3%) | 0 (0.0%) |
| Total | 64 (100.0%) | 0 (0.0%) |
Real Estate Taxes by Mortgage Status in Cane Beds
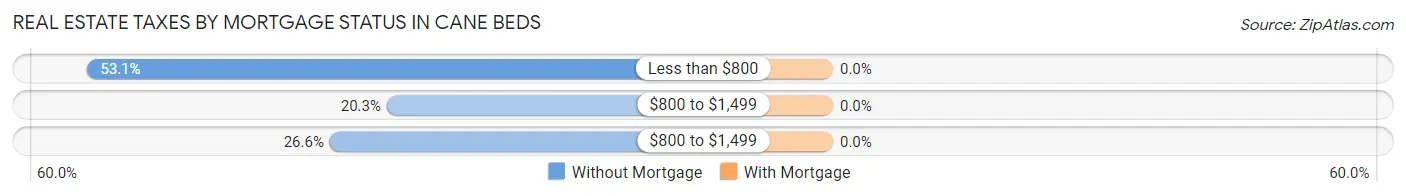
| Property Taxes | Without Mortgage | With Mortgage |
| Less than $800 | 34 (53.1%) | 0 (0.0%) |
| $800 to $1,499 | 13 (20.3%) | 0 (0.0%) |
| $800 to $1,499 | 17 (26.6%) | 0 (0.0%) |
| Total | 64 (100.0%) | 0 (0.0%) |
Health & Disability in Cane Beds
Health Insurance Coverage by Age in Cane Beds
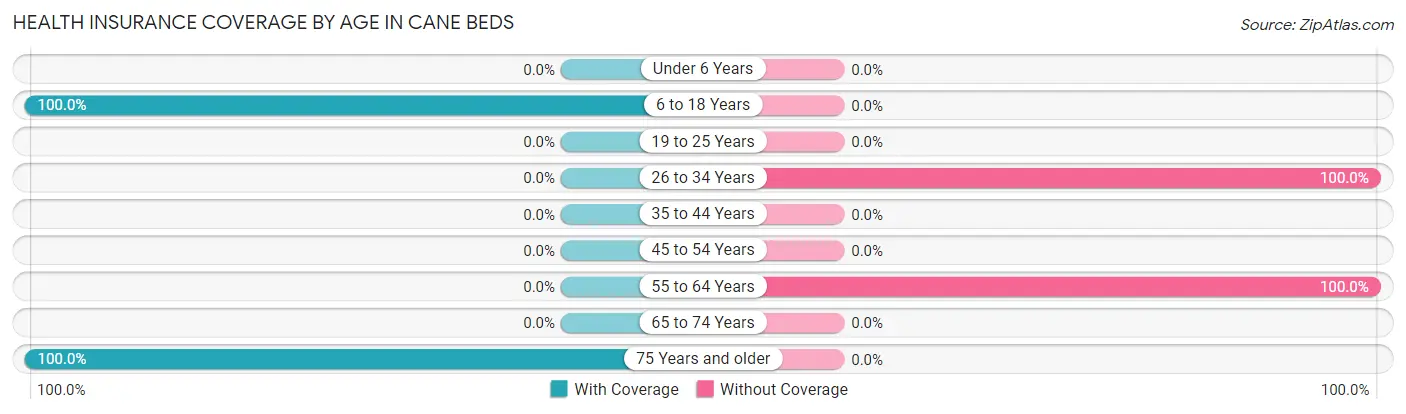
| Age Bracket | With Coverage | Without Coverage |
| Under 6 Years | 0 (0.0%) | 0 (0.0%) |
| 6 to 18 Years | 86 (100.0%) | 0 (0.0%) |
| 19 to 25 Years | 0 (0.0%) | 0 (0.0%) |
| 26 to 34 Years | 0 (0.0%) | 96 (100.0%) |
| 35 to 44 Years | 0 (0.0%) | 0 (0.0%) |
| 45 to 54 Years | 0 (0.0%) | 0 (0.0%) |
| 55 to 64 Years | 0 (0.0%) | 50 (100.0%) |
| 65 to 74 Years | 0 (0.0%) | 0 (0.0%) |
| 75 Years and older | 14 (100.0%) | 0 (0.0%) |
| Total | 100 (40.6%) | 146 (59.4%) |
Health Insurance Coverage by Citizenship Status in Cane Beds
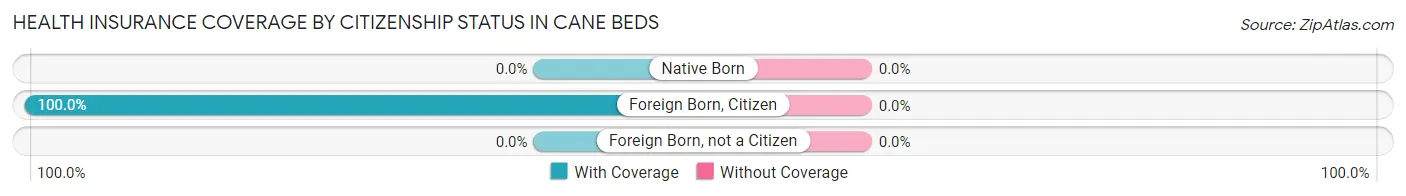
| Citizenship Status | With Coverage | Without Coverage |
| Native Born | 0 (0.0%) | 0 (0.0%) |
| Foreign Born, Citizen | 86 (100.0%) | 0 (0.0%) |
| Foreign Born, not a Citizen | 0 (0.0%) | 0 (0.0%) |
Health Insurance Coverage by Household Income in Cane Beds
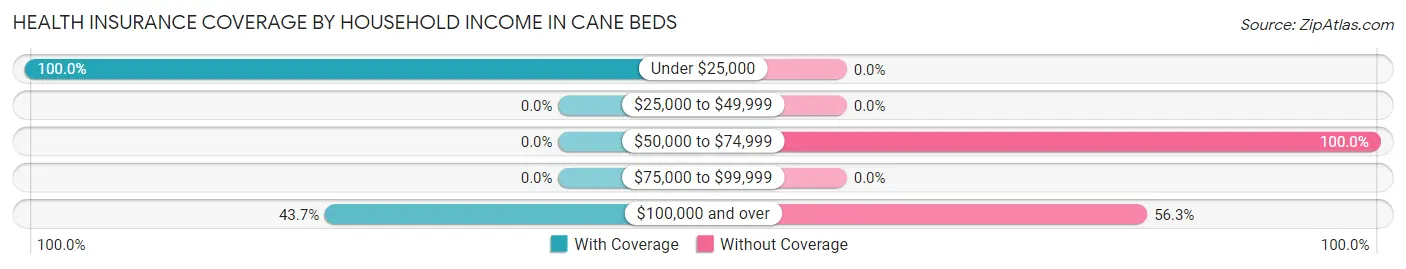
| Household Income | With Coverage | Without Coverage |
| Under $25,000 | 13 (100.0%) | 0 (0.0%) |
| $25,000 to $49,999 | 0 (0.0%) | 0 (0.0%) |
| $50,000 to $74,999 | 0 (0.0%) | 34 (100.0%) |
| $75,000 to $99,999 | 0 (0.0%) | 0 (0.0%) |
| $100,000 and over | 87 (43.7%) | 112 (56.3%) |
Public vs Private Health Insurance Coverage by Age in Cane Beds
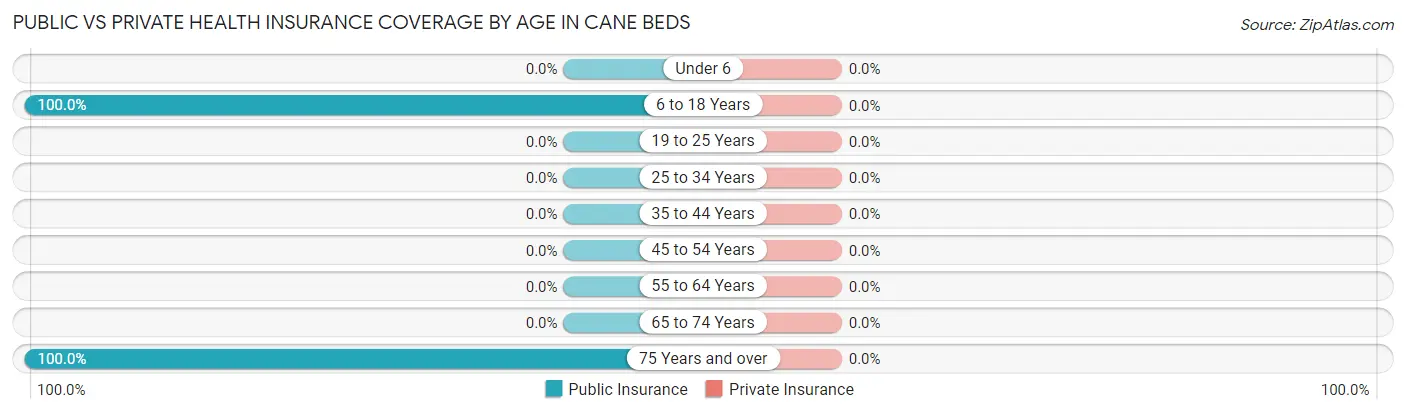
| Age Bracket | Public Insurance | Private Insurance |
| Under 6 | 0 (0.0%) | 0 (0.0%) |
| 6 to 18 Years | 86 (100.0%) | 0 (0.0%) |
| 19 to 25 Years | 0 (0.0%) | 0 (0.0%) |
| 25 to 34 Years | 0 (0.0%) | 0 (0.0%) |
| 35 to 44 Years | 0 (0.0%) | 0 (0.0%) |
| 45 to 54 Years | 0 (0.0%) | 0 (0.0%) |
| 55 to 64 Years | 0 (0.0%) | 0 (0.0%) |
| 65 to 74 Years | 0 (0.0%) | 0 (0.0%) |
| 75 Years and over | 14 (100.0%) | 0 (0.0%) |
| Total | 100 (40.6%) | 0 (0.0%) |
Disability Status by Sex by Age in Cane Beds
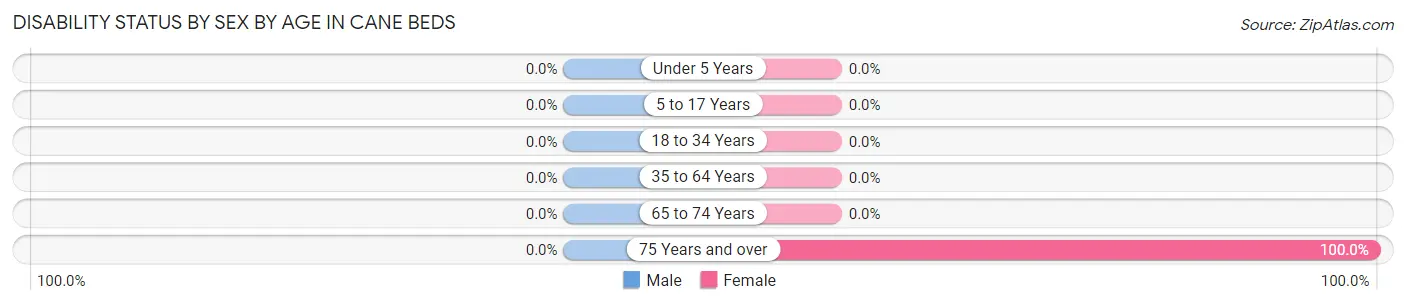
| Age Bracket | Male | Female |
| Under 5 Years | 0 (0.0%) | 0 (0.0%) |
| 5 to 17 Years | 0 (0.0%) | 0 (0.0%) |
| 18 to 34 Years | 0 (0.0%) | 0 (0.0%) |
| 35 to 64 Years | 0 (0.0%) | 0 (0.0%) |
| 65 to 74 Years | 0 (0.0%) | 0 (0.0%) |
| 75 Years and over | 0 (0.0%) | 1 (100.0%) |
Disability Class by Sex by Age in Cane Beds
Disability Class: Hearing Difficulty
| Age Bracket | Male | Female |
| Under 5 Years | 0 (0.0%) | 0 (0.0%) |
| 5 to 17 Years | 0 (0.0%) | 0 (0.0%) |
| 18 to 34 Years | 0 (0.0%) | 0 (0.0%) |
| 35 to 64 Years | 0 (0.0%) | 0 (0.0%) |
| 65 to 74 Years | 0 (0.0%) | 0 (0.0%) |
| 75 Years and over | 0 (0.0%) | 0 (0.0%) |
Disability Class: Vision Difficulty
| Age Bracket | Male | Female |
| Under 5 Years | 0 (0.0%) | 0 (0.0%) |
| 5 to 17 Years | 0 (0.0%) | 0 (0.0%) |
| 18 to 34 Years | 0 (0.0%) | 0 (0.0%) |
| 35 to 64 Years | 0 (0.0%) | 0 (0.0%) |
| 65 to 74 Years | 0 (0.0%) | 0 (0.0%) |
| 75 Years and over | 0 (0.0%) | 0 (0.0%) |
Disability Class: Cognitive Difficulty
| Age Bracket | Male | Female |
| 5 to 17 Years | 0 (0.0%) | 0 (0.0%) |
| 18 to 34 Years | 0 (0.0%) | 0 (0.0%) |
| 35 to 64 Years | 0 (0.0%) | 0 (0.0%) |
| 65 to 74 Years | 0 (0.0%) | 0 (0.0%) |
| 75 Years and over | 0 (0.0%) | 0 (0.0%) |
Disability Class: Ambulatory Difficulty
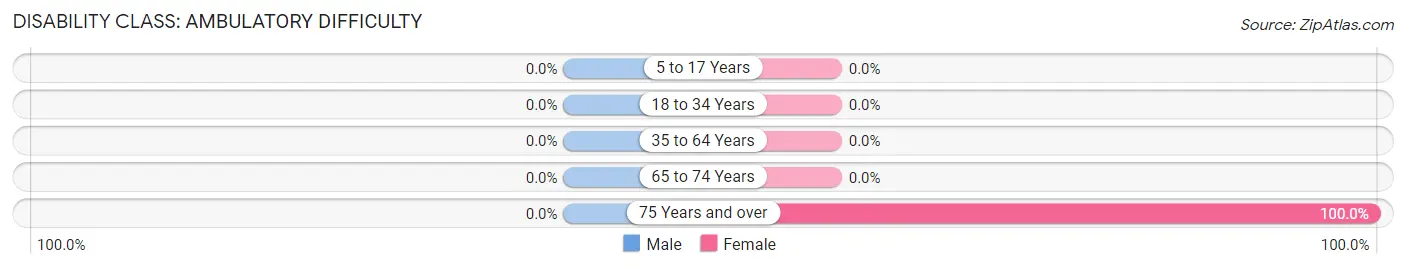
| Age Bracket | Male | Female |
| 5 to 17 Years | 0 (0.0%) | 0 (0.0%) |
| 18 to 34 Years | 0 (0.0%) | 0 (0.0%) |
| 35 to 64 Years | 0 (0.0%) | 0 (0.0%) |
| 65 to 74 Years | 0 (0.0%) | 0 (0.0%) |
| 75 Years and over | 0 (0.0%) | 1 (100.0%) |
Disability Class: Self-Care Difficulty
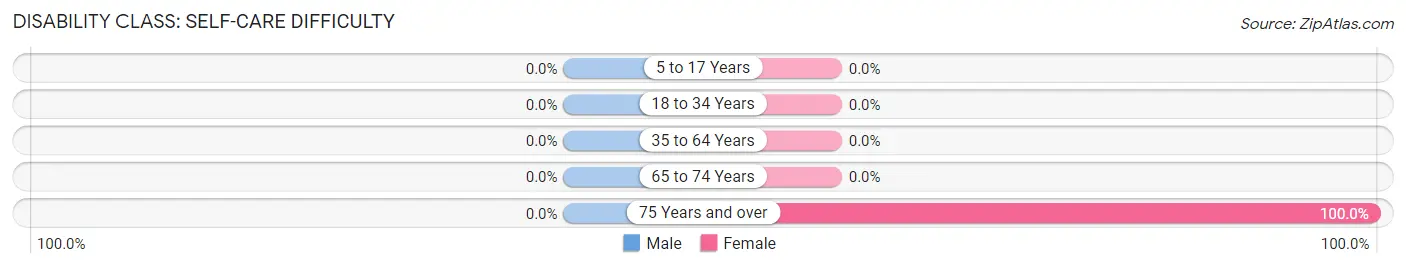
| Age Bracket | Male | Female |
| 5 to 17 Years | 0 (0.0%) | 0 (0.0%) |
| 18 to 34 Years | 0 (0.0%) | 0 (0.0%) |
| 35 to 64 Years | 0 (0.0%) | 0 (0.0%) |
| 65 to 74 Years | 0 (0.0%) | 0 (0.0%) |
| 75 Years and over | 0 (0.0%) | 1 (100.0%) |
Technology Access in Cane Beds
Computing Device Access in Cane Beds
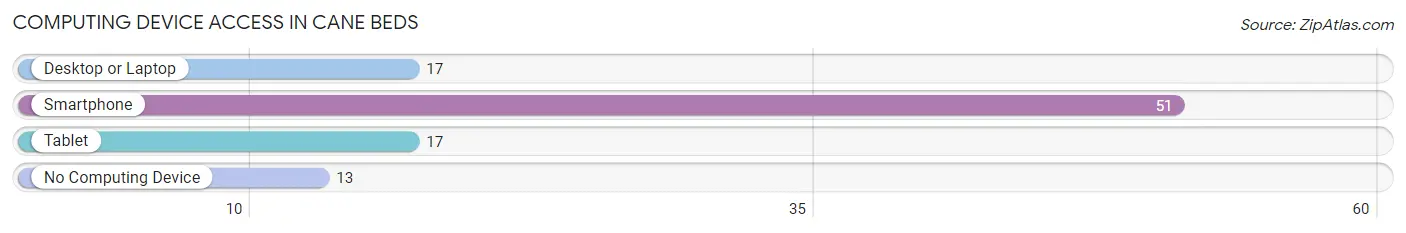
| Device Type | # Households | % Households |
| Desktop or Laptop | 17 | 26.6% |
| Smartphone | 51 | 79.7% |
| Tablet | 17 | 26.6% |
| No Computing Device | 13 | 20.3% |
| Total | 64 | 100.0% |
Internet Access in Cane Beds
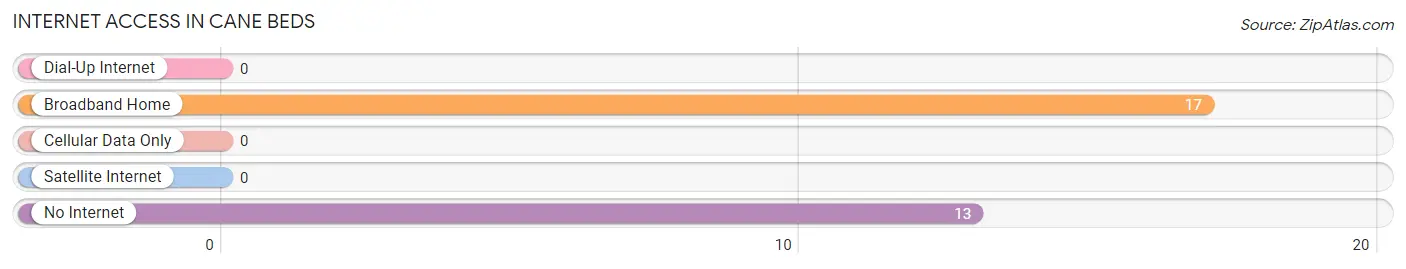
| Internet Type | # Households | % Households |
| Dial-Up Internet | 0 | 0.0% |
| Broadband Home | 17 | 26.6% |
| Cellular Data Only | 0 | 0.0% |
| Satellite Internet | 0 | 0.0% |
| No Internet | 13 | 20.3% |
| Total | 64 | 100.0% |
Cane Beds Summary
Cane Beds is a small unincorporated community located in Mohave County, Arizona. It is situated in the Arizona Strip, a remote region of the state that is bordered by Utah to the north and Nevada to the east. The community is located approximately 25 miles south of St. George, Utah, and is accessible via State Route 389. As of the 2010 census, the population of Cane Beds was estimated to be around 200 people.
History
The area that is now known as Cane Beds was first settled by Mormon pioneers in the late 19th century. The community was named after the nearby Cane Beds, a large area of land covered in tall grasses and reeds. The settlers used the reeds to make beds and furniture, hence the name.
The first post office in Cane Beds was established in 1883. The community grew slowly over the years, and by the early 20th century, it had become a small farming and ranching community.
Geography
Cane Beds is located in the Arizona Strip, a remote region of the state that is bordered by Utah to the north and Nevada to the east. The community is situated at an elevation of 4,000 feet and is surrounded by the Grand Canyon-Parashant National Monument.
The climate in Cane Beds is arid and semi-arid, with hot summers and mild winters. The average annual precipitation is around 8 inches.
Economy
The economy of Cane Beds is largely based on agriculture and ranching. The area is home to several cattle ranches, as well as some small farms. The community also has a few small businesses, including a gas station, a convenience store, and a restaurant.
Demographics
As of the 2010 census, the population of Cane Beds was estimated to be around 200 people. The racial makeup of the community was 95.5% White, 0.5% Native American, 0.5% Asian, and 3.5% from other races. The median household income was $35,000, and the median age was 44 years.
Conclusion
Cane Beds is a small unincorporated community located in Mohave County, Arizona. It is situated in the Arizona Strip, a remote region of the state that is bordered by Utah to the north and Nevada to the east. The community was first settled by Mormon pioneers in the late 19th century, and has since become a small farming and ranching community. As of the 2010 census, the population of Cane Beds was estimated to be around 200 people. The economy of Cane Beds is largely based on agriculture and ranching, and the community also has a few small businesses.
Common Questions
What is Per Capita Income in Cane Beds?
Per Capita income in Cane Beds is $26,289.
What is Inequality or Gini Index in Cane Beds?
Inequality or Gini Index in Cane Beds is 0.43.
What is the Total Population of Cane Beds?
Total Population of Cane Beds is 246.
What is the Total Male Population of Cane Beds?
Total Male Population of Cane Beds is 166.
What is the Total Female Population of Cane Beds?
Total Female Population of Cane Beds is 80.
What is the Ratio of Males per 100 Females in Cane Beds?
There are 207.50 Males per 100 Females in Cane Beds.
What is the Ratio of Females per 100 Males in Cane Beds?
There are 48.19 Females per 100 Males in Cane Beds.
What is the Median Population Age in Cane Beds?
Median Population Age in Cane Beds is 27.6 Years.
What is the Average Family Size in Cane Beds
Average Family Size in Cane Beds is 6.7 People.
What is the Average Household Size in Cane Beds
Average Household Size in Cane Beds is 3.8 People.
How Large is the Labor Force in Cane Beds?
There are 113 People in the Labor Forcein in Cane Beds.
What is the Percentage of People in the Labor Force in Cane Beds?
70.6% of People are in the Labor Force in Cane Beds.