Delano, MN Map & Demographics
Delano Map
Delano Overview
$44,425
PER CAPITA INCOME
$122,273
AVG FAMILY INCOME
$105,766
AVG HOUSEHOLD INCOME
44.6%
WAGE / INCOME GAP [ % ]
55.4¢/ $1
WAGE / INCOME GAP [ $ ]
0.41
INEQUALITY / GINI INDEX
6,539
TOTAL POPULATION
3,317
MALE POPULATION
3,222
FEMALE POPULATION
102.95
MALES / 100 FEMALES
97.14
FEMALES / 100 MALES
36.1
MEDIAN AGE
3.3
AVG FAMILY SIZE
2.7
AVG HOUSEHOLD SIZE
3,631
LABOR FORCE [ PEOPLE ]
75.6%
PERCENT IN LABOR FORCE
0.8%
UNEMPLOYMENT RATE
Delano Zip Codes
Delano Area Codes
Income in Delano
Income Overview in Delano
Per Capita Income in Delano is $44,425, while median incomes of families and households are $122,273 and $105,766 respectively.
| Characteristic | Number | Measure |
| Per Capita Income | 6,539 | $44,425 |
| Median Family Income | 1,722 | $122,273 |
| Mean Family Income | 1,722 | $143,103 |
| Median Household Income | 2,383 | $105,766 |
| Mean Household Income | 2,383 | $118,107 |
| Income Deficit | 1,722 | $0 |
| Wage / Income Gap (%) | 6,539 | 44.63% |
| Wage / Income Gap ($) | 6,539 | 55.37¢ per $1 |
| Gini / Inequality Index | 6,539 | 0.41 |
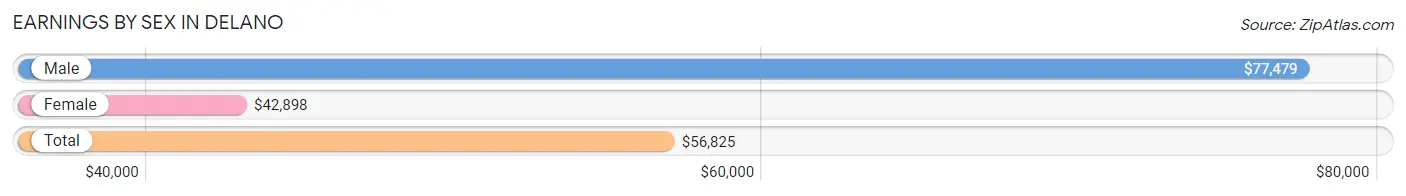
Earnings by Sex in Delano
Average Earnings in Delano are $56,825, $77,479 for men and $42,898 for women, a difference of 44.6%.
| Sex | Number | Average Earnings |
| Male | 1,883 (51.0%) | $77,479 |
| Female | 1,812 (49.0%) | $42,898 |
| Total | 3,695 (100.0%) | $56,825 |
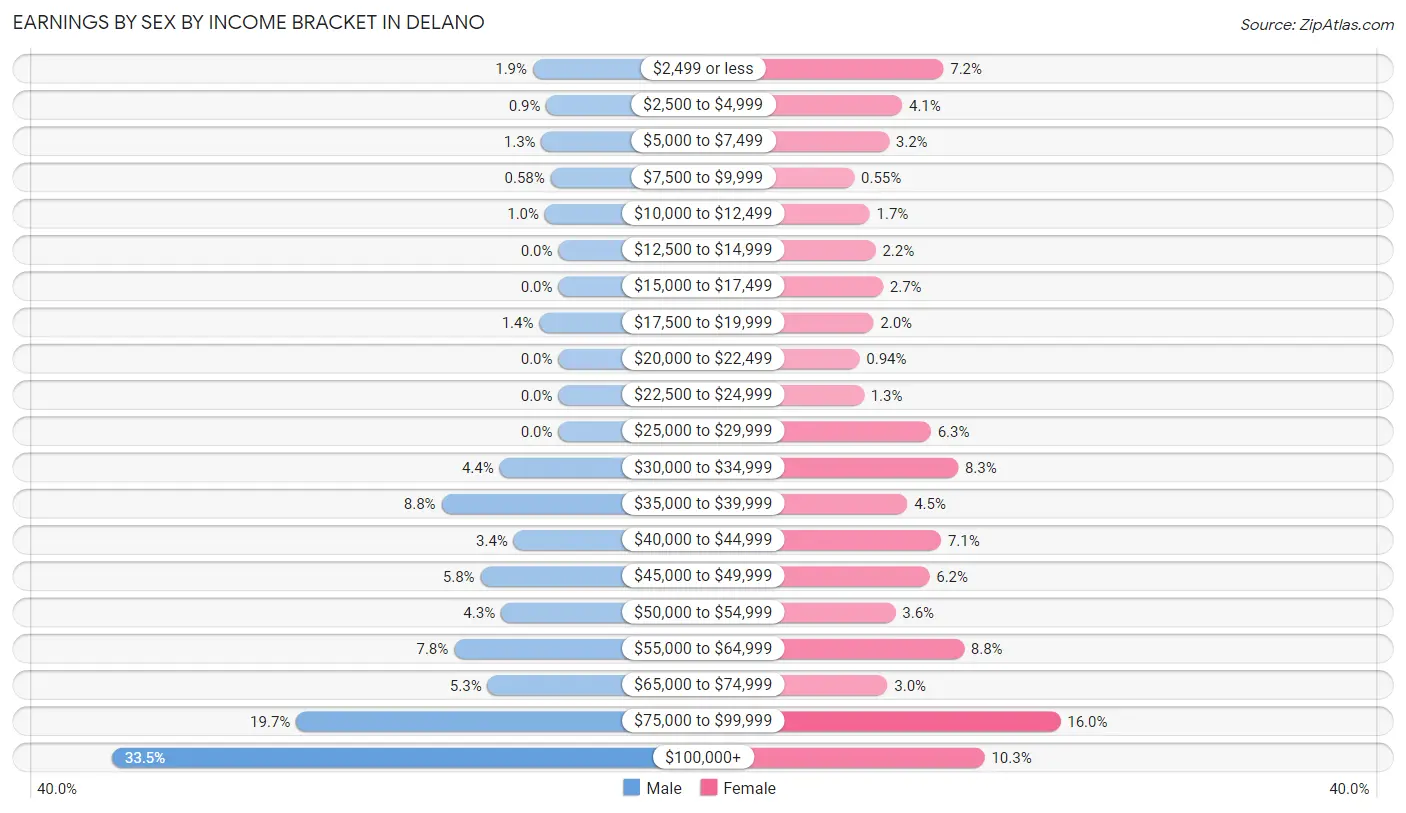
Earnings by Sex by Income Bracket in Delano
The most common earnings brackets in Delano are $100,000+ for men (630 | 33.5%) and $75,000 to $99,999 for women (290 | 16.0%).
| Income | Male | Female |
| $2,499 or less | 36 (1.9%) | 131 (7.2%) |
| $2,500 to $4,999 | 17 (0.9%) | 75 (4.1%) |
| $5,000 to $7,499 | 24 (1.3%) | 57 (3.2%) |
| $7,500 to $9,999 | 11 (0.6%) | 10 (0.5%) |
| $10,000 to $12,499 | 19 (1.0%) | 31 (1.7%) |
| $12,500 to $14,999 | 0 (0.0%) | 39 (2.1%) |
| $15,000 to $17,499 | 0 (0.0%) | 49 (2.7%) |
| $17,500 to $19,999 | 27 (1.4%) | 36 (2.0%) |
| $20,000 to $22,499 | 0 (0.0%) | 17 (0.9%) |
| $22,500 to $24,999 | 0 (0.0%) | 23 (1.3%) |
| $25,000 to $29,999 | 0 (0.0%) | 114 (6.3%) |
| $30,000 to $34,999 | 83 (4.4%) | 151 (8.3%) |
| $35,000 to $39,999 | 165 (8.8%) | 82 (4.5%) |
| $40,000 to $44,999 | 63 (3.4%) | 128 (7.1%) |
| $45,000 to $49,999 | 110 (5.8%) | 112 (6.2%) |
| $50,000 to $54,999 | 81 (4.3%) | 66 (3.6%) |
| $55,000 to $64,999 | 147 (7.8%) | 159 (8.8%) |
| $65,000 to $74,999 | 100 (5.3%) | 55 (3.0%) |
| $75,000 to $99,999 | 370 (19.7%) | 290 (16.0%) |
| $100,000+ | 630 (33.5%) | 187 (10.3%) |
| Total | 1,883 (100.0%) | 1,812 (100.0%) |
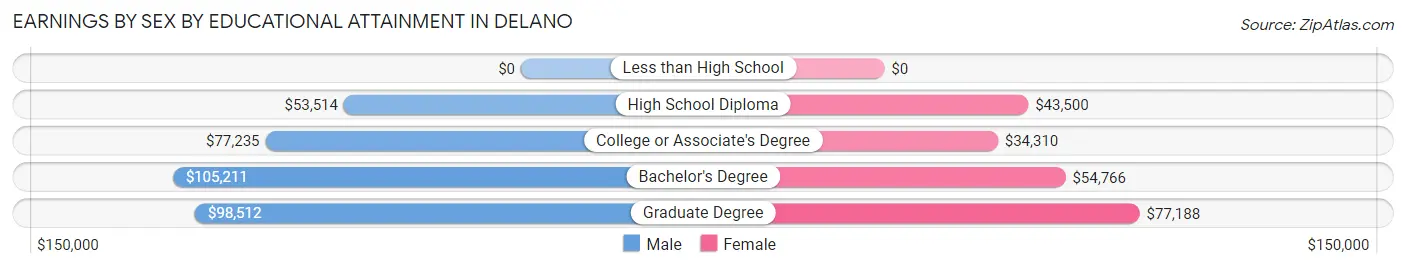
Earnings by Sex by Educational Attainment in Delano
Average earnings in Delano are $88,642 for men and $46,786 for women, a difference of 47.2%. Men with an educational attainment of bachelor's degree enjoy the highest average annual earnings of $105,211, while those with high school diploma education earn the least with $53,514. Women with an educational attainment of graduate degree earn the most with the average annual earnings of $77,188, while those with college or associate's degree education have the smallest earnings of $34,310.
| Educational Attainment | Male Income | Female Income |
| Less than High School | - | - |
| High School Diploma | $53,514 | $43,500 |
| College or Associate's Degree | $77,235 | $34,310 |
| Bachelor's Degree | $105,211 | $54,766 |
| Graduate Degree | $98,512 | $77,188 |
| Total | $88,642 | $46,786 |
Family Income in Delano
Family Income Brackets in Delano
According to the Delano family income data, there are 437 families falling into the $100,000 to $149,999 income range, which is the most common income bracket and makes up 25.4% of all families.
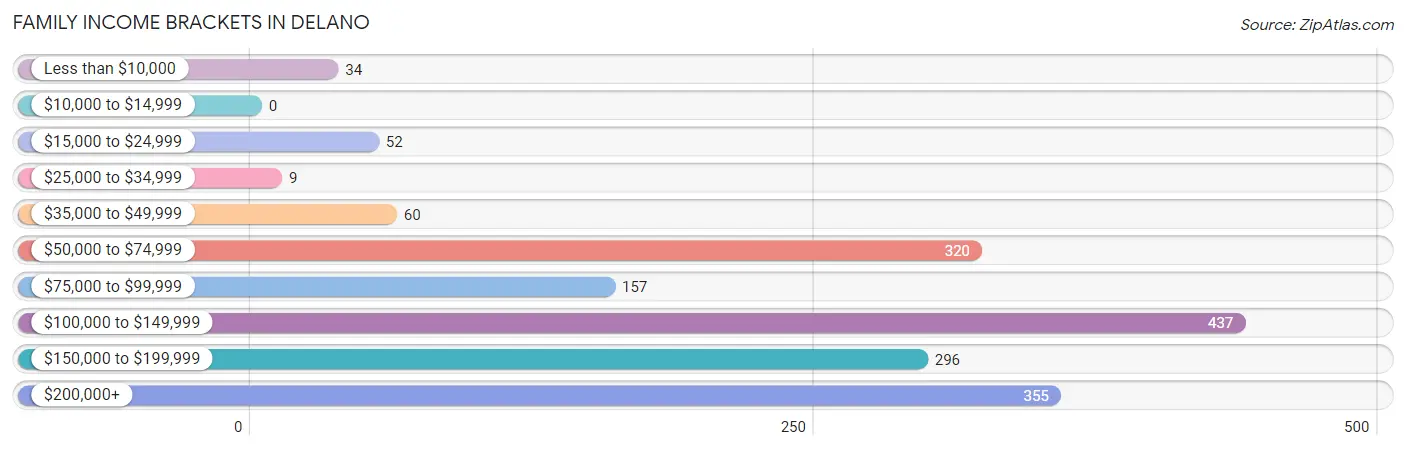
| Income Bracket | # Families | % Families |
| Less than $10,000 | 34 | 2.0% |
| $10,000 to $14,999 | 0 | 0.0% |
| $15,000 to $24,999 | 52 | 3.0% |
| $25,000 to $34,999 | 9 | 0.5% |
| $35,000 to $49,999 | 60 | 3.5% |
| $50,000 to $74,999 | 320 | 18.6% |
| $75,000 to $99,999 | 157 | 9.1% |
| $100,000 to $149,999 | 437 | 25.4% |
| $150,000 to $199,999 | 296 | 17.2% |
| $200,000+ | 355 | 20.6% |
Family Income by Famaliy Size in Delano
5-person families (234 | 13.6%) account for the highest median family income in Delano with $180,357 per family, while 2-person families (742 | 43.1%) have the highest median income of $47,969 per family member.
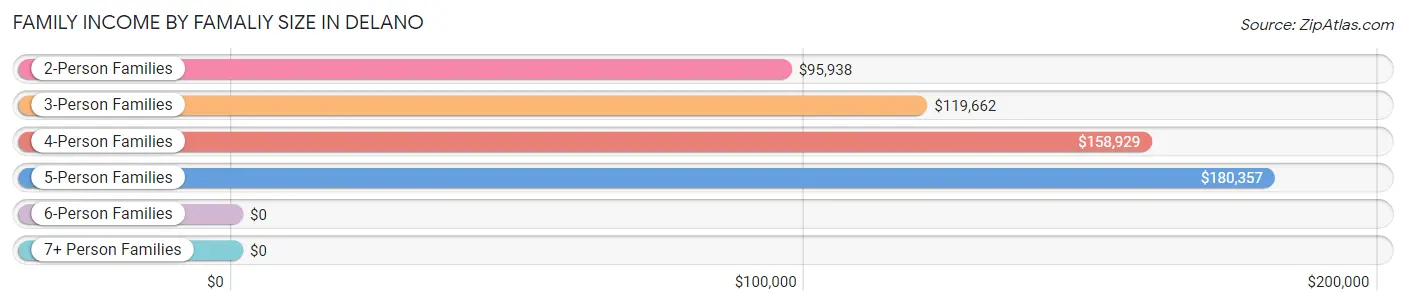
| Income Bracket | # Families | Median Income |
| 2-Person Families | 742 (43.1%) | $95,938 |
| 3-Person Families | 352 (20.4%) | $119,662 |
| 4-Person Families | 336 (19.5%) | $158,929 |
| 5-Person Families | 234 (13.6%) | $180,357 |
| 6-Person Families | 32 (1.9%) | $0 |
| 7+ Person Families | 26 (1.5%) | $0 |
| Total | 1,722 (100.0%) | $122,273 |
Family Income by Number of Earners in Delano
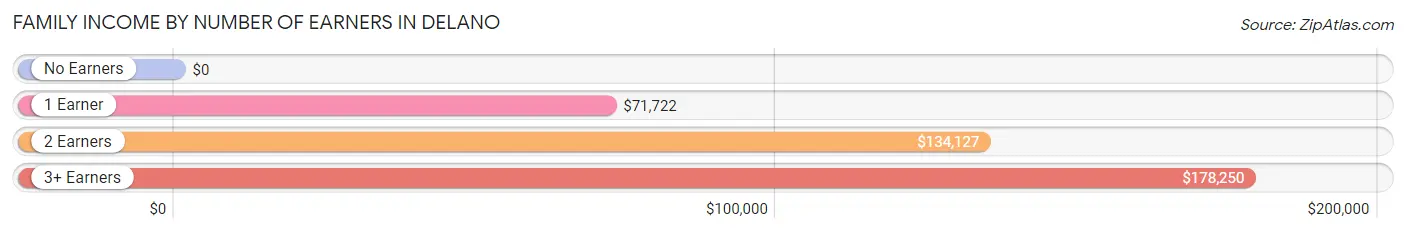
| Number of Earners | # Families | Median Income |
| No Earners | 143 (8.3%) | $0 |
| 1 Earner | 251 (14.6%) | $71,722 |
| 2 Earners | 1,173 (68.1%) | $134,127 |
| 3+ Earners | 155 (9.0%) | $178,250 |
| Total | 1,722 (100.0%) | $122,273 |
Household Income in Delano
Household Income Brackets in Delano
With 570 households falling in the category, the $100,000 to $149,999 income range is the most frequent in Delano, accounting for 23.9% of all households. In contrast, only 45 households (1.9%) fall into the $10,000 to $14,999 income bracket, making it the least populous group.
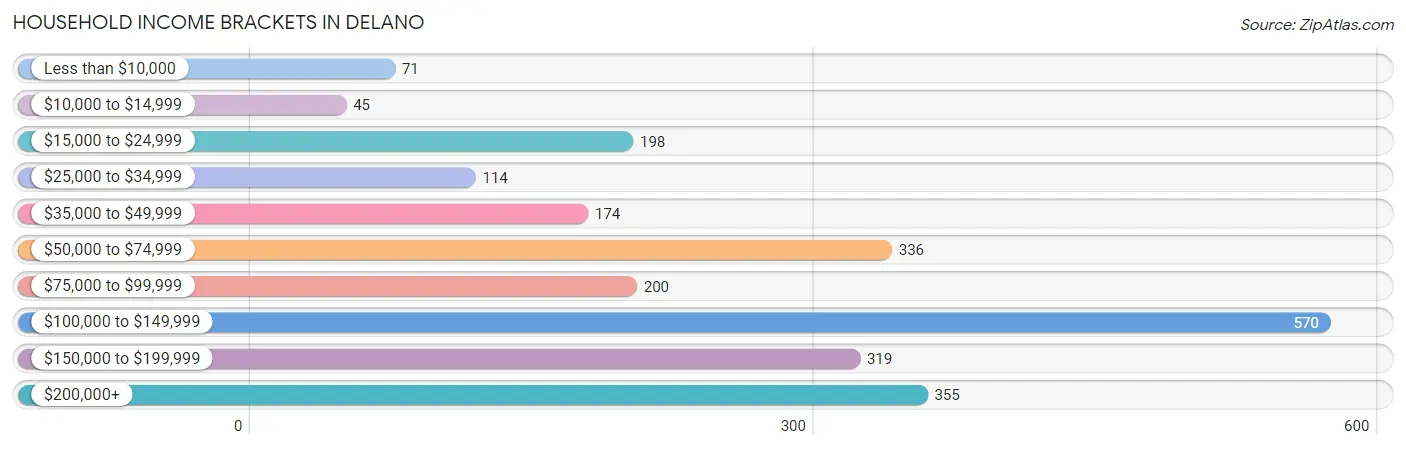
| Income Bracket | # Households | % Households |
| Less than $10,000 | 71 | 3.0% |
| $10,000 to $14,999 | 45 | 1.9% |
| $15,000 to $24,999 | 198 | 8.3% |
| $25,000 to $34,999 | 114 | 4.8% |
| $35,000 to $49,999 | 174 | 7.3% |
| $50,000 to $74,999 | 336 | 14.1% |
| $75,000 to $99,999 | 200 | 8.4% |
| $100,000 to $149,999 | 570 | 23.9% |
| $150,000 to $199,999 | 319 | 13.4% |
| $200,000+ | 355 | 14.9% |
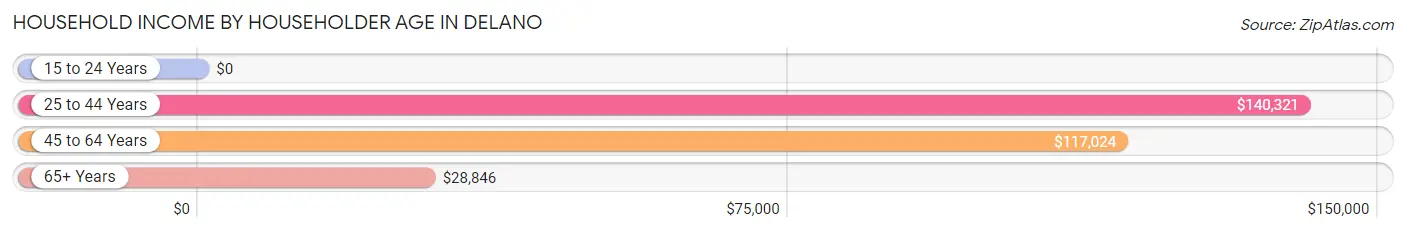
Household Income by Householder Age in Delano
The median household income in Delano is $105,766, with the highest median household income of $140,321 found in the 25 to 44 years age bracket for the primary householder. A total of 846 households (35.5%) fall into this category. Meanwhile, the 15 to 24 years age bracket for the primary householder has the lowest median household income of $0, with 27 households (1.1%) in this group.
| Income Bracket | # Households | Median Income |
| 15 to 24 Years | 27 (1.1%) | $0 |
| 25 to 44 Years | 846 (35.5%) | $140,321 |
| 45 to 64 Years | 898 (37.7%) | $117,024 |
| 65+ Years | 612 (25.7%) | $28,846 |
| Total | 2,383 (100.0%) | $105,766 |
Poverty in Delano
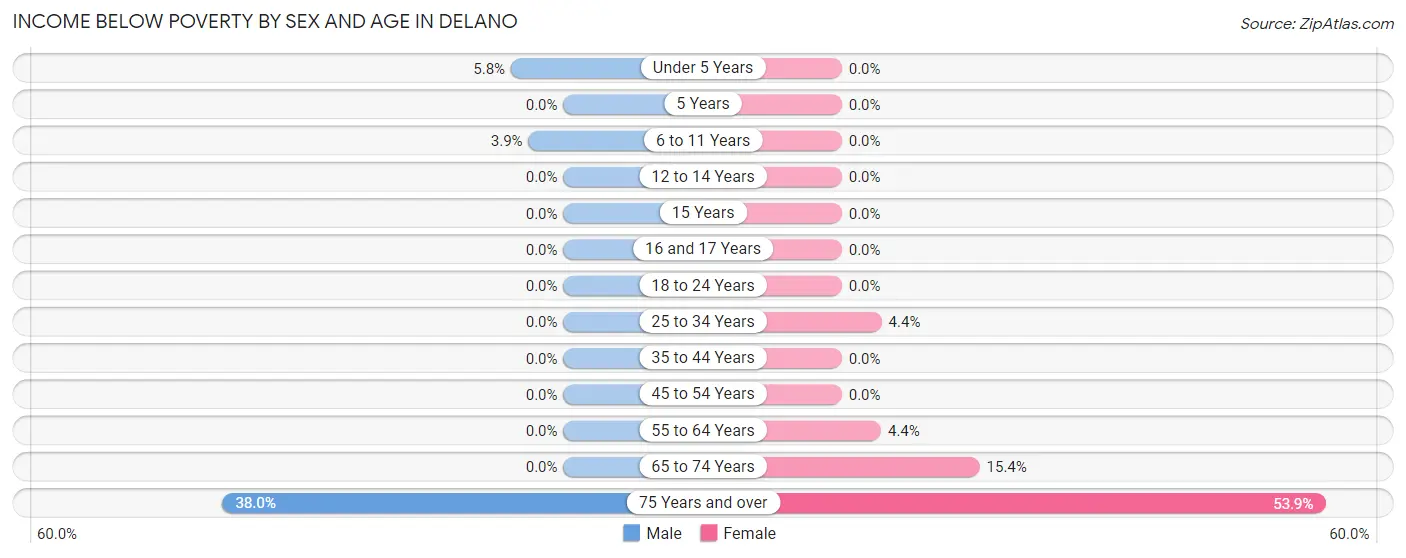
Income Below Poverty by Sex and Age in Delano
With 2.5% poverty level for males and 6.4% for females among the residents of Delano, 75 year old and over males and 75 year old and over females are the most vulnerable to poverty, with 52 males (38.0%) and 133 females (53.8%) in their respective age groups living below the poverty level.
| Age Bracket | Male | Female |
| Under 5 Years | 16 (5.8%) | 0 (0.0%) |
| 5 Years | 0 (0.0%) | 0 (0.0%) |
| 6 to 11 Years | 15 (3.9%) | 0 (0.0%) |
| 12 to 14 Years | 0 (0.0%) | 0 (0.0%) |
| 15 Years | 0 (0.0%) | 0 (0.0%) |
| 16 and 17 Years | 0 (0.0%) | 0 (0.0%) |
| 18 to 24 Years | 0 (0.0%) | 0 (0.0%) |
| 25 to 34 Years | 0 (0.0%) | 17 (4.4%) |
| 35 to 44 Years | 0 (0.0%) | 0 (0.0%) |
| 45 to 54 Years | 0 (0.0%) | 0 (0.0%) |
| 55 to 64 Years | 0 (0.0%) | 18 (4.4%) |
| 65 to 74 Years | 0 (0.0%) | 35 (15.3%) |
| 75 Years and over | 52 (38.0%) | 133 (53.8%) |
| Total | 83 (2.5%) | 203 (6.4%) |
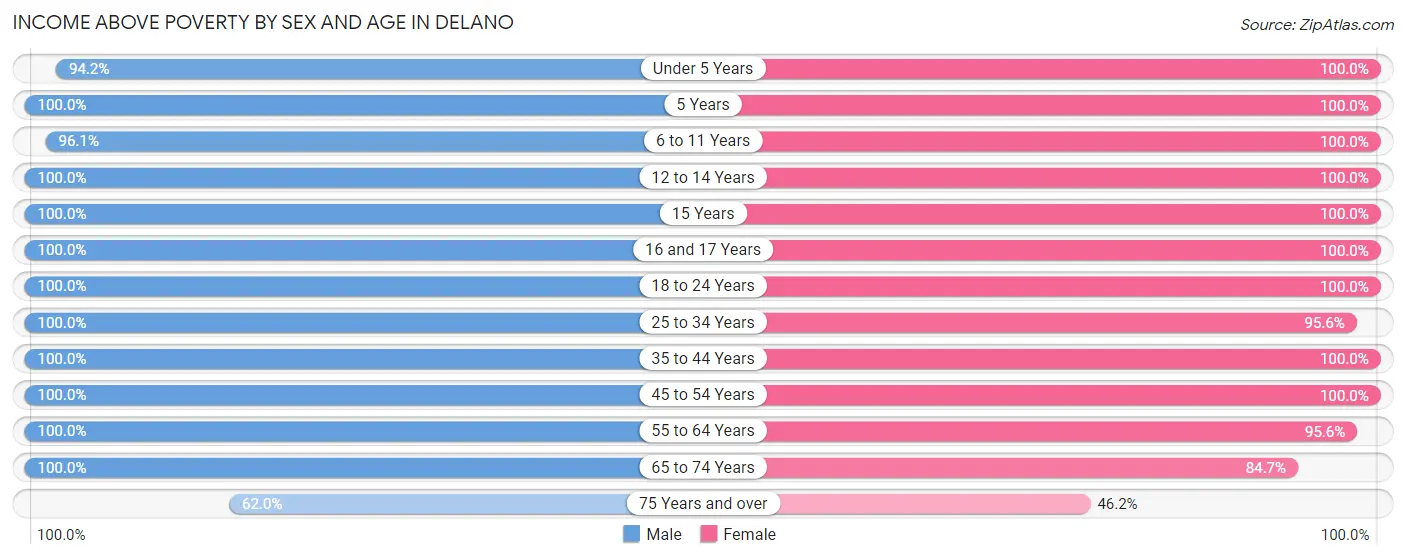
Income Above Poverty by Sex and Age in Delano
According to the poverty statistics in Delano, males aged 5 years and females aged under 5 years are the age groups that are most secure financially, with 100.0% of males and 100.0% of females in these age groups living above the poverty line.
| Age Bracket | Male | Female |
| Under 5 Years | 258 (94.2%) | 265 (100.0%) |
| 5 Years | 65 (100.0%) | 11 (100.0%) |
| 6 to 11 Years | 371 (96.1%) | 299 (100.0%) |
| 12 to 14 Years | 227 (100.0%) | 129 (100.0%) |
| 15 Years | 45 (100.0%) | 35 (100.0%) |
| 16 and 17 Years | 95 (100.0%) | 133 (100.0%) |
| 18 to 24 Years | 183 (100.0%) | 152 (100.0%) |
| 25 to 34 Years | 373 (100.0%) | 366 (95.6%) |
| 35 to 44 Years | 608 (100.0%) | 504 (100.0%) |
| 45 to 54 Years | 383 (100.0%) | 372 (100.0%) |
| 55 to 64 Years | 387 (100.0%) | 394 (95.6%) |
| 65 to 74 Years | 141 (100.0%) | 193 (84.7%) |
| 75 Years and over | 85 (62.0%) | 114 (46.2%) |
| Total | 3,221 (97.5%) | 2,967 (93.6%) |
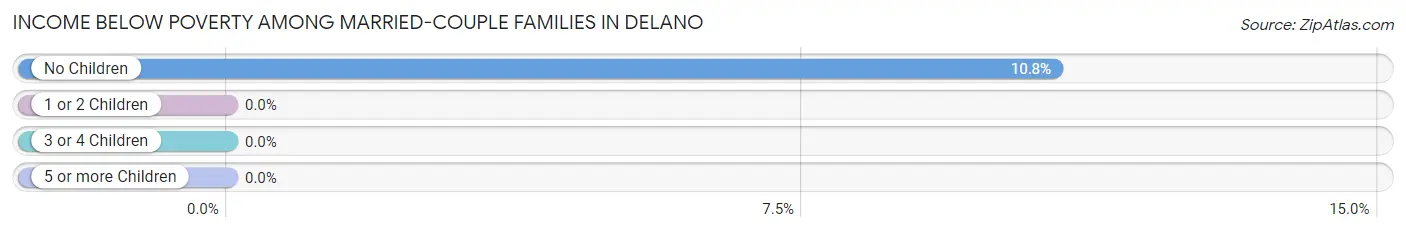
Income Below Poverty Among Married-Couple Families in Delano
The poverty statistics for married-couple families in Delano show that 4.0% or 52 of the total 1,293 families live below the poverty line. Families with no children have the highest poverty rate of 10.8%, comprising of 52 families. On the other hand, families with 1 or 2 children have the lowest poverty rate of 0.0%, which includes 0 families.
| Children | Above Poverty | Below Poverty |
| No Children | 431 (89.2%) | 52 (10.8%) |
| 1 or 2 Children | 576 (100.0%) | 0 (0.0%) |
| 3 or 4 Children | 208 (100.0%) | 0 (0.0%) |
| 5 or more Children | 26 (100.0%) | 0 (0.0%) |
| Total | 1,241 (96.0%) | 52 (4.0%) |
Income Below Poverty Among Single-Parent Households in Delano
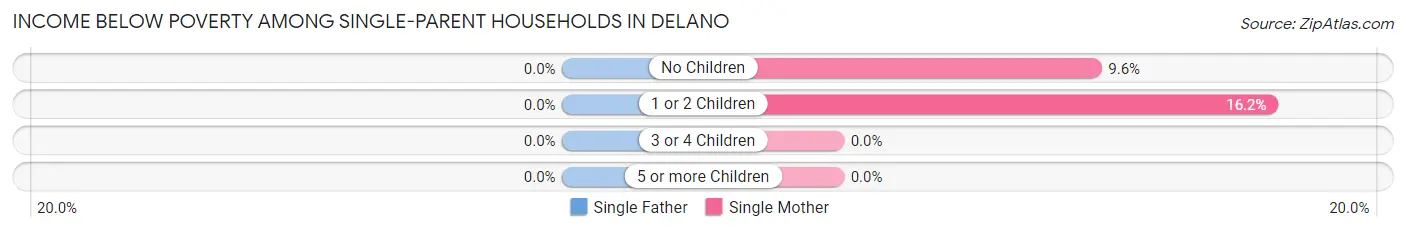
| Children | Single Father | Single Mother |
| No Children | 0 (0.0%) | 17 (9.6%) |
| 1 or 2 Children | 0 (0.0%) | 17 (16.2%) |
| 3 or 4 Children | 0 (0.0%) | 0 (0.0%) |
| 5 or more Children | 0 (0.0%) | 0 (0.0%) |
| Total | 0 (0.0%) | 34 (11.7%) |
Income Below Poverty Among Married-Couple vs Single-Parent Households in Delano
The poverty data for Delano shows that 52 of the married-couple family households (4.0%) and 34 of the single-parent households (7.9%) are living below the poverty level. Within the married-couple family households, those with no children have the highest poverty rate, with 52 households (10.8%) falling below the poverty line. Among the single-parent households, those with 1 or 2 children have the highest poverty rate, with 17 household (12.2%) living below poverty.
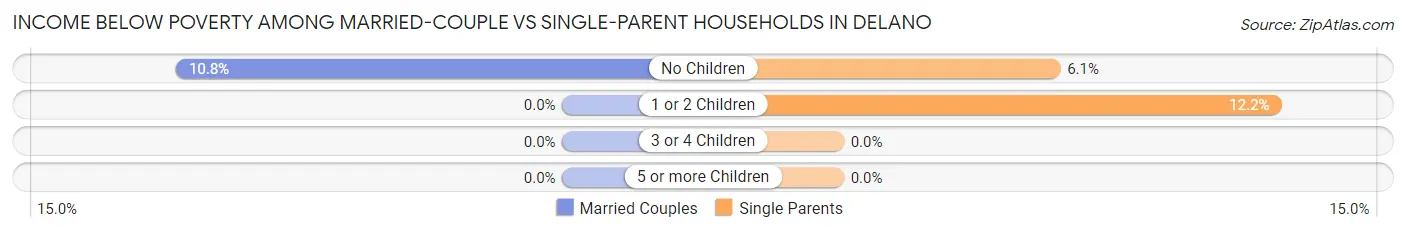
| Children | Married-Couple Families | Single-Parent Households |
| No Children | 52 (10.8%) | 17 (6.0%) |
| 1 or 2 Children | 0 (0.0%) | 17 (12.2%) |
| 3 or 4 Children | 0 (0.0%) | 0 (0.0%) |
| 5 or more Children | 0 (0.0%) | 0 (0.0%) |
| Total | 52 (4.0%) | 34 (7.9%) |
Race in Delano
The most populous races in Delano are White / Caucasian (6,197 | 94.8%), Hispanic or Latino (283 | 4.3%), and Two or more Races (277 | 4.2%).
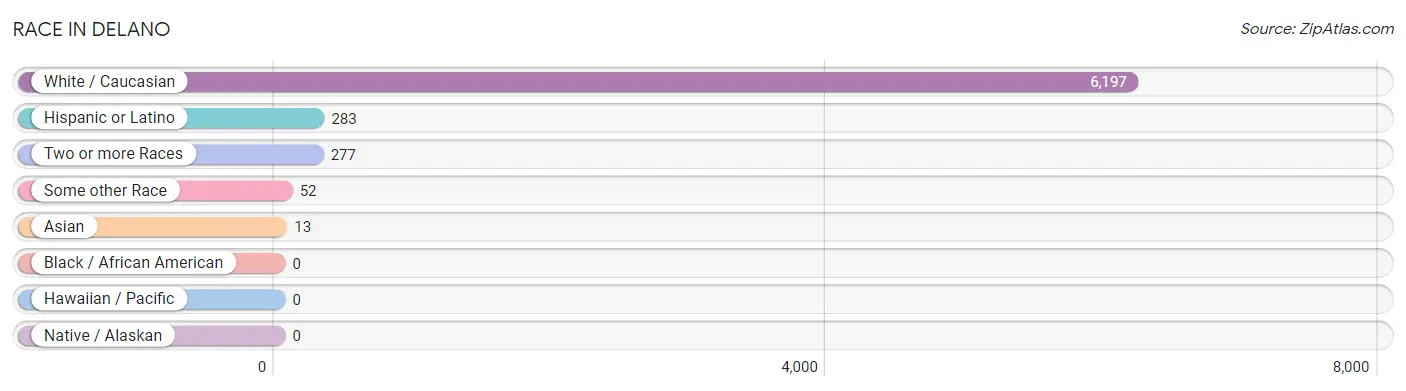
| Race | # Population | % Population |
| Asian | 13 | 0.2% |
| Black / African American | 0 | 0.0% |
| Hawaiian / Pacific | 0 | 0.0% |
| Hispanic or Latino | 283 | 4.3% |
| Native / Alaskan | 0 | 0.0% |
| White / Caucasian | 6,197 | 94.8% |
| Two or more Races | 277 | 4.2% |
| Some other Race | 52 | 0.8% |
| Total | 6,539 | 100.0% |
Ancestry in Delano
The most populous ancestries reported in Delano are German (2,553 | 39.0%), Swedish (899 | 13.8%), Irish (765 | 11.7%), Norwegian (716 | 11.0%), and American (460 | 7.0%), together accounting for 82.5% of all Delano residents.
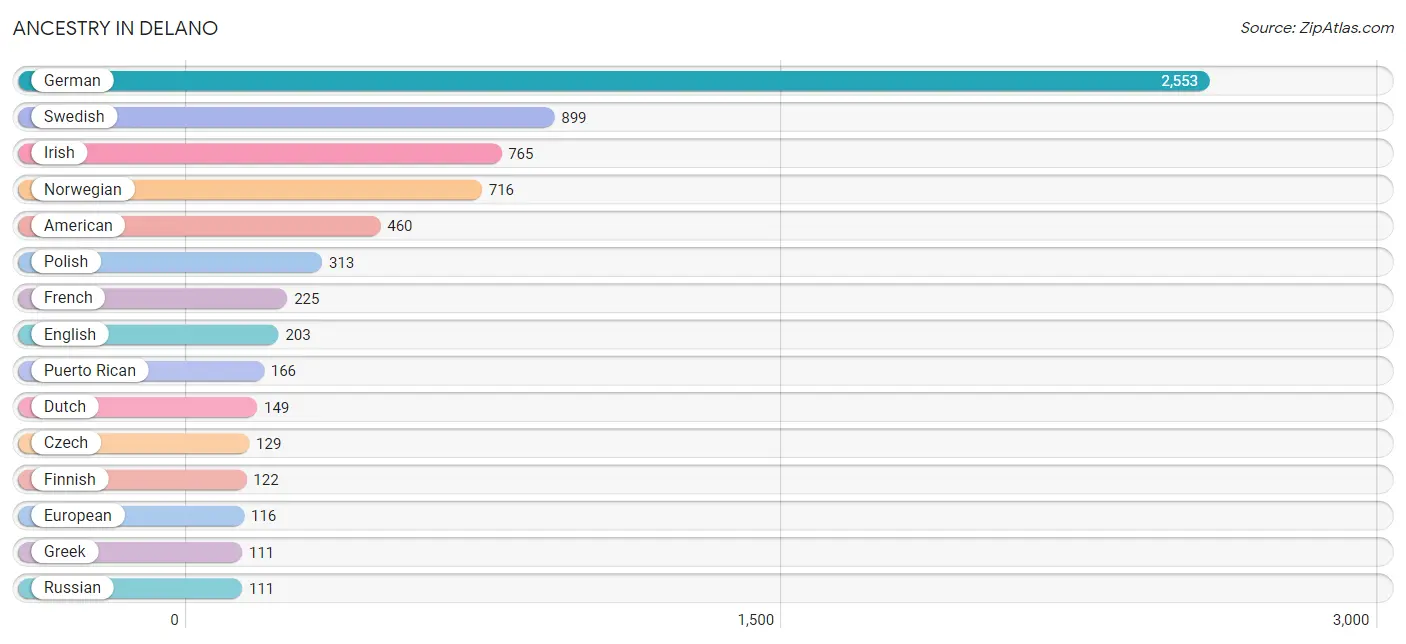
| Ancestry | # Population | % Population |
| African | 50 | 0.8% |
| American | 460 | 7.0% |
| Austrian | 34 | 0.5% |
| Canadian | 38 | 0.6% |
| Central American | 52 | 0.8% |
| Chippewa | 17 | 0.3% |
| Croatian | 9 | 0.1% |
| Czech | 129 | 2.0% |
| Czechoslovakian | 20 | 0.3% |
| Danish | 54 | 0.8% |
| Dutch | 149 | 2.3% |
| English | 203 | 3.1% |
| European | 116 | 1.8% |
| Finnish | 122 | 1.9% |
| French | 225 | 3.4% |
| French Canadian | 99 | 1.5% |
| German | 2,553 | 39.0% |
| Greek | 111 | 1.7% |
| Guatemalan | 52 | 0.8% |
| Icelander | 35 | 0.5% |
| Irish | 765 | 11.7% |
| Italian | 34 | 0.5% |
| Mexican | 65 | 1.0% |
| Norwegian | 716 | 11.0% |
| Polish | 313 | 4.8% |
| Puerto Rican | 166 | 2.5% |
| Russian | 111 | 1.7% |
| Scandinavian | 109 | 1.7% |
| Scotch-Irish | 11 | 0.2% |
| Scottish | 43 | 0.7% |
| Sri Lankan | 21 | 0.3% |
| Subsaharan African | 50 | 0.8% |
| Swedish | 899 | 13.8% |
| Swiss | 35 | 0.5% |
| Thai | 61 | 0.9% | View All 35 Rows |
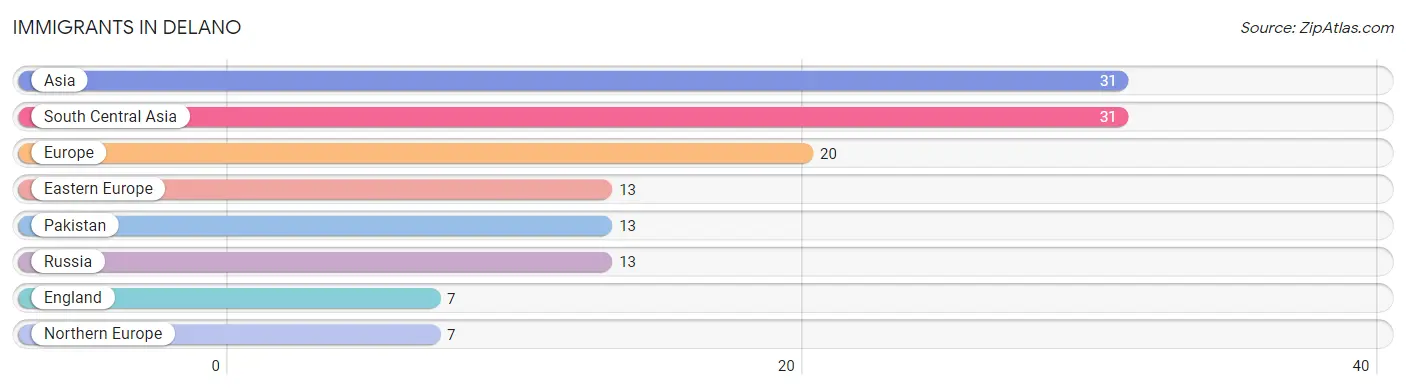
Immigrants in Delano
The most numerous immigrant groups reported in Delano came from Asia (31 | 0.5%), South Central Asia (31 | 0.5%), Europe (20 | 0.3%), Eastern Europe (13 | 0.2%), and Pakistan (13 | 0.2%), together accounting for 1.7% of all Delano residents.
| Immigration Origin | # Population | % Population |
| Asia | 31 | 0.5% |
| Eastern Europe | 13 | 0.2% |
| England | 7 | 0.1% |
| Europe | 20 | 0.3% |
| Northern Europe | 7 | 0.1% |
| Pakistan | 13 | 0.2% |
| Russia | 13 | 0.2% |
| South Central Asia | 31 | 0.5% | View All 8 Rows |
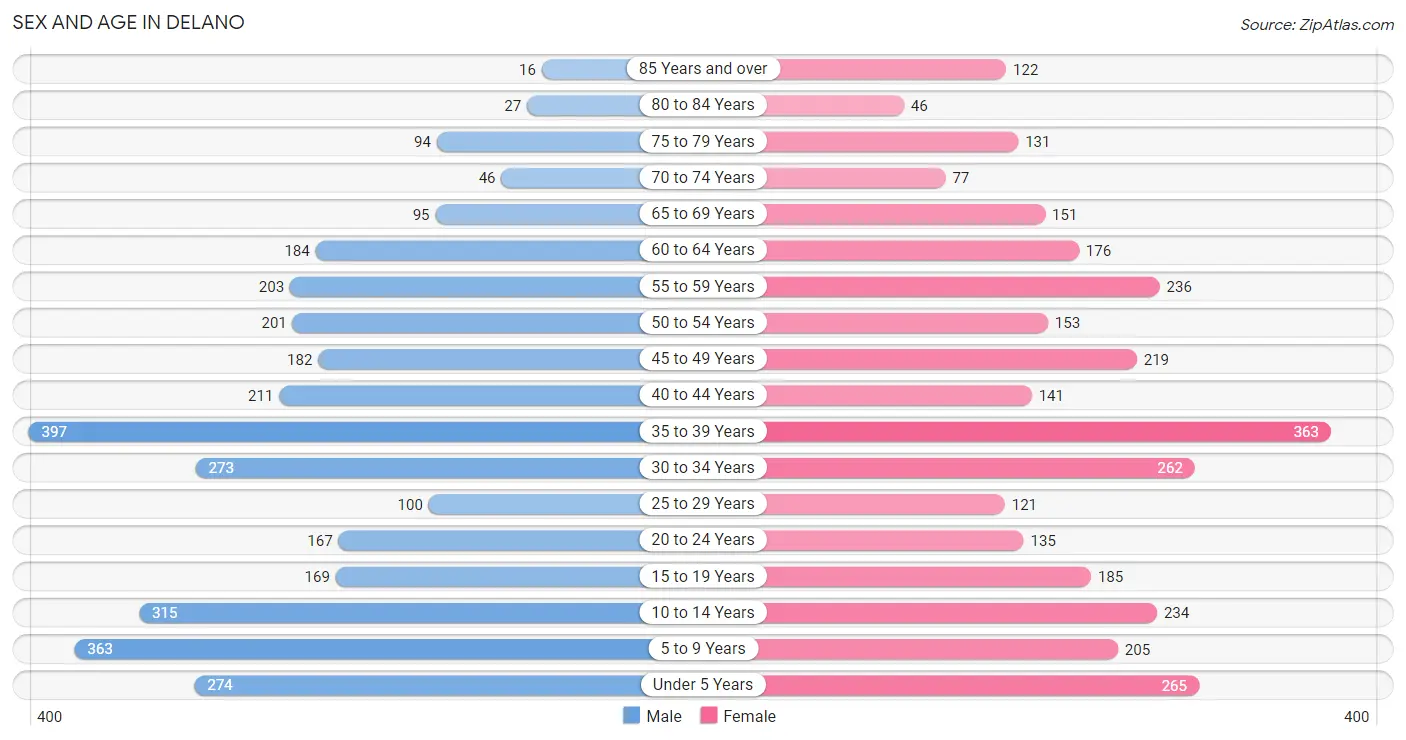
Sex and Age in Delano
Sex and Age in Delano
The most populous age groups in Delano are 35 to 39 Years (397 | 12.0%) for men and 35 to 39 Years (363 | 11.3%) for women.
| Age Bracket | Male | Female |
| Under 5 Years | 274 (8.3%) | 265 (8.2%) |
| 5 to 9 Years | 363 (10.9%) | 205 (6.4%) |
| 10 to 14 Years | 315 (9.5%) | 234 (7.3%) |
| 15 to 19 Years | 169 (5.1%) | 185 (5.7%) |
| 20 to 24 Years | 167 (5.0%) | 135 (4.2%) |
| 25 to 29 Years | 100 (3.0%) | 121 (3.8%) |
| 30 to 34 Years | 273 (8.2%) | 262 (8.1%) |
| 35 to 39 Years | 397 (12.0%) | 363 (11.3%) |
| 40 to 44 Years | 211 (6.4%) | 141 (4.4%) |
| 45 to 49 Years | 182 (5.5%) | 219 (6.8%) |
| 50 to 54 Years | 201 (6.1%) | 153 (4.8%) |
| 55 to 59 Years | 203 (6.1%) | 236 (7.3%) |
| 60 to 64 Years | 184 (5.6%) | 176 (5.5%) |
| 65 to 69 Years | 95 (2.9%) | 151 (4.7%) |
| 70 to 74 Years | 46 (1.4%) | 77 (2.4%) |
| 75 to 79 Years | 94 (2.8%) | 131 (4.1%) |
| 80 to 84 Years | 27 (0.8%) | 46 (1.4%) |
| 85 Years and over | 16 (0.5%) | 122 (3.8%) |
| Total | 3,317 (100.0%) | 3,222 (100.0%) |
Families and Households in Delano
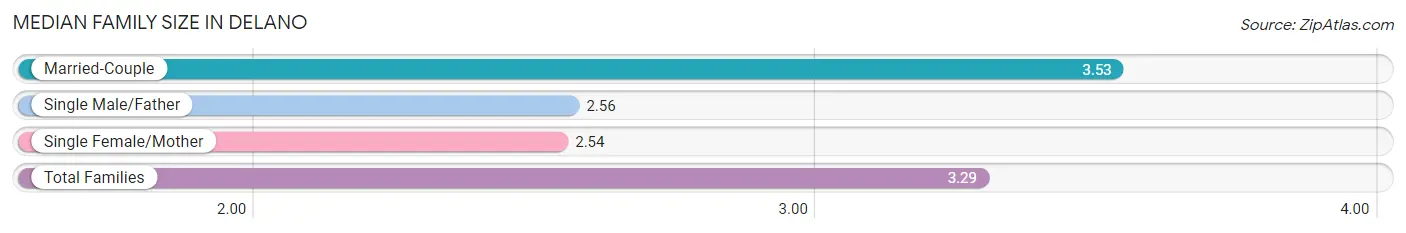
Median Family Size in Delano
The median family size in Delano is 3.29 persons per family, with married-couple families (1,293 | 75.1%) accounting for the largest median family size of 3.53 persons per family. On the other hand, single female/mother families (291 | 16.9%) represent the smallest median family size with 2.54 persons per family.
| Family Type | # Families | Family Size |
| Married-Couple | 1,293 (75.1%) | 3.53 |
| Single Male/Father | 138 (8.0%) | 2.56 |
| Single Female/Mother | 291 (16.9%) | 2.54 |
| Total Families | 1,722 (100.0%) | 3.29 |
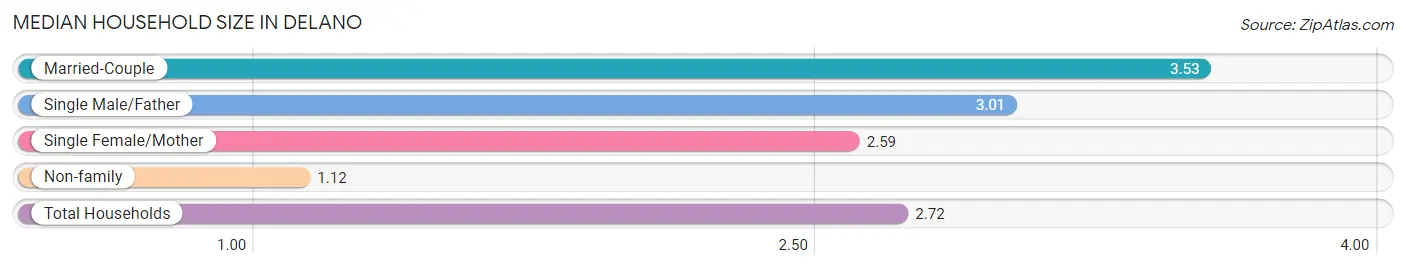
Median Household Size in Delano
The median household size in Delano is 2.72 persons per household, with married-couple households (1,293 | 54.3%) accounting for the largest median household size of 3.53 persons per household. non-family households (661 | 27.7%) represent the smallest median household size with 1.12 persons per household.
| Household Type | # Households | Household Size |
| Married-Couple | 1,293 (54.3%) | 3.53 |
| Single Male/Father | 138 (5.8%) | 3.01 |
| Single Female/Mother | 291 (12.2%) | 2.59 |
| Non-family | 661 (27.7%) | 1.12 |
| Total Households | 2,383 (100.0%) | 2.72 |
Household Size by Marriage Status in Delano
Out of a total of 2,383 households in Delano, 1,722 (72.3%) are family households, while 661 (27.7%) are nonfamily households. The most numerous type of family households are 2-person households, comprising 708, and the most common type of nonfamily households are 1-person households, comprising 582.
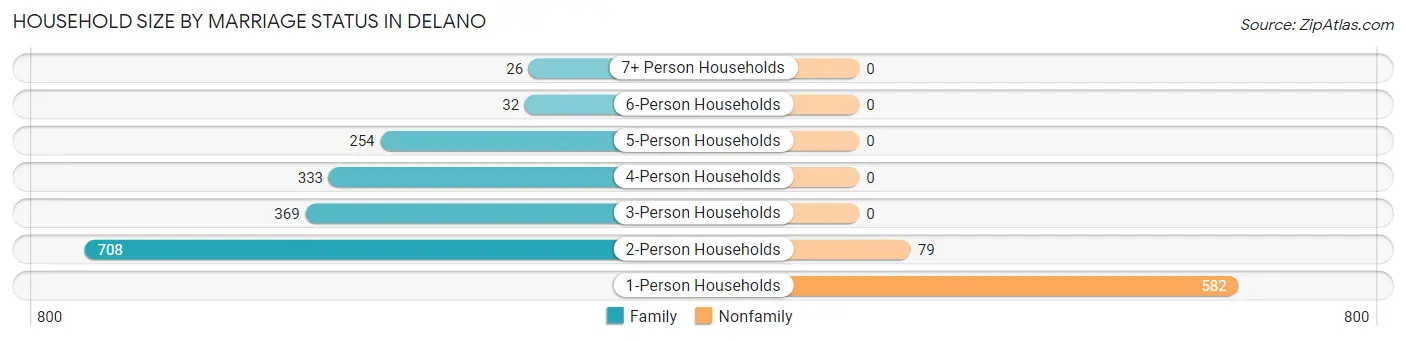
| Household Size | Family Households | Nonfamily Households |
| 1-Person Households | - | 582 (24.4%) |
| 2-Person Households | 708 (29.7%) | 79 (3.3%) |
| 3-Person Households | 369 (15.5%) | 0 (0.0%) |
| 4-Person Households | 333 (14.0%) | 0 (0.0%) |
| 5-Person Households | 254 (10.7%) | 0 (0.0%) |
| 6-Person Households | 32 (1.3%) | 0 (0.0%) |
| 7+ Person Households | 26 (1.1%) | 0 (0.0%) |
| Total | 1,722 (72.3%) | 661 (27.7%) |
Female Fertility in Delano
Fertility by Age in Delano
Average fertility rate in Delano is 72.0 births per 1,000 women. Women in the age bracket of 20 to 34 years have the highest fertility rate with 91.0 births per 1,000 women. Women in the age bracket of 35 to 50 years acount for 56.5% of all women with births.
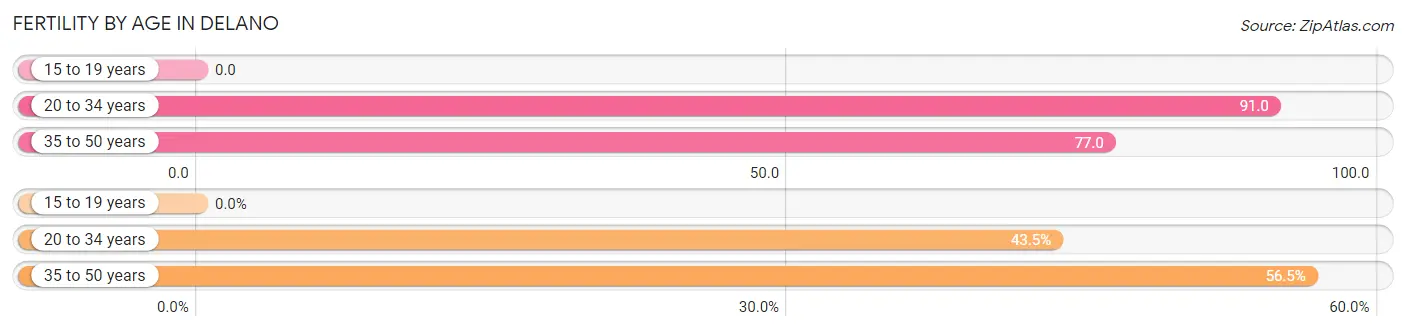
| Age Bracket | Women with Births | Births / 1,000 Women |
| 15 to 19 years | 0 (0.0%) | 0.0 |
| 20 to 34 years | 47 (43.5%) | 91.0 |
| 35 to 50 years | 61 (56.5%) | 77.0 |
| Total | 108 (100.0%) | 72.0 |
Fertility by Age by Marriage Status in Delano
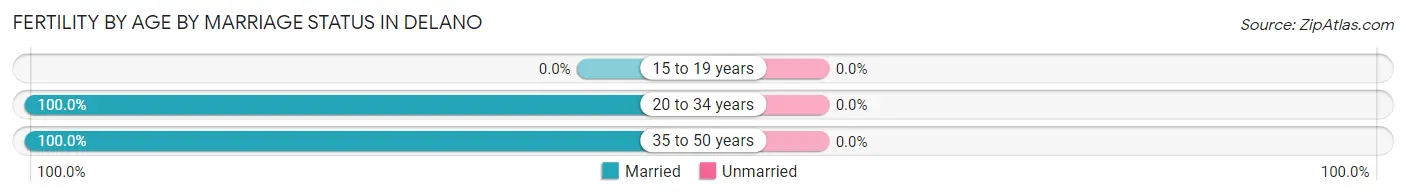
| Age Bracket | Married | Unmarried |
| 15 to 19 years | 0 (0.0%) | 0 (0.0%) |
| 20 to 34 years | 47 (100.0%) | 0 (0.0%) |
| 35 to 50 years | 61 (100.0%) | 0 (0.0%) |
| Total | 108 (100.0%) | 0 (0.0%) |
Fertility by Education in Delano
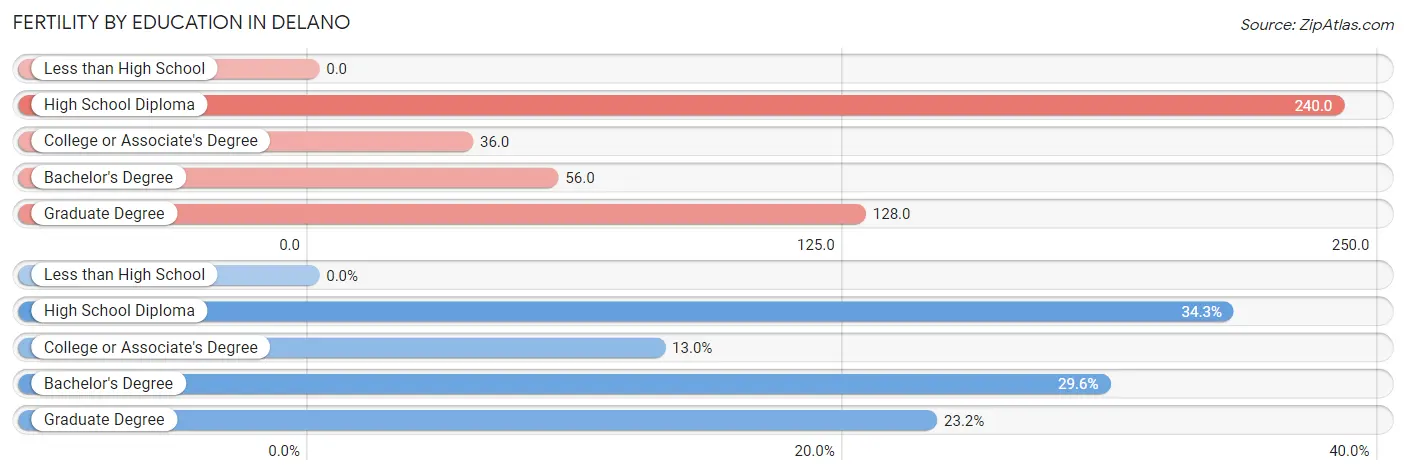
| Educational Attainment | Women with Births | Births / 1,000 Women |
| Less than High School | 0 (0.0%) | 0.0 |
| High School Diploma | 37 (34.3%) | 240.0 |
| College or Associate's Degree | 14 (13.0%) | 36.0 |
| Bachelor's Degree | 32 (29.6%) | 56.0 |
| Graduate Degree | 25 (23.2%) | 128.0 |
| Total | 108 (100.0%) | 72.0 |
Fertility by Education by Marriage Status in Delano
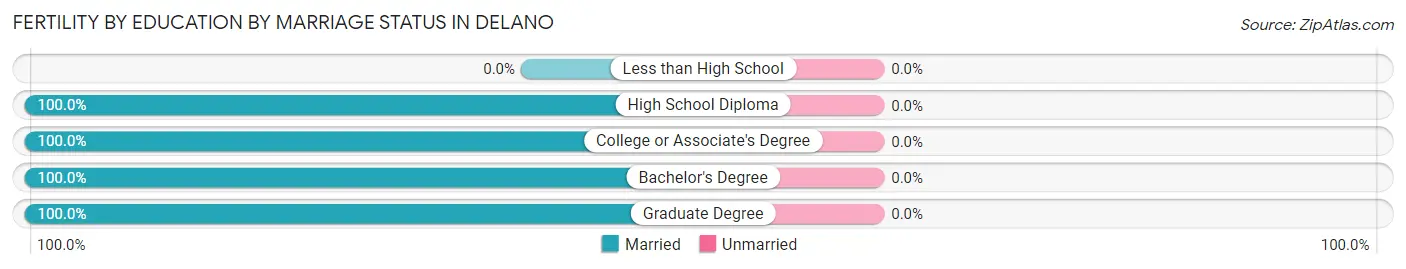
| Educational Attainment | Married | Unmarried |
| Less than High School | 0 (0.0%) | 0 (0.0%) |
| High School Diploma | 37 (100.0%) | 0 (0.0%) |
| College or Associate's Degree | 14 (100.0%) | 0 (0.0%) |
| Bachelor's Degree | 32 (100.0%) | 0 (0.0%) |
| Graduate Degree | 25 (100.0%) | 0 (0.0%) |
| Total | 108 (100.0%) | 0 (0.0%) |
Employment Characteristics in Delano
Employment by Class of Employer in Delano
Among the 3,588 employed individuals in Delano, private company employees (2,567 | 71.5%), local government employees (366 | 10.2%), and self-employed (not incorporated) (179 | 5.0%) make up the most common classes of employment.
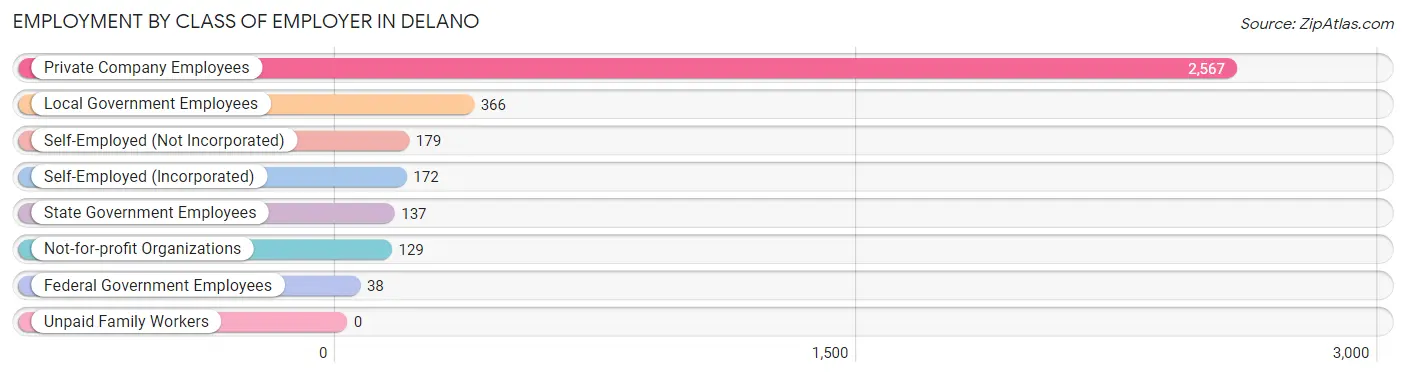
| Employer Class | # Employees | % Employees |
| Private Company Employees | 2,567 | 71.5% |
| Self-Employed (Incorporated) | 172 | 4.8% |
| Self-Employed (Not Incorporated) | 179 | 5.0% |
| Not-for-profit Organizations | 129 | 3.6% |
| Local Government Employees | 366 | 10.2% |
| State Government Employees | 137 | 3.8% |
| Federal Government Employees | 38 | 1.1% |
| Unpaid Family Workers | 0 | 0.0% |
| Total | 3,588 | 100.0% |
Employment Status by Age in Delano
According to the labor force statistics for Delano, out of the total population over 16 years of age (4,803), 75.6% or 3,631 individuals are in the labor force, with 0.8% or 29 of them unemployed. The age group with the highest labor force participation rate is 25 to 29 years, with 100.0% or 221 individuals in the labor force. Within the labor force, the 16 to 19 years age range has the highest percentage of unemployed individuals, with 10.5% or 16 of them being unemployed.
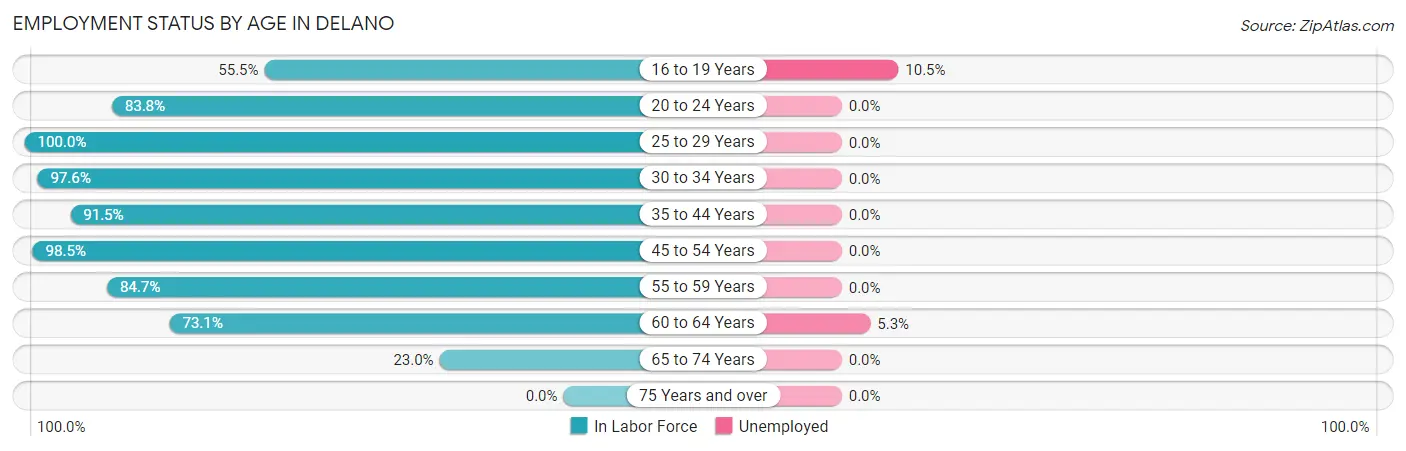
| Age Bracket | In Labor Force | Unemployed |
| 16 to 19 Years | 152 (55.5%) | 16 (10.5%) |
| 20 to 24 Years | 253 (83.8%) | 0 (0.0%) |
| 25 to 29 Years | 221 (100.0%) | 0 (0.0%) |
| 30 to 34 Years | 522 (97.6%) | 0 (0.0%) |
| 35 to 44 Years | 1,017 (91.5%) | 0 (0.0%) |
| 45 to 54 Years | 744 (98.5%) | 0 (0.0%) |
| 55 to 59 Years | 372 (84.7%) | 0 (0.0%) |
| 60 to 64 Years | 263 (73.1%) | 14 (5.3%) |
| 65 to 74 Years | 85 (23.0%) | 0 (0.0%) |
| 75 Years and over | 0 (0.0%) | 0 (0.0%) |
| Total | 3,631 (75.6%) | 29 (0.8%) |
Employment Status by Educational Attainment in Delano
According to labor force statistics for Delano, 91.8% of individuals (3,141) out of the total population between 25 and 64 years of age (3,422) are in the labor force, with 0.4% or 13 of them being unemployed. The group with the highest labor force participation rate are those with the educational attainment of bachelor's degree or higher, with 97.3% or 1,577 individuals in the labor force. Within the labor force, individuals with college / associate degree education have the highest percentage of unemployment, with 1.6% or 14 of them being unemployed.
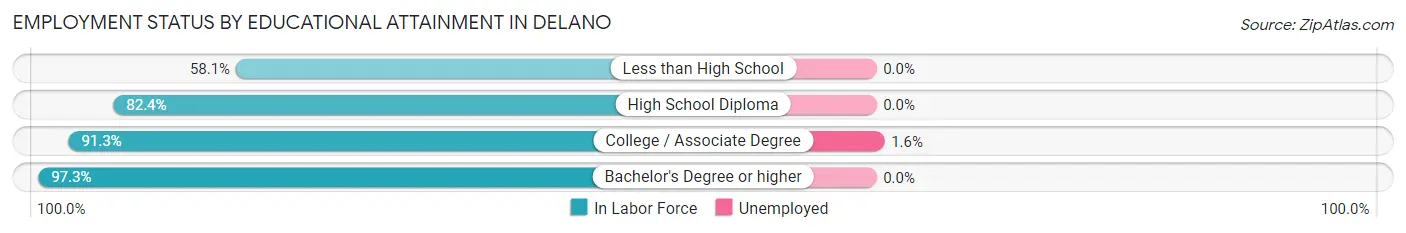
| Educational Attainment | In Labor Force | Unemployed |
| Less than High School | 18 (58.1%) | 0 (0.0%) |
| High School Diploma | 654 (82.4%) | 0 (0.0%) |
| College / Associate Degree | 891 (91.3%) | 16 (1.6%) |
| Bachelor's Degree or higher | 1,577 (97.3%) | 0 (0.0%) |
| Total | 3,141 (91.8%) | 14 (0.4%) |
Employment Occupations by Sex in Delano
Management, Business, Science and Arts Occupations
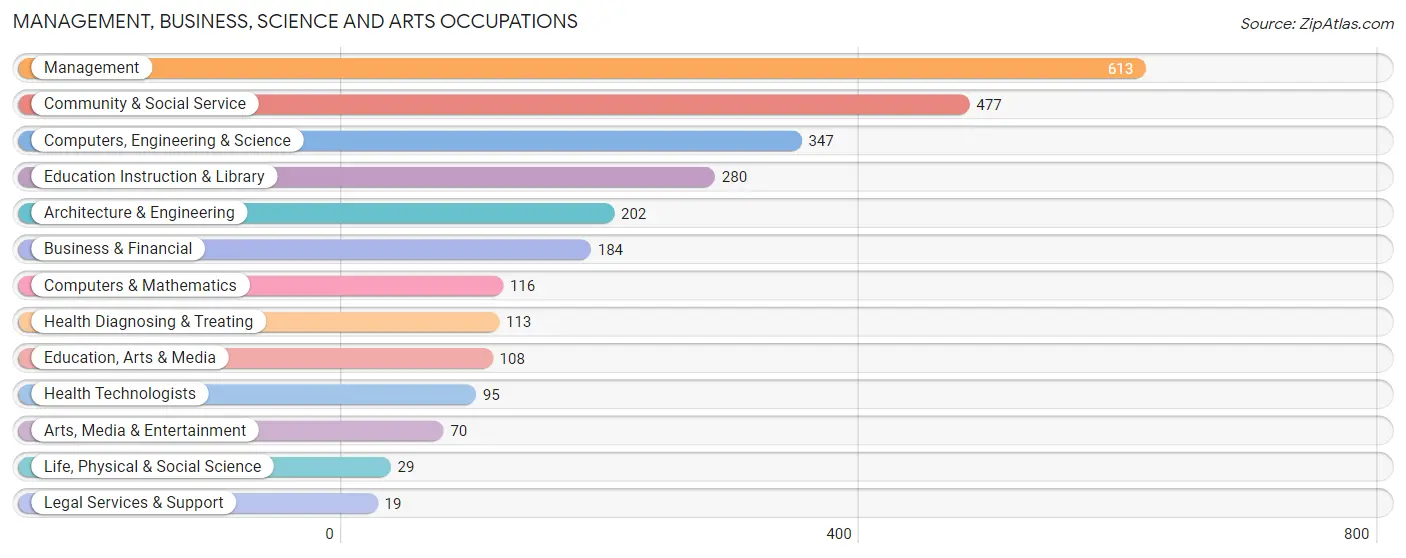
The most common Management, Business, Science and Arts occupations in Delano are Management (613 | 17.0%), Community & Social Service (477 | 13.3%), Computers, Engineering & Science (347 | 9.6%), Education Instruction & Library (280 | 7.8%), and Architecture & Engineering (202 | 5.6%).
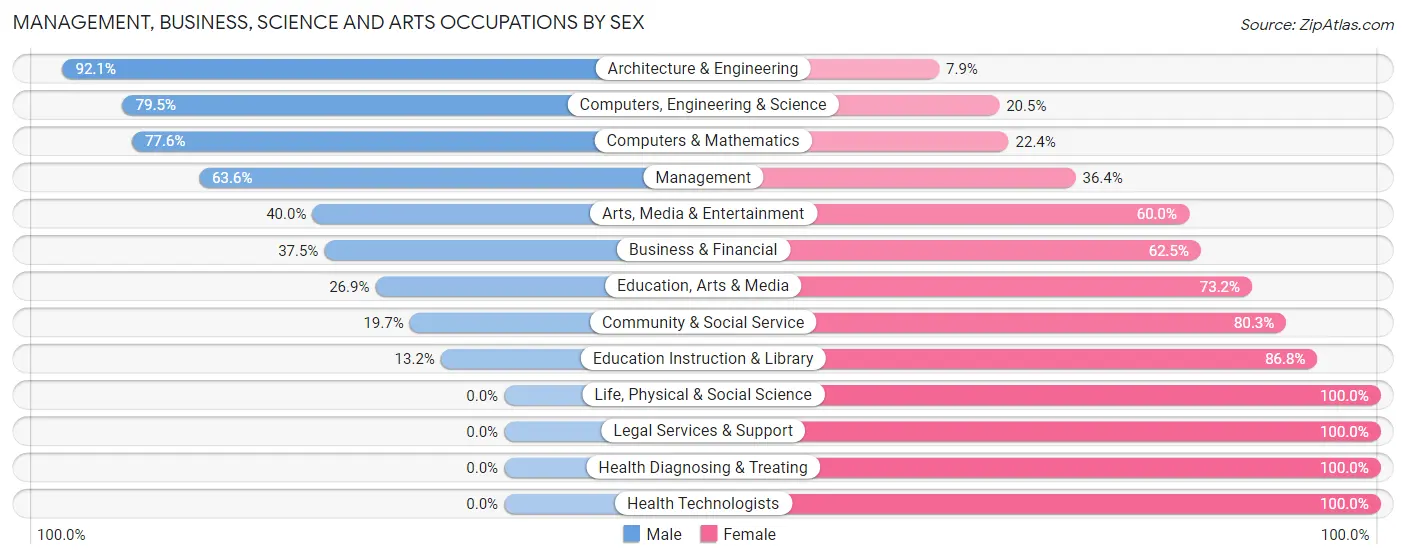
Management, Business, Science and Arts Occupations by Sex
Within the Management, Business, Science and Arts occupations in Delano, the most male-oriented occupations are Architecture & Engineering (92.1%), Computers, Engineering & Science (79.5%), and Computers & Mathematics (77.6%), while the most female-oriented occupations are Life, Physical & Social Science (100.0%), Legal Services & Support (100.0%), and Health Diagnosing & Treating (100.0%).
| Occupation | Male | Female |
| Management | 390 (63.6%) | 223 (36.4%) |
| Business & Financial | 69 (37.5%) | 115 (62.5%) |
| Computers, Engineering & Science | 276 (79.5%) | 71 (20.5%) |
| Computers & Mathematics | 90 (77.6%) | 26 (22.4%) |
| Architecture & Engineering | 186 (92.1%) | 16 (7.9%) |
| Life, Physical & Social Science | 0 (0.0%) | 29 (100.0%) |
| Community & Social Service | 94 (19.7%) | 383 (80.3%) |
| Education, Arts & Media | 29 (26.9%) | 79 (73.2%) |
| Legal Services & Support | 0 (0.0%) | 19 (100.0%) |
| Education Instruction & Library | 37 (13.2%) | 243 (86.8%) |
| Arts, Media & Entertainment | 28 (40.0%) | 42 (60.0%) |
| Health Diagnosing & Treating | 0 (0.0%) | 113 (100.0%) |
| Health Technologists | 0 (0.0%) | 95 (100.0%) |
| Total (Category) | 829 (47.8%) | 905 (52.2%) |
| Total (Overall) | 1,836 (51.0%) | 1,764 (49.0%) |
Services Occupations
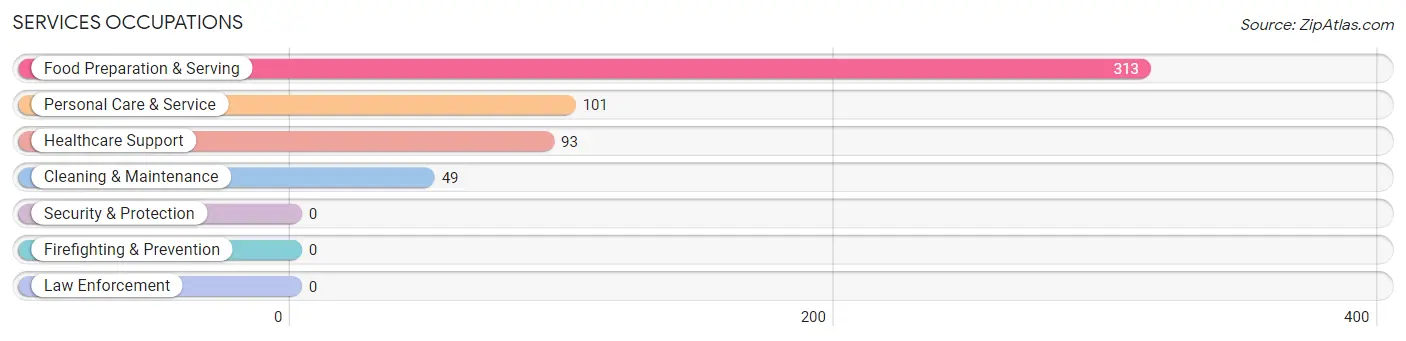
The most common Services occupations in Delano are Food Preparation & Serving (313 | 8.7%), Personal Care & Service (101 | 2.8%), Healthcare Support (93 | 2.6%), and Cleaning & Maintenance (49 | 1.4%).
Services Occupations by Sex
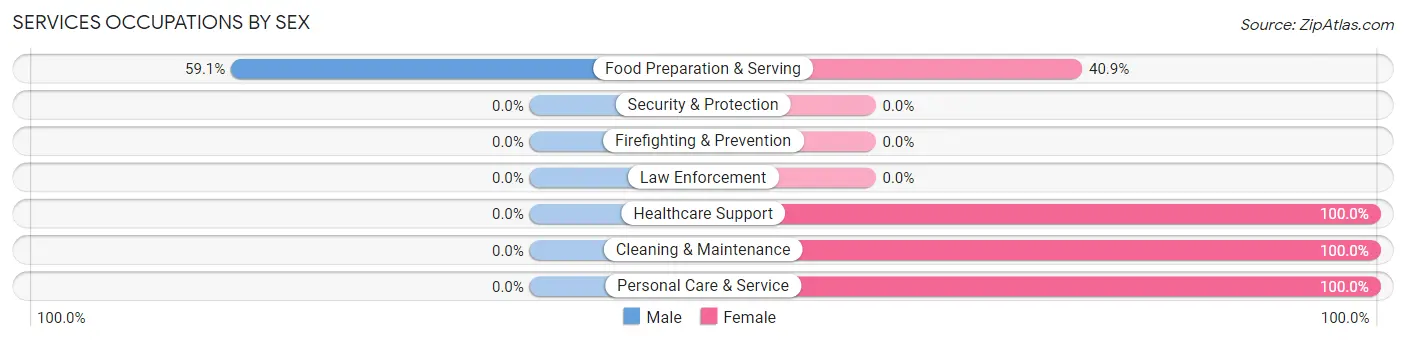
| Occupation | Male | Female |
| Healthcare Support | 0 (0.0%) | 93 (100.0%) |
| Security & Protection | 0 (0.0%) | 0 (0.0%) |
| Firefighting & Prevention | 0 (0.0%) | 0 (0.0%) |
| Law Enforcement | 0 (0.0%) | 0 (0.0%) |
| Food Preparation & Serving | 185 (59.1%) | 128 (40.9%) |
| Cleaning & Maintenance | 0 (0.0%) | 49 (100.0%) |
| Personal Care & Service | 0 (0.0%) | 101 (100.0%) |
| Total (Category) | 185 (33.3%) | 371 (66.7%) |
| Total (Overall) | 1,836 (51.0%) | 1,764 (49.0%) |
Sales and Office Occupations
The most common Sales and Office occupations in Delano are Office & Administration (405 | 11.3%), and Sales & Related (267 | 7.4%).

Sales and Office Occupations by Sex

| Occupation | Male | Female |
| Sales & Related | 134 (50.2%) | 133 (49.8%) |
| Office & Administration | 83 (20.5%) | 322 (79.5%) |
| Total (Category) | 217 (32.3%) | 455 (67.7%) |
| Total (Overall) | 1,836 (51.0%) | 1,764 (49.0%) |
Natural Resources, Construction and Maintenance Occupations
The most common Natural Resources, Construction and Maintenance occupations in Delano are Construction & Extraction (211 | 5.9%), Installation, Maintenance & Repair (78 | 2.2%), and Farming, Fishing & Forestry (13 | 0.4%).
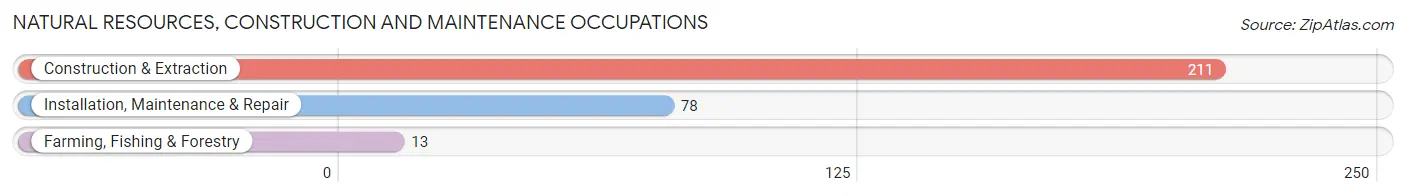
Natural Resources, Construction and Maintenance Occupations by Sex

| Occupation | Male | Female |
| Farming, Fishing & Forestry | 13 (100.0%) | 0 (0.0%) |
| Construction & Extraction | 211 (100.0%) | 0 (0.0%) |
| Installation, Maintenance & Repair | 64 (82.1%) | 14 (17.9%) |
| Total (Category) | 288 (95.4%) | 14 (4.6%) |
| Total (Overall) | 1,836 (51.0%) | 1,764 (49.0%) |
Production, Transportation and Moving Occupations
The most common Production, Transportation and Moving occupations in Delano are Production (238 | 6.6%), Material Moving (68 | 1.9%), and Transportation (30 | 0.8%).
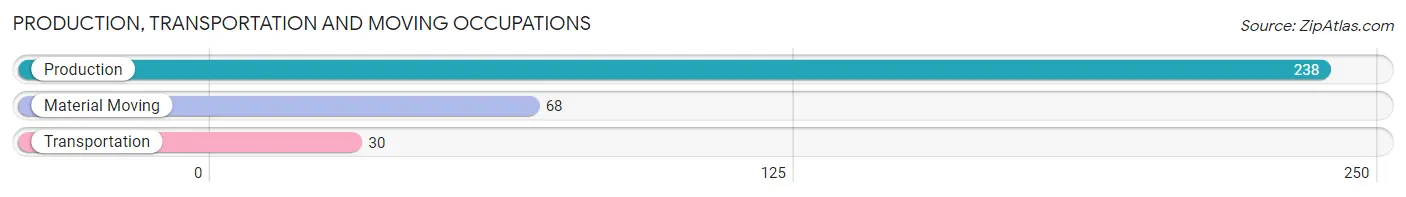
Production, Transportation and Moving Occupations by Sex
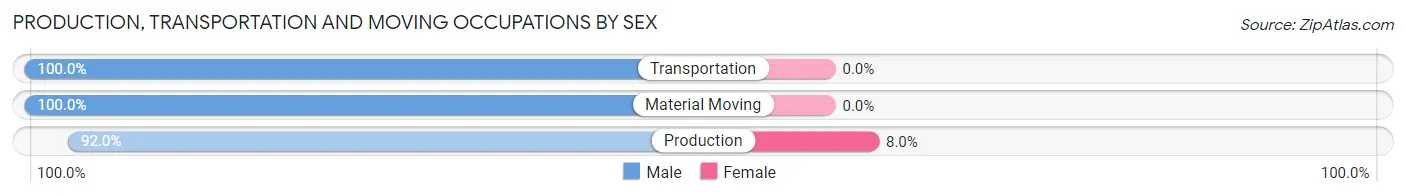
| Occupation | Male | Female |
| Production | 219 (92.0%) | 19 (8.0%) |
| Transportation | 30 (100.0%) | 0 (0.0%) |
| Material Moving | 68 (100.0%) | 0 (0.0%) |
| Total (Category) | 317 (94.4%) | 19 (5.7%) |
| Total (Overall) | 1,836 (51.0%) | 1,764 (49.0%) |
Employment Industries by Sex in Delano
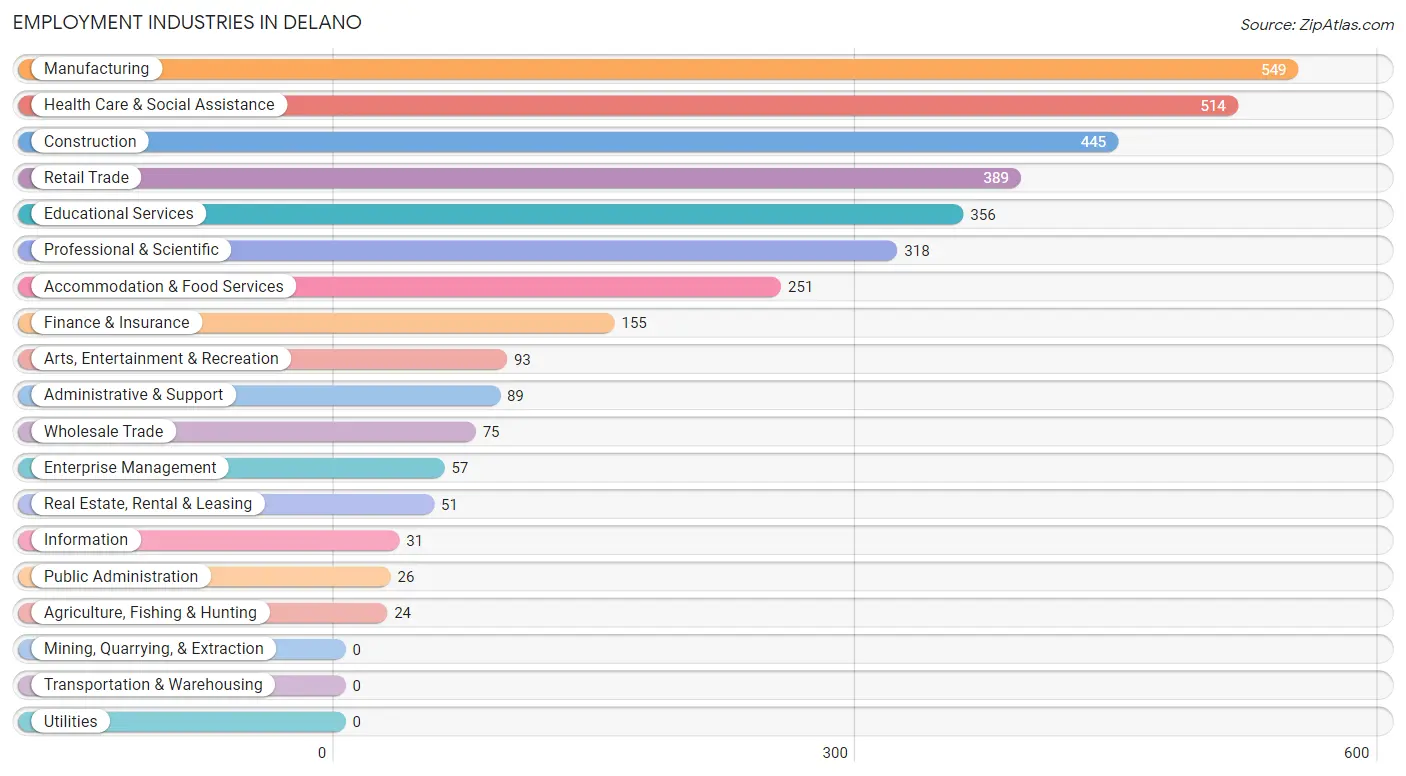
Employment Industries in Delano
The major employment industries in Delano include Manufacturing (549 | 15.2%), Health Care & Social Assistance (514 | 14.3%), Construction (445 | 12.4%), Retail Trade (389 | 10.8%), and Educational Services (356 | 9.9%).
Employment Industries by Sex in Delano
The Delano industries that see more men than women are Enterprise Management (100.0%), Administrative & Support (87.6%), and Accommodation & Food Services (85.7%), whereas the industries that tend to have a higher number of women are Information (100.0%), Public Administration (100.0%), and Health Care & Social Assistance (90.5%).
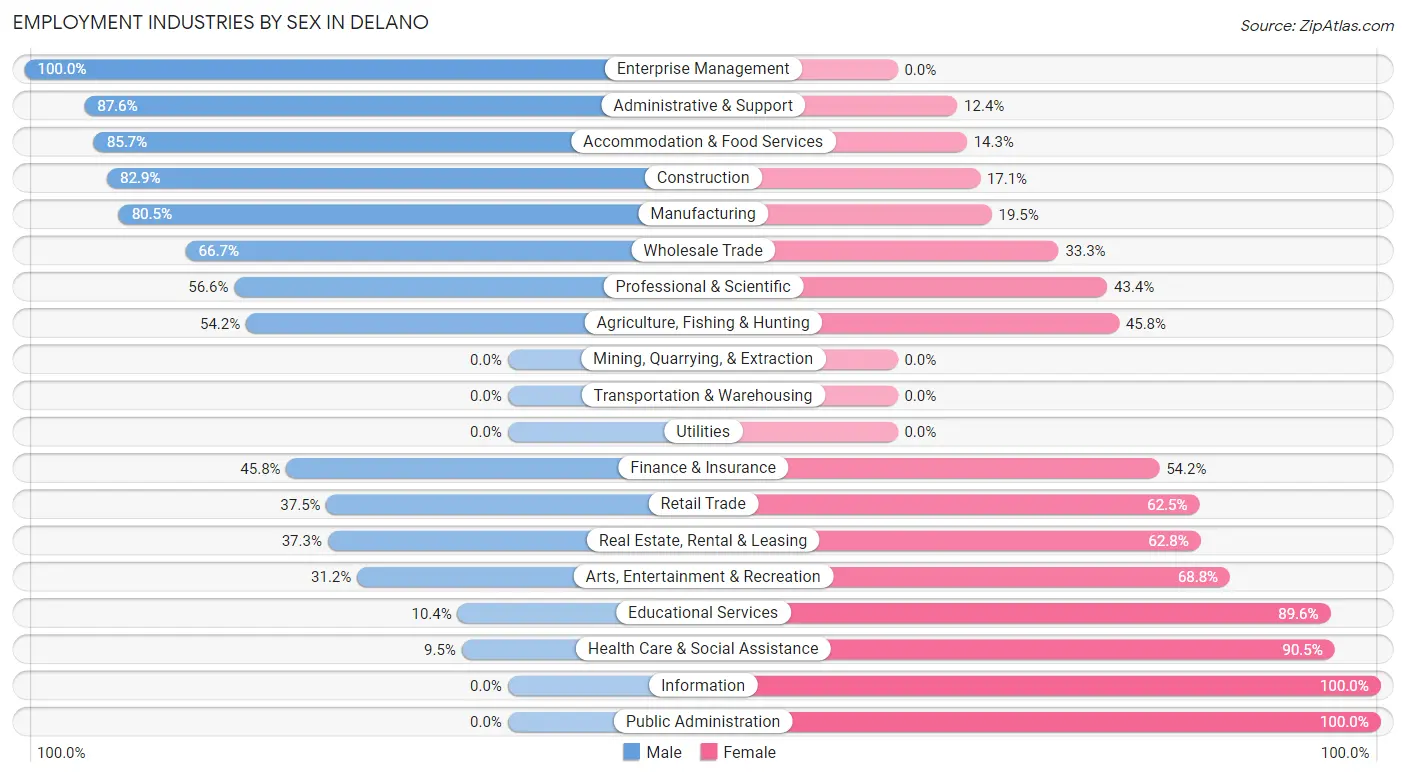
| Industry | Male | Female |
| Agriculture, Fishing & Hunting | 13 (54.2%) | 11 (45.8%) |
| Mining, Quarrying, & Extraction | 0 (0.0%) | 0 (0.0%) |
| Construction | 369 (82.9%) | 76 (17.1%) |
| Manufacturing | 442 (80.5%) | 107 (19.5%) |
| Wholesale Trade | 50 (66.7%) | 25 (33.3%) |
| Retail Trade | 146 (37.5%) | 243 (62.5%) |
| Transportation & Warehousing | 0 (0.0%) | 0 (0.0%) |
| Utilities | 0 (0.0%) | 0 (0.0%) |
| Information | 0 (0.0%) | 31 (100.0%) |
| Finance & Insurance | 71 (45.8%) | 84 (54.2%) |
| Real Estate, Rental & Leasing | 19 (37.2%) | 32 (62.7%) |
| Professional & Scientific | 180 (56.6%) | 138 (43.4%) |
| Enterprise Management | 57 (100.0%) | 0 (0.0%) |
| Administrative & Support | 78 (87.6%) | 11 (12.4%) |
| Educational Services | 37 (10.4%) | 319 (89.6%) |
| Health Care & Social Assistance | 49 (9.5%) | 465 (90.5%) |
| Arts, Entertainment & Recreation | 29 (31.2%) | 64 (68.8%) |
| Accommodation & Food Services | 215 (85.7%) | 36 (14.3%) |
| Public Administration | 0 (0.0%) | 26 (100.0%) |
| Total | 1,836 (51.0%) | 1,764 (49.0%) |
Education in Delano
School Enrollment in Delano
The most common levels of schooling among the 1,496 students in Delano are elementary school (410 | 27.4%), middle school (393 | 26.3%), and high school (320 | 21.4%).
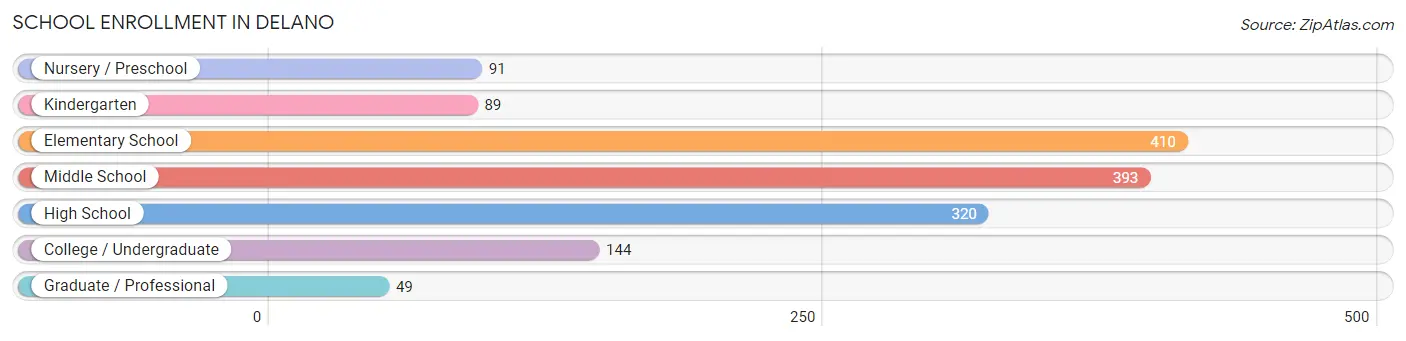
| School Level | # Students | % Students |
| Nursery / Preschool | 91 | 6.1% |
| Kindergarten | 89 | 5.9% |
| Elementary School | 410 | 27.4% |
| Middle School | 393 | 26.3% |
| High School | 320 | 21.4% |
| College / Undergraduate | 144 | 9.6% |
| Graduate / Professional | 49 | 3.3% |
| Total | 1,496 | 100.0% |
School Enrollment by Age by Funding Source in Delano
Out of a total of 1,496 students who are enrolled in schools in Delano, 262 (17.5%) attend a private institution, while the remaining 1,234 (82.5%) are enrolled in public schools. The age group of 3 to 4 year olds has the highest likelihood of being enrolled in private schools, with 69 (86.3% in the age bracket) enrolled. Conversely, the age group of 18 to 19 year olds has the lowest likelihood of being enrolled in a private school, with 29 (100.0% in the age bracket) attending a public institution.
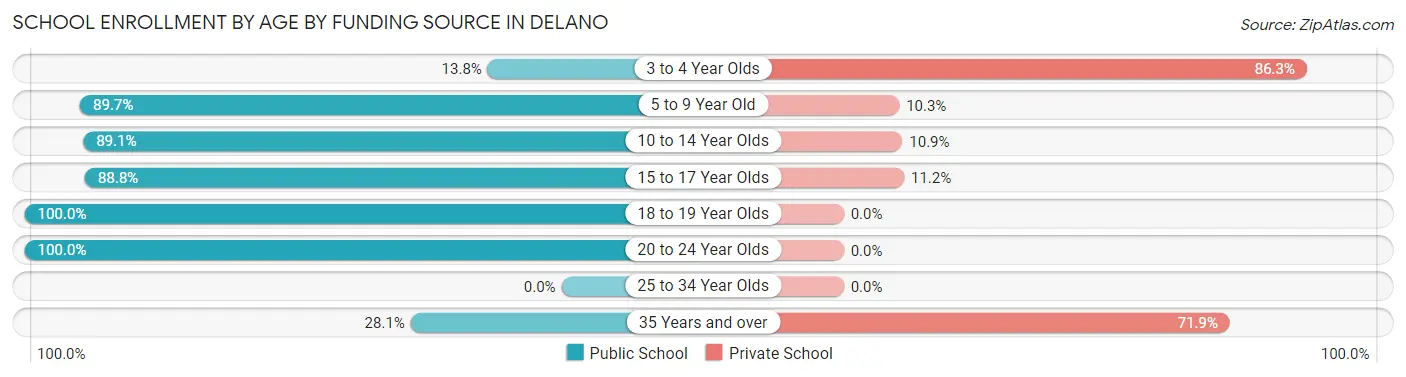
| Age Bracket | Public School | Private School |
| 3 to 4 Year Olds | 11 (13.8%) | 69 (86.3%) |
| 5 to 9 Year Old | 347 (89.7%) | 40 (10.3%) |
| 10 to 14 Year Olds | 489 (89.1%) | 60 (10.9%) |
| 15 to 17 Year Olds | 229 (88.8%) | 29 (11.2%) |
| 18 to 19 Year Olds | 29 (100.0%) | 0 (0.0%) |
| 20 to 24 Year Olds | 104 (100.0%) | 0 (0.0%) |
| 25 to 34 Year Olds | 0 (0.0%) | 0 (0.0%) |
| 35 Years and over | 25 (28.1%) | 64 (71.9%) |
| Total | 1,234 (82.5%) | 262 (17.5%) |
Educational Attainment by Field of Study in Delano
Business (567 | 29.1%), education (277 | 14.2%), engineering (216 | 11.1%), arts & humanities (165 | 8.5%), and bio, nature & agricultural (132 | 6.8%) are the most common fields of study among 1,947 individuals in Delano who have obtained a bachelor's degree or higher.
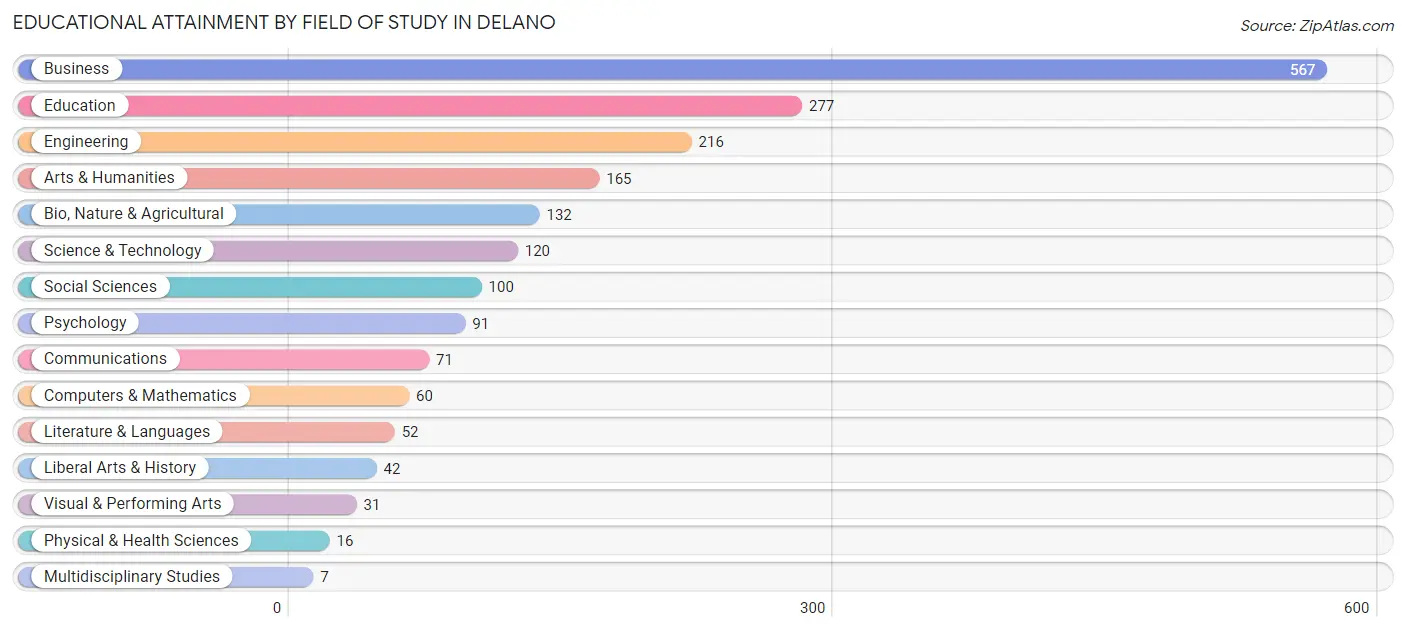
| Field of Study | # Graduates | % Graduates |
| Computers & Mathematics | 60 | 3.1% |
| Bio, Nature & Agricultural | 132 | 6.8% |
| Physical & Health Sciences | 16 | 0.8% |
| Psychology | 91 | 4.7% |
| Social Sciences | 100 | 5.1% |
| Engineering | 216 | 11.1% |
| Multidisciplinary Studies | 7 | 0.4% |
| Science & Technology | 120 | 6.2% |
| Business | 567 | 29.1% |
| Education | 277 | 14.2% |
| Literature & Languages | 52 | 2.7% |
| Liberal Arts & History | 42 | 2.2% |
| Visual & Performing Arts | 31 | 1.6% |
| Communications | 71 | 3.6% |
| Arts & Humanities | 165 | 8.5% |
| Total | 1,947 | 100.0% |
Transportation & Commute in Delano
Vehicle Availability by Sex in Delano
The most prevalent vehicle ownership categories in Delano are males with 2 vehicles (1,097, accounting for 59.8%) and females with 2 vehicles (1,128, making up 62.6%).
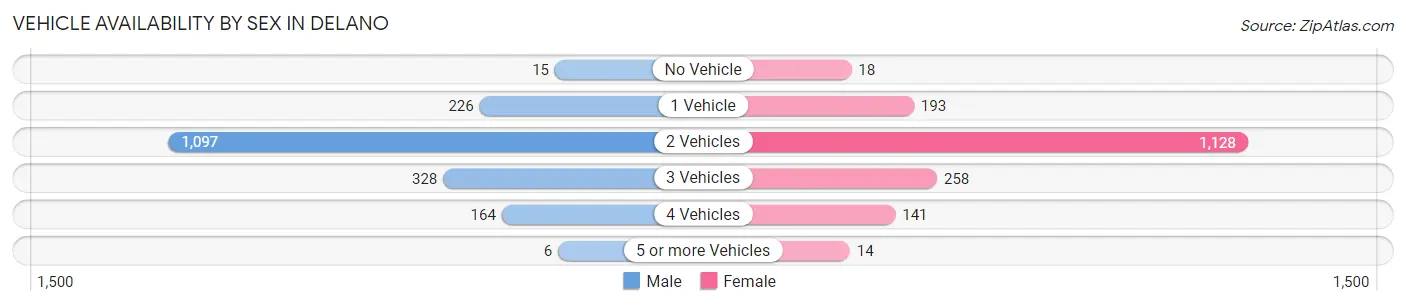
| Vehicles Available | Male | Female |
| No Vehicle | 15 (0.8%) | 18 (1.0%) |
| 1 Vehicle | 226 (12.3%) | 193 (11.0%) |
| 2 Vehicles | 1,097 (59.8%) | 1,128 (64.4%) |
| 3 Vehicles | 328 (17.9%) | 258 (14.7%) |
| 4 Vehicles | 164 (8.9%) | 141 (8.1%) |
| 5 or more Vehicles | 6 (0.3%) | 14 (0.8%) |
| Total | 1,836 (100.0%) | 1,752 (100.0%) |
Commute Time in Delano
The most frequently occuring commute durations in Delano are 35 to 39 minutes (461 commuters, 15.1%), 30 to 34 minutes (445 commuters, 14.5%), and 10 to 14 minutes (337 commuters, 11.0%).
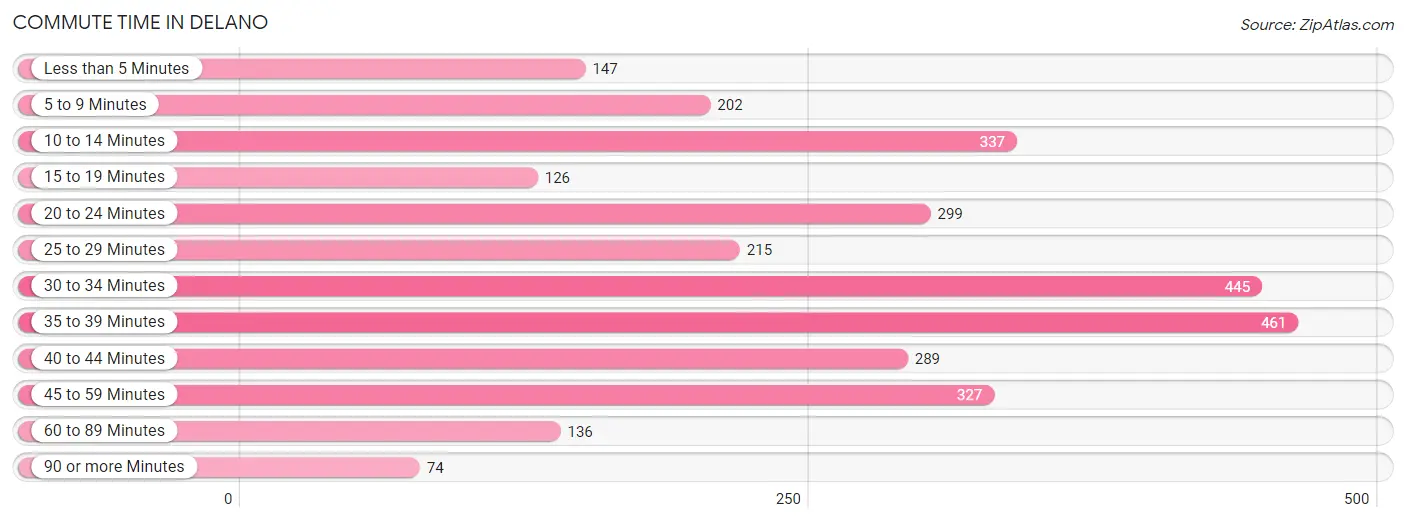
| Commute Time | # Commuters | % Commuters |
| Less than 5 Minutes | 147 | 4.8% |
| 5 to 9 Minutes | 202 | 6.6% |
| 10 to 14 Minutes | 337 | 11.0% |
| 15 to 19 Minutes | 126 | 4.1% |
| 20 to 24 Minutes | 299 | 9.8% |
| 25 to 29 Minutes | 215 | 7.0% |
| 30 to 34 Minutes | 445 | 14.5% |
| 35 to 39 Minutes | 461 | 15.1% |
| 40 to 44 Minutes | 289 | 9.5% |
| 45 to 59 Minutes | 327 | 10.7% |
| 60 to 89 Minutes | 136 | 4.4% |
| 90 or more Minutes | 74 | 2.4% |
Commute Time by Sex in Delano
The most common commute times in Delano are 30 to 34 minutes (300 commuters, 18.9%) for males and 20 to 24 minutes (237 commuters, 16.1%) for females.
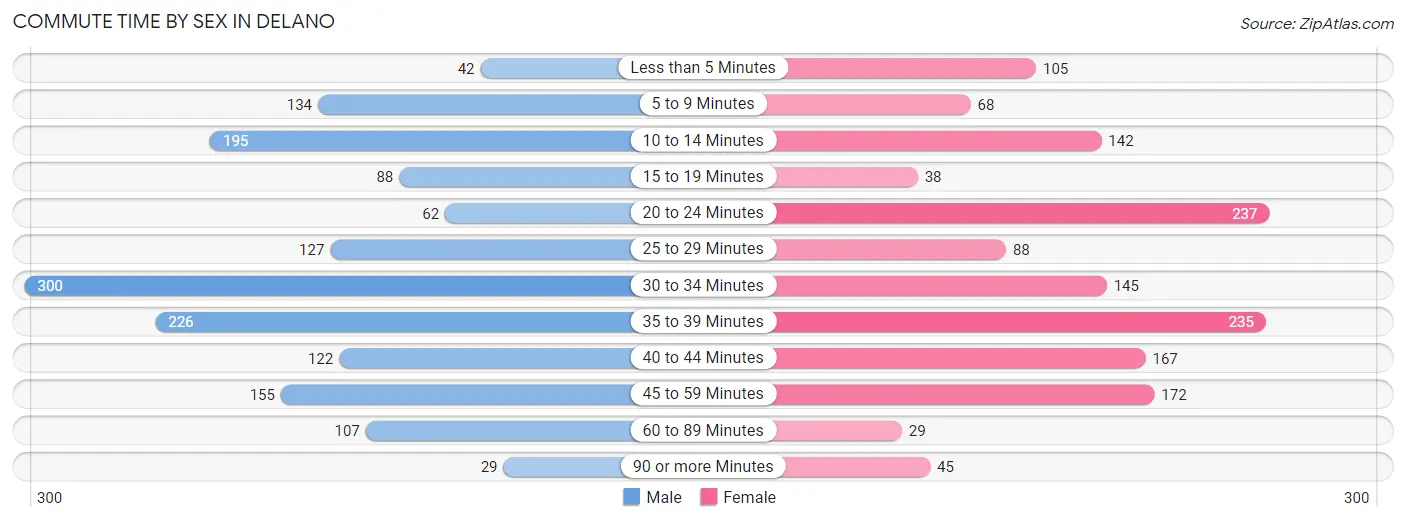
| Commute Time | Male | Female |
| Less than 5 Minutes | 42 (2.6%) | 105 (7.1%) |
| 5 to 9 Minutes | 134 (8.4%) | 68 (4.6%) |
| 10 to 14 Minutes | 195 (12.3%) | 142 (9.7%) |
| 15 to 19 Minutes | 88 (5.6%) | 38 (2.6%) |
| 20 to 24 Minutes | 62 (3.9%) | 237 (16.1%) |
| 25 to 29 Minutes | 127 (8.0%) | 88 (6.0%) |
| 30 to 34 Minutes | 300 (18.9%) | 145 (9.9%) |
| 35 to 39 Minutes | 226 (14.2%) | 235 (16.0%) |
| 40 to 44 Minutes | 122 (7.7%) | 167 (11.4%) |
| 45 to 59 Minutes | 155 (9.8%) | 172 (11.7%) |
| 60 to 89 Minutes | 107 (6.7%) | 29 (2.0%) |
| 90 or more Minutes | 29 (1.8%) | 45 (3.1%) |
Time of Departure to Work by Sex in Delano
The most frequent times of departure to work in Delano are 7:00 AM to 7:29 AM (319, 20.1%) for males and 7:00 AM to 7:29 AM (296, 20.1%) for females.
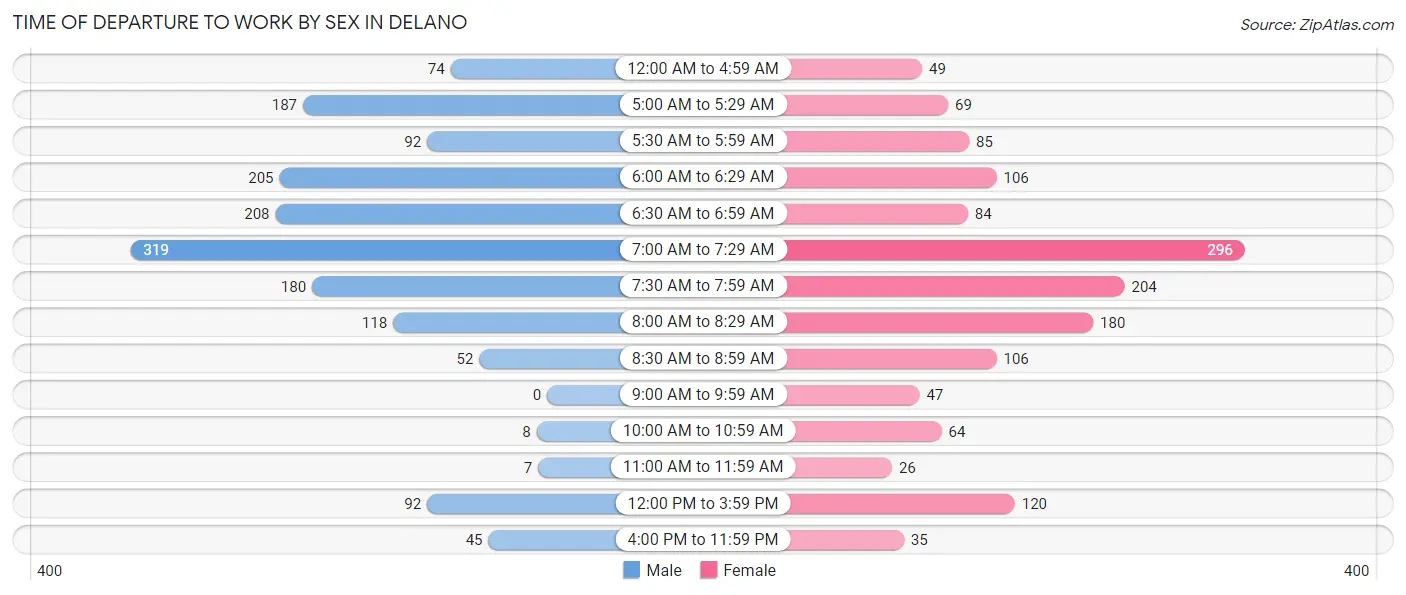
| Time of Departure | Male | Female |
| 12:00 AM to 4:59 AM | 74 (4.7%) | 49 (3.3%) |
| 5:00 AM to 5:29 AM | 187 (11.8%) | 69 (4.7%) |
| 5:30 AM to 5:59 AM | 92 (5.8%) | 85 (5.8%) |
| 6:00 AM to 6:29 AM | 205 (12.9%) | 106 (7.2%) |
| 6:30 AM to 6:59 AM | 208 (13.1%) | 84 (5.7%) |
| 7:00 AM to 7:29 AM | 319 (20.1%) | 296 (20.1%) |
| 7:30 AM to 7:59 AM | 180 (11.3%) | 204 (13.9%) |
| 8:00 AM to 8:29 AM | 118 (7.4%) | 180 (12.2%) |
| 8:30 AM to 8:59 AM | 52 (3.3%) | 106 (7.2%) |
| 9:00 AM to 9:59 AM | 0 (0.0%) | 47 (3.2%) |
| 10:00 AM to 10:59 AM | 8 (0.5%) | 64 (4.3%) |
| 11:00 AM to 11:59 AM | 7 (0.4%) | 26 (1.8%) |
| 12:00 PM to 3:59 PM | 92 (5.8%) | 120 (8.2%) |
| 4:00 PM to 11:59 PM | 45 (2.8%) | 35 (2.4%) |
| Total | 1,587 (100.0%) | 1,471 (100.0%) |
Housing Occupancy in Delano
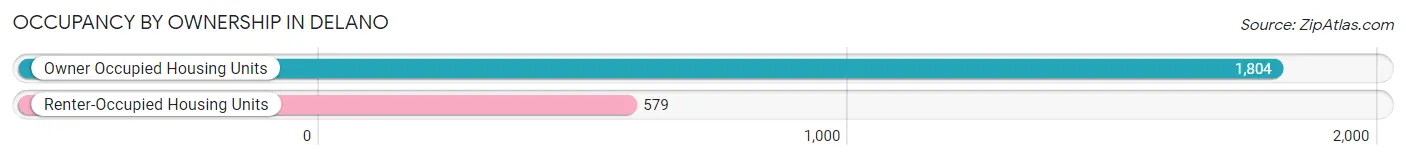
Occupancy by Ownership in Delano
Of the total 2,383 dwellings in Delano, owner-occupied units account for 1,804 (75.7%), while renter-occupied units make up 579 (24.3%).
| Occupancy | # Housing Units | % Housing Units |
| Owner Occupied Housing Units | 1,804 | 75.7% |
| Renter-Occupied Housing Units | 579 | 24.3% |
| Total Occupied Housing Units | 2,383 | 100.0% |
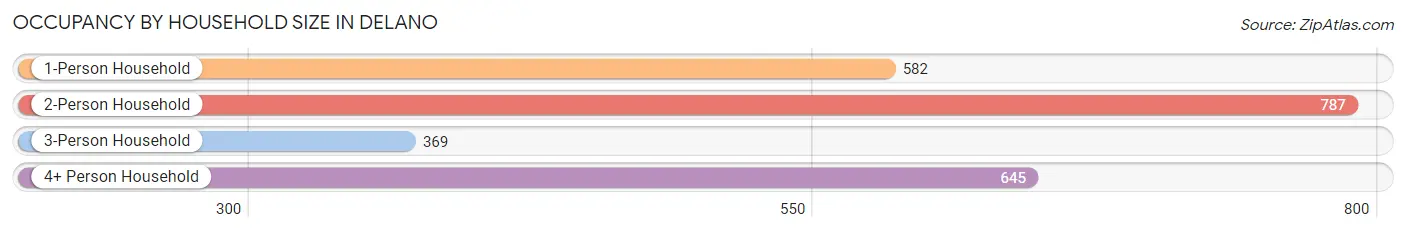
Occupancy by Household Size in Delano
| Household Size | # Housing Units | % Housing Units |
| 1-Person Household | 582 | 24.4% |
| 2-Person Household | 787 | 33.0% |
| 3-Person Household | 369 | 15.5% |
| 4+ Person Household | 645 | 27.1% |
| Total Housing Units | 2,383 | 100.0% |
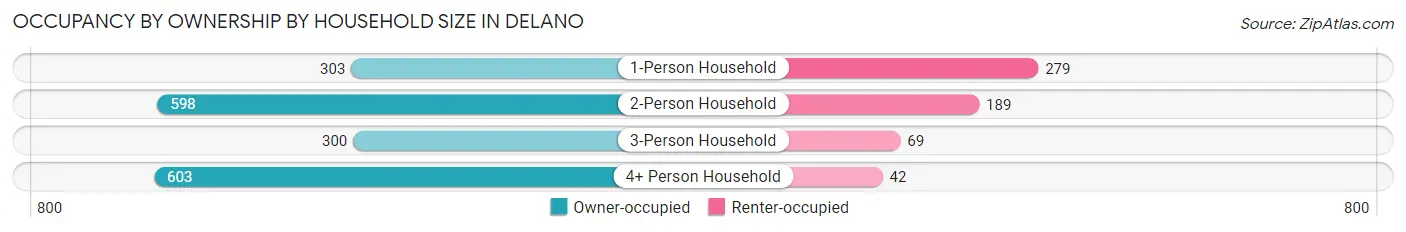
Occupancy by Ownership by Household Size in Delano
| Household Size | Owner-occupied | Renter-occupied |
| 1-Person Household | 303 (52.1%) | 279 (47.9%) |
| 2-Person Household | 598 (76.0%) | 189 (24.0%) |
| 3-Person Household | 300 (81.3%) | 69 (18.7%) |
| 4+ Person Household | 603 (93.5%) | 42 (6.5%) |
| Total Housing Units | 1,804 (75.7%) | 579 (24.3%) |
Occupancy by Educational Attainment in Delano
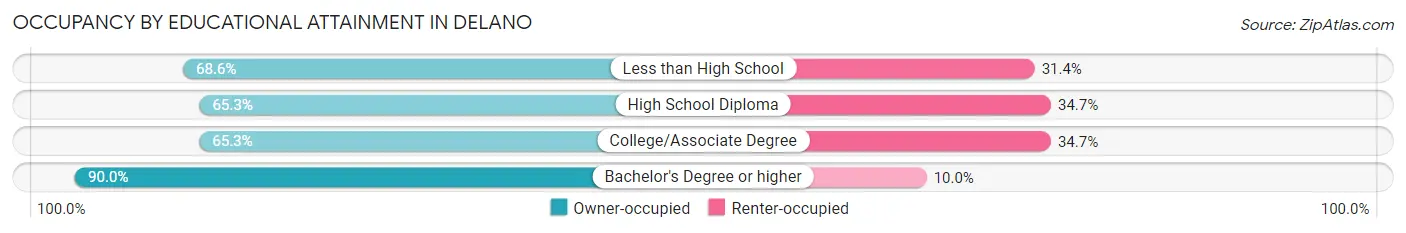
| Household Size | Owner-occupied | Renter-occupied |
| Less than High School | 24 (68.6%) | 11 (31.4%) |
| High School Diploma | 292 (65.3%) | 155 (34.7%) |
| College/Associate Degree | 590 (65.3%) | 313 (34.7%) |
| Bachelor's Degree or higher | 898 (90.0%) | 100 (10.0%) |
Occupancy by Age of Householder in Delano
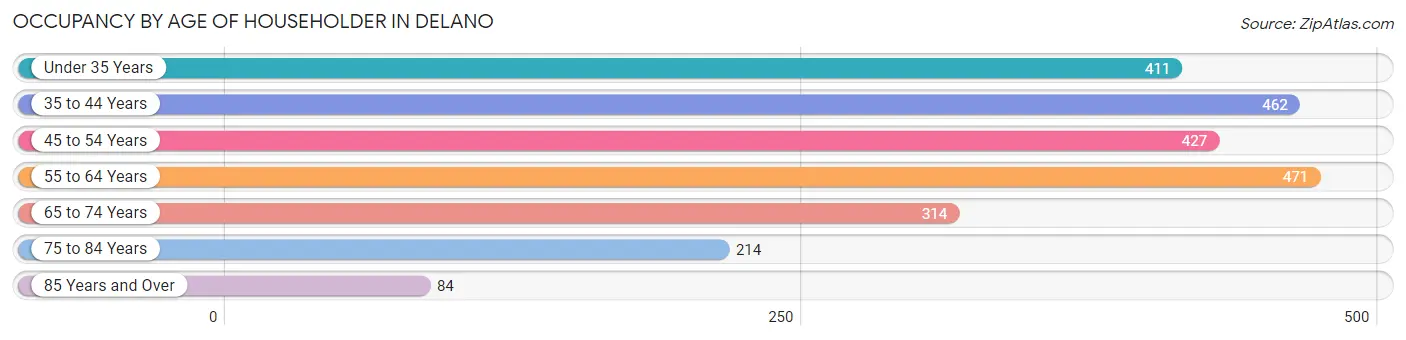
| Age Bracket | # Households | % Households |
| Under 35 Years | 411 | 17.2% |
| 35 to 44 Years | 462 | 19.4% |
| 45 to 54 Years | 427 | 17.9% |
| 55 to 64 Years | 471 | 19.8% |
| 65 to 74 Years | 314 | 13.2% |
| 75 to 84 Years | 214 | 9.0% |
| 85 Years and Over | 84 | 3.5% |
| Total | 2,383 | 100.0% |
Housing Finances in Delano
Median Income by Occupancy in Delano
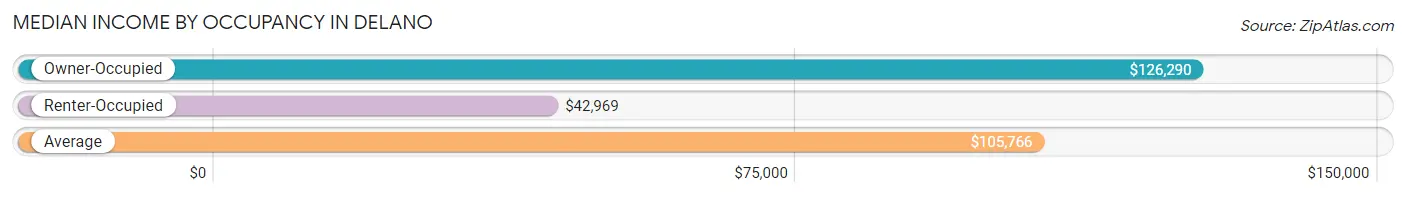
| Occupancy Type | # Households | Median Income |
| Owner-Occupied | 1,804 (75.7%) | $126,290 |
| Renter-Occupied | 579 (24.3%) | $42,969 |
| Average | 2,383 (100.0%) | $105,766 |
Occupancy by Householder Income Bracket in Delano
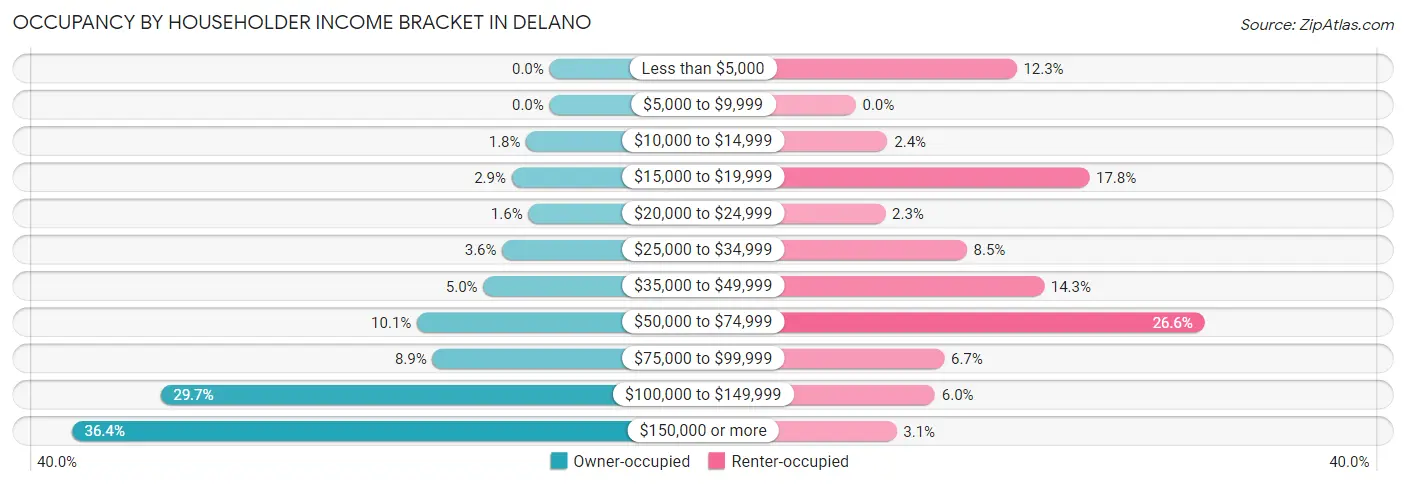
| Income Bracket | Owner-occupied | Renter-occupied |
| Less than $5,000 | 0 (0.0%) | 71 (12.3%) |
| $5,000 to $9,999 | 0 (0.0%) | 0 (0.0%) |
| $10,000 to $14,999 | 32 (1.8%) | 14 (2.4%) |
| $15,000 to $19,999 | 52 (2.9%) | 103 (17.8%) |
| $20,000 to $24,999 | 29 (1.6%) | 13 (2.2%) |
| $25,000 to $34,999 | 65 (3.6%) | 49 (8.5%) |
| $35,000 to $49,999 | 91 (5.0%) | 83 (14.3%) |
| $50,000 to $74,999 | 182 (10.1%) | 154 (26.6%) |
| $75,000 to $99,999 | 161 (8.9%) | 39 (6.7%) |
| $100,000 to $149,999 | 535 (29.7%) | 35 (6.0%) |
| $150,000 or more | 657 (36.4%) | 18 (3.1%) |
| Total | 1,804 (100.0%) | 579 (100.0%) |
Monthly Housing Cost Tiers in Delano
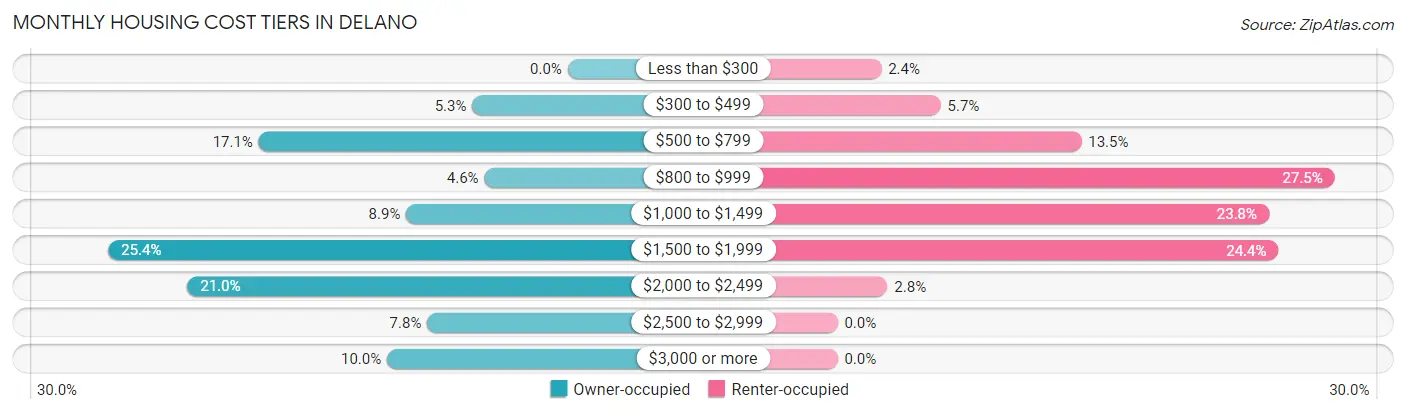
| Monthly Cost | Owner-occupied | Renter-occupied |
| Less than $300 | 0 (0.0%) | 14 (2.4%) |
| $300 to $499 | 95 (5.3%) | 33 (5.7%) |
| $500 to $799 | 308 (17.1%) | 78 (13.5%) |
| $800 to $999 | 83 (4.6%) | 159 (27.5%) |
| $1,000 to $1,499 | 161 (8.9%) | 138 (23.8%) |
| $1,500 to $1,999 | 458 (25.4%) | 141 (24.3%) |
| $2,000 to $2,499 | 379 (21.0%) | 16 (2.8%) |
| $2,500 to $2,999 | 140 (7.8%) | 0 (0.0%) |
| $3,000 or more | 180 (10.0%) | 0 (0.0%) |
| Total | 1,804 (100.0%) | 579 (100.0%) |
Physical Housing Characteristics in Delano
Housing Structures in Delano
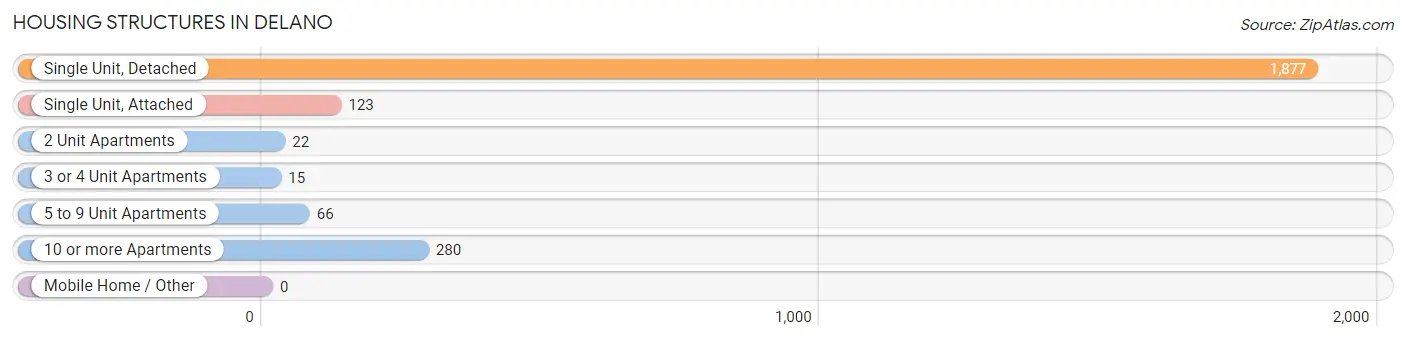
| Structure Type | # Housing Units | % Housing Units |
| Single Unit, Detached | 1,877 | 78.8% |
| Single Unit, Attached | 123 | 5.2% |
| 2 Unit Apartments | 22 | 0.9% |
| 3 or 4 Unit Apartments | 15 | 0.6% |
| 5 to 9 Unit Apartments | 66 | 2.8% |
| 10 or more Apartments | 280 | 11.7% |
| Mobile Home / Other | 0 | 0.0% |
| Total | 2,383 | 100.0% |
Housing Structures by Occupancy in Delano
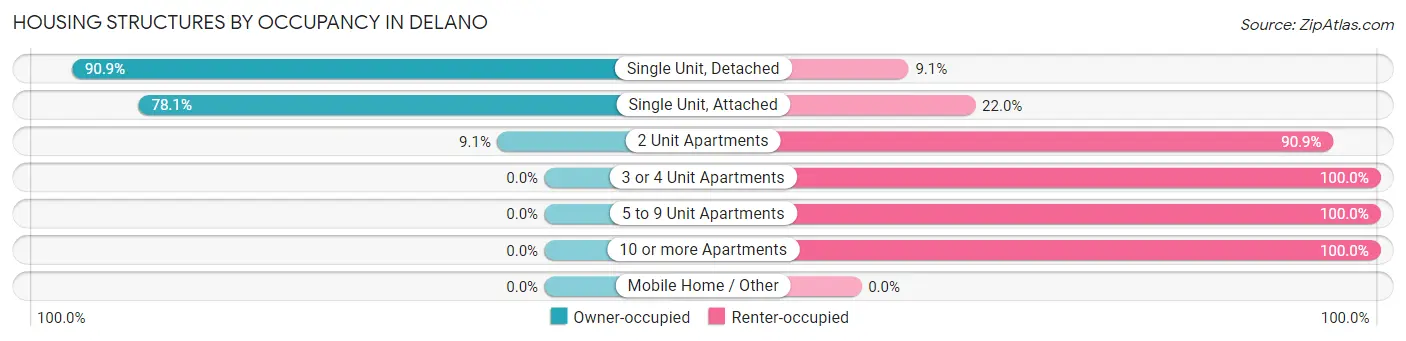
| Structure Type | Owner-occupied | Renter-occupied |
| Single Unit, Detached | 1,706 (90.9%) | 171 (9.1%) |
| Single Unit, Attached | 96 (78.0%) | 27 (22.0%) |
| 2 Unit Apartments | 2 (9.1%) | 20 (90.9%) |
| 3 or 4 Unit Apartments | 0 (0.0%) | 15 (100.0%) |
| 5 to 9 Unit Apartments | 0 (0.0%) | 66 (100.0%) |
| 10 or more Apartments | 0 (0.0%) | 280 (100.0%) |
| Mobile Home / Other | 0 (0.0%) | 0 (0.0%) |
| Total | 1,804 (75.7%) | 579 (24.3%) |
Housing Structures by Number of Rooms in Delano
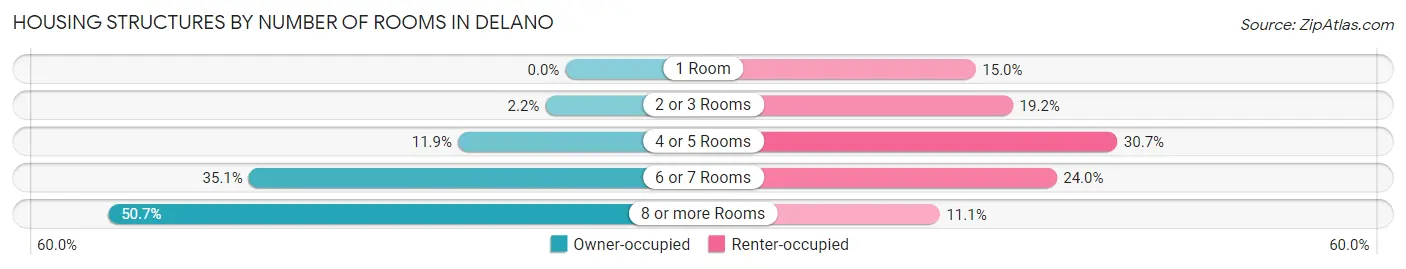
| Number of Rooms | Owner-occupied | Renter-occupied |
| 1 Room | 0 (0.0%) | 87 (15.0%) |
| 2 or 3 Rooms | 40 (2.2%) | 111 (19.2%) |
| 4 or 5 Rooms | 215 (11.9%) | 178 (30.7%) |
| 6 or 7 Rooms | 634 (35.1%) | 139 (24.0%) |
| 8 or more Rooms | 915 (50.7%) | 64 (11.1%) |
| Total | 1,804 (100.0%) | 579 (100.0%) |
Housing Structure by Heating Type in Delano
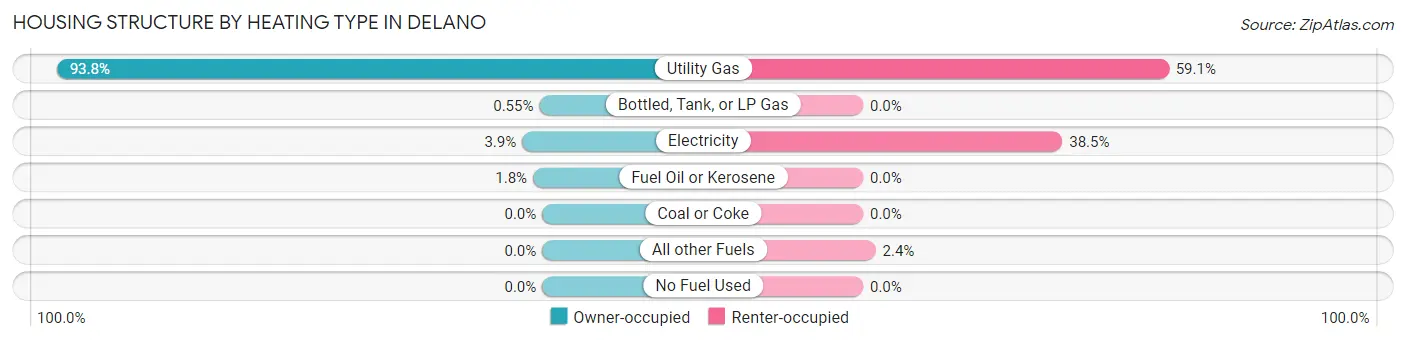
| Heating Type | Owner-occupied | Renter-occupied |
| Utility Gas | 1,692 (93.8%) | 342 (59.1%) |
| Bottled, Tank, or LP Gas | 10 (0.5%) | 0 (0.0%) |
| Electricity | 70 (3.9%) | 223 (38.5%) |
| Fuel Oil or Kerosene | 32 (1.8%) | 0 (0.0%) |
| Coal or Coke | 0 (0.0%) | 0 (0.0%) |
| All other Fuels | 0 (0.0%) | 14 (2.4%) |
| No Fuel Used | 0 (0.0%) | 0 (0.0%) |
| Total | 1,804 (100.0%) | 579 (100.0%) |
Household Vehicle Usage in Delano
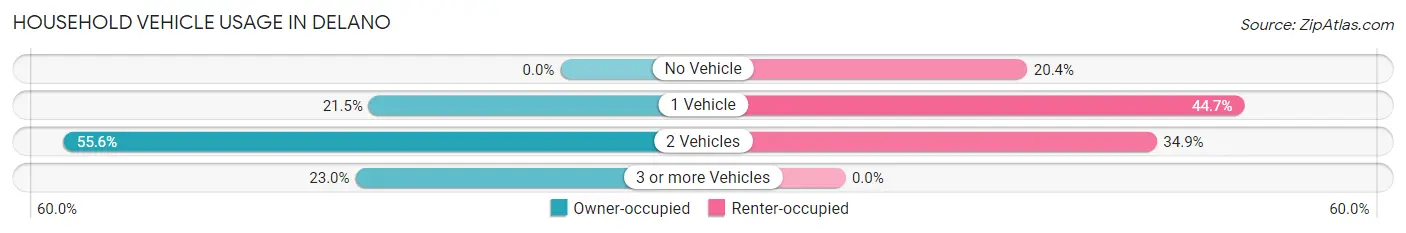
| Vehicles per Household | Owner-occupied | Renter-occupied |
| No Vehicle | 0 (0.0%) | 118 (20.4%) |
| 1 Vehicle | 387 (21.4%) | 259 (44.7%) |
| 2 Vehicles | 1,003 (55.6%) | 202 (34.9%) |
| 3 or more Vehicles | 414 (23.0%) | 0 (0.0%) |
| Total | 1,804 (100.0%) | 579 (100.0%) |
Real Estate & Mortgages in Delano
Real Estate and Mortgage Overview in Delano
| Characteristic | Without Mortgage | With Mortgage |
| Housing Units | 483 | 1,321 |
| Median Property Value | $299,600 | $334,400 |
| Median Household Income | $84,083 | $638 |
| Monthly Housing Costs | $646 | $180 |
| Real Estate Taxes | $2,982 | $25 |
Property Value by Mortgage Status in Delano
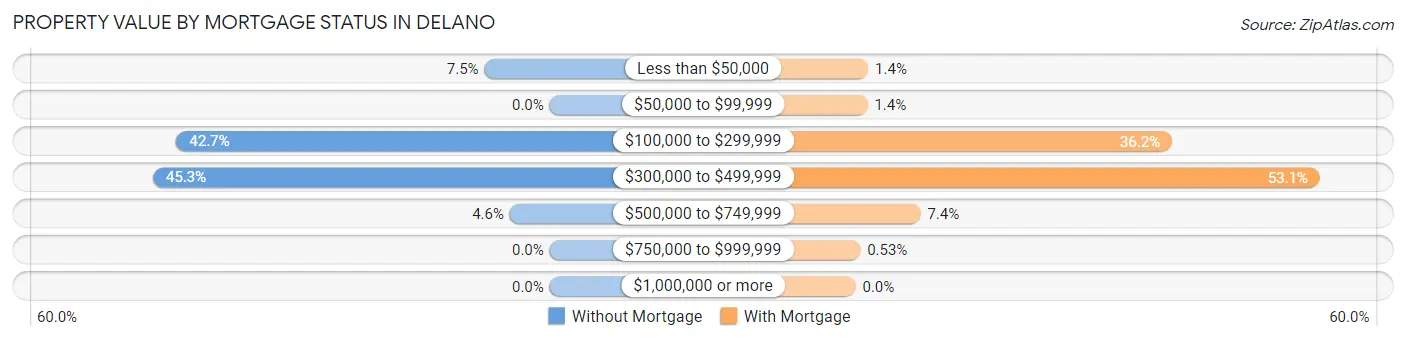
| Property Value | Without Mortgage | With Mortgage |
| Less than $50,000 | 36 (7.4%) | 19 (1.4%) |
| $50,000 to $99,999 | 0 (0.0%) | 18 (1.4%) |
| $100,000 to $299,999 | 206 (42.6%) | 478 (36.2%) |
| $300,000 to $499,999 | 219 (45.3%) | 701 (53.1%) |
| $500,000 to $749,999 | 22 (4.5%) | 98 (7.4%) |
| $750,000 to $999,999 | 0 (0.0%) | 7 (0.5%) |
| $1,000,000 or more | 0 (0.0%) | 0 (0.0%) |
| Total | 483 (100.0%) | 1,321 (100.0%) |
Household Income by Mortgage Status in Delano
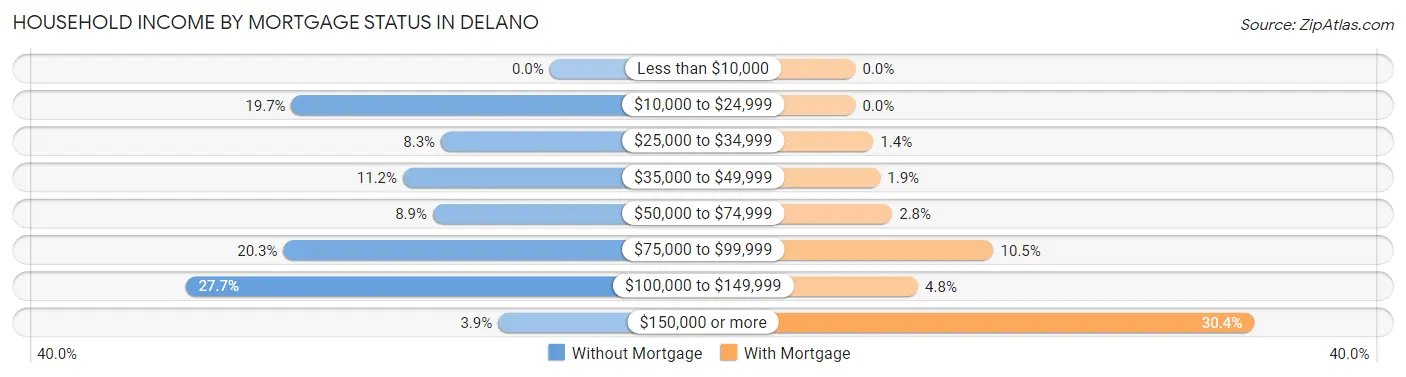
| Household Income | Without Mortgage | With Mortgage |
| Less than $10,000 | 0 (0.0%) | 0 (0.0%) |
| $10,000 to $24,999 | 95 (19.7%) | 0 (0.0%) |
| $25,000 to $34,999 | 40 (8.3%) | 18 (1.4%) |
| $35,000 to $49,999 | 54 (11.2%) | 25 (1.9%) |
| $50,000 to $74,999 | 43 (8.9%) | 37 (2.8%) |
| $75,000 to $99,999 | 98 (20.3%) | 139 (10.5%) |
| $100,000 to $149,999 | 134 (27.7%) | 63 (4.8%) |
| $150,000 or more | 19 (3.9%) | 401 (30.4%) |
| Total | 483 (100.0%) | 1,321 (100.0%) |
Property Value to Household Income Ratio in Delano
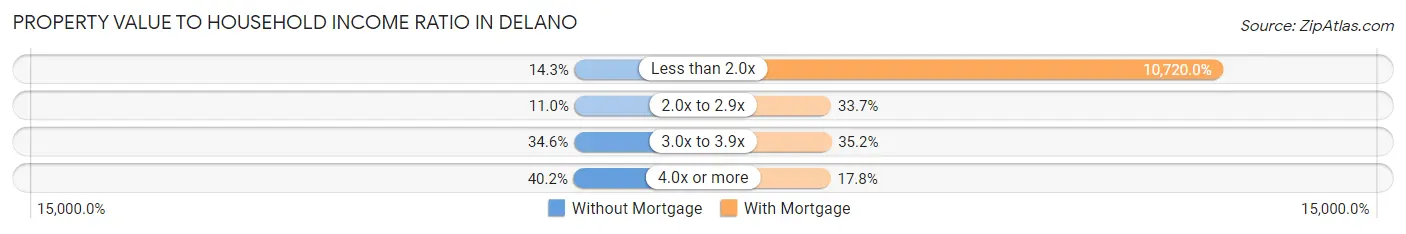
| Value-to-Income Ratio | Without Mortgage | With Mortgage |
| Less than 2.0x | 69 (14.3%) | 141,611 (10,720.0%) |
| 2.0x to 2.9x | 53 (11.0%) | 445 (33.7%) |
| 3.0x to 3.9x | 167 (34.6%) | 465 (35.2%) |
| 4.0x or more | 194 (40.2%) | 235 (17.8%) |
| Total | 483 (100.0%) | 1,321 (100.0%) |
Real Estate Taxes by Mortgage Status in Delano
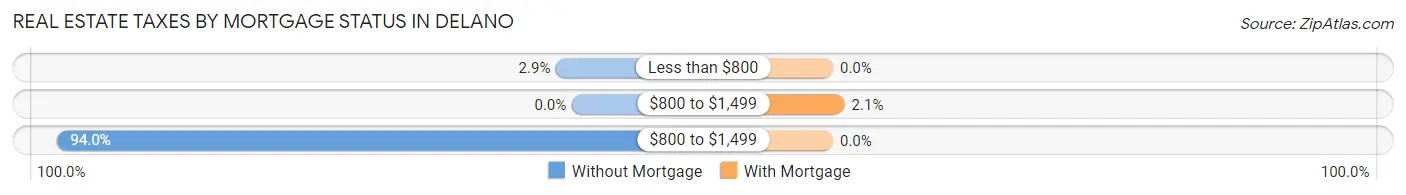
| Property Taxes | Without Mortgage | With Mortgage |
| Less than $800 | 14 (2.9%) | 0 (0.0%) |
| $800 to $1,499 | 0 (0.0%) | 28 (2.1%) |
| $800 to $1,499 | 454 (94.0%) | 0 (0.0%) |
| Total | 483 (100.0%) | 1,321 (100.0%) |
Health & Disability in Delano
Health Insurance Coverage by Age in Delano
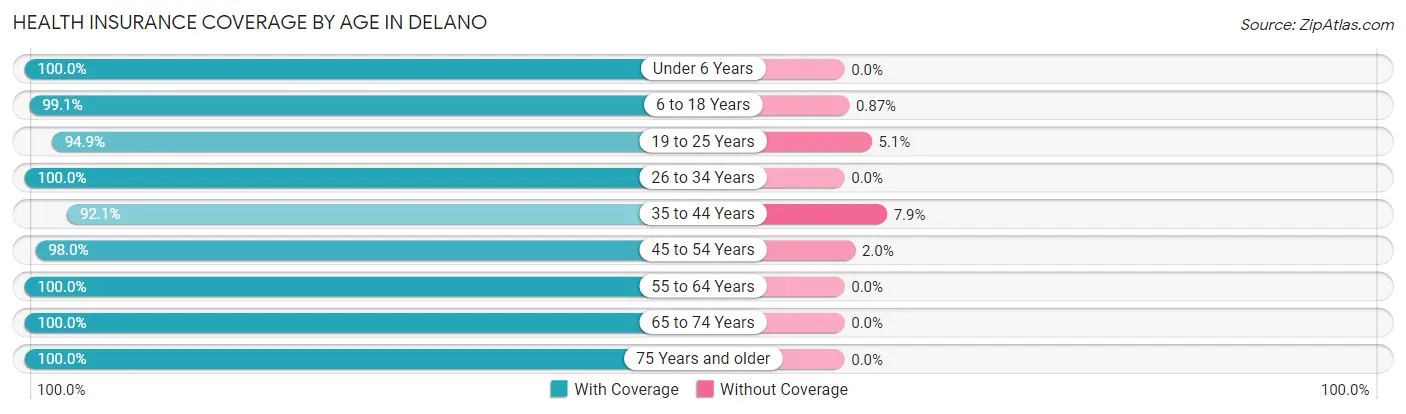
| Age Bracket | With Coverage | Without Coverage |
| Under 6 Years | 615 (100.0%) | 0 (0.0%) |
| 6 to 18 Years | 1,366 (99.1%) | 12 (0.9%) |
| 19 to 25 Years | 319 (94.9%) | 17 (5.1%) |
| 26 to 34 Years | 726 (100.0%) | 0 (0.0%) |
| 35 to 44 Years | 1,024 (92.1%) | 88 (7.9%) |
| 45 to 54 Years | 740 (98.0%) | 15 (2.0%) |
| 55 to 64 Years | 799 (100.0%) | 0 (0.0%) |
| 65 to 74 Years | 369 (100.0%) | 0 (0.0%) |
| 75 Years and older | 384 (100.0%) | 0 (0.0%) |
| Total | 6,342 (98.0%) | 132 (2.0%) |
Health Insurance Coverage by Citizenship Status in Delano

| Citizenship Status | With Coverage | Without Coverage |
| Native Born | 615 (100.0%) | 0 (0.0%) |
| Foreign Born, Citizen | 1,366 (99.1%) | 12 (0.9%) |
| Foreign Born, not a Citizen | 319 (94.9%) | 17 (5.1%) |
Health Insurance Coverage by Household Income in Delano
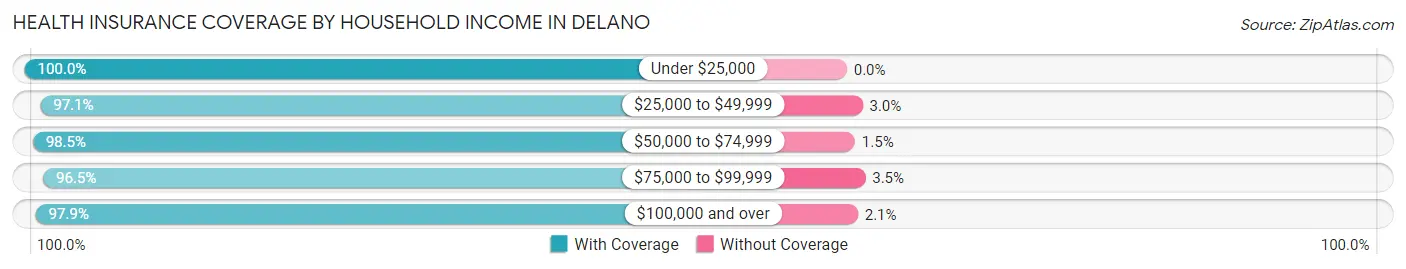
| Household Income | With Coverage | Without Coverage |
| Under $25,000 | 383 (100.0%) | 0 (0.0%) |
| $25,000 to $49,999 | 494 (97.1%) | 15 (2.9%) |
| $50,000 to $74,999 | 907 (98.5%) | 14 (1.5%) |
| $75,000 to $99,999 | 474 (96.5%) | 17 (3.5%) |
| $100,000 and over | 4,084 (97.9%) | 86 (2.1%) |
Public vs Private Health Insurance Coverage by Age in Delano
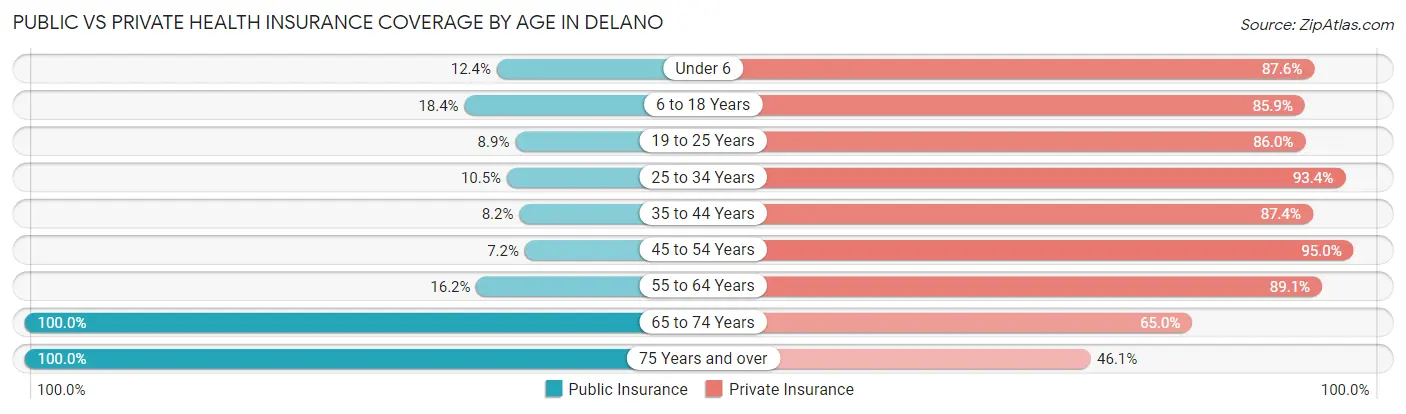
| Age Bracket | Public Insurance | Private Insurance |
| Under 6 | 76 (12.4%) | 539 (87.6%) |
| 6 to 18 Years | 253 (18.4%) | 1,184 (85.9%) |
| 19 to 25 Years | 30 (8.9%) | 289 (86.0%) |
| 25 to 34 Years | 76 (10.5%) | 678 (93.4%) |
| 35 to 44 Years | 91 (8.2%) | 972 (87.4%) |
| 45 to 54 Years | 54 (7.1%) | 717 (95.0%) |
| 55 to 64 Years | 129 (16.2%) | 712 (89.1%) |
| 65 to 74 Years | 369 (100.0%) | 240 (65.0%) |
| 75 Years and over | 384 (100.0%) | 177 (46.1%) |
| Total | 1,462 (22.6%) | 5,508 (85.1%) |
Disability Status by Sex by Age in Delano
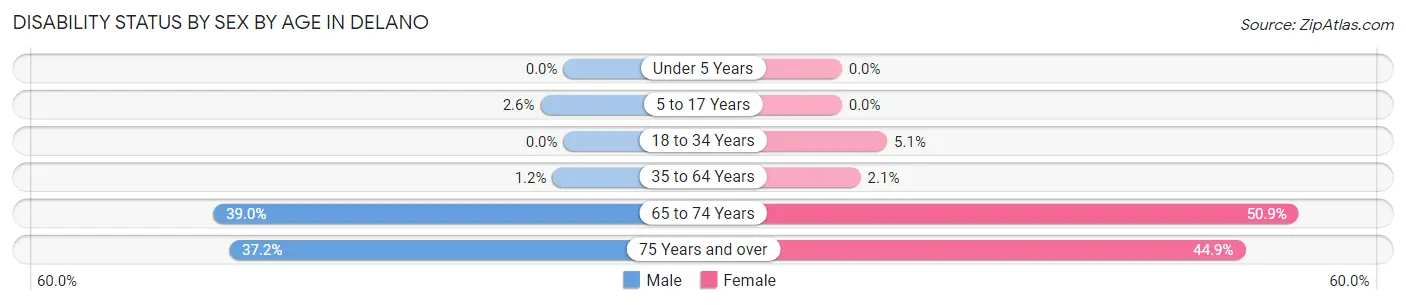
| Age Bracket | Male | Female |
| Under 5 Years | 0 (0.0%) | 0 (0.0%) |
| 5 to 17 Years | 21 (2.6%) | 0 (0.0%) |
| 18 to 34 Years | 0 (0.0%) | 27 (5.1%) |
| 35 to 64 Years | 17 (1.2%) | 27 (2.1%) |
| 65 to 74 Years | 55 (39.0%) | 116 (50.9%) |
| 75 Years and over | 51 (37.2%) | 111 (44.9%) |
Disability Class by Sex by Age in Delano
Disability Class: Hearing Difficulty
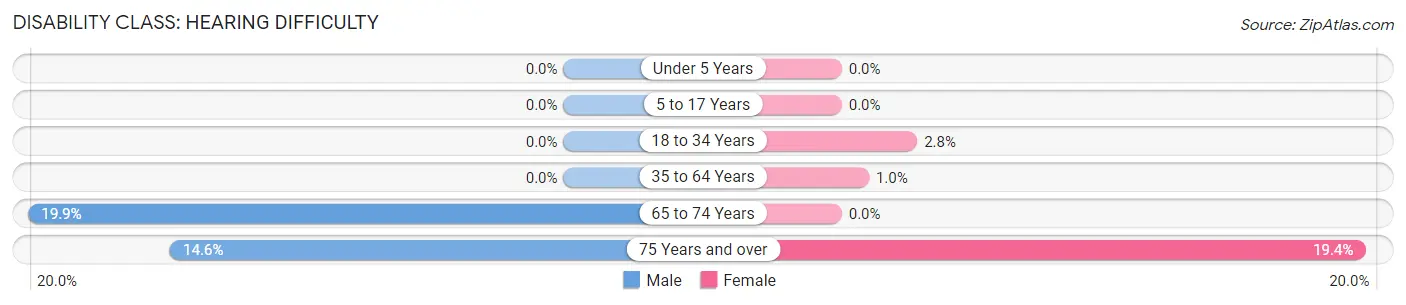
| Age Bracket | Male | Female |
| Under 5 Years | 0 (0.0%) | 0 (0.0%) |
| 5 to 17 Years | 0 (0.0%) | 0 (0.0%) |
| 18 to 34 Years | 0 (0.0%) | 15 (2.8%) |
| 35 to 64 Years | 0 (0.0%) | 13 (1.0%) |
| 65 to 74 Years | 28 (19.9%) | 0 (0.0%) |
| 75 Years and over | 20 (14.6%) | 48 (19.4%) |
Disability Class: Vision Difficulty
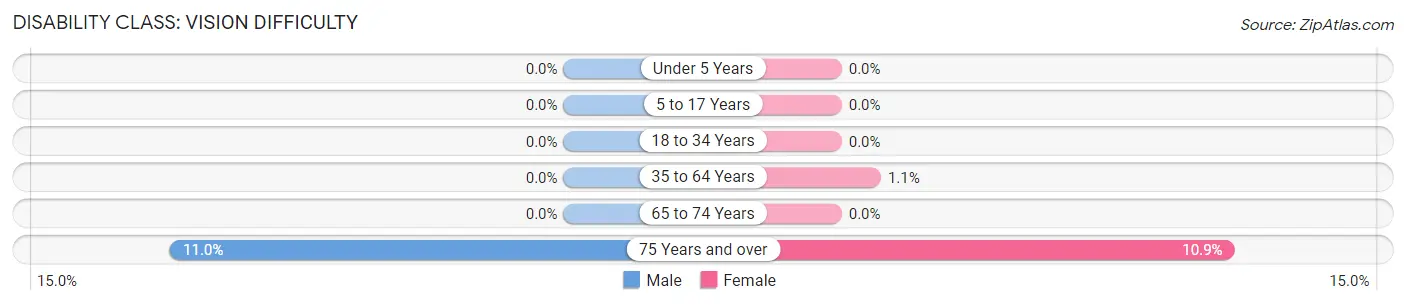
| Age Bracket | Male | Female |
| Under 5 Years | 0 (0.0%) | 0 (0.0%) |
| 5 to 17 Years | 0 (0.0%) | 0 (0.0%) |
| 18 to 34 Years | 0 (0.0%) | 0 (0.0%) |
| 35 to 64 Years | 0 (0.0%) | 14 (1.1%) |
| 65 to 74 Years | 0 (0.0%) | 0 (0.0%) |
| 75 Years and over | 15 (11.0%) | 27 (10.9%) |
Disability Class: Cognitive Difficulty
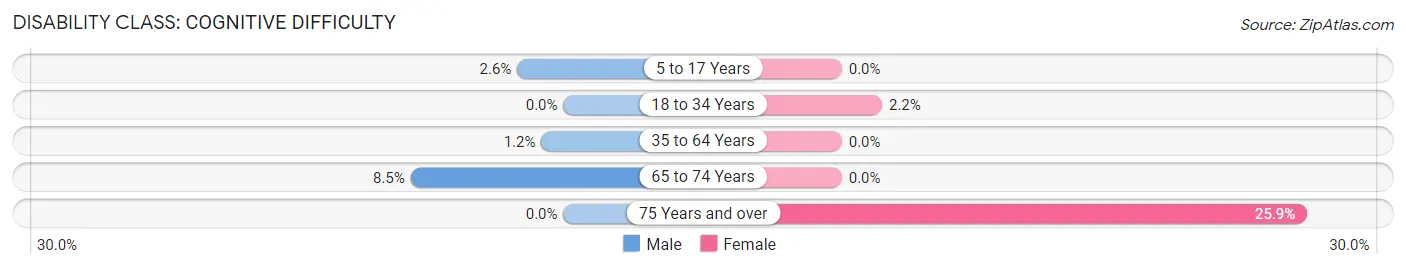
| Age Bracket | Male | Female |
| 5 to 17 Years | 21 (2.6%) | 0 (0.0%) |
| 18 to 34 Years | 0 (0.0%) | 12 (2.2%) |
| 35 to 64 Years | 17 (1.2%) | 0 (0.0%) |
| 65 to 74 Years | 12 (8.5%) | 0 (0.0%) |
| 75 Years and over | 0 (0.0%) | 64 (25.9%) |
Disability Class: Ambulatory Difficulty
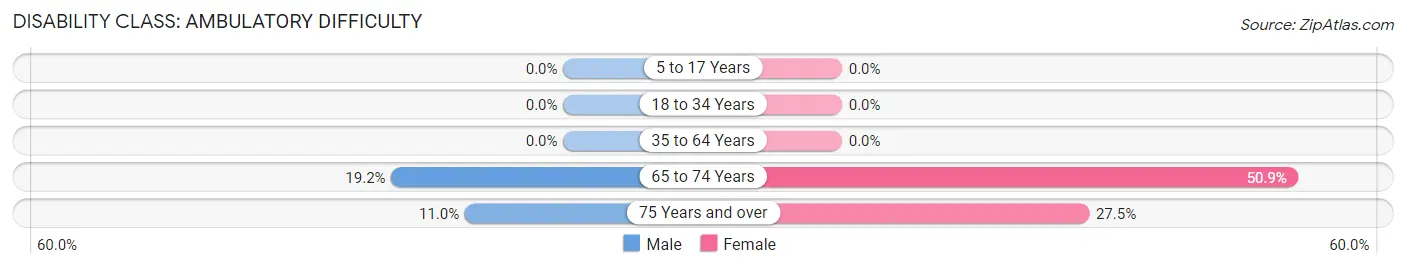
| Age Bracket | Male | Female |
| 5 to 17 Years | 0 (0.0%) | 0 (0.0%) |
| 18 to 34 Years | 0 (0.0%) | 0 (0.0%) |
| 35 to 64 Years | 0 (0.0%) | 0 (0.0%) |
| 65 to 74 Years | 27 (19.2%) | 116 (50.9%) |
| 75 Years and over | 15 (11.0%) | 68 (27.5%) |
Disability Class: Self-Care Difficulty
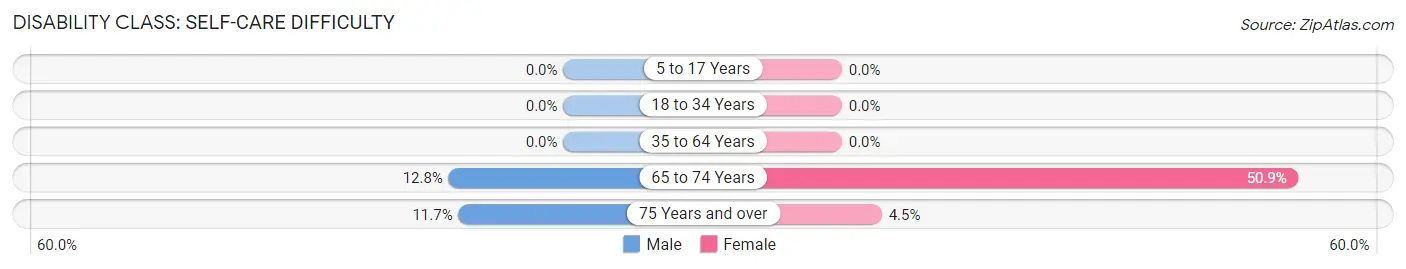
| Age Bracket | Male | Female |
| 5 to 17 Years | 0 (0.0%) | 0 (0.0%) |
| 18 to 34 Years | 0 (0.0%) | 0 (0.0%) |
| 35 to 64 Years | 0 (0.0%) | 0 (0.0%) |
| 65 to 74 Years | 18 (12.8%) | 116 (50.9%) |
| 75 Years and over | 16 (11.7%) | 11 (4.4%) |
Technology Access in Delano
Computing Device Access in Delano
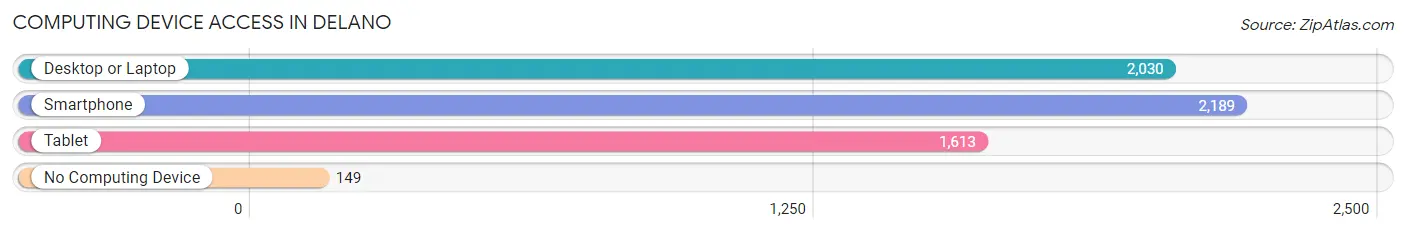
| Device Type | # Households | % Households |
| Desktop or Laptop | 2,030 | 85.2% |
| Smartphone | 2,189 | 91.9% |
| Tablet | 1,613 | 67.7% |
| No Computing Device | 149 | 6.2% |
| Total | 2,383 | 100.0% |
Internet Access in Delano
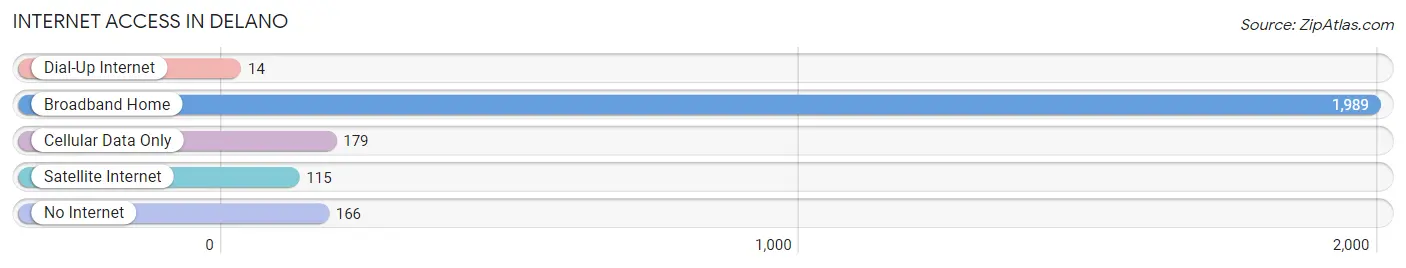
| Internet Type | # Households | % Households |
| Dial-Up Internet | 14 | 0.6% |
| Broadband Home | 1,989 | 83.5% |
| Cellular Data Only | 179 | 7.5% |
| Satellite Internet | 115 | 4.8% |
| No Internet | 166 | 7.0% |
| Total | 2,383 | 100.0% |
Delano Summary
Delano, Minnesota is a small city located in Wright County, approximately 40 miles west of Minneapolis. The city is situated on the banks of the Crow River and is home to a population of approximately 8,000 people.
History
Delano was first settled in 1855 by a group of German immigrants. The city was named after the Italian patriot Giuseppe Garibaldi, who was known as “the Hero of Two Worlds”. The city was incorporated in 1876 and was originally a farming community. In the late 19th century, the city began to grow and develop as a commercial center. The first railroad line was built in 1877, connecting Delano to Minneapolis. This allowed for the growth of the city’s economy and population.
In the early 20th century, Delano was a thriving community with a variety of businesses, including a flour mill, a creamery, a brewery, and a furniture factory. The city also had a number of churches, schools, and other civic organizations.
Geography
Delano is located in the central part of Minnesota, in Wright County. The city is situated on the banks of the Crow River, which flows through the city. The city is surrounded by rolling hills and farmland. The city is located approximately 40 miles west of Minneapolis and is part of the Twin Cities metropolitan area.
The climate in Delano is typical of the Midwest, with cold winters and hot summers. The average temperature in the winter is around 20 degrees Fahrenheit, while the average temperature in the summer is around 75 degrees Fahrenheit.
Economy
Delano’s economy is largely based on agriculture and manufacturing. The city is home to a number of agricultural businesses, including dairy farms, grain elevators, and feed mills. The city also has a number of manufacturing businesses, including a furniture factory, a brewery, and a flour mill.
The city is also home to a number of retail businesses, including grocery stores, restaurants, and clothing stores. The city also has a number of service businesses, including banks, insurance companies, and medical offices.
Demographics
As of the 2010 census, the population of Delano was 8,015. The racial makeup of the city was 94.3% White, 1.2% African American, 0.4% Native American, 0.7% Asian, 0.1% Pacific Islander, 1.7% from other races, and 1.8% from two or more races. Hispanic or Latino of any race were 4.2% of the population.
The median household income in Delano was $50,945, and the median family income was $60,945. The per capita income in Delano was $24,945. About 6.3% of families and 8.2% of the population were below the poverty line, including 10.2% of those under age 18 and 6.2% of those age 65 or over.
Delano is a small city with a rich history and a diverse economy. The city is home to a variety of businesses, including agricultural, manufacturing, retail, and service businesses. The city also has a diverse population, with a mix of races and ethnicities. Delano is a great place to live and work, and is a great example of a small city with a big heart.
Common Questions
What is Per Capita Income in Delano?
Per Capita income in Delano is $44,425.
What is the Median Family Income in Delano?
Median Family Income in Delano is $122,273.
What is the Median Household income in Delano?
Median Household Income in Delano is $105,766.
What is Income or Wage Gap in Delano?
Income or Wage Gap in Delano is 44.6%.
Women in Delano earn 55.4 cents for every dollar earned by a man.
What is Inequality or Gini Index in Delano?
Inequality or Gini Index in Delano is 0.41.
What is the Total Population of Delano?
Total Population of Delano is 6,539.
What is the Total Male Population of Delano?
Total Male Population of Delano is 3,317.
What is the Total Female Population of Delano?
Total Female Population of Delano is 3,222.
What is the Ratio of Males per 100 Females in Delano?
There are 102.95 Males per 100 Females in Delano.
What is the Ratio of Females per 100 Males in Delano?
There are 97.14 Females per 100 Males in Delano.
What is the Median Population Age in Delano?
Median Population Age in Delano is 36.1 Years.
What is the Average Family Size in Delano
Average Family Size in Delano is 3.3 People.
What is the Average Household Size in Delano
Average Household Size in Delano is 2.7 People.
How Large is the Labor Force in Delano?
There are 3,631 People in the Labor Forcein in Delano.
What is the Percentage of People in the Labor Force in Delano?
75.6% of People are in the Labor Force in Delano.
What is the Unemployment Rate in Delano?
Unemployment Rate in Delano is 0.8%.