Hadley, MN Map & Demographics
Hadley Map
Hadley Overview
$46,988
PER CAPITA INCOME
$77,917
AVG FAMILY INCOME
$79,167
AVG HOUSEHOLD INCOME
0.33
INEQUALITY / GINI INDEX
43
TOTAL POPULATION
21
MALE POPULATION
22
FEMALE POPULATION
95.45
MALES / 100 FEMALES
104.76
FEMALES / 100 MALES
57.1
MEDIAN AGE
2.3
AVG FAMILY SIZE
1.9
AVG HOUSEHOLD SIZE
30
LABOR FORCE [ PEOPLE ]
85.7%
PERCENT IN LABOR FORCE
Hadley Area Codes
Income in Hadley
Income Overview in Hadley
Per Capita Income in Hadley is $46,988, while median incomes of families and households are $77,917 and $79,167 respectively.
| Characteristic | Number | Measure |
| Per Capita Income | 43 | $46,988 |
| Median Family Income | 13 | $77,917 |
| Mean Family Income | 13 | $94,362 |
| Median Household Income | 22 | $79,167 |
| Mean Household Income | 22 | $95,377 |
| Income Deficit | 13 | $0 |
| Wage / Income Gap (%) | 43 | 0.00% |
| Wage / Income Gap ($) | 43 | 100.00¢ per $1 |
| Gini / Inequality Index | 43 | 0.33 |
Earnings by Sex in Hadley
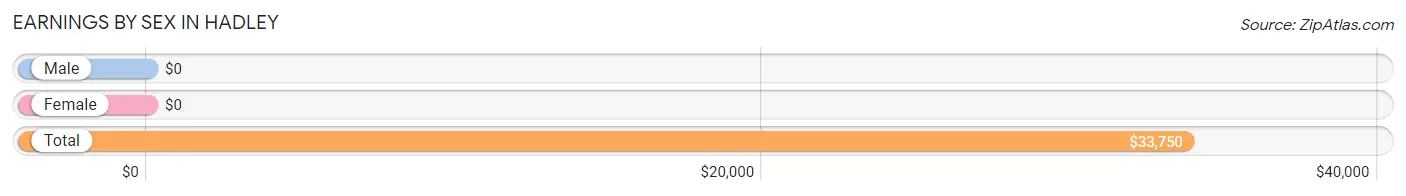
| Sex | Number | Average Earnings |
| Male | 17 (56.7%) | $0 |
| Female | 13 (43.3%) | $0 |
| Total | 30 (100.0%) | $33,750 |
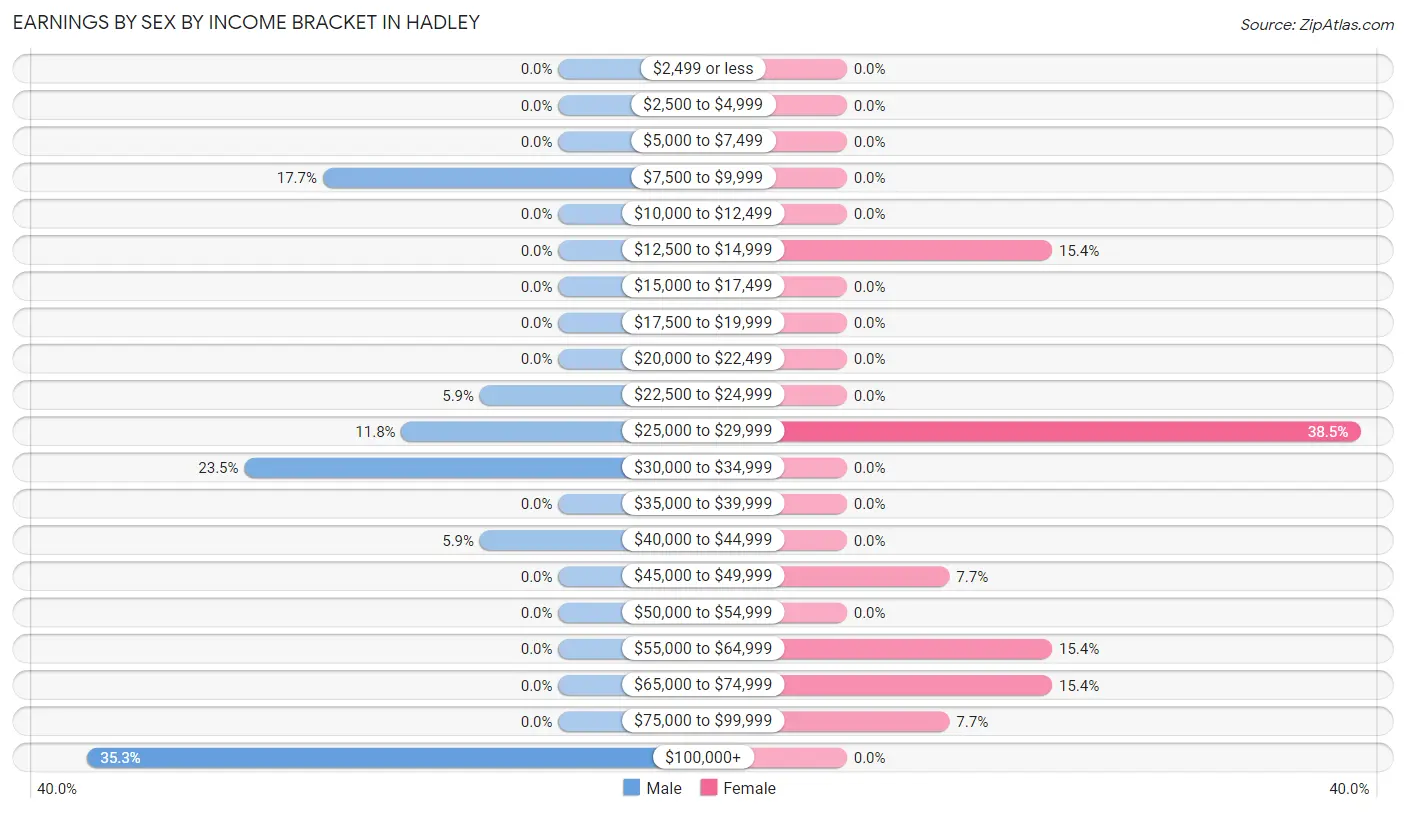
Earnings by Sex by Income Bracket in Hadley
The most common earnings brackets in Hadley are $100,000+ for men (6 | 35.3%) and $25,000 to $29,999 for women (5 | 38.5%).
| Income | Male | Female |
| $2,499 or less | 0 (0.0%) | 0 (0.0%) |
| $2,500 to $4,999 | 0 (0.0%) | 0 (0.0%) |
| $5,000 to $7,499 | 0 (0.0%) | 0 (0.0%) |
| $7,500 to $9,999 | 3 (17.6%) | 0 (0.0%) |
| $10,000 to $12,499 | 0 (0.0%) | 0 (0.0%) |
| $12,500 to $14,999 | 0 (0.0%) | 2 (15.4%) |
| $15,000 to $17,499 | 0 (0.0%) | 0 (0.0%) |
| $17,500 to $19,999 | 0 (0.0%) | 0 (0.0%) |
| $20,000 to $22,499 | 0 (0.0%) | 0 (0.0%) |
| $22,500 to $24,999 | 1 (5.9%) | 0 (0.0%) |
| $25,000 to $29,999 | 2 (11.8%) | 5 (38.5%) |
| $30,000 to $34,999 | 4 (23.5%) | 0 (0.0%) |
| $35,000 to $39,999 | 0 (0.0%) | 0 (0.0%) |
| $40,000 to $44,999 | 1 (5.9%) | 0 (0.0%) |
| $45,000 to $49,999 | 0 (0.0%) | 1 (7.7%) |
| $50,000 to $54,999 | 0 (0.0%) | 0 (0.0%) |
| $55,000 to $64,999 | 0 (0.0%) | 2 (15.4%) |
| $65,000 to $74,999 | 0 (0.0%) | 2 (15.4%) |
| $75,000 to $99,999 | 0 (0.0%) | 1 (7.7%) |
| $100,000+ | 6 (35.3%) | 0 (0.0%) |
| Total | 17 (100.0%) | 13 (100.0%) |
Earnings by Sex by Educational Attainment in Hadley
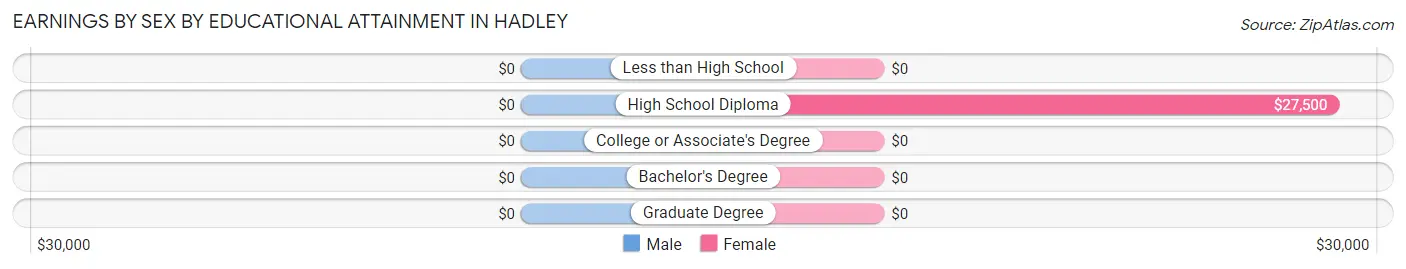
| Educational Attainment | Male Income | Female Income |
| Less than High School | - | - |
| High School Diploma | - | - |
| College or Associate's Degree | - | - |
| Bachelor's Degree | - | - |
| Graduate Degree | - | - |
| Total | - | - |
Family Income in Hadley
Family Income Brackets in Hadley
According to the Hadley family income data, there are 5 families falling into the $25,000 to $34,999 income range, which is the most common income bracket and makes up 38.5% of all families.
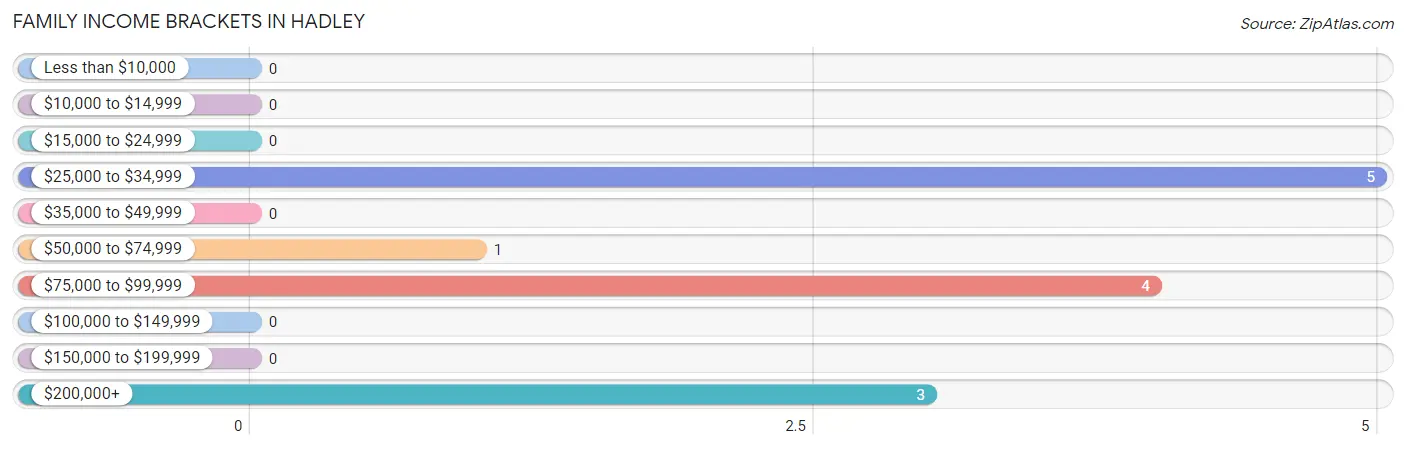
| Income Bracket | # Families | % Families |
| Less than $10,000 | 0 | 0.0% |
| $10,000 to $14,999 | 0 | 0.0% |
| $15,000 to $24,999 | 0 | 0.0% |
| $25,000 to $34,999 | 5 | 38.5% |
| $35,000 to $49,999 | 0 | 0.0% |
| $50,000 to $74,999 | 1 | 7.7% |
| $75,000 to $99,999 | 4 | 30.8% |
| $100,000 to $149,999 | 0 | 0.0% |
| $150,000 to $199,999 | 0 | 0.0% |
| $200,000+ | 3 | 23.1% |
Family Income by Famaliy Size in Hadley
2-person families (10 | 76.9%) account for the highest median family income in Hadley with $66,250 per family, while 2-person families (10 | 76.9%) have the highest median income of $33,125 per family member.
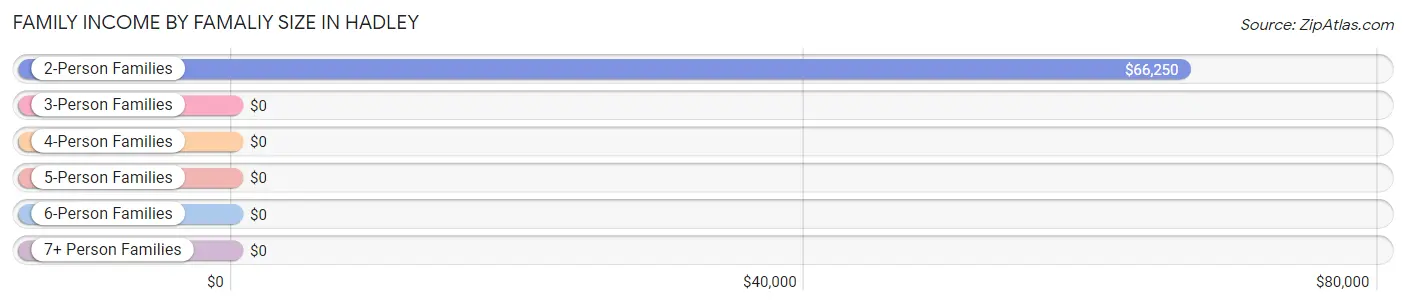
| Income Bracket | # Families | Median Income |
| 2-Person Families | 10 (76.9%) | $66,250 |
| 3-Person Families | 1 (7.7%) | $0 |
| 4-Person Families | 0 (0.0%) | $0 |
| 5-Person Families | 2 (15.4%) | $0 |
| 6-Person Families | 0 (0.0%) | $0 |
| 7+ Person Families | 0 (0.0%) | $0 |
| Total | 13 (100.0%) | $77,917 |
Family Income by Number of Earners in Hadley
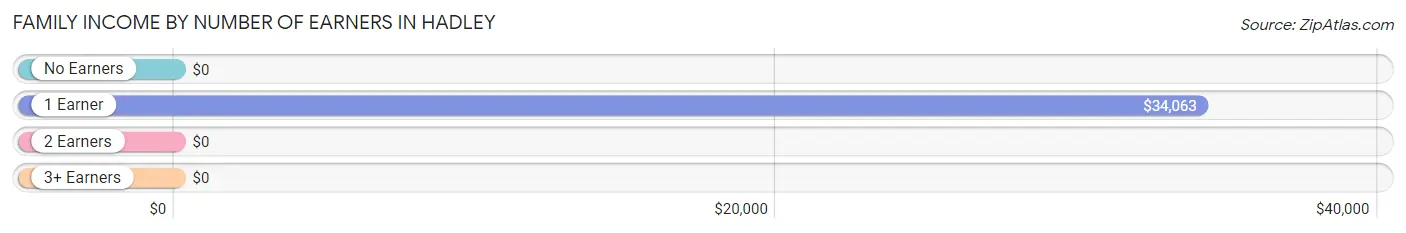
| Number of Earners | # Families | Median Income |
| No Earners | 1 (7.7%) | $0 |
| 1 Earner | 7 (53.8%) | $34,063 |
| 2 Earners | 5 (38.5%) | $0 |
| 3+ Earners | 0 (0.0%) | $0 |
| Total | 13 (100.0%) | $77,917 |
Household Income in Hadley
Household Income Brackets in Hadley
With 6 households falling in the category, the $50,000 to $74,999 income range is the most frequent in Hadley, accounting for 27.3% of all households.
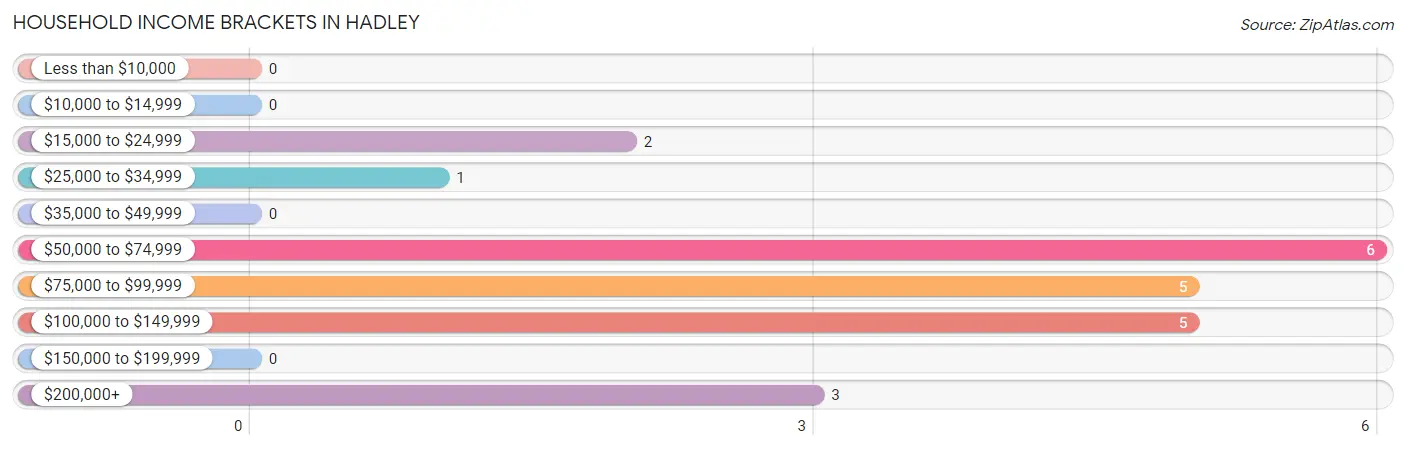
| Income Bracket | # Households | % Households |
| Less than $10,000 | 0 | 0.0% |
| $10,000 to $14,999 | 0 | 0.0% |
| $15,000 to $24,999 | 2 | 9.1% |
| $25,000 to $34,999 | 1 | 4.5% |
| $35,000 to $49,999 | 0 | 0.0% |
| $50,000 to $74,999 | 6 | 27.3% |
| $75,000 to $99,999 | 5 | 22.7% |
| $100,000 to $149,999 | 5 | 22.7% |
| $150,000 to $199,999 | 0 | 0.0% |
| $200,000+ | 3 | 13.6% |
Household Income by Householder Age in Hadley
The median household income in Hadley is $79,167, with the highest median household income of $115,750 found in the 45 to 64 years age bracket for the primary householder. A total of 7 households (31.8%) fall into this category.
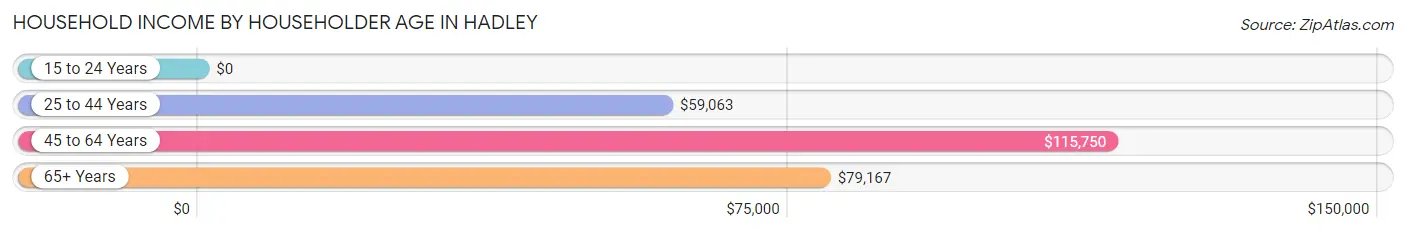
| Income Bracket | # Households | Median Income |
| 15 to 24 Years | 0 (0.0%) | $0 |
| 25 to 44 Years | 7 (31.8%) | $59,063 |
| 45 to 64 Years | 7 (31.8%) | $115,750 |
| 65+ Years | 8 (36.4%) | $79,167 |
| Total | 22 (100.0%) | $79,167 |
Poverty in Hadley
Income Below Poverty by Sex and Age in Hadley
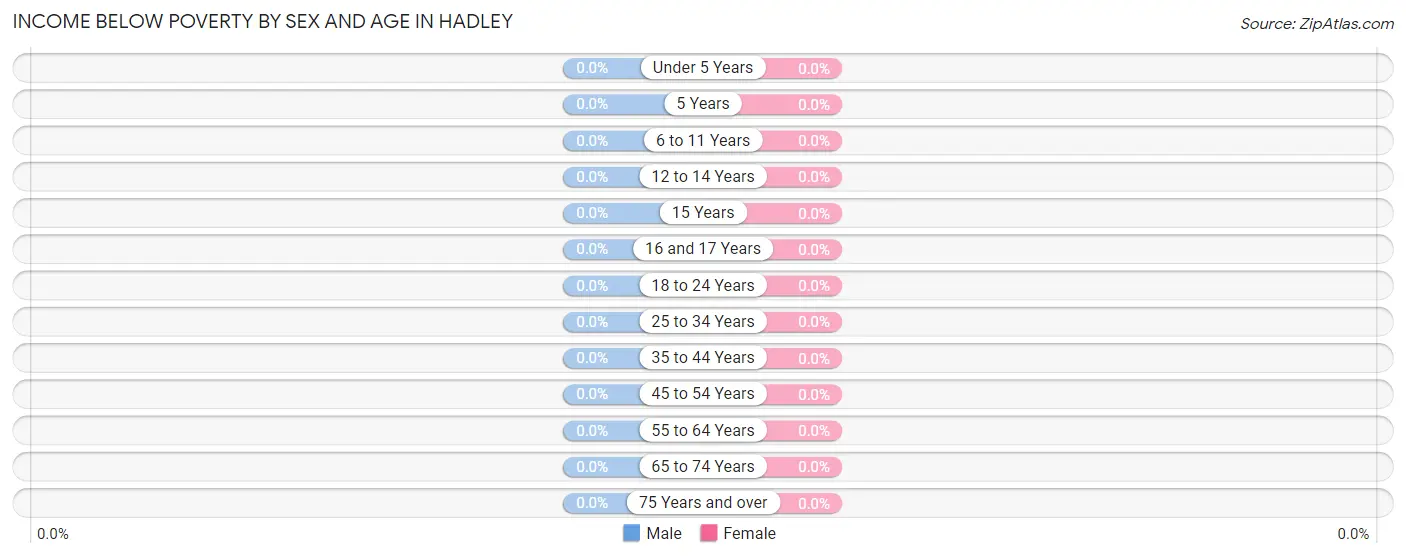
| Age Bracket | Male | Female |
| Under 5 Years | 0 (0.0%) | 0 (0.0%) |
| 5 Years | 0 (0.0%) | 0 (0.0%) |
| 6 to 11 Years | 0 (0.0%) | 0 (0.0%) |
| 12 to 14 Years | 0 (0.0%) | 0 (0.0%) |
| 15 Years | 0 (0.0%) | 0 (0.0%) |
| 16 and 17 Years | 0 (0.0%) | 0 (0.0%) |
| 18 to 24 Years | 0 (0.0%) | 0 (0.0%) |
| 25 to 34 Years | 0 (0.0%) | 0 (0.0%) |
| 35 to 44 Years | 0 (0.0%) | 0 (0.0%) |
| 45 to 54 Years | 0 (0.0%) | 0 (0.0%) |
| 55 to 64 Years | 0 (0.0%) | 0 (0.0%) |
| 65 to 74 Years | 0 (0.0%) | 0 (0.0%) |
| 75 Years and over | 0 (0.0%) | 0 (0.0%) |
| Total | 0 (0.0%) | 0 (0.0%) |
Income Above Poverty by Sex and Age in Hadley
According to the poverty statistics in Hadley, males aged 6 to 11 years and females aged under 5 years are the age groups that are most secure financially, with 100.0% of males and 100.0% of females in these age groups living above the poverty line.
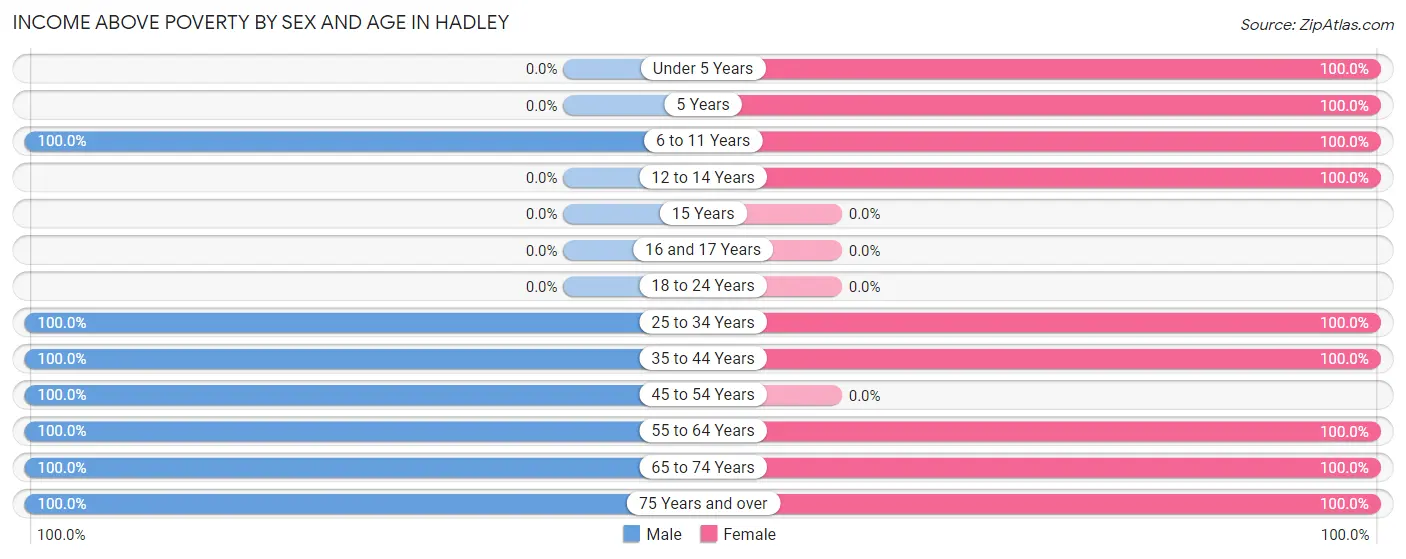
| Age Bracket | Male | Female |
| Under 5 Years | 0 (0.0%) | 3 (100.0%) |
| 5 Years | 0 (0.0%) | 1 (100.0%) |
| 6 to 11 Years | 2 (100.0%) | 1 (100.0%) |
| 12 to 14 Years | 0 (0.0%) | 1 (100.0%) |
| 15 Years | 0 (0.0%) | 0 (0.0%) |
| 16 and 17 Years | 0 (0.0%) | 0 (0.0%) |
| 18 to 24 Years | 0 (0.0%) | 0 (0.0%) |
| 25 to 34 Years | 4 (100.0%) | 5 (100.0%) |
| 35 to 44 Years | 1 (100.0%) | 2 (100.0%) |
| 45 to 54 Years | 1 (100.0%) | 0 (0.0%) |
| 55 to 64 Years | 6 (100.0%) | 5 (100.0%) |
| 65 to 74 Years | 4 (100.0%) | 2 (100.0%) |
| 75 Years and over | 3 (100.0%) | 2 (100.0%) |
| Total | 21 (100.0%) | 22 (100.0%) |
Income Below Poverty Among Married-Couple Families in Hadley
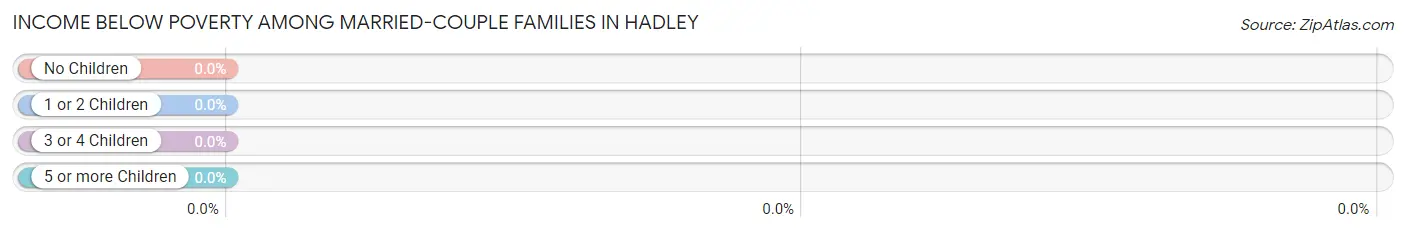
| Children | Above Poverty | Below Poverty |
| No Children | 6 (100.0%) | 0 (0.0%) |
| 1 or 2 Children | 0 (0.0%) | 0 (0.0%) |
| 3 or 4 Children | 2 (100.0%) | 0 (0.0%) |
| 5 or more Children | 0 (0.0%) | 0 (0.0%) |
| Total | 8 (100.0%) | 0 (0.0%) |
Income Below Poverty Among Single-Parent Households in Hadley
| Children | Single Father | Single Mother |
| No Children | 0 (0.0%) | 0 (0.0%) |
| 1 or 2 Children | 0 (0.0%) | 0 (0.0%) |
| 3 or 4 Children | 0 (0.0%) | 0 (0.0%) |
| 5 or more Children | 0 (0.0%) | 0 (0.0%) |
| Total | 0 (0.0%) | 0 (0.0%) |
Income Below Poverty Among Married-Couple vs Single-Parent Households in Hadley
| Children | Married-Couple Families | Single-Parent Households |
| No Children | 0 (0.0%) | 0 (0.0%) |
| 1 or 2 Children | 0 (0.0%) | 0 (0.0%) |
| 3 or 4 Children | 0 (0.0%) | 0 (0.0%) |
| 5 or more Children | 0 (0.0%) | 0 (0.0%) |
| Total | 0 (0.0%) | 0 (0.0%) |
Race in Hadley
The most populous races in Hadley are , and White / Caucasian (43 | 100.0%).
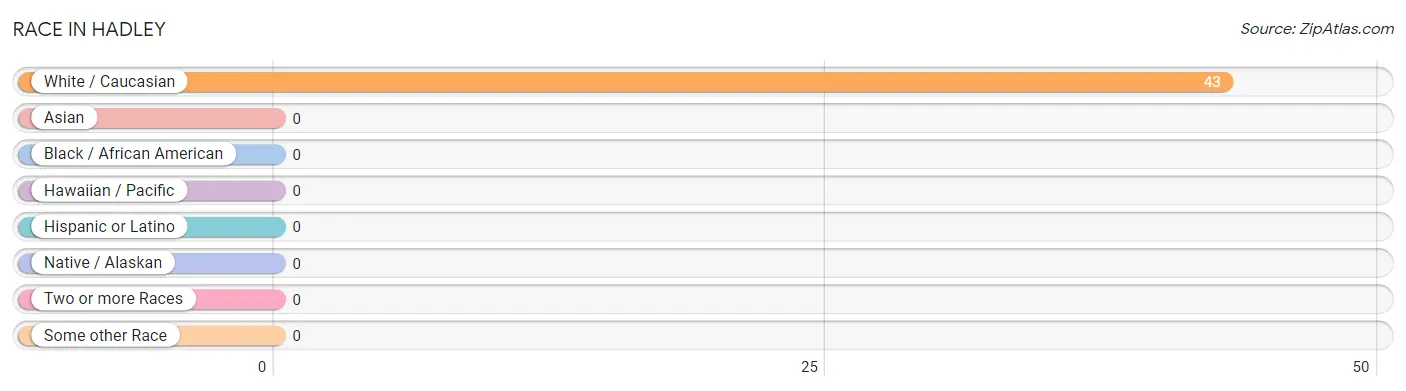
| Race | # Population | % Population |
| Asian | 0 | 0.0% |
| Black / African American | 0 | 0.0% |
| Hawaiian / Pacific | 0 | 0.0% |
| Hispanic or Latino | 0 | 0.0% |
| Native / Alaskan | 0 | 0.0% |
| White / Caucasian | 43 | 100.0% |
| Two or more Races | 0 | 0.0% |
| Some other Race | 0 | 0.0% |
| Total | 43 | 100.0% |
Ancestry in Hadley
The most populous ancestries reported in Hadley are German (30 | 69.8%), Dutch (12 | 27.9%), Norwegian (10 | 23.3%), Danish (6 | 14.0%), and Swedish (6 | 14.0%), together accounting for 148.8% of all Hadley residents.
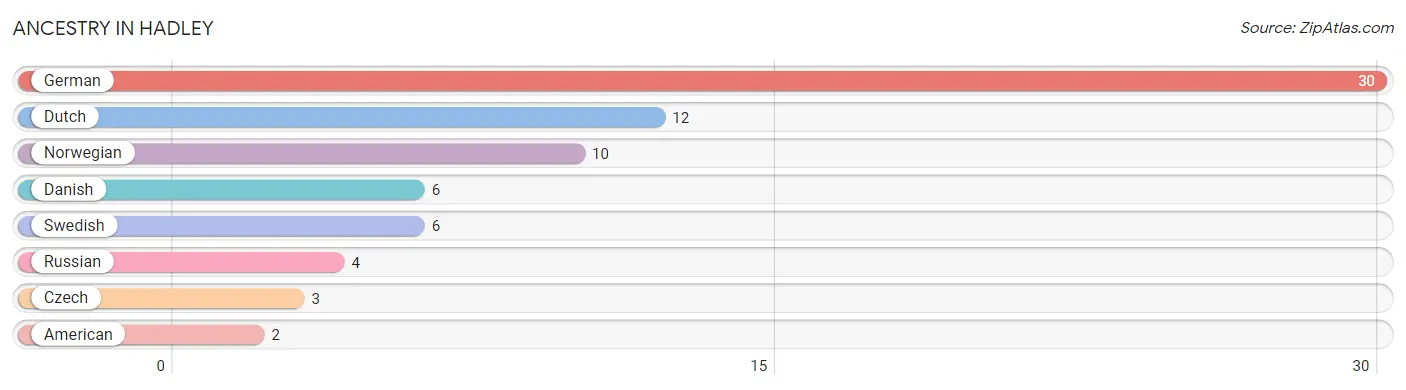
| Ancestry | # Population | % Population |
| American | 2 | 4.6% |
| Czech | 3 | 7.0% |
| Danish | 6 | 14.0% |
| Dutch | 12 | 27.9% |
| German | 30 | 69.8% |
| Norwegian | 10 | 23.3% |
| Russian | 4 | 9.3% |
| Swedish | 6 | 14.0% | View All 8 Rows |
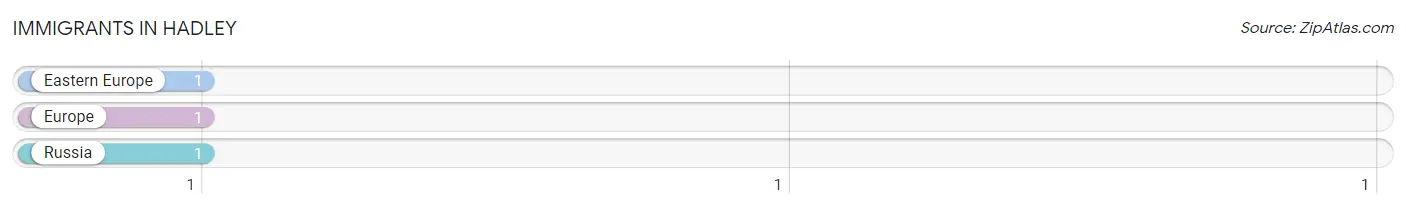
Immigrants in Hadley
The most numerous immigrant groups reported in Hadley came from Eastern Europe (1 | 2.3%), Europe (1 | 2.3%), and Russia (1 | 2.3%), together accounting for 7.0% of all Hadley residents.
| Immigration Origin | # Population | % Population |
| Eastern Europe | 1 | 2.3% |
| Europe | 1 | 2.3% |
| Russia | 1 | 2.3% | View All 3 Rows |
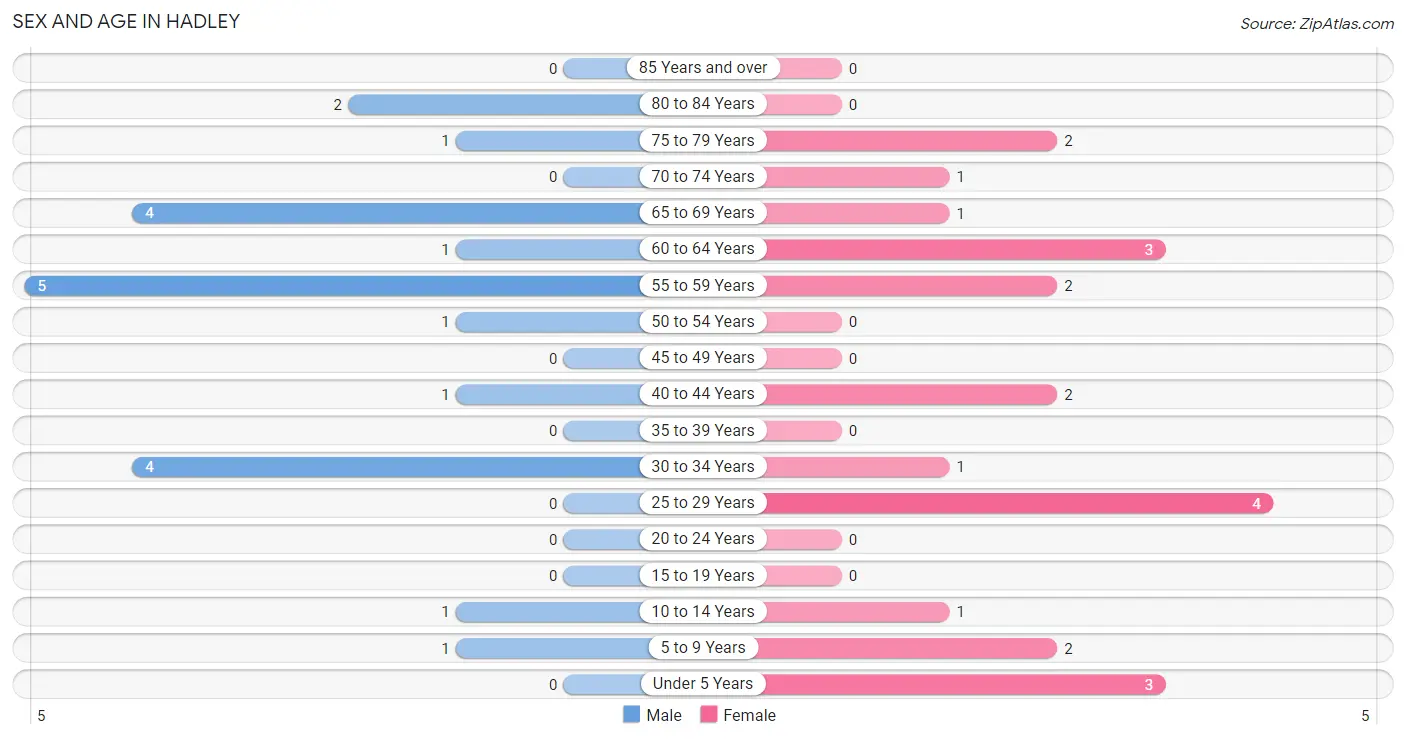
Sex and Age in Hadley
Sex and Age in Hadley
The most populous age groups in Hadley are 55 to 59 Years (5 | 23.8%) for men and 25 to 29 Years (4 | 18.2%) for women.
| Age Bracket | Male | Female |
| Under 5 Years | 0 (0.0%) | 3 (13.6%) |
| 5 to 9 Years | 1 (4.8%) | 2 (9.1%) |
| 10 to 14 Years | 1 (4.8%) | 1 (4.5%) |
| 15 to 19 Years | 0 (0.0%) | 0 (0.0%) |
| 20 to 24 Years | 0 (0.0%) | 0 (0.0%) |
| 25 to 29 Years | 0 (0.0%) | 4 (18.2%) |
| 30 to 34 Years | 4 (19.1%) | 1 (4.5%) |
| 35 to 39 Years | 0 (0.0%) | 0 (0.0%) |
| 40 to 44 Years | 1 (4.8%) | 2 (9.1%) |
| 45 to 49 Years | 0 (0.0%) | 0 (0.0%) |
| 50 to 54 Years | 1 (4.8%) | 0 (0.0%) |
| 55 to 59 Years | 5 (23.8%) | 2 (9.1%) |
| 60 to 64 Years | 1 (4.8%) | 3 (13.6%) |
| 65 to 69 Years | 4 (19.1%) | 1 (4.5%) |
| 70 to 74 Years | 0 (0.0%) | 1 (4.5%) |
| 75 to 79 Years | 1 (4.8%) | 2 (9.1%) |
| 80 to 84 Years | 2 (9.5%) | 0 (0.0%) |
| 85 Years and over | 0 (0.0%) | 0 (0.0%) |
| Total | 21 (100.0%) | 22 (100.0%) |
Families and Households in Hadley
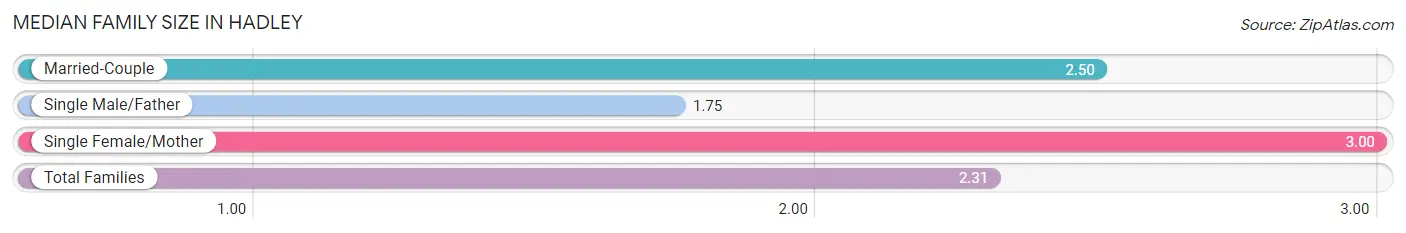
Median Family Size in Hadley
The median family size in Hadley is 2.31 persons per family, with single female/mother families (1 | 7.7%) accounting for the largest median family size of 3 persons per family. On the other hand, single male/father families (4 | 30.8%) represent the smallest median family size with 1.75 persons per family.
| Family Type | # Families | Family Size |
| Married-Couple | 8 (61.5%) | 2.50 |
| Single Male/Father | 4 (30.8%) | 1.75 |
| Single Female/Mother | 1 (7.7%) | 3.00 |
| Total Families | 13 (100.0%) | 2.31 |
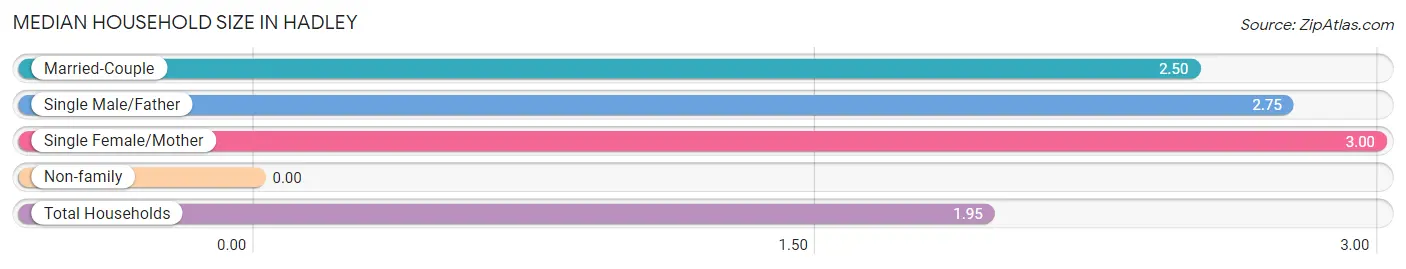
Median Household Size in Hadley
| Household Type | # Households | Household Size |
| Married-Couple | 8 (36.4%) | 2.50 |
| Single Male/Father | 4 (18.2%) | 2.75 |
| Single Female/Mother | 1 (4.5%) | 3.00 |
| Non-family | 9 (40.9%) | - |
| Total Households | 22 (100.0%) | 1.95 |
Household Size by Marriage Status in Hadley
Out of a total of 22 households in Hadley, 13 (59.1%) are family households, while 9 (40.9%) are nonfamily households. The most numerous type of family households are 2-person households, comprising 6, and the most common type of nonfamily households are 1-person households, comprising 9.
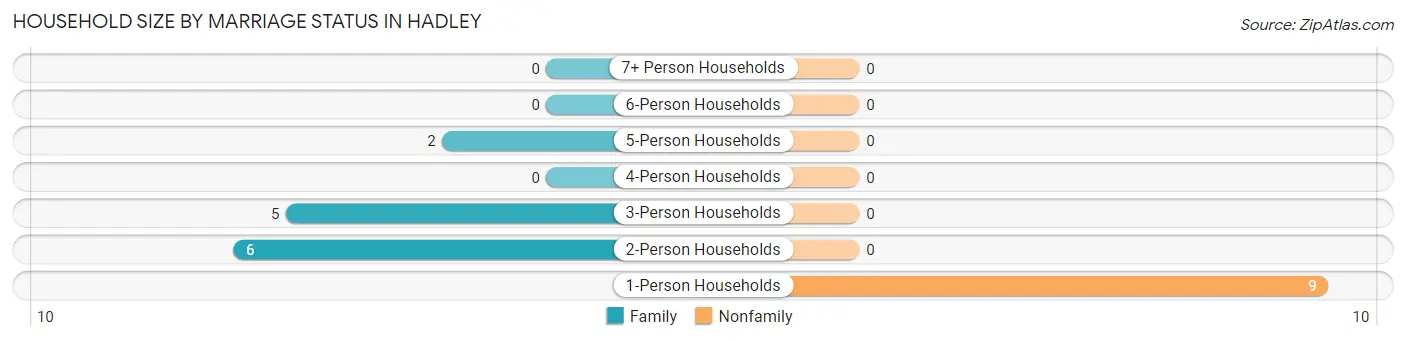
| Household Size | Family Households | Nonfamily Households |
| 1-Person Households | - | 9 (40.9%) |
| 2-Person Households | 6 (27.3%) | 0 (0.0%) |
| 3-Person Households | 5 (22.7%) | 0 (0.0%) |
| 4-Person Households | 0 (0.0%) | 0 (0.0%) |
| 5-Person Households | 2 (9.1%) | 0 (0.0%) |
| 6-Person Households | 0 (0.0%) | 0 (0.0%) |
| 7+ Person Households | 0 (0.0%) | 0 (0.0%) |
| Total | 13 (59.1%) | 9 (40.9%) |
Female Fertility in Hadley
Fertility by Age in Hadley
| Age Bracket | Women with Births | Births / 1,000 Women |
| 15 to 19 years | 0 (0.0%) | 0.0 |
| 20 to 34 years | 0 (0.0%) | 0.0 |
| 35 to 50 years | 0 (0.0%) | 0.0 |
| Total | 0 (0.0%) | 0.0 |
Fertility by Age by Marriage Status in Hadley
| Age Bracket | Married | Unmarried |
| 15 to 19 years | 0 (0.0%) | 0 (0.0%) |
| 20 to 34 years | 0 (0.0%) | 0 (0.0%) |
| 35 to 50 years | 0 (0.0%) | 0 (0.0%) |
| Total | 0 (0.0%) | 0 (0.0%) |
Fertility by Education in Hadley
| Educational Attainment | Women with Births | Births / 1,000 Women |
| Less than High School | 0 (0.0%) | 0.0 |
| High School Diploma | 0 (0.0%) | 0.0 |
| College or Associate's Degree | 0 (0.0%) | 0.0 |
| Bachelor's Degree | 0 (0.0%) | 0.0 |
| Graduate Degree | 0 (0.0%) | 0.0 |
| Total | 0 (0.0%) | 0.0 |
Fertility by Education by Marriage Status in Hadley
| Educational Attainment | Married | Unmarried |
| Less than High School | 0 (0.0%) | 0 (0.0%) |
| High School Diploma | 0 (0.0%) | 0 (0.0%) |
| College or Associate's Degree | 0 (0.0%) | 0 (0.0%) |
| Bachelor's Degree | 0 (0.0%) | 0 (0.0%) |
| Graduate Degree | 0 (0.0%) | 0 (0.0%) |
| Total | 0 (0.0%) | 0 (0.0%) |
Employment Characteristics in Hadley
Employment by Class of Employer in Hadley
Among the 30 employed individuals in Hadley, private company employees (24 | 80.0%), not-for-profit organizations (4 | 13.3%), and local government employees (2 | 6.7%) make up the most common classes of employment.
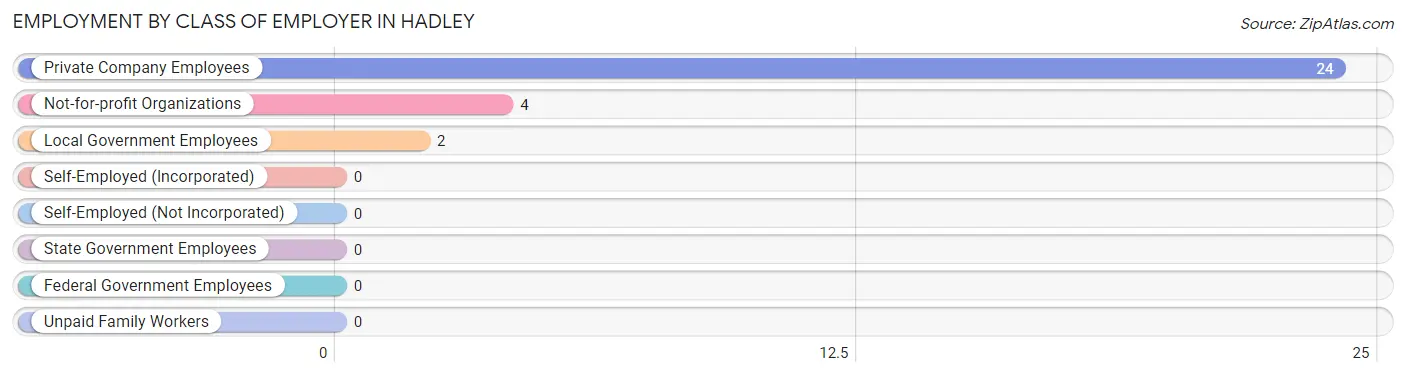
| Employer Class | # Employees | % Employees |
| Private Company Employees | 24 | 80.0% |
| Self-Employed (Incorporated) | 0 | 0.0% |
| Self-Employed (Not Incorporated) | 0 | 0.0% |
| Not-for-profit Organizations | 4 | 13.3% |
| Local Government Employees | 2 | 6.7% |
| State Government Employees | 0 | 0.0% |
| Federal Government Employees | 0 | 0.0% |
| Unpaid Family Workers | 0 | 0.0% |
| Total | 30 | 100.0% |
Employment Status by Age in Hadley
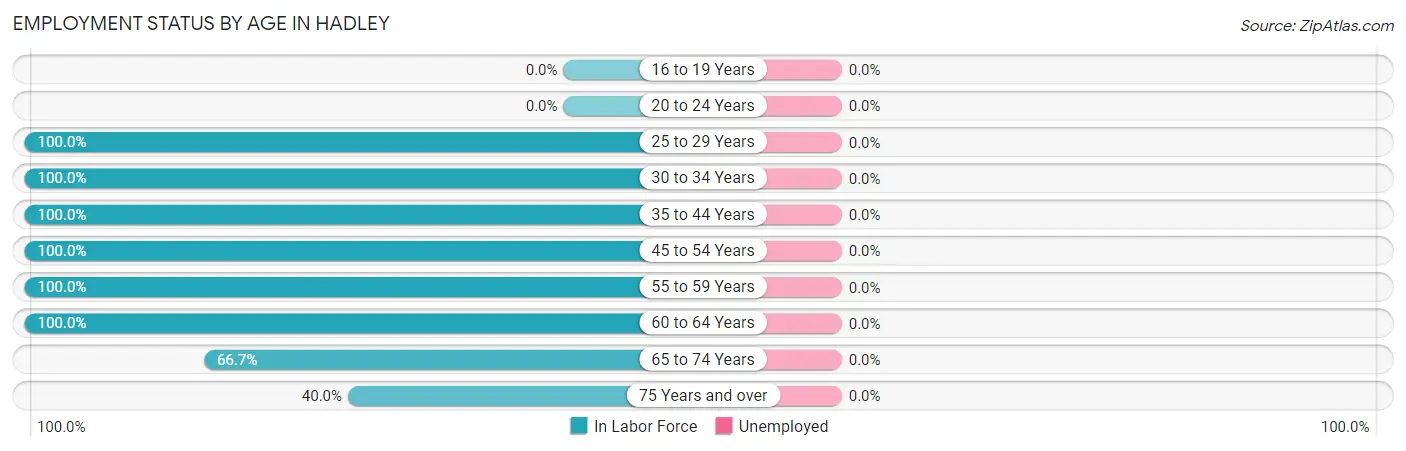
| Age Bracket | In Labor Force | Unemployed |
| 16 to 19 Years | 0 (0.0%) | 0 (0.0%) |
| 20 to 24 Years | 0 (0.0%) | 0 (0.0%) |
| 25 to 29 Years | 4 (100.0%) | 0 (0.0%) |
| 30 to 34 Years | 5 (100.0%) | 0 (0.0%) |
| 35 to 44 Years | 3 (100.0%) | 0 (0.0%) |
| 45 to 54 Years | 1 (100.0%) | 0 (0.0%) |
| 55 to 59 Years | 7 (100.0%) | 0 (0.0%) |
| 60 to 64 Years | 4 (100.0%) | 0 (0.0%) |
| 65 to 74 Years | 4 (66.7%) | 0 (0.0%) |
| 75 Years and over | 2 (40.0%) | 0 (0.0%) |
| Total | 30 (85.7%) | 0 (0.0%) |
Employment Status by Educational Attainment in Hadley
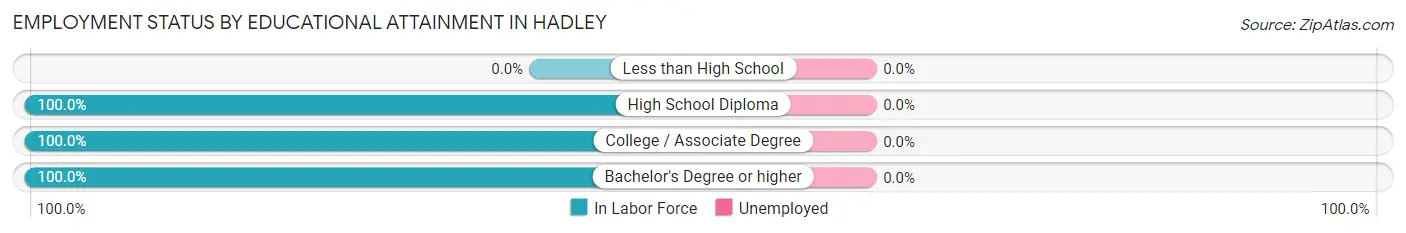
| Educational Attainment | In Labor Force | Unemployed |
| Less than High School | 0 (0.0%) | 0 (0.0%) |
| High School Diploma | 8 (100.0%) | 0 (0.0%) |
| College / Associate Degree | 12 (100.0%) | 0 (0.0%) |
| Bachelor's Degree or higher | 4 (100.0%) | 0 (0.0%) |
| Total | 24 (100.0%) | 0 (0.0%) |
Employment Occupations by Sex in Hadley
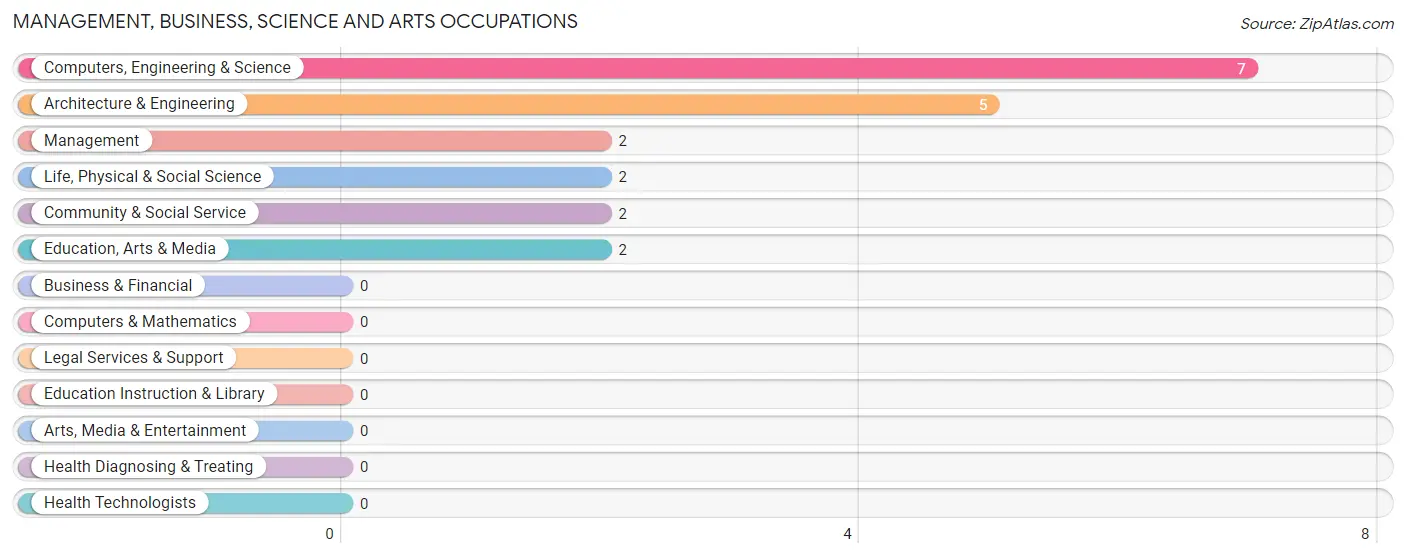
Management, Business, Science and Arts Occupations
The most common Management, Business, Science and Arts occupations in Hadley are Computers, Engineering & Science (7 | 23.3%), Architecture & Engineering (5 | 16.7%), Management (2 | 6.7%), Life, Physical & Social Science (2 | 6.7%), and Community & Social Service (2 | 6.7%).
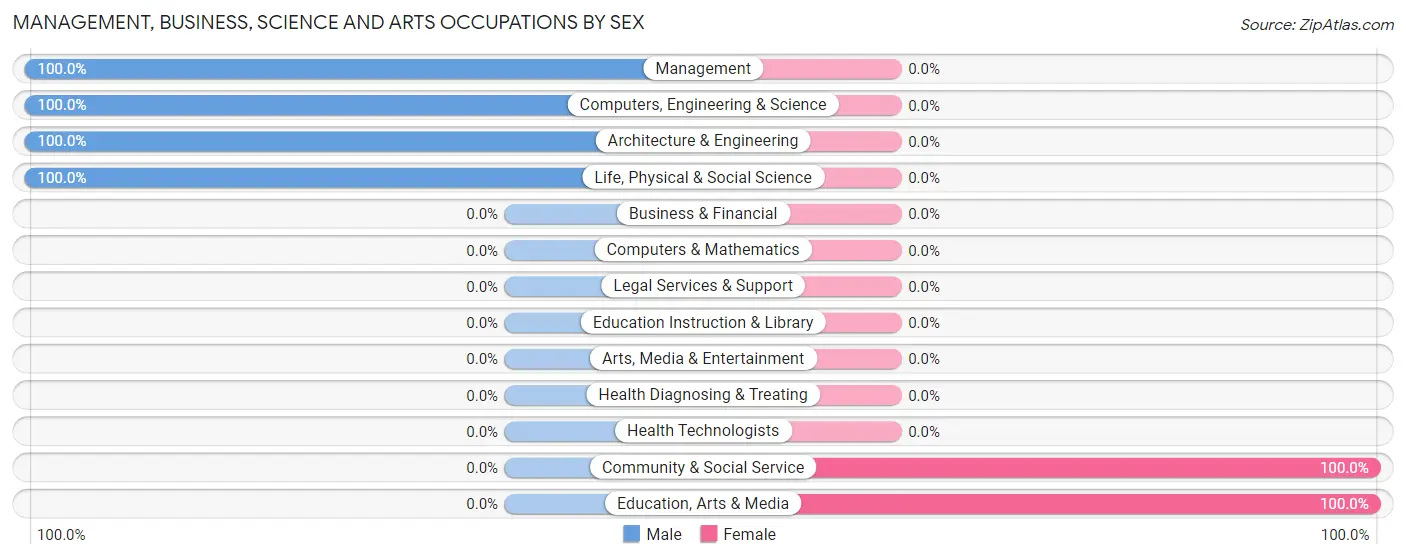
Management, Business, Science and Arts Occupations by Sex
Within the Management, Business, Science and Arts occupations in Hadley, the most male-oriented occupations are Management (100.0%), Computers, Engineering & Science (100.0%), and Architecture & Engineering (100.0%), while the most female-oriented occupations are Community & Social Service (100.0%), and Education, Arts & Media (100.0%).
| Occupation | Male | Female |
| Management | 2 (100.0%) | 0 (0.0%) |
| Business & Financial | 0 (0.0%) | 0 (0.0%) |
| Computers, Engineering & Science | 7 (100.0%) | 0 (0.0%) |
| Computers & Mathematics | 0 (0.0%) | 0 (0.0%) |
| Architecture & Engineering | 5 (100.0%) | 0 (0.0%) |
| Life, Physical & Social Science | 2 (100.0%) | 0 (0.0%) |
| Community & Social Service | 0 (0.0%) | 2 (100.0%) |
| Education, Arts & Media | 0 (0.0%) | 2 (100.0%) |
| Legal Services & Support | 0 (0.0%) | 0 (0.0%) |
| Education Instruction & Library | 0 (0.0%) | 0 (0.0%) |
| Arts, Media & Entertainment | 0 (0.0%) | 0 (0.0%) |
| Health Diagnosing & Treating | 0 (0.0%) | 0 (0.0%) |
| Health Technologists | 0 (0.0%) | 0 (0.0%) |
| Total (Category) | 9 (81.8%) | 2 (18.2%) |
| Total (Overall) | 17 (56.7%) | 13 (43.3%) |
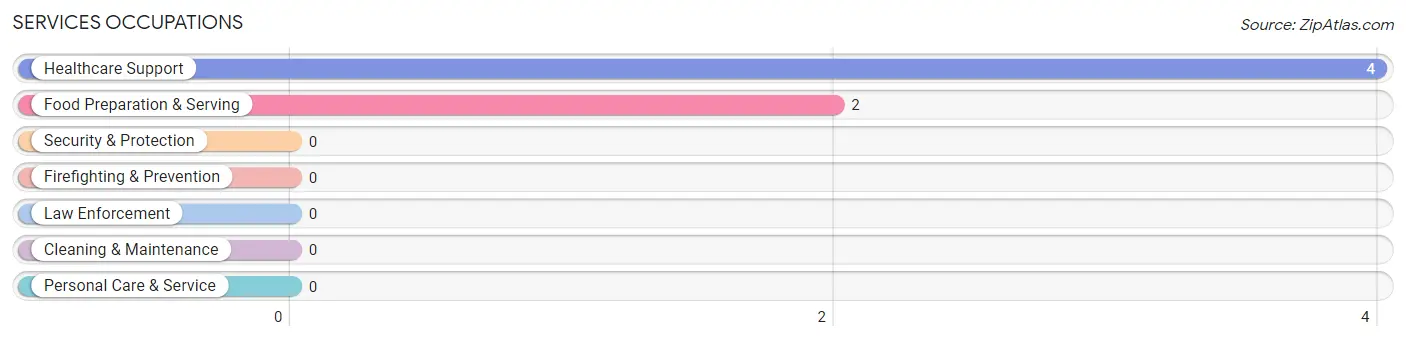
Services Occupations
The most common Services occupations in Hadley are Healthcare Support (4 | 13.3%), and Food Preparation & Serving (2 | 6.7%).
Services Occupations by Sex
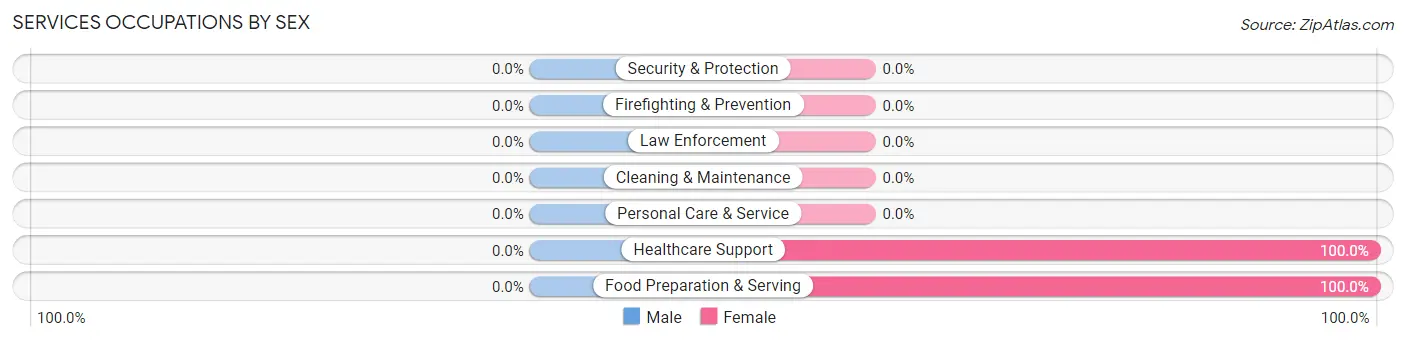
| Occupation | Male | Female |
| Healthcare Support | 0 (0.0%) | 4 (100.0%) |
| Security & Protection | 0 (0.0%) | 0 (0.0%) |
| Firefighting & Prevention | 0 (0.0%) | 0 (0.0%) |
| Law Enforcement | 0 (0.0%) | 0 (0.0%) |
| Food Preparation & Serving | 0 (0.0%) | 2 (100.0%) |
| Cleaning & Maintenance | 0 (0.0%) | 0 (0.0%) |
| Personal Care & Service | 0 (0.0%) | 0 (0.0%) |
| Total (Category) | 0 (0.0%) | 6 (100.0%) |
| Total (Overall) | 17 (56.7%) | 13 (43.3%) |
Sales and Office Occupations
The most common Sales and Office occupations in Hadley are Office & Administration (3 | 10.0%), and Sales & Related (1 | 3.3%).
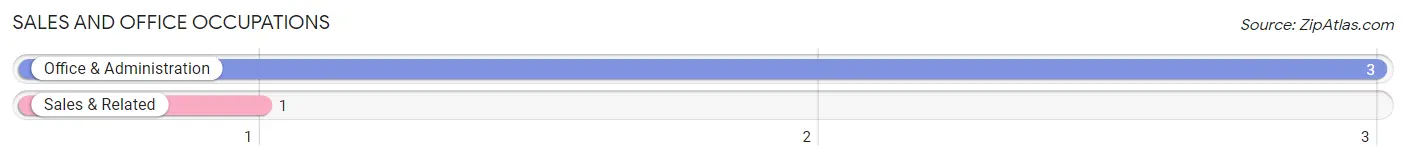
Sales and Office Occupations by Sex
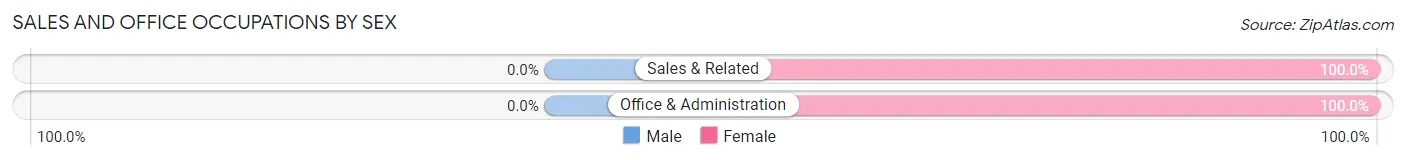
| Occupation | Male | Female |
| Sales & Related | 0 (0.0%) | 1 (100.0%) |
| Office & Administration | 0 (0.0%) | 3 (100.0%) |
| Total (Category) | 0 (0.0%) | 4 (100.0%) |
| Total (Overall) | 17 (56.7%) | 13 (43.3%) |
Natural Resources, Construction and Maintenance Occupations
The most common Natural Resources, Construction and Maintenance occupations in Hadley are Construction & Extraction (4 | 13.3%), Farming, Fishing & Forestry (2 | 6.7%), and Installation, Maintenance & Repair (1 | 3.3%).
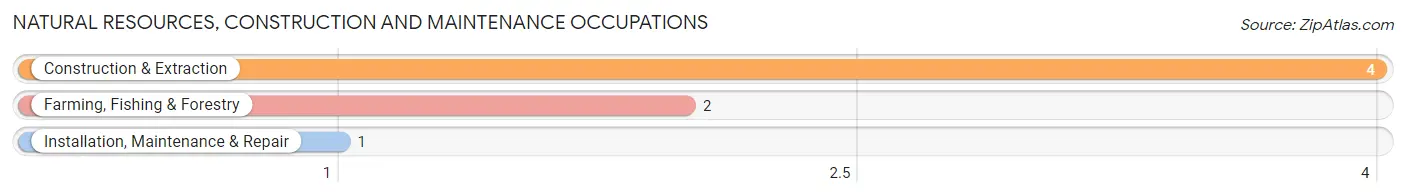
Natural Resources, Construction and Maintenance Occupations by Sex
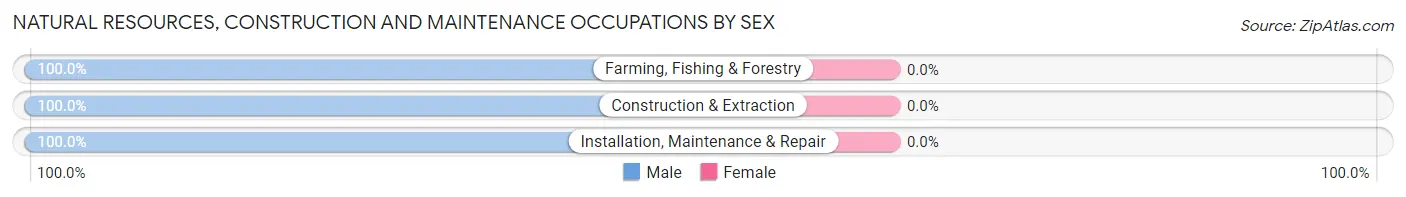
| Occupation | Male | Female |
| Farming, Fishing & Forestry | 2 (100.0%) | 0 (0.0%) |
| Construction & Extraction | 4 (100.0%) | 0 (0.0%) |
| Installation, Maintenance & Repair | 1 (100.0%) | 0 (0.0%) |
| Total (Category) | 7 (100.0%) | 0 (0.0%) |
| Total (Overall) | 17 (56.7%) | 13 (43.3%) |
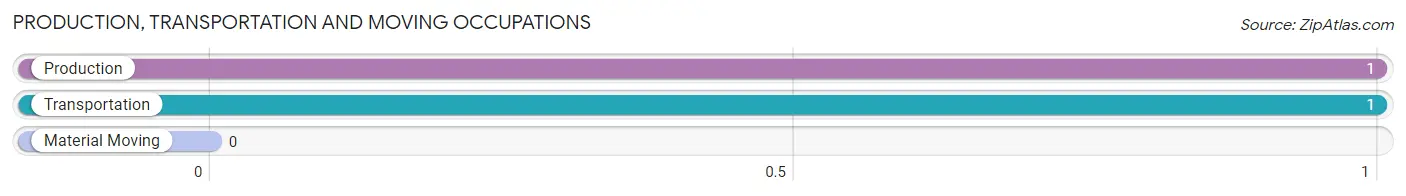
Production, Transportation and Moving Occupations
The most common Production, Transportation and Moving occupations in Hadley are Production (1 | 3.3%), and Transportation (1 | 3.3%).
Production, Transportation and Moving Occupations by Sex
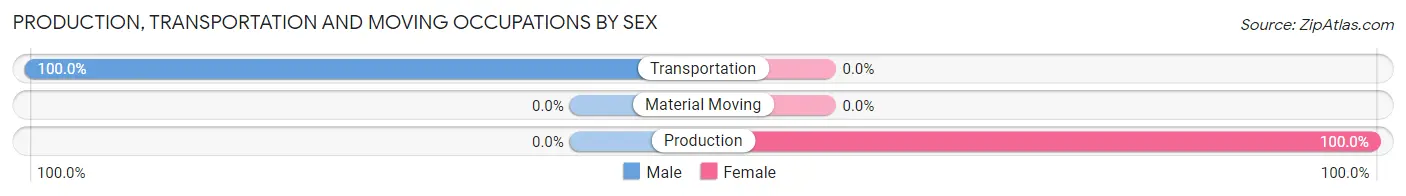
| Occupation | Male | Female |
| Production | 0 (0.0%) | 1 (100.0%) |
| Transportation | 1 (100.0%) | 0 (0.0%) |
| Material Moving | 0 (0.0%) | 0 (0.0%) |
| Total (Category) | 1 (50.0%) | 1 (50.0%) |
| Total (Overall) | 17 (56.7%) | 13 (43.3%) |
Employment Industries by Sex in Hadley
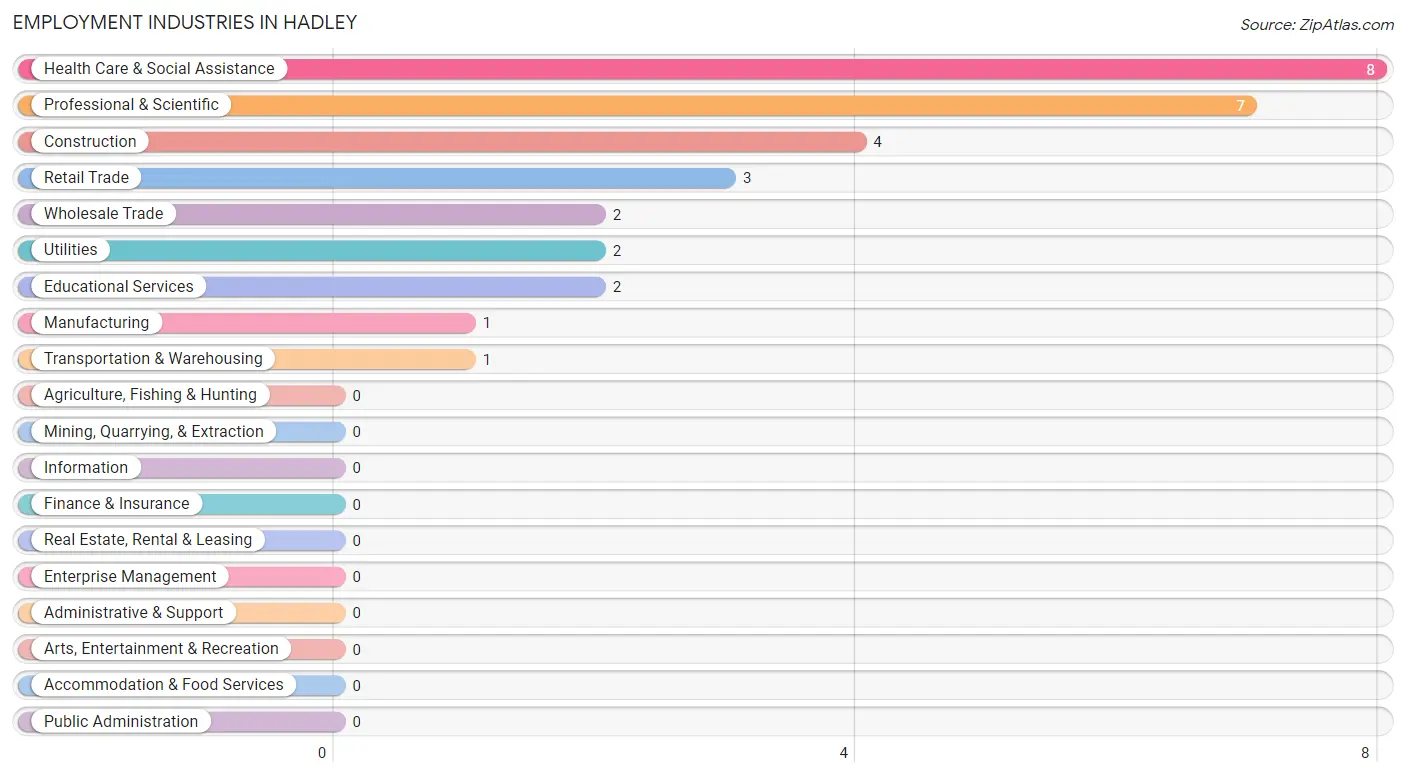
Employment Industries in Hadley
The major employment industries in Hadley include Health Care & Social Assistance (8 | 26.7%), Professional & Scientific (7 | 23.3%), Construction (4 | 13.3%), Retail Trade (3 | 10.0%), and Wholesale Trade (2 | 6.7%).
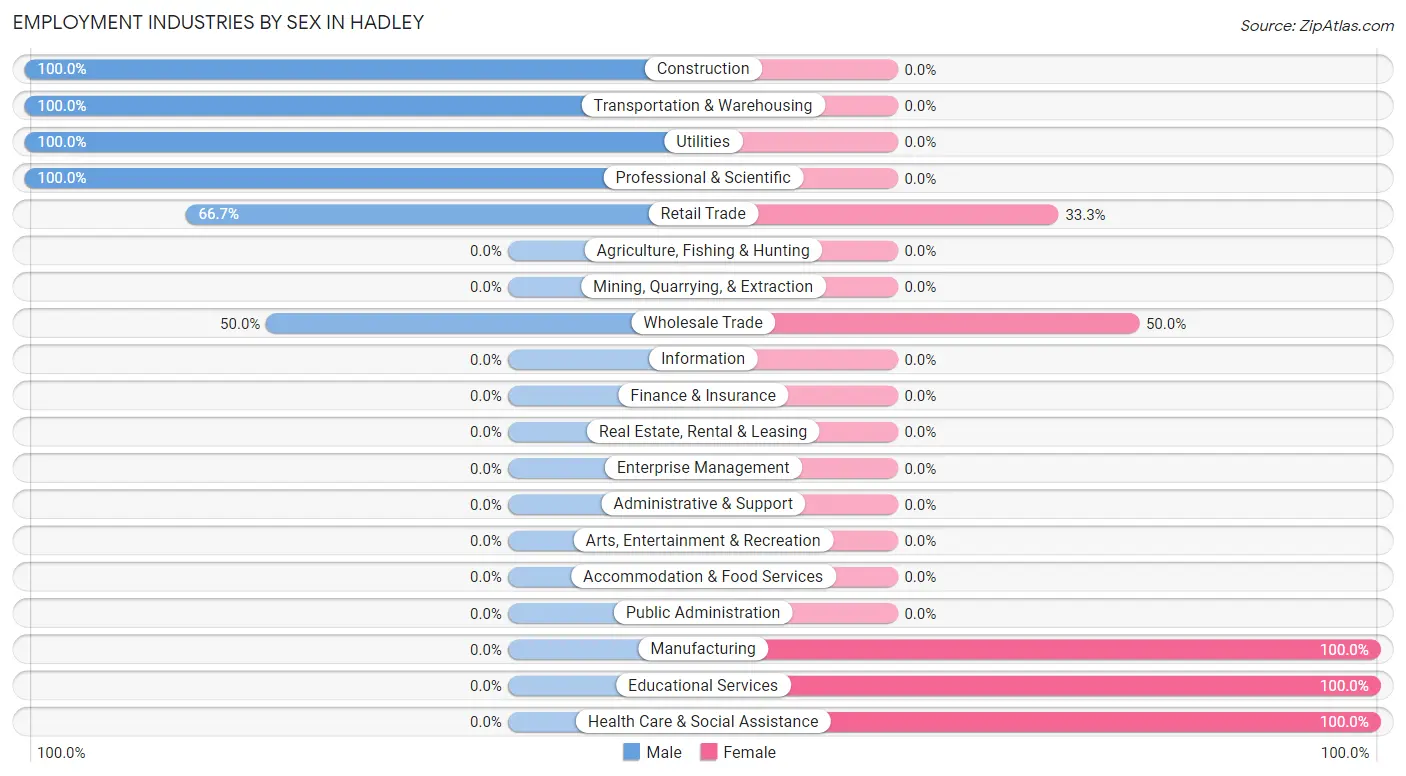
Employment Industries by Sex in Hadley
The Hadley industries that see more men than women are Construction (100.0%), Transportation & Warehousing (100.0%), and Utilities (100.0%), whereas the industries that tend to have a higher number of women are Manufacturing (100.0%), Educational Services (100.0%), and Health Care & Social Assistance (100.0%).
| Industry | Male | Female |
| Agriculture, Fishing & Hunting | 0 (0.0%) | 0 (0.0%) |
| Mining, Quarrying, & Extraction | 0 (0.0%) | 0 (0.0%) |
| Construction | 4 (100.0%) | 0 (0.0%) |
| Manufacturing | 0 (0.0%) | 1 (100.0%) |
| Wholesale Trade | 1 (50.0%) | 1 (50.0%) |
| Retail Trade | 2 (66.7%) | 1 (33.3%) |
| Transportation & Warehousing | 1 (100.0%) | 0 (0.0%) |
| Utilities | 2 (100.0%) | 0 (0.0%) |
| Information | 0 (0.0%) | 0 (0.0%) |
| Finance & Insurance | 0 (0.0%) | 0 (0.0%) |
| Real Estate, Rental & Leasing | 0 (0.0%) | 0 (0.0%) |
| Professional & Scientific | 7 (100.0%) | 0 (0.0%) |
| Enterprise Management | 0 (0.0%) | 0 (0.0%) |
| Administrative & Support | 0 (0.0%) | 0 (0.0%) |
| Educational Services | 0 (0.0%) | 2 (100.0%) |
| Health Care & Social Assistance | 0 (0.0%) | 8 (100.0%) |
| Arts, Entertainment & Recreation | 0 (0.0%) | 0 (0.0%) |
| Accommodation & Food Services | 0 (0.0%) | 0 (0.0%) |
| Public Administration | 0 (0.0%) | 0 (0.0%) |
| Total | 17 (56.7%) | 13 (43.3%) |
Education in Hadley
School Enrollment in Hadley
The most common levels of schooling among the 5 students in Hadley are elementary school (2 | 40.0%), middle school (2 | 40.0%), and nursery / preschool (1 | 20.0%).
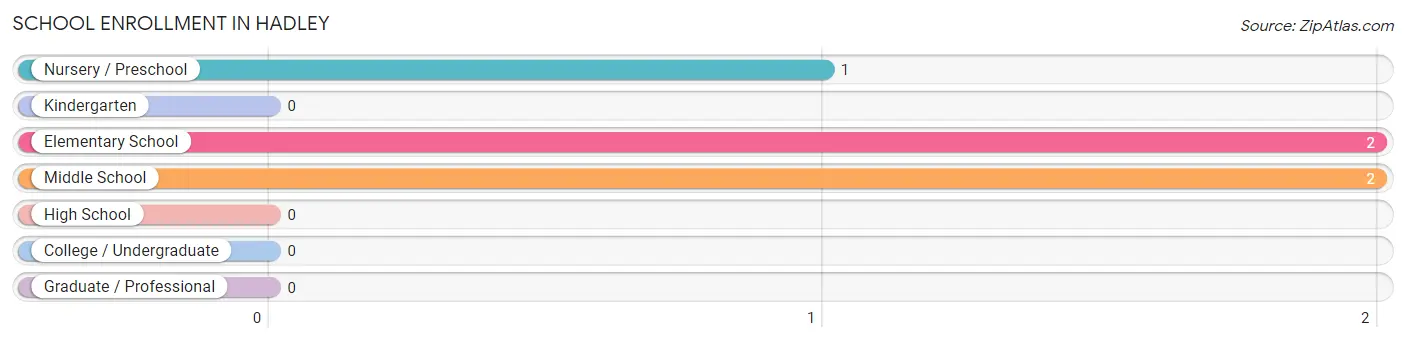
| School Level | # Students | % Students |
| Nursery / Preschool | 1 | 20.0% |
| Kindergarten | 0 | 0.0% |
| Elementary School | 2 | 40.0% |
| Middle School | 2 | 40.0% |
| High School | 0 | 0.0% |
| College / Undergraduate | 0 | 0.0% |
| Graduate / Professional | 0 | 0.0% |
| Total | 5 | 100.0% |
School Enrollment by Age by Funding Source in Hadley
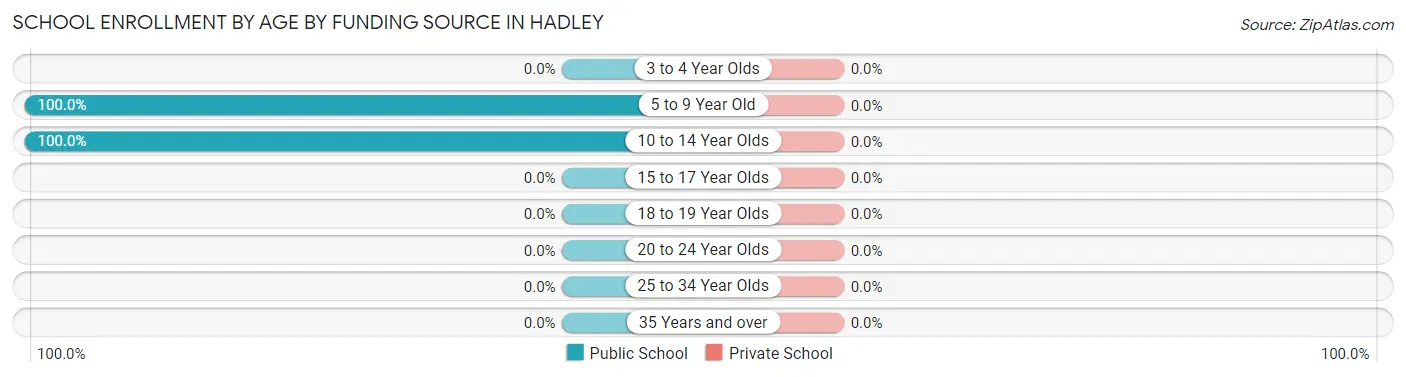
| Age Bracket | Public School | Private School |
| 3 to 4 Year Olds | 0 (0.0%) | 0 (0.0%) |
| 5 to 9 Year Old | 3 (100.0%) | 0 (0.0%) |
| 10 to 14 Year Olds | 2 (100.0%) | 0 (0.0%) |
| 15 to 17 Year Olds | 0 (0.0%) | 0 (0.0%) |
| 18 to 19 Year Olds | 0 (0.0%) | 0 (0.0%) |
| 20 to 24 Year Olds | 0 (0.0%) | 0 (0.0%) |
| 25 to 34 Year Olds | 0 (0.0%) | 0 (0.0%) |
| 35 Years and over | 0 (0.0%) | 0 (0.0%) |
| Total | 5 (100.0%) | 0 (0.0%) |
Educational Attainment by Field of Study in Hadley
Business (3 | 37.5%), bio, nature & agricultural (2 | 25.0%), arts & humanities (2 | 25.0%), and education (1 | 12.5%) are the most common fields of study among 8 individuals in Hadley who have obtained a bachelor's degree or higher.
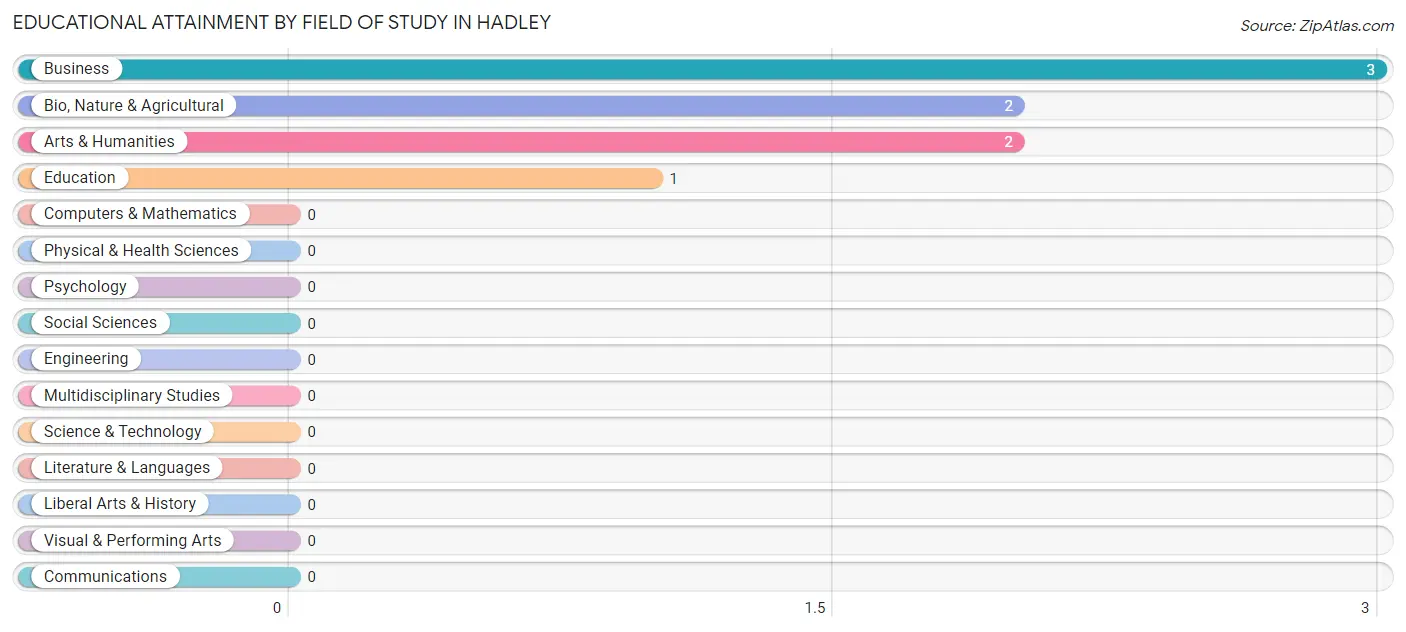
| Field of Study | # Graduates | % Graduates |
| Computers & Mathematics | 0 | 0.0% |
| Bio, Nature & Agricultural | 2 | 25.0% |
| Physical & Health Sciences | 0 | 0.0% |
| Psychology | 0 | 0.0% |
| Social Sciences | 0 | 0.0% |
| Engineering | 0 | 0.0% |
| Multidisciplinary Studies | 0 | 0.0% |
| Science & Technology | 0 | 0.0% |
| Business | 3 | 37.5% |
| Education | 1 | 12.5% |
| Literature & Languages | 0 | 0.0% |
| Liberal Arts & History | 0 | 0.0% |
| Visual & Performing Arts | 0 | 0.0% |
| Communications | 0 | 0.0% |
| Arts & Humanities | 2 | 25.0% |
| Total | 8 | 100.0% |
Transportation & Commute in Hadley
Vehicle Availability by Sex in Hadley
The most prevalent vehicle ownership categories in Hadley are males with 2 vehicles (13, accounting for 76.5%) and females with 2 vehicles (9, making up 100.0%).
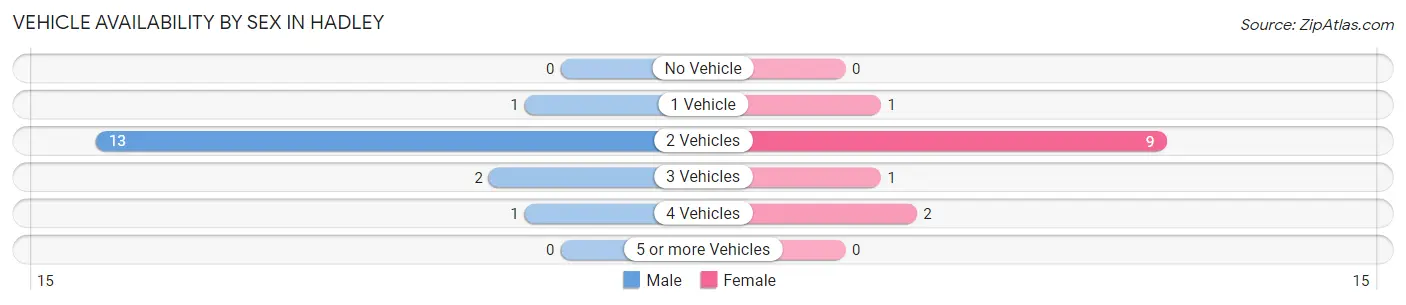
| Vehicles Available | Male | Female |
| No Vehicle | 0 (0.0%) | 0 (0.0%) |
| 1 Vehicle | 1 (5.9%) | 1 (7.7%) |
| 2 Vehicles | 13 (76.5%) | 9 (69.2%) |
| 3 Vehicles | 2 (11.8%) | 1 (7.7%) |
| 4 Vehicles | 1 (5.9%) | 2 (15.4%) |
| 5 or more Vehicles | 0 (0.0%) | 0 (0.0%) |
| Total | 17 (100.0%) | 13 (100.0%) |
Commute Time in Hadley
The most frequently occuring commute durations in Hadley are 30 to 34 minutes (7 commuters, 25.9%), 5 to 9 minutes (6 commuters, 22.2%), and 15 to 19 minutes (6 commuters, 22.2%).
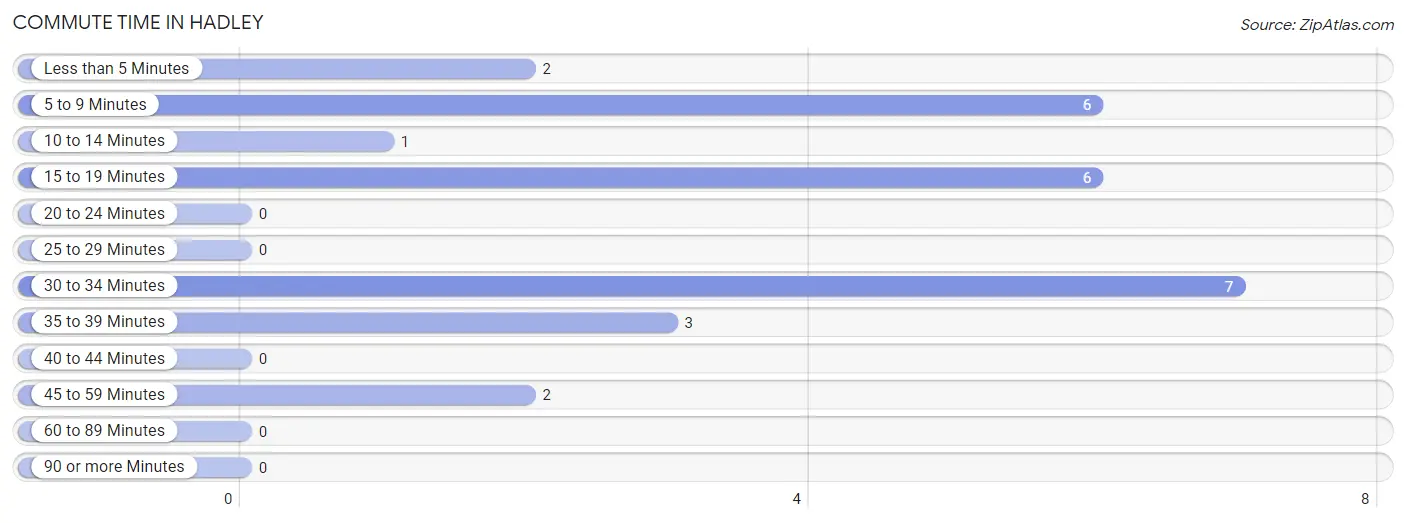
| Commute Time | # Commuters | % Commuters |
| Less than 5 Minutes | 2 | 7.4% |
| 5 to 9 Minutes | 6 | 22.2% |
| 10 to 14 Minutes | 1 | 3.7% |
| 15 to 19 Minutes | 6 | 22.2% |
| 20 to 24 Minutes | 0 | 0.0% |
| 25 to 29 Minutes | 0 | 0.0% |
| 30 to 34 Minutes | 7 | 25.9% |
| 35 to 39 Minutes | 3 | 11.1% |
| 40 to 44 Minutes | 0 | 0.0% |
| 45 to 59 Minutes | 2 | 7.4% |
| 60 to 89 Minutes | 0 | 0.0% |
| 90 or more Minutes | 0 | 0.0% |
Commute Time by Sex in Hadley
The most common commute times in Hadley are 5 to 9 minutes (6 commuters, 37.5%) for males and 15 to 19 minutes (4 commuters, 36.4%) for females.
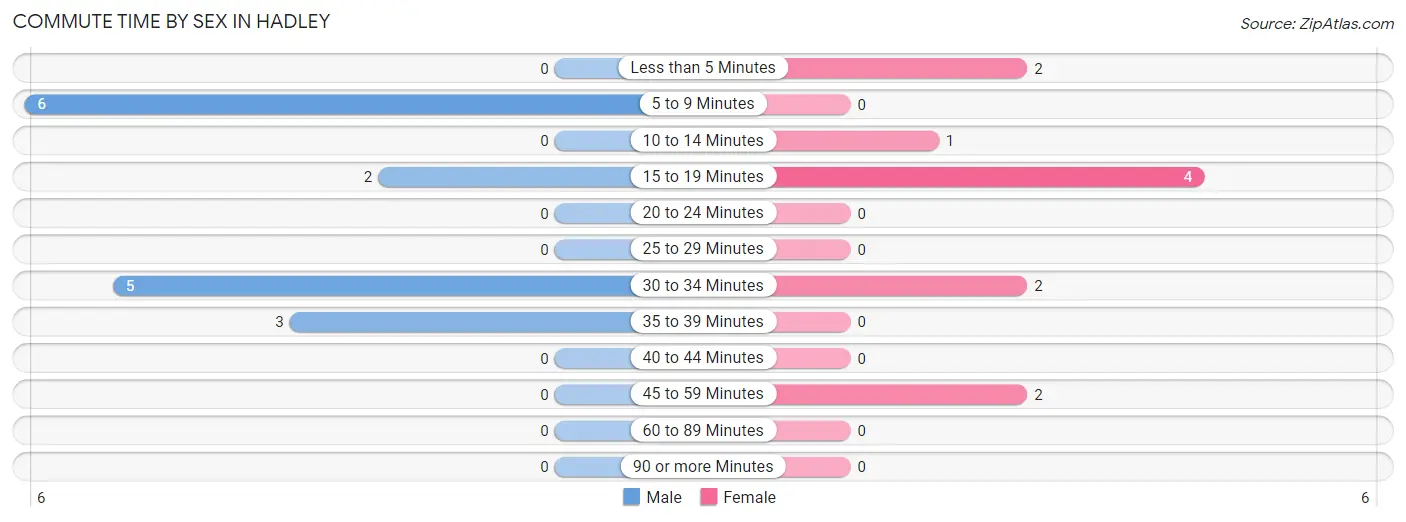
| Commute Time | Male | Female |
| Less than 5 Minutes | 0 (0.0%) | 2 (18.2%) |
| 5 to 9 Minutes | 6 (37.5%) | 0 (0.0%) |
| 10 to 14 Minutes | 0 (0.0%) | 1 (9.1%) |
| 15 to 19 Minutes | 2 (12.5%) | 4 (36.4%) |
| 20 to 24 Minutes | 0 (0.0%) | 0 (0.0%) |
| 25 to 29 Minutes | 0 (0.0%) | 0 (0.0%) |
| 30 to 34 Minutes | 5 (31.2%) | 2 (18.2%) |
| 35 to 39 Minutes | 3 (18.8%) | 0 (0.0%) |
| 40 to 44 Minutes | 0 (0.0%) | 0 (0.0%) |
| 45 to 59 Minutes | 0 (0.0%) | 2 (18.2%) |
| 60 to 89 Minutes | 0 (0.0%) | 0 (0.0%) |
| 90 or more Minutes | 0 (0.0%) | 0 (0.0%) |
Time of Departure to Work by Sex in Hadley
The most frequent times of departure to work in Hadley are 6:30 AM to 6:59 AM (6, 37.5%) for males and 9:00 AM to 9:59 AM (4, 36.4%) for females.
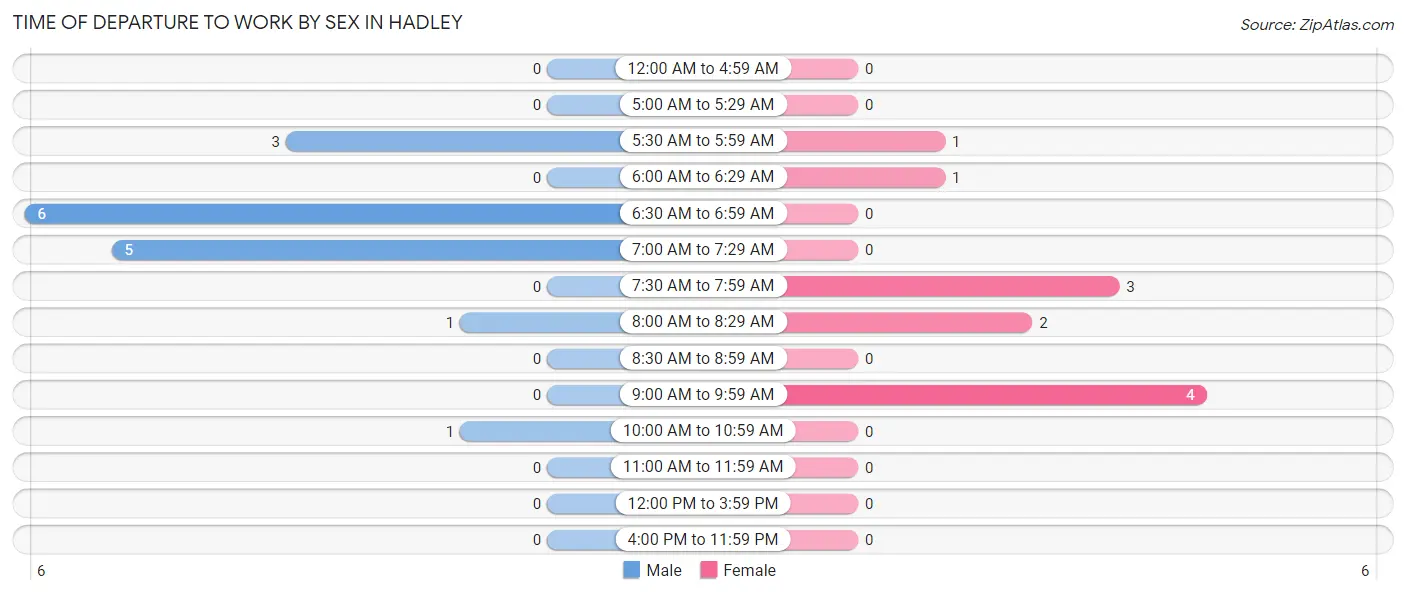
| Time of Departure | Male | Female |
| 12:00 AM to 4:59 AM | 0 (0.0%) | 0 (0.0%) |
| 5:00 AM to 5:29 AM | 0 (0.0%) | 0 (0.0%) |
| 5:30 AM to 5:59 AM | 3 (18.8%) | 1 (9.1%) |
| 6:00 AM to 6:29 AM | 0 (0.0%) | 1 (9.1%) |
| 6:30 AM to 6:59 AM | 6 (37.5%) | 0 (0.0%) |
| 7:00 AM to 7:29 AM | 5 (31.2%) | 0 (0.0%) |
| 7:30 AM to 7:59 AM | 0 (0.0%) | 3 (27.3%) |
| 8:00 AM to 8:29 AM | 1 (6.2%) | 2 (18.2%) |
| 8:30 AM to 8:59 AM | 0 (0.0%) | 0 (0.0%) |
| 9:00 AM to 9:59 AM | 0 (0.0%) | 4 (36.4%) |
| 10:00 AM to 10:59 AM | 1 (6.2%) | 0 (0.0%) |
| 11:00 AM to 11:59 AM | 0 (0.0%) | 0 (0.0%) |
| 12:00 PM to 3:59 PM | 0 (0.0%) | 0 (0.0%) |
| 4:00 PM to 11:59 PM | 0 (0.0%) | 0 (0.0%) |
| Total | 16 (100.0%) | 11 (100.0%) |
Housing Occupancy in Hadley
Occupancy by Ownership in Hadley
Of the total 22 dwellings in Hadley, owner-occupied units account for 17 (77.3%), while renter-occupied units make up 5 (22.7%).
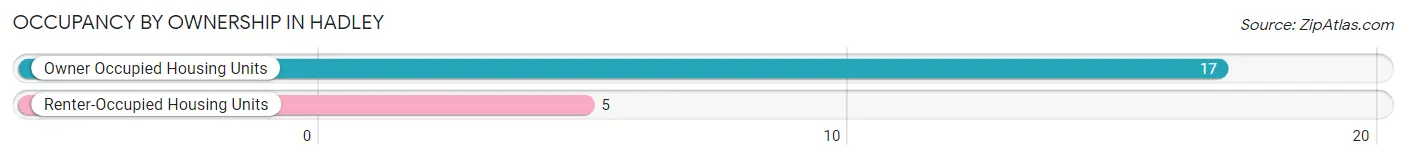
| Occupancy | # Housing Units | % Housing Units |
| Owner Occupied Housing Units | 17 | 77.3% |
| Renter-Occupied Housing Units | 5 | 22.7% |
| Total Occupied Housing Units | 22 | 100.0% |
Occupancy by Household Size in Hadley
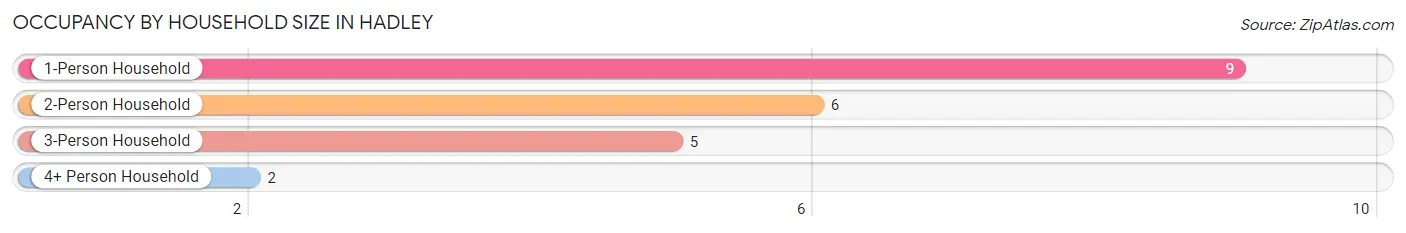
| Household Size | # Housing Units | % Housing Units |
| 1-Person Household | 9 | 40.9% |
| 2-Person Household | 6 | 27.3% |
| 3-Person Household | 5 | 22.7% |
| 4+ Person Household | 2 | 9.1% |
| Total Housing Units | 22 | 100.0% |
Occupancy by Ownership by Household Size in Hadley
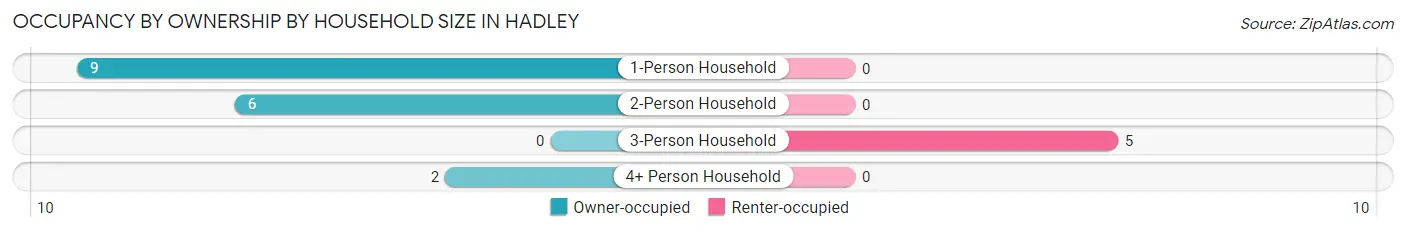
| Household Size | Owner-occupied | Renter-occupied |
| 1-Person Household | 9 (100.0%) | 0 (0.0%) |
| 2-Person Household | 6 (100.0%) | 0 (0.0%) |
| 3-Person Household | 0 (0.0%) | 5 (100.0%) |
| 4+ Person Household | 2 (100.0%) | 0 (0.0%) |
| Total Housing Units | 17 (77.3%) | 5 (22.7%) |
Occupancy by Educational Attainment in Hadley
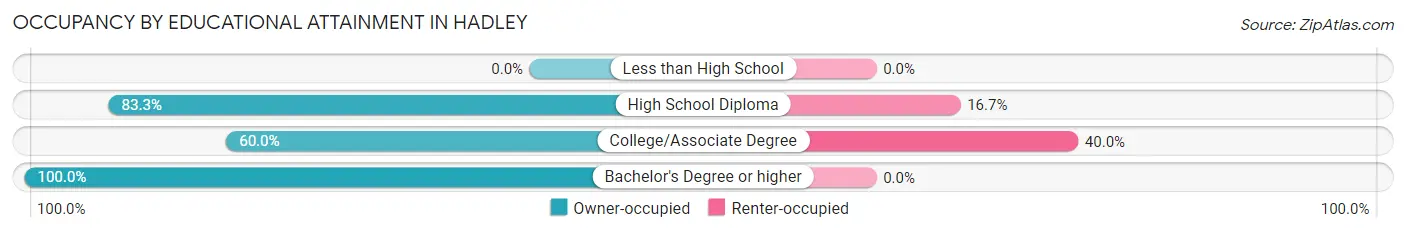
| Household Size | Owner-occupied | Renter-occupied |
| Less than High School | 0 (0.0%) | 0 (0.0%) |
| High School Diploma | 5 (83.3%) | 1 (16.7%) |
| College/Associate Degree | 6 (60.0%) | 4 (40.0%) |
| Bachelor's Degree or higher | 6 (100.0%) | 0 (0.0%) |
Occupancy by Age of Householder in Hadley
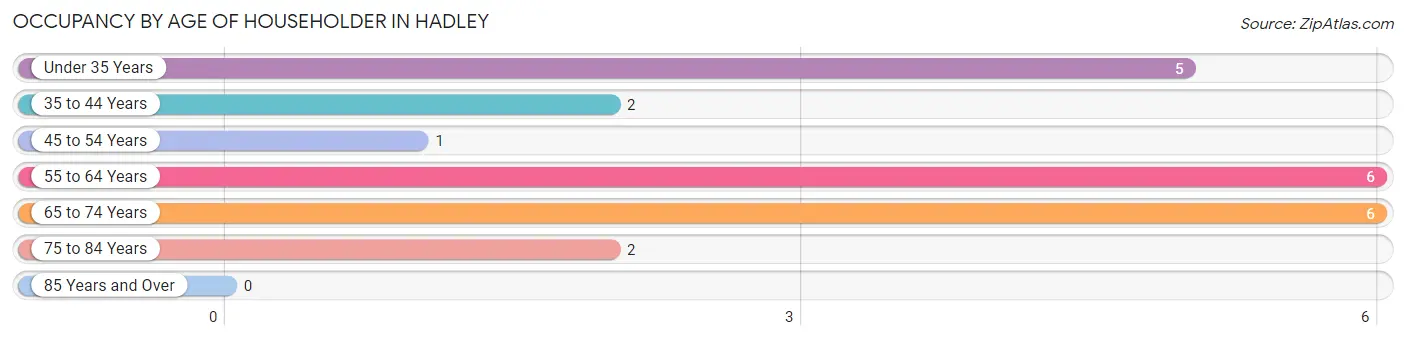
| Age Bracket | # Households | % Households |
| Under 35 Years | 5 | 22.7% |
| 35 to 44 Years | 2 | 9.1% |
| 45 to 54 Years | 1 | 4.5% |
| 55 to 64 Years | 6 | 27.3% |
| 65 to 74 Years | 6 | 27.3% |
| 75 to 84 Years | 2 | 9.1% |
| 85 Years and Over | 0 | 0.0% |
| Total | 22 | 100.0% |
Housing Finances in Hadley
Median Income by Occupancy in Hadley
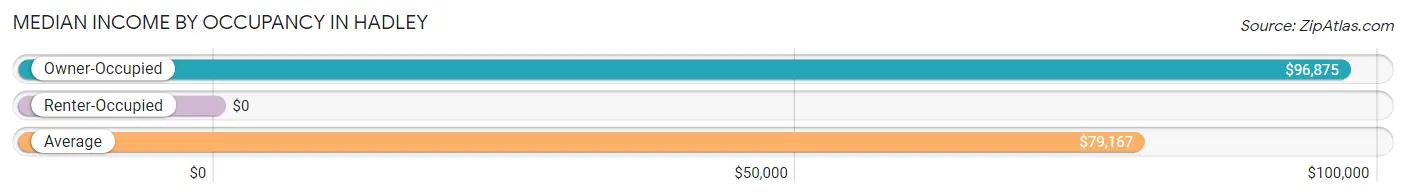
| Occupancy Type | # Households | Median Income |
| Owner-Occupied | 17 (77.3%) | $96,875 |
| Renter-Occupied | 5 (22.7%) | $0 |
| Average | 22 (100.0%) | $79,167 |
Occupancy by Householder Income Bracket in Hadley
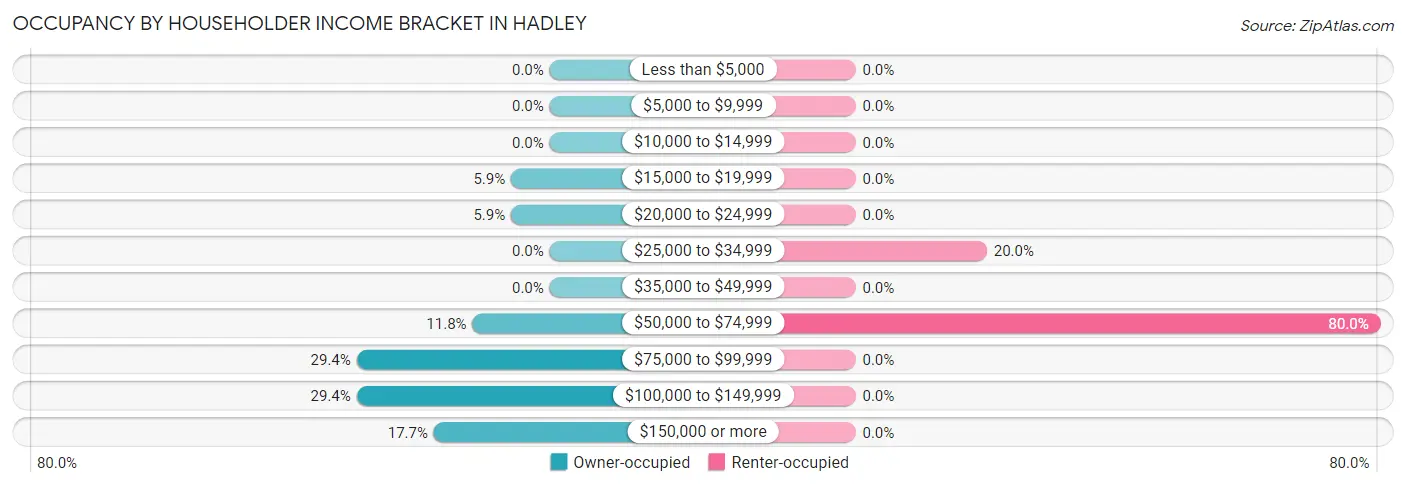
| Income Bracket | Owner-occupied | Renter-occupied |
| Less than $5,000 | 0 (0.0%) | 0 (0.0%) |
| $5,000 to $9,999 | 0 (0.0%) | 0 (0.0%) |
| $10,000 to $14,999 | 0 (0.0%) | 0 (0.0%) |
| $15,000 to $19,999 | 1 (5.9%) | 0 (0.0%) |
| $20,000 to $24,999 | 1 (5.9%) | 0 (0.0%) |
| $25,000 to $34,999 | 0 (0.0%) | 1 (20.0%) |
| $35,000 to $49,999 | 0 (0.0%) | 0 (0.0%) |
| $50,000 to $74,999 | 2 (11.8%) | 4 (80.0%) |
| $75,000 to $99,999 | 5 (29.4%) | 0 (0.0%) |
| $100,000 to $149,999 | 5 (29.4%) | 0 (0.0%) |
| $150,000 or more | 3 (17.6%) | 0 (0.0%) |
| Total | 17 (100.0%) | 5 (100.0%) |
Monthly Housing Cost Tiers in Hadley
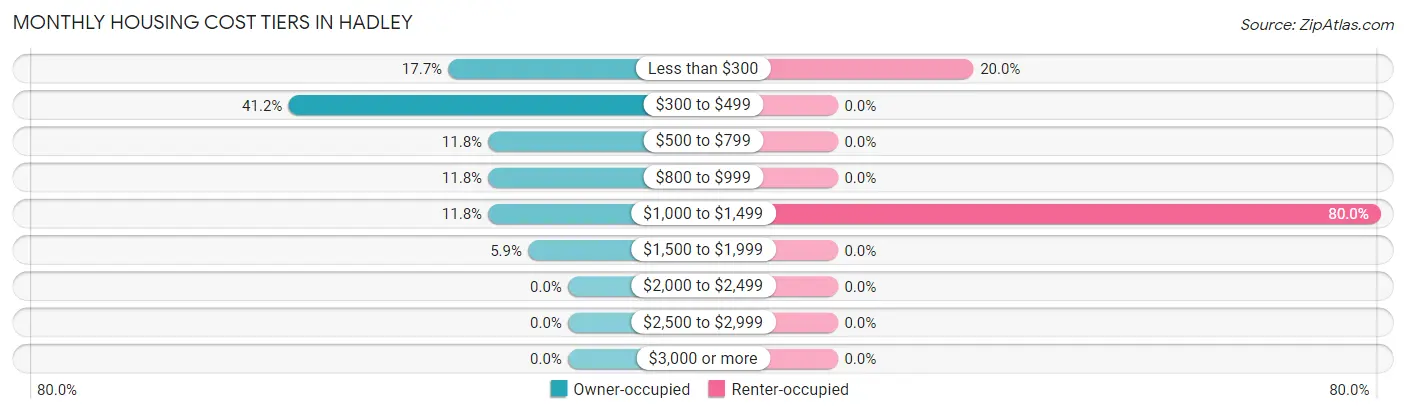
| Monthly Cost | Owner-occupied | Renter-occupied |
| Less than $300 | 3 (17.6%) | 1 (20.0%) |
| $300 to $499 | 7 (41.2%) | 0 (0.0%) |
| $500 to $799 | 2 (11.8%) | 0 (0.0%) |
| $800 to $999 | 2 (11.8%) | 0 (0.0%) |
| $1,000 to $1,499 | 2 (11.8%) | 4 (80.0%) |
| $1,500 to $1,999 | 1 (5.9%) | 0 (0.0%) |
| $2,000 to $2,499 | 0 (0.0%) | 0 (0.0%) |
| $2,500 to $2,999 | 0 (0.0%) | 0 (0.0%) |
| $3,000 or more | 0 (0.0%) | 0 (0.0%) |
| Total | 17 (100.0%) | 5 (100.0%) |
Physical Housing Characteristics in Hadley
Housing Structures in Hadley
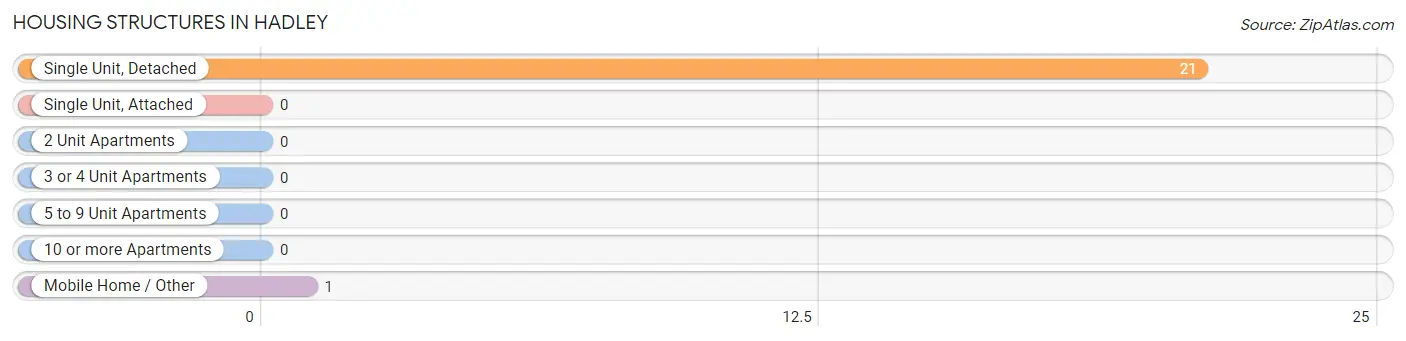
| Structure Type | # Housing Units | % Housing Units |
| Single Unit, Detached | 21 | 95.5% |
| Single Unit, Attached | 0 | 0.0% |
| 2 Unit Apartments | 0 | 0.0% |
| 3 or 4 Unit Apartments | 0 | 0.0% |
| 5 to 9 Unit Apartments | 0 | 0.0% |
| 10 or more Apartments | 0 | 0.0% |
| Mobile Home / Other | 1 | 4.5% |
| Total | 22 | 100.0% |
Housing Structures by Occupancy in Hadley
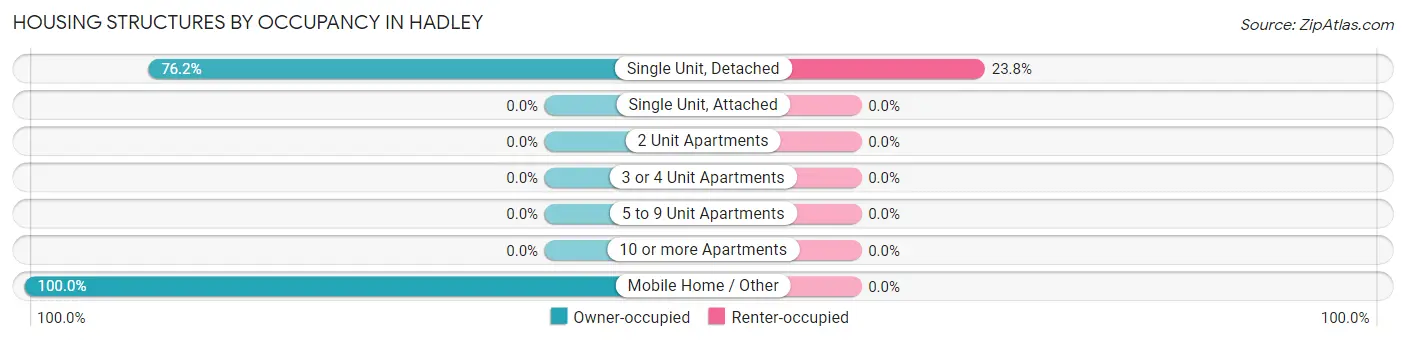
| Structure Type | Owner-occupied | Renter-occupied |
| Single Unit, Detached | 16 (76.2%) | 5 (23.8%) |
| Single Unit, Attached | 0 (0.0%) | 0 (0.0%) |
| 2 Unit Apartments | 0 (0.0%) | 0 (0.0%) |
| 3 or 4 Unit Apartments | 0 (0.0%) | 0 (0.0%) |
| 5 to 9 Unit Apartments | 0 (0.0%) | 0 (0.0%) |
| 10 or more Apartments | 0 (0.0%) | 0 (0.0%) |
| Mobile Home / Other | 1 (100.0%) | 0 (0.0%) |
| Total | 17 (77.3%) | 5 (22.7%) |
Housing Structures by Number of Rooms in Hadley
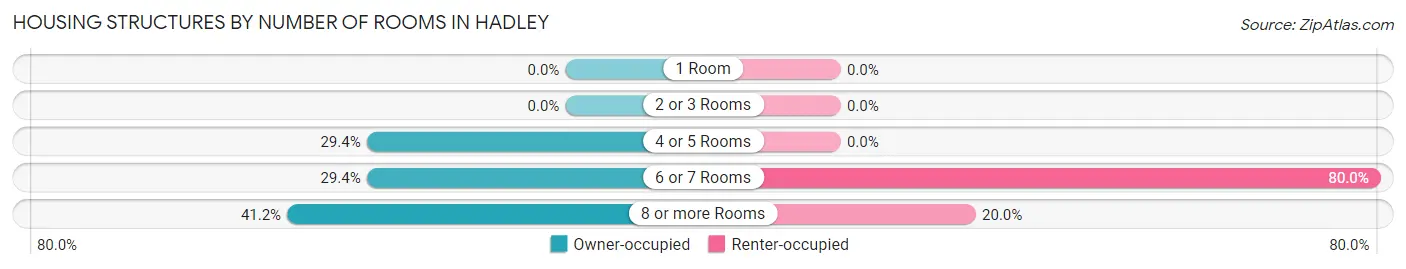
| Number of Rooms | Owner-occupied | Renter-occupied |
| 1 Room | 0 (0.0%) | 0 (0.0%) |
| 2 or 3 Rooms | 0 (0.0%) | 0 (0.0%) |
| 4 or 5 Rooms | 5 (29.4%) | 0 (0.0%) |
| 6 or 7 Rooms | 5 (29.4%) | 4 (80.0%) |
| 8 or more Rooms | 7 (41.2%) | 1 (20.0%) |
| Total | 17 (100.0%) | 5 (100.0%) |
Housing Structure by Heating Type in Hadley
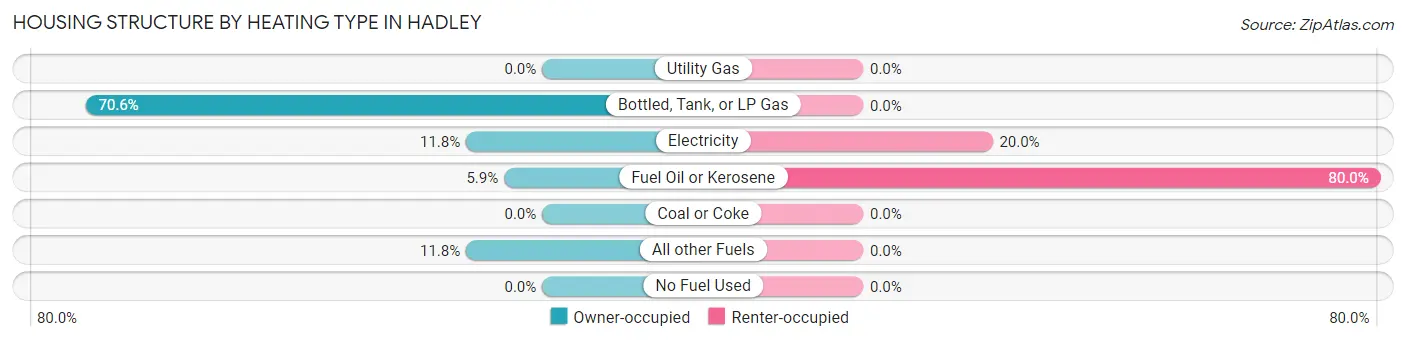
| Heating Type | Owner-occupied | Renter-occupied |
| Utility Gas | 0 (0.0%) | 0 (0.0%) |
| Bottled, Tank, or LP Gas | 12 (70.6%) | 0 (0.0%) |
| Electricity | 2 (11.8%) | 1 (20.0%) |
| Fuel Oil or Kerosene | 1 (5.9%) | 4 (80.0%) |
| Coal or Coke | 0 (0.0%) | 0 (0.0%) |
| All other Fuels | 2 (11.8%) | 0 (0.0%) |
| No Fuel Used | 0 (0.0%) | 0 (0.0%) |
| Total | 17 (100.0%) | 5 (100.0%) |
Household Vehicle Usage in Hadley
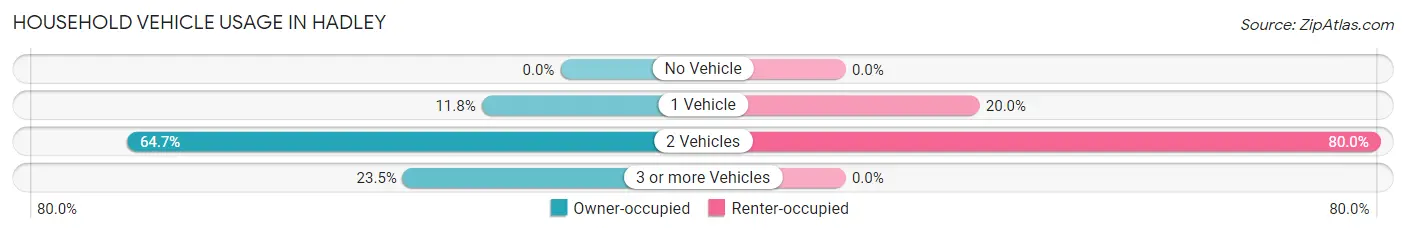
| Vehicles per Household | Owner-occupied | Renter-occupied |
| No Vehicle | 0 (0.0%) | 0 (0.0%) |
| 1 Vehicle | 2 (11.8%) | 1 (20.0%) |
| 2 Vehicles | 11 (64.7%) | 4 (80.0%) |
| 3 or more Vehicles | 4 (23.5%) | 0 (0.0%) |
| Total | 17 (100.0%) | 5 (100.0%) |
Real Estate & Mortgages in Hadley
Real Estate and Mortgage Overview in Hadley
| Characteristic | Without Mortgage | With Mortgage |
| Housing Units | 15 | 2 |
| Median Property Value | $47,500 | $0 |
| Median Household Income | $96,875 | $1 |
| Monthly Housing Costs | $450 | $0 |
| Real Estate Taxes | $375 | $0 |
Property Value by Mortgage Status in Hadley
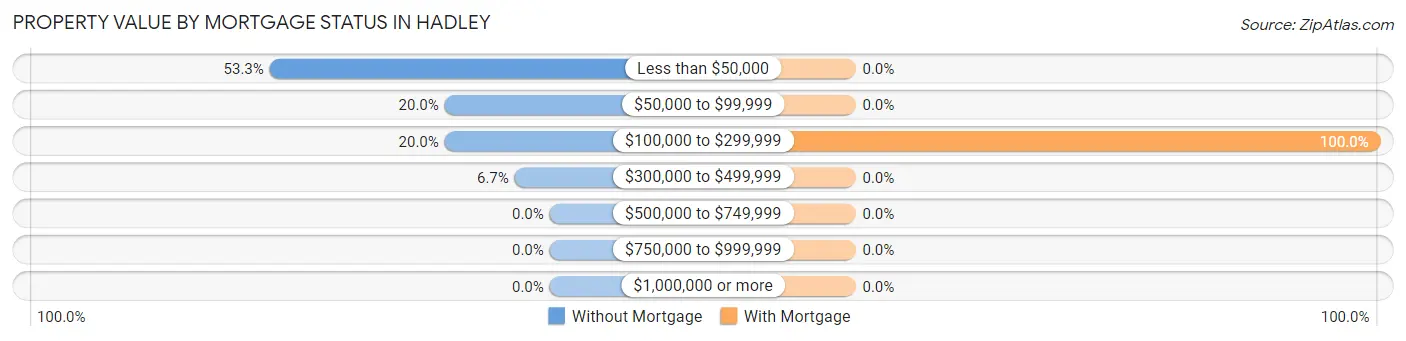
| Property Value | Without Mortgage | With Mortgage |
| Less than $50,000 | 8 (53.3%) | 0 (0.0%) |
| $50,000 to $99,999 | 3 (20.0%) | 0 (0.0%) |
| $100,000 to $299,999 | 3 (20.0%) | 2 (100.0%) |
| $300,000 to $499,999 | 1 (6.7%) | 0 (0.0%) |
| $500,000 to $749,999 | 0 (0.0%) | 0 (0.0%) |
| $750,000 to $999,999 | 0 (0.0%) | 0 (0.0%) |
| $1,000,000 or more | 0 (0.0%) | 0 (0.0%) |
| Total | 15 (100.0%) | 2 (100.0%) |
Household Income by Mortgage Status in Hadley
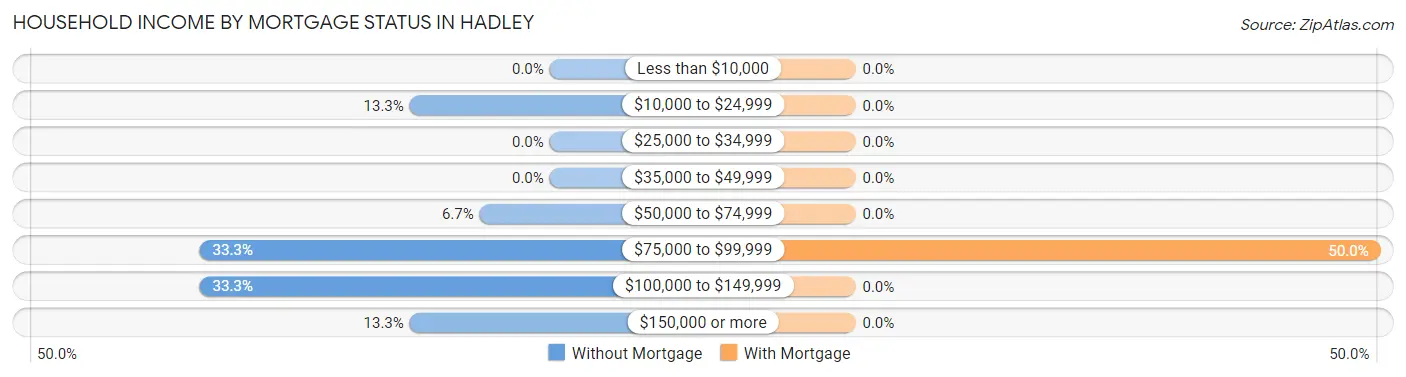
| Household Income | Without Mortgage | With Mortgage |
| Less than $10,000 | 0 (0.0%) | 0 (0.0%) |
| $10,000 to $24,999 | 2 (13.3%) | 0 (0.0%) |
| $25,000 to $34,999 | 0 (0.0%) | 0 (0.0%) |
| $35,000 to $49,999 | 0 (0.0%) | 0 (0.0%) |
| $50,000 to $74,999 | 1 (6.7%) | 0 (0.0%) |
| $75,000 to $99,999 | 5 (33.3%) | 1 (50.0%) |
| $100,000 to $149,999 | 5 (33.3%) | 0 (0.0%) |
| $150,000 or more | 2 (13.3%) | 0 (0.0%) |
| Total | 15 (100.0%) | 2 (100.0%) |
Property Value to Household Income Ratio in Hadley
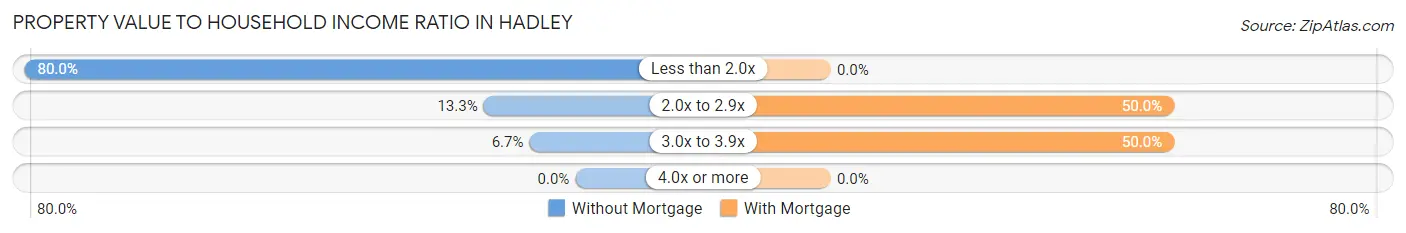
| Value-to-Income Ratio | Without Mortgage | With Mortgage |
| Less than 2.0x | 12 (80.0%) | 0 (0.0%) |
| 2.0x to 2.9x | 2 (13.3%) | 1 (50.0%) |
| 3.0x to 3.9x | 1 (6.7%) | 1 (50.0%) |
| 4.0x or more | 0 (0.0%) | 0 (0.0%) |
| Total | 15 (100.0%) | 2 (100.0%) |
Real Estate Taxes by Mortgage Status in Hadley
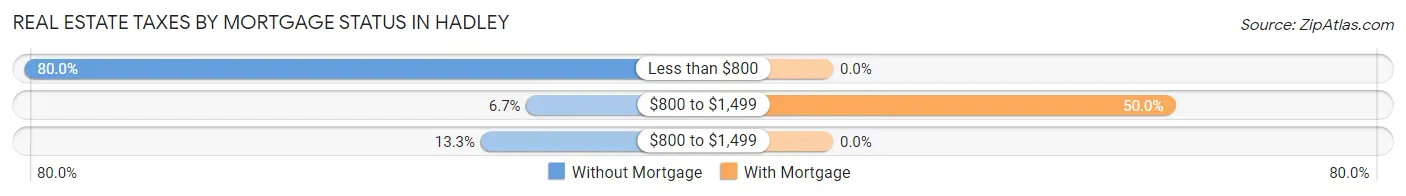
| Property Taxes | Without Mortgage | With Mortgage |
| Less than $800 | 12 (80.0%) | 0 (0.0%) |
| $800 to $1,499 | 1 (6.7%) | 1 (50.0%) |
| $800 to $1,499 | 2 (13.3%) | 0 (0.0%) |
| Total | 15 (100.0%) | 2 (100.0%) |
Health & Disability in Hadley
Health Insurance Coverage by Age in Hadley
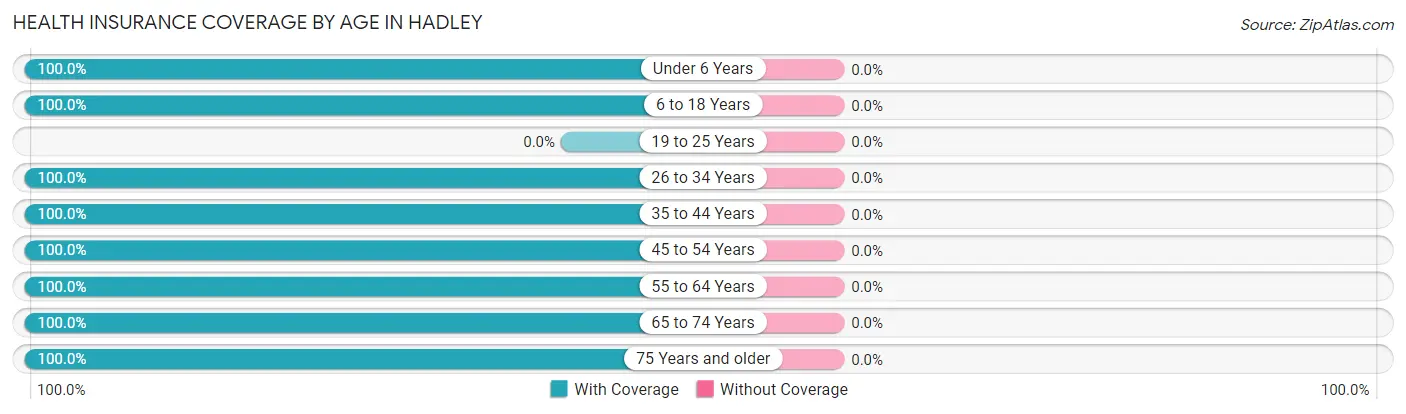
| Age Bracket | With Coverage | Without Coverage |
| Under 6 Years | 4 (100.0%) | 0 (0.0%) |
| 6 to 18 Years | 4 (100.0%) | 0 (0.0%) |
| 19 to 25 Years | 0 (0.0%) | 0 (0.0%) |
| 26 to 34 Years | 9 (100.0%) | 0 (0.0%) |
| 35 to 44 Years | 3 (100.0%) | 0 (0.0%) |
| 45 to 54 Years | 1 (100.0%) | 0 (0.0%) |
| 55 to 64 Years | 11 (100.0%) | 0 (0.0%) |
| 65 to 74 Years | 6 (100.0%) | 0 (0.0%) |
| 75 Years and older | 5 (100.0%) | 0 (0.0%) |
| Total | 43 (100.0%) | 0 (0.0%) |
Health Insurance Coverage by Citizenship Status in Hadley
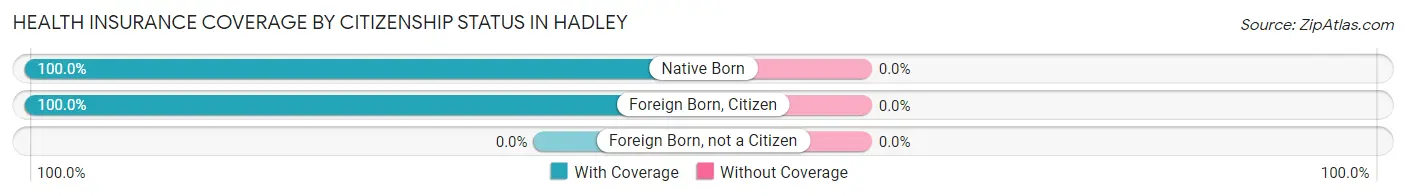
| Citizenship Status | With Coverage | Without Coverage |
| Native Born | 4 (100.0%) | 0 (0.0%) |
| Foreign Born, Citizen | 4 (100.0%) | 0 (0.0%) |
| Foreign Born, not a Citizen | 0 (0.0%) | 0 (0.0%) |
Health Insurance Coverage by Household Income in Hadley
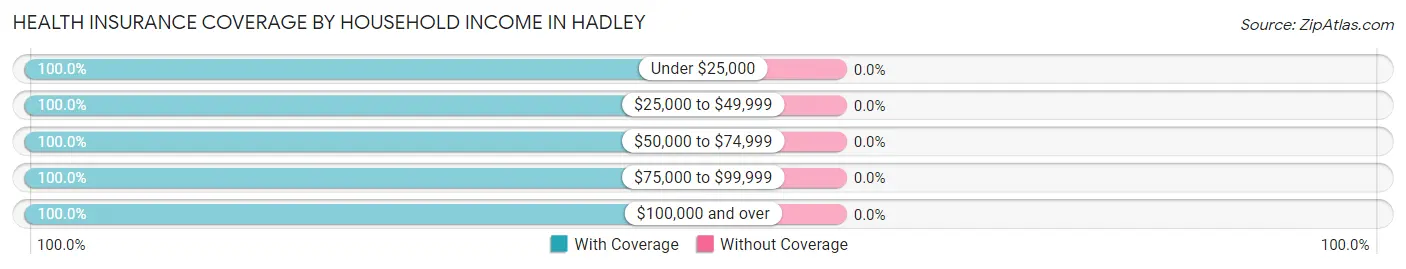
| Household Income | With Coverage | Without Coverage |
| Under $25,000 | 2 (100.0%) | 0 (0.0%) |
| $25,000 to $49,999 | 3 (100.0%) | 0 (0.0%) |
| $50,000 to $74,999 | 15 (100.0%) | 0 (0.0%) |
| $75,000 to $99,999 | 10 (100.0%) | 0 (0.0%) |
| $100,000 and over | 13 (100.0%) | 0 (0.0%) |
Public vs Private Health Insurance Coverage by Age in Hadley
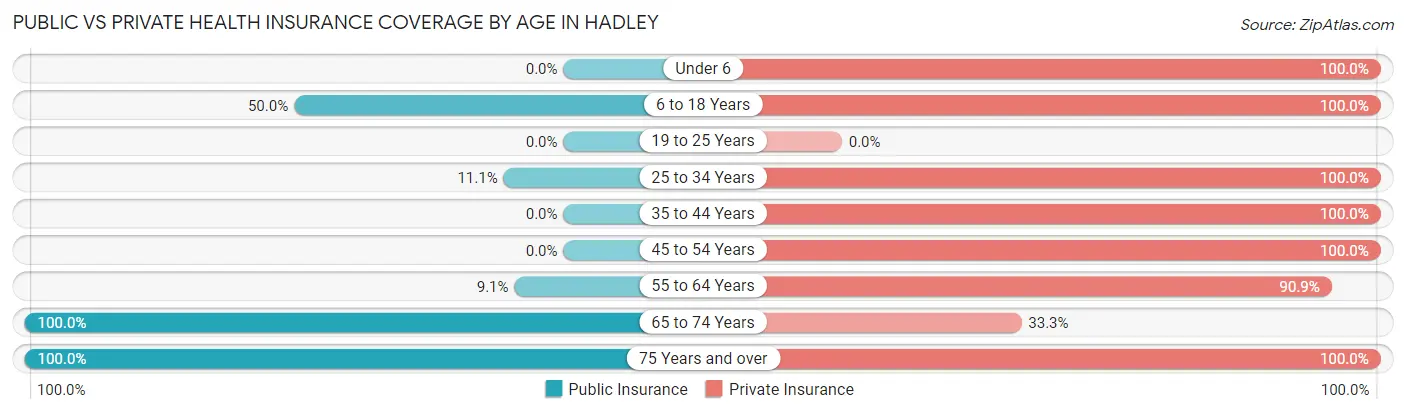
| Age Bracket | Public Insurance | Private Insurance |
| Under 6 | 0 (0.0%) | 4 (100.0%) |
| 6 to 18 Years | 2 (50.0%) | 4 (100.0%) |
| 19 to 25 Years | 0 (0.0%) | 0 (0.0%) |
| 25 to 34 Years | 1 (11.1%) | 9 (100.0%) |
| 35 to 44 Years | 0 (0.0%) | 3 (100.0%) |
| 45 to 54 Years | 0 (0.0%) | 1 (100.0%) |
| 55 to 64 Years | 1 (9.1%) | 10 (90.9%) |
| 65 to 74 Years | 6 (100.0%) | 2 (33.3%) |
| 75 Years and over | 5 (100.0%) | 5 (100.0%) |
| Total | 15 (34.9%) | 38 (88.4%) |
Disability Status by Sex by Age in Hadley
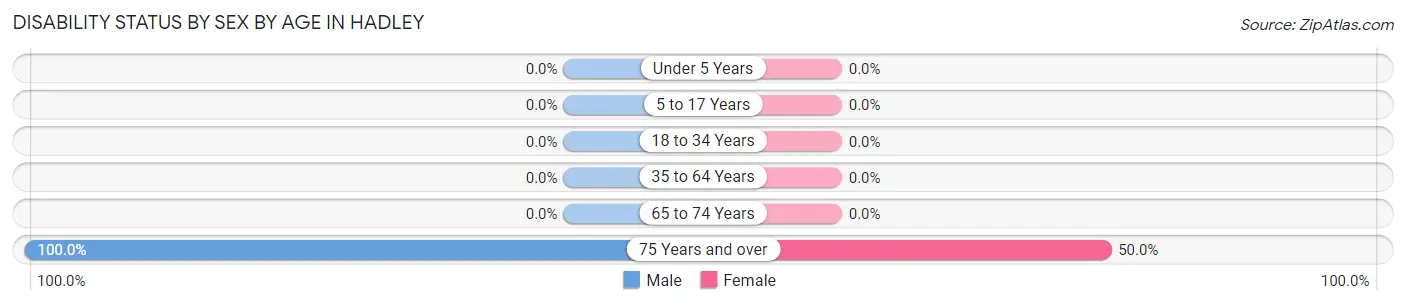
| Age Bracket | Male | Female |
| Under 5 Years | 0 (0.0%) | 0 (0.0%) |
| 5 to 17 Years | 0 (0.0%) | 0 (0.0%) |
| 18 to 34 Years | 0 (0.0%) | 0 (0.0%) |
| 35 to 64 Years | 0 (0.0%) | 0 (0.0%) |
| 65 to 74 Years | 0 (0.0%) | 0 (0.0%) |
| 75 Years and over | 3 (100.0%) | 1 (50.0%) |
Disability Class by Sex by Age in Hadley
Disability Class: Hearing Difficulty
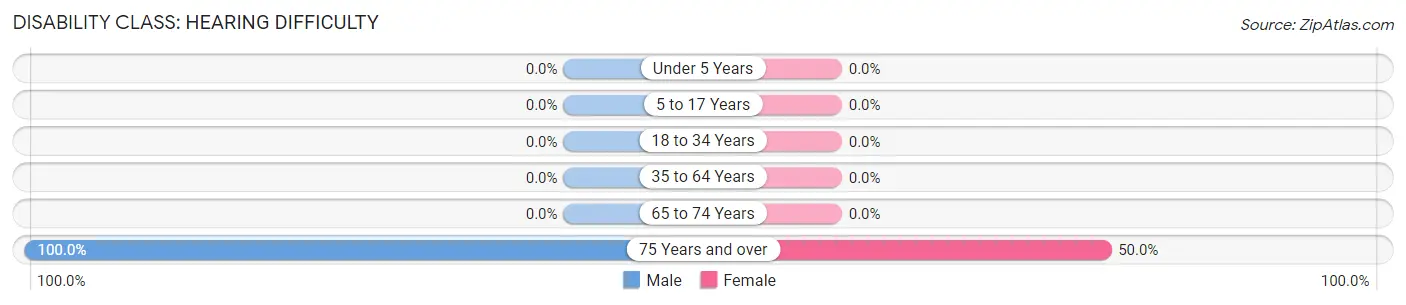
| Age Bracket | Male | Female |
| Under 5 Years | 0 (0.0%) | 0 (0.0%) |
| 5 to 17 Years | 0 (0.0%) | 0 (0.0%) |
| 18 to 34 Years | 0 (0.0%) | 0 (0.0%) |
| 35 to 64 Years | 0 (0.0%) | 0 (0.0%) |
| 65 to 74 Years | 0 (0.0%) | 0 (0.0%) |
| 75 Years and over | 3 (100.0%) | 1 (50.0%) |
Disability Class: Vision Difficulty
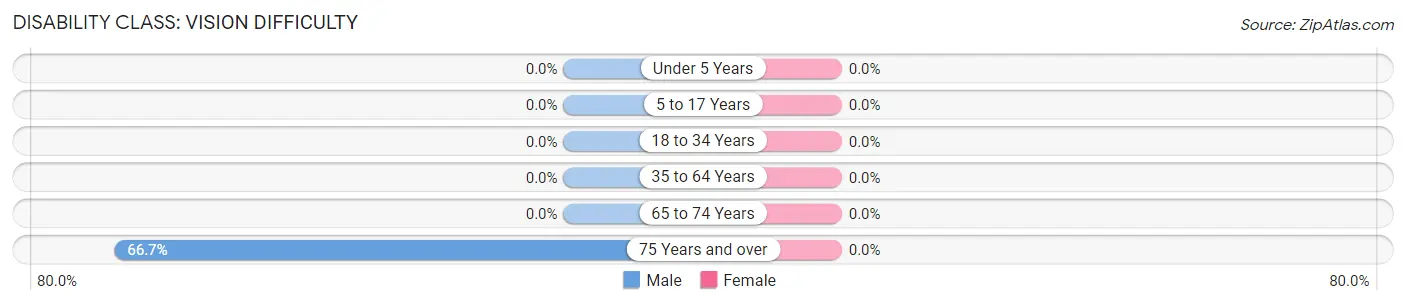
| Age Bracket | Male | Female |
| Under 5 Years | 0 (0.0%) | 0 (0.0%) |
| 5 to 17 Years | 0 (0.0%) | 0 (0.0%) |
| 18 to 34 Years | 0 (0.0%) | 0 (0.0%) |
| 35 to 64 Years | 0 (0.0%) | 0 (0.0%) |
| 65 to 74 Years | 0 (0.0%) | 0 (0.0%) |
| 75 Years and over | 2 (66.7%) | 0 (0.0%) |
Disability Class: Cognitive Difficulty

| Age Bracket | Male | Female |
| 5 to 17 Years | 0 (0.0%) | 0 (0.0%) |
| 18 to 34 Years | 0 (0.0%) | 0 (0.0%) |
| 35 to 64 Years | 0 (0.0%) | 0 (0.0%) |
| 65 to 74 Years | 0 (0.0%) | 0 (0.0%) |
| 75 Years and over | 0 (0.0%) | 0 (0.0%) |
Disability Class: Ambulatory Difficulty
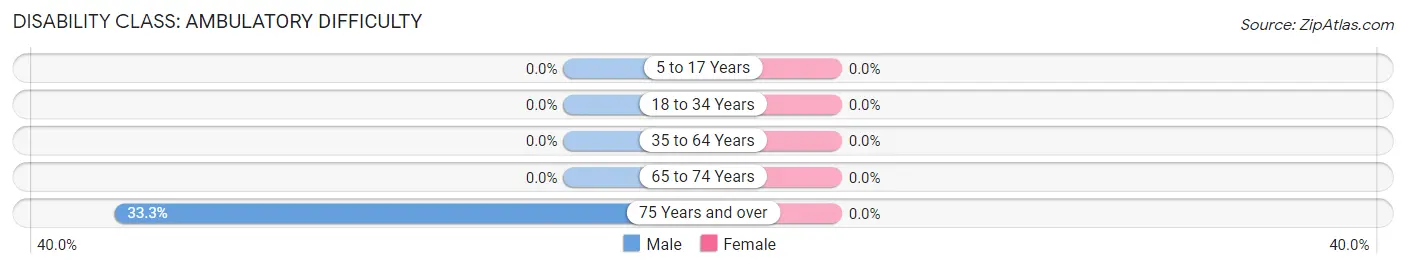
| Age Bracket | Male | Female |
| 5 to 17 Years | 0 (0.0%) | 0 (0.0%) |
| 18 to 34 Years | 0 (0.0%) | 0 (0.0%) |
| 35 to 64 Years | 0 (0.0%) | 0 (0.0%) |
| 65 to 74 Years | 0 (0.0%) | 0 (0.0%) |
| 75 Years and over | 1 (33.3%) | 0 (0.0%) |
Disability Class: Self-Care Difficulty
| Age Bracket | Male | Female |
| 5 to 17 Years | 0 (0.0%) | 0 (0.0%) |
| 18 to 34 Years | 0 (0.0%) | 0 (0.0%) |
| 35 to 64 Years | 0 (0.0%) | 0 (0.0%) |
| 65 to 74 Years | 0 (0.0%) | 0 (0.0%) |
| 75 Years and over | 0 (0.0%) | 0 (0.0%) |
Technology Access in Hadley
Computing Device Access in Hadley
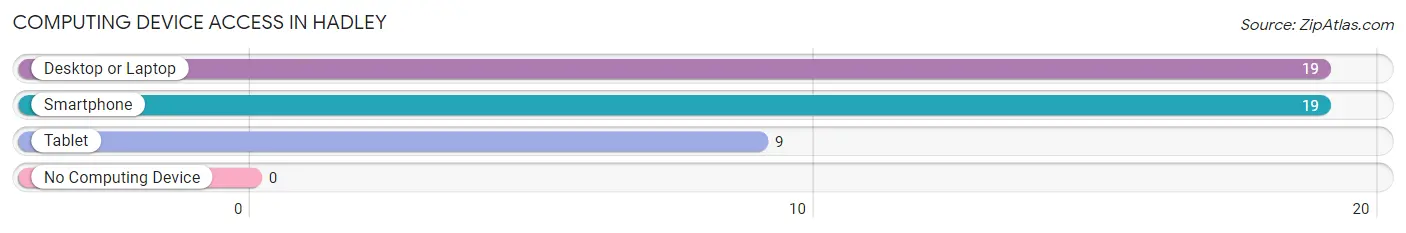
| Device Type | # Households | % Households |
| Desktop or Laptop | 19 | 86.4% |
| Smartphone | 19 | 86.4% |
| Tablet | 9 | 40.9% |
| No Computing Device | 0 | 0.0% |
| Total | 22 | 100.0% |
Internet Access in Hadley
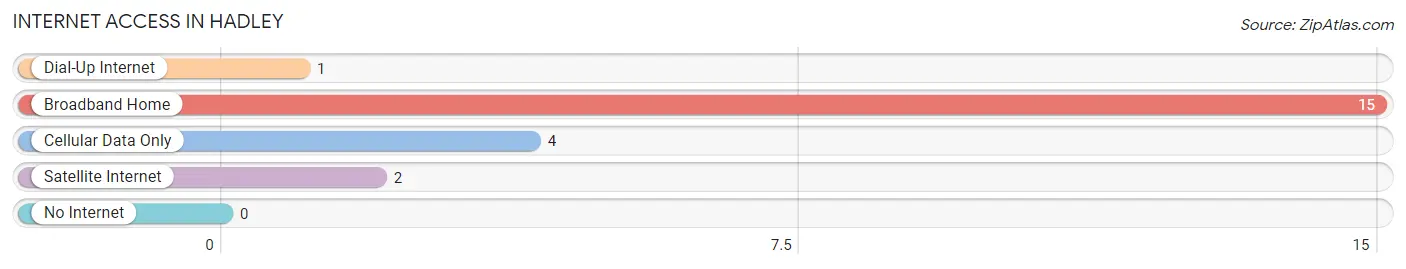
| Internet Type | # Households | % Households |
| Dial-Up Internet | 1 | 4.5% |
| Broadband Home | 15 | 68.2% |
| Cellular Data Only | 4 | 18.2% |
| Satellite Internet | 2 | 9.1% |
| No Internet | 0 | 0.0% |
| Total | 22 | 100.0% |
Hadley Summary
Hadley, Minnesota is a small city located in the southwestern corner of the state, in the county of Lyon. It is situated on the banks of the Minnesota River, and is part of the Marshall-Lyon County Metropolitan Statistical Area. The city has a population of approximately 1,400 people, and is home to a variety of businesses, including a number of small manufacturing companies.
History
Hadley was founded in 1871 by a group of settlers from the nearby town of Marshall. The settlers were looking for a place to settle and farm, and chose the area due to its proximity to the Minnesota River. The town was named after the Hadley family, who were among the first settlers.
The town grew slowly over the years, and by the early 1900s, it had become a thriving agricultural community. The town was home to a number of small businesses, including a general store, a blacksmith, and a sawmill.
In the 1950s, the town began to experience a period of growth, as new businesses moved into the area. This included a number of manufacturing companies, which helped to diversify the local economy.
Geography
Hadley is located in the southwestern corner of Minnesota, in the county of Lyon. It is situated on the banks of the Minnesota River, and is part of the Marshall-Lyon County Metropolitan Statistical Area. The city has a total area of 1.2 square miles, all of which is land.
The city is located in a flat, open area, with no major hills or mountains. The climate is generally mild, with cold winters and hot summers. The average annual temperature is around 40 degrees Fahrenheit.
Economy
Hadley’s economy is largely based on agriculture and manufacturing. The city is home to a number of small manufacturing companies, which produce a variety of products, including furniture, clothing, and electronics.
Agriculture is also an important part of the local economy. The city is home to a number of farms, which produce a variety of crops, including corn, soybeans, and wheat.
Demographics
As of the 2010 census, Hadley had a population of 1,400 people. The racial makeup of the city was 97.3% White, 0.7% African American, 0.3% Native American, 0.3% Asian, and 1.3% from other races.
The median household income in Hadley was $45,000, and the median family income was $50,000. The per capita income was $20,000. About 8.5% of the population was below the poverty line.
Conclusion
Hadley, Minnesota is a small city located in the southwestern corner of the state, in the county of Lyon. It is situated on the banks of the Minnesota River, and is part of the Marshall-Lyon County Metropolitan Statistical Area. The city has a population of approximately 1,400 people, and is home to a variety of businesses, including a number of small manufacturing companies. The economy of Hadley is largely based on agriculture and manufacturing, and the city has a diverse population.
Common Questions
What is Per Capita Income in Hadley?
Per Capita income in Hadley is $46,988.
What is the Median Family Income in Hadley?
Median Family Income in Hadley is $77,917.
What is the Median Household income in Hadley?
Median Household Income in Hadley is $79,167.
What is Inequality or Gini Index in Hadley?
Inequality or Gini Index in Hadley is 0.33.
What is the Total Population of Hadley?
Total Population of Hadley is 43.
What is the Total Male Population of Hadley?
Total Male Population of Hadley is 21.
What is the Total Female Population of Hadley?
Total Female Population of Hadley is 22.
What is the Ratio of Males per 100 Females in Hadley?
There are 95.45 Males per 100 Females in Hadley.
What is the Ratio of Females per 100 Males in Hadley?
There are 104.76 Females per 100 Males in Hadley.
What is the Median Population Age in Hadley?
Median Population Age in Hadley is 57.1 Years.
What is the Average Family Size in Hadley
Average Family Size in Hadley is 2.3 People.
What is the Average Household Size in Hadley
Average Household Size in Hadley is 1.9 People.
How Large is the Labor Force in Hadley?
There are 30 People in the Labor Forcein in Hadley.
What is the Percentage of People in the Labor Force in Hadley?
85.7% of People are in the Labor Force in Hadley.