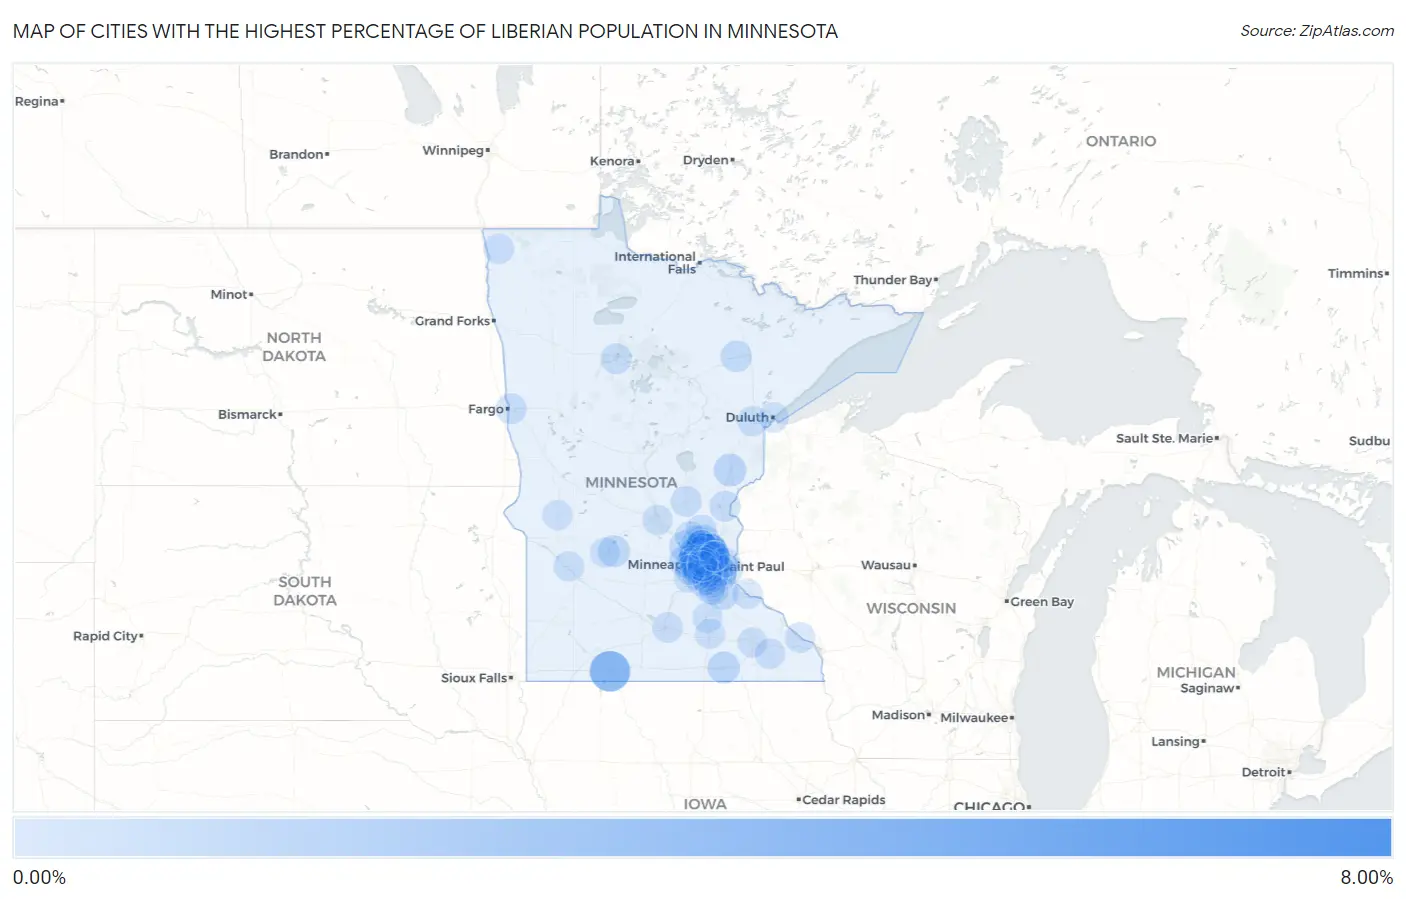
Cities with the Highest Percentage of Liberian Population in Minnesota
RELATED REPORTS & OPTIONS
Liberian
Minnesota
Compare Cities
Map of Cities with the Highest Percentage of Liberian Population in Minnesota
0.00%
8.00%

Cities with the Highest Percentage of Liberian Population in Minnesota
| City | Liberian | vs State | vs National | |
| 1. | Brooklyn Center | 7.79% | 0.25%(+7.55)#1 | 0.028%(+7.76)#4 |
| 2. | New Hope | 5.63% | 0.25%(+5.39)#2 | 0.028%(+5.61)#7 |
| 3. | Brooklyn Park | 4.54% | 0.25%(+4.29)#3 | 0.028%(+4.51)#12 |
| 4. | Jackson | 4.06% | 0.25%(+3.81)#4 | 0.028%(+4.03)#14 |
| 5. | Maple Grove | 1.71% | 0.25%(+1.46)#5 | 0.028%(+1.68)#33 |
| 6. | Champlin | 1.51% | 0.25%(+1.26)#6 | 0.028%(+1.48)#38 |
| 7. | Hopkins | 1.50% | 0.25%(+1.26)#7 | 0.028%(+1.48)#39 |
| 8. | Mounds View | 1.02% | 0.25%(+0.768)#8 | 0.028%(+0.987)#57 |
| 9. | Andover | 0.97% | 0.25%(+0.718)#9 | 0.028%(+0.937)#64 |
| 10. | Osseo | 0.95% | 0.25%(+0.702)#10 | 0.028%(+0.921)#65 |
| 11. | Sandstone | 0.90% | 0.25%(+0.649)#11 | 0.028%(+0.868)#68 |
| 12. | Crystal | 0.86% | 0.25%(+0.611)#12 | 0.028%(+0.830)#73 |
| 13. | New Brighton | 0.77% | 0.25%(+0.522)#13 | 0.028%(+0.741)#82 |
| 14. | Austin | 0.73% | 0.25%(+0.487)#14 | 0.028%(+0.706)#85 |
| 15. | Hampton | 0.68% | 0.25%(+0.430)#15 | 0.028%(+0.649)#91 |
| 16. | Maple Plain | 0.67% | 0.25%(+0.427)#16 | 0.028%(+0.646)#92 |
| 17. | Kandiyohi | 0.64% | 0.25%(+0.390)#17 | 0.028%(+0.609)#100 |
| 18. | St Michael | 0.58% | 0.25%(+0.337)#18 | 0.028%(+0.557)#106 |
| 19. | Fridley | 0.58% | 0.25%(+0.335)#19 | 0.028%(+0.554)#107 |
| 20. | St Anthony City Hennepin And Ramsey Counties | 0.51% | 0.25%(+0.267)#20 | 0.028%(+0.486)#118 |
| 21. | Buhl | 0.49% | 0.25%(+0.239)#21 | 0.028%(+0.458)#125 |
| 22. | Ramsey | 0.43% | 0.25%(+0.185)#22 | 0.028%(+0.404)#134 |
| 23. | Long Lake | 0.35% | 0.25%(+0.103)#23 | 0.028%(+0.322)#148 |
| 24. | Rush City | 0.31% | 0.25%(+0.062)#24 | 0.028%(+0.281)#166 |
| 25. | Inver Grove Heights | 0.27% | 0.25%(+0.027)#25 | 0.028%(+0.247)#173 |
| 26. | Bemidji | 0.27% | 0.25%(+0.025)#26 | 0.028%(+0.244)#174 |
| 27. | Milaca | 0.26% | 0.25%(+0.017)#27 | 0.028%(+0.236)#176 |
| 28. | Plymouth | 0.26% | 0.25%(+0.014)#28 | 0.028%(+0.234)#178 |
| 29. | West St Paul | 0.26% | 0.25%(+0.012)#29 | 0.028%(+0.231)#179 |
| 30. | Woodbury | 0.25% | 0.25%(+0.003)#30 | 0.028%(+0.222)#186 |
| 31. | Bloomington | 0.25% | 0.25%(+0.002)#31 | 0.028%(+0.221)#188 |
| 32. | Apple Valley | 0.23% | 0.25%(-0.013)#32 | 0.028%(+0.206)#196 |
| 33. | Edina | 0.21% | 0.25%(-0.034)#33 | 0.028%(+0.185)#209 |
| 34. | South St Paul | 0.21% | 0.25%(-0.038)#34 | 0.028%(+0.181)#213 |
| 35. | St Francis | 0.21% | 0.25%(-0.040)#35 | 0.028%(+0.179)#214 |
| 36. | Moorhead | 0.21% | 0.25%(-0.040)#36 | 0.028%(+0.179)#215 |
| 37. | Minnetonka | 0.16% | 0.25%(-0.090)#37 | 0.028%(+0.129)#252 |
| 38. | Blaine | 0.14% | 0.25%(-0.106)#38 | 0.028%(+0.113)#265 |
| 39. | St Paul | 0.14% | 0.25%(-0.107)#39 | 0.028%(+0.113)#266 |
| 40. | Mankato | 0.14% | 0.25%(-0.108)#40 | 0.028%(+0.112)#267 |
| 41. | Coon Rapids | 0.13% | 0.25%(-0.119)#41 | 0.028%(+0.100)#279 |
| 42. | Hallock | 0.12% | 0.25%(-0.122)#42 | 0.028%(+0.097)#281 |
| 43. | Savage | 0.12% | 0.25%(-0.127)#43 | 0.028%(+0.092)#285 |
| 44. | Eagan | 0.12% | 0.25%(-0.131)#44 | 0.028%(+0.088)#291 |
| 45. | Robbinsdale | 0.11% | 0.25%(-0.137)#45 | 0.028%(+0.083)#297 |
| 46. | Chatfield | 0.11% | 0.25%(-0.138)#46 | 0.028%(+0.081)#299 |
| 47. | Cloquet | 0.10% | 0.25%(-0.144)#47 | 0.028%(+0.076)#309 |
| 48. | Minneapolis | 0.10% | 0.25%(-0.144)#48 | 0.028%(+0.075)#310 |
| 49. | Lakeville | 0.091% | 0.25%(-0.157)#49 | 0.028%(+0.063)#330 |
| 50. | Winona | 0.088% | 0.25%(-0.159)#50 | 0.028%(+0.060)#333 |
| 51. | Montevideo | 0.075% | 0.25%(-0.172)#51 | 0.028%(+0.047)#358 |
| 52. | St Cloud | 0.073% | 0.25%(-0.175)#52 | 0.028%(+0.045)#369 |
| 53. | Oakdale | 0.071% | 0.25%(-0.176)#53 | 0.028%(+0.043)#371 |
| 54. | Richfield | 0.068% | 0.25%(-0.179)#54 | 0.028%(+0.040)#374 |
| 55. | Faribault | 0.057% | 0.25%(-0.190)#55 | 0.028%(+0.029)#398 |
| 56. | Eden Prairie | 0.055% | 0.25%(-0.192)#56 | 0.028%(+0.027)#403 |
| 57. | Morris | 0.039% | 0.25%(-0.208)#57 | 0.028%(+0.011)#444 |
| 58. | Arden Hills | 0.031% | 0.25%(-0.217)#58 | 0.028%(+0.003)#470 |
| 59. | Chaska | 0.029% | 0.25%(-0.218)#59 | 0.028%(+0.001)#484 |
| 60. | Owatonna | 0.027% | 0.25%(-0.221)#60 | 0.028%(-0.001)#496 |
| 61. | Burnsville | 0.025% | 0.25%(-0.222)#61 | 0.028%(-0.003)#507 |
| 62. | Elk River | 0.023% | 0.25%(-0.224)#62 | 0.028%(-0.005)#515 |
| 63. | Farmington | 0.021% | 0.25%(-0.226)#63 | 0.028%(-0.007)#527 |
| 64. | Anoka | 0.017% | 0.25%(-0.230)#64 | 0.028%(-0.011)#552 |
| 65. | Golden Valley | 0.014% | 0.25%(-0.234)#65 | 0.028%(-0.014)#567 |
| 66. | Shorewood | 0.013% | 0.25%(-0.234)#66 | 0.028%(-0.015)#574 |
| 67. | St Louis Park | 0.0061% | 0.25%(-0.241)#67 | 0.028%(-0.022)#617 |
| 68. | Red Wing | 0.0060% | 0.25%(-0.241)#68 | 0.028%(-0.022)#619 |
| 69. | Willmar | 0.0048% | 0.25%(-0.242)#69 | 0.028%(-0.023)#623 |
| 70. | Shoreview | 0.0037% | 0.25%(-0.243)#70 | 0.028%(-0.024)#628 |
| 71. | Rochester | 0.0025% | 0.25%(-0.245)#71 | 0.028%(-0.025)#632 |
| 72. | Duluth | 0.0023% | 0.25%(-0.245)#72 | 0.028%(-0.026)#634 |
Common Questions
What are the Top 10 Cities with the Highest Percentage of Liberian Population in Minnesota?
Top 10 Cities with the Highest Percentage of Liberian Population in Minnesota are:
#1
7.79%
#2
5.63%
#3
4.54%
#4
4.06%
#5
1.71%
#6
1.51%
#7
1.50%
#8
1.02%
#9
0.97%
#10
0.95%
What city has the Highest Percentage of Liberian Population in Minnesota?
Brooklyn Center has the Highest Percentage of Liberian Population in Minnesota with 7.79%.
What is the Percentage of Liberian Population in the State of Minnesota?
Percentage of Liberian Population in Minnesota is 0.25%.
What is the Percentage of Liberian Population in the United States?
Percentage of Liberian Population in the United States is 0.028%.