Falcon Heights, MN Map & Demographics
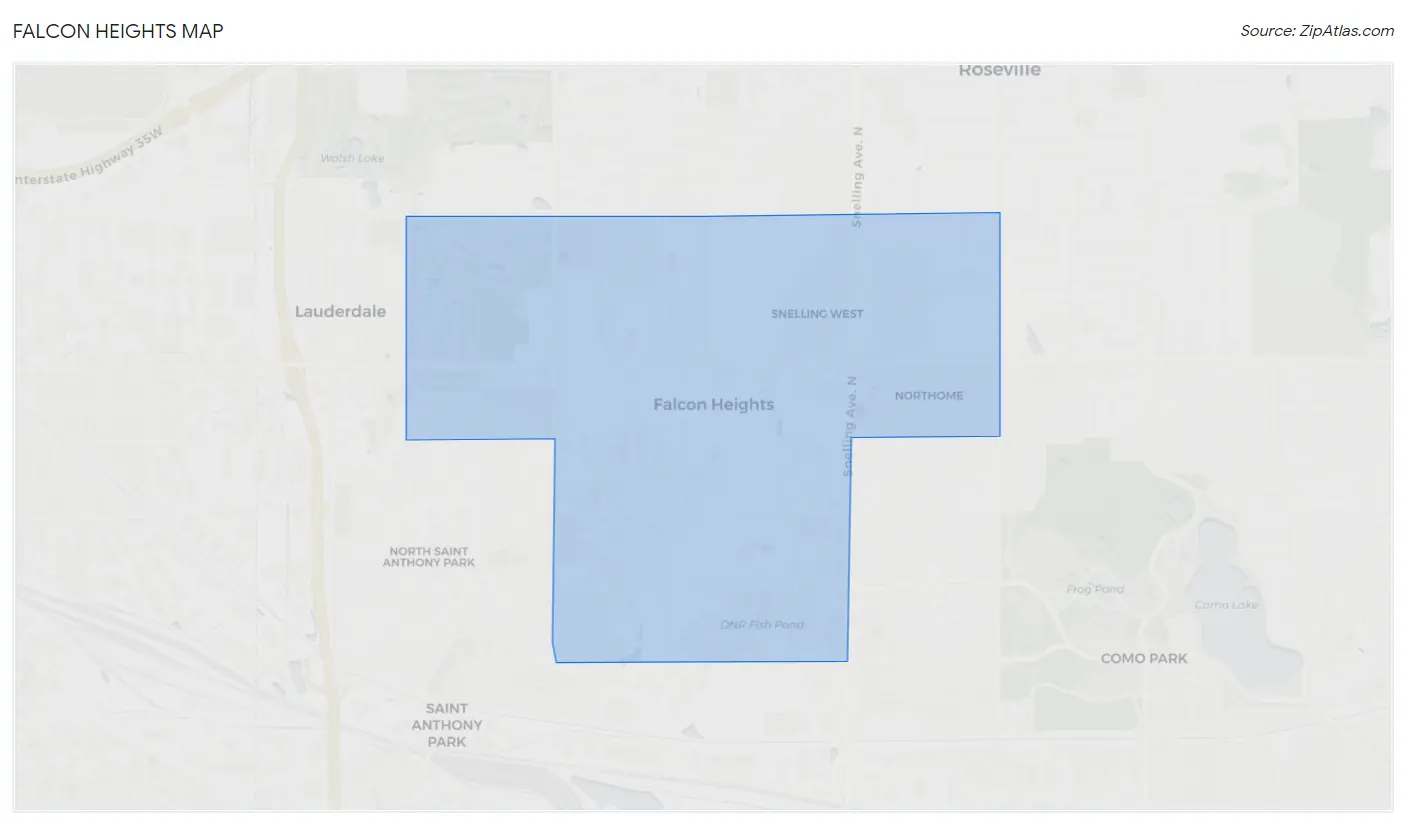
Falcon Heights Map
Falcon Heights Overview
$47,425
PER CAPITA INCOME
$133,650
AVG FAMILY INCOME
$87,750
AVG HOUSEHOLD INCOME
33.4%
WAGE / INCOME GAP [ % ]
66.6¢/ $1
WAGE / INCOME GAP [ $ ]
0.45
INEQUALITY / GINI INDEX
5,232
TOTAL POPULATION
2,493
MALE POPULATION
2,739
FEMALE POPULATION
91.02
MALES / 100 FEMALES
109.87
FEMALES / 100 MALES
36.1
MEDIAN AGE
3.0
AVG FAMILY SIZE
2.3
AVG HOUSEHOLD SIZE
3,105
LABOR FORCE [ PEOPLE ]
70.5%
PERCENT IN LABOR FORCE
8.1%
UNEMPLOYMENT RATE
Income in Falcon Heights
Income Overview in Falcon Heights
Per Capita Income in Falcon Heights is $47,425, while median incomes of families and households are $133,650 and $87,750 respectively.
| Characteristic | Number | Measure |
| Per Capita Income | 5,232 | $47,425 |
| Median Family Income | 1,203 | $133,650 |
| Mean Family Income | 1,203 | $152,945 |
| Median Household Income | 2,050 | $87,750 |
| Mean Household Income | 2,050 | $117,002 |
| Income Deficit | 1,203 | $0 |
| Wage / Income Gap (%) | 5,232 | 33.39% |
| Wage / Income Gap ($) | 5,232 | 66.61¢ per $1 |
| Gini / Inequality Index | 5,232 | 0.45 |
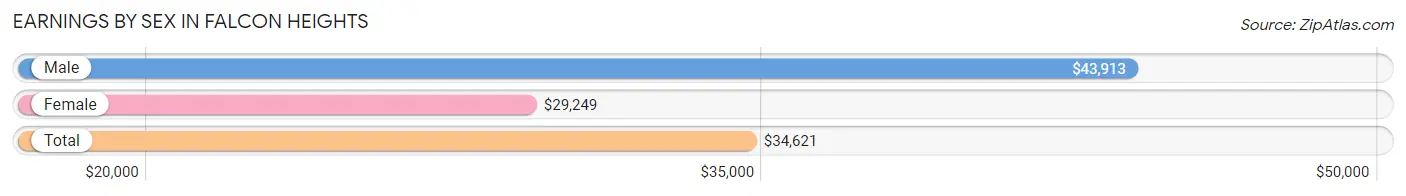
Earnings by Sex in Falcon Heights
Average Earnings in Falcon Heights are $34,621, $43,913 for men and $29,249 for women, a difference of 33.4%.
| Sex | Number | Average Earnings |
| Male | 1,714 (50.1%) | $43,913 |
| Female | 1,710 (49.9%) | $29,249 |
| Total | 3,424 (100.0%) | $34,621 |
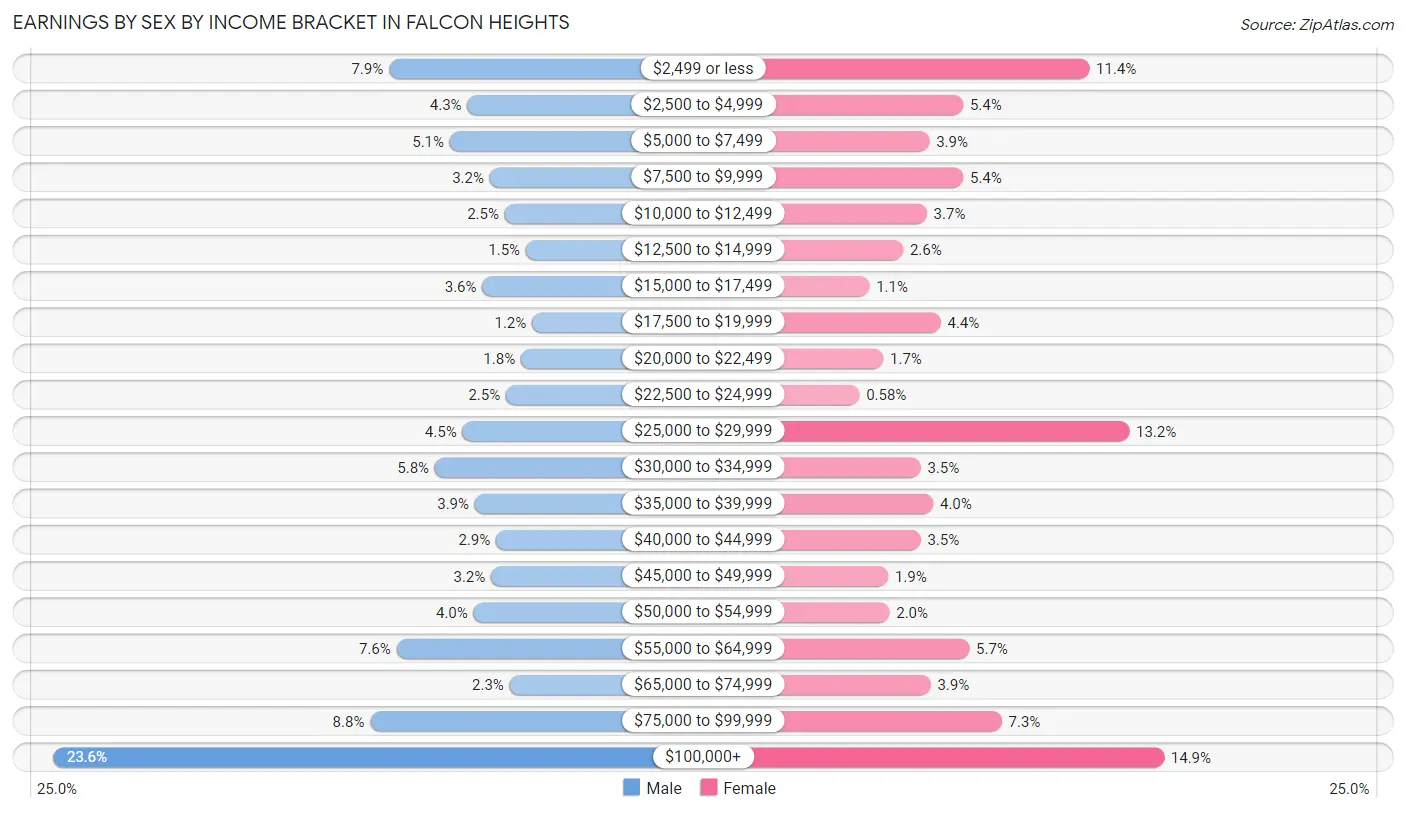
Earnings by Sex by Income Bracket in Falcon Heights
The most common earnings brackets in Falcon Heights are $100,000+ for men (405 | 23.6%) and $100,000+ for women (254 | 14.8%).
| Income | Male | Female |
| $2,499 or less | 136 (7.9%) | 194 (11.4%) |
| $2,500 to $4,999 | 73 (4.3%) | 93 (5.4%) |
| $5,000 to $7,499 | 87 (5.1%) | 66 (3.9%) |
| $7,500 to $9,999 | 55 (3.2%) | 93 (5.4%) |
| $10,000 to $12,499 | 43 (2.5%) | 64 (3.7%) |
| $12,500 to $14,999 | 26 (1.5%) | 45 (2.6%) |
| $15,000 to $17,499 | 61 (3.6%) | 18 (1.1%) |
| $17,500 to $19,999 | 21 (1.2%) | 75 (4.4%) |
| $20,000 to $22,499 | 30 (1.8%) | 29 (1.7%) |
| $22,500 to $24,999 | 42 (2.5%) | 10 (0.6%) |
| $25,000 to $29,999 | 77 (4.5%) | 226 (13.2%) |
| $30,000 to $34,999 | 99 (5.8%) | 59 (3.5%) |
| $35,000 to $39,999 | 67 (3.9%) | 69 (4.0%) |
| $40,000 to $44,999 | 50 (2.9%) | 59 (3.5%) |
| $45,000 to $49,999 | 54 (3.2%) | 33 (1.9%) |
| $50,000 to $54,999 | 68 (4.0%) | 34 (2.0%) |
| $55,000 to $64,999 | 130 (7.6%) | 98 (5.7%) |
| $65,000 to $74,999 | 39 (2.3%) | 67 (3.9%) |
| $75,000 to $99,999 | 151 (8.8%) | 124 (7.2%) |
| $100,000+ | 405 (23.6%) | 254 (14.8%) |
| Total | 1,714 (100.0%) | 1,710 (100.0%) |
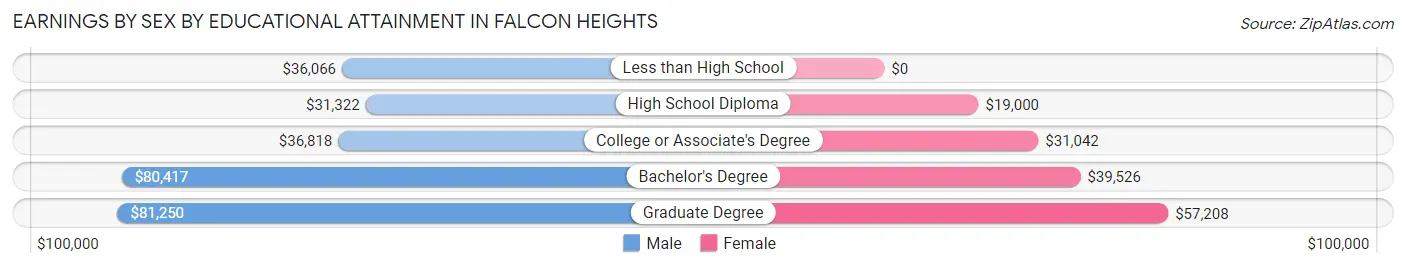
Earnings by Sex by Educational Attainment in Falcon Heights
Average earnings in Falcon Heights are $59,330 for men and $40,000 for women, a difference of 32.6%. Men with an educational attainment of graduate degree enjoy the highest average annual earnings of $81,250, while those with high school diploma education earn the least with $31,322. Women with an educational attainment of graduate degree earn the most with the average annual earnings of $57,208, while those with high school diploma education have the smallest earnings of $19,000.
| Educational Attainment | Male Income | Female Income |
| Less than High School | $36,066 | $0 |
| High School Diploma | $31,322 | $19,000 |
| College or Associate's Degree | $36,818 | $31,042 |
| Bachelor's Degree | $80,417 | $39,526 |
| Graduate Degree | $81,250 | $57,208 |
| Total | $59,330 | $40,000 |
Family Income in Falcon Heights
Family Income Brackets in Falcon Heights
According to the Falcon Heights family income data, there are 351 families falling into the $150,000 to $199,999 income range, which is the most common income bracket and makes up 29.2% of all families.
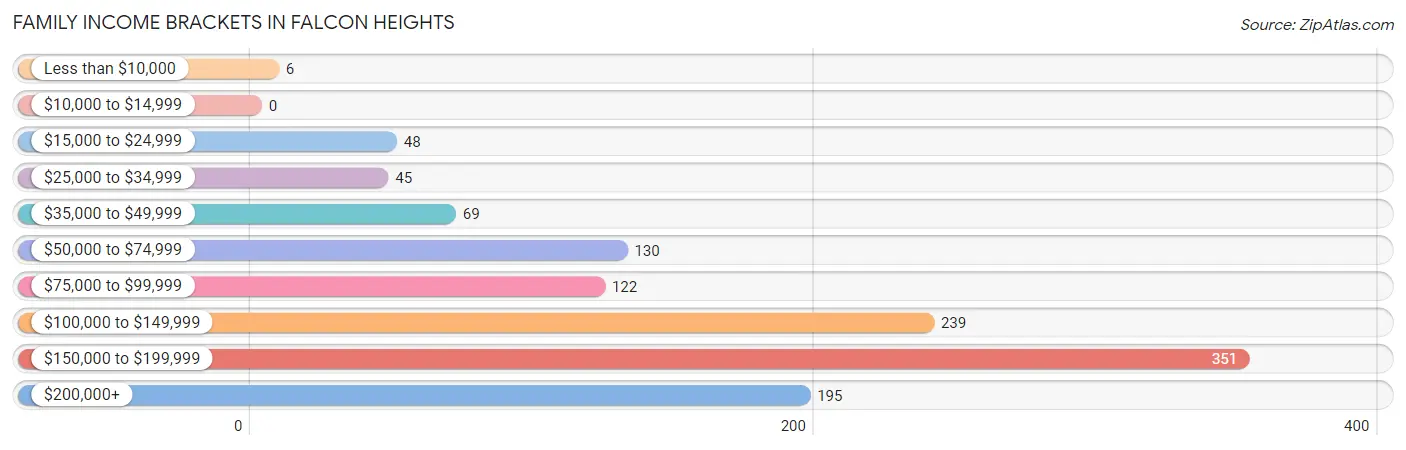
| Income Bracket | # Families | % Families |
| Less than $10,000 | 6 | 0.5% |
| $10,000 to $14,999 | 0 | 0.0% |
| $15,000 to $24,999 | 48 | 4.0% |
| $25,000 to $34,999 | 45 | 3.7% |
| $35,000 to $49,999 | 69 | 5.7% |
| $50,000 to $74,999 | 130 | 10.8% |
| $75,000 to $99,999 | 122 | 10.1% |
| $100,000 to $149,999 | 239 | 19.9% |
| $150,000 to $199,999 | 351 | 29.2% |
| $200,000+ | 195 | 16.2% |
Family Income by Famaliy Size in Falcon Heights
6-person families (92 | 7.6%) account for the highest median family income in Falcon Heights with $197,788 per family, while 2-person families (671 | 55.8%) have the highest median income of $65,134 per family member.
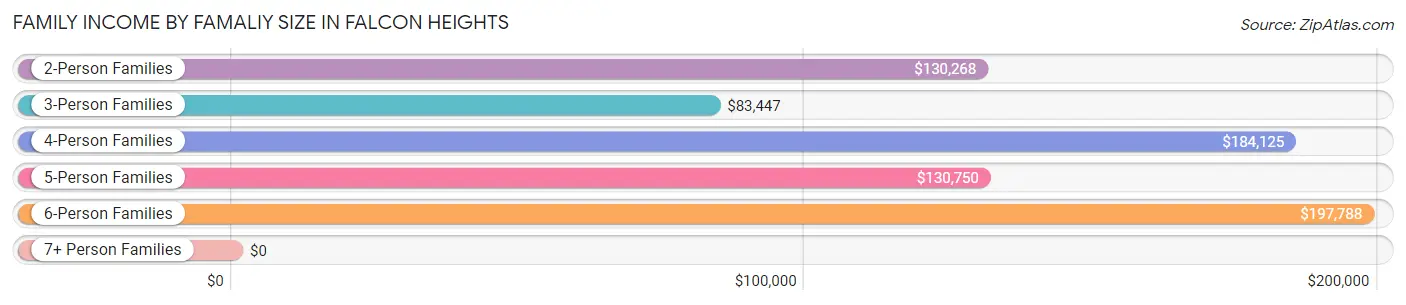
| Income Bracket | # Families | Median Income |
| 2-Person Families | 671 (55.8%) | $130,268 |
| 3-Person Families | 217 (18.0%) | $83,447 |
| 4-Person Families | 165 (13.7%) | $184,125 |
| 5-Person Families | 58 (4.8%) | $130,750 |
| 6-Person Families | 92 (7.6%) | $197,788 |
| 7+ Person Families | 0 (0.0%) | $0 |
| Total | 1,203 (100.0%) | $133,650 |
Family Income by Number of Earners in Falcon Heights
The median family income in Falcon Heights is $133,650, with families comprising 3+ earners (170) having the highest median family income of $198,173, while families with 1 earner (300) have the lowest median family income of $95,000, accounting for 14.1% and 24.9% of families, respectively.
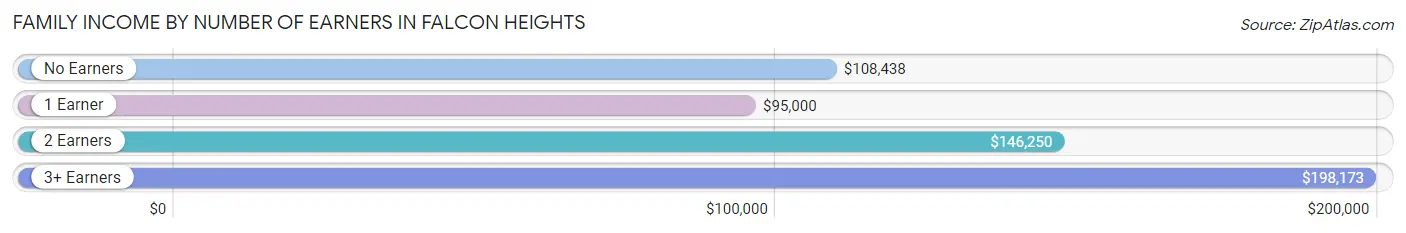
| Number of Earners | # Families | Median Income |
| No Earners | 120 (10.0%) | $108,438 |
| 1 Earner | 300 (24.9%) | $95,000 |
| 2 Earners | 613 (51.0%) | $146,250 |
| 3+ Earners | 170 (14.1%) | $198,173 |
| Total | 1,203 (100.0%) | $133,650 |
Household Income in Falcon Heights
Household Income Brackets in Falcon Heights
With 400 households falling in the category, the $150,000 to $199,999 income range is the most frequent in Falcon Heights, accounting for 19.5% of all households. In contrast, only 27 households (1.3%) fall into the $10,000 to $14,999 income bracket, making it the least populous group.
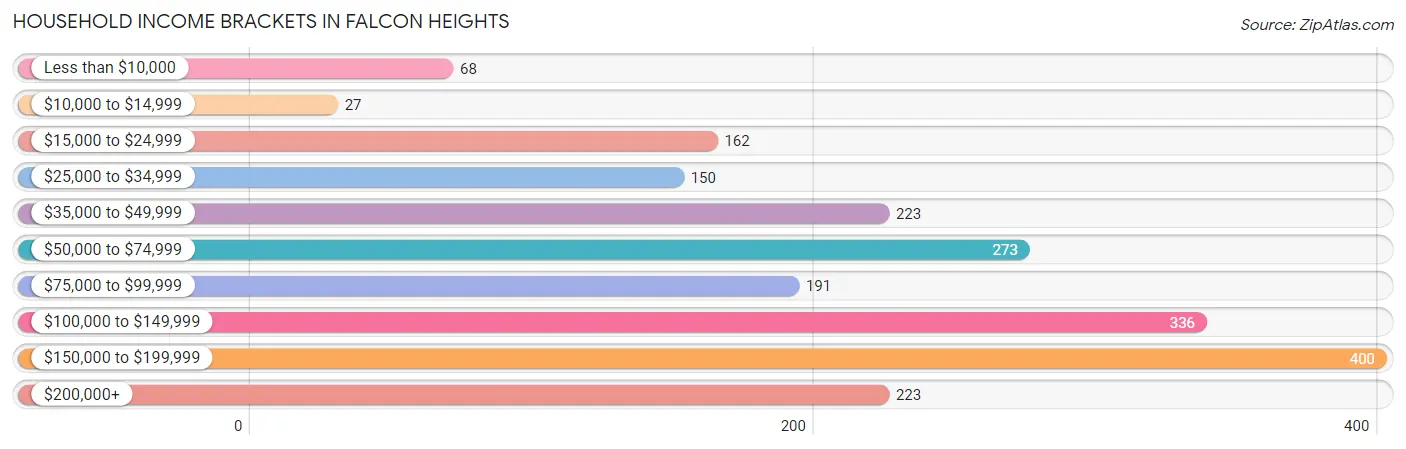
| Income Bracket | # Households | % Households |
| Less than $10,000 | 68 | 3.3% |
| $10,000 to $14,999 | 27 | 1.3% |
| $15,000 to $24,999 | 162 | 7.9% |
| $25,000 to $34,999 | 150 | 7.3% |
| $35,000 to $49,999 | 223 | 10.9% |
| $50,000 to $74,999 | 273 | 13.3% |
| $75,000 to $99,999 | 191 | 9.3% |
| $100,000 to $149,999 | 336 | 16.4% |
| $150,000 to $199,999 | 400 | 19.5% |
| $200,000+ | 223 | 10.9% |
Household Income by Householder Age in Falcon Heights
The median household income in Falcon Heights is $87,750, with the highest median household income of $136,875 found in the 45 to 64 years age bracket for the primary householder. A total of 568 households (27.7%) fall into this category. Meanwhile, the 15 to 24 years age bracket for the primary householder has the lowest median household income of $41,818, with 90 households (4.4%) in this group.
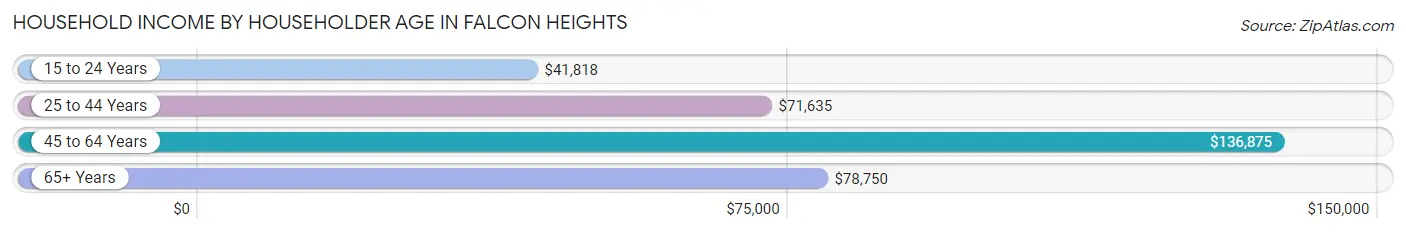
| Income Bracket | # Households | Median Income |
| 15 to 24 Years | 90 (4.4%) | $41,818 |
| 25 to 44 Years | 777 (37.9%) | $71,635 |
| 45 to 64 Years | 568 (27.7%) | $136,875 |
| 65+ Years | 615 (30.0%) | $78,750 |
| Total | 2,050 (100.0%) | $87,750 |
Poverty in Falcon Heights
Income Below Poverty by Sex and Age in Falcon Heights
With 6.1% poverty level for males and 7.8% for females among the residents of Falcon Heights, 18 to 24 year old males and 18 to 24 year old females are the most vulnerable to poverty, with 45 males (24.6%) and 64 females (28.7%) in their respective age groups living below the poverty level.
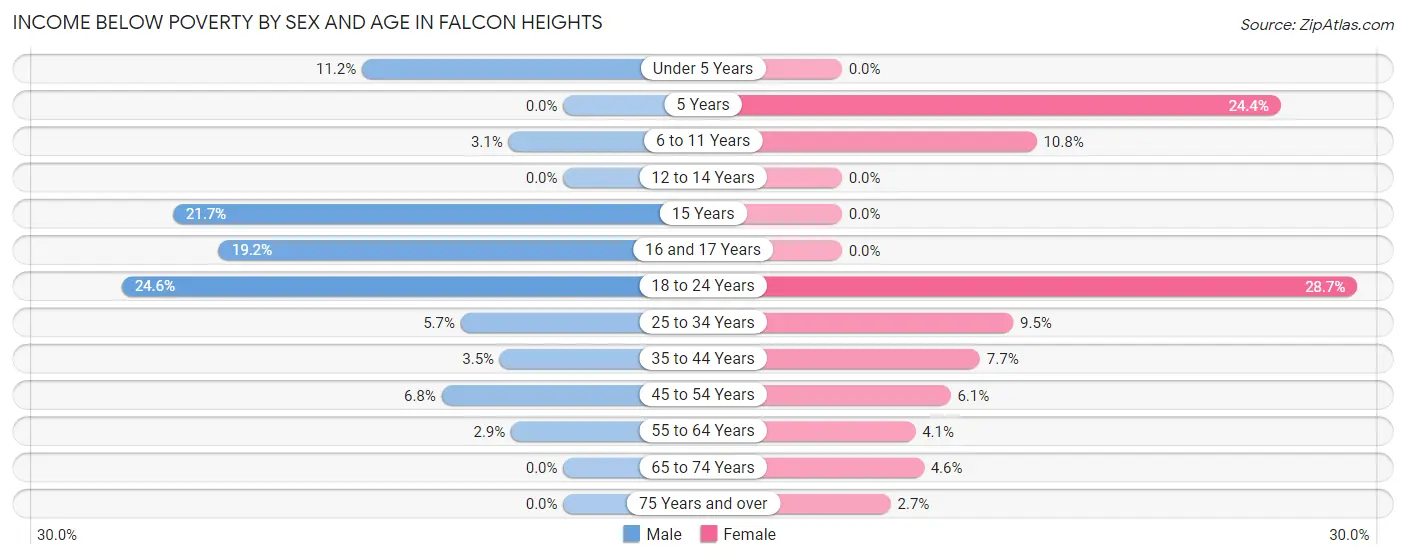
| Age Bracket | Male | Female |
| Under 5 Years | 12 (11.2%) | 0 (0.0%) |
| 5 Years | 0 (0.0%) | 11 (24.4%) |
| 6 to 11 Years | 6 (3.0%) | 9 (10.8%) |
| 12 to 14 Years | 0 (0.0%) | 0 (0.0%) |
| 15 Years | 5 (21.7%) | 0 (0.0%) |
| 16 and 17 Years | 14 (19.2%) | 0 (0.0%) |
| 18 to 24 Years | 45 (24.6%) | 64 (28.7%) |
| 25 to 34 Years | 22 (5.7%) | 37 (9.5%) |
| 35 to 44 Years | 12 (3.5%) | 28 (7.7%) |
| 45 to 54 Years | 16 (6.8%) | 15 (6.0%) |
| 55 to 64 Years | 8 (2.9%) | 14 (4.1%) |
| 65 to 74 Years | 0 (0.0%) | 11 (4.6%) |
| 75 Years and over | 0 (0.0%) | 8 (2.7%) |
| Total | 140 (6.1%) | 197 (7.8%) |
Income Above Poverty by Sex and Age in Falcon Heights
According to the poverty statistics in Falcon Heights, males aged 5 years and females aged under 5 years are the age groups that are most secure financially, with 100.0% of males and 100.0% of females in these age groups living above the poverty line.
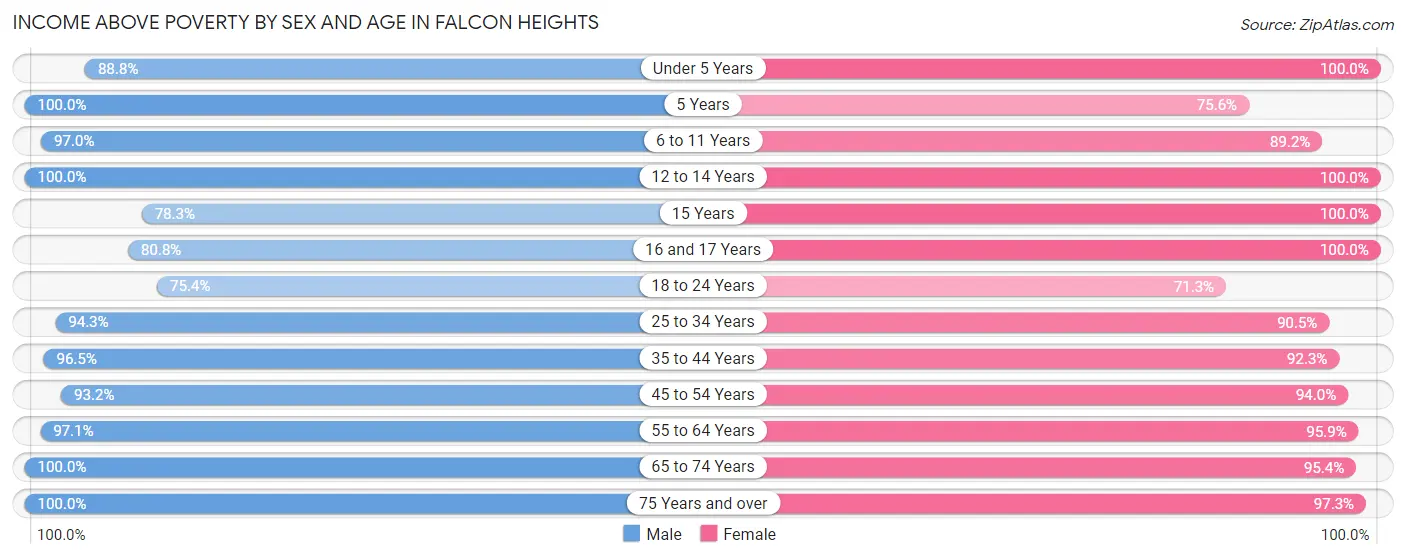
| Age Bracket | Male | Female |
| Under 5 Years | 95 (88.8%) | 139 (100.0%) |
| 5 Years | 34 (100.0%) | 34 (75.6%) |
| 6 to 11 Years | 191 (97.0%) | 74 (89.2%) |
| 12 to 14 Years | 70 (100.0%) | 43 (100.0%) |
| 15 Years | 18 (78.3%) | 62 (100.0%) |
| 16 and 17 Years | 59 (80.8%) | 59 (100.0%) |
| 18 to 24 Years | 138 (75.4%) | 159 (71.3%) |
| 25 to 34 Years | 363 (94.3%) | 351 (90.5%) |
| 35 to 44 Years | 328 (96.5%) | 336 (92.3%) |
| 45 to 54 Years | 220 (93.2%) | 233 (94.0%) |
| 55 to 64 Years | 267 (97.1%) | 328 (95.9%) |
| 65 to 74 Years | 170 (100.0%) | 230 (95.4%) |
| 75 Years and over | 182 (100.0%) | 286 (97.3%) |
| Total | 2,135 (93.9%) | 2,334 (92.2%) |
Income Below Poverty Among Married-Couple Families in Falcon Heights
The poverty statistics for married-couple families in Falcon Heights show that 2.1% or 22 of the total 1,041 families live below the poverty line. Families with 1 or 2 children have the highest poverty rate of 5.1%, comprising of 16 families. On the other hand, families with no children have the lowest poverty rate of 0.0%, which includes 0 families.
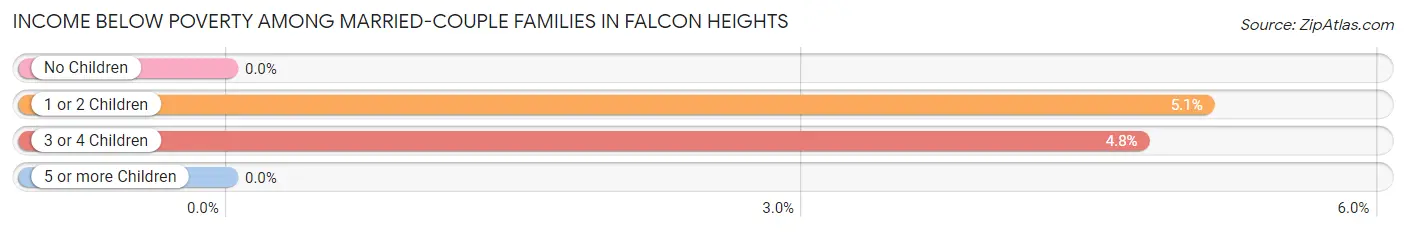
| Children | Above Poverty | Below Poverty |
| No Children | 601 (100.0%) | 0 (0.0%) |
| 1 or 2 Children | 298 (94.9%) | 16 (5.1%) |
| 3 or 4 Children | 120 (95.2%) | 6 (4.8%) |
| 5 or more Children | 0 (0.0%) | 0 (0.0%) |
| Total | 1,019 (97.9%) | 22 (2.1%) |
Income Below Poverty Among Single-Parent Households in Falcon Heights
According to the poverty data in Falcon Heights, 7.3% or 4 single-father households and 12.1% or 13 single-mother households are living below the poverty line. Among single-father households, those with 1 or 2 children have the highest poverty rate, with 4 households (11.8%) experiencing poverty. Likewise, among single-mother households, those with 1 or 2 children have the highest poverty rate, with 13 households (21.7%) falling below the poverty line.
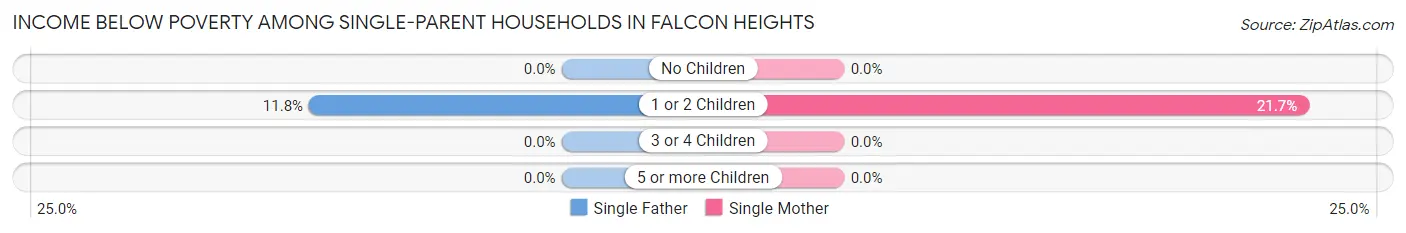
| Children | Single Father | Single Mother |
| No Children | 0 (0.0%) | 0 (0.0%) |
| 1 or 2 Children | 4 (11.8%) | 13 (21.7%) |
| 3 or 4 Children | 0 (0.0%) | 0 (0.0%) |
| 5 or more Children | 0 (0.0%) | 0 (0.0%) |
| Total | 4 (7.3%) | 13 (12.1%) |
Income Below Poverty Among Married-Couple vs Single-Parent Households in Falcon Heights
The poverty data for Falcon Heights shows that 22 of the married-couple family households (2.1%) and 17 of the single-parent households (10.5%) are living below the poverty level. Within the married-couple family households, those with 1 or 2 children have the highest poverty rate, with 16 households (5.1%) falling below the poverty line. Among the single-parent households, those with 1 or 2 children have the highest poverty rate, with 17 household (18.1%) living below poverty.
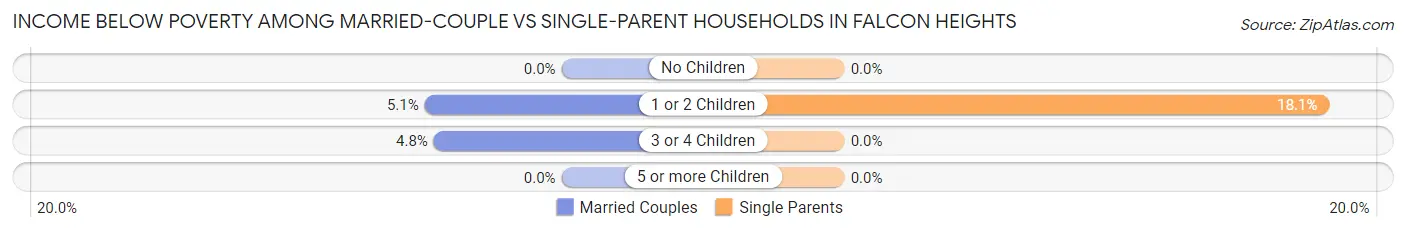
| Children | Married-Couple Families | Single-Parent Households |
| No Children | 0 (0.0%) | 0 (0.0%) |
| 1 or 2 Children | 16 (5.1%) | 17 (18.1%) |
| 3 or 4 Children | 6 (4.8%) | 0 (0.0%) |
| 5 or more Children | 0 (0.0%) | 0 (0.0%) |
| Total | 22 (2.1%) | 17 (10.5%) |
Race in Falcon Heights
The most populous races in Falcon Heights are White / Caucasian (3,925 | 75.0%), Asian (662 | 12.7%), and Black / African American (337 | 6.4%).
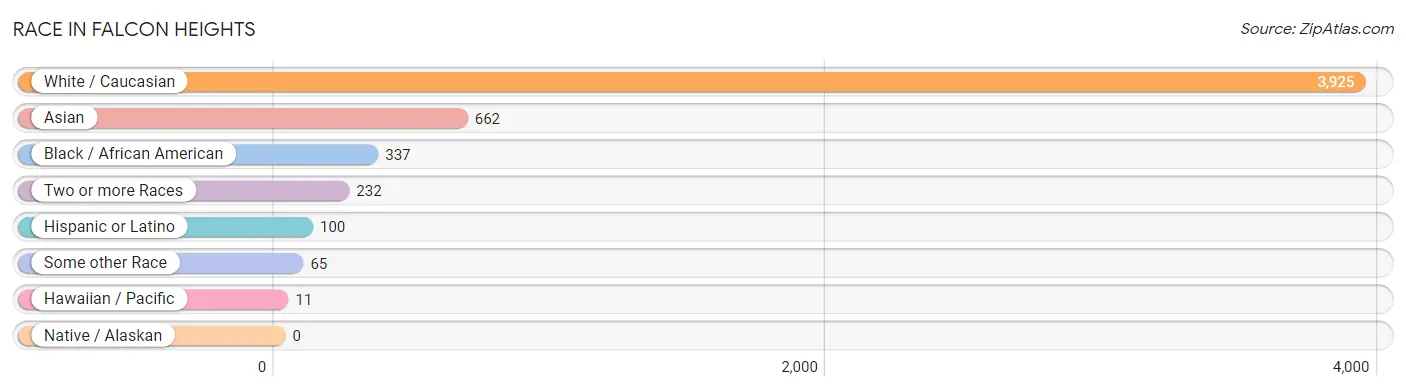
| Race | # Population | % Population |
| Asian | 662 | 12.7% |
| Black / African American | 337 | 6.4% |
| Hawaiian / Pacific | 11 | 0.2% |
| Hispanic or Latino | 100 | 1.9% |
| Native / Alaskan | 0 | 0.0% |
| White / Caucasian | 3,925 | 75.0% |
| Two or more Races | 232 | 4.4% |
| Some other Race | 65 | 1.2% |
| Total | 5,232 | 100.0% |
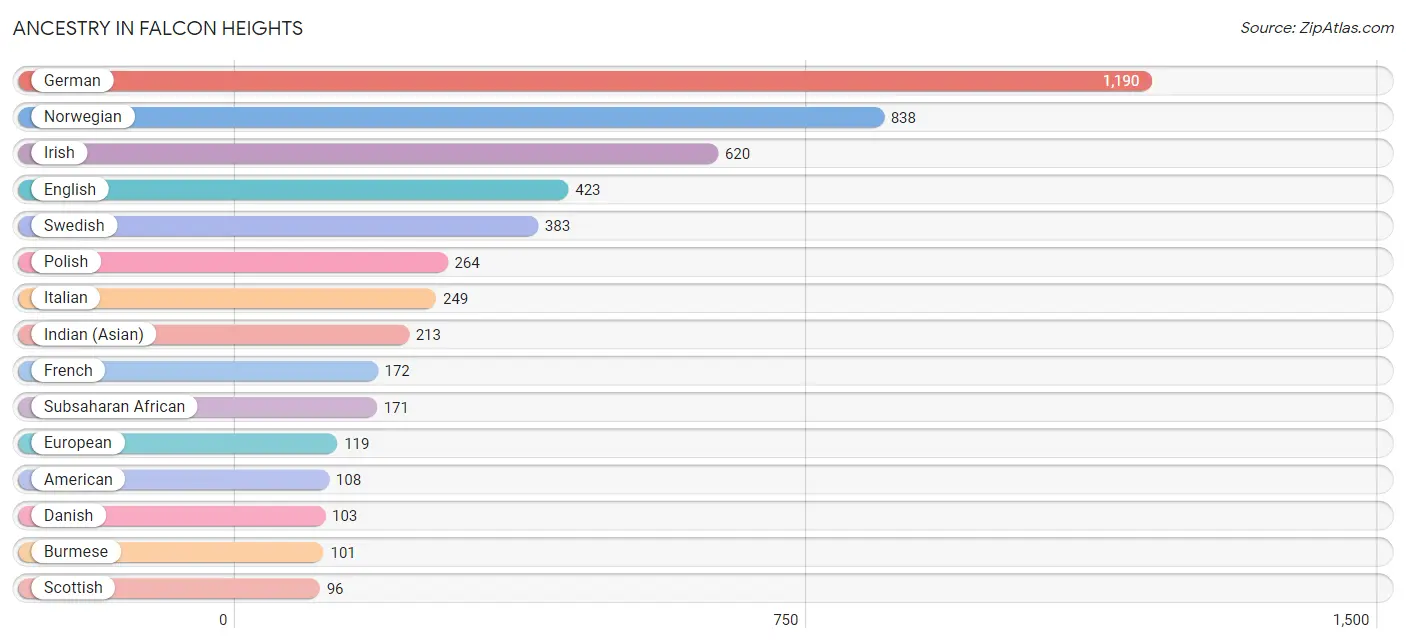
Ancestry in Falcon Heights
The most populous ancestries reported in Falcon Heights are German (1,190 | 22.7%), Norwegian (838 | 16.0%), Irish (620 | 11.8%), English (423 | 8.1%), and Swedish (383 | 7.3%), together accounting for 66.0% of all Falcon Heights residents.
| Ancestry | # Population | % Population |
| African | 38 | 0.7% |
| American | 108 | 2.1% |
| Arab | 67 | 1.3% |
| Australian | 3 | 0.1% |
| Austrian | 19 | 0.4% |
| Bangladeshi | 88 | 1.7% |
| Belgian | 7 | 0.1% |
| Bhutanese | 69 | 1.3% |
| Bolivian | 31 | 0.6% |
| Brazilian | 10 | 0.2% |
| British | 50 | 1.0% |
| Bulgarian | 5 | 0.1% |
| Burmese | 101 | 1.9% |
| Cambodian | 23 | 0.4% |
| Canadian | 5 | 0.1% |
| Central American | 10 | 0.2% |
| Chippewa | 3 | 0.1% |
| Croatian | 11 | 0.2% |
| Czech | 48 | 0.9% |
| Czechoslovakian | 17 | 0.3% |
| Danish | 103 | 2.0% |
| Dutch | 48 | 0.9% |
| Eastern European | 14 | 0.3% |
| Egyptian | 42 | 0.8% |
| English | 423 | 8.1% |
| Ethiopian | 73 | 1.4% |
| European | 119 | 2.3% |
| Filipino | 41 | 0.8% |
| Finnish | 61 | 1.2% |
| French | 172 | 3.3% |
| French Canadian | 11 | 0.2% |
| German | 1,190 | 22.7% |
| Greek | 22 | 0.4% |
| Guyanese | 22 | 0.4% |
| Honduran | 10 | 0.2% |
| Hungarian | 8 | 0.2% |
| Indian (Asian) | 213 | 4.1% |
| Iranian | 8 | 0.2% |
| Irish | 620 | 11.8% |
| Italian | 249 | 4.8% |
| Korean | 23 | 0.4% |
| Latvian | 39 | 0.7% |
| Lebanese | 9 | 0.2% |
| Luxembourger | 25 | 0.5% |
| Mexican | 23 | 0.4% |
| Northern European | 40 | 0.8% |
| Norwegian | 838 | 16.0% |
| Peruvian | 3 | 0.1% |
| Polish | 264 | 5.1% |
| Portuguese | 22 | 0.4% |
| Potawatomi | 27 | 0.5% |
| Puerto Rican | 9 | 0.2% |
| Russian | 31 | 0.6% |
| Samoan | 22 | 0.4% |
| Scandinavian | 57 | 1.1% |
| Scotch-Irish | 37 | 0.7% |
| Scottish | 96 | 1.8% |
| Serbian | 39 | 0.7% |
| Slovak | 15 | 0.3% |
| Slovene | 26 | 0.5% |
| Somali | 37 | 0.7% |
| South American | 58 | 1.1% |
| South American Indian | 10 | 0.2% |
| Sri Lankan | 16 | 0.3% |
| Subsaharan African | 171 | 3.3% |
| Swedish | 383 | 7.3% |
| Swiss | 42 | 0.8% |
| Thai | 80 | 1.5% |
| Turkish | 9 | 0.2% |
| Ukrainian | 13 | 0.3% |
| Venezuelan | 24 | 0.5% |
| Vietnamese | 18 | 0.3% |
| Welsh | 29 | 0.5% |
| Zimbabwean | 7 | 0.1% | View All 74 Rows |
Immigrants in Falcon Heights
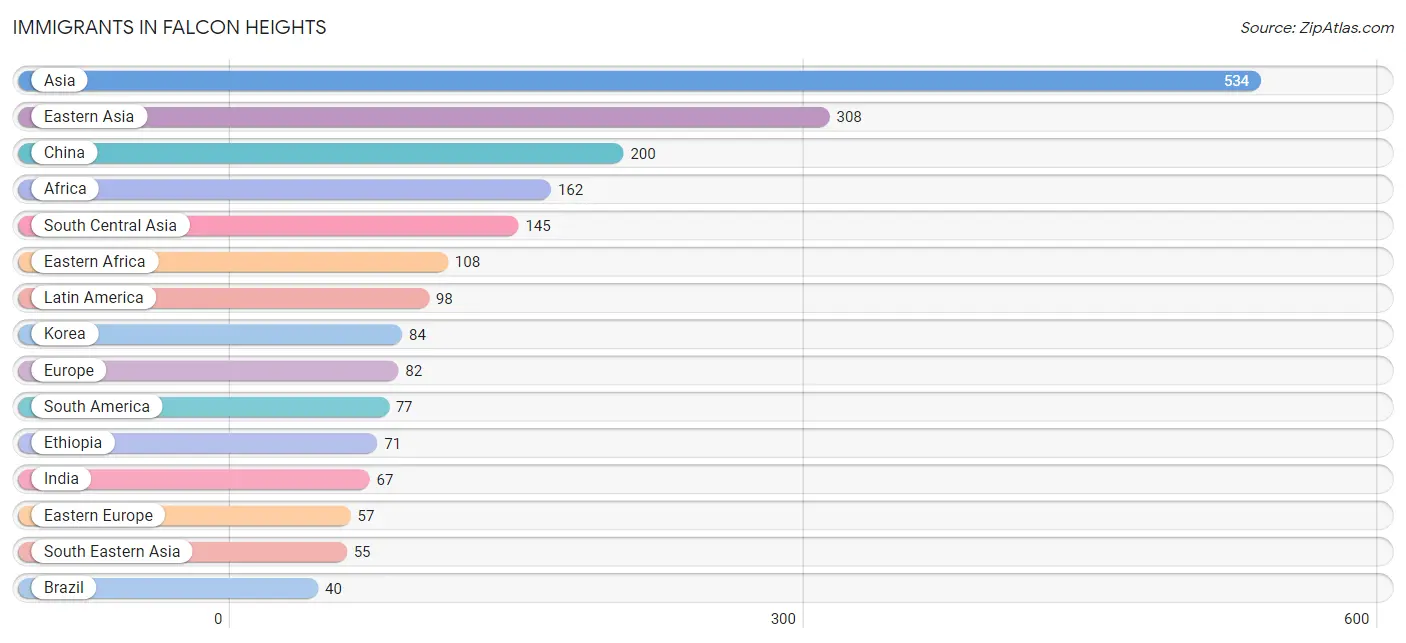
The most numerous immigrant groups reported in Falcon Heights came from Asia (534 | 10.2%), Eastern Asia (308 | 5.9%), China (200 | 3.8%), Africa (162 | 3.1%), and South Central Asia (145 | 2.8%), together accounting for 25.8% of all Falcon Heights residents.
| Immigration Origin | # Population | % Population |
| Africa | 162 | 3.1% |
| Asia | 534 | 10.2% |
| Australia | 3 | 0.1% |
| Bangladesh | 13 | 0.3% |
| Bolivia | 12 | 0.2% |
| Brazil | 40 | 0.8% |
| Bulgaria | 5 | 0.1% |
| Canada | 9 | 0.2% |
| Central America | 21 | 0.4% |
| China | 200 | 3.8% |
| Eastern Africa | 108 | 2.1% |
| Eastern Asia | 308 | 5.9% |
| Eastern Europe | 57 | 1.1% |
| Egypt | 26 | 0.5% |
| England | 6 | 0.1% |
| Ethiopia | 71 | 1.4% |
| Europe | 82 | 1.6% |
| Germany | 19 | 0.4% |
| Guyana | 22 | 0.4% |
| Honduras | 10 | 0.2% |
| Hong Kong | 11 | 0.2% |
| India | 67 | 1.3% |
| Iran | 8 | 0.2% |
| Japan | 13 | 0.3% |
| Jordan | 16 | 0.3% |
| Korea | 84 | 1.6% |
| Laos | 10 | 0.2% |
| Latin America | 98 | 1.9% |
| Latvia | 39 | 0.7% |
| Nepal | 22 | 0.4% |
| Nicaragua | 11 | 0.2% |
| Northern Africa | 26 | 0.5% |
| Northern Europe | 6 | 0.1% |
| Oceania | 14 | 0.3% |
| Pakistan | 35 | 0.7% |
| Peru | 3 | 0.1% |
| Philippines | 12 | 0.2% |
| Russia | 8 | 0.2% |
| Saudi Arabia | 5 | 0.1% |
| Serbia | 5 | 0.1% |
| Somalia | 37 | 0.7% |
| South America | 77 | 1.5% |
| South Central Asia | 145 | 2.8% |
| South Eastern Asia | 55 | 1.1% |
| Taiwan | 38 | 0.7% |
| Vietnam | 12 | 0.2% |
| Western Africa | 9 | 0.2% |
| Western Asia | 26 | 0.5% |
| Western Europe | 19 | 0.4% | View All 49 Rows |
Sex and Age in Falcon Heights
Sex and Age in Falcon Heights
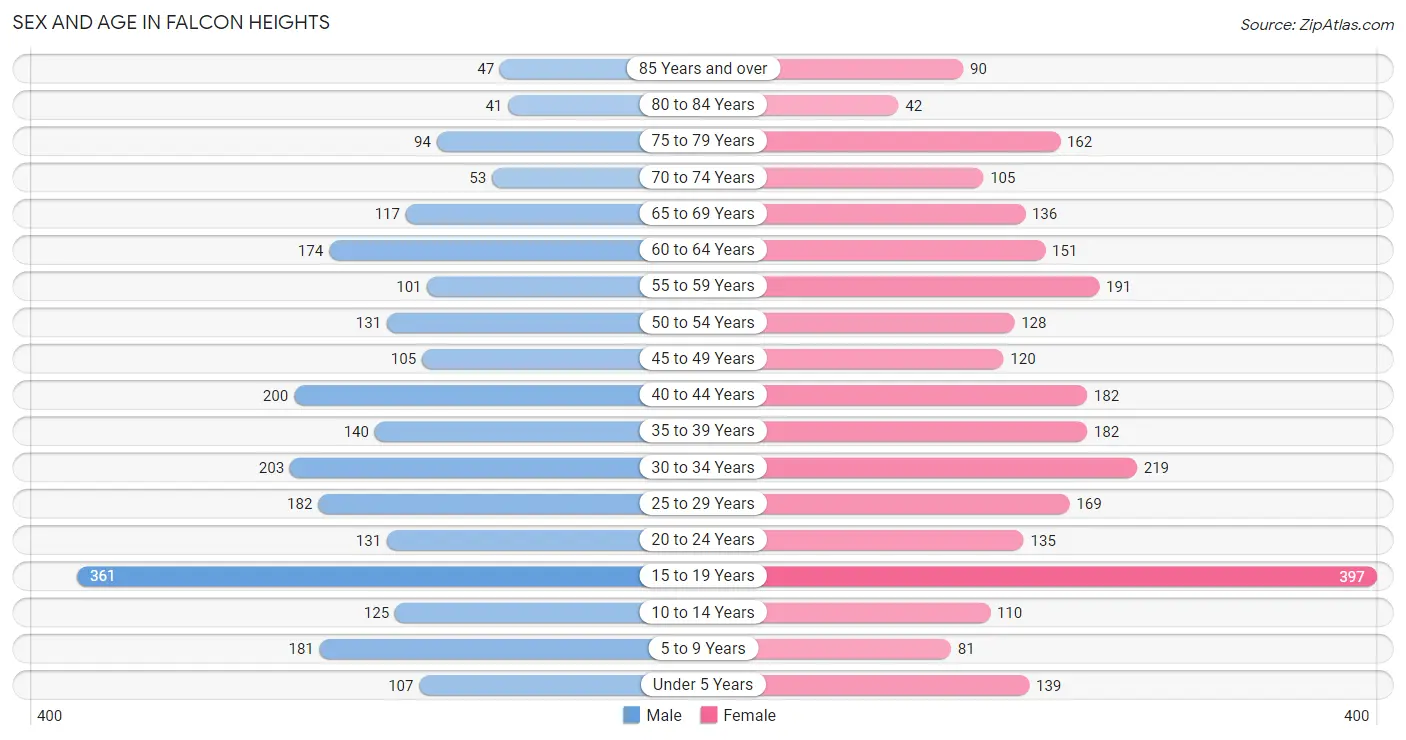
The most populous age groups in Falcon Heights are 15 to 19 Years (361 | 14.5%) for men and 15 to 19 Years (397 | 14.5%) for women.
| Age Bracket | Male | Female |
| Under 5 Years | 107 (4.3%) | 139 (5.1%) |
| 5 to 9 Years | 181 (7.3%) | 81 (3.0%) |
| 10 to 14 Years | 125 (5.0%) | 110 (4.0%) |
| 15 to 19 Years | 361 (14.5%) | 397 (14.5%) |
| 20 to 24 Years | 131 (5.2%) | 135 (4.9%) |
| 25 to 29 Years | 182 (7.3%) | 169 (6.2%) |
| 30 to 34 Years | 203 (8.1%) | 219 (8.0%) |
| 35 to 39 Years | 140 (5.6%) | 182 (6.6%) |
| 40 to 44 Years | 200 (8.0%) | 182 (6.6%) |
| 45 to 49 Years | 105 (4.2%) | 120 (4.4%) |
| 50 to 54 Years | 131 (5.2%) | 128 (4.7%) |
| 55 to 59 Years | 101 (4.1%) | 191 (7.0%) |
| 60 to 64 Years | 174 (7.0%) | 151 (5.5%) |
| 65 to 69 Years | 117 (4.7%) | 136 (5.0%) |
| 70 to 74 Years | 53 (2.1%) | 105 (3.8%) |
| 75 to 79 Years | 94 (3.8%) | 162 (5.9%) |
| 80 to 84 Years | 41 (1.6%) | 42 (1.5%) |
| 85 Years and over | 47 (1.9%) | 90 (3.3%) |
| Total | 2,493 (100.0%) | 2,739 (100.0%) |
Families and Households in Falcon Heights
Median Family Size in Falcon Heights
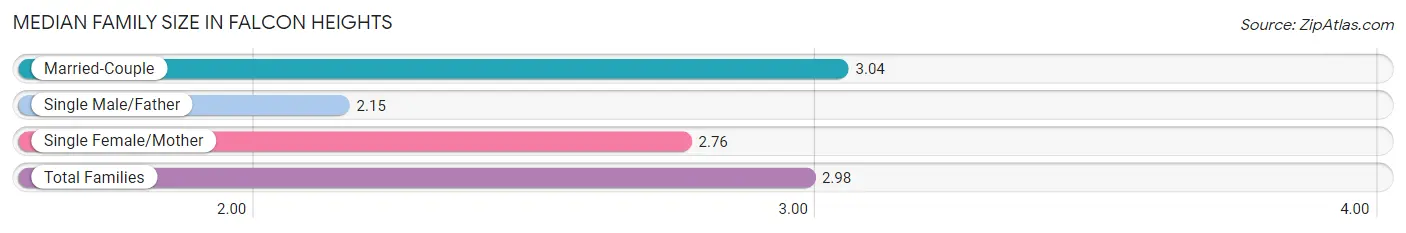
The median family size in Falcon Heights is 2.98 persons per family, with married-couple families (1,041 | 86.5%) accounting for the largest median family size of 3.04 persons per family. On the other hand, single male/father families (55 | 4.6%) represent the smallest median family size with 2.15 persons per family.
| Family Type | # Families | Family Size |
| Married-Couple | 1,041 (86.5%) | 3.04 |
| Single Male/Father | 55 (4.6%) | 2.15 |
| Single Female/Mother | 107 (8.9%) | 2.76 |
| Total Families | 1,203 (100.0%) | 2.98 |
Median Household Size in Falcon Heights
The median household size in Falcon Heights is 2.34 persons per household, with married-couple households (1,041 | 50.8%) accounting for the largest median household size of 3.06 persons per household. non-family households (847 | 41.3%) represent the smallest median household size with 1.39 persons per household.

| Household Type | # Households | Household Size |
| Married-Couple | 1,041 (50.8%) | 3.06 |
| Single Male/Father | 55 (2.7%) | 2.33 |
| Single Female/Mother | 107 (5.2%) | 2.81 |
| Non-family | 847 (41.3%) | 1.39 |
| Total Households | 2,050 (100.0%) | 2.34 |
Household Size by Marriage Status in Falcon Heights
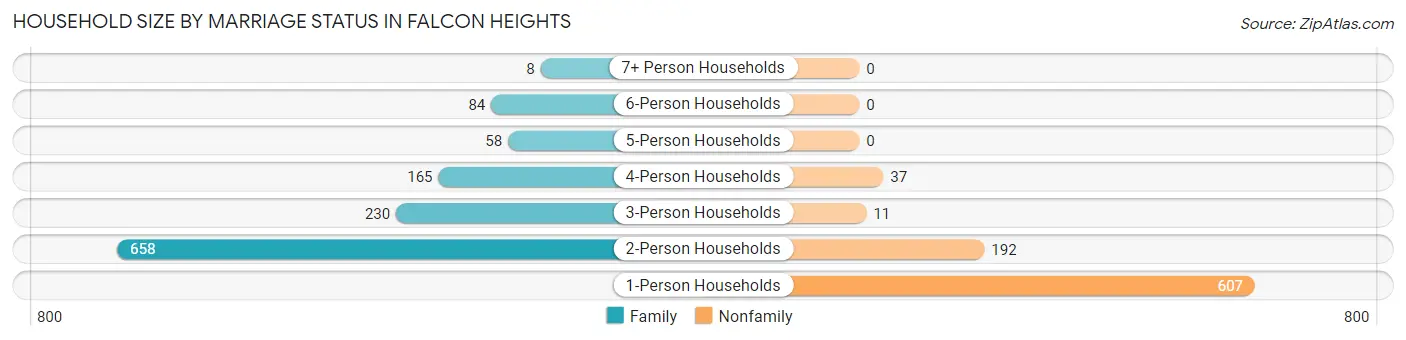
Out of a total of 2,050 households in Falcon Heights, 1,203 (58.7%) are family households, while 847 (41.3%) are nonfamily households. The most numerous type of family households are 2-person households, comprising 658, and the most common type of nonfamily households are 1-person households, comprising 607.
| Household Size | Family Households | Nonfamily Households |
| 1-Person Households | - | 607 (29.6%) |
| 2-Person Households | 658 (32.1%) | 192 (9.4%) |
| 3-Person Households | 230 (11.2%) | 11 (0.5%) |
| 4-Person Households | 165 (8.1%) | 37 (1.8%) |
| 5-Person Households | 58 (2.8%) | 0 (0.0%) |
| 6-Person Households | 84 (4.1%) | 0 (0.0%) |
| 7+ Person Households | 8 (0.4%) | 0 (0.0%) |
| Total | 1,203 (58.7%) | 847 (41.3%) |
Female Fertility in Falcon Heights
Fertility by Age in Falcon Heights
Average fertility rate in Falcon Heights is 38.0 births per 1,000 women. Women in the age bracket of 20 to 34 years have the highest fertility rate with 80.0 births per 1,000 women. Women in the age bracket of 20 to 34 years acount for 76.4% of all women with births.
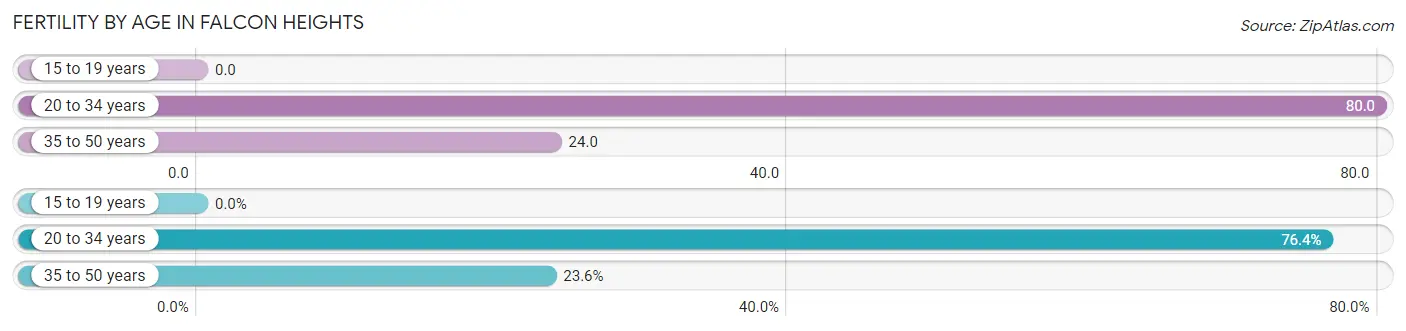
| Age Bracket | Women with Births | Births / 1,000 Women |
| 15 to 19 years | 0 (0.0%) | 0.0 |
| 20 to 34 years | 42 (76.4%) | 80.0 |
| 35 to 50 years | 13 (23.6%) | 24.0 |
| Total | 55 (100.0%) | 38.0 |
Fertility by Age by Marriage Status in Falcon Heights
85.5% of women with births (55) in Falcon Heights are married. The highest percentage of unmarried women with births falls into 20 to 34 years age bracket with 19.1% of them unmarried at the time of birth, while the lowest percentage of unmarried women with births belong to 35 to 50 years age bracket with 0.0% of them unmarried.
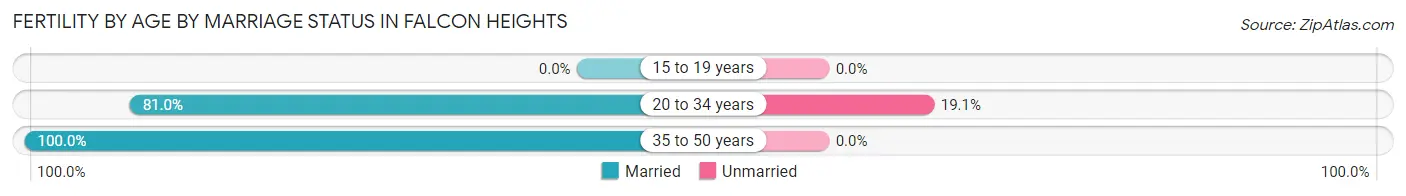
| Age Bracket | Married | Unmarried |
| 15 to 19 years | 0 (0.0%) | 0 (0.0%) |
| 20 to 34 years | 34 (80.9%) | 8 (19.1%) |
| 35 to 50 years | 13 (100.0%) | 0 (0.0%) |
| Total | 47 (85.5%) | 8 (14.5%) |
Fertility by Education in Falcon Heights
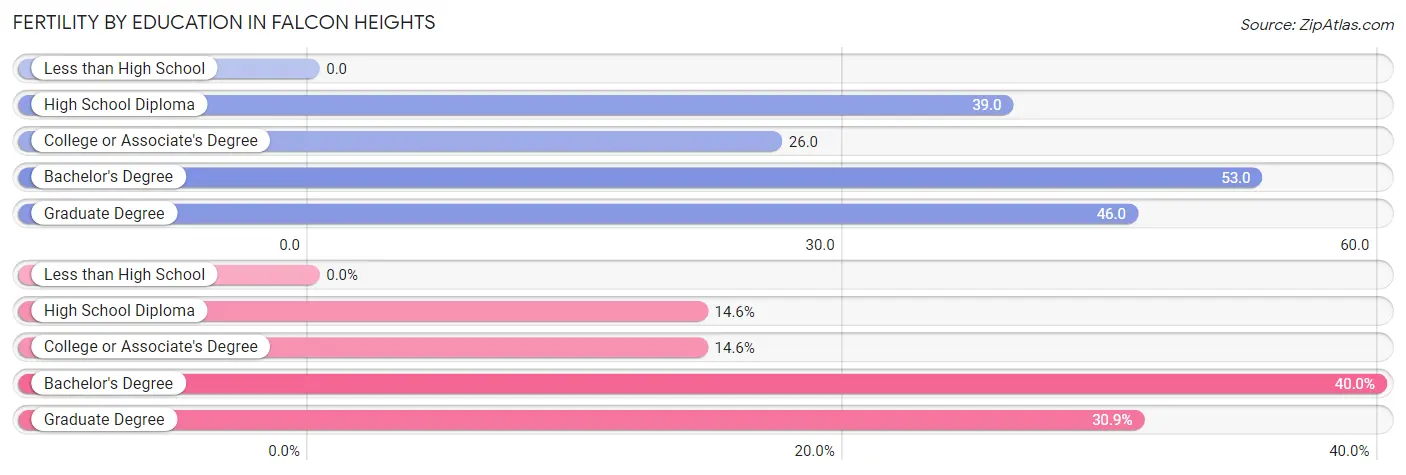
| Educational Attainment | Women with Births | Births / 1,000 Women |
| Less than High School | 0 (0.0%) | 0.0 |
| High School Diploma | 8 (14.5%) | 39.0 |
| College or Associate's Degree | 8 (14.5%) | 26.0 |
| Bachelor's Degree | 22 (40.0%) | 53.0 |
| Graduate Degree | 17 (30.9%) | 46.0 |
| Total | 55 (100.0%) | 38.0 |
Fertility by Education by Marriage Status in Falcon Heights
14.5% of women with births in Falcon Heights are unmarried. Women with the educational attainment of college or associate's degree are most likely to be married with 100.0% of them married at childbirth, while women with the educational attainment of high school diploma are least likely to be married with 100.0% of them unmarried at childbirth.
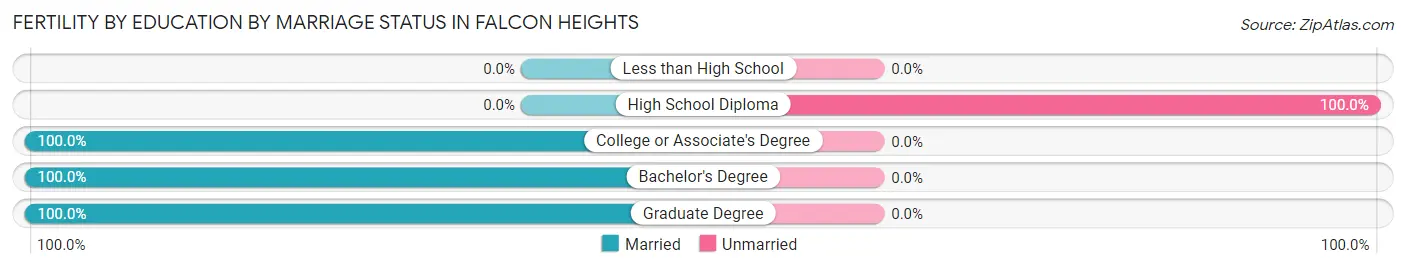
| Educational Attainment | Married | Unmarried |
| Less than High School | 0 (0.0%) | 0 (0.0%) |
| High School Diploma | 0 (0.0%) | 8 (100.0%) |
| College or Associate's Degree | 8 (100.0%) | 0 (0.0%) |
| Bachelor's Degree | 22 (100.0%) | 0 (0.0%) |
| Graduate Degree | 17 (100.0%) | 0 (0.0%) |
| Total | 47 (85.5%) | 8 (14.5%) |
Employment Characteristics in Falcon Heights
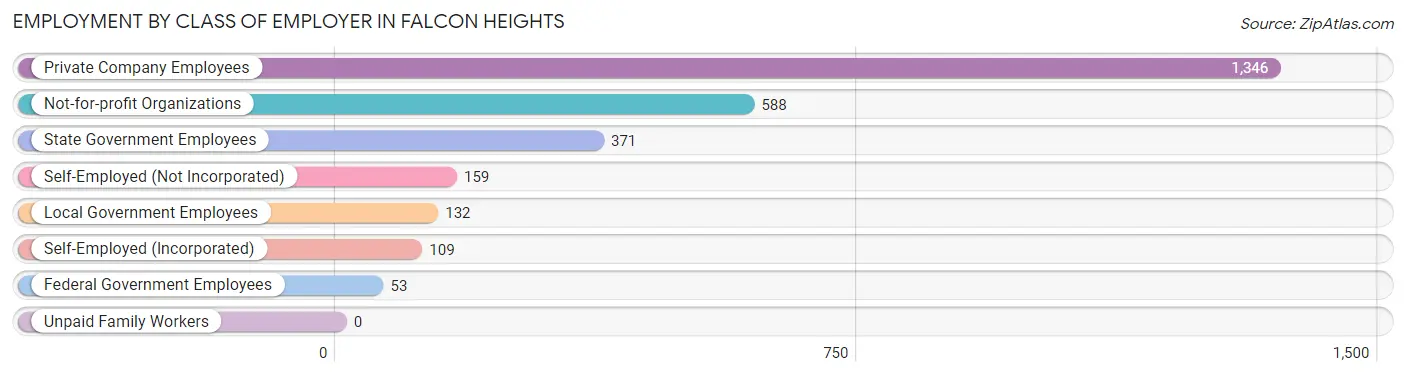
Employment by Class of Employer in Falcon Heights
Among the 2,758 employed individuals in Falcon Heights, private company employees (1,346 | 48.8%), not-for-profit organizations (588 | 21.3%), and state government employees (371 | 13.5%) make up the most common classes of employment.
| Employer Class | # Employees | % Employees |
| Private Company Employees | 1,346 | 48.8% |
| Self-Employed (Incorporated) | 109 | 4.0% |
| Self-Employed (Not Incorporated) | 159 | 5.8% |
| Not-for-profit Organizations | 588 | 21.3% |
| Local Government Employees | 132 | 4.8% |
| State Government Employees | 371 | 13.5% |
| Federal Government Employees | 53 | 1.9% |
| Unpaid Family Workers | 0 | 0.0% |
| Total | 2,758 | 100.0% |
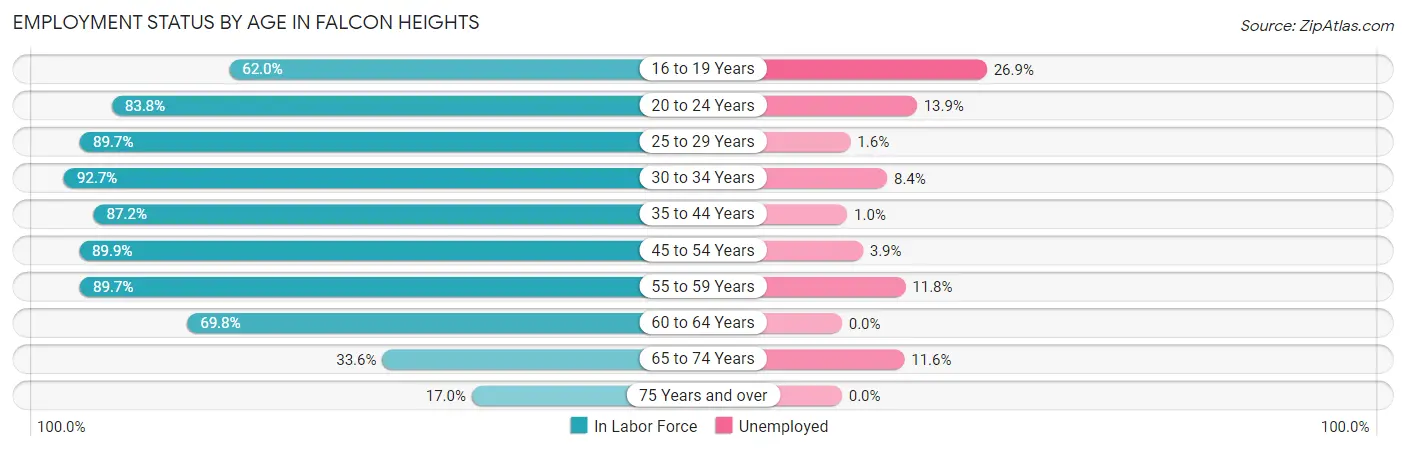
Employment Status by Age in Falcon Heights
According to the labor force statistics for Falcon Heights, out of the total population over 16 years of age (4,404), 70.5% or 3,105 individuals are in the labor force, with 8.1% or 252 of them unemployed. The age group with the highest labor force participation rate is 30 to 34 years, with 92.7% or 391 individuals in the labor force. Within the labor force, the 16 to 19 years age range has the highest percentage of unemployed individuals, with 26.9% or 112 of them being unemployed.
| Age Bracket | In Labor Force | Unemployed |
| 16 to 19 Years | 417 (62.0%) | 112 (26.9%) |
| 20 to 24 Years | 223 (83.8%) | 31 (13.9%) |
| 25 to 29 Years | 315 (89.7%) | 5 (1.6%) |
| 30 to 34 Years | 391 (92.7%) | 33 (8.4%) |
| 35 to 44 Years | 614 (87.2%) | 6 (1.0%) |
| 45 to 54 Years | 435 (89.9%) | 17 (3.9%) |
| 55 to 59 Years | 262 (89.7%) | 31 (11.8%) |
| 60 to 64 Years | 227 (69.8%) | 0 (0.0%) |
| 65 to 74 Years | 138 (33.6%) | 16 (11.6%) |
| 75 Years and over | 81 (17.0%) | 0 (0.0%) |
| Total | 3,105 (70.5%) | 252 (8.1%) |
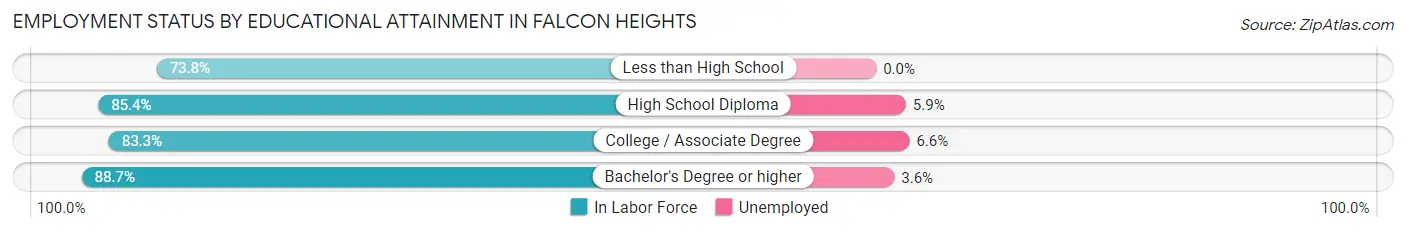
Employment Status by Educational Attainment in Falcon Heights
According to labor force statistics for Falcon Heights, 87.0% of individuals (2,243) out of the total population between 25 and 64 years of age (2,578) are in the labor force, with 4.1% or 92 of them being unemployed. The group with the highest labor force participation rate are those with the educational attainment of bachelor's degree or higher, with 88.7% or 1,677 individuals in the labor force. Within the labor force, individuals with college / associate degree education have the highest percentage of unemployment, with 6.6% or 20 of them being unemployed.
| Educational Attainment | In Labor Force | Unemployed |
| Less than High School | 76 (73.8%) | 0 (0.0%) |
| High School Diploma | 187 (85.4%) | 13 (5.9%) |
| College / Associate Degree | 304 (83.3%) | 24 (6.6%) |
| Bachelor's Degree or higher | 1,677 (88.7%) | 68 (3.6%) |
| Total | 2,243 (87.0%) | 106 (4.1%) |
Employment Occupations by Sex in Falcon Heights
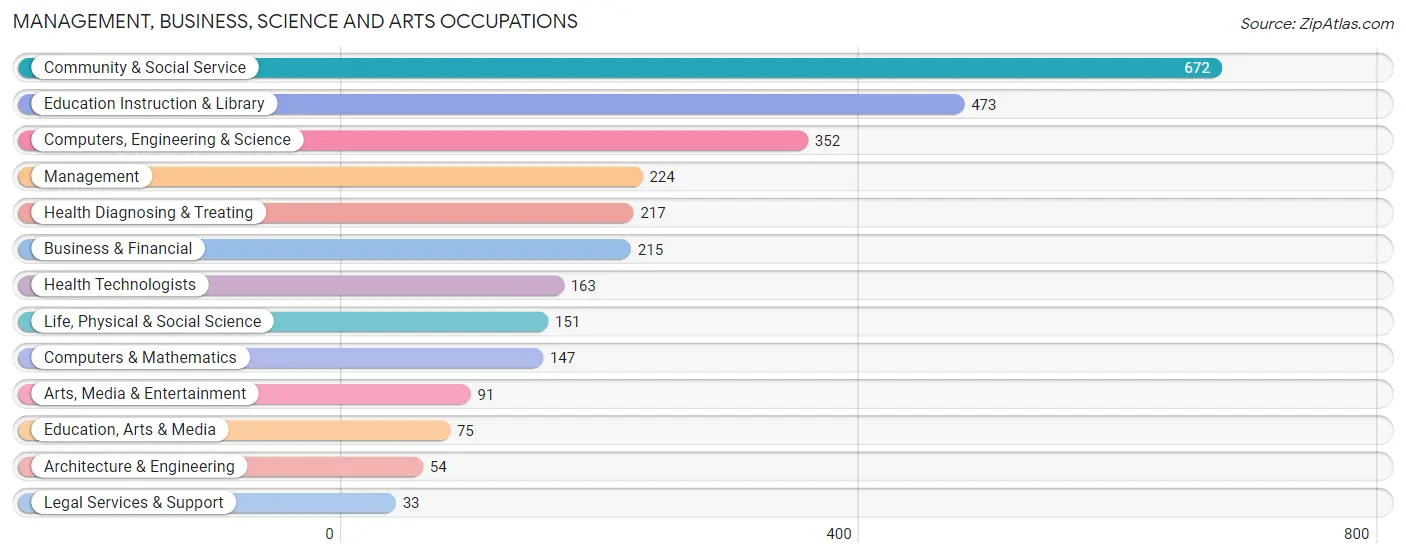
Management, Business, Science and Arts Occupations
The most common Management, Business, Science and Arts occupations in Falcon Heights are Community & Social Service (672 | 23.6%), Education Instruction & Library (473 | 16.6%), Computers, Engineering & Science (352 | 12.3%), Management (224 | 7.9%), and Health Diagnosing & Treating (217 | 7.6%).
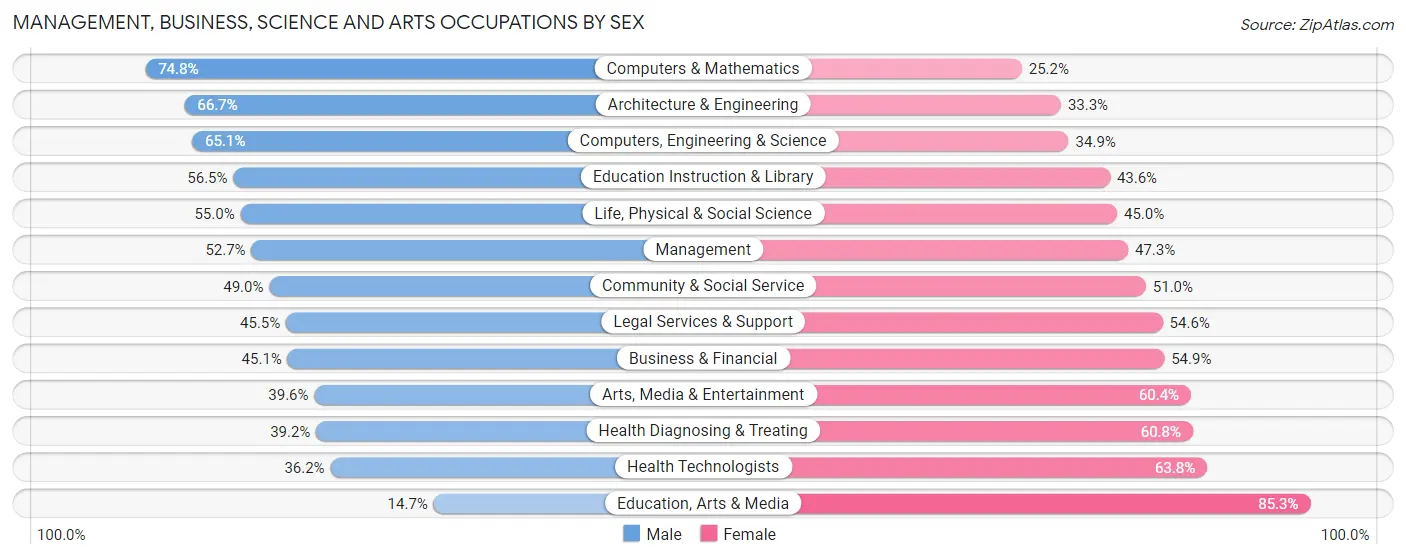
Management, Business, Science and Arts Occupations by Sex
Within the Management, Business, Science and Arts occupations in Falcon Heights, the most male-oriented occupations are Computers & Mathematics (74.8%), Architecture & Engineering (66.7%), and Computers, Engineering & Science (65.1%), while the most female-oriented occupations are Education, Arts & Media (85.3%), Health Technologists (63.8%), and Health Diagnosing & Treating (60.8%).
| Occupation | Male | Female |
| Management | 118 (52.7%) | 106 (47.3%) |
| Business & Financial | 97 (45.1%) | 118 (54.9%) |
| Computers, Engineering & Science | 229 (65.1%) | 123 (34.9%) |
| Computers & Mathematics | 110 (74.8%) | 37 (25.2%) |
| Architecture & Engineering | 36 (66.7%) | 18 (33.3%) |
| Life, Physical & Social Science | 83 (55.0%) | 68 (45.0%) |
| Community & Social Service | 329 (49.0%) | 343 (51.0%) |
| Education, Arts & Media | 11 (14.7%) | 64 (85.3%) |
| Legal Services & Support | 15 (45.5%) | 18 (54.5%) |
| Education Instruction & Library | 267 (56.5%) | 206 (43.5%) |
| Arts, Media & Entertainment | 36 (39.6%) | 55 (60.4%) |
| Health Diagnosing & Treating | 85 (39.2%) | 132 (60.8%) |
| Health Technologists | 59 (36.2%) | 104 (63.8%) |
| Total (Category) | 858 (51.1%) | 822 (48.9%) |
| Total (Overall) | 1,444 (50.6%) | 1,408 (49.4%) |
Services Occupations
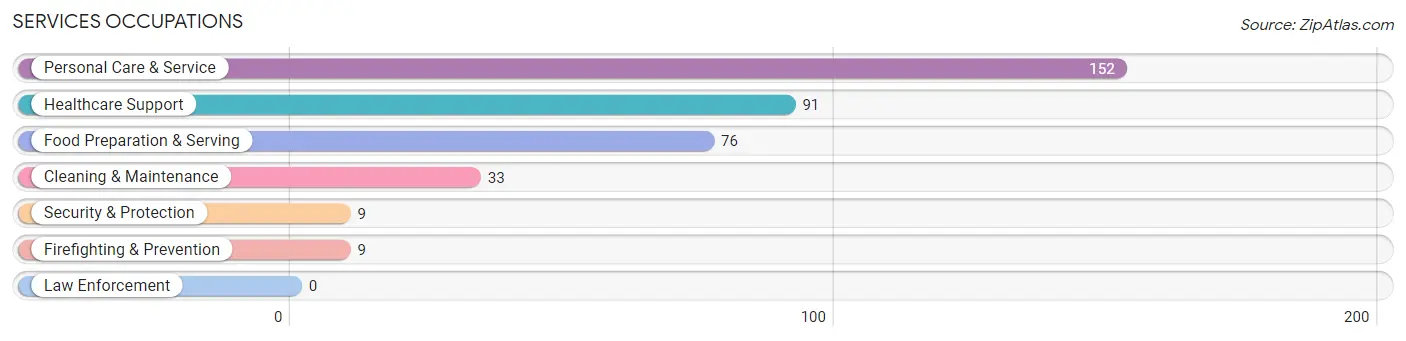
The most common Services occupations in Falcon Heights are Personal Care & Service (152 | 5.3%), Healthcare Support (91 | 3.2%), Food Preparation & Serving (76 | 2.7%), Cleaning & Maintenance (33 | 1.2%), and Security & Protection (9 | 0.3%).
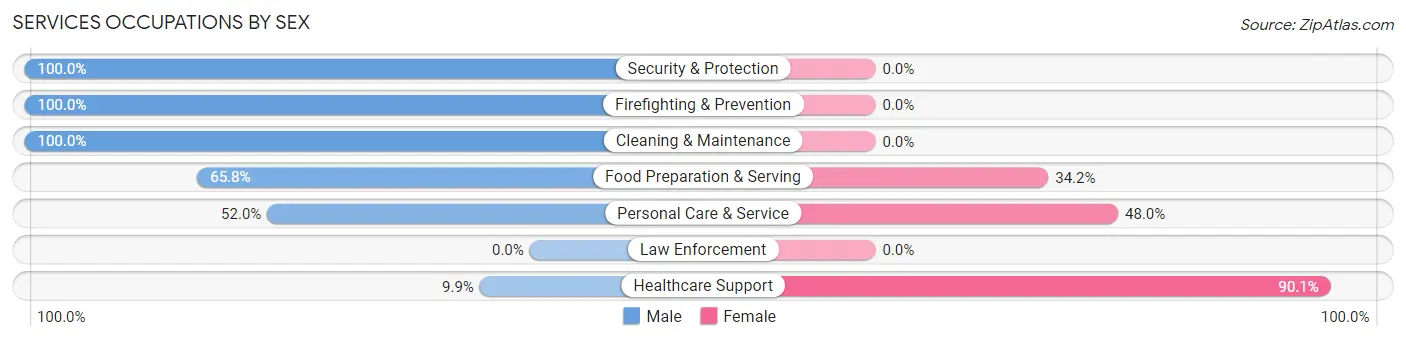
Services Occupations by Sex
Within the Services occupations in Falcon Heights, the most male-oriented occupations are Security & Protection (100.0%), Firefighting & Prevention (100.0%), and Cleaning & Maintenance (100.0%), while the most female-oriented occupations are Healthcare Support (90.1%), Personal Care & Service (48.0%), and Food Preparation & Serving (34.2%).
| Occupation | Male | Female |
| Healthcare Support | 9 (9.9%) | 82 (90.1%) |
| Security & Protection | 9 (100.0%) | 0 (0.0%) |
| Firefighting & Prevention | 9 (100.0%) | 0 (0.0%) |
| Law Enforcement | 0 (0.0%) | 0 (0.0%) |
| Food Preparation & Serving | 50 (65.8%) | 26 (34.2%) |
| Cleaning & Maintenance | 33 (100.0%) | 0 (0.0%) |
| Personal Care & Service | 79 (52.0%) | 73 (48.0%) |
| Total (Category) | 180 (49.9%) | 181 (50.1%) |
| Total (Overall) | 1,444 (50.6%) | 1,408 (49.4%) |
Sales and Office Occupations
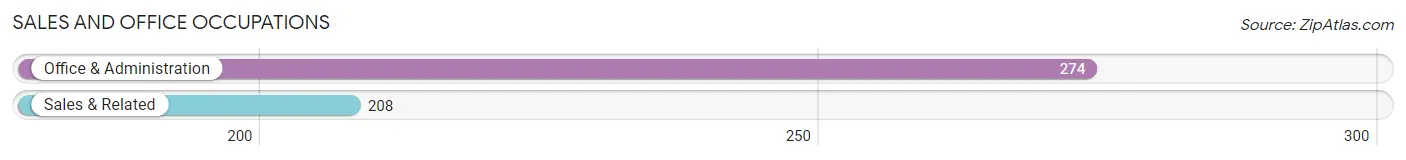
The most common Sales and Office occupations in Falcon Heights are Office & Administration (274 | 9.6%), and Sales & Related (208 | 7.3%).
Sales and Office Occupations by Sex
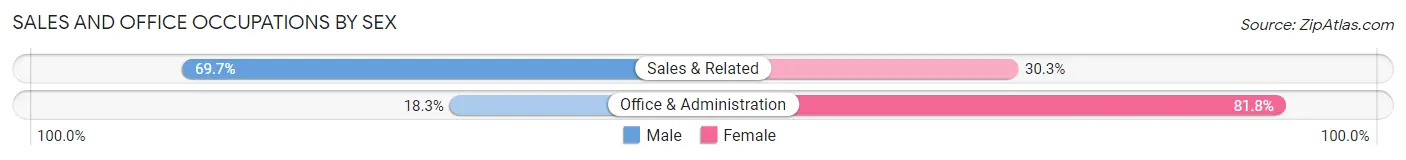
| Occupation | Male | Female |
| Sales & Related | 145 (69.7%) | 63 (30.3%) |
| Office & Administration | 50 (18.2%) | 224 (81.8%) |
| Total (Category) | 195 (40.5%) | 287 (59.5%) |
| Total (Overall) | 1,444 (50.6%) | 1,408 (49.4%) |
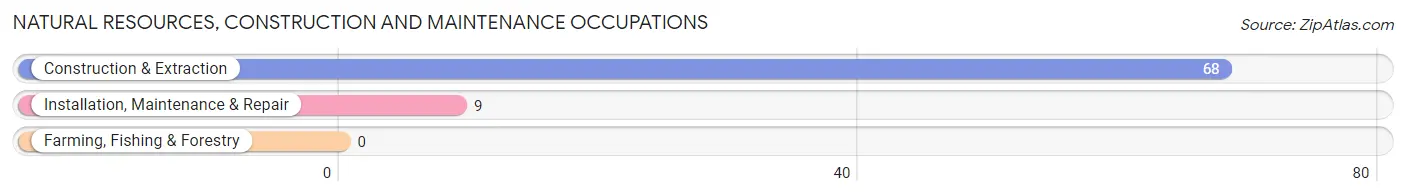
Natural Resources, Construction and Maintenance Occupations
The most common Natural Resources, Construction and Maintenance occupations in Falcon Heights are Construction & Extraction (68 | 2.4%), and Installation, Maintenance & Repair (9 | 0.3%).
Natural Resources, Construction and Maintenance Occupations by Sex
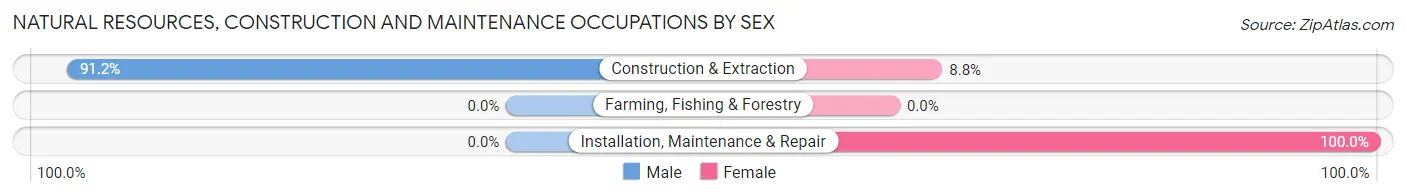
| Occupation | Male | Female |
| Farming, Fishing & Forestry | 0 (0.0%) | 0 (0.0%) |
| Construction & Extraction | 62 (91.2%) | 6 (8.8%) |
| Installation, Maintenance & Repair | 0 (0.0%) | 9 (100.0%) |
| Total (Category) | 62 (80.5%) | 15 (19.5%) |
| Total (Overall) | 1,444 (50.6%) | 1,408 (49.4%) |
Production, Transportation and Moving Occupations
The most common Production, Transportation and Moving occupations in Falcon Heights are Production (120 | 4.2%), Material Moving (93 | 3.3%), and Transportation (39 | 1.4%).
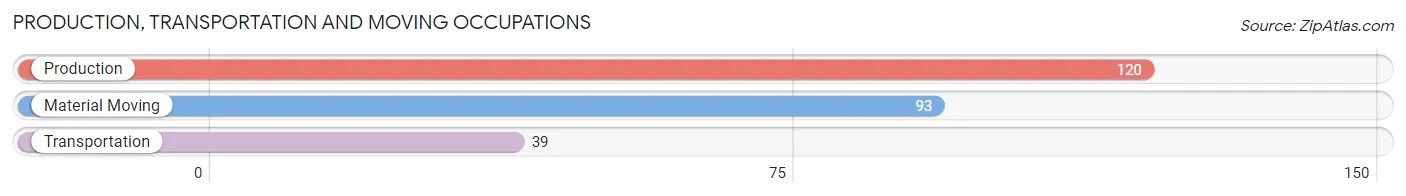
Production, Transportation and Moving Occupations by Sex
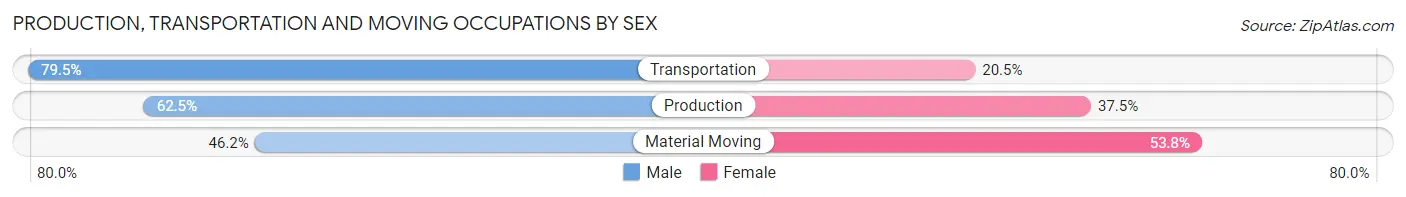
| Occupation | Male | Female |
| Production | 75 (62.5%) | 45 (37.5%) |
| Transportation | 31 (79.5%) | 8 (20.5%) |
| Material Moving | 43 (46.2%) | 50 (53.8%) |
| Total (Category) | 149 (59.1%) | 103 (40.9%) |
| Total (Overall) | 1,444 (50.6%) | 1,408 (49.4%) |
Employment Industries by Sex in Falcon Heights
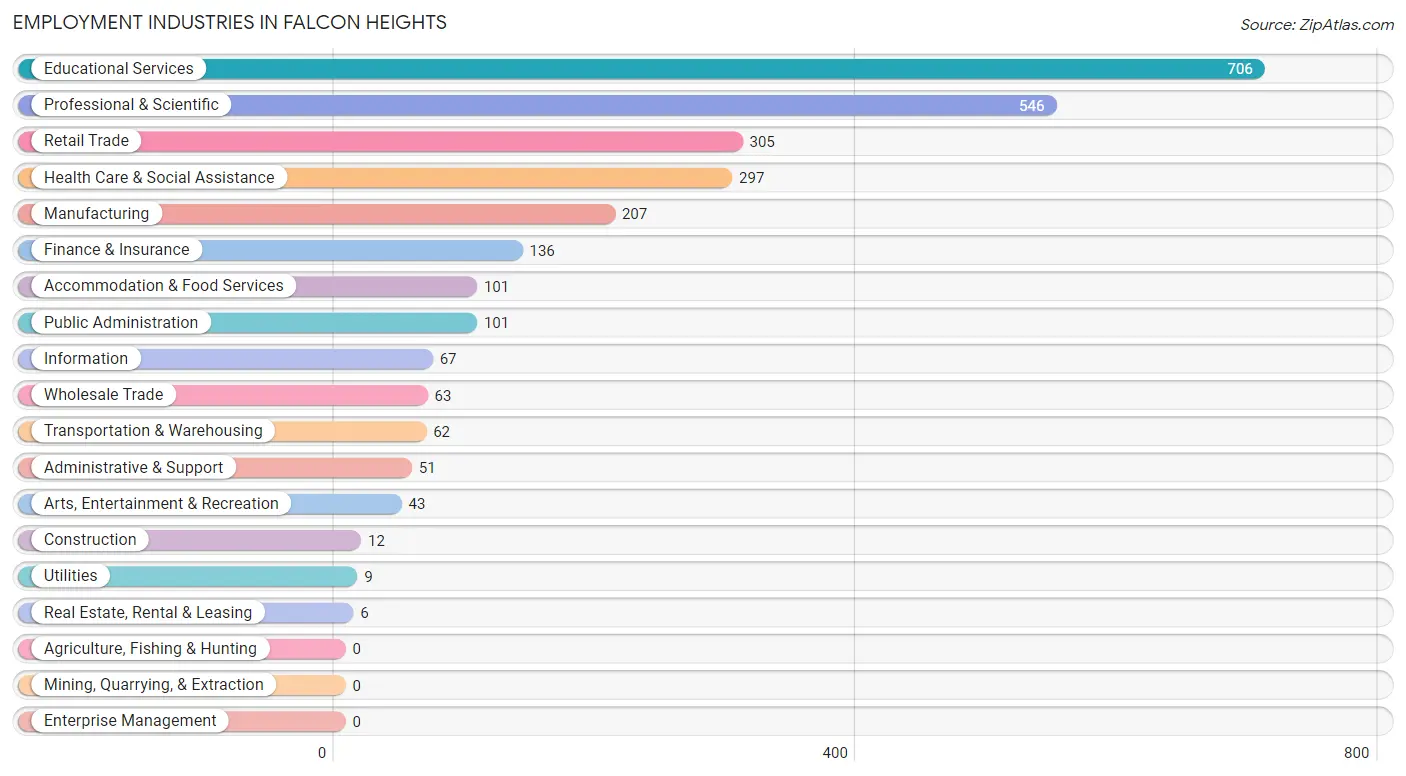
Employment Industries in Falcon Heights
The major employment industries in Falcon Heights include Educational Services (706 | 24.7%), Professional & Scientific (546 | 19.1%), Retail Trade (305 | 10.7%), Health Care & Social Assistance (297 | 10.4%), and Manufacturing (207 | 7.3%).
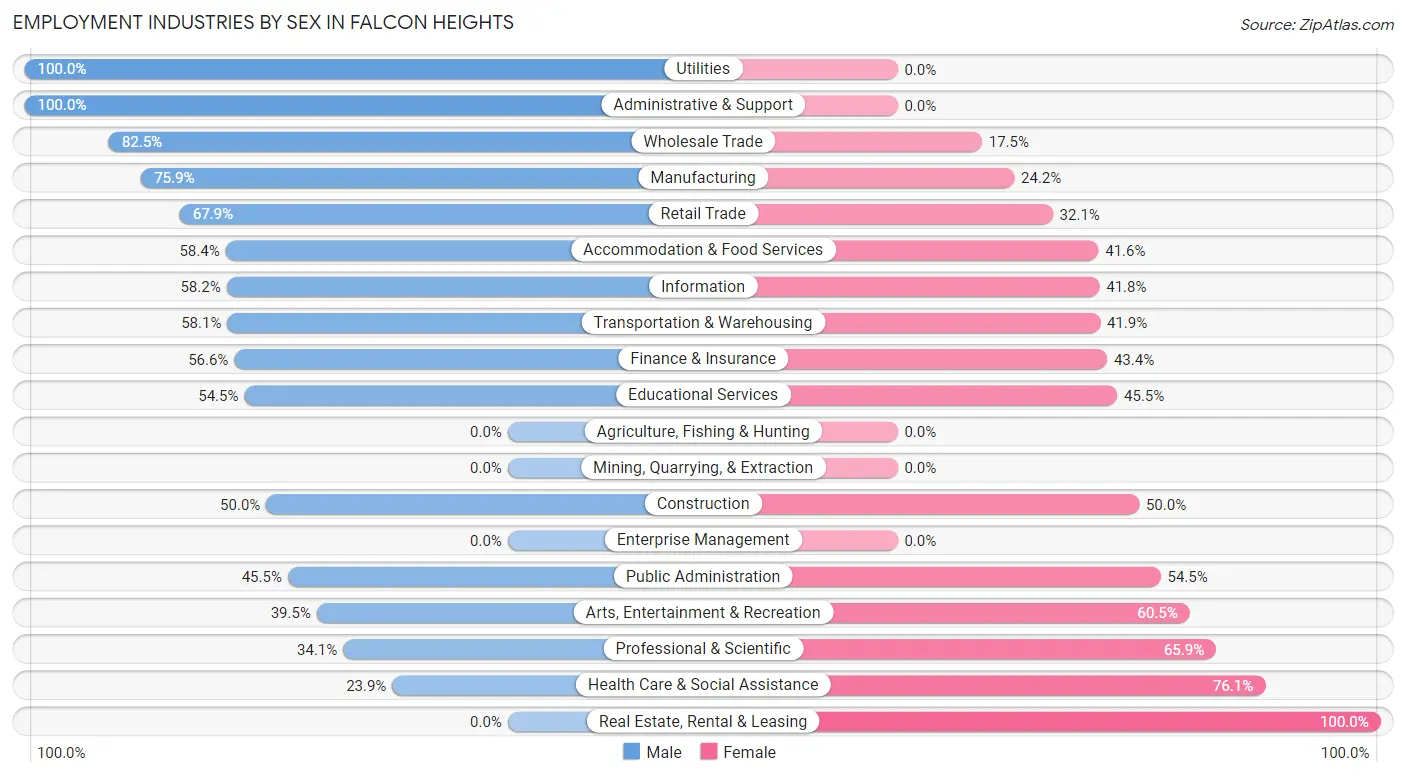
Employment Industries by Sex in Falcon Heights
The Falcon Heights industries that see more men than women are Utilities (100.0%), Administrative & Support (100.0%), and Wholesale Trade (82.5%), whereas the industries that tend to have a higher number of women are Real Estate, Rental & Leasing (100.0%), Health Care & Social Assistance (76.1%), and Professional & Scientific (65.9%).
| Industry | Male | Female |
| Agriculture, Fishing & Hunting | 0 (0.0%) | 0 (0.0%) |
| Mining, Quarrying, & Extraction | 0 (0.0%) | 0 (0.0%) |
| Construction | 6 (50.0%) | 6 (50.0%) |
| Manufacturing | 157 (75.8%) | 50 (24.1%) |
| Wholesale Trade | 52 (82.5%) | 11 (17.5%) |
| Retail Trade | 207 (67.9%) | 98 (32.1%) |
| Transportation & Warehousing | 36 (58.1%) | 26 (41.9%) |
| Utilities | 9 (100.0%) | 0 (0.0%) |
| Information | 39 (58.2%) | 28 (41.8%) |
| Finance & Insurance | 77 (56.6%) | 59 (43.4%) |
| Real Estate, Rental & Leasing | 0 (0.0%) | 6 (100.0%) |
| Professional & Scientific | 186 (34.1%) | 360 (65.9%) |
| Enterprise Management | 0 (0.0%) | 0 (0.0%) |
| Administrative & Support | 51 (100.0%) | 0 (0.0%) |
| Educational Services | 385 (54.5%) | 321 (45.5%) |
| Health Care & Social Assistance | 71 (23.9%) | 226 (76.1%) |
| Arts, Entertainment & Recreation | 17 (39.5%) | 26 (60.5%) |
| Accommodation & Food Services | 59 (58.4%) | 42 (41.6%) |
| Public Administration | 46 (45.5%) | 55 (54.5%) |
| Total | 1,444 (50.6%) | 1,408 (49.4%) |
Education in Falcon Heights
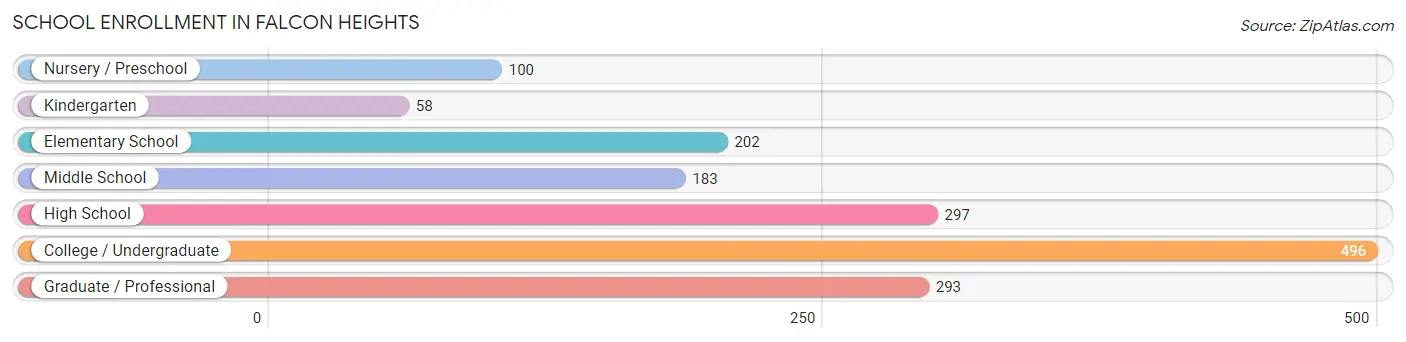
School Enrollment in Falcon Heights
The most common levels of schooling among the 1,629 students in Falcon Heights are college / undergraduate (496 | 30.4%), high school (297 | 18.2%), and graduate / professional (293 | 18.0%).
| School Level | # Students | % Students |
| Nursery / Preschool | 100 | 6.1% |
| Kindergarten | 58 | 3.6% |
| Elementary School | 202 | 12.4% |
| Middle School | 183 | 11.2% |
| High School | 297 | 18.2% |
| College / Undergraduate | 496 | 30.4% |
| Graduate / Professional | 293 | 18.0% |
| Total | 1,629 | 100.0% |
School Enrollment by Age by Funding Source in Falcon Heights
Out of a total of 1,629 students who are enrolled in schools in Falcon Heights, 463 (28.4%) attend a private institution, while the remaining 1,166 (71.6%) are enrolled in public schools. The age group of 3 to 4 year olds has the highest likelihood of being enrolled in private schools, with 52 (83.9% in the age bracket) enrolled. Conversely, the age group of 18 to 19 year olds has the lowest likelihood of being enrolled in a private school, with 428 (98.2% in the age bracket) attending a public institution.
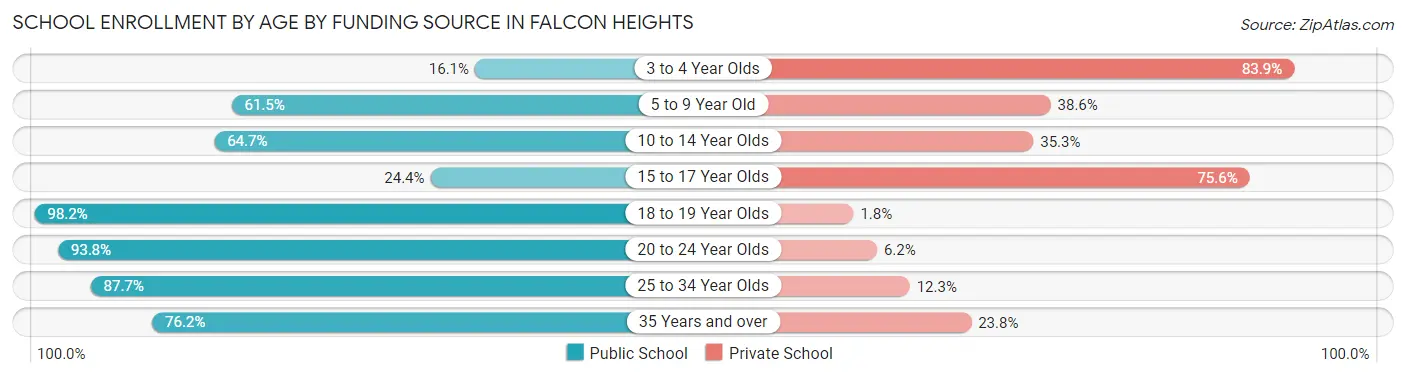
| Age Bracket | Public School | Private School |
| 3 to 4 Year Olds | 10 (16.1%) | 52 (83.9%) |
| 5 to 9 Year Old | 161 (61.5%) | 101 (38.6%) |
| 10 to 14 Year Olds | 152 (64.7%) | 83 (35.3%) |
| 15 to 17 Year Olds | 53 (24.4%) | 164 (75.6%) |
| 18 to 19 Year Olds | 428 (98.2%) | 8 (1.8%) |
| 20 to 24 Year Olds | 121 (93.8%) | 8 (6.2%) |
| 25 to 34 Year Olds | 164 (87.7%) | 23 (12.3%) |
| 35 Years and over | 77 (76.2%) | 24 (23.8%) |
| Total | 1,166 (71.6%) | 463 (28.4%) |
Educational Attainment by Field of Study in Falcon Heights
Bio, nature & agricultural (382 | 14.0%), business (310 | 11.3%), social sciences (308 | 11.3%), engineering (242 | 8.8%), and literature & languages (233 | 8.5%) are the most common fields of study among 2,733 individuals in Falcon Heights who have obtained a bachelor's degree or higher.
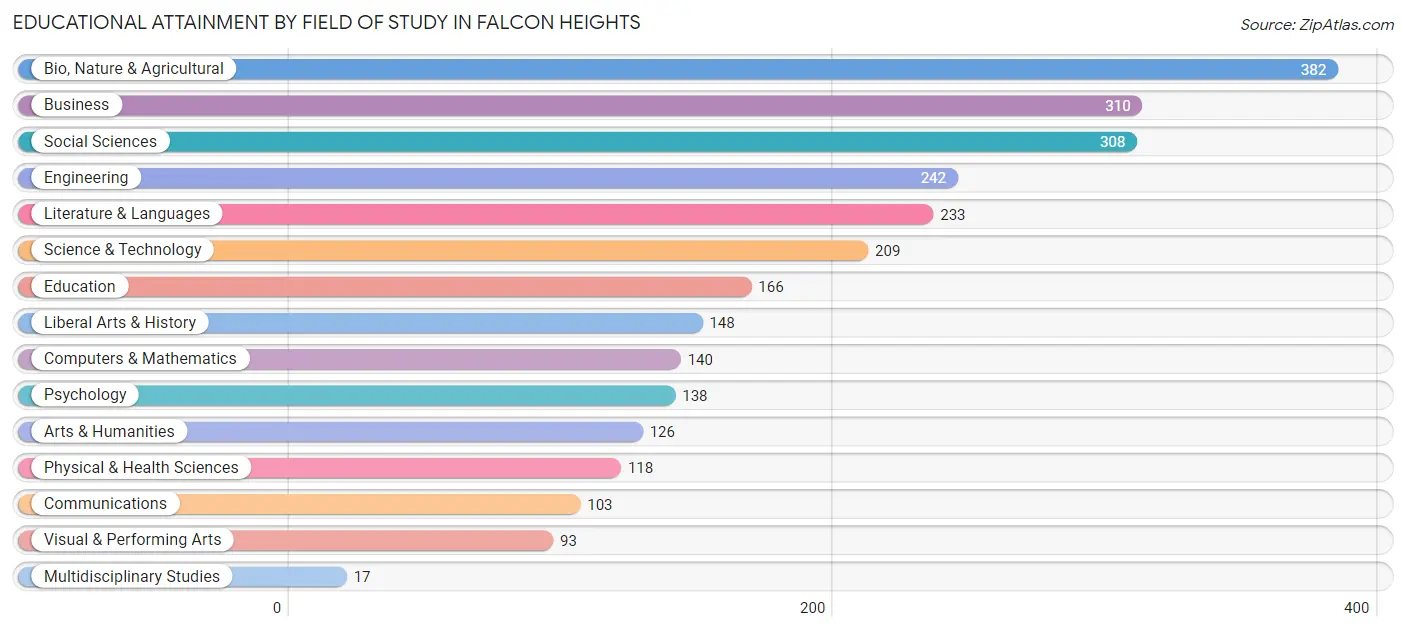
| Field of Study | # Graduates | % Graduates |
| Computers & Mathematics | 140 | 5.1% |
| Bio, Nature & Agricultural | 382 | 14.0% |
| Physical & Health Sciences | 118 | 4.3% |
| Psychology | 138 | 5.1% |
| Social Sciences | 308 | 11.3% |
| Engineering | 242 | 8.8% |
| Multidisciplinary Studies | 17 | 0.6% |
| Science & Technology | 209 | 7.6% |
| Business | 310 | 11.3% |
| Education | 166 | 6.1% |
| Literature & Languages | 233 | 8.5% |
| Liberal Arts & History | 148 | 5.4% |
| Visual & Performing Arts | 93 | 3.4% |
| Communications | 103 | 3.8% |
| Arts & Humanities | 126 | 4.6% |
| Total | 2,733 | 100.0% |
Transportation & Commute in Falcon Heights
Vehicle Availability by Sex in Falcon Heights
The most prevalent vehicle ownership categories in Falcon Heights are males with 2 vehicles (596, accounting for 44.9%) and females with 2 vehicles (505, making up 45.2%).
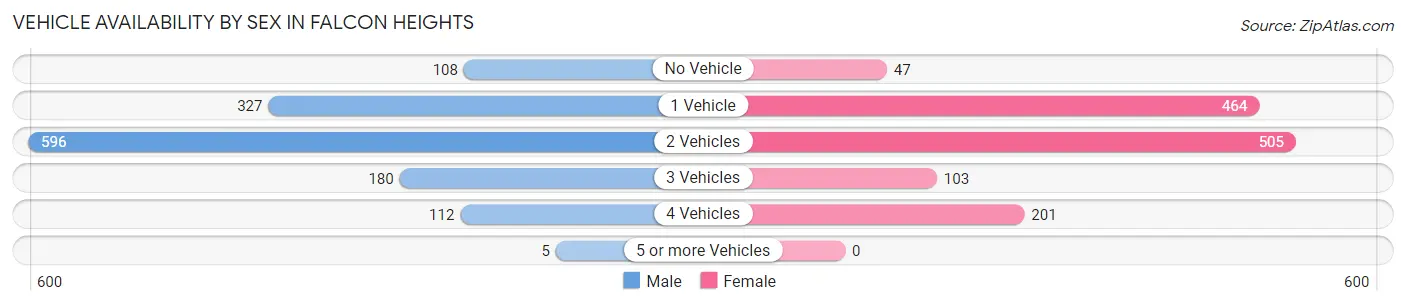
| Vehicles Available | Male | Female |
| No Vehicle | 108 (8.1%) | 47 (3.6%) |
| 1 Vehicle | 327 (24.6%) | 464 (35.1%) |
| 2 Vehicles | 596 (44.9%) | 505 (38.3%) |
| 3 Vehicles | 180 (13.6%) | 103 (7.8%) |
| 4 Vehicles | 112 (8.4%) | 201 (15.2%) |
| 5 or more Vehicles | 5 (0.4%) | 0 (0.0%) |
| Total | 1,328 (100.0%) | 1,320 (100.0%) |
Commute Time in Falcon Heights
The most frequently occuring commute durations in Falcon Heights are 15 to 19 minutes (474 commuters, 23.8%), 20 to 24 minutes (433 commuters, 21.7%), and 10 to 14 minutes (339 commuters, 17.0%).
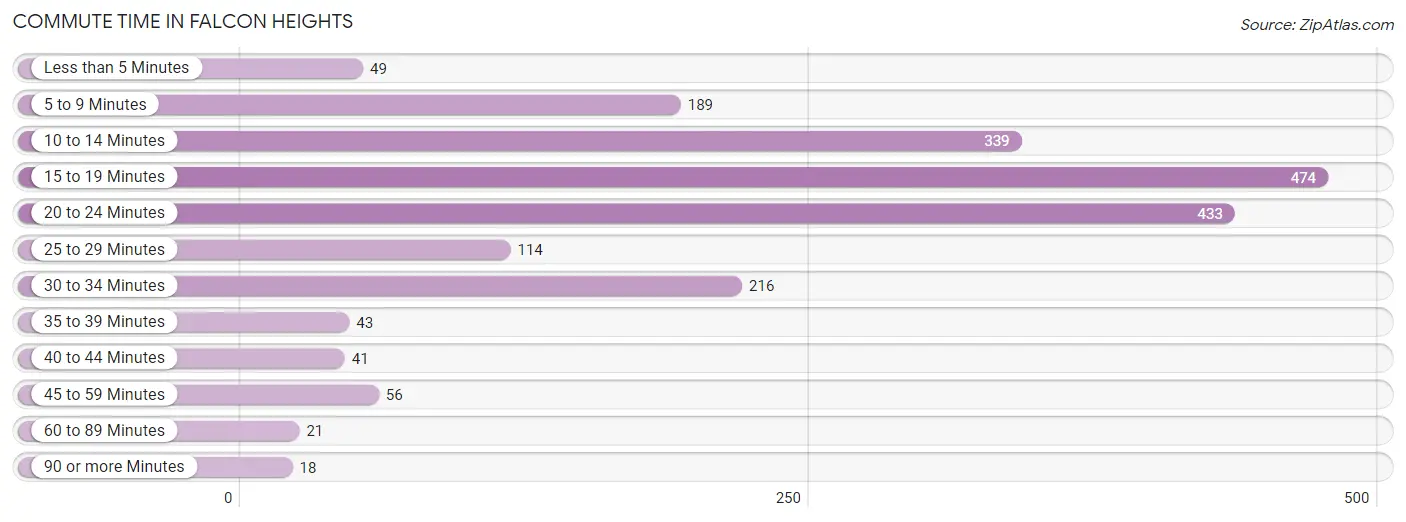
| Commute Time | # Commuters | % Commuters |
| Less than 5 Minutes | 49 | 2.5% |
| 5 to 9 Minutes | 189 | 9.5% |
| 10 to 14 Minutes | 339 | 17.0% |
| 15 to 19 Minutes | 474 | 23.8% |
| 20 to 24 Minutes | 433 | 21.7% |
| 25 to 29 Minutes | 114 | 5.7% |
| 30 to 34 Minutes | 216 | 10.8% |
| 35 to 39 Minutes | 43 | 2.2% |
| 40 to 44 Minutes | 41 | 2.1% |
| 45 to 59 Minutes | 56 | 2.8% |
| 60 to 89 Minutes | 21 | 1.1% |
| 90 or more Minutes | 18 | 0.9% |
Commute Time by Sex in Falcon Heights
The most common commute times in Falcon Heights are 20 to 24 minutes (243 commuters, 23.7%) for males and 15 to 19 minutes (311 commuters, 32.2%) for females.
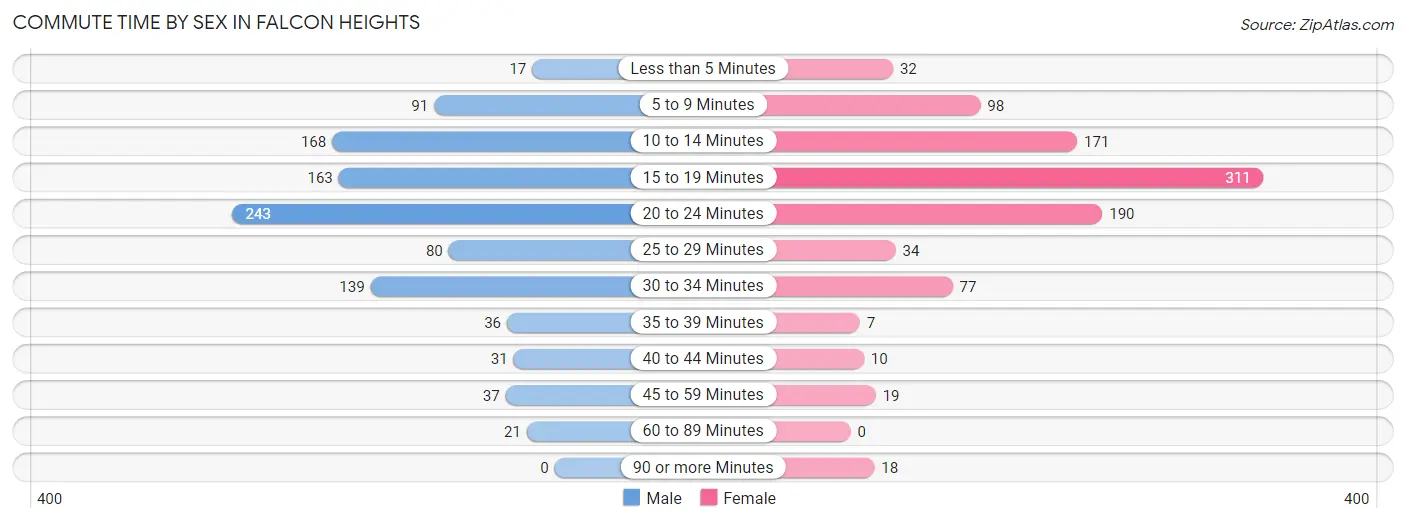
| Commute Time | Male | Female |
| Less than 5 Minutes | 17 (1.7%) | 32 (3.3%) |
| 5 to 9 Minutes | 91 (8.9%) | 98 (10.1%) |
| 10 to 14 Minutes | 168 (16.4%) | 171 (17.7%) |
| 15 to 19 Minutes | 163 (15.9%) | 311 (32.2%) |
| 20 to 24 Minutes | 243 (23.7%) | 190 (19.7%) |
| 25 to 29 Minutes | 80 (7.8%) | 34 (3.5%) |
| 30 to 34 Minutes | 139 (13.6%) | 77 (8.0%) |
| 35 to 39 Minutes | 36 (3.5%) | 7 (0.7%) |
| 40 to 44 Minutes | 31 (3.0%) | 10 (1.0%) |
| 45 to 59 Minutes | 37 (3.6%) | 19 (2.0%) |
| 60 to 89 Minutes | 21 (2.1%) | 0 (0.0%) |
| 90 or more Minutes | 0 (0.0%) | 18 (1.9%) |
Time of Departure to Work by Sex in Falcon Heights
The most frequent times of departure to work in Falcon Heights are 7:30 AM to 7:59 AM (155, 15.1%) for males and 7:30 AM to 7:59 AM (186, 19.2%) for females.
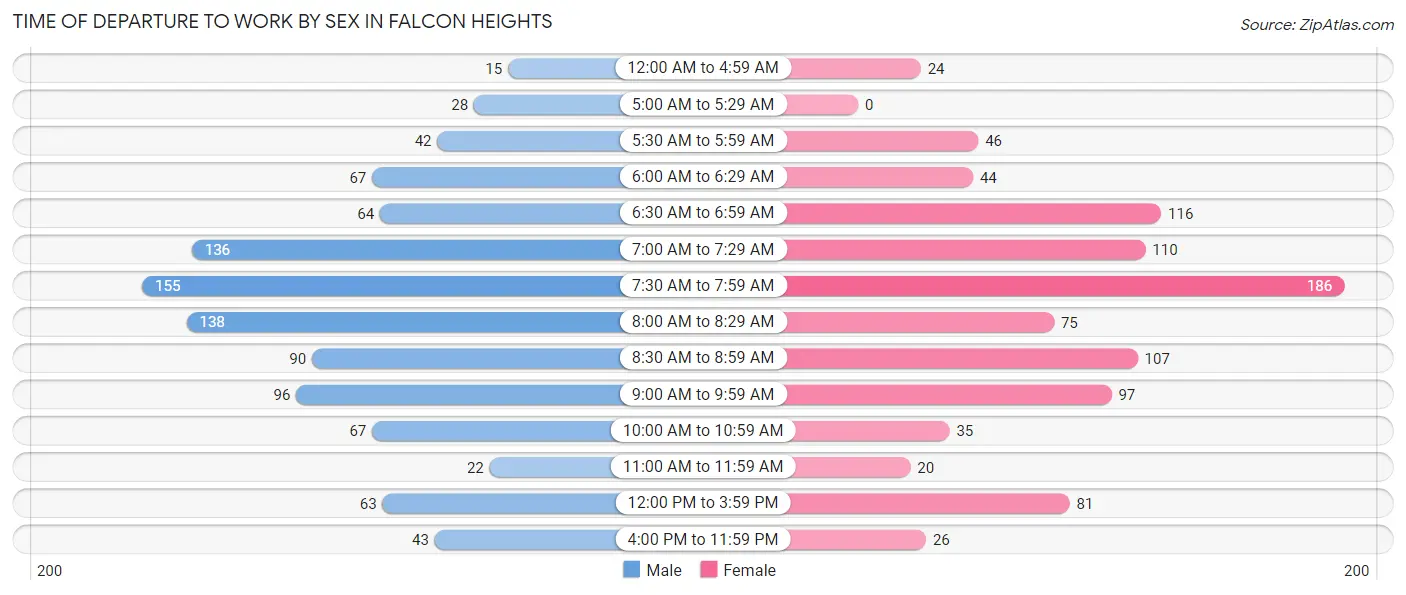
| Time of Departure | Male | Female |
| 12:00 AM to 4:59 AM | 15 (1.5%) | 24 (2.5%) |
| 5:00 AM to 5:29 AM | 28 (2.7%) | 0 (0.0%) |
| 5:30 AM to 5:59 AM | 42 (4.1%) | 46 (4.8%) |
| 6:00 AM to 6:29 AM | 67 (6.5%) | 44 (4.5%) |
| 6:30 AM to 6:59 AM | 64 (6.2%) | 116 (12.0%) |
| 7:00 AM to 7:29 AM | 136 (13.3%) | 110 (11.4%) |
| 7:30 AM to 7:59 AM | 155 (15.1%) | 186 (19.2%) |
| 8:00 AM to 8:29 AM | 138 (13.5%) | 75 (7.8%) |
| 8:30 AM to 8:59 AM | 90 (8.8%) | 107 (11.1%) |
| 9:00 AM to 9:59 AM | 96 (9.4%) | 97 (10.0%) |
| 10:00 AM to 10:59 AM | 67 (6.5%) | 35 (3.6%) |
| 11:00 AM to 11:59 AM | 22 (2.1%) | 20 (2.1%) |
| 12:00 PM to 3:59 PM | 63 (6.1%) | 81 (8.4%) |
| 4:00 PM to 11:59 PM | 43 (4.2%) | 26 (2.7%) |
| Total | 1,026 (100.0%) | 967 (100.0%) |
Housing Occupancy in Falcon Heights
Occupancy by Ownership in Falcon Heights
Of the total 2,050 dwellings in Falcon Heights, owner-occupied units account for 1,248 (60.9%), while renter-occupied units make up 802 (39.1%).
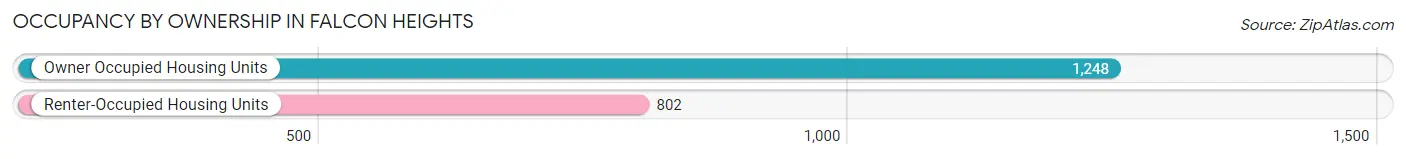
| Occupancy | # Housing Units | % Housing Units |
| Owner Occupied Housing Units | 1,248 | 60.9% |
| Renter-Occupied Housing Units | 802 | 39.1% |
| Total Occupied Housing Units | 2,050 | 100.0% |
Occupancy by Household Size in Falcon Heights
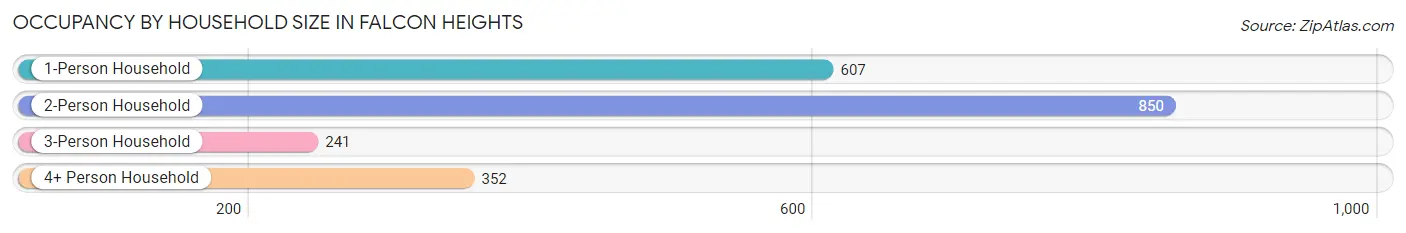
| Household Size | # Housing Units | % Housing Units |
| 1-Person Household | 607 | 29.6% |
| 2-Person Household | 850 | 41.5% |
| 3-Person Household | 241 | 11.8% |
| 4+ Person Household | 352 | 17.2% |
| Total Housing Units | 2,050 | 100.0% |
Occupancy by Ownership by Household Size in Falcon Heights
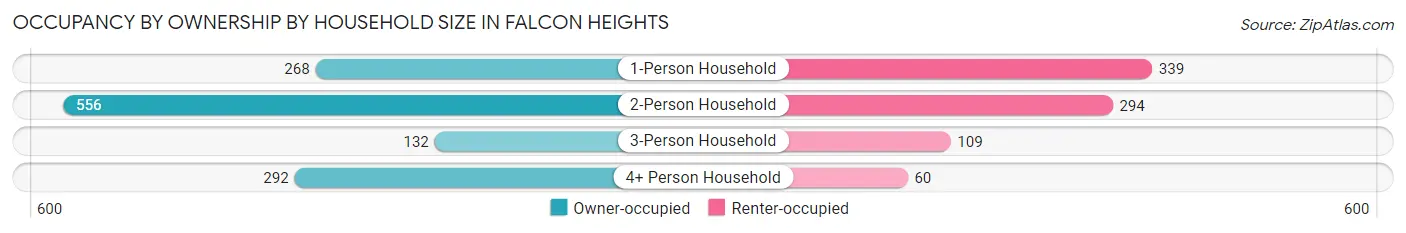
| Household Size | Owner-occupied | Renter-occupied |
| 1-Person Household | 268 (44.2%) | 339 (55.8%) |
| 2-Person Household | 556 (65.4%) | 294 (34.6%) |
| 3-Person Household | 132 (54.8%) | 109 (45.2%) |
| 4+ Person Household | 292 (83.0%) | 60 (17.1%) |
| Total Housing Units | 1,248 (60.9%) | 802 (39.1%) |
Occupancy by Educational Attainment in Falcon Heights
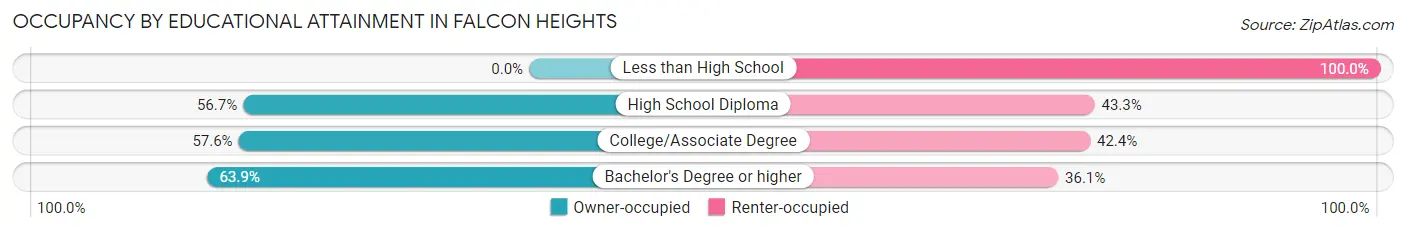
| Household Size | Owner-occupied | Renter-occupied |
| Less than High School | 0 (0.0%) | 42 (100.0%) |
| High School Diploma | 110 (56.7%) | 84 (43.3%) |
| College/Associate Degree | 197 (57.6%) | 145 (42.4%) |
| Bachelor's Degree or higher | 941 (63.9%) | 531 (36.1%) |
Occupancy by Age of Householder in Falcon Heights
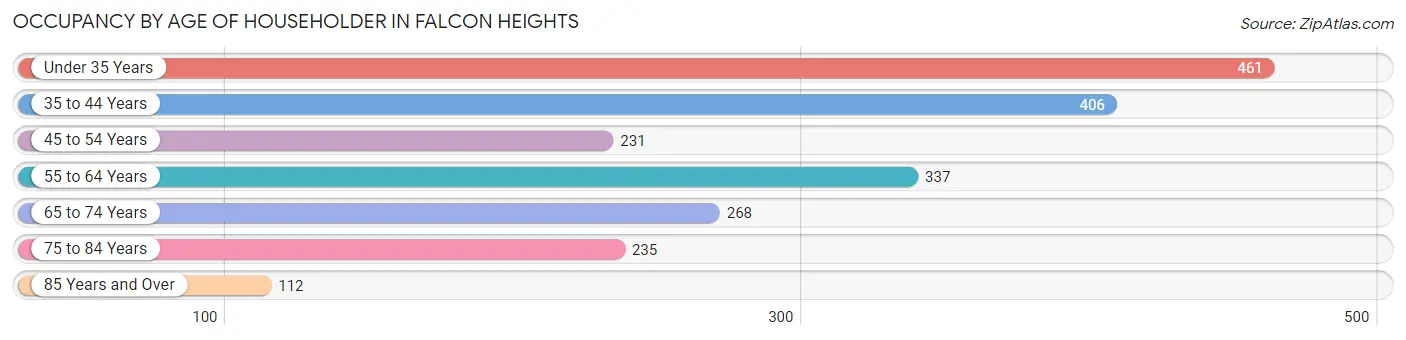
| Age Bracket | # Households | % Households |
| Under 35 Years | 461 | 22.5% |
| 35 to 44 Years | 406 | 19.8% |
| 45 to 54 Years | 231 | 11.3% |
| 55 to 64 Years | 337 | 16.4% |
| 65 to 74 Years | 268 | 13.1% |
| 75 to 84 Years | 235 | 11.5% |
| 85 Years and Over | 112 | 5.5% |
| Total | 2,050 | 100.0% |
Housing Finances in Falcon Heights
Median Income by Occupancy in Falcon Heights
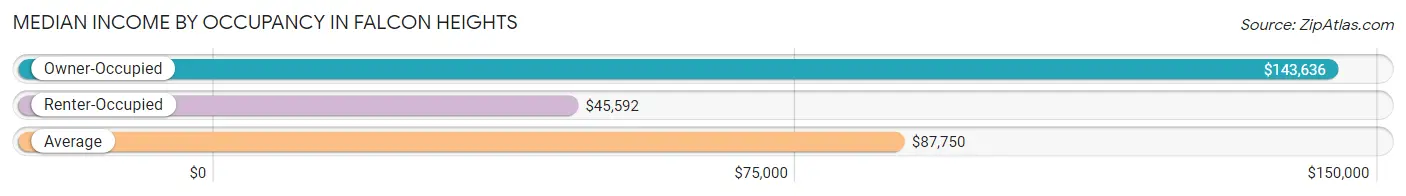
| Occupancy Type | # Households | Median Income |
| Owner-Occupied | 1,248 (60.9%) | $143,636 |
| Renter-Occupied | 802 (39.1%) | $45,592 |
| Average | 2,050 (100.0%) | $87,750 |
Occupancy by Householder Income Bracket in Falcon Heights
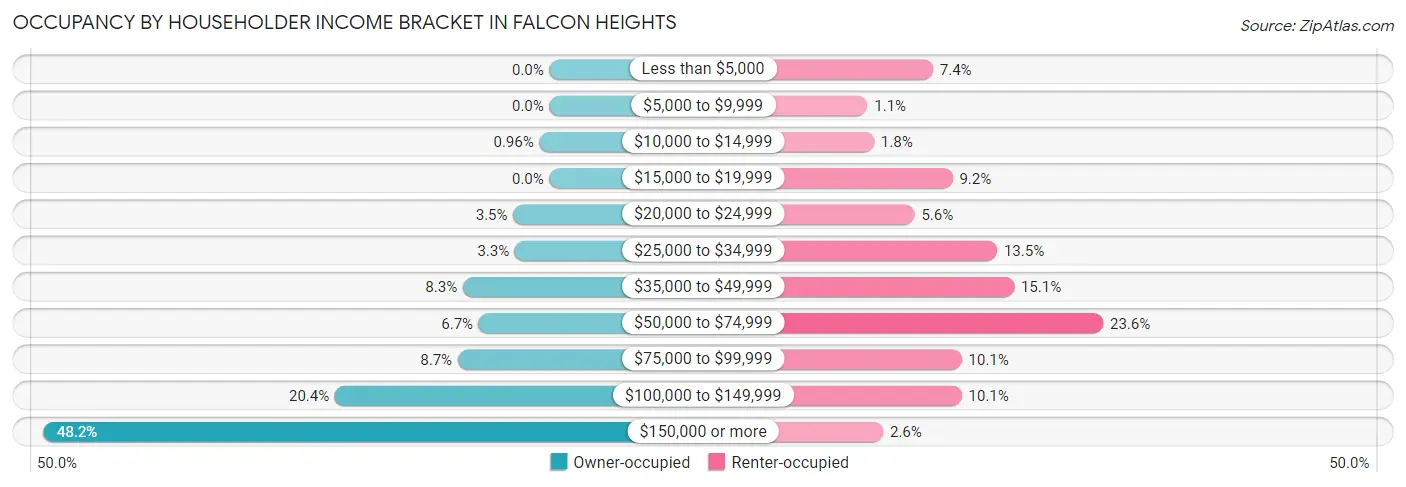
| Income Bracket | Owner-occupied | Renter-occupied |
| Less than $5,000 | 0 (0.0%) | 59 (7.4%) |
| $5,000 to $9,999 | 0 (0.0%) | 9 (1.1%) |
| $10,000 to $14,999 | 12 (1.0%) | 14 (1.8%) |
| $15,000 to $19,999 | 0 (0.0%) | 74 (9.2%) |
| $20,000 to $24,999 | 43 (3.5%) | 45 (5.6%) |
| $25,000 to $34,999 | 41 (3.3%) | 108 (13.5%) |
| $35,000 to $49,999 | 103 (8.3%) | 121 (15.1%) |
| $50,000 to $74,999 | 84 (6.7%) | 189 (23.6%) |
| $75,000 to $99,999 | 109 (8.7%) | 81 (10.1%) |
| $100,000 to $149,999 | 255 (20.4%) | 81 (10.1%) |
| $150,000 or more | 601 (48.2%) | 21 (2.6%) |
| Total | 1,248 (100.0%) | 802 (100.0%) |
Monthly Housing Cost Tiers in Falcon Heights
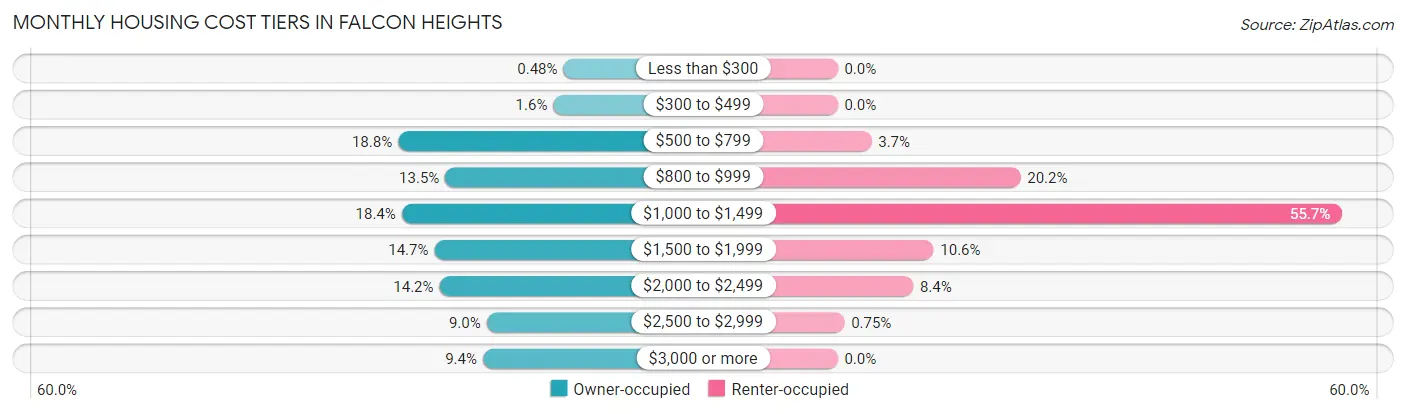
| Monthly Cost | Owner-occupied | Renter-occupied |
| Less than $300 | 6 (0.5%) | 0 (0.0%) |
| $300 to $499 | 20 (1.6%) | 0 (0.0%) |
| $500 to $799 | 234 (18.8%) | 30 (3.7%) |
| $800 to $999 | 169 (13.5%) | 162 (20.2%) |
| $1,000 to $1,499 | 229 (18.3%) | 447 (55.7%) |
| $1,500 to $1,999 | 184 (14.7%) | 85 (10.6%) |
| $2,000 to $2,499 | 177 (14.2%) | 67 (8.4%) |
| $2,500 to $2,999 | 112 (9.0%) | 6 (0.7%) |
| $3,000 or more | 117 (9.4%) | 0 (0.0%) |
| Total | 1,248 (100.0%) | 802 (100.0%) |
Physical Housing Characteristics in Falcon Heights
Housing Structures in Falcon Heights
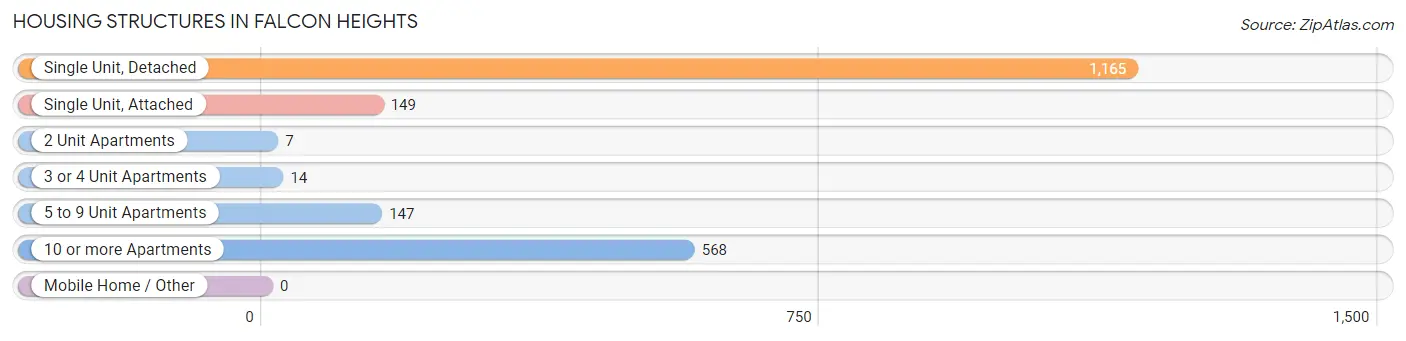
| Structure Type | # Housing Units | % Housing Units |
| Single Unit, Detached | 1,165 | 56.8% |
| Single Unit, Attached | 149 | 7.3% |
| 2 Unit Apartments | 7 | 0.3% |
| 3 or 4 Unit Apartments | 14 | 0.7% |
| 5 to 9 Unit Apartments | 147 | 7.2% |
| 10 or more Apartments | 568 | 27.7% |
| Mobile Home / Other | 0 | 0.0% |
| Total | 2,050 | 100.0% |
Housing Structures by Occupancy in Falcon Heights
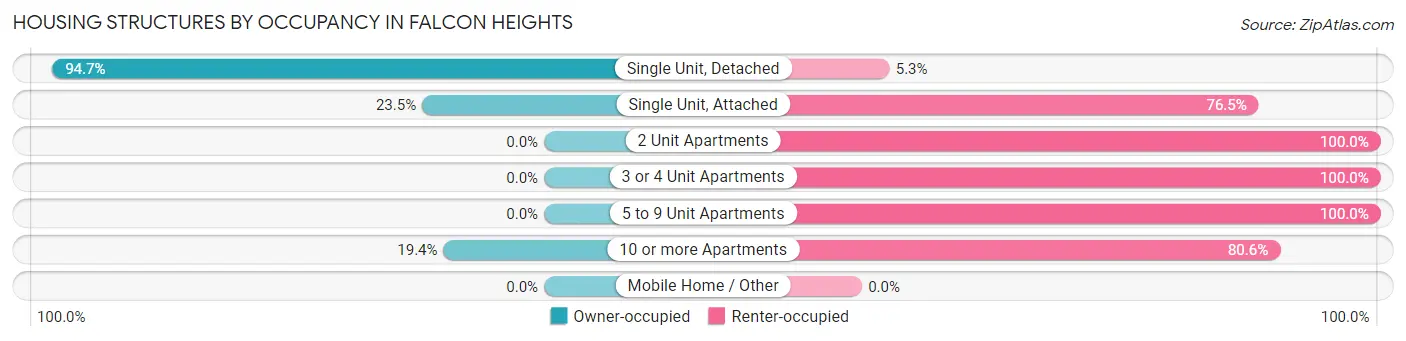
| Structure Type | Owner-occupied | Renter-occupied |
| Single Unit, Detached | 1,103 (94.7%) | 62 (5.3%) |
| Single Unit, Attached | 35 (23.5%) | 114 (76.5%) |
| 2 Unit Apartments | 0 (0.0%) | 7 (100.0%) |
| 3 or 4 Unit Apartments | 0 (0.0%) | 14 (100.0%) |
| 5 to 9 Unit Apartments | 0 (0.0%) | 147 (100.0%) |
| 10 or more Apartments | 110 (19.4%) | 458 (80.6%) |
| Mobile Home / Other | 0 (0.0%) | 0 (0.0%) |
| Total | 1,248 (60.9%) | 802 (39.1%) |
Housing Structures by Number of Rooms in Falcon Heights
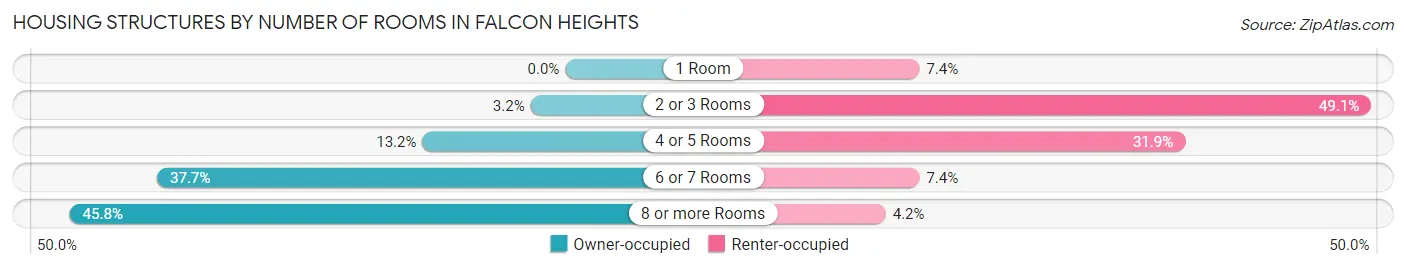
| Number of Rooms | Owner-occupied | Renter-occupied |
| 1 Room | 0 (0.0%) | 59 (7.4%) |
| 2 or 3 Rooms | 40 (3.2%) | 394 (49.1%) |
| 4 or 5 Rooms | 165 (13.2%) | 256 (31.9%) |
| 6 or 7 Rooms | 471 (37.7%) | 59 (7.4%) |
| 8 or more Rooms | 572 (45.8%) | 34 (4.2%) |
| Total | 1,248 (100.0%) | 802 (100.0%) |
Housing Structure by Heating Type in Falcon Heights
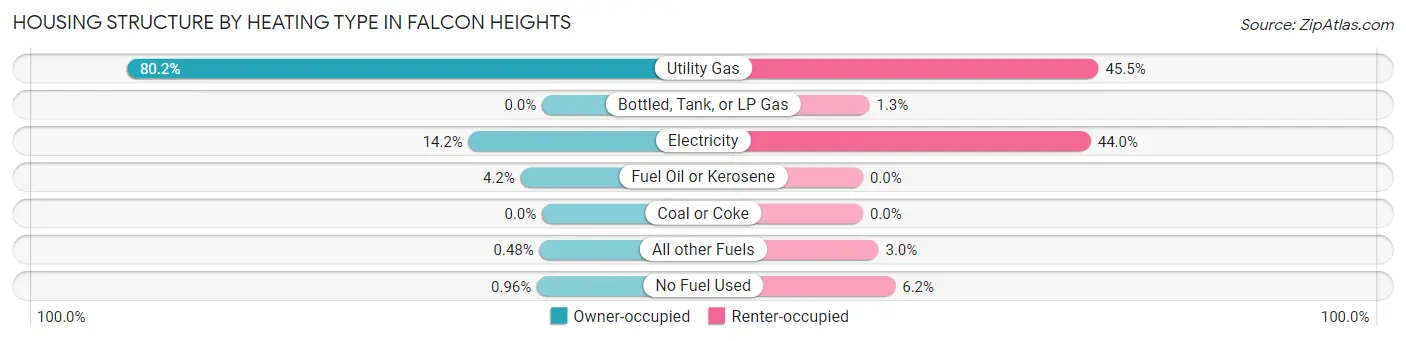
| Heating Type | Owner-occupied | Renter-occupied |
| Utility Gas | 1,001 (80.2%) | 365 (45.5%) |
| Bottled, Tank, or LP Gas | 0 (0.0%) | 10 (1.3%) |
| Electricity | 177 (14.2%) | 353 (44.0%) |
| Fuel Oil or Kerosene | 52 (4.2%) | 0 (0.0%) |
| Coal or Coke | 0 (0.0%) | 0 (0.0%) |
| All other Fuels | 6 (0.5%) | 24 (3.0%) |
| No Fuel Used | 12 (1.0%) | 50 (6.2%) |
| Total | 1,248 (100.0%) | 802 (100.0%) |
Household Vehicle Usage in Falcon Heights
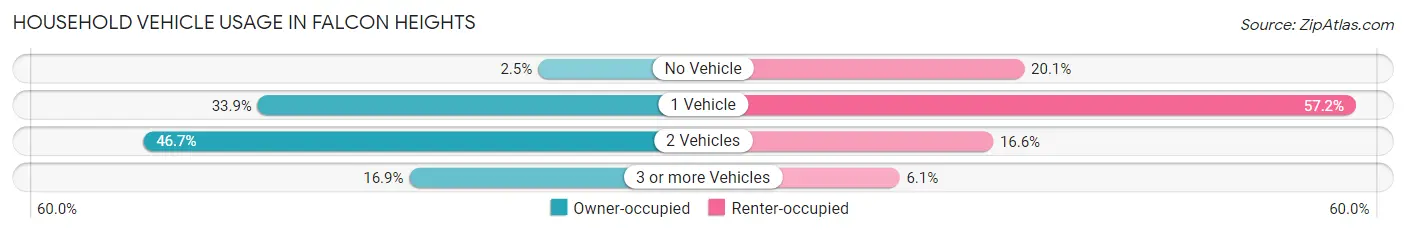
| Vehicles per Household | Owner-occupied | Renter-occupied |
| No Vehicle | 31 (2.5%) | 161 (20.1%) |
| 1 Vehicle | 423 (33.9%) | 459 (57.2%) |
| 2 Vehicles | 583 (46.7%) | 133 (16.6%) |
| 3 or more Vehicles | 211 (16.9%) | 49 (6.1%) |
| Total | 1,248 (100.0%) | 802 (100.0%) |
Real Estate & Mortgages in Falcon Heights
Real Estate and Mortgage Overview in Falcon Heights
| Characteristic | Without Mortgage | With Mortgage |
| Housing Units | 579 | 669 |
| Median Property Value | $343,700 | $356,300 |
| Median Household Income | $114,821 | $439 |
| Monthly Housing Costs | $857 | $117 |
| Real Estate Taxes | $4,558 | $0 |
Property Value by Mortgage Status in Falcon Heights
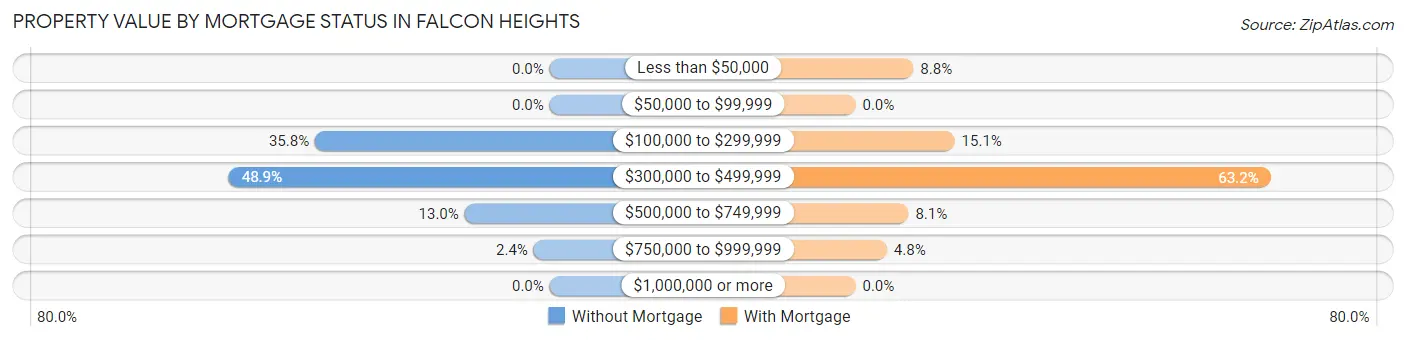
| Property Value | Without Mortgage | With Mortgage |
| Less than $50,000 | 0 (0.0%) | 59 (8.8%) |
| $50,000 to $99,999 | 0 (0.0%) | 0 (0.0%) |
| $100,000 to $299,999 | 207 (35.7%) | 101 (15.1%) |
| $300,000 to $499,999 | 283 (48.9%) | 423 (63.2%) |
| $500,000 to $749,999 | 75 (13.0%) | 54 (8.1%) |
| $750,000 to $999,999 | 14 (2.4%) | 32 (4.8%) |
| $1,000,000 or more | 0 (0.0%) | 0 (0.0%) |
| Total | 579 (100.0%) | 669 (100.0%) |
Household Income by Mortgage Status in Falcon Heights
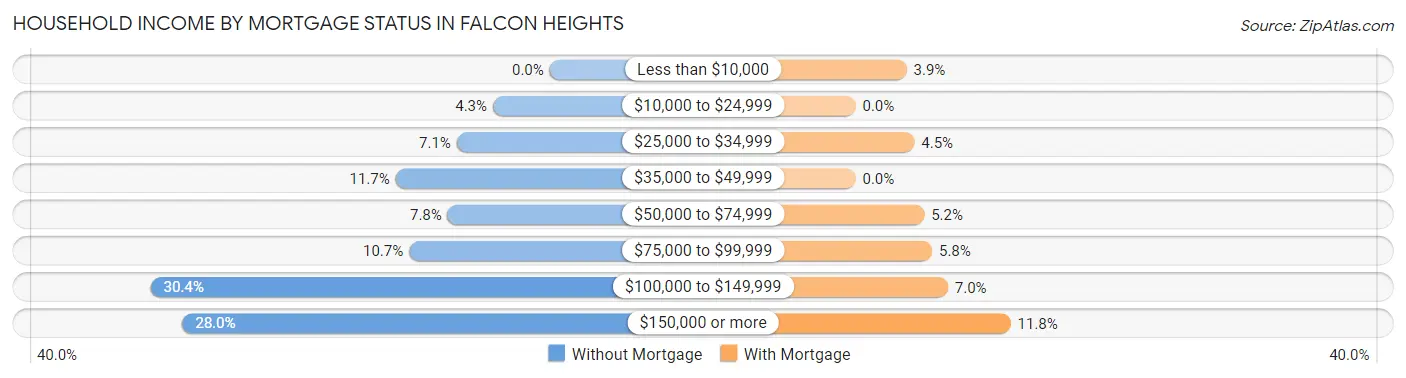
| Household Income | Without Mortgage | With Mortgage |
| Less than $10,000 | 0 (0.0%) | 26 (3.9%) |
| $10,000 to $24,999 | 25 (4.3%) | 0 (0.0%) |
| $25,000 to $34,999 | 41 (7.1%) | 30 (4.5%) |
| $35,000 to $49,999 | 68 (11.7%) | 0 (0.0%) |
| $50,000 to $74,999 | 45 (7.8%) | 35 (5.2%) |
| $75,000 to $99,999 | 62 (10.7%) | 39 (5.8%) |
| $100,000 to $149,999 | 176 (30.4%) | 47 (7.0%) |
| $150,000 or more | 162 (28.0%) | 79 (11.8%) |
| Total | 579 (100.0%) | 669 (100.0%) |
Property Value to Household Income Ratio in Falcon Heights
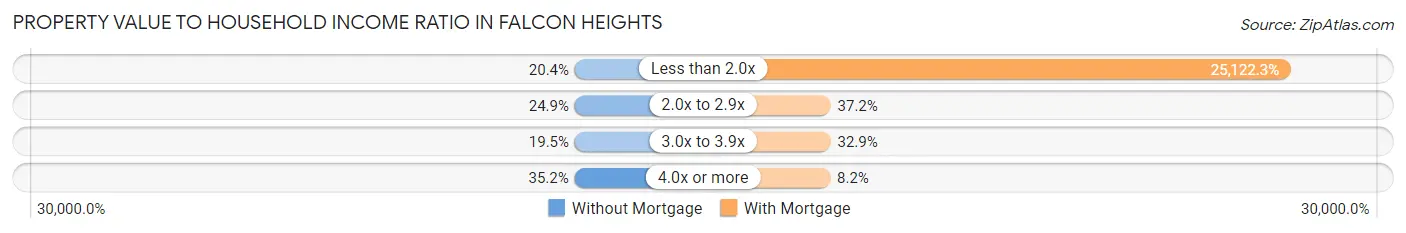
| Value-to-Income Ratio | Without Mortgage | With Mortgage |
| Less than 2.0x | 118 (20.4%) | 168,068 (25,122.3%) |
| 2.0x to 2.9x | 144 (24.9%) | 249 (37.2%) |
| 3.0x to 3.9x | 113 (19.5%) | 220 (32.9%) |
| 4.0x or more | 204 (35.2%) | 55 (8.2%) |
| Total | 579 (100.0%) | 669 (100.0%) |
Real Estate Taxes by Mortgage Status in Falcon Heights
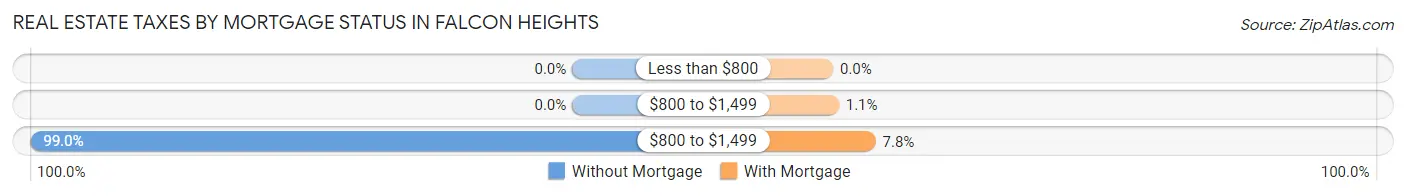
| Property Taxes | Without Mortgage | With Mortgage |
| Less than $800 | 0 (0.0%) | 0 (0.0%) |
| $800 to $1,499 | 0 (0.0%) | 7 (1.1%) |
| $800 to $1,499 | 573 (99.0%) | 52 (7.8%) |
| Total | 579 (100.0%) | 669 (100.0%) |
Health & Disability in Falcon Heights
Health Insurance Coverage by Age in Falcon Heights
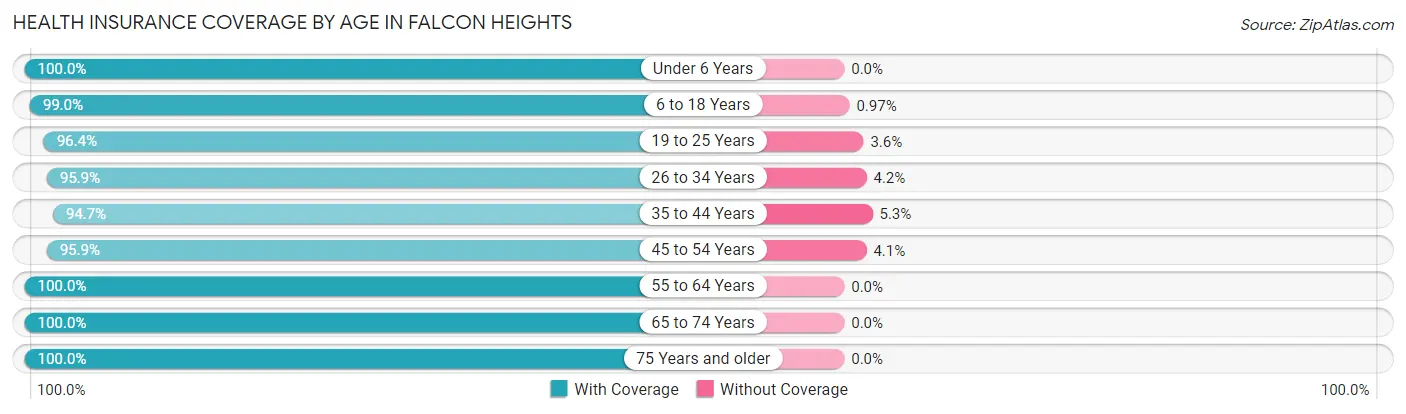
| Age Bracket | With Coverage | Without Coverage |
| Under 6 Years | 325 (100.0%) | 0 (0.0%) |
| 6 to 18 Years | 919 (99.0%) | 9 (1.0%) |
| 19 to 25 Years | 568 (96.4%) | 21 (3.6%) |
| 26 to 34 Years | 669 (95.9%) | 29 (4.2%) |
| 35 to 44 Years | 667 (94.7%) | 37 (5.3%) |
| 45 to 54 Years | 464 (95.9%) | 20 (4.1%) |
| 55 to 64 Years | 617 (100.0%) | 0 (0.0%) |
| 65 to 74 Years | 411 (100.0%) | 0 (0.0%) |
| 75 Years and older | 476 (100.0%) | 0 (0.0%) |
| Total | 5,116 (97.8%) | 116 (2.2%) |
Health Insurance Coverage by Citizenship Status in Falcon Heights
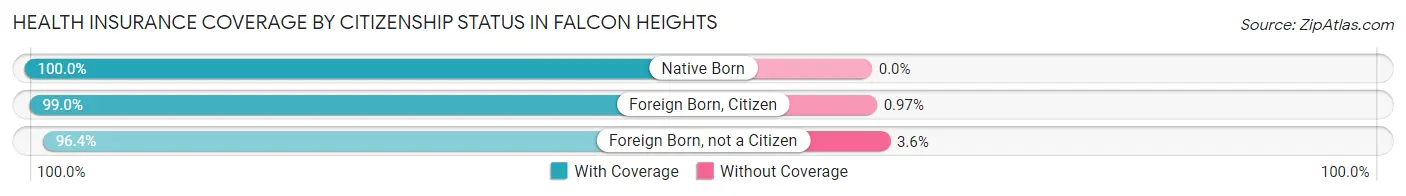
| Citizenship Status | With Coverage | Without Coverage |
| Native Born | 325 (100.0%) | 0 (0.0%) |
| Foreign Born, Citizen | 919 (99.0%) | 9 (1.0%) |
| Foreign Born, not a Citizen | 568 (96.4%) | 21 (3.6%) |
Health Insurance Coverage by Household Income in Falcon Heights
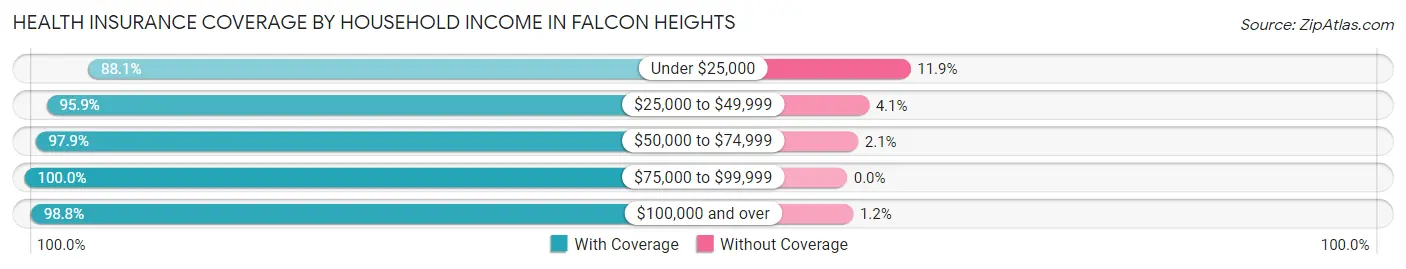
| Household Income | With Coverage | Without Coverage |
| Under $25,000 | 341 (88.1%) | 46 (11.9%) |
| $25,000 to $49,999 | 608 (95.9%) | 26 (4.1%) |
| $50,000 to $74,999 | 567 (97.9%) | 12 (2.1%) |
| $75,000 to $99,999 | 437 (100.0%) | 0 (0.0%) |
| $100,000 and over | 2,718 (98.8%) | 32 (1.2%) |
Public vs Private Health Insurance Coverage by Age in Falcon Heights
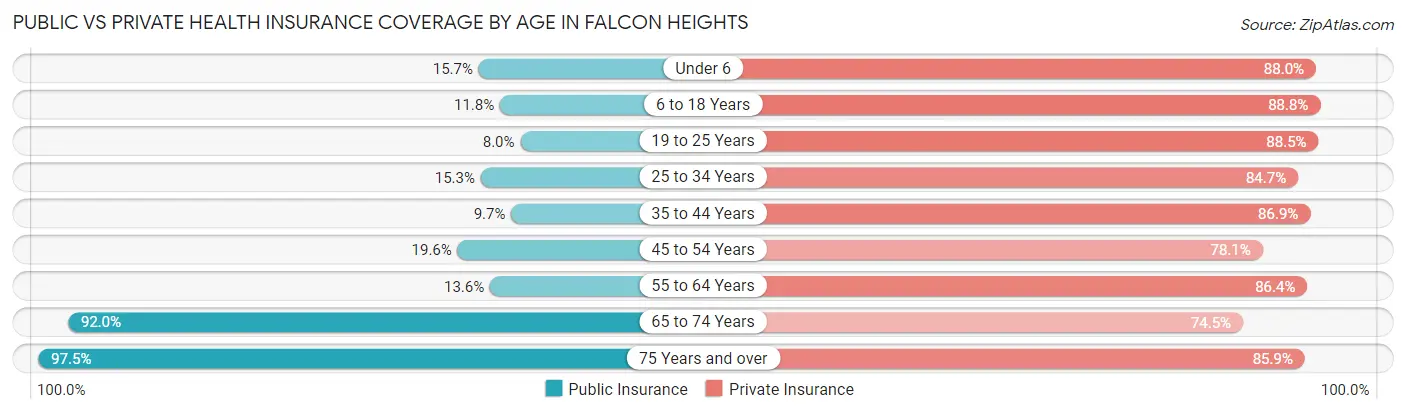
| Age Bracket | Public Insurance | Private Insurance |
| Under 6 | 51 (15.7%) | 286 (88.0%) |
| 6 to 18 Years | 109 (11.7%) | 824 (88.8%) |
| 19 to 25 Years | 47 (8.0%) | 521 (88.5%) |
| 25 to 34 Years | 107 (15.3%) | 591 (84.7%) |
| 35 to 44 Years | 68 (9.7%) | 612 (86.9%) |
| 45 to 54 Years | 95 (19.6%) | 378 (78.1%) |
| 55 to 64 Years | 84 (13.6%) | 533 (86.4%) |
| 65 to 74 Years | 378 (92.0%) | 306 (74.5%) |
| 75 Years and over | 464 (97.5%) | 409 (85.9%) |
| Total | 1,403 (26.8%) | 4,460 (85.2%) |
Disability Status by Sex by Age in Falcon Heights
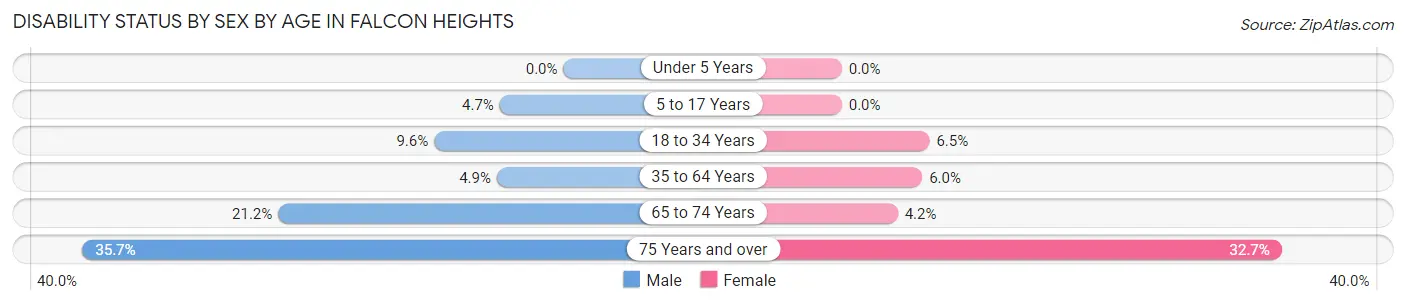
| Age Bracket | Male | Female |
| Under 5 Years | 0 (0.0%) | 0 (0.0%) |
| 5 to 17 Years | 19 (4.7%) | 0 (0.0%) |
| 18 to 34 Years | 75 (9.6%) | 52 (6.5%) |
| 35 to 64 Years | 42 (4.9%) | 57 (6.0%) |
| 65 to 74 Years | 36 (21.2%) | 10 (4.2%) |
| 75 Years and over | 65 (35.7%) | 96 (32.7%) |
Disability Class by Sex by Age in Falcon Heights
Disability Class: Hearing Difficulty
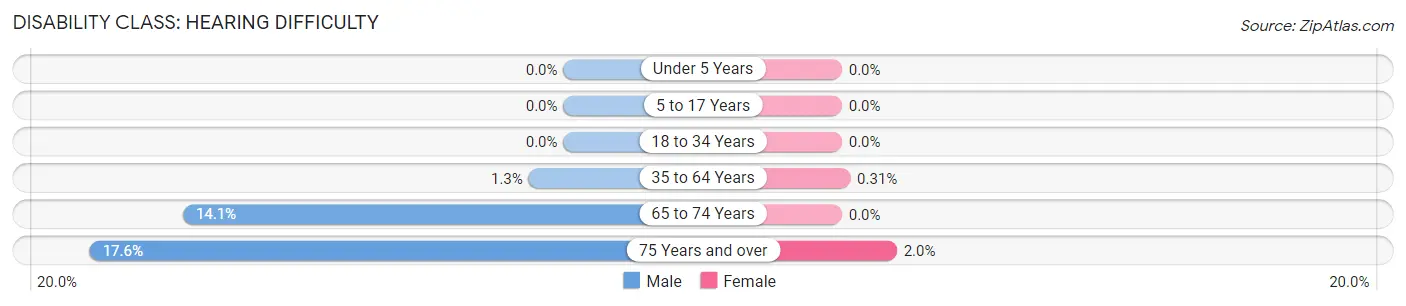
| Age Bracket | Male | Female |
| Under 5 Years | 0 (0.0%) | 0 (0.0%) |
| 5 to 17 Years | 0 (0.0%) | 0 (0.0%) |
| 18 to 34 Years | 0 (0.0%) | 0 (0.0%) |
| 35 to 64 Years | 11 (1.3%) | 3 (0.3%) |
| 65 to 74 Years | 24 (14.1%) | 0 (0.0%) |
| 75 Years and over | 32 (17.6%) | 6 (2.0%) |
Disability Class: Vision Difficulty
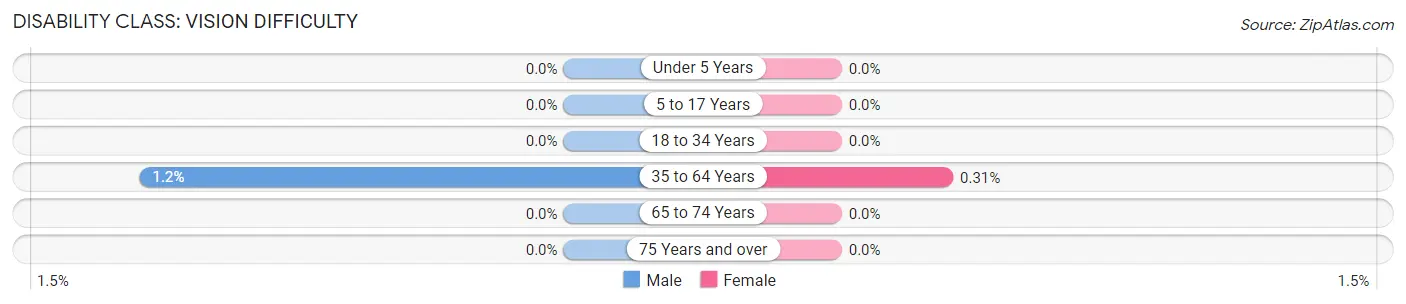
| Age Bracket | Male | Female |
| Under 5 Years | 0 (0.0%) | 0 (0.0%) |
| 5 to 17 Years | 0 (0.0%) | 0 (0.0%) |
| 18 to 34 Years | 0 (0.0%) | 0 (0.0%) |
| 35 to 64 Years | 10 (1.2%) | 3 (0.3%) |
| 65 to 74 Years | 0 (0.0%) | 0 (0.0%) |
| 75 Years and over | 0 (0.0%) | 0 (0.0%) |
Disability Class: Cognitive Difficulty
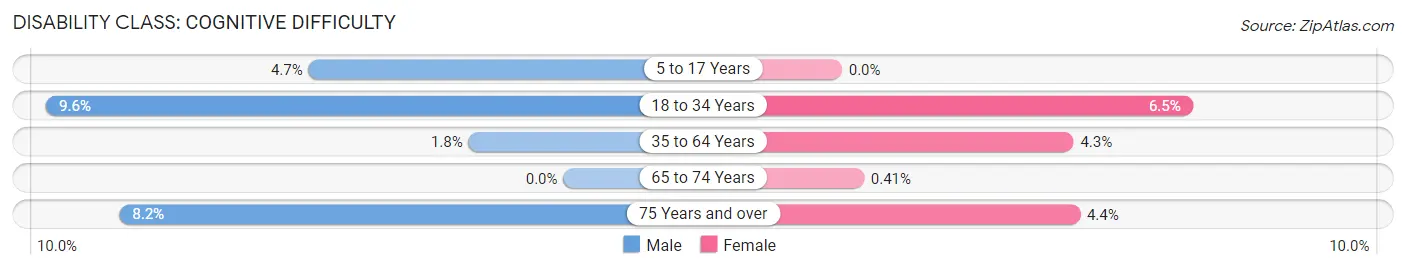
| Age Bracket | Male | Female |
| 5 to 17 Years | 19 (4.7%) | 0 (0.0%) |
| 18 to 34 Years | 75 (9.6%) | 52 (6.5%) |
| 35 to 64 Years | 15 (1.8%) | 41 (4.3%) |
| 65 to 74 Years | 0 (0.0%) | 1 (0.4%) |
| 75 Years and over | 15 (8.2%) | 13 (4.4%) |
Disability Class: Ambulatory Difficulty
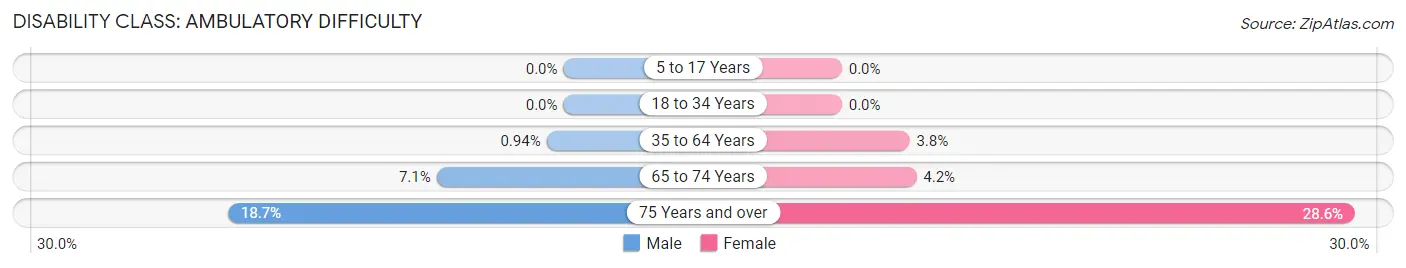
| Age Bracket | Male | Female |
| 5 to 17 Years | 0 (0.0%) | 0 (0.0%) |
| 18 to 34 Years | 0 (0.0%) | 0 (0.0%) |
| 35 to 64 Years | 8 (0.9%) | 36 (3.8%) |
| 65 to 74 Years | 12 (7.1%) | 10 (4.2%) |
| 75 Years and over | 34 (18.7%) | 84 (28.6%) |
Disability Class: Self-Care Difficulty
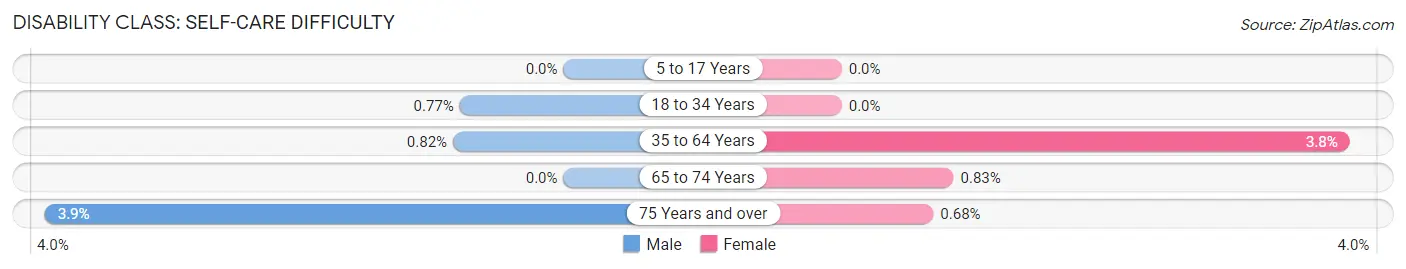
| Age Bracket | Male | Female |
| 5 to 17 Years | 0 (0.0%) | 0 (0.0%) |
| 18 to 34 Years | 6 (0.8%) | 0 (0.0%) |
| 35 to 64 Years | 7 (0.8%) | 36 (3.8%) |
| 65 to 74 Years | 0 (0.0%) | 2 (0.8%) |
| 75 Years and over | 7 (3.8%) | 2 (0.7%) |
Technology Access in Falcon Heights
Computing Device Access in Falcon Heights
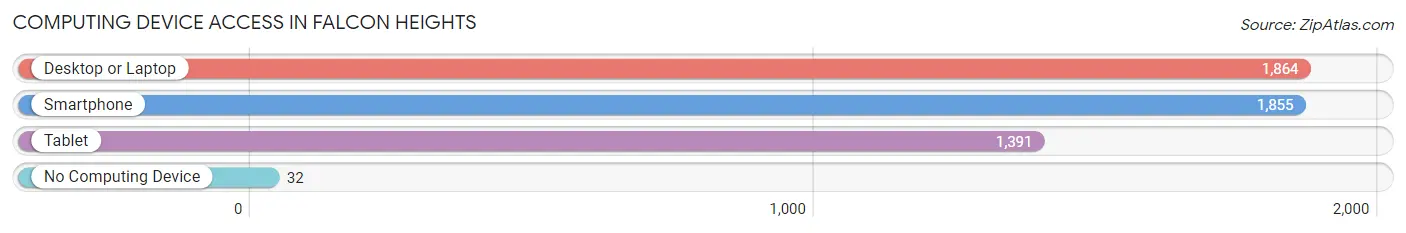
| Device Type | # Households | % Households |
| Desktop or Laptop | 1,864 | 90.9% |
| Smartphone | 1,855 | 90.5% |
| Tablet | 1,391 | 67.8% |
| No Computing Device | 32 | 1.6% |
| Total | 2,050 | 100.0% |
Internet Access in Falcon Heights
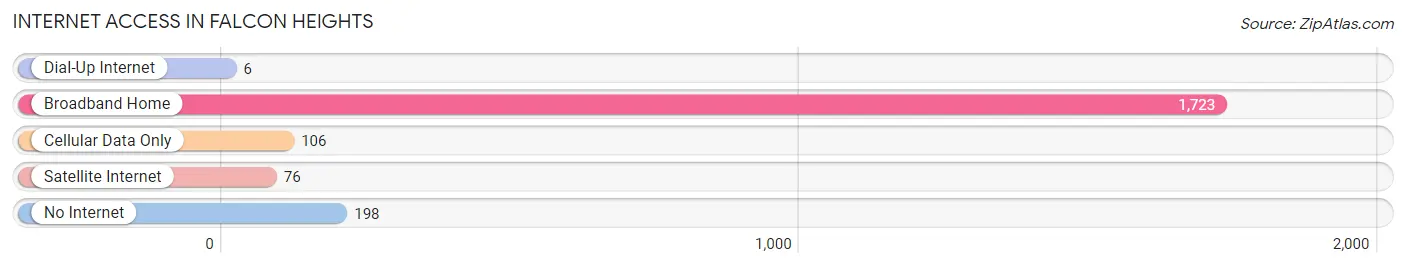
| Internet Type | # Households | % Households |
| Dial-Up Internet | 6 | 0.3% |
| Broadband Home | 1,723 | 84.1% |
| Cellular Data Only | 106 | 5.2% |
| Satellite Internet | 76 | 3.7% |
| No Internet | 198 | 9.7% |
| Total | 2,050 | 100.0% |
Falcon Heights Summary
Falcon Heights is a city located in Ramsey County, Minnesota, United States. It is a suburb of the Twin Cities metropolitan area and is located just north of the city of Saint Paul. As of the 2010 census, the population of Falcon Heights was 5,321.
History
The area that is now Falcon Heights was originally inhabited by the Dakota Sioux. The first European settlers arrived in the area in the mid-1800s, and the area was incorporated as a village in 1949. The village was named after the falcon, which was a symbol of the area’s early settlers.
Geography
Falcon Heights is located in Ramsey County, Minnesota, and is situated just north of the city of Saint Paul. It is bordered by the cities of Lauderdale, Roseville, and Arden Hills. The city has a total area of 1.6 square miles, all of which is land.
Economy
The economy of Falcon Heights is largely based on the service industry. The city is home to several large employers, including the University of Minnesota, the Minnesota State Fair, and the Minnesota Zoo. Additionally, the city is home to several small businesses, including restaurants, retail stores, and professional services.
Demographics
As of the 2010 census, the population of Falcon Heights was 5,321. The racial makeup of the city was 79.2% White, 8.2% African American, 0.3% Native American, 8.2% Asian, 0.1% Pacific Islander, and 3.2% from other races. The median household income in Falcon Heights was $63,945, and the median family income was $76,945. The per capita income in Falcon Heights was $31,945.
Conclusion
Falcon Heights is a city located in Ramsey County, Minnesota, United States. It is a suburb of the Twin Cities metropolitan area and is located just north of the city of Saint Paul. The area was originally inhabited by the Dakota Sioux, and the first European settlers arrived in the area in the mid-1800s. The economy of Falcon Heights is largely based on the service industry, and the city is home to several large employers, including the University of Minnesota, the Minnesota State Fair, and the Minnesota Zoo. As of the 2010 census, the population of Falcon Heights was 5,321, and the median household income was $63,945.
Common Questions
What is Per Capita Income in Falcon Heights?
Per Capita income in Falcon Heights is $47,425.
What is the Median Family Income in Falcon Heights?
Median Family Income in Falcon Heights is $133,650.
What is the Median Household income in Falcon Heights?
Median Household Income in Falcon Heights is $87,750.
What is Income or Wage Gap in Falcon Heights?
Income or Wage Gap in Falcon Heights is 33.4%.
Women in Falcon Heights earn 66.6 cents for every dollar earned by a man.
What is Inequality or Gini Index in Falcon Heights?
Inequality or Gini Index in Falcon Heights is 0.45.
What is the Total Population of Falcon Heights?
Total Population of Falcon Heights is 5,232.
What is the Total Male Population of Falcon Heights?
Total Male Population of Falcon Heights is 2,493.
What is the Total Female Population of Falcon Heights?
Total Female Population of Falcon Heights is 2,739.
What is the Ratio of Males per 100 Females in Falcon Heights?
There are 91.02 Males per 100 Females in Falcon Heights.
What is the Ratio of Females per 100 Males in Falcon Heights?
There are 109.87 Females per 100 Males in Falcon Heights.
What is the Median Population Age in Falcon Heights?
Median Population Age in Falcon Heights is 36.1 Years.
What is the Average Family Size in Falcon Heights
Average Family Size in Falcon Heights is 3.0 People.
What is the Average Household Size in Falcon Heights
Average Household Size in Falcon Heights is 2.3 People.
How Large is the Labor Force in Falcon Heights?
There are 3,105 People in the Labor Forcein in Falcon Heights.
What is the Percentage of People in the Labor Force in Falcon Heights?
70.5% of People are in the Labor Force in Falcon Heights.
What is the Unemployment Rate in Falcon Heights?
Unemployment Rate in Falcon Heights is 8.1%.