Rollingstone, MN Map & Demographics
Rollingstone Map
Rollingstone Overview
$37,116
PER CAPITA INCOME
$92,500
AVG FAMILY INCOME
$87,000
AVG HOUSEHOLD INCOME
38.2%
WAGE / INCOME GAP [ % ]
61.8¢/ $1
WAGE / INCOME GAP [ $ ]
0.40
INEQUALITY / GINI INDEX
601
TOTAL POPULATION
294
MALE POPULATION
307
FEMALE POPULATION
95.77
MALES / 100 FEMALES
104.42
FEMALES / 100 MALES
42.6
MEDIAN AGE
3.0
AVG FAMILY SIZE
2.7
AVG HOUSEHOLD SIZE
304
LABOR FORCE [ PEOPLE ]
66.7%
PERCENT IN LABOR FORCE
1.6%
UNEMPLOYMENT RATE
Rollingstone Zip Codes
Rollingstone Area Codes
Income in Rollingstone
Income Overview in Rollingstone
Per Capita Income in Rollingstone is $37,116, while median incomes of families and households are $92,500 and $87,000 respectively.
| Characteristic | Number | Measure |
| Per Capita Income | 601 | $37,116 |
| Median Family Income | 172 | $92,500 |
| Mean Family Income | 172 | $103,766 |
| Median Household Income | 226 | $87,000 |
| Mean Household Income | 226 | $97,075 |
| Income Deficit | 172 | $0 |
| Wage / Income Gap (%) | 601 | 38.22% |
| Wage / Income Gap ($) | 601 | 61.78¢ per $1 |
| Gini / Inequality Index | 601 | 0.40 |
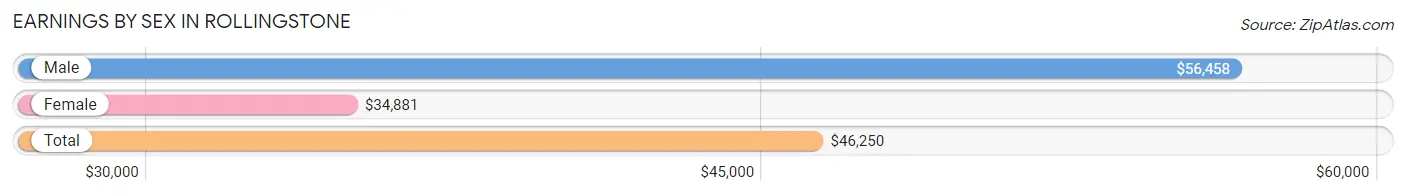
Earnings by Sex in Rollingstone
Average Earnings in Rollingstone are $46,250, $56,458 for men and $34,881 for women, a difference of 38.2%.
| Sex | Number | Average Earnings |
| Male | 160 (51.3%) | $56,458 |
| Female | 152 (48.7%) | $34,881 |
| Total | 312 (100.0%) | $46,250 |
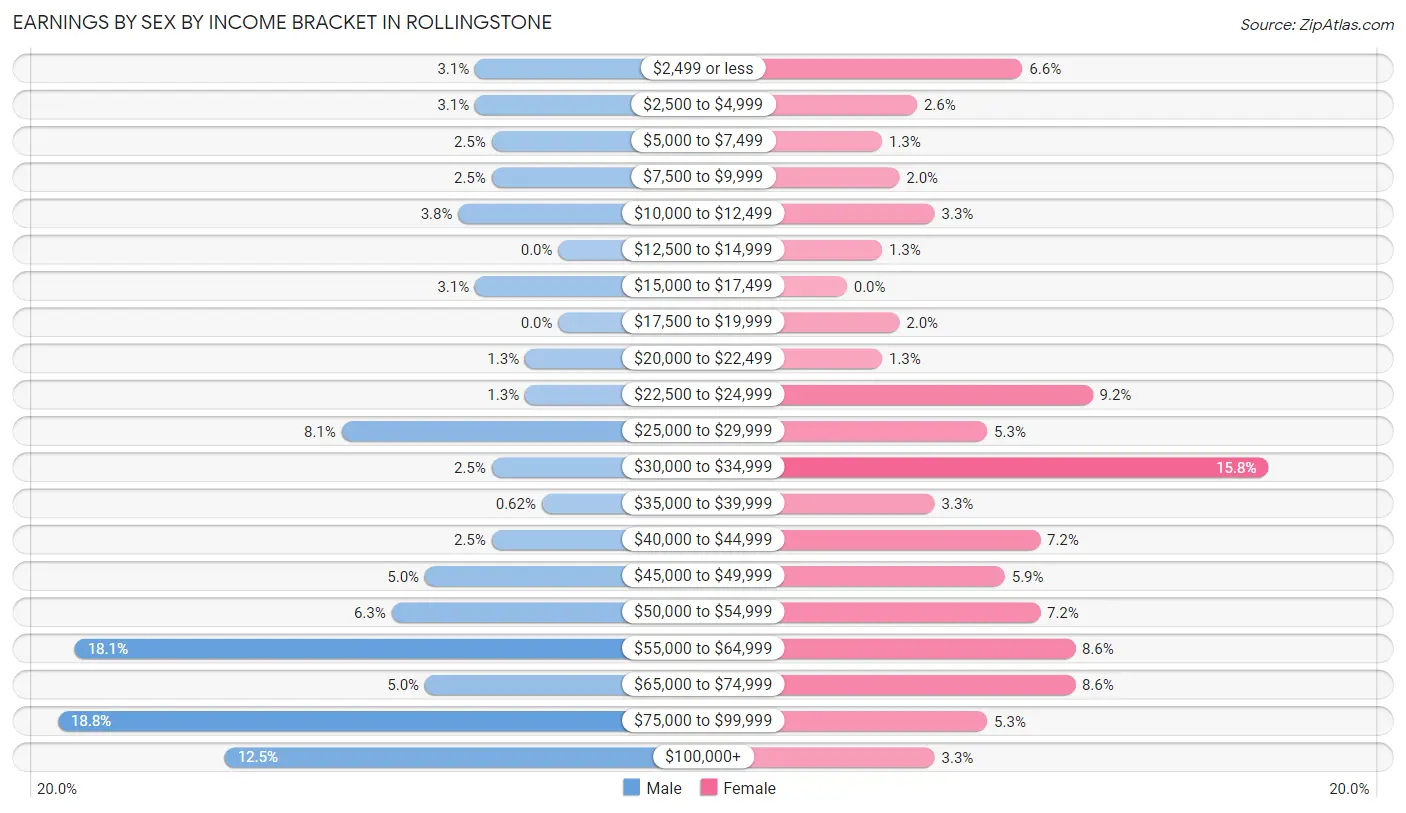
Earnings by Sex by Income Bracket in Rollingstone
The most common earnings brackets in Rollingstone are $75,000 to $99,999 for men (30 | 18.8%) and $30,000 to $34,999 for women (24 | 15.8%).
| Income | Male | Female |
| $2,499 or less | 5 (3.1%) | 10 (6.6%) |
| $2,500 to $4,999 | 5 (3.1%) | 4 (2.6%) |
| $5,000 to $7,499 | 4 (2.5%) | 2 (1.3%) |
| $7,500 to $9,999 | 4 (2.5%) | 3 (2.0%) |
| $10,000 to $12,499 | 6 (3.7%) | 5 (3.3%) |
| $12,500 to $14,999 | 0 (0.0%) | 2 (1.3%) |
| $15,000 to $17,499 | 5 (3.1%) | 0 (0.0%) |
| $17,500 to $19,999 | 0 (0.0%) | 3 (2.0%) |
| $20,000 to $22,499 | 2 (1.3%) | 2 (1.3%) |
| $22,500 to $24,999 | 2 (1.3%) | 14 (9.2%) |
| $25,000 to $29,999 | 13 (8.1%) | 8 (5.3%) |
| $30,000 to $34,999 | 4 (2.5%) | 24 (15.8%) |
| $35,000 to $39,999 | 1 (0.6%) | 5 (3.3%) |
| $40,000 to $44,999 | 4 (2.5%) | 11 (7.2%) |
| $45,000 to $49,999 | 8 (5.0%) | 9 (5.9%) |
| $50,000 to $54,999 | 10 (6.2%) | 11 (7.2%) |
| $55,000 to $64,999 | 29 (18.1%) | 13 (8.6%) |
| $65,000 to $74,999 | 8 (5.0%) | 13 (8.6%) |
| $75,000 to $99,999 | 30 (18.8%) | 8 (5.3%) |
| $100,000+ | 20 (12.5%) | 5 (3.3%) |
| Total | 160 (100.0%) | 152 (100.0%) |
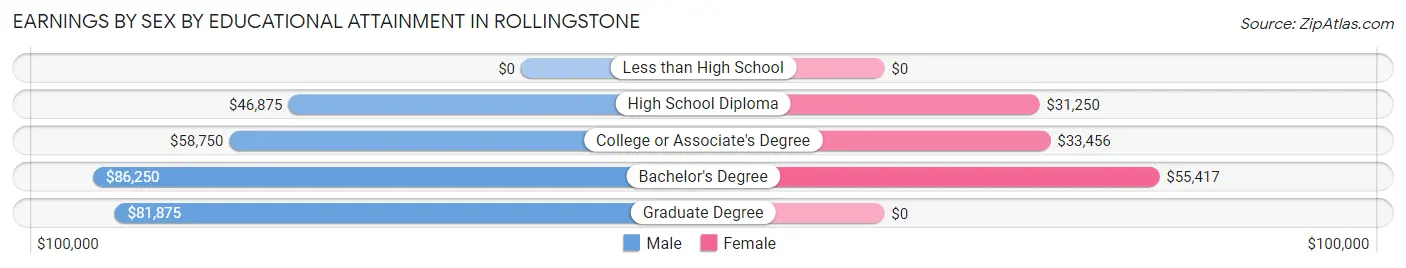
Earnings by Sex by Educational Attainment in Rollingstone
Average earnings in Rollingstone are $60,469 for men and $36,250 for women, a difference of 40.1%. Men with an educational attainment of bachelor's degree enjoy the highest average annual earnings of $86,250, while those with high school diploma education earn the least with $46,875. Women with an educational attainment of bachelor's degree earn the most with the average annual earnings of $55,417, while those with high school diploma education have the smallest earnings of $31,250.
| Educational Attainment | Male Income | Female Income |
| Less than High School | - | - |
| High School Diploma | $46,875 | $31,250 |
| College or Associate's Degree | $58,750 | $33,456 |
| Bachelor's Degree | $86,250 | $55,417 |
| Graduate Degree | $81,875 | $0 |
| Total | $60,469 | $36,250 |
Family Income in Rollingstone
Family Income Brackets in Rollingstone
According to the Rollingstone family income data, there are 42 families falling into the $75,000 to $99,999 income range, which is the most common income bracket and makes up 24.4% of all families. Conversely, the less than $10,000 income bracket is the least frequent group with only 4 families (2.3%) belonging to this category.
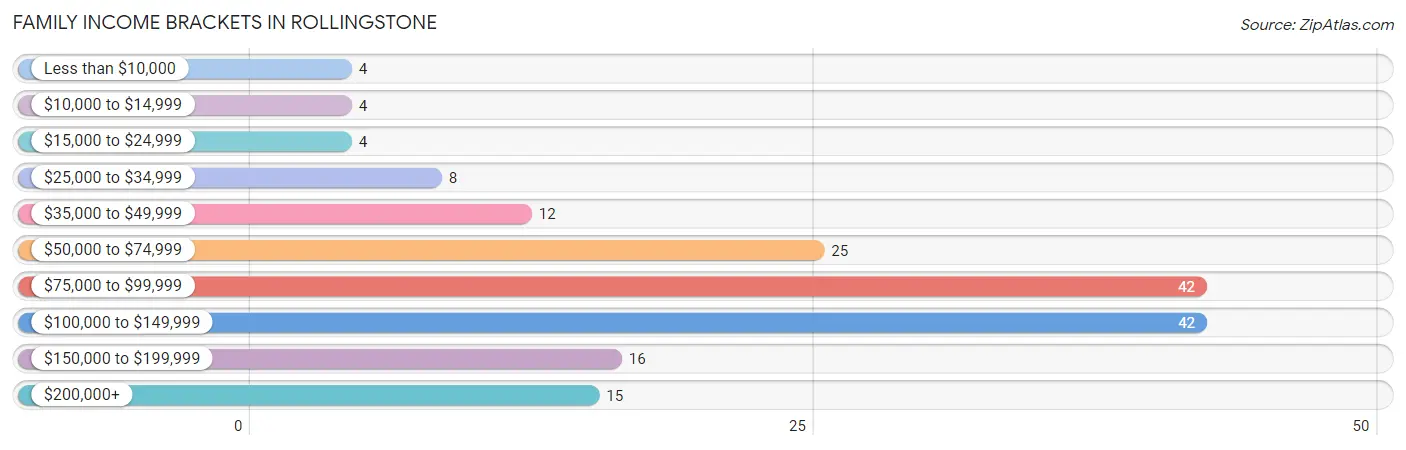
| Income Bracket | # Families | % Families |
| Less than $10,000 | 4 | 2.3% |
| $10,000 to $14,999 | 4 | 2.3% |
| $15,000 to $24,999 | 4 | 2.3% |
| $25,000 to $34,999 | 8 | 4.7% |
| $35,000 to $49,999 | 12 | 7.0% |
| $50,000 to $74,999 | 25 | 14.5% |
| $75,000 to $99,999 | 42 | 24.4% |
| $100,000 to $149,999 | 42 | 24.4% |
| $150,000 to $199,999 | 16 | 9.3% |
| $200,000+ | 15 | 8.7% |
Family Income by Famaliy Size in Rollingstone
4-person families (24 | 14.0%) account for the highest median family income in Rollingstone with $121,250 per family, while 2-person families (86 | 50.0%) have the highest median income of $40,000 per family member.
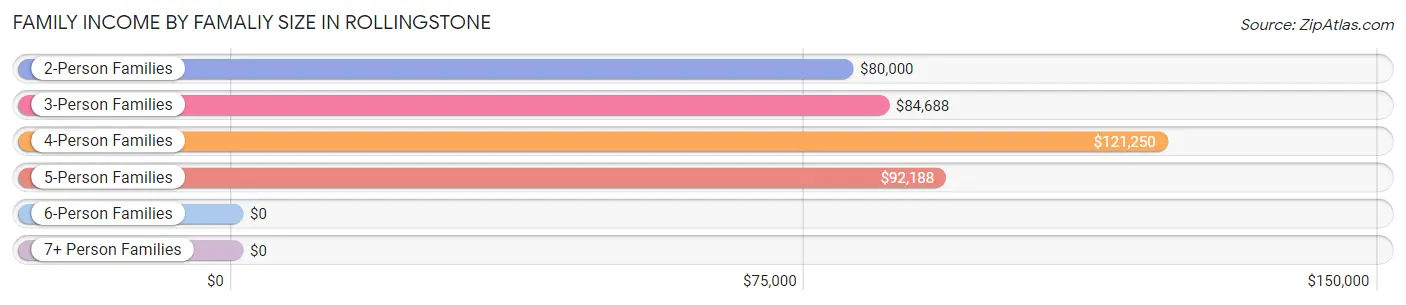
| Income Bracket | # Families | Median Income |
| 2-Person Families | 86 (50.0%) | $80,000 |
| 3-Person Families | 40 (23.3%) | $84,688 |
| 4-Person Families | 24 (14.0%) | $121,250 |
| 5-Person Families | 13 (7.6%) | $92,188 |
| 6-Person Families | 7 (4.1%) | $0 |
| 7+ Person Families | 2 (1.2%) | $0 |
| Total | 172 (100.0%) | $92,500 |
Family Income by Number of Earners in Rollingstone
The median family income in Rollingstone is $92,500, with families comprising 2 earners (84) having the highest median family income of $112,500, while families with no earners (26) have the lowest median family income of $35,000, accounting for 48.8% and 15.1% of families, respectively.
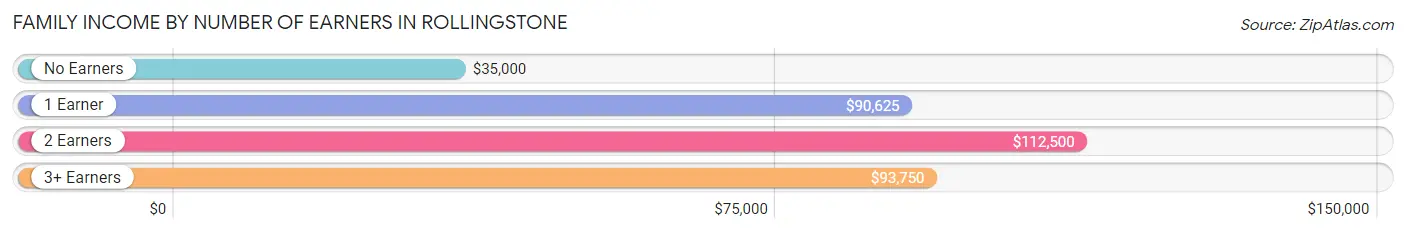
| Number of Earners | # Families | Median Income |
| No Earners | 26 (15.1%) | $35,000 |
| 1 Earner | 44 (25.6%) | $90,625 |
| 2 Earners | 84 (48.8%) | $112,500 |
| 3+ Earners | 18 (10.5%) | $93,750 |
| Total | 172 (100.0%) | $92,500 |
Household Income in Rollingstone
Household Income Brackets in Rollingstone
With 54 households falling in the category, the $100,000 to $149,999 income range is the most frequent in Rollingstone, accounting for 23.9% of all households. In contrast, only 8 households (3.5%) fall into the $10,000 to $14,999 income bracket, making it the least populous group.
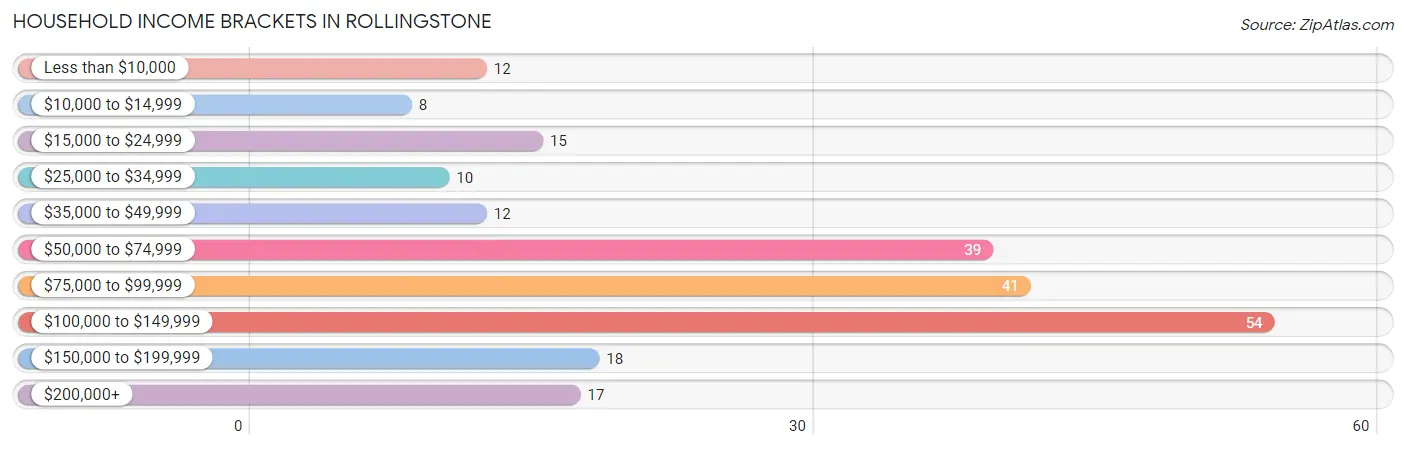
| Income Bracket | # Households | % Households |
| Less than $10,000 | 12 | 5.3% |
| $10,000 to $14,999 | 8 | 3.5% |
| $15,000 to $24,999 | 15 | 6.6% |
| $25,000 to $34,999 | 10 | 4.4% |
| $35,000 to $49,999 | 12 | 5.3% |
| $50,000 to $74,999 | 39 | 17.3% |
| $75,000 to $99,999 | 41 | 18.1% |
| $100,000 to $149,999 | 54 | 23.9% |
| $150,000 to $199,999 | 18 | 8.0% |
| $200,000+ | 17 | 7.5% |
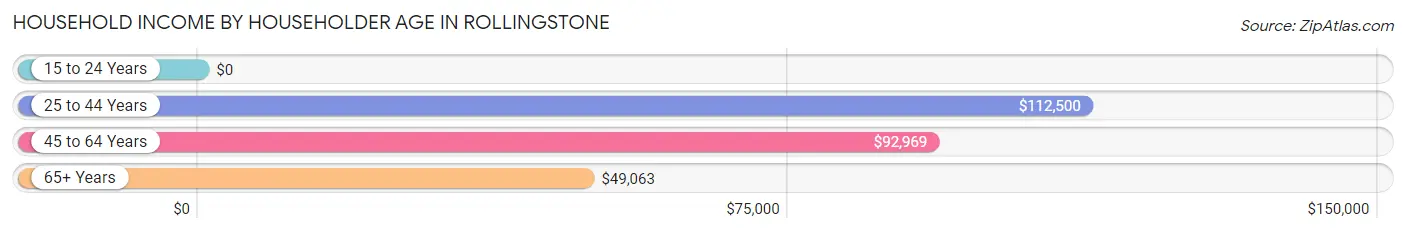
Household Income by Householder Age in Rollingstone
The median household income in Rollingstone is $87,000, with the highest median household income of $112,500 found in the 25 to 44 years age bracket for the primary householder. A total of 58 households (25.7%) fall into this category.
| Income Bracket | # Households | Median Income |
| 15 to 24 Years | 0 (0.0%) | $0 |
| 25 to 44 Years | 58 (25.7%) | $112,500 |
| 45 to 64 Years | 99 (43.8%) | $92,969 |
| 65+ Years | 69 (30.5%) | $49,063 |
| Total | 226 (100.0%) | $87,000 |
Poverty in Rollingstone
Income Below Poverty by Sex and Age in Rollingstone
With 5.1% poverty level for males and 7.6% for females among the residents of Rollingstone, 65 to 74 year old males and 65 to 74 year old females are the most vulnerable to poverty, with 5 males (17.2%) and 10 females (22.2%) in their respective age groups living below the poverty level.
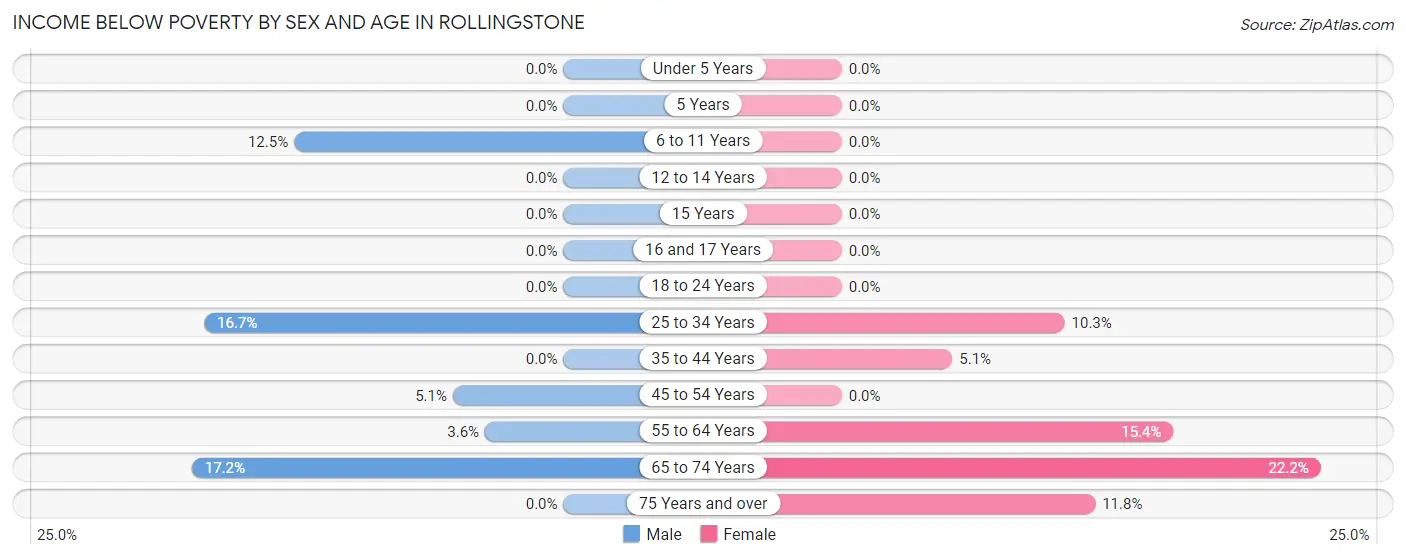
| Age Bracket | Male | Female |
| Under 5 Years | 0 (0.0%) | 0 (0.0%) |
| 5 Years | 0 (0.0%) | 0 (0.0%) |
| 6 to 11 Years | 3 (12.5%) | 0 (0.0%) |
| 12 to 14 Years | 0 (0.0%) | 0 (0.0%) |
| 15 Years | 0 (0.0%) | 0 (0.0%) |
| 16 and 17 Years | 0 (0.0%) | 0 (0.0%) |
| 18 to 24 Years | 0 (0.0%) | 0 (0.0%) |
| 25 to 34 Years | 3 (16.7%) | 3 (10.3%) |
| 35 to 44 Years | 0 (0.0%) | 2 (5.1%) |
| 45 to 54 Years | 2 (5.1%) | 0 (0.0%) |
| 55 to 64 Years | 2 (3.6%) | 6 (15.4%) |
| 65 to 74 Years | 5 (17.2%) | 10 (22.2%) |
| 75 Years and over | 0 (0.0%) | 2 (11.8%) |
| Total | 15 (5.1%) | 23 (7.6%) |
Income Above Poverty by Sex and Age in Rollingstone
According to the poverty statistics in Rollingstone, males aged under 5 years and females aged under 5 years are the age groups that are most secure financially, with 100.0% of males and 100.0% of females in these age groups living above the poverty line.
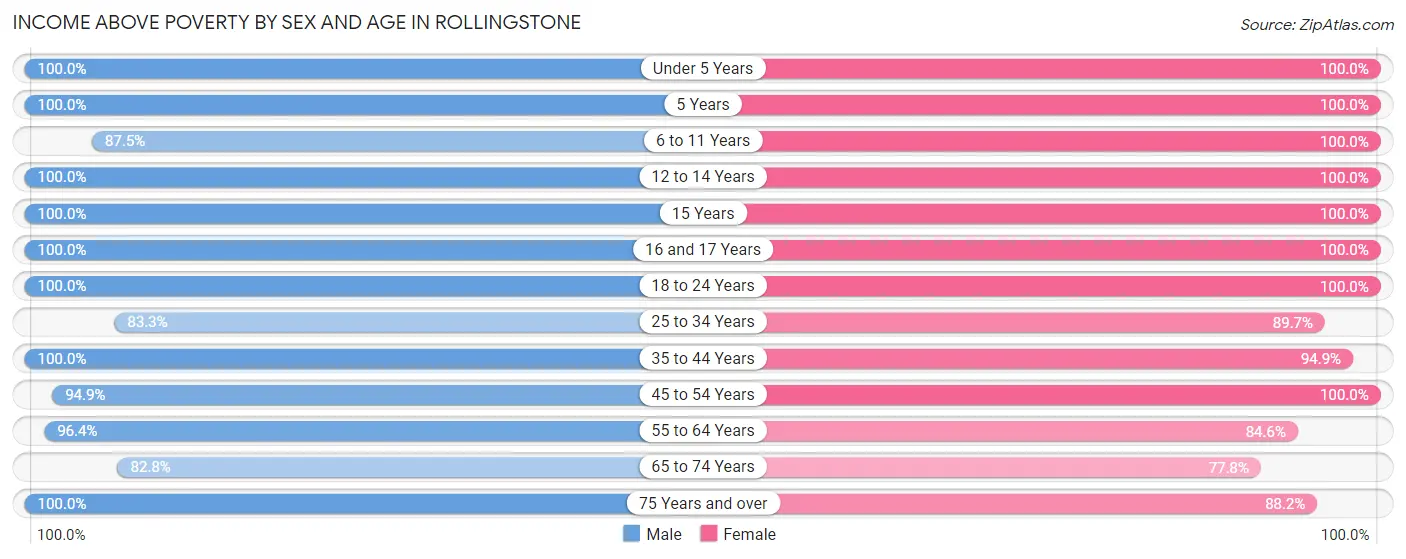
| Age Bracket | Male | Female |
| Under 5 Years | 10 (100.0%) | 29 (100.0%) |
| 5 Years | 2 (100.0%) | 6 (100.0%) |
| 6 to 11 Years | 21 (87.5%) | 21 (100.0%) |
| 12 to 14 Years | 31 (100.0%) | 11 (100.0%) |
| 15 Years | 4 (100.0%) | 1 (100.0%) |
| 16 and 17 Years | 17 (100.0%) | 9 (100.0%) |
| 18 to 24 Years | 15 (100.0%) | 9 (100.0%) |
| 25 to 34 Years | 15 (83.3%) | 26 (89.7%) |
| 35 to 44 Years | 34 (100.0%) | 37 (94.9%) |
| 45 to 54 Years | 37 (94.9%) | 49 (100.0%) |
| 55 to 64 Years | 53 (96.4%) | 33 (84.6%) |
| 65 to 74 Years | 24 (82.8%) | 35 (77.8%) |
| 75 Years and over | 13 (100.0%) | 15 (88.2%) |
| Total | 276 (94.9%) | 281 (92.4%) |
Income Below Poverty Among Married-Couple Families in Rollingstone
The poverty statistics for married-couple families in Rollingstone show that 4.1% or 6 of the total 147 families live below the poverty line. Families with no children have the highest poverty rate of 7.3%, comprising of 6 families. On the other hand, families with 1 or 2 children have the lowest poverty rate of 0.0%, which includes 0 families.
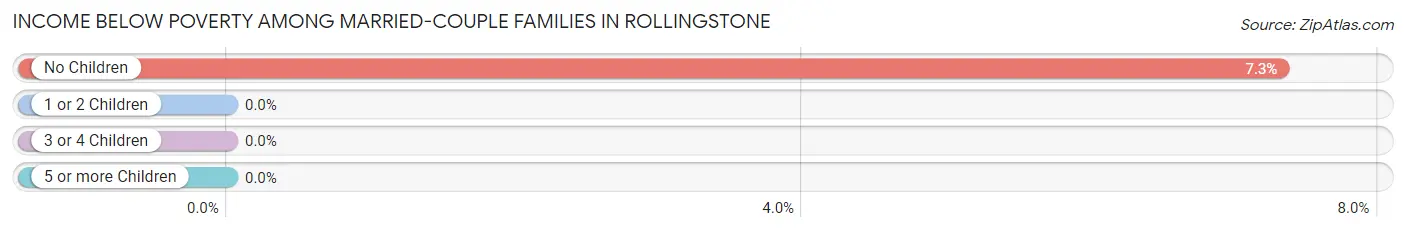
| Children | Above Poverty | Below Poverty |
| No Children | 76 (92.7%) | 6 (7.3%) |
| 1 or 2 Children | 43 (100.0%) | 0 (0.0%) |
| 3 or 4 Children | 20 (100.0%) | 0 (0.0%) |
| 5 or more Children | 2 (100.0%) | 0 (0.0%) |
| Total | 141 (95.9%) | 6 (4.1%) |
Income Below Poverty Among Single-Parent Households in Rollingstone
According to the poverty data in Rollingstone, 13.3% or 2 single-father households and 20.0% or 2 single-mother households are living below the poverty line. Among single-father households, those with no children have the highest poverty rate, with 2 households (25.0%) experiencing poverty. Likewise, among single-mother households, those with 1 or 2 children have the highest poverty rate, with 2 households (28.6%) falling below the poverty line.
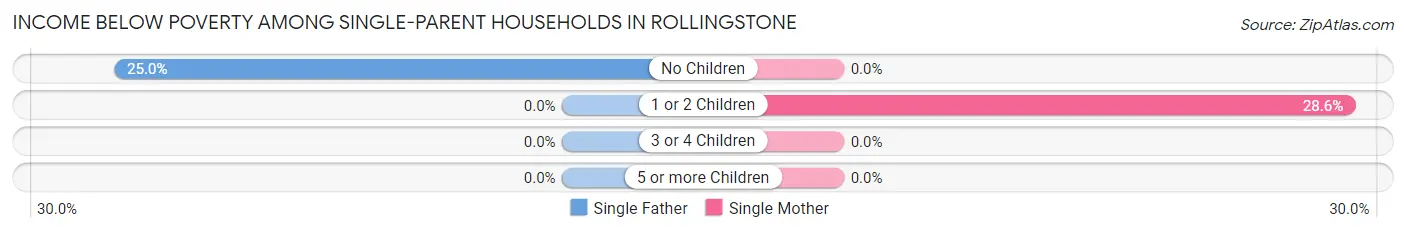
| Children | Single Father | Single Mother |
| No Children | 2 (25.0%) | 0 (0.0%) |
| 1 or 2 Children | 0 (0.0%) | 2 (28.6%) |
| 3 or 4 Children | 0 (0.0%) | 0 (0.0%) |
| 5 or more Children | 0 (0.0%) | 0 (0.0%) |
| Total | 2 (13.3%) | 2 (20.0%) |
Income Below Poverty Among Married-Couple vs Single-Parent Households in Rollingstone
The poverty data for Rollingstone shows that 6 of the married-couple family households (4.1%) and 4 of the single-parent households (16.0%) are living below the poverty level. Within the married-couple family households, those with no children have the highest poverty rate, with 6 households (7.3%) falling below the poverty line. Among the single-parent households, those with no children have the highest poverty rate, with 2 household (18.2%) living below poverty.
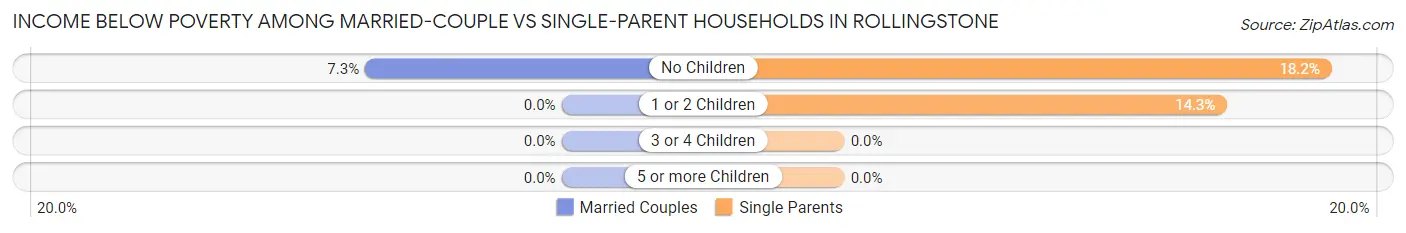
| Children | Married-Couple Families | Single-Parent Households |
| No Children | 6 (7.3%) | 2 (18.2%) |
| 1 or 2 Children | 0 (0.0%) | 2 (14.3%) |
| 3 or 4 Children | 0 (0.0%) | 0 (0.0%) |
| 5 or more Children | 0 (0.0%) | 0 (0.0%) |
| Total | 6 (4.1%) | 4 (16.0%) |
Race in Rollingstone
The most populous races in Rollingstone are White / Caucasian (574 | 95.5%), Two or more Races (23 | 3.8%), and Asian (3 | 0.5%).
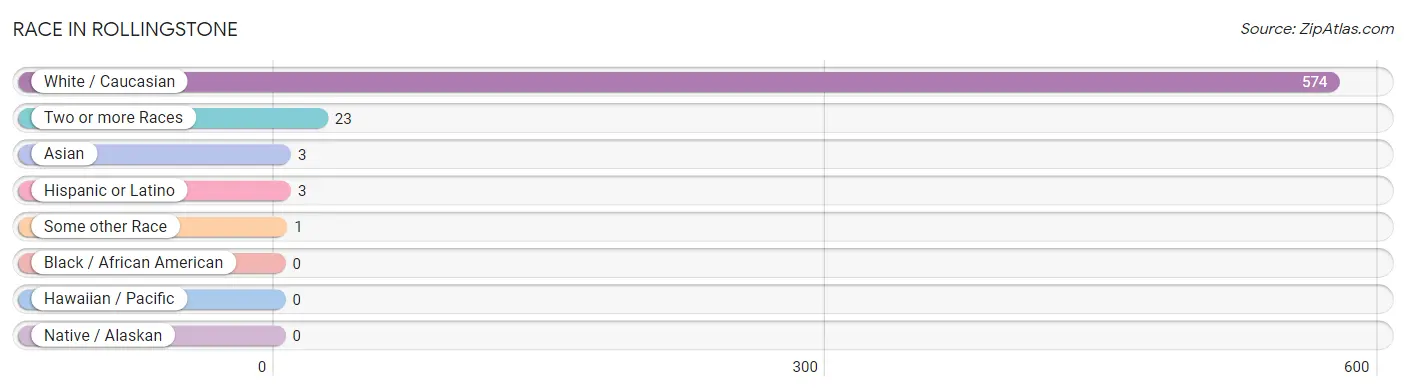
| Race | # Population | % Population |
| Asian | 3 | 0.5% |
| Black / African American | 0 | 0.0% |
| Hawaiian / Pacific | 0 | 0.0% |
| Hispanic or Latino | 3 | 0.5% |
| Native / Alaskan | 0 | 0.0% |
| White / Caucasian | 574 | 95.5% |
| Two or more Races | 23 | 3.8% |
| Some other Race | 1 | 0.2% |
| Total | 601 | 100.0% |
Ancestry in Rollingstone
The most populous ancestries reported in Rollingstone are German (283 | 47.1%), Norwegian (102 | 17.0%), American (73 | 12.1%), Polish (51 | 8.5%), and French (46 | 7.6%), together accounting for 92.3% of all Rollingstone residents.
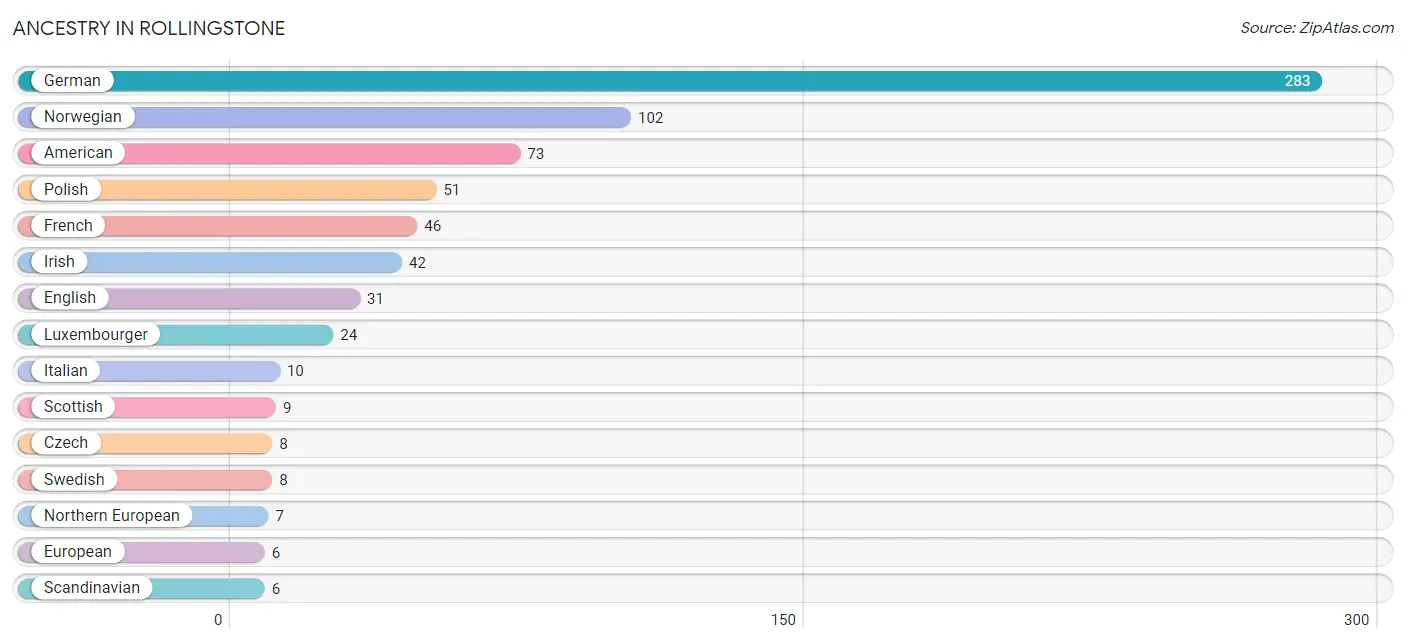
| Ancestry | # Population | % Population |
| American | 73 | 12.1% |
| Czech | 8 | 1.3% |
| Czechoslovakian | 5 | 0.8% |
| Danish | 1 | 0.2% |
| English | 31 | 5.2% |
| European | 6 | 1.0% |
| French | 46 | 7.6% |
| German | 283 | 47.1% |
| Irish | 42 | 7.0% |
| Italian | 10 | 1.7% |
| Korean | 5 | 0.8% |
| Luxembourger | 24 | 4.0% |
| Mexican | 3 | 0.5% |
| Northern European | 7 | 1.2% |
| Norwegian | 102 | 17.0% |
| Polish | 51 | 8.5% |
| Russian | 1 | 0.2% |
| Scandinavian | 6 | 1.0% |
| Scotch-Irish | 4 | 0.7% |
| Scottish | 9 | 1.5% |
| Swedish | 8 | 1.3% |
| Swiss | 2 | 0.3% | View All 22 Rows |
Immigrants in Rollingstone
The most numerous immigrant groups reported in Rollingstone came from Europe (4 | 0.7%), Western Europe (4 | 0.7%), France (3 | 0.5%), Central America (1 | 0.2%), and Germany (1 | 0.2%), together accounting for 2.2% of all Rollingstone residents.
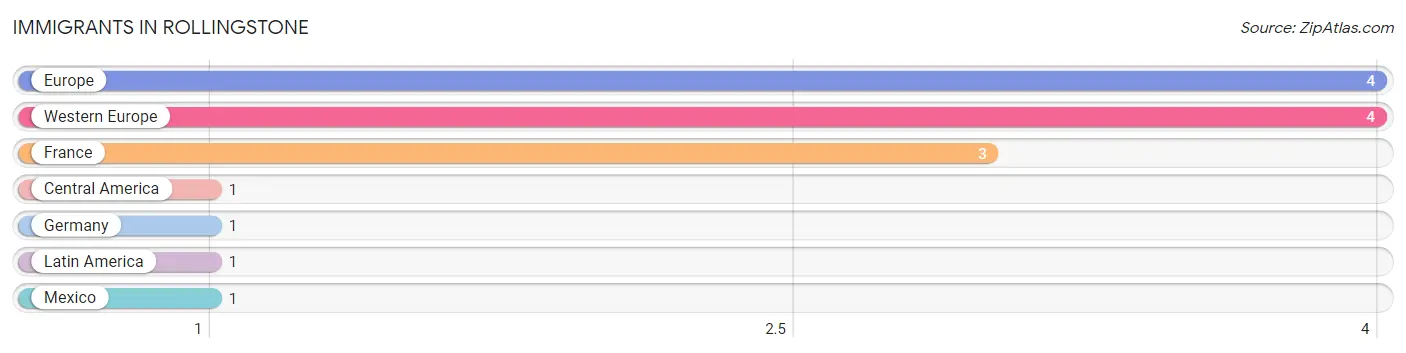
| Immigration Origin | # Population | % Population |
| Central America | 1 | 0.2% |
| Europe | 4 | 0.7% |
| France | 3 | 0.5% |
| Germany | 1 | 0.2% |
| Latin America | 1 | 0.2% |
| Mexico | 1 | 0.2% |
| Western Europe | 4 | 0.7% | View All 7 Rows |
Sex and Age in Rollingstone
Sex and Age in Rollingstone
The most populous age groups in Rollingstone are 10 to 14 Years (38 | 12.9%) for men and 50 to 54 Years (38 | 12.4%) for women.
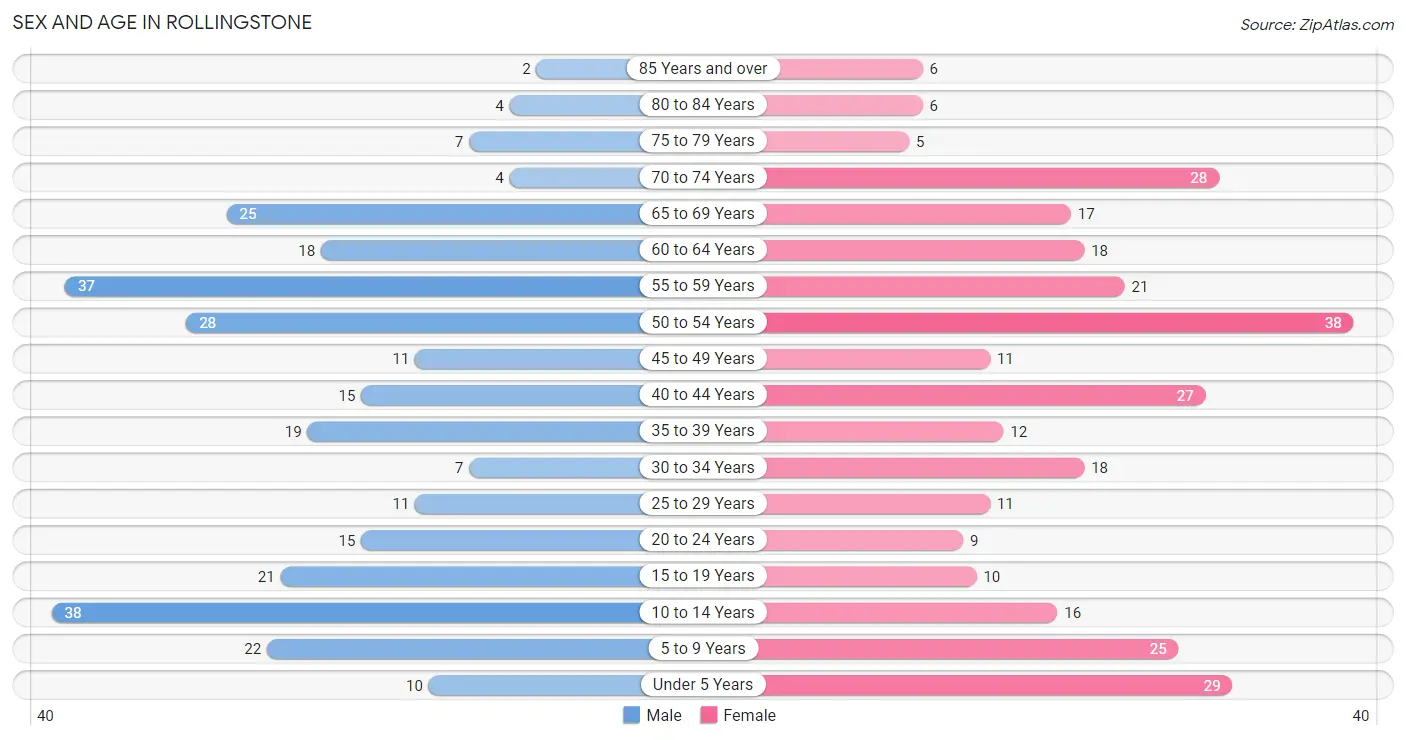
| Age Bracket | Male | Female |
| Under 5 Years | 10 (3.4%) | 29 (9.5%) |
| 5 to 9 Years | 22 (7.5%) | 25 (8.1%) |
| 10 to 14 Years | 38 (12.9%) | 16 (5.2%) |
| 15 to 19 Years | 21 (7.1%) | 10 (3.3%) |
| 20 to 24 Years | 15 (5.1%) | 9 (2.9%) |
| 25 to 29 Years | 11 (3.7%) | 11 (3.6%) |
| 30 to 34 Years | 7 (2.4%) | 18 (5.9%) |
| 35 to 39 Years | 19 (6.5%) | 12 (3.9%) |
| 40 to 44 Years | 15 (5.1%) | 27 (8.8%) |
| 45 to 49 Years | 11 (3.7%) | 11 (3.6%) |
| 50 to 54 Years | 28 (9.5%) | 38 (12.4%) |
| 55 to 59 Years | 37 (12.6%) | 21 (6.8%) |
| 60 to 64 Years | 18 (6.1%) | 18 (5.9%) |
| 65 to 69 Years | 25 (8.5%) | 17 (5.5%) |
| 70 to 74 Years | 4 (1.4%) | 28 (9.1%) |
| 75 to 79 Years | 7 (2.4%) | 5 (1.6%) |
| 80 to 84 Years | 4 (1.4%) | 6 (1.9%) |
| 85 Years and over | 2 (0.7%) | 6 (1.9%) |
| Total | 294 (100.0%) | 307 (100.0%) |
Families and Households in Rollingstone
Median Family Size in Rollingstone
The median family size in Rollingstone is 3.03 persons per family, with married-couple families (147 | 85.5%) accounting for the largest median family size of 3.09 persons per family. On the other hand, single male/father families (15 | 8.7%) represent the smallest median family size with 2.47 persons per family.
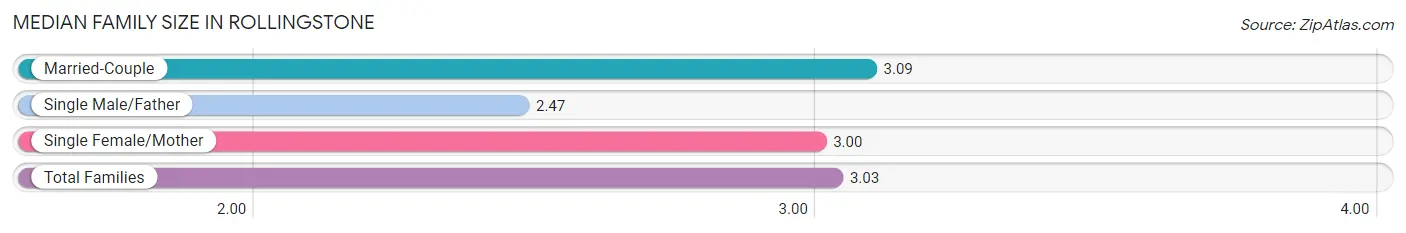
| Family Type | # Families | Family Size |
| Married-Couple | 147 (85.5%) | 3.09 |
| Single Male/Father | 15 (8.7%) | 2.47 |
| Single Female/Mother | 10 (5.8%) | 3.00 |
| Total Families | 172 (100.0%) | 3.03 |
Median Household Size in Rollingstone
The median household size in Rollingstone is 2.66 persons per household, with single female/mother households (10 | 4.4%) accounting for the largest median household size of 3.3 persons per household. non-family households (54 | 23.9%) represent the smallest median household size with 1.31 persons per household.
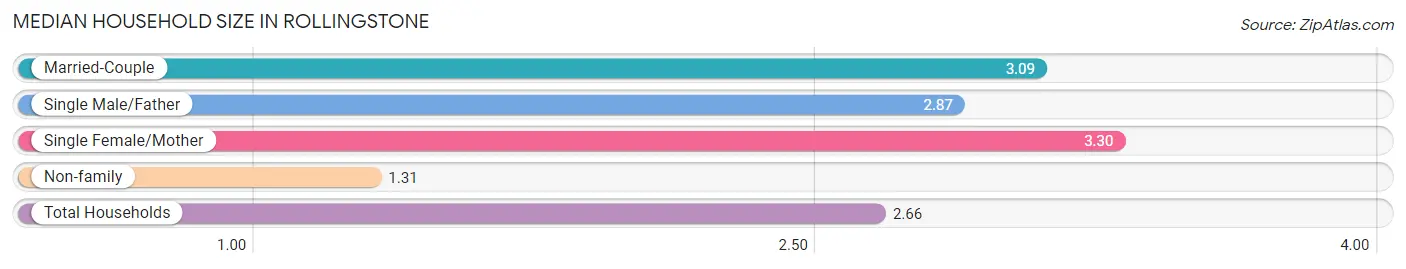
| Household Type | # Households | Household Size |
| Married-Couple | 147 (65.0%) | 3.09 |
| Single Male/Father | 15 (6.6%) | 2.87 |
| Single Female/Mother | 10 (4.4%) | 3.30 |
| Non-family | 54 (23.9%) | 1.31 |
| Total Households | 226 (100.0%) | 2.66 |
Household Size by Marriage Status in Rollingstone
Out of a total of 226 households in Rollingstone, 172 (76.1%) are family households, while 54 (23.9%) are nonfamily households. The most numerous type of family households are 2-person households, comprising 86, and the most common type of nonfamily households are 1-person households, comprising 46.
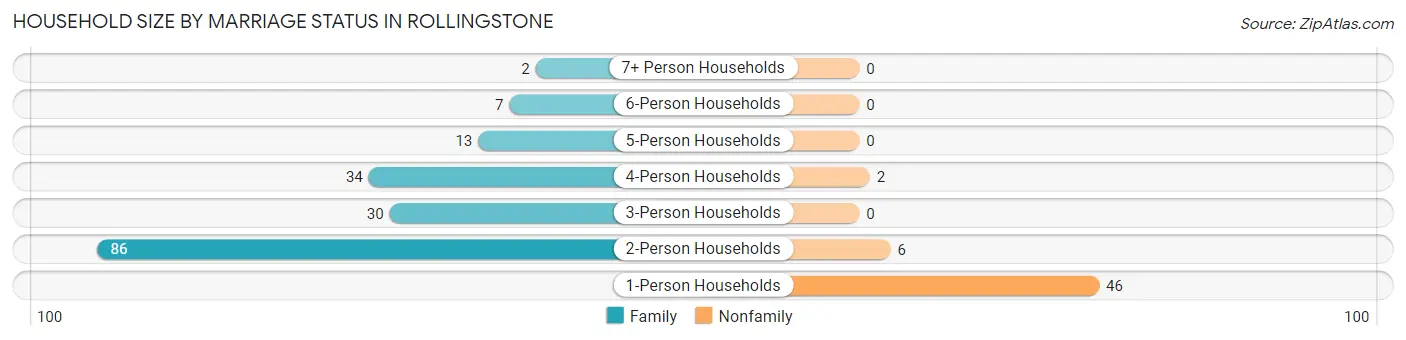
| Household Size | Family Households | Nonfamily Households |
| 1-Person Households | - | 46 (20.3%) |
| 2-Person Households | 86 (38.1%) | 6 (2.6%) |
| 3-Person Households | 30 (13.3%) | 0 (0.0%) |
| 4-Person Households | 34 (15.0%) | 2 (0.9%) |
| 5-Person Households | 13 (5.8%) | 0 (0.0%) |
| 6-Person Households | 7 (3.1%) | 0 (0.0%) |
| 7+ Person Households | 2 (0.9%) | 0 (0.0%) |
| Total | 172 (76.1%) | 54 (23.9%) |
Female Fertility in Rollingstone
Fertility by Age in Rollingstone
Average fertility rate in Rollingstone is 40.0 births per 1,000 women. Women in the age bracket of 20 to 34 years have the highest fertility rate with 105.0 births per 1,000 women. Women in the age bracket of 20 to 34 years acount for 100.0% of all women with births.
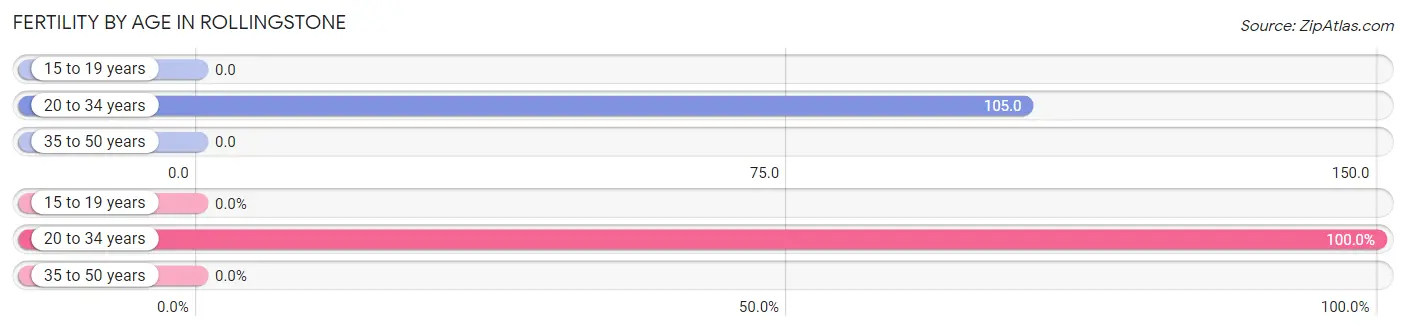
| Age Bracket | Women with Births | Births / 1,000 Women |
| 15 to 19 years | 0 (0.0%) | 0.0 |
| 20 to 34 years | 4 (100.0%) | 105.0 |
| 35 to 50 years | 0 (0.0%) | 0.0 |
| Total | 4 (100.0%) | 40.0 |
Fertility by Age by Marriage Status in Rollingstone
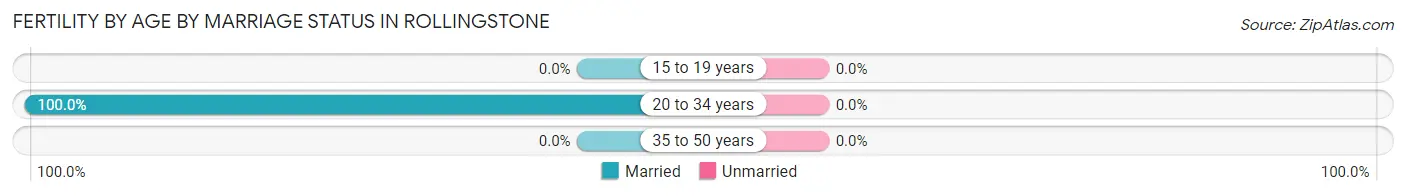
| Age Bracket | Married | Unmarried |
| 15 to 19 years | 0 (0.0%) | 0 (0.0%) |
| 20 to 34 years | 4 (100.0%) | 0 (0.0%) |
| 35 to 50 years | 0 (0.0%) | 0 (0.0%) |
| Total | 4 (100.0%) | 0 (0.0%) |
Fertility by Education in Rollingstone
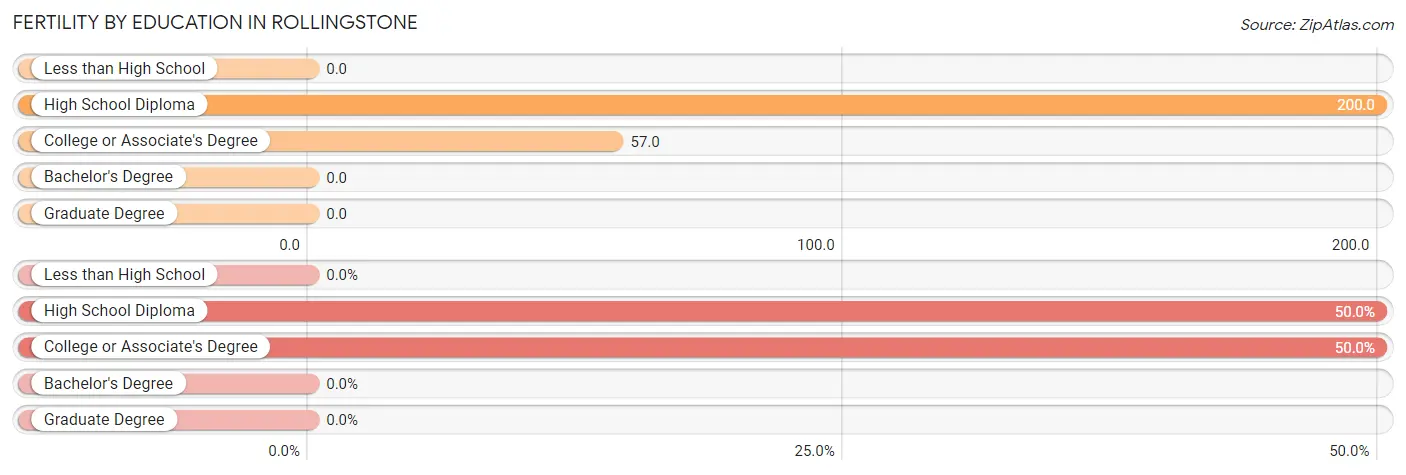
| Educational Attainment | Women with Births | Births / 1,000 Women |
| Less than High School | 0 (0.0%) | 0.0 |
| High School Diploma | 2 (50.0%) | 200.0 |
| College or Associate's Degree | 2 (50.0%) | 57.0 |
| Bachelor's Degree | 0 (0.0%) | 0.0 |
| Graduate Degree | 0 (0.0%) | 0.0 |
| Total | 4 (100.0%) | 40.0 |
Fertility by Education by Marriage Status in Rollingstone
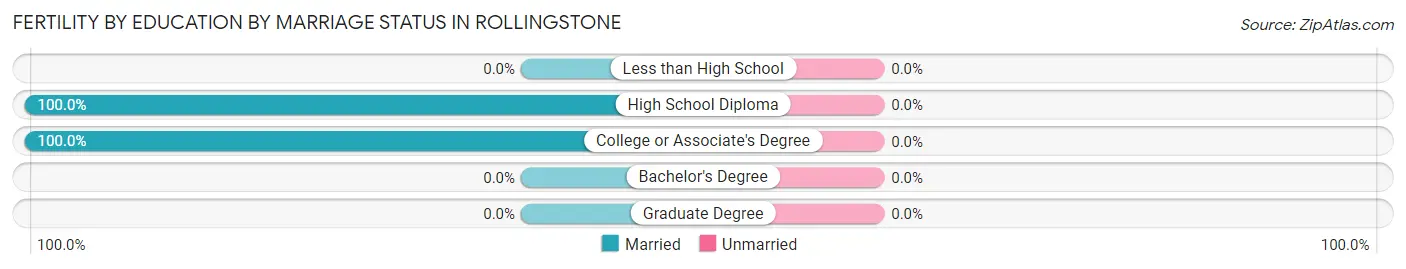
| Educational Attainment | Married | Unmarried |
| Less than High School | 0 (0.0%) | 0 (0.0%) |
| High School Diploma | 2 (100.0%) | 0 (0.0%) |
| College or Associate's Degree | 2 (100.0%) | 0 (0.0%) |
| Bachelor's Degree | 0 (0.0%) | 0 (0.0%) |
| Graduate Degree | 0 (0.0%) | 0 (0.0%) |
| Total | 4 (100.0%) | 0 (0.0%) |
Employment Characteristics in Rollingstone
Employment by Class of Employer in Rollingstone
Among the 293 employed individuals in Rollingstone, private company employees (186 | 63.5%), not-for-profit organizations (45 | 15.4%), and local government employees (20 | 6.8%) make up the most common classes of employment.
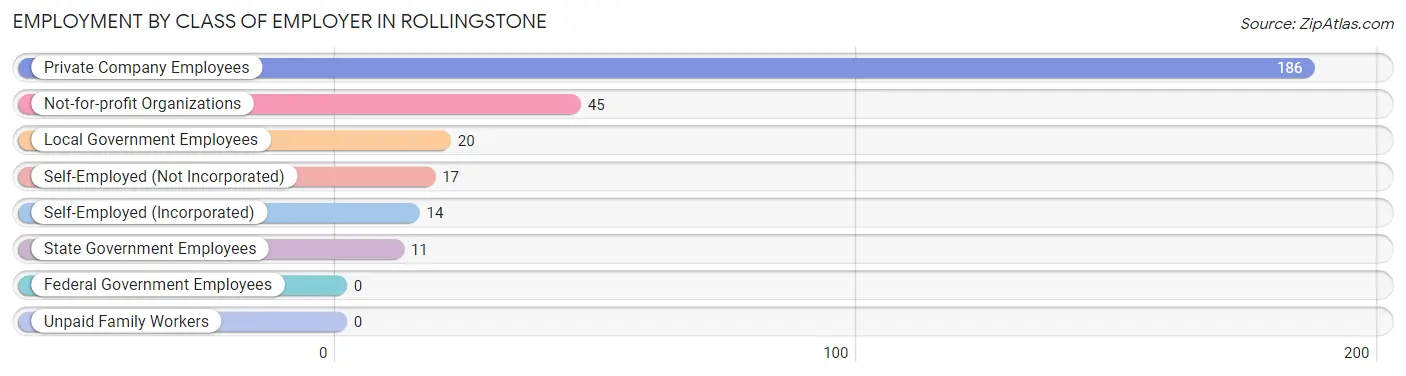
| Employer Class | # Employees | % Employees |
| Private Company Employees | 186 | 63.5% |
| Self-Employed (Incorporated) | 14 | 4.8% |
| Self-Employed (Not Incorporated) | 17 | 5.8% |
| Not-for-profit Organizations | 45 | 15.4% |
| Local Government Employees | 20 | 6.8% |
| State Government Employees | 11 | 3.7% |
| Federal Government Employees | 0 | 0.0% |
| Unpaid Family Workers | 0 | 0.0% |
| Total | 293 | 100.0% |
Employment Status by Age in Rollingstone
According to the labor force statistics for Rollingstone, out of the total population over 16 years of age (456), 66.7% or 304 individuals are in the labor force, with 1.6% or 5 of them unemployed. The age group with the highest labor force participation rate is 30 to 34 years, with 100.0% or 25 individuals in the labor force. Within the labor force, the 20 to 24 years age range has the highest percentage of unemployed individuals, with 20.0% or 4 of them being unemployed.
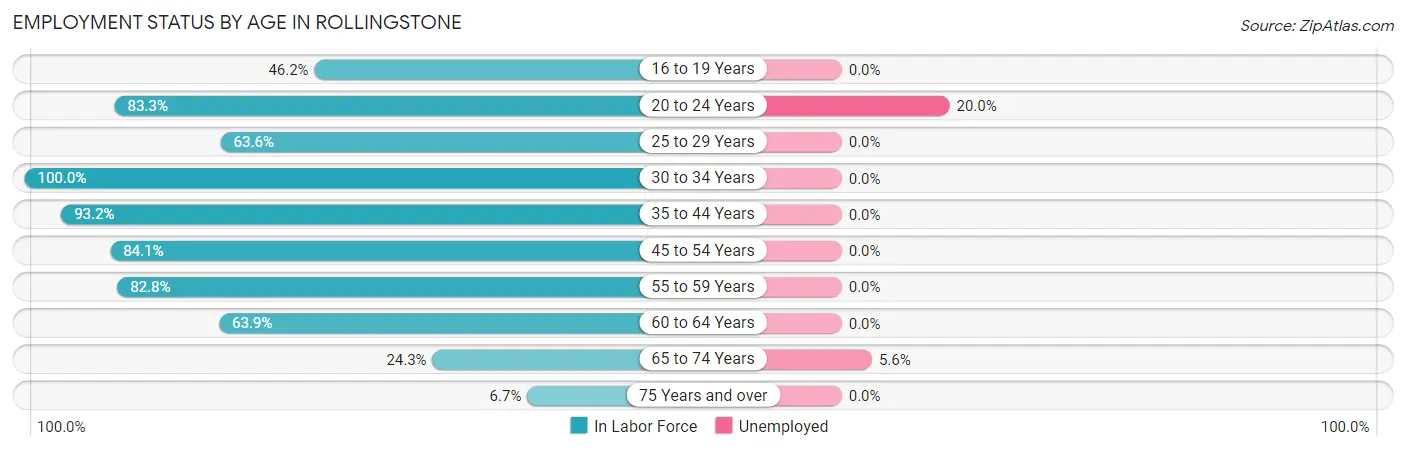
| Age Bracket | In Labor Force | Unemployed |
| 16 to 19 Years | 12 (46.2%) | 0 (0.0%) |
| 20 to 24 Years | 20 (83.3%) | 4 (20.0%) |
| 25 to 29 Years | 14 (63.6%) | 0 (0.0%) |
| 30 to 34 Years | 25 (100.0%) | 0 (0.0%) |
| 35 to 44 Years | 68 (93.2%) | 0 (0.0%) |
| 45 to 54 Years | 74 (84.1%) | 0 (0.0%) |
| 55 to 59 Years | 48 (82.8%) | 0 (0.0%) |
| 60 to 64 Years | 23 (63.9%) | 0 (0.0%) |
| 65 to 74 Years | 18 (24.3%) | 1 (5.6%) |
| 75 Years and over | 2 (6.7%) | 0 (0.0%) |
| Total | 304 (66.7%) | 5 (1.6%) |
Employment Status by Educational Attainment in Rollingstone
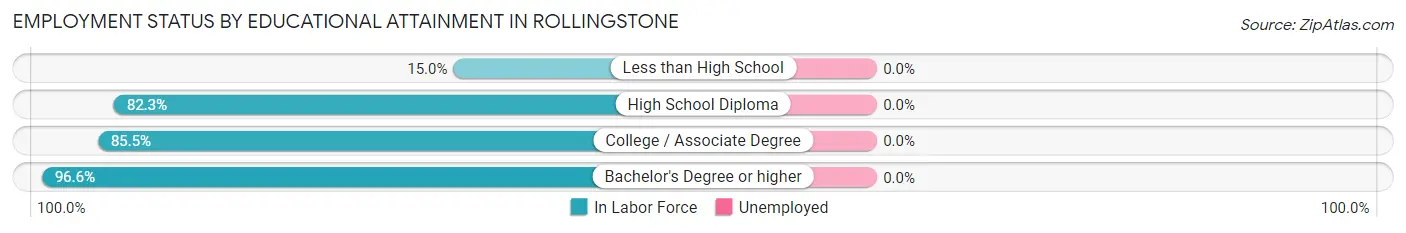
| Educational Attainment | In Labor Force | Unemployed |
| Less than High School | 3 (15.0%) | 0 (0.0%) |
| High School Diploma | 51 (82.3%) | 0 (0.0%) |
| College / Associate Degree | 112 (85.5%) | 0 (0.0%) |
| Bachelor's Degree or higher | 86 (96.6%) | 0 (0.0%) |
| Total | 252 (83.4%) | 0 (0.0%) |
Employment Occupations by Sex in Rollingstone
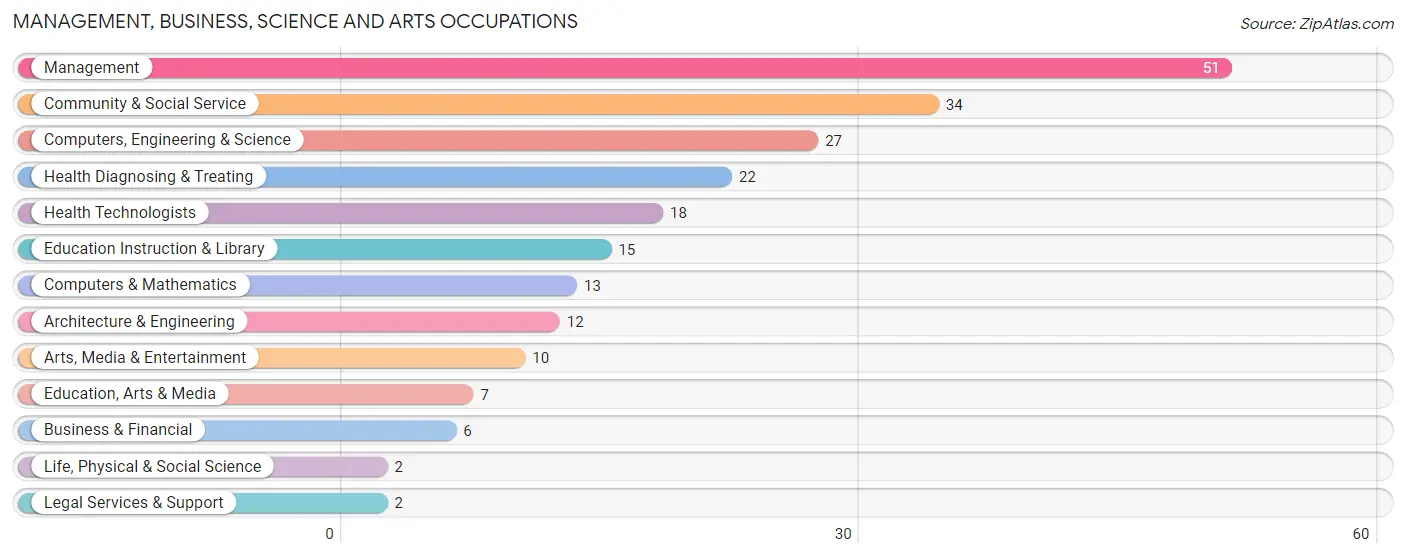
Management, Business, Science and Arts Occupations
The most common Management, Business, Science and Arts occupations in Rollingstone are Management (51 | 17.1%), Community & Social Service (34 | 11.4%), Computers, Engineering & Science (27 | 9.0%), Health Diagnosing & Treating (22 | 7.4%), and Health Technologists (18 | 6.0%).
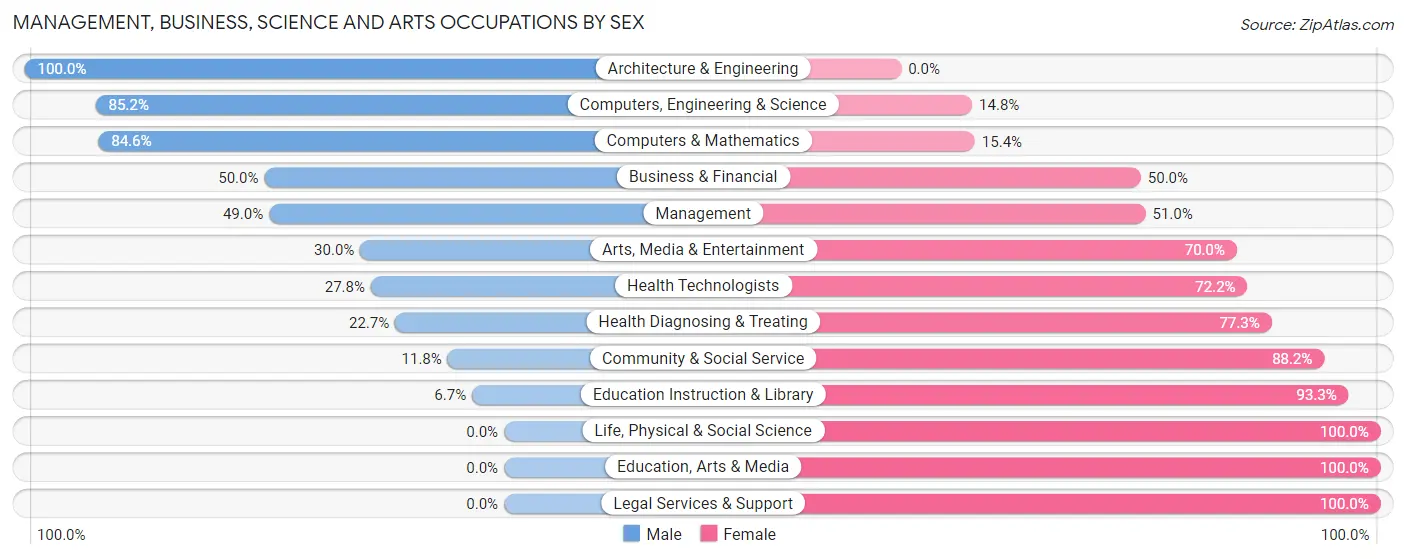
Management, Business, Science and Arts Occupations by Sex
Within the Management, Business, Science and Arts occupations in Rollingstone, the most male-oriented occupations are Architecture & Engineering (100.0%), Computers, Engineering & Science (85.2%), and Computers & Mathematics (84.6%), while the most female-oriented occupations are Life, Physical & Social Science (100.0%), Education, Arts & Media (100.0%), and Legal Services & Support (100.0%).
| Occupation | Male | Female |
| Management | 25 (49.0%) | 26 (51.0%) |
| Business & Financial | 3 (50.0%) | 3 (50.0%) |
| Computers, Engineering & Science | 23 (85.2%) | 4 (14.8%) |
| Computers & Mathematics | 11 (84.6%) | 2 (15.4%) |
| Architecture & Engineering | 12 (100.0%) | 0 (0.0%) |
| Life, Physical & Social Science | 0 (0.0%) | 2 (100.0%) |
| Community & Social Service | 4 (11.8%) | 30 (88.2%) |
| Education, Arts & Media | 0 (0.0%) | 7 (100.0%) |
| Legal Services & Support | 0 (0.0%) | 2 (100.0%) |
| Education Instruction & Library | 1 (6.7%) | 14 (93.3%) |
| Arts, Media & Entertainment | 3 (30.0%) | 7 (70.0%) |
| Health Diagnosing & Treating | 5 (22.7%) | 17 (77.3%) |
| Health Technologists | 5 (27.8%) | 13 (72.2%) |
| Total (Category) | 60 (42.9%) | 80 (57.1%) |
| Total (Overall) | 148 (49.5%) | 151 (50.5%) |
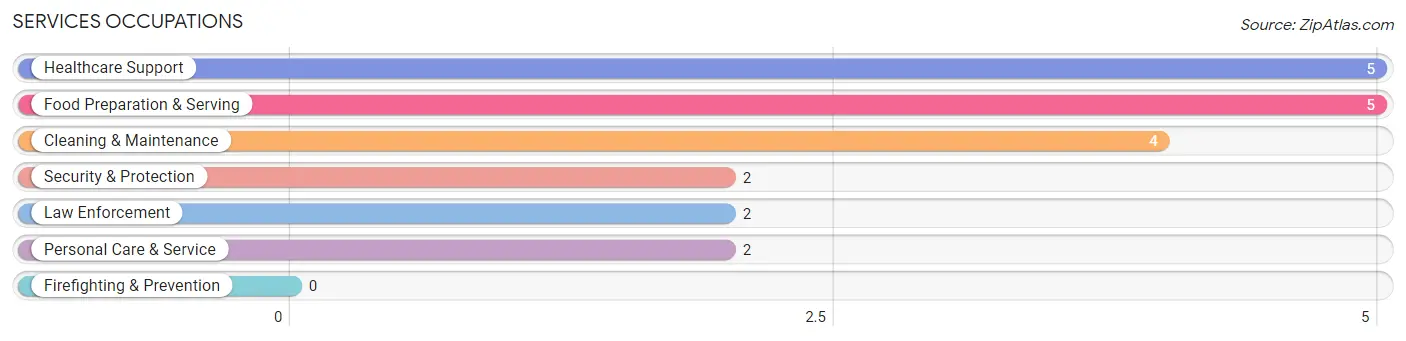
Services Occupations
The most common Services occupations in Rollingstone are Healthcare Support (5 | 1.7%), Food Preparation & Serving (5 | 1.7%), Cleaning & Maintenance (4 | 1.3%), Security & Protection (2 | 0.7%), and Law Enforcement (2 | 0.7%).
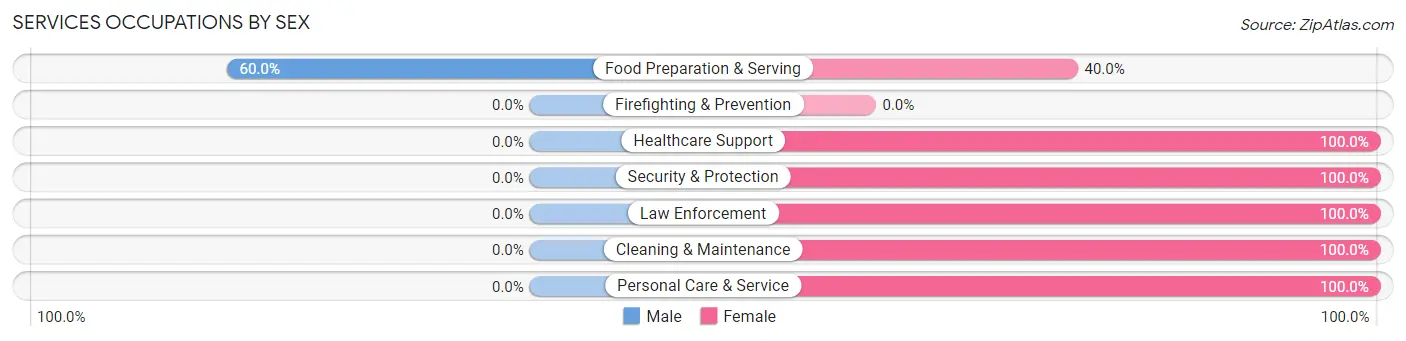
Services Occupations by Sex
| Occupation | Male | Female |
| Healthcare Support | 0 (0.0%) | 5 (100.0%) |
| Security & Protection | 0 (0.0%) | 2 (100.0%) |
| Firefighting & Prevention | 0 (0.0%) | 0 (0.0%) |
| Law Enforcement | 0 (0.0%) | 2 (100.0%) |
| Food Preparation & Serving | 3 (60.0%) | 2 (40.0%) |
| Cleaning & Maintenance | 0 (0.0%) | 4 (100.0%) |
| Personal Care & Service | 0 (0.0%) | 2 (100.0%) |
| Total (Category) | 3 (16.7%) | 15 (83.3%) |
| Total (Overall) | 148 (49.5%) | 151 (50.5%) |
Sales and Office Occupations
The most common Sales and Office occupations in Rollingstone are Office & Administration (48 | 16.1%), and Sales & Related (24 | 8.0%).
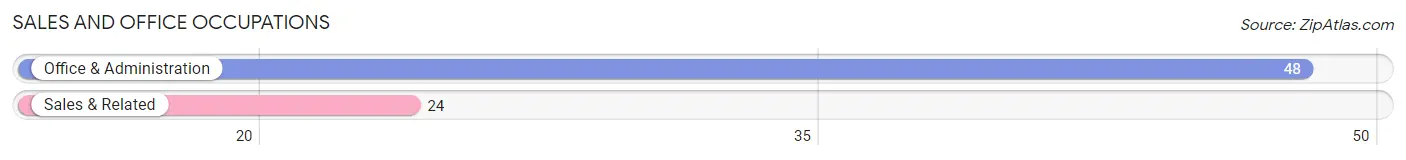
Sales and Office Occupations by Sex
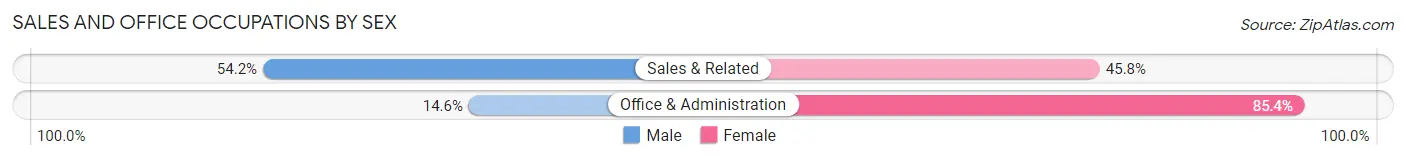
| Occupation | Male | Female |
| Sales & Related | 13 (54.2%) | 11 (45.8%) |
| Office & Administration | 7 (14.6%) | 41 (85.4%) |
| Total (Category) | 20 (27.8%) | 52 (72.2%) |
| Total (Overall) | 148 (49.5%) | 151 (50.5%) |
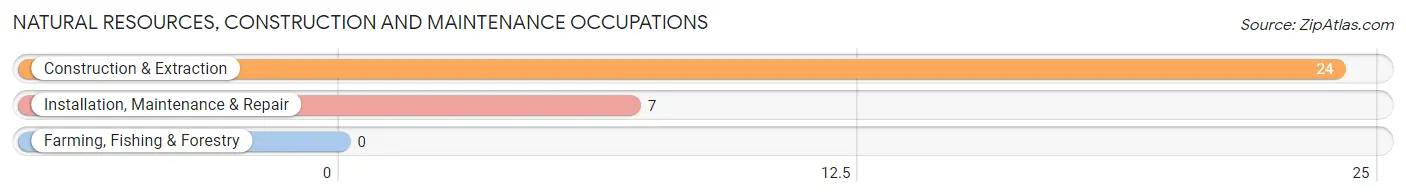
Natural Resources, Construction and Maintenance Occupations
The most common Natural Resources, Construction and Maintenance occupations in Rollingstone are Construction & Extraction (24 | 8.0%), and Installation, Maintenance & Repair (7 | 2.3%).
Natural Resources, Construction and Maintenance Occupations by Sex
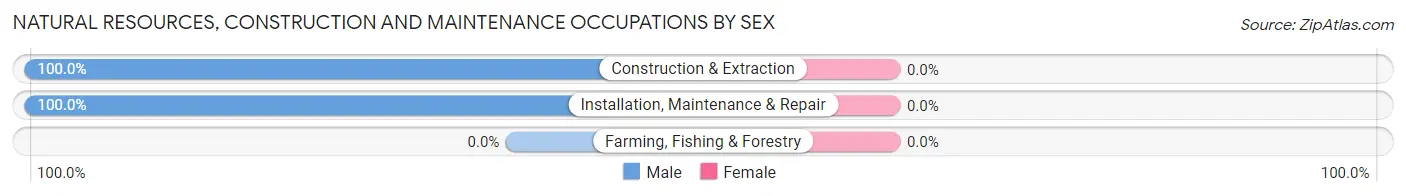
| Occupation | Male | Female |
| Farming, Fishing & Forestry | 0 (0.0%) | 0 (0.0%) |
| Construction & Extraction | 24 (100.0%) | 0 (0.0%) |
| Installation, Maintenance & Repair | 7 (100.0%) | 0 (0.0%) |
| Total (Category) | 31 (100.0%) | 0 (0.0%) |
| Total (Overall) | 148 (49.5%) | 151 (50.5%) |
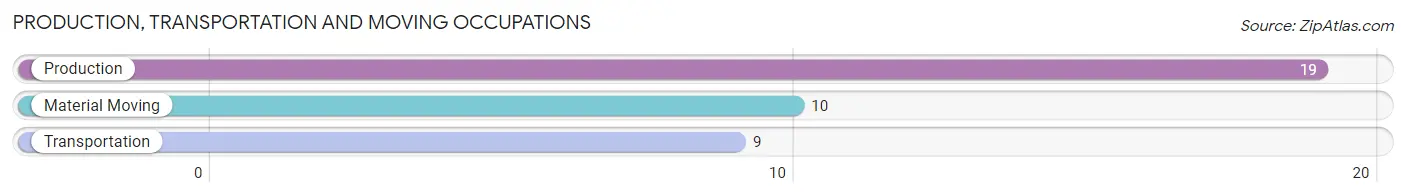
Production, Transportation and Moving Occupations
The most common Production, Transportation and Moving occupations in Rollingstone are Production (19 | 6.4%), Material Moving (10 | 3.3%), and Transportation (9 | 3.0%).
Production, Transportation and Moving Occupations by Sex
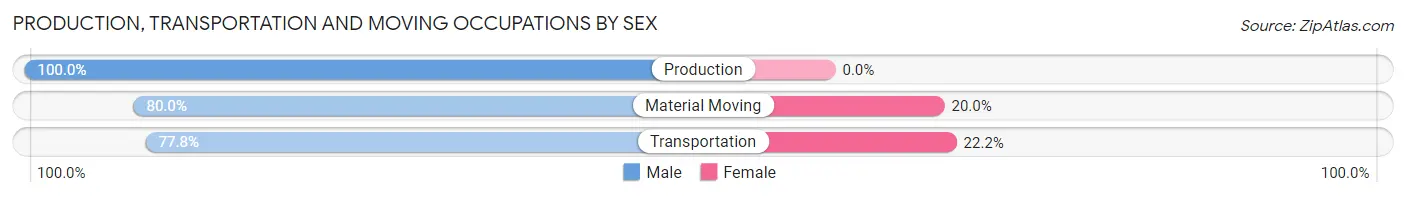
| Occupation | Male | Female |
| Production | 19 (100.0%) | 0 (0.0%) |
| Transportation | 7 (77.8%) | 2 (22.2%) |
| Material Moving | 8 (80.0%) | 2 (20.0%) |
| Total (Category) | 34 (89.5%) | 4 (10.5%) |
| Total (Overall) | 148 (49.5%) | 151 (50.5%) |
Employment Industries by Sex in Rollingstone
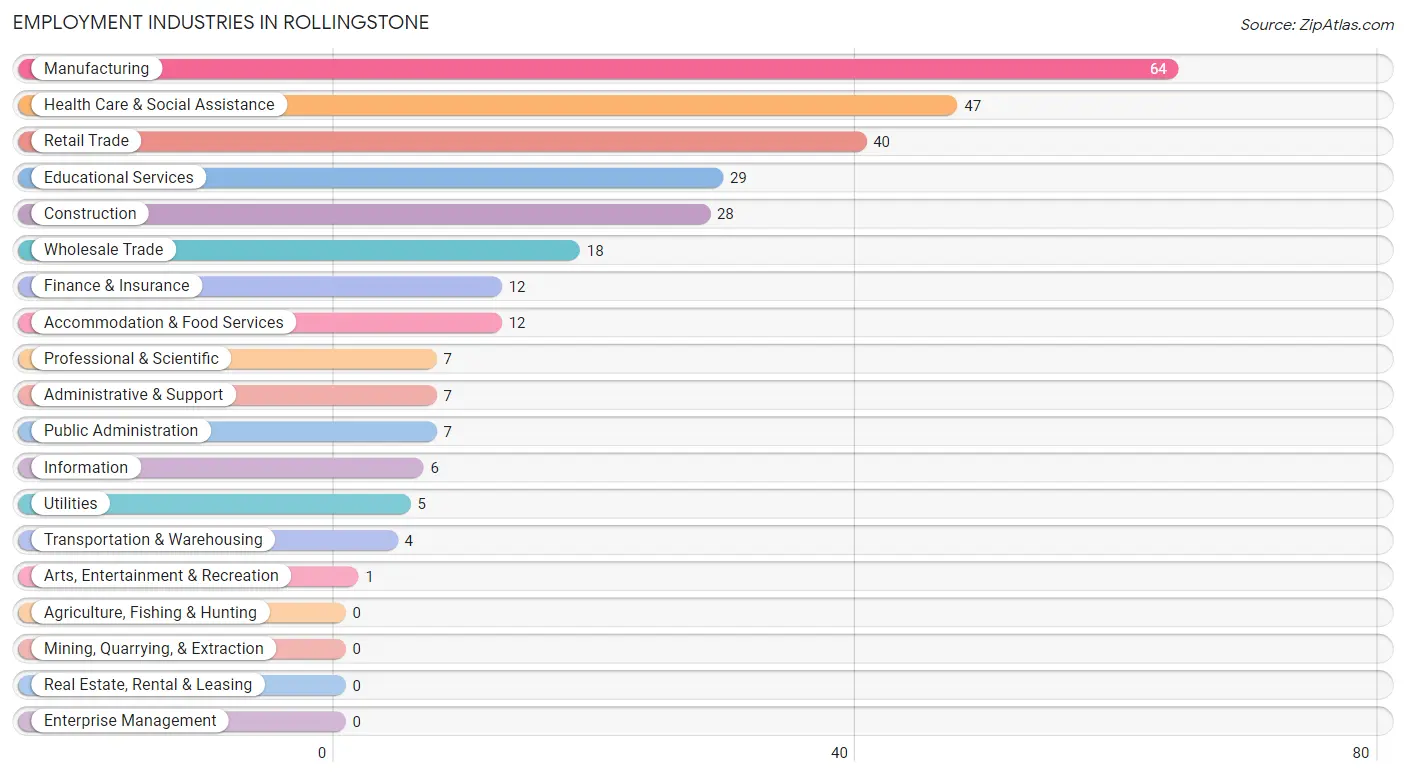
Employment Industries in Rollingstone
The major employment industries in Rollingstone include Manufacturing (64 | 21.4%), Health Care & Social Assistance (47 | 15.7%), Retail Trade (40 | 13.4%), Educational Services (29 | 9.7%), and Construction (28 | 9.4%).
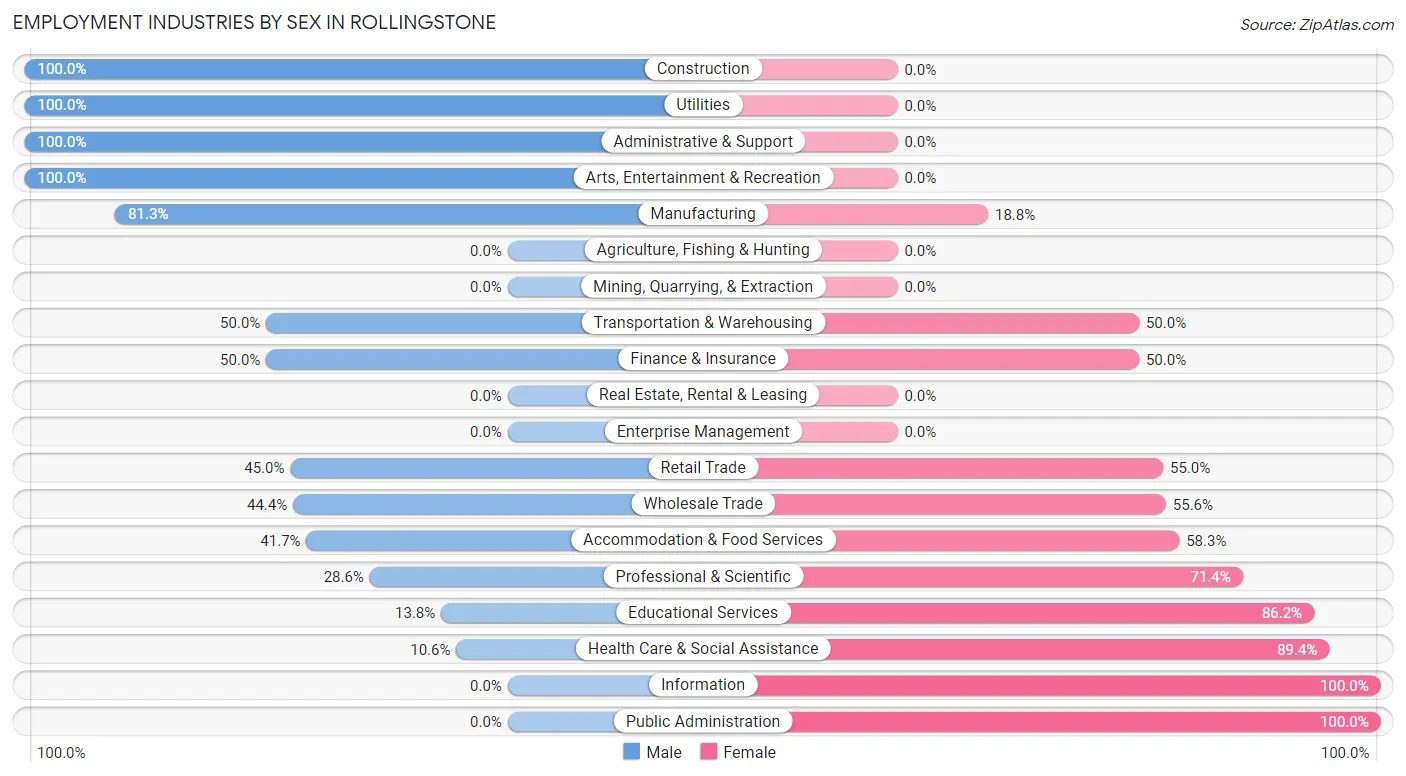
Employment Industries by Sex in Rollingstone
The Rollingstone industries that see more men than women are Construction (100.0%), Utilities (100.0%), and Administrative & Support (100.0%), whereas the industries that tend to have a higher number of women are Information (100.0%), Public Administration (100.0%), and Health Care & Social Assistance (89.4%).
| Industry | Male | Female |
| Agriculture, Fishing & Hunting | 0 (0.0%) | 0 (0.0%) |
| Mining, Quarrying, & Extraction | 0 (0.0%) | 0 (0.0%) |
| Construction | 28 (100.0%) | 0 (0.0%) |
| Manufacturing | 52 (81.2%) | 12 (18.8%) |
| Wholesale Trade | 8 (44.4%) | 10 (55.6%) |
| Retail Trade | 18 (45.0%) | 22 (55.0%) |
| Transportation & Warehousing | 2 (50.0%) | 2 (50.0%) |
| Utilities | 5 (100.0%) | 0 (0.0%) |
| Information | 0 (0.0%) | 6 (100.0%) |
| Finance & Insurance | 6 (50.0%) | 6 (50.0%) |
| Real Estate, Rental & Leasing | 0 (0.0%) | 0 (0.0%) |
| Professional & Scientific | 2 (28.6%) | 5 (71.4%) |
| Enterprise Management | 0 (0.0%) | 0 (0.0%) |
| Administrative & Support | 7 (100.0%) | 0 (0.0%) |
| Educational Services | 4 (13.8%) | 25 (86.2%) |
| Health Care & Social Assistance | 5 (10.6%) | 42 (89.4%) |
| Arts, Entertainment & Recreation | 1 (100.0%) | 0 (0.0%) |
| Accommodation & Food Services | 5 (41.7%) | 7 (58.3%) |
| Public Administration | 0 (0.0%) | 7 (100.0%) |
| Total | 148 (49.5%) | 151 (50.5%) |
Education in Rollingstone
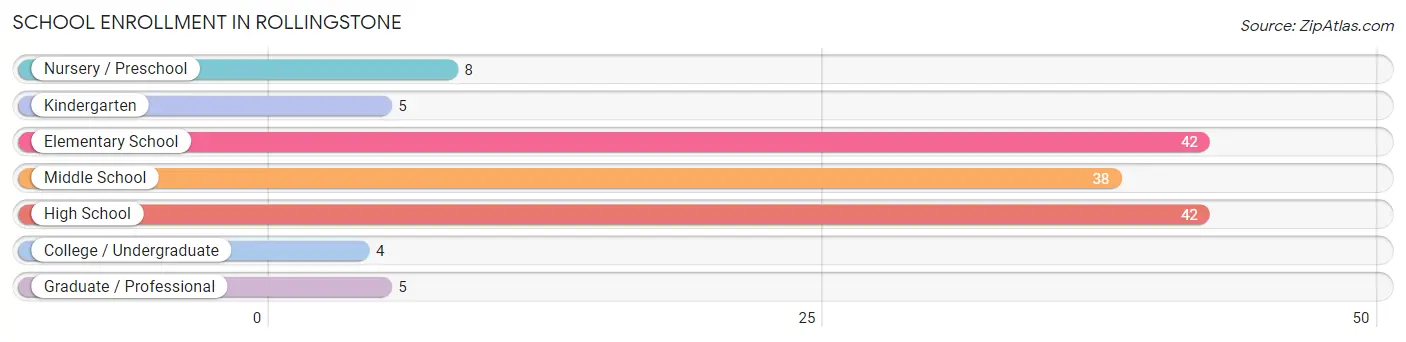
School Enrollment in Rollingstone
The most common levels of schooling among the 144 students in Rollingstone are elementary school (42 | 29.2%), high school (42 | 29.2%), and middle school (38 | 26.4%).
| School Level | # Students | % Students |
| Nursery / Preschool | 8 | 5.6% |
| Kindergarten | 5 | 3.5% |
| Elementary School | 42 | 29.2% |
| Middle School | 38 | 26.4% |
| High School | 42 | 29.2% |
| College / Undergraduate | 4 | 2.8% |
| Graduate / Professional | 5 | 3.5% |
| Total | 144 | 100.0% |
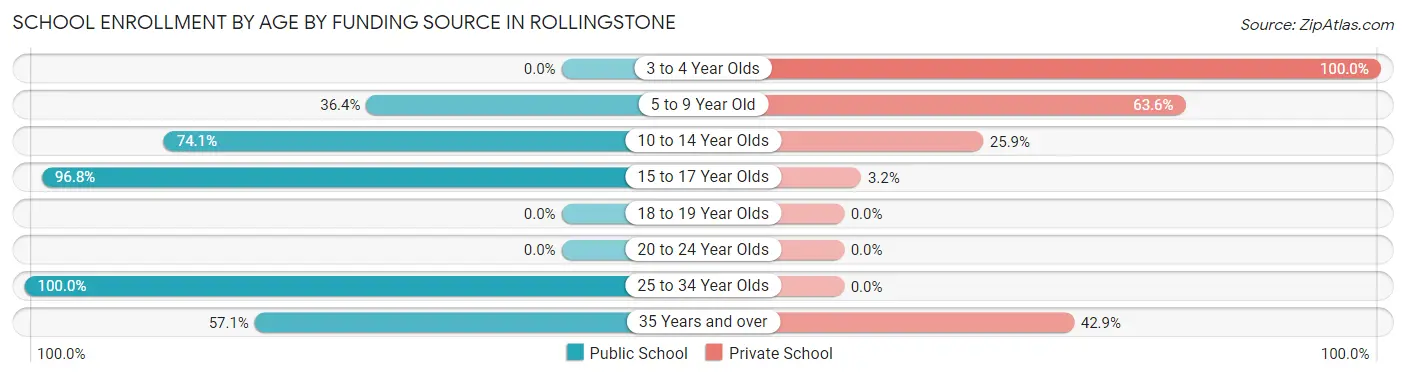
School Enrollment by Age by Funding Source in Rollingstone
Out of a total of 144 students who are enrolled in schools in Rollingstone, 52 (36.1%) attend a private institution, while the remaining 92 (63.9%) are enrolled in public schools. The age group of 3 to 4 year olds has the highest likelihood of being enrolled in private schools, with 6 (100.0% in the age bracket) enrolled. Conversely, the age group of 25 to 34 year olds has the lowest likelihood of being enrolled in a private school, with 2 (100.0% in the age bracket) attending a public institution.
| Age Bracket | Public School | Private School |
| 3 to 4 Year Olds | 0 (0.0%) | 6 (100.0%) |
| 5 to 9 Year Old | 16 (36.4%) | 28 (63.6%) |
| 10 to 14 Year Olds | 40 (74.1%) | 14 (25.9%) |
| 15 to 17 Year Olds | 30 (96.8%) | 1 (3.2%) |
| 18 to 19 Year Olds | 0 (0.0%) | 0 (0.0%) |
| 20 to 24 Year Olds | 0 (0.0%) | 0 (0.0%) |
| 25 to 34 Year Olds | 2 (100.0%) | 0 (0.0%) |
| 35 Years and over | 4 (57.1%) | 3 (42.9%) |
| Total | 92 (63.9%) | 52 (36.1%) |
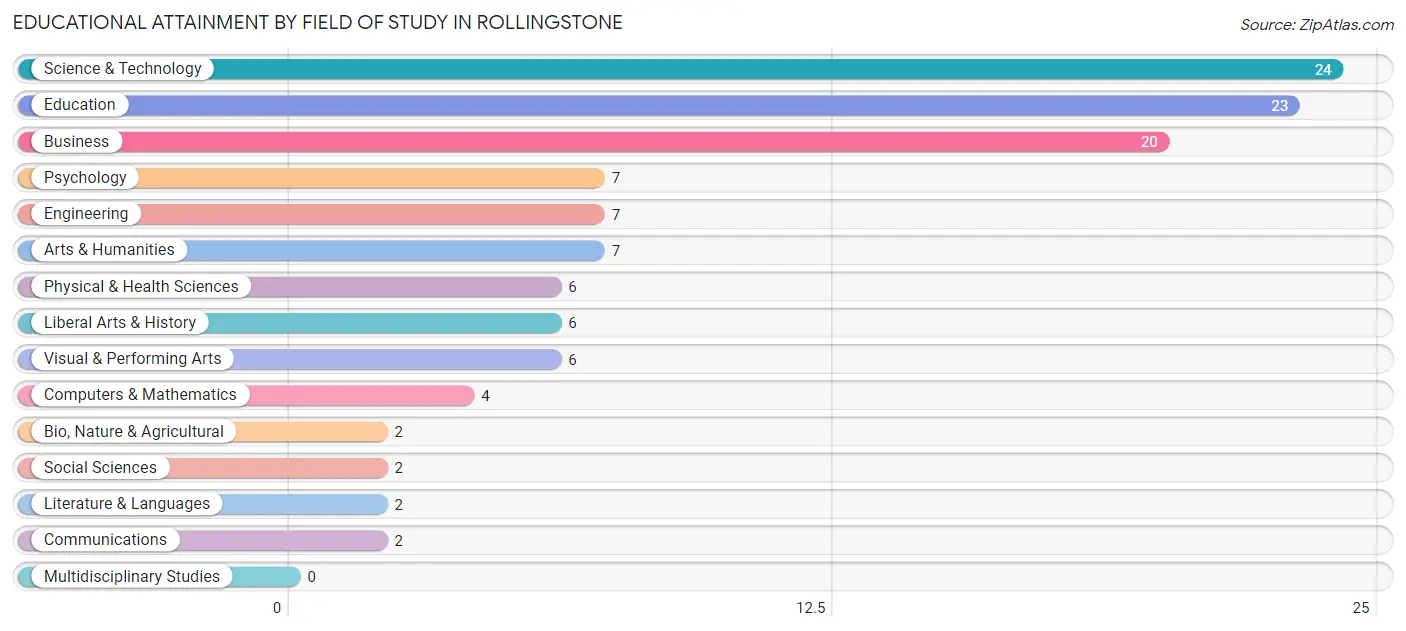
Educational Attainment by Field of Study in Rollingstone
Science & technology (24 | 20.3%), education (23 | 19.5%), business (20 | 17.0%), psychology (7 | 5.9%), and engineering (7 | 5.9%) are the most common fields of study among 118 individuals in Rollingstone who have obtained a bachelor's degree or higher.
| Field of Study | # Graduates | % Graduates |
| Computers & Mathematics | 4 | 3.4% |
| Bio, Nature & Agricultural | 2 | 1.7% |
| Physical & Health Sciences | 6 | 5.1% |
| Psychology | 7 | 5.9% |
| Social Sciences | 2 | 1.7% |
| Engineering | 7 | 5.9% |
| Multidisciplinary Studies | 0 | 0.0% |
| Science & Technology | 24 | 20.3% |
| Business | 20 | 17.0% |
| Education | 23 | 19.5% |
| Literature & Languages | 2 | 1.7% |
| Liberal Arts & History | 6 | 5.1% |
| Visual & Performing Arts | 6 | 5.1% |
| Communications | 2 | 1.7% |
| Arts & Humanities | 7 | 5.9% |
| Total | 118 | 100.0% |
Transportation & Commute in Rollingstone
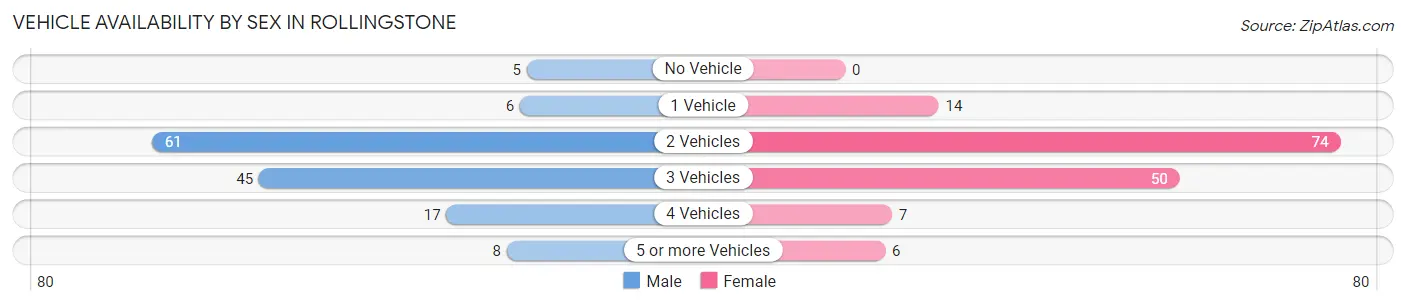
Vehicle Availability by Sex in Rollingstone
The most prevalent vehicle ownership categories in Rollingstone are males with 2 vehicles (61, accounting for 43.0%) and females with 2 vehicles (74, making up 40.4%).
| Vehicles Available | Male | Female |
| No Vehicle | 5 (3.5%) | 0 (0.0%) |
| 1 Vehicle | 6 (4.2%) | 14 (9.3%) |
| 2 Vehicles | 61 (43.0%) | 74 (49.0%) |
| 3 Vehicles | 45 (31.7%) | 50 (33.1%) |
| 4 Vehicles | 17 (12.0%) | 7 (4.6%) |
| 5 or more Vehicles | 8 (5.6%) | 6 (4.0%) |
| Total | 142 (100.0%) | 151 (100.0%) |
Commute Time in Rollingstone
The most frequently occuring commute durations in Rollingstone are 15 to 19 minutes (61 commuters, 21.9%), 20 to 24 minutes (56 commuters, 20.1%), and 10 to 14 minutes (52 commuters, 18.7%).
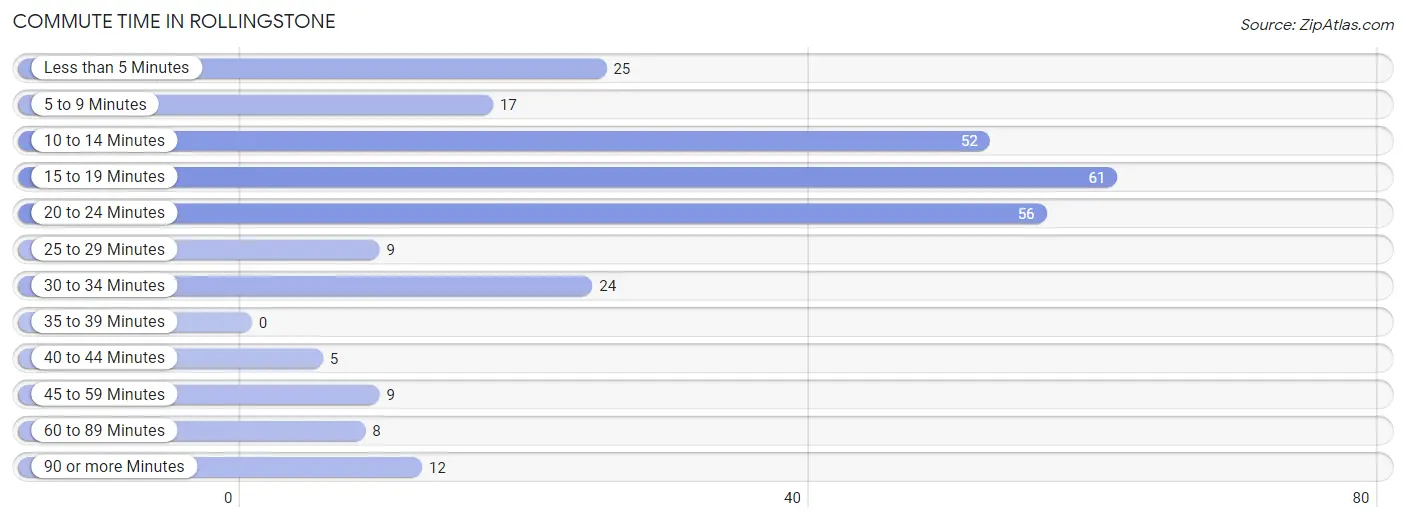
| Commute Time | # Commuters | % Commuters |
| Less than 5 Minutes | 25 | 9.0% |
| 5 to 9 Minutes | 17 | 6.1% |
| 10 to 14 Minutes | 52 | 18.7% |
| 15 to 19 Minutes | 61 | 21.9% |
| 20 to 24 Minutes | 56 | 20.1% |
| 25 to 29 Minutes | 9 | 3.2% |
| 30 to 34 Minutes | 24 | 8.6% |
| 35 to 39 Minutes | 0 | 0.0% |
| 40 to 44 Minutes | 5 | 1.8% |
| 45 to 59 Minutes | 9 | 3.2% |
| 60 to 89 Minutes | 8 | 2.9% |
| 90 or more Minutes | 12 | 4.3% |
Commute Time by Sex in Rollingstone
The most common commute times in Rollingstone are 10 to 14 minutes (32 commuters, 23.4%) for males and 20 to 24 minutes (42 commuters, 29.8%) for females.
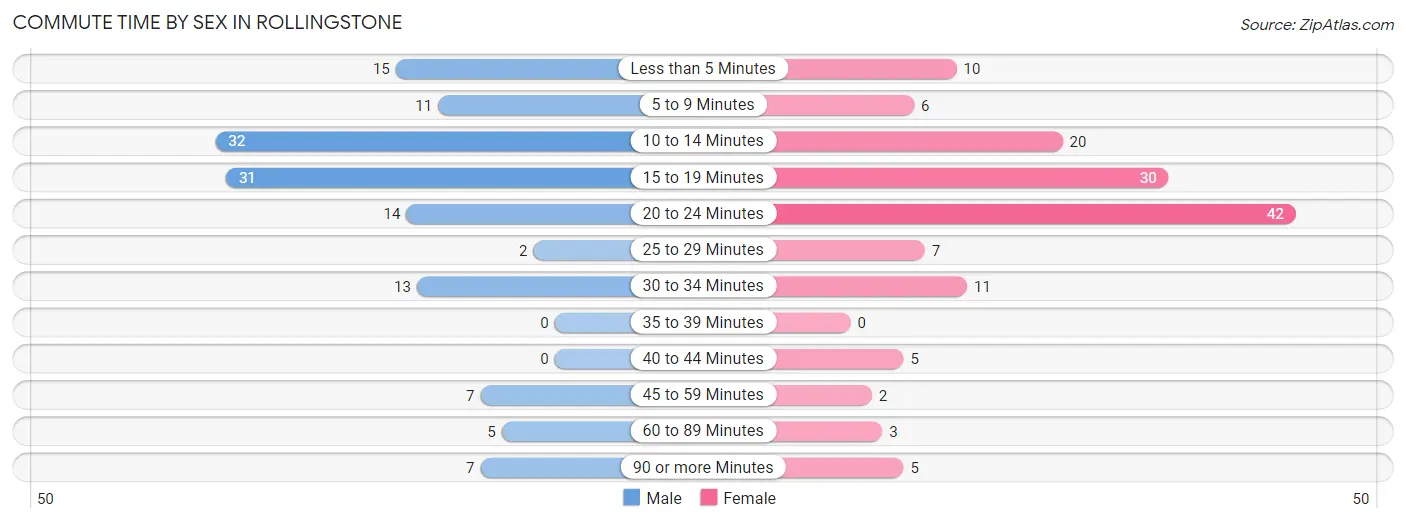
| Commute Time | Male | Female |
| Less than 5 Minutes | 15 (11.0%) | 10 (7.1%) |
| 5 to 9 Minutes | 11 (8.0%) | 6 (4.3%) |
| 10 to 14 Minutes | 32 (23.4%) | 20 (14.2%) |
| 15 to 19 Minutes | 31 (22.6%) | 30 (21.3%) |
| 20 to 24 Minutes | 14 (10.2%) | 42 (29.8%) |
| 25 to 29 Minutes | 2 (1.5%) | 7 (5.0%) |
| 30 to 34 Minutes | 13 (9.5%) | 11 (7.8%) |
| 35 to 39 Minutes | 0 (0.0%) | 0 (0.0%) |
| 40 to 44 Minutes | 0 (0.0%) | 5 (3.5%) |
| 45 to 59 Minutes | 7 (5.1%) | 2 (1.4%) |
| 60 to 89 Minutes | 5 (3.6%) | 3 (2.1%) |
| 90 or more Minutes | 7 (5.1%) | 5 (3.5%) |
Time of Departure to Work by Sex in Rollingstone
The most frequent times of departure to work in Rollingstone are 7:00 AM to 7:29 AM (25, 18.2%) for males and 7:00 AM to 7:29 AM (38, 27.0%) for females.
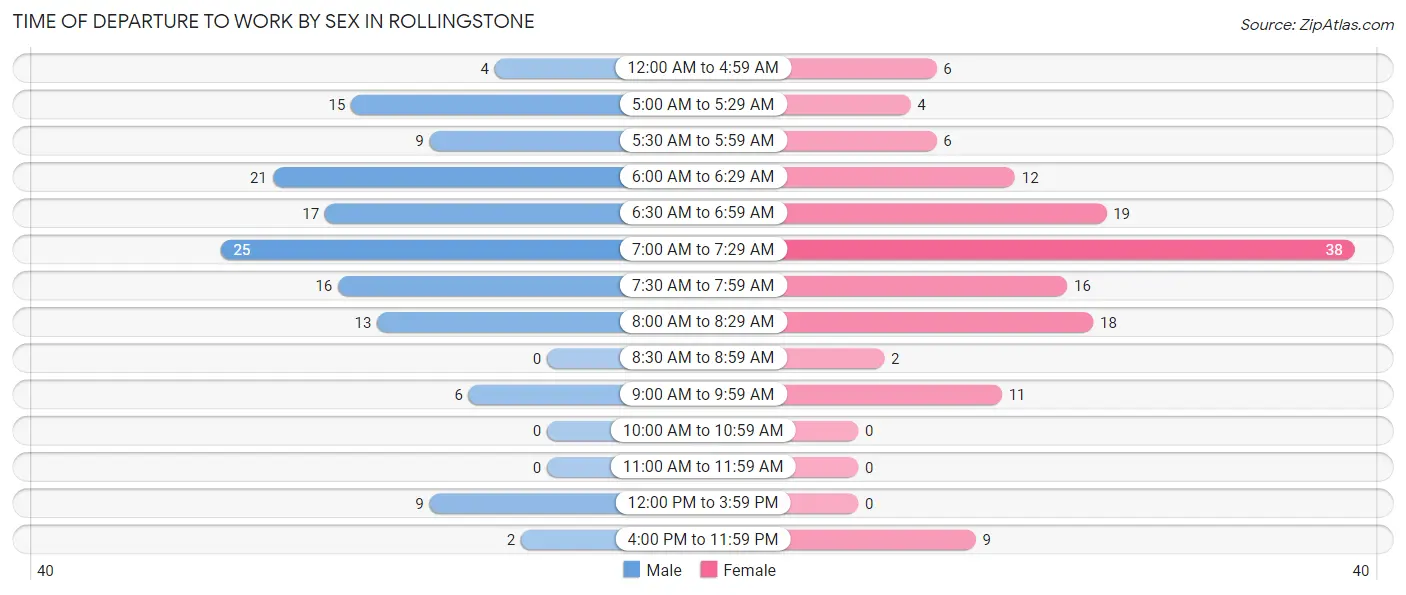
| Time of Departure | Male | Female |
| 12:00 AM to 4:59 AM | 4 (2.9%) | 6 (4.3%) |
| 5:00 AM to 5:29 AM | 15 (11.0%) | 4 (2.8%) |
| 5:30 AM to 5:59 AM | 9 (6.6%) | 6 (4.3%) |
| 6:00 AM to 6:29 AM | 21 (15.3%) | 12 (8.5%) |
| 6:30 AM to 6:59 AM | 17 (12.4%) | 19 (13.5%) |
| 7:00 AM to 7:29 AM | 25 (18.2%) | 38 (27.0%) |
| 7:30 AM to 7:59 AM | 16 (11.7%) | 16 (11.4%) |
| 8:00 AM to 8:29 AM | 13 (9.5%) | 18 (12.8%) |
| 8:30 AM to 8:59 AM | 0 (0.0%) | 2 (1.4%) |
| 9:00 AM to 9:59 AM | 6 (4.4%) | 11 (7.8%) |
| 10:00 AM to 10:59 AM | 0 (0.0%) | 0 (0.0%) |
| 11:00 AM to 11:59 AM | 0 (0.0%) | 0 (0.0%) |
| 12:00 PM to 3:59 PM | 9 (6.6%) | 0 (0.0%) |
| 4:00 PM to 11:59 PM | 2 (1.5%) | 9 (6.4%) |
| Total | 137 (100.0%) | 141 (100.0%) |
Housing Occupancy in Rollingstone
Occupancy by Ownership in Rollingstone
Of the total 226 dwellings in Rollingstone, owner-occupied units account for 199 (88.0%), while renter-occupied units make up 27 (11.9%).
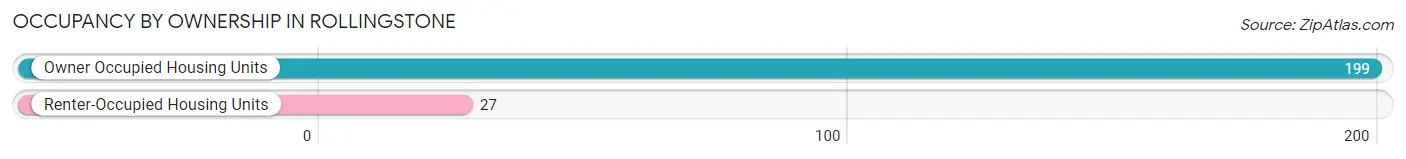
| Occupancy | # Housing Units | % Housing Units |
| Owner Occupied Housing Units | 199 | 88.0% |
| Renter-Occupied Housing Units | 27 | 11.9% |
| Total Occupied Housing Units | 226 | 100.0% |
Occupancy by Household Size in Rollingstone
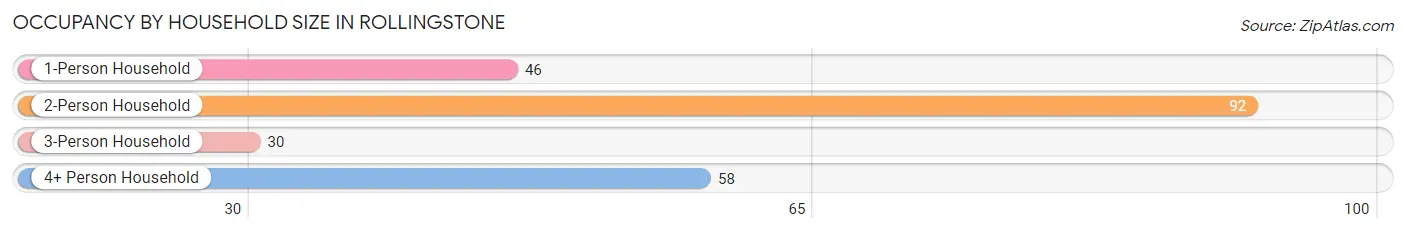
| Household Size | # Housing Units | % Housing Units |
| 1-Person Household | 46 | 20.3% |
| 2-Person Household | 92 | 40.7% |
| 3-Person Household | 30 | 13.3% |
| 4+ Person Household | 58 | 25.7% |
| Total Housing Units | 226 | 100.0% |
Occupancy by Ownership by Household Size in Rollingstone
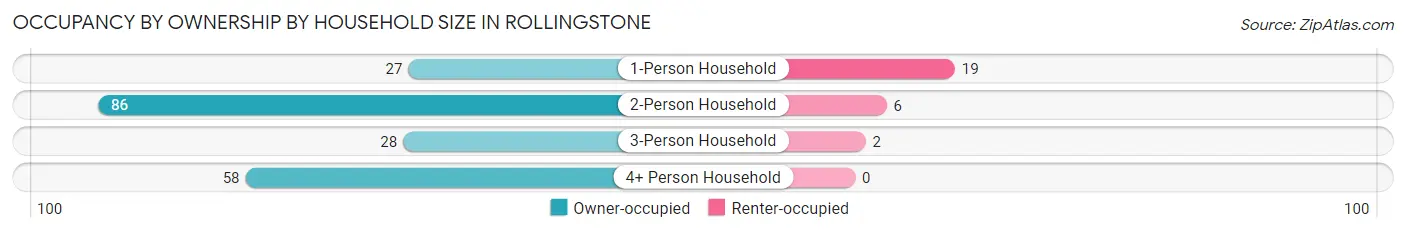
| Household Size | Owner-occupied | Renter-occupied |
| 1-Person Household | 27 (58.7%) | 19 (41.3%) |
| 2-Person Household | 86 (93.5%) | 6 (6.5%) |
| 3-Person Household | 28 (93.3%) | 2 (6.7%) |
| 4+ Person Household | 58 (100.0%) | 0 (0.0%) |
| Total Housing Units | 199 (88.0%) | 27 (11.9%) |
Occupancy by Educational Attainment in Rollingstone
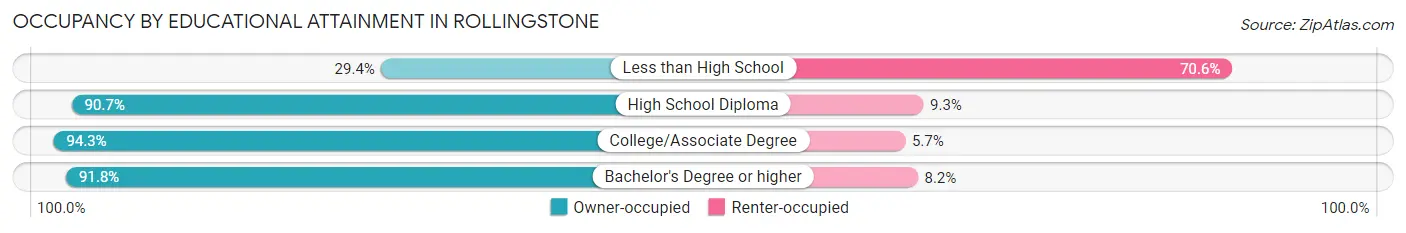
| Household Size | Owner-occupied | Renter-occupied |
| Less than High School | 5 (29.4%) | 12 (70.6%) |
| High School Diploma | 39 (90.7%) | 4 (9.3%) |
| College/Associate Degree | 99 (94.3%) | 6 (5.7%) |
| Bachelor's Degree or higher | 56 (91.8%) | 5 (8.2%) |
Occupancy by Age of Householder in Rollingstone
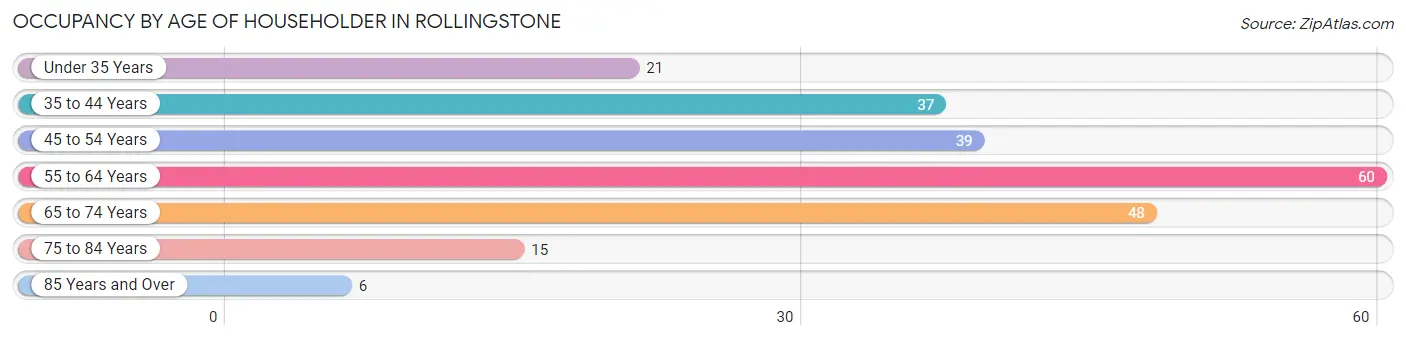
| Age Bracket | # Households | % Households |
| Under 35 Years | 21 | 9.3% |
| 35 to 44 Years | 37 | 16.4% |
| 45 to 54 Years | 39 | 17.3% |
| 55 to 64 Years | 60 | 26.6% |
| 65 to 74 Years | 48 | 21.2% |
| 75 to 84 Years | 15 | 6.6% |
| 85 Years and Over | 6 | 2.6% |
| Total | 226 | 100.0% |
Housing Finances in Rollingstone
Median Income by Occupancy in Rollingstone
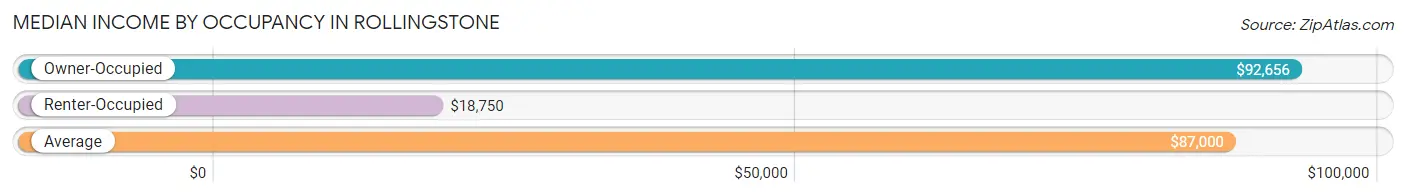
| Occupancy Type | # Households | Median Income |
| Owner-Occupied | 199 (88.0%) | $92,656 |
| Renter-Occupied | 27 (11.9%) | $18,750 |
| Average | 226 (100.0%) | $87,000 |
Occupancy by Householder Income Bracket in Rollingstone
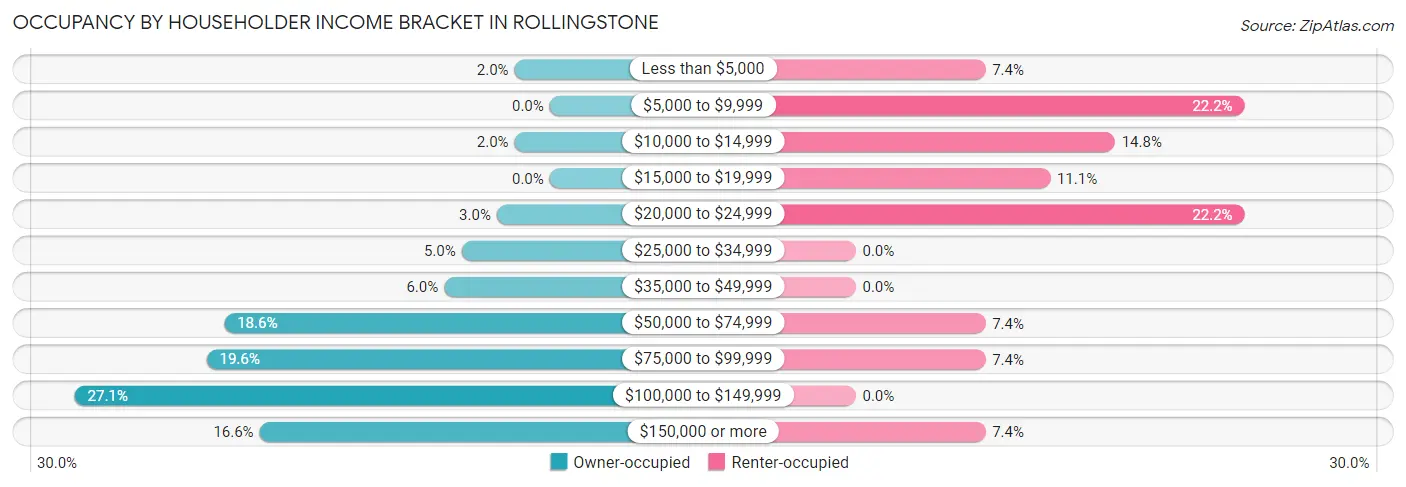
| Income Bracket | Owner-occupied | Renter-occupied |
| Less than $5,000 | 4 (2.0%) | 2 (7.4%) |
| $5,000 to $9,999 | 0 (0.0%) | 6 (22.2%) |
| $10,000 to $14,999 | 4 (2.0%) | 4 (14.8%) |
| $15,000 to $19,999 | 0 (0.0%) | 3 (11.1%) |
| $20,000 to $24,999 | 6 (3.0%) | 6 (22.2%) |
| $25,000 to $34,999 | 10 (5.0%) | 0 (0.0%) |
| $35,000 to $49,999 | 12 (6.0%) | 0 (0.0%) |
| $50,000 to $74,999 | 37 (18.6%) | 2 (7.4%) |
| $75,000 to $99,999 | 39 (19.6%) | 2 (7.4%) |
| $100,000 to $149,999 | 54 (27.1%) | 0 (0.0%) |
| $150,000 or more | 33 (16.6%) | 2 (7.4%) |
| Total | 199 (100.0%) | 27 (100.0%) |
Monthly Housing Cost Tiers in Rollingstone
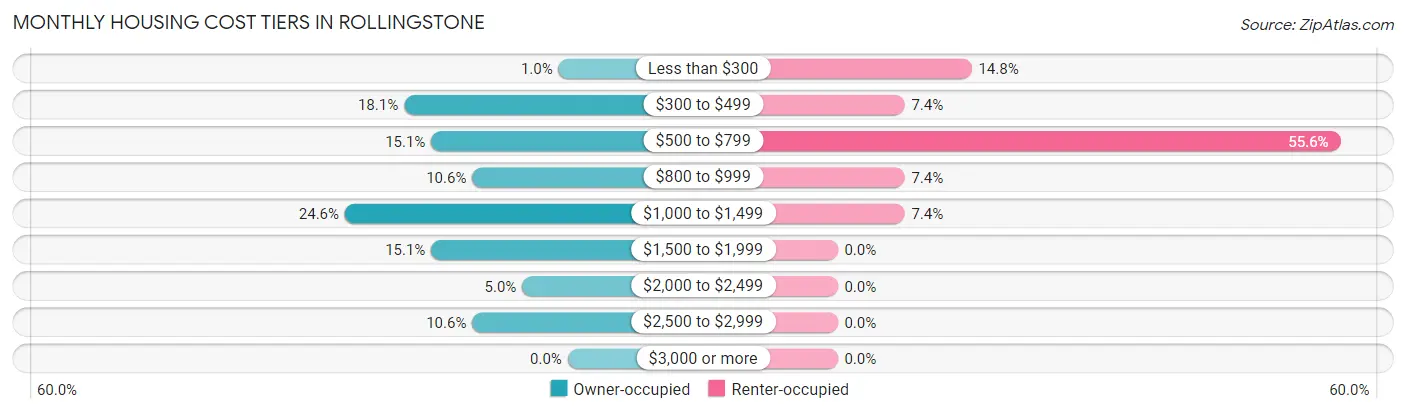
| Monthly Cost | Owner-occupied | Renter-occupied |
| Less than $300 | 2 (1.0%) | 4 (14.8%) |
| $300 to $499 | 36 (18.1%) | 2 (7.4%) |
| $500 to $799 | 30 (15.1%) | 15 (55.6%) |
| $800 to $999 | 21 (10.5%) | 2 (7.4%) |
| $1,000 to $1,499 | 49 (24.6%) | 2 (7.4%) |
| $1,500 to $1,999 | 30 (15.1%) | 0 (0.0%) |
| $2,000 to $2,499 | 10 (5.0%) | 0 (0.0%) |
| $2,500 to $2,999 | 21 (10.5%) | 0 (0.0%) |
| $3,000 or more | 0 (0.0%) | 0 (0.0%) |
| Total | 199 (100.0%) | 27 (100.0%) |
Physical Housing Characteristics in Rollingstone
Housing Structures in Rollingstone
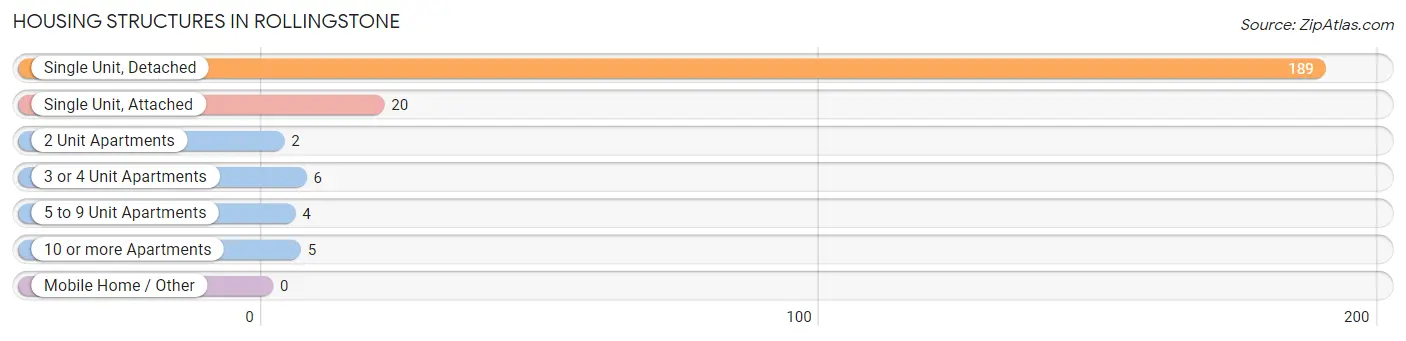
| Structure Type | # Housing Units | % Housing Units |
| Single Unit, Detached | 189 | 83.6% |
| Single Unit, Attached | 20 | 8.8% |
| 2 Unit Apartments | 2 | 0.9% |
| 3 or 4 Unit Apartments | 6 | 2.6% |
| 5 to 9 Unit Apartments | 4 | 1.8% |
| 10 or more Apartments | 5 | 2.2% |
| Mobile Home / Other | 0 | 0.0% |
| Total | 226 | 100.0% |
Housing Structures by Occupancy in Rollingstone
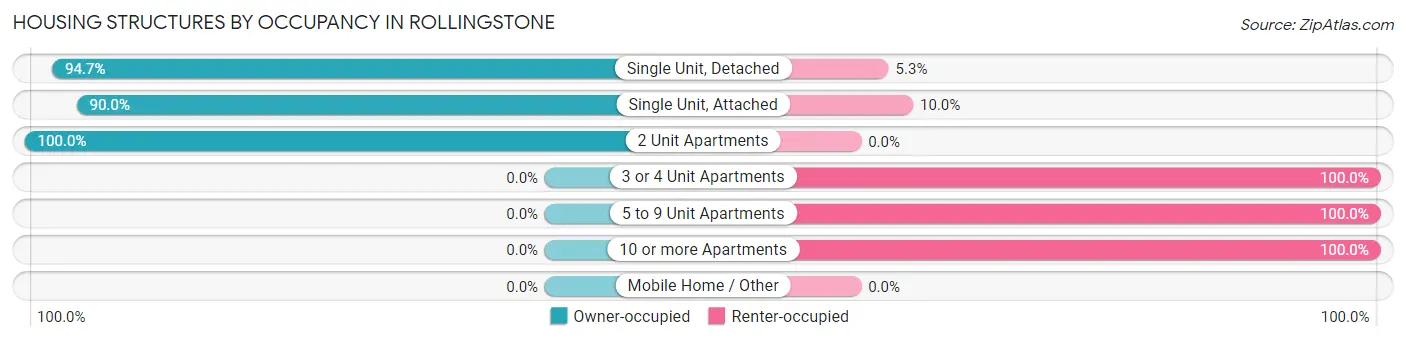
| Structure Type | Owner-occupied | Renter-occupied |
| Single Unit, Detached | 179 (94.7%) | 10 (5.3%) |
| Single Unit, Attached | 18 (90.0%) | 2 (10.0%) |
| 2 Unit Apartments | 2 (100.0%) | 0 (0.0%) |
| 3 or 4 Unit Apartments | 0 (0.0%) | 6 (100.0%) |
| 5 to 9 Unit Apartments | 0 (0.0%) | 4 (100.0%) |
| 10 or more Apartments | 0 (0.0%) | 5 (100.0%) |
| Mobile Home / Other | 0 (0.0%) | 0 (0.0%) |
| Total | 199 (88.0%) | 27 (11.9%) |
Housing Structures by Number of Rooms in Rollingstone
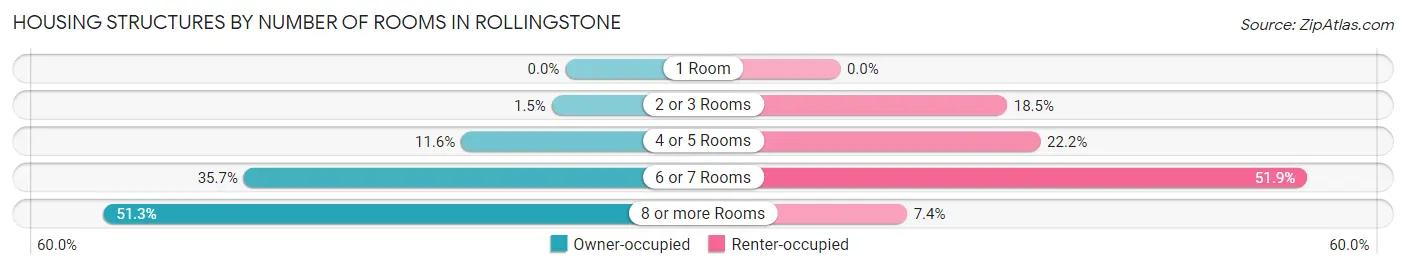
| Number of Rooms | Owner-occupied | Renter-occupied |
| 1 Room | 0 (0.0%) | 0 (0.0%) |
| 2 or 3 Rooms | 3 (1.5%) | 5 (18.5%) |
| 4 or 5 Rooms | 23 (11.6%) | 6 (22.2%) |
| 6 or 7 Rooms | 71 (35.7%) | 14 (51.8%) |
| 8 or more Rooms | 102 (51.3%) | 2 (7.4%) |
| Total | 199 (100.0%) | 27 (100.0%) |
Housing Structure by Heating Type in Rollingstone
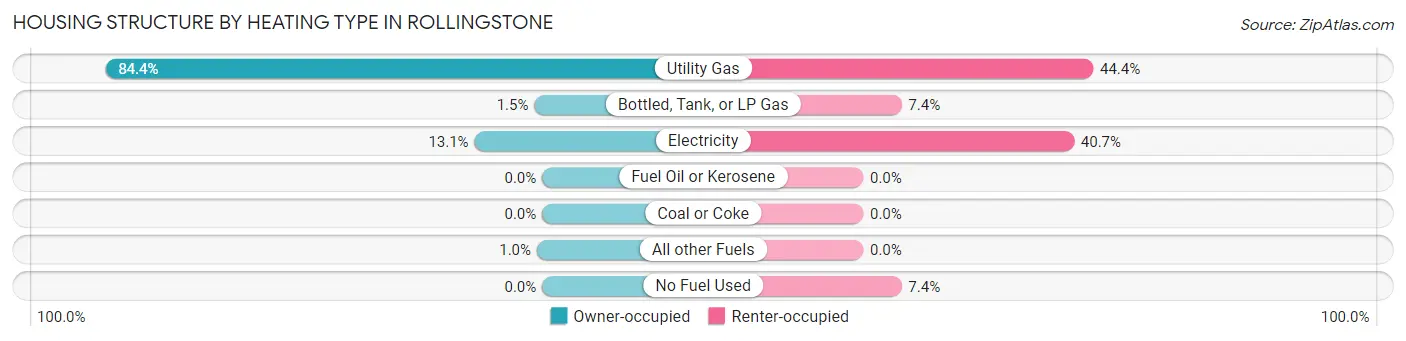
| Heating Type | Owner-occupied | Renter-occupied |
| Utility Gas | 168 (84.4%) | 12 (44.4%) |
| Bottled, Tank, or LP Gas | 3 (1.5%) | 2 (7.4%) |
| Electricity | 26 (13.1%) | 11 (40.7%) |
| Fuel Oil or Kerosene | 0 (0.0%) | 0 (0.0%) |
| Coal or Coke | 0 (0.0%) | 0 (0.0%) |
| All other Fuels | 2 (1.0%) | 0 (0.0%) |
| No Fuel Used | 0 (0.0%) | 2 (7.4%) |
| Total | 199 (100.0%) | 27 (100.0%) |
Household Vehicle Usage in Rollingstone
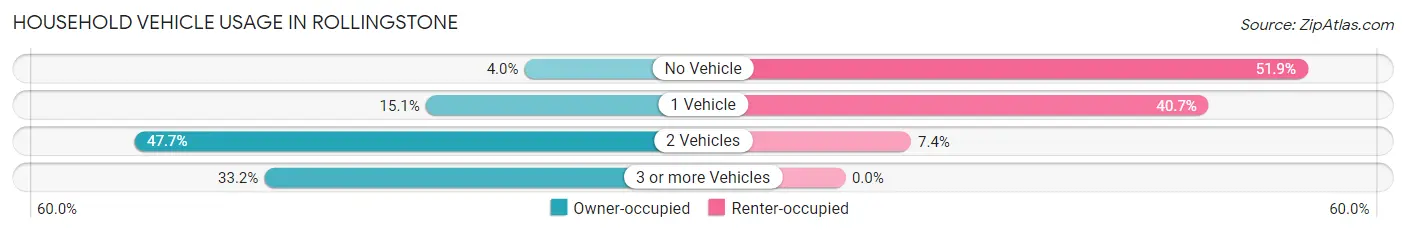
| Vehicles per Household | Owner-occupied | Renter-occupied |
| No Vehicle | 8 (4.0%) | 14 (51.8%) |
| 1 Vehicle | 30 (15.1%) | 11 (40.7%) |
| 2 Vehicles | 95 (47.7%) | 2 (7.4%) |
| 3 or more Vehicles | 66 (33.2%) | 0 (0.0%) |
| Total | 199 (100.0%) | 27 (100.0%) |
Real Estate & Mortgages in Rollingstone
Real Estate and Mortgage Overview in Rollingstone
| Characteristic | Without Mortgage | With Mortgage |
| Housing Units | 74 | 125 |
| Median Property Value | $209,500 | $217,500 |
| Median Household Income | $64,167 | $27 |
| Monthly Housing Costs | $514 | $0 |
| Real Estate Taxes | $2,138 | $0 |
Property Value by Mortgage Status in Rollingstone
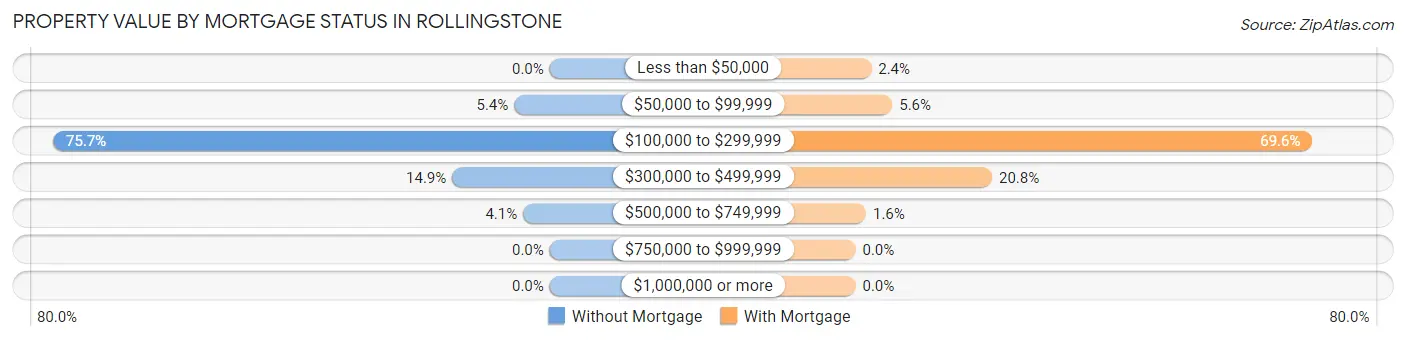
| Property Value | Without Mortgage | With Mortgage |
| Less than $50,000 | 0 (0.0%) | 3 (2.4%) |
| $50,000 to $99,999 | 4 (5.4%) | 7 (5.6%) |
| $100,000 to $299,999 | 56 (75.7%) | 87 (69.6%) |
| $300,000 to $499,999 | 11 (14.9%) | 26 (20.8%) |
| $500,000 to $749,999 | 3 (4.1%) | 2 (1.6%) |
| $750,000 to $999,999 | 0 (0.0%) | 0 (0.0%) |
| $1,000,000 or more | 0 (0.0%) | 0 (0.0%) |
| Total | 74 (100.0%) | 125 (100.0%) |
Household Income by Mortgage Status in Rollingstone
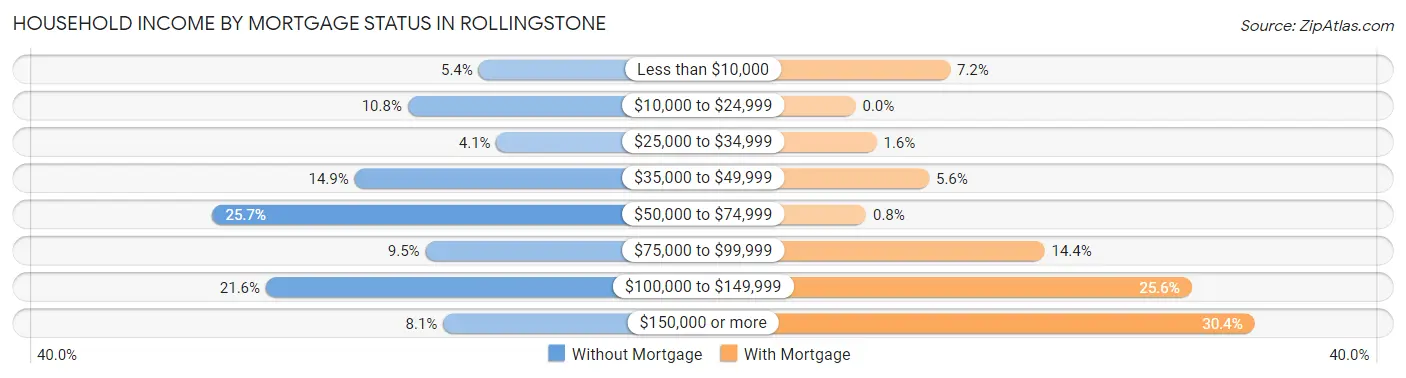
| Household Income | Without Mortgage | With Mortgage |
| Less than $10,000 | 4 (5.4%) | 9 (7.2%) |
| $10,000 to $24,999 | 8 (10.8%) | 0 (0.0%) |
| $25,000 to $34,999 | 3 (4.1%) | 2 (1.6%) |
| $35,000 to $49,999 | 11 (14.9%) | 7 (5.6%) |
| $50,000 to $74,999 | 19 (25.7%) | 1 (0.8%) |
| $75,000 to $99,999 | 7 (9.5%) | 18 (14.4%) |
| $100,000 to $149,999 | 16 (21.6%) | 32 (25.6%) |
| $150,000 or more | 6 (8.1%) | 38 (30.4%) |
| Total | 74 (100.0%) | 125 (100.0%) |
Property Value to Household Income Ratio in Rollingstone
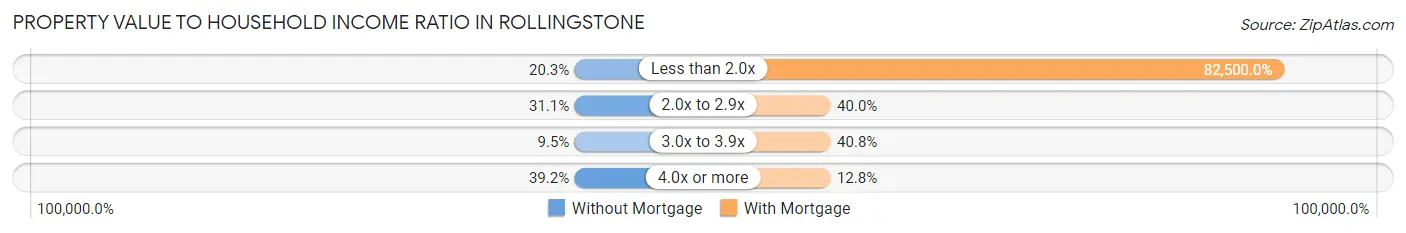
| Value-to-Income Ratio | Without Mortgage | With Mortgage |
| Less than 2.0x | 15 (20.3%) | 103,125 (82,500.0%) |
| 2.0x to 2.9x | 23 (31.1%) | 50 (40.0%) |
| 3.0x to 3.9x | 7 (9.5%) | 51 (40.8%) |
| 4.0x or more | 29 (39.2%) | 16 (12.8%) |
| Total | 74 (100.0%) | 125 (100.0%) |
Real Estate Taxes by Mortgage Status in Rollingstone
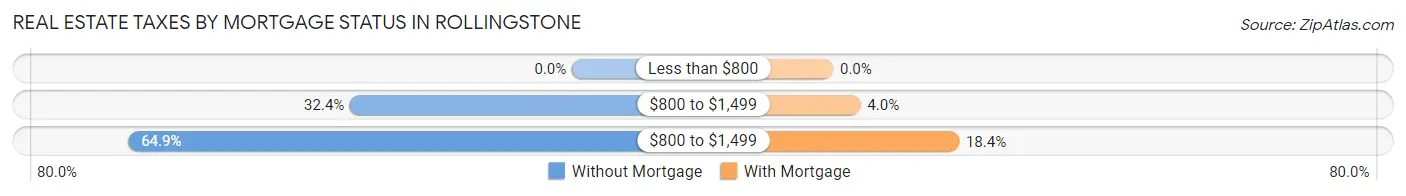
| Property Taxes | Without Mortgage | With Mortgage |
| Less than $800 | 0 (0.0%) | 0 (0.0%) |
| $800 to $1,499 | 24 (32.4%) | 5 (4.0%) |
| $800 to $1,499 | 48 (64.9%) | 23 (18.4%) |
| Total | 74 (100.0%) | 125 (100.0%) |
Health & Disability in Rollingstone
Health Insurance Coverage by Age in Rollingstone
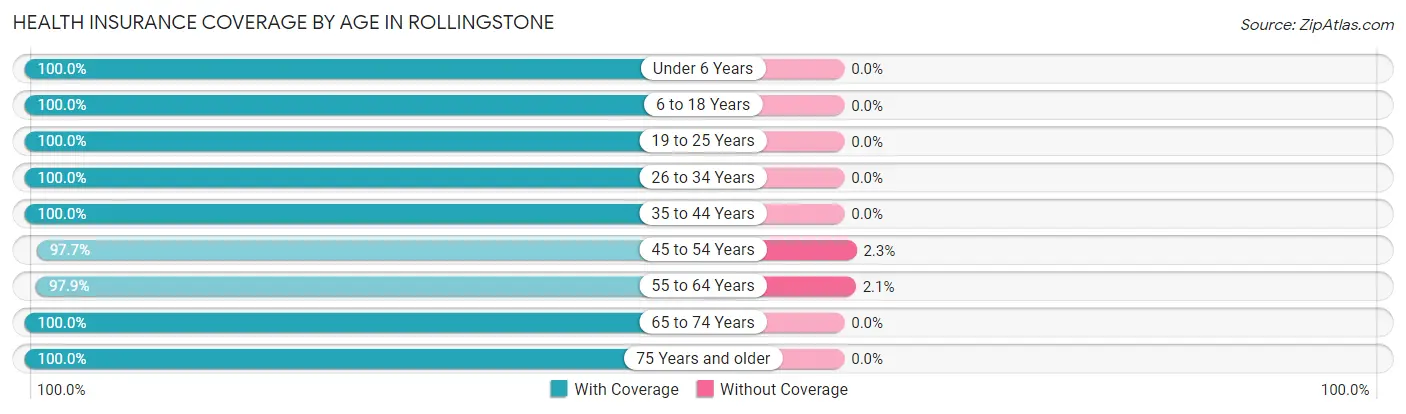
| Age Bracket | With Coverage | Without Coverage |
| Under 6 Years | 47 (100.0%) | 0 (0.0%) |
| 6 to 18 Years | 124 (100.0%) | 0 (0.0%) |
| 19 to 25 Years | 26 (100.0%) | 0 (0.0%) |
| 26 to 34 Years | 45 (100.0%) | 0 (0.0%) |
| 35 to 44 Years | 73 (100.0%) | 0 (0.0%) |
| 45 to 54 Years | 86 (97.7%) | 2 (2.3%) |
| 55 to 64 Years | 92 (97.9%) | 2 (2.1%) |
| 65 to 74 Years | 74 (100.0%) | 0 (0.0%) |
| 75 Years and older | 30 (100.0%) | 0 (0.0%) |
| Total | 597 (99.3%) | 4 (0.7%) |
Health Insurance Coverage by Citizenship Status in Rollingstone
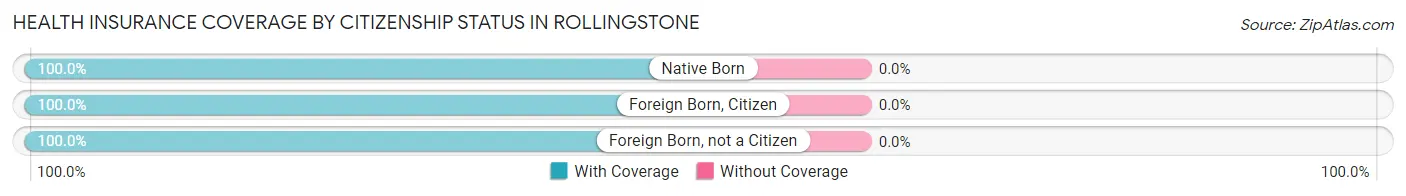
| Citizenship Status | With Coverage | Without Coverage |
| Native Born | 47 (100.0%) | 0 (0.0%) |
| Foreign Born, Citizen | 124 (100.0%) | 0 (0.0%) |
| Foreign Born, not a Citizen | 26 (100.0%) | 0 (0.0%) |
Health Insurance Coverage by Household Income in Rollingstone
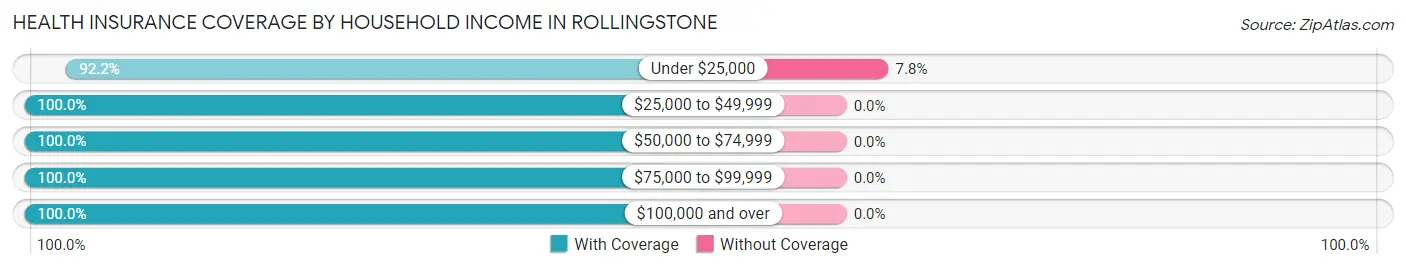
| Household Income | With Coverage | Without Coverage |
| Under $25,000 | 47 (92.2%) | 4 (7.8%) |
| $25,000 to $49,999 | 46 (100.0%) | 0 (0.0%) |
| $50,000 to $74,999 | 93 (100.0%) | 0 (0.0%) |
| $75,000 to $99,999 | 110 (100.0%) | 0 (0.0%) |
| $100,000 and over | 301 (100.0%) | 0 (0.0%) |
Public vs Private Health Insurance Coverage by Age in Rollingstone
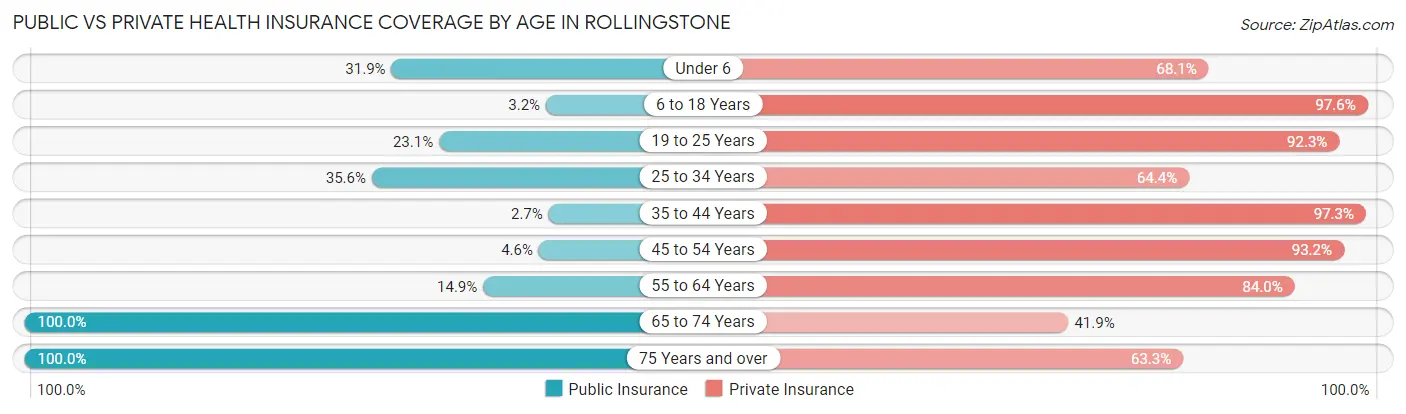
| Age Bracket | Public Insurance | Private Insurance |
| Under 6 | 15 (31.9%) | 32 (68.1%) |
| 6 to 18 Years | 4 (3.2%) | 121 (97.6%) |
| 19 to 25 Years | 6 (23.1%) | 24 (92.3%) |
| 25 to 34 Years | 16 (35.6%) | 29 (64.4%) |
| 35 to 44 Years | 2 (2.7%) | 71 (97.3%) |
| 45 to 54 Years | 4 (4.5%) | 82 (93.2%) |
| 55 to 64 Years | 14 (14.9%) | 79 (84.0%) |
| 65 to 74 Years | 74 (100.0%) | 31 (41.9%) |
| 75 Years and over | 30 (100.0%) | 19 (63.3%) |
| Total | 165 (27.5%) | 488 (81.2%) |
Disability Status by Sex by Age in Rollingstone
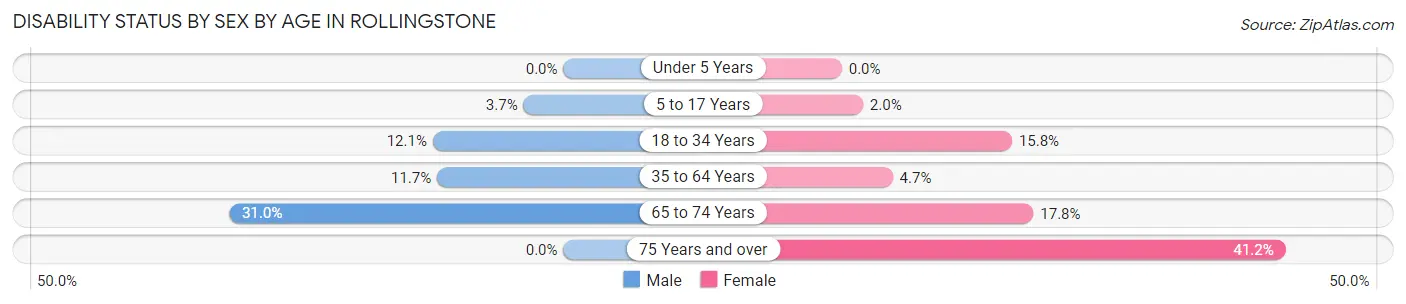
| Age Bracket | Male | Female |
| Under 5 Years | 0 (0.0%) | 0 (0.0%) |
| 5 to 17 Years | 3 (3.7%) | 1 (2.0%) |
| 18 to 34 Years | 4 (12.1%) | 6 (15.8%) |
| 35 to 64 Years | 15 (11.7%) | 6 (4.7%) |
| 65 to 74 Years | 9 (31.0%) | 8 (17.8%) |
| 75 Years and over | 0 (0.0%) | 7 (41.2%) |
Disability Class by Sex by Age in Rollingstone
Disability Class: Hearing Difficulty
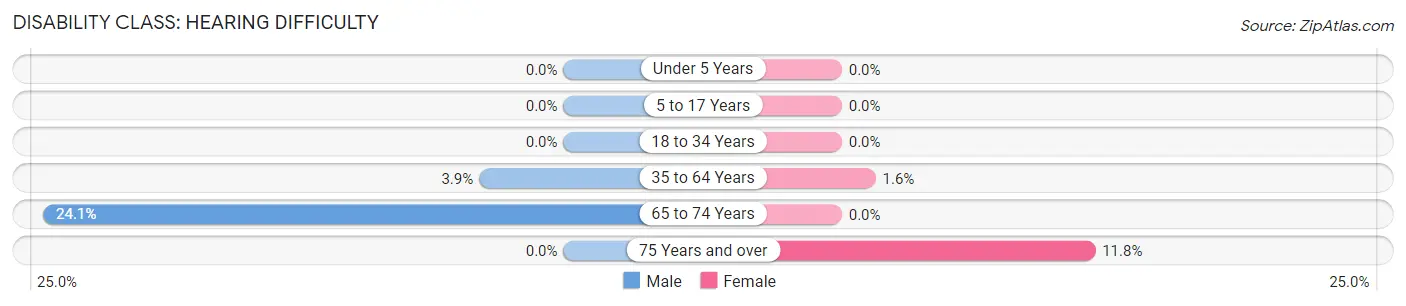
| Age Bracket | Male | Female |
| Under 5 Years | 0 (0.0%) | 0 (0.0%) |
| 5 to 17 Years | 0 (0.0%) | 0 (0.0%) |
| 18 to 34 Years | 0 (0.0%) | 0 (0.0%) |
| 35 to 64 Years | 5 (3.9%) | 2 (1.6%) |
| 65 to 74 Years | 7 (24.1%) | 0 (0.0%) |
| 75 Years and over | 0 (0.0%) | 2 (11.8%) |
Disability Class: Vision Difficulty
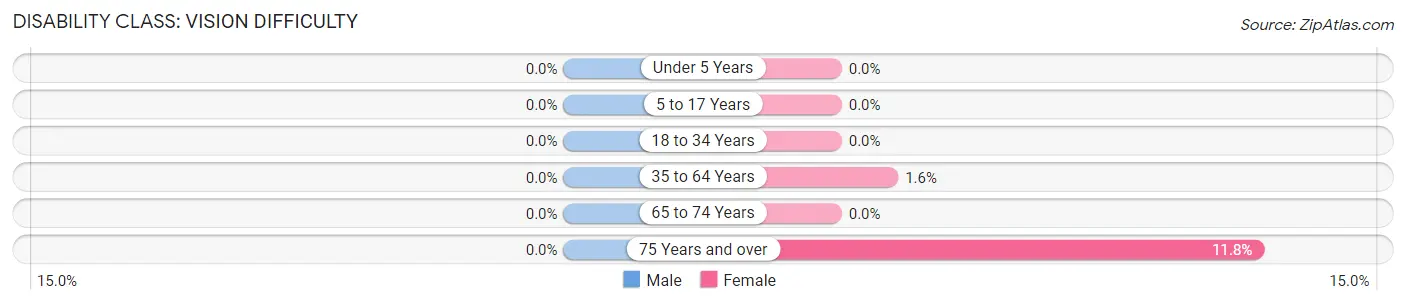
| Age Bracket | Male | Female |
| Under 5 Years | 0 (0.0%) | 0 (0.0%) |
| 5 to 17 Years | 0 (0.0%) | 0 (0.0%) |
| 18 to 34 Years | 0 (0.0%) | 0 (0.0%) |
| 35 to 64 Years | 0 (0.0%) | 2 (1.6%) |
| 65 to 74 Years | 0 (0.0%) | 0 (0.0%) |
| 75 Years and over | 0 (0.0%) | 2 (11.8%) |
Disability Class: Cognitive Difficulty
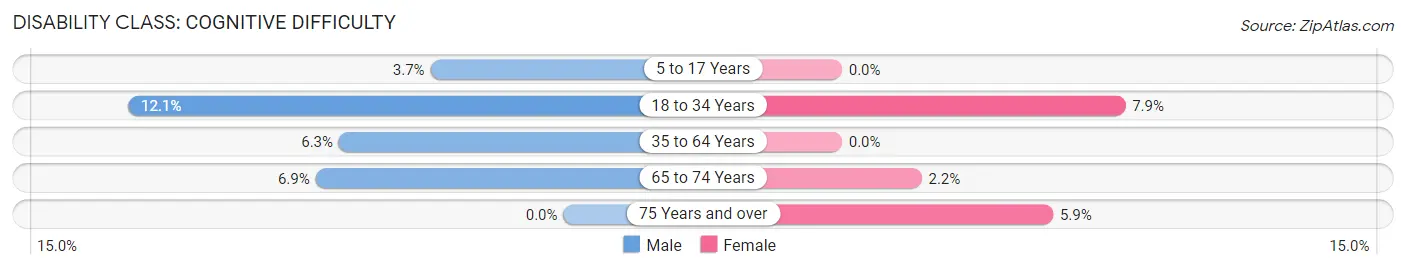
| Age Bracket | Male | Female |
| 5 to 17 Years | 3 (3.7%) | 0 (0.0%) |
| 18 to 34 Years | 4 (12.1%) | 3 (7.9%) |
| 35 to 64 Years | 8 (6.2%) | 0 (0.0%) |
| 65 to 74 Years | 2 (6.9%) | 1 (2.2%) |
| 75 Years and over | 0 (0.0%) | 1 (5.9%) |
Disability Class: Ambulatory Difficulty
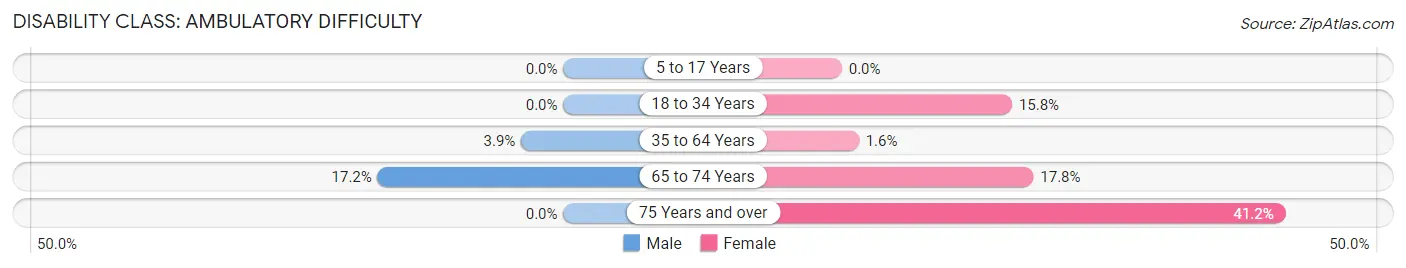
| Age Bracket | Male | Female |
| 5 to 17 Years | 0 (0.0%) | 0 (0.0%) |
| 18 to 34 Years | 0 (0.0%) | 6 (15.8%) |
| 35 to 64 Years | 5 (3.9%) | 2 (1.6%) |
| 65 to 74 Years | 5 (17.2%) | 8 (17.8%) |
| 75 Years and over | 0 (0.0%) | 7 (41.2%) |
Disability Class: Self-Care Difficulty
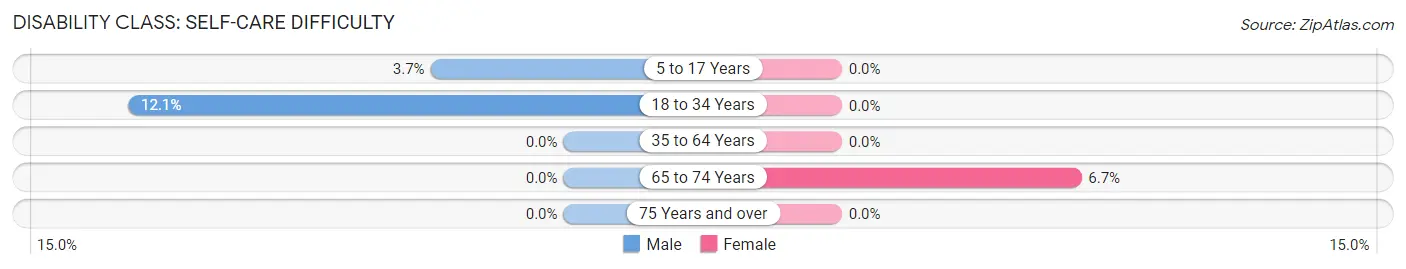
| Age Bracket | Male | Female |
| 5 to 17 Years | 3 (3.7%) | 0 (0.0%) |
| 18 to 34 Years | 4 (12.1%) | 0 (0.0%) |
| 35 to 64 Years | 0 (0.0%) | 0 (0.0%) |
| 65 to 74 Years | 0 (0.0%) | 3 (6.7%) |
| 75 Years and over | 0 (0.0%) | 0 (0.0%) |
Technology Access in Rollingstone
Computing Device Access in Rollingstone
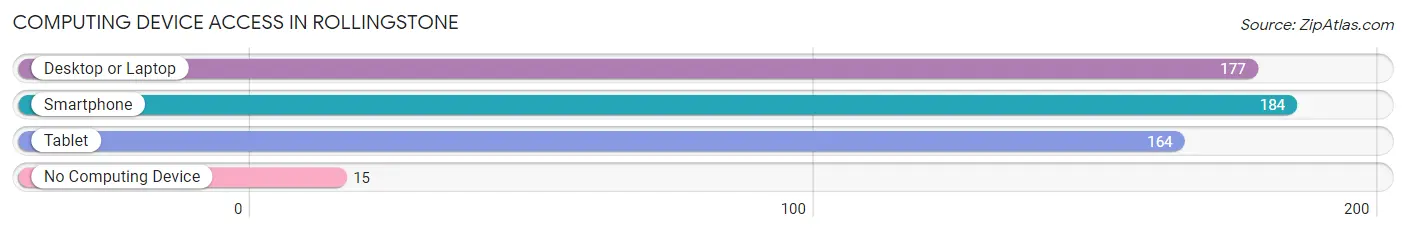
| Device Type | # Households | % Households |
| Desktop or Laptop | 177 | 78.3% |
| Smartphone | 184 | 81.4% |
| Tablet | 164 | 72.6% |
| No Computing Device | 15 | 6.6% |
| Total | 226 | 100.0% |
Internet Access in Rollingstone
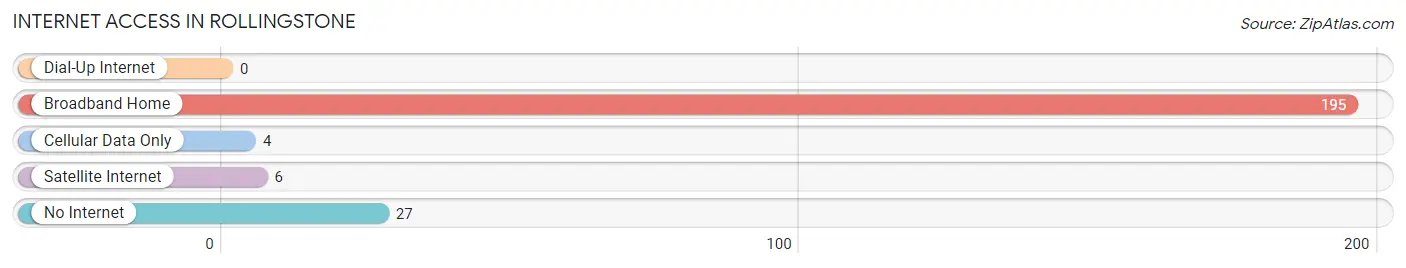
| Internet Type | # Households | % Households |
| Dial-Up Internet | 0 | 0.0% |
| Broadband Home | 195 | 86.3% |
| Cellular Data Only | 4 | 1.8% |
| Satellite Internet | 6 | 2.6% |
| No Internet | 27 | 11.9% |
| Total | 226 | 100.0% |
Rollingstone Summary
Rollingstone, Minnesota is a small city located in Winona County, in the southeastern corner of the state. The city is situated on the banks of the Mississippi River, and is home to a population of just over 1,000 people. The city is known for its rich history, diverse geography, and vibrant economy.
History
Rollingstone was first settled in 1854 by a group of German immigrants. The city was named after a nearby creek, which was named after a large stone that was found in the creek bed. The stone was said to have been rolled by Native Americans in the area, and thus the name Rollingstone was born.
The city quickly grew in size and importance, becoming a major hub for the lumber industry. The city was also home to a number of mills, which provided employment for many of the city’s residents.
In the late 19th century, the city was home to a number of prominent businesses, including a brewery, a flour mill, and a brickyard. The city also had a number of churches, schools, and other civic organizations.
In the early 20th century, the city experienced a period of decline, as the lumber industry began to decline and the mills began to close. The city’s population began to decline as well, and by the 1950s, the city had become a small, rural community.
Geography
Rollingstone is located in the southeastern corner of Minnesota, on the banks of the Mississippi River. The city is situated in a valley, surrounded by rolling hills and bluffs. The city is located in a temperate climate, with hot summers and cold winters.
The city is home to a number of parks and recreational areas, including the Rollingstone Valley Park, which offers a variety of outdoor activities, such as hiking, biking, and fishing. The city is also home to a number of historic sites, including the historic Rollingstone Mill, which is now a museum.
Economy
The economy of Rollingstone is largely based on agriculture and tourism. The city is home to a number of farms, which produce a variety of crops, including corn, soybeans, and wheat. The city is also home to a number of wineries, which produce a variety of wines.
The city is also home to a number of small businesses, including restaurants, shops, and other services. The city is also home to a number of manufacturing companies, which produce a variety of products, including furniture, clothing, and electronics.
Demographics
As of the 2010 census, the population of Rollingstone was 1,072. The city is predominantly white, with a small percentage of African Americans, Hispanics, and other minorities. The median household income in the city is $45,000, and the median home value is $150,000.
The city is home to a number of churches, including the Rollingstone United Methodist Church, the Rollingstone Lutheran Church, and the Rollingstone Catholic Church. The city is also home to a number of schools, including the Rollingstone Elementary School, the Rollingstone Middle School, and the Rollingstone High School.
Conclusion
Rollingstone, Minnesota is a small city located in Winona County, in the southeastern corner of the state. The city is known for its rich history, diverse geography, and vibrant economy. The city is home to a number of farms, wineries, small businesses, and manufacturing companies, which provide employment for many of the city’s residents. The city is also home to a number of churches, schools, and other civic organizations. The population of Rollingstone is predominantly white, with a small percentage of African Americans, Hispanics, and other minorities. The median household income in the city is $45,000, and the median home value is $150,000.
Common Questions
What is Per Capita Income in Rollingstone?
Per Capita income in Rollingstone is $37,116.
What is the Median Family Income in Rollingstone?
Median Family Income in Rollingstone is $92,500.
What is the Median Household income in Rollingstone?
Median Household Income in Rollingstone is $87,000.
What is Income or Wage Gap in Rollingstone?
Income or Wage Gap in Rollingstone is 38.2%.
Women in Rollingstone earn 61.8 cents for every dollar earned by a man.
What is Inequality or Gini Index in Rollingstone?
Inequality or Gini Index in Rollingstone is 0.40.
What is the Total Population of Rollingstone?
Total Population of Rollingstone is 601.
What is the Total Male Population of Rollingstone?
Total Male Population of Rollingstone is 294.
What is the Total Female Population of Rollingstone?
Total Female Population of Rollingstone is 307.
What is the Ratio of Males per 100 Females in Rollingstone?
There are 95.77 Males per 100 Females in Rollingstone.
What is the Ratio of Females per 100 Males in Rollingstone?
There are 104.42 Females per 100 Males in Rollingstone.
What is the Median Population Age in Rollingstone?
Median Population Age in Rollingstone is 42.6 Years.
What is the Average Family Size in Rollingstone
Average Family Size in Rollingstone is 3.0 People.
What is the Average Household Size in Rollingstone
Average Household Size in Rollingstone is 2.7 People.
How Large is the Labor Force in Rollingstone?
There are 304 People in the Labor Forcein in Rollingstone.
What is the Percentage of People in the Labor Force in Rollingstone?
66.7% of People are in the Labor Force in Rollingstone.
What is the Unemployment Rate in Rollingstone?
Unemployment Rate in Rollingstone is 1.6%.