Lauderdale, MN Map & Demographics
Lauderdale Map
Lauderdale Overview
$42,250
PER CAPITA INCOME
$89,219
AVG FAMILY INCOME
$73,931
AVG HOUSEHOLD INCOME
22.1%
WAGE / INCOME GAP [ % ]
77.9¢/ $1
WAGE / INCOME GAP [ $ ]
0.34
INEQUALITY / GINI INDEX
2,454
TOTAL POPULATION
1,328
MALE POPULATION
1,126
FEMALE POPULATION
117.94
MALES / 100 FEMALES
84.79
FEMALES / 100 MALES
34.2
MEDIAN AGE
2.7
AVG FAMILY SIZE
1.9
AVG HOUSEHOLD SIZE
1,579
LABOR FORCE [ PEOPLE ]
71.6%
PERCENT IN LABOR FORCE
10.7%
UNEMPLOYMENT RATE
Income in Lauderdale
Income Overview in Lauderdale
Per Capita Income in Lauderdale is $42,250, while median incomes of families and households are $89,219 and $73,931 respectively.
| Characteristic | Number | Measure |
| Per Capita Income | 2,454 | $42,250 |
| Median Family Income | 527 | $89,219 |
| Mean Family Income | 527 | $99,246 |
| Median Household Income | 1,253 | $73,931 |
| Mean Household Income | 1,253 | $82,468 |
| Income Deficit | 527 | $0 |
| Wage / Income Gap (%) | 2,454 | 22.13% |
| Wage / Income Gap ($) | 2,454 | 77.87¢ per $1 |
| Gini / Inequality Index | 2,454 | 0.34 |
Earnings by Sex in Lauderdale
Average Earnings in Lauderdale are $45,373, $47,610 for men and $37,074 for women, a difference of 22.1%.

| Sex | Number | Average Earnings |
| Male | 825 (52.7%) | $47,610 |
| Female | 739 (47.2%) | $37,074 |
| Total | 1,564 (100.0%) | $45,373 |
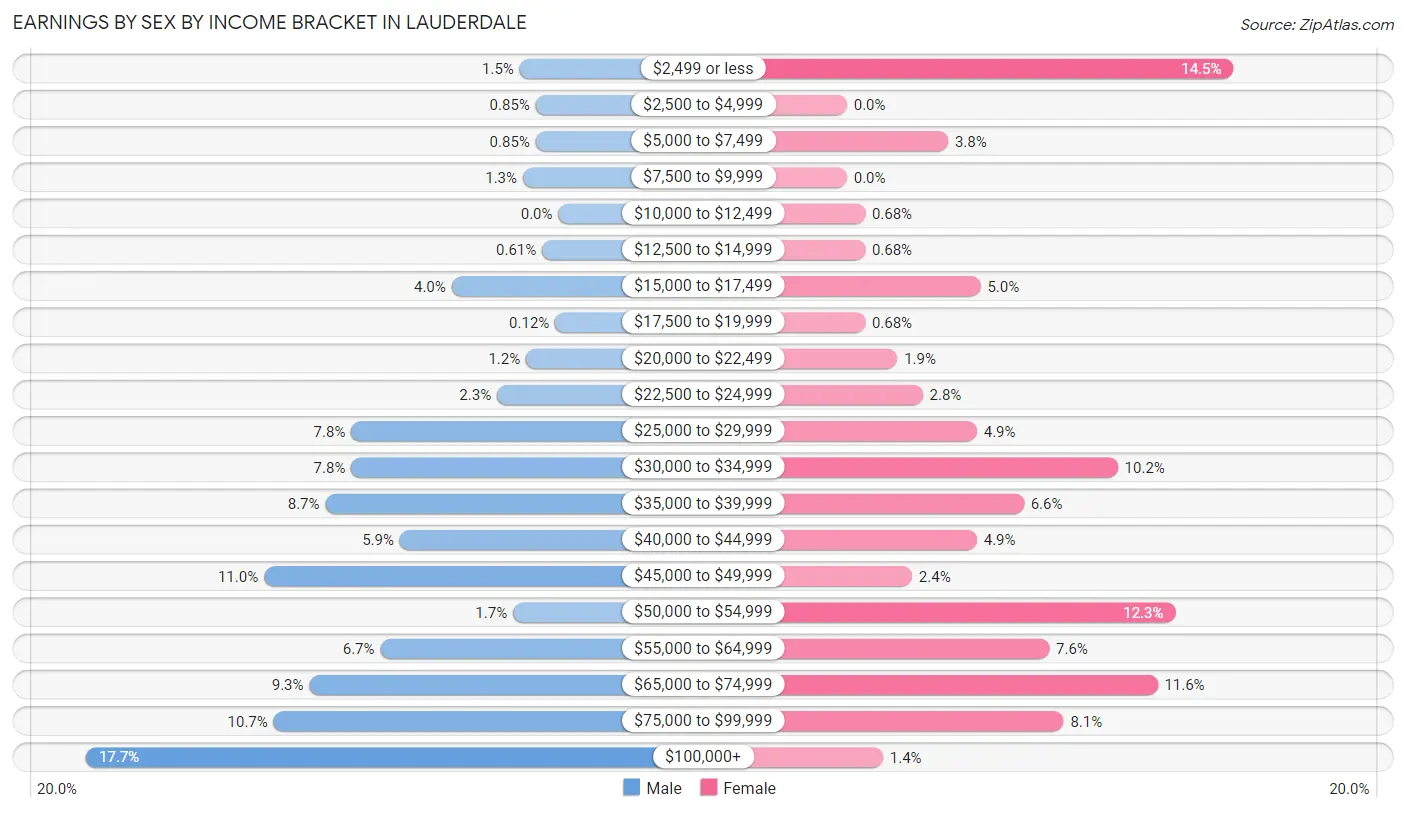
Earnings by Sex by Income Bracket in Lauderdale
The most common earnings brackets in Lauderdale are $100,000+ for men (146 | 17.7%) and $2,499 or less for women (107 | 14.5%).
| Income | Male | Female |
| $2,499 or less | 12 (1.5%) | 107 (14.5%) |
| $2,500 to $4,999 | 7 (0.9%) | 0 (0.0%) |
| $5,000 to $7,499 | 7 (0.9%) | 28 (3.8%) |
| $7,500 to $9,999 | 11 (1.3%) | 0 (0.0%) |
| $10,000 to $12,499 | 0 (0.0%) | 5 (0.7%) |
| $12,500 to $14,999 | 5 (0.6%) | 5 (0.7%) |
| $15,000 to $17,499 | 33 (4.0%) | 37 (5.0%) |
| $17,500 to $19,999 | 1 (0.1%) | 5 (0.7%) |
| $20,000 to $22,499 | 10 (1.2%) | 14 (1.9%) |
| $22,500 to $24,999 | 19 (2.3%) | 21 (2.8%) |
| $25,000 to $29,999 | 64 (7.8%) | 36 (4.9%) |
| $30,000 to $34,999 | 64 (7.8%) | 75 (10.2%) |
| $35,000 to $39,999 | 72 (8.7%) | 49 (6.6%) |
| $40,000 to $44,999 | 49 (5.9%) | 36 (4.9%) |
| $45,000 to $49,999 | 91 (11.0%) | 18 (2.4%) |
| $50,000 to $54,999 | 14 (1.7%) | 91 (12.3%) |
| $55,000 to $64,999 | 55 (6.7%) | 56 (7.6%) |
| $65,000 to $74,999 | 77 (9.3%) | 86 (11.6%) |
| $75,000 to $99,999 | 88 (10.7%) | 60 (8.1%) |
| $100,000+ | 146 (17.7%) | 10 (1.3%) |
| Total | 825 (100.0%) | 739 (100.0%) |
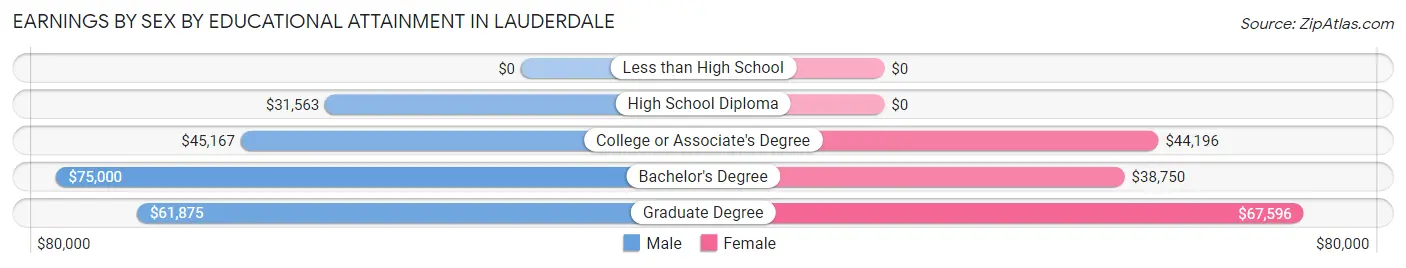
Earnings by Sex by Educational Attainment in Lauderdale
Average earnings in Lauderdale are $58,450 for men and $50,646 for women, a difference of 13.4%. Men with an educational attainment of bachelor's degree enjoy the highest average annual earnings of $75,000, while those with high school diploma education earn the least with $31,563. Women with an educational attainment of graduate degree earn the most with the average annual earnings of $67,596, while those with bachelor's degree education have the smallest earnings of $38,750.
| Educational Attainment | Male Income | Female Income |
| Less than High School | - | - |
| High School Diploma | $31,563 | $0 |
| College or Associate's Degree | $45,167 | $44,196 |
| Bachelor's Degree | $75,000 | $38,750 |
| Graduate Degree | $61,875 | $67,596 |
| Total | $58,450 | $50,646 |
Family Income in Lauderdale
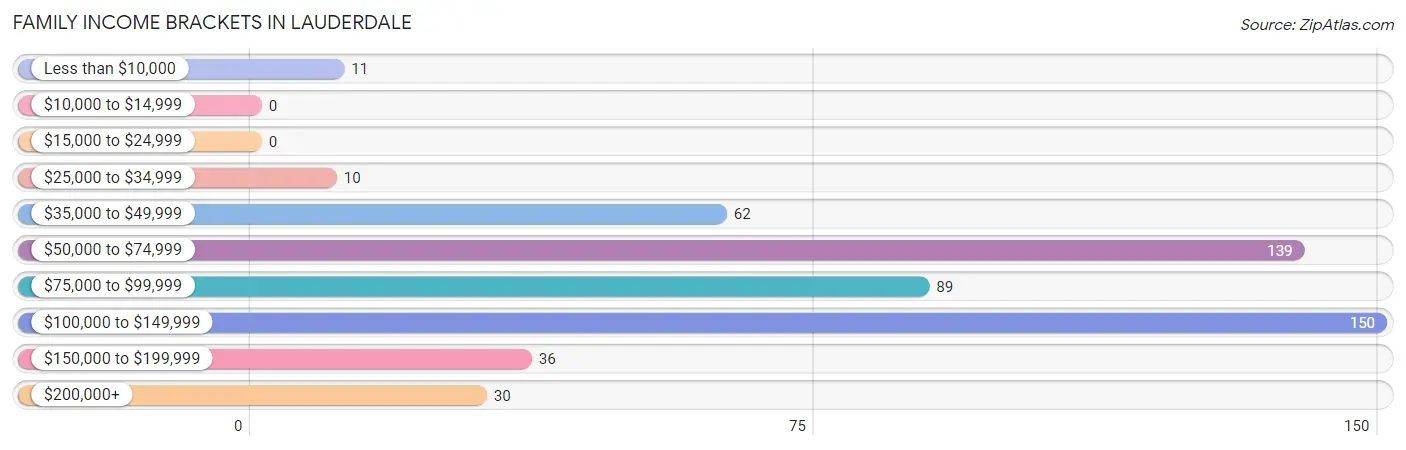
Family Income Brackets in Lauderdale
According to the Lauderdale family income data, there are 150 families falling into the $100,000 to $149,999 income range, which is the most common income bracket and makes up 28.5% of all families.
| Income Bracket | # Families | % Families |
| Less than $10,000 | 11 | 2.1% |
| $10,000 to $14,999 | 0 | 0.0% |
| $15,000 to $24,999 | 0 | 0.0% |
| $25,000 to $34,999 | 10 | 1.9% |
| $35,000 to $49,999 | 62 | 11.8% |
| $50,000 to $74,999 | 139 | 26.4% |
| $75,000 to $99,999 | 89 | 16.9% |
| $100,000 to $149,999 | 150 | 28.5% |
| $150,000 to $199,999 | 36 | 6.8% |
| $200,000+ | 30 | 5.7% |
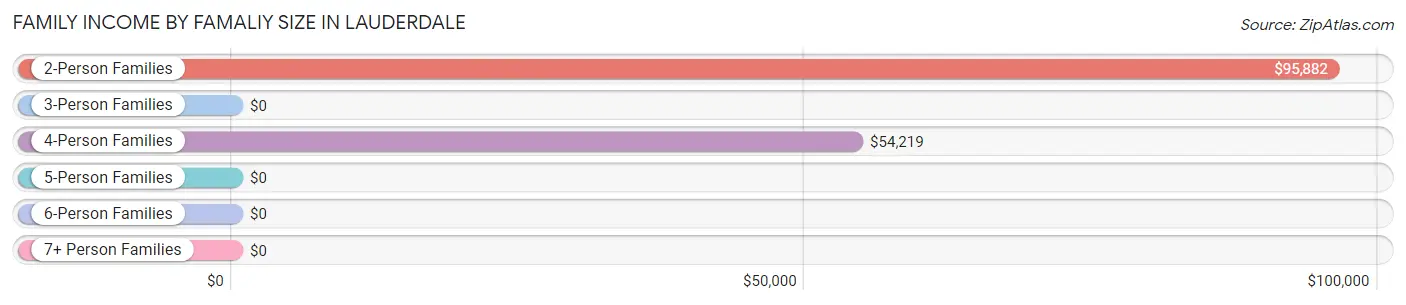
Family Income by Famaliy Size in Lauderdale
2-person families (322 | 61.1%) account for the highest median family income in Lauderdale with $95,882 per family, while 2-person families (322 | 61.1%) have the highest median income of $47,941 per family member.
| Income Bracket | # Families | Median Income |
| 2-Person Families | 322 (61.1%) | $95,882 |
| 3-Person Families | 122 (23.2%) | $0 |
| 4-Person Families | 63 (11.9%) | $54,219 |
| 5-Person Families | 1 (0.2%) | $0 |
| 6-Person Families | 15 (2.9%) | $0 |
| 7+ Person Families | 4 (0.8%) | $0 |
| Total | 527 (100.0%) | $89,219 |
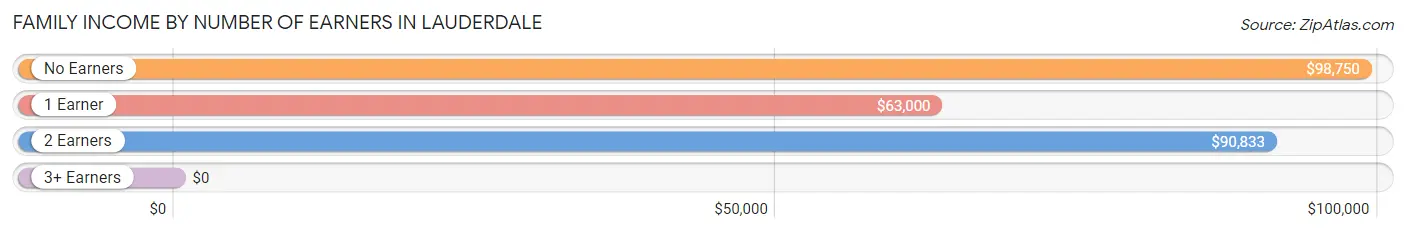
Family Income by Number of Earners in Lauderdale
| Number of Earners | # Families | Median Income |
| No Earners | 173 (32.8%) | $98,750 |
| 1 Earner | 86 (16.3%) | $63,000 |
| 2 Earners | 248 (47.1%) | $90,833 |
| 3+ Earners | 20 (3.8%) | $0 |
| Total | 527 (100.0%) | $89,219 |
Household Income in Lauderdale
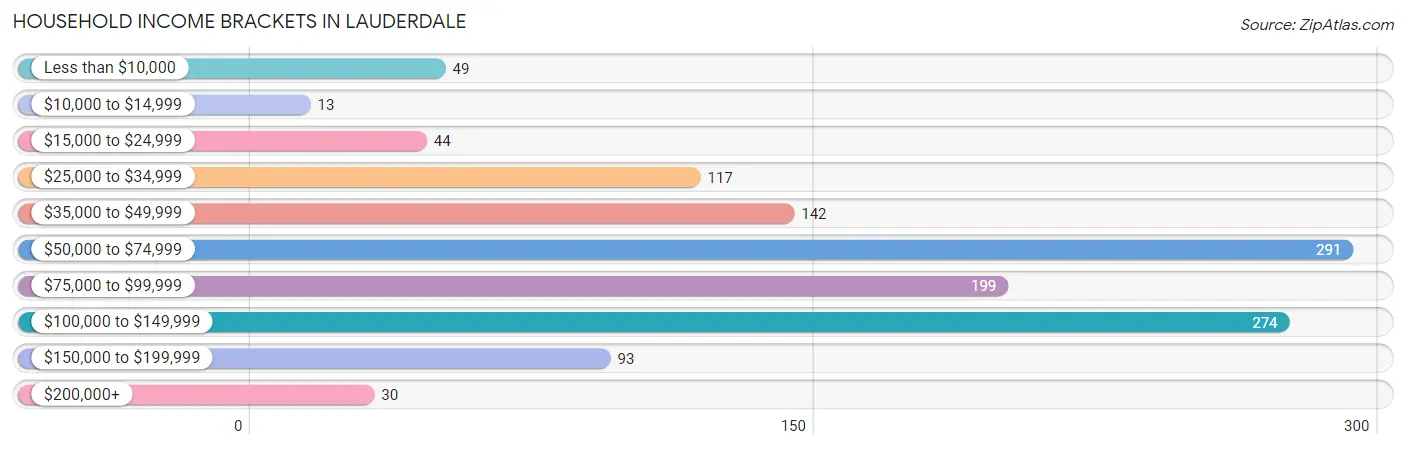
Household Income Brackets in Lauderdale
With 291 households falling in the category, the $50,000 to $74,999 income range is the most frequent in Lauderdale, accounting for 23.2% of all households. In contrast, only 13 households (1.0%) fall into the $10,000 to $14,999 income bracket, making it the least populous group.
| Income Bracket | # Households | % Households |
| Less than $10,000 | 49 | 3.9% |
| $10,000 to $14,999 | 13 | 1.0% |
| $15,000 to $24,999 | 44 | 3.5% |
| $25,000 to $34,999 | 117 | 9.3% |
| $35,000 to $49,999 | 142 | 11.3% |
| $50,000 to $74,999 | 291 | 23.2% |
| $75,000 to $99,999 | 199 | 15.9% |
| $100,000 to $149,999 | 274 | 21.9% |
| $150,000 to $199,999 | 93 | 7.4% |
| $200,000+ | 30 | 2.4% |
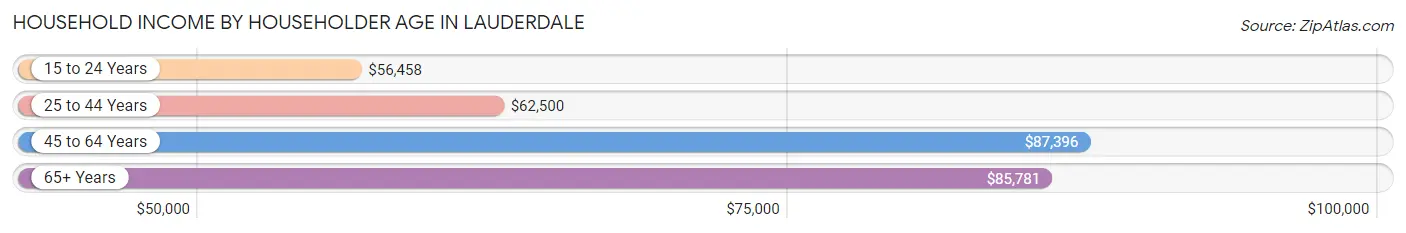
Household Income by Householder Age in Lauderdale
The median household income in Lauderdale is $73,931, with the highest median household income of $87,396 found in the 45 to 64 years age bracket for the primary householder. A total of 291 households (23.2%) fall into this category. Meanwhile, the 15 to 24 years age bracket for the primary householder has the lowest median household income of $56,458, with 69 households (5.5%) in this group.
| Income Bracket | # Households | Median Income |
| 15 to 24 Years | 69 (5.5%) | $56,458 |
| 25 to 44 Years | 570 (45.5%) | $62,500 |
| 45 to 64 Years | 291 (23.2%) | $87,396 |
| 65+ Years | 323 (25.8%) | $85,781 |
| Total | 1,253 (100.0%) | $73,931 |
Poverty in Lauderdale
Income Below Poverty by Sex and Age in Lauderdale
With 6.6% poverty level for males and 5.3% for females among the residents of Lauderdale, 18 to 24 year old males and 18 to 24 year old females are the most vulnerable to poverty, with 26 males (20.5%) and 26 females (14.4%) in their respective age groups living below the poverty level.
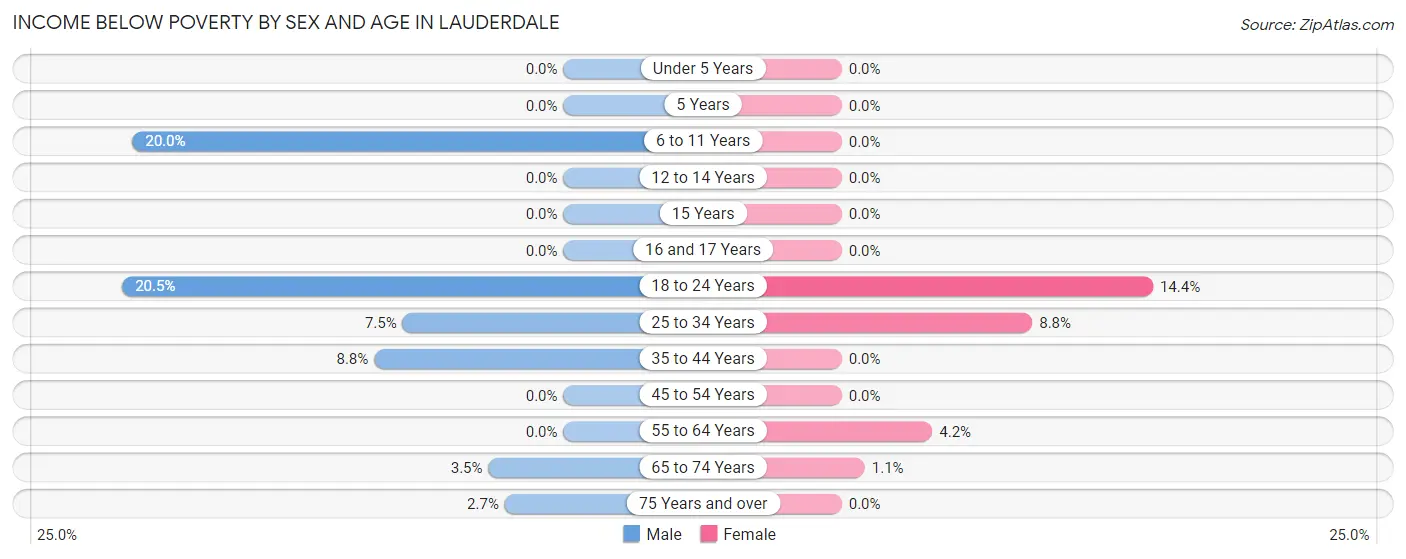
| Age Bracket | Male | Female |
| Under 5 Years | 0 (0.0%) | 0 (0.0%) |
| 5 Years | 0 (0.0%) | 0 (0.0%) |
| 6 to 11 Years | 10 (20.0%) | 0 (0.0%) |
| 12 to 14 Years | 0 (0.0%) | 0 (0.0%) |
| 15 Years | 0 (0.0%) | 0 (0.0%) |
| 16 and 17 Years | 0 (0.0%) | 0 (0.0%) |
| 18 to 24 Years | 26 (20.5%) | 26 (14.4%) |
| 25 to 34 Years | 25 (7.5%) | 26 (8.8%) |
| 35 to 44 Years | 18 (8.8%) | 0 (0.0%) |
| 45 to 54 Years | 0 (0.0%) | 0 (0.0%) |
| 55 to 64 Years | 0 (0.0%) | 6 (4.2%) |
| 65 to 74 Years | 4 (3.5%) | 2 (1.1%) |
| 75 Years and over | 4 (2.7%) | 0 (0.0%) |
| Total | 87 (6.6%) | 60 (5.3%) |
Income Above Poverty by Sex and Age in Lauderdale
According to the poverty statistics in Lauderdale, males aged under 5 years and females aged under 5 years are the age groups that are most secure financially, with 100.0% of males and 100.0% of females in these age groups living above the poverty line.
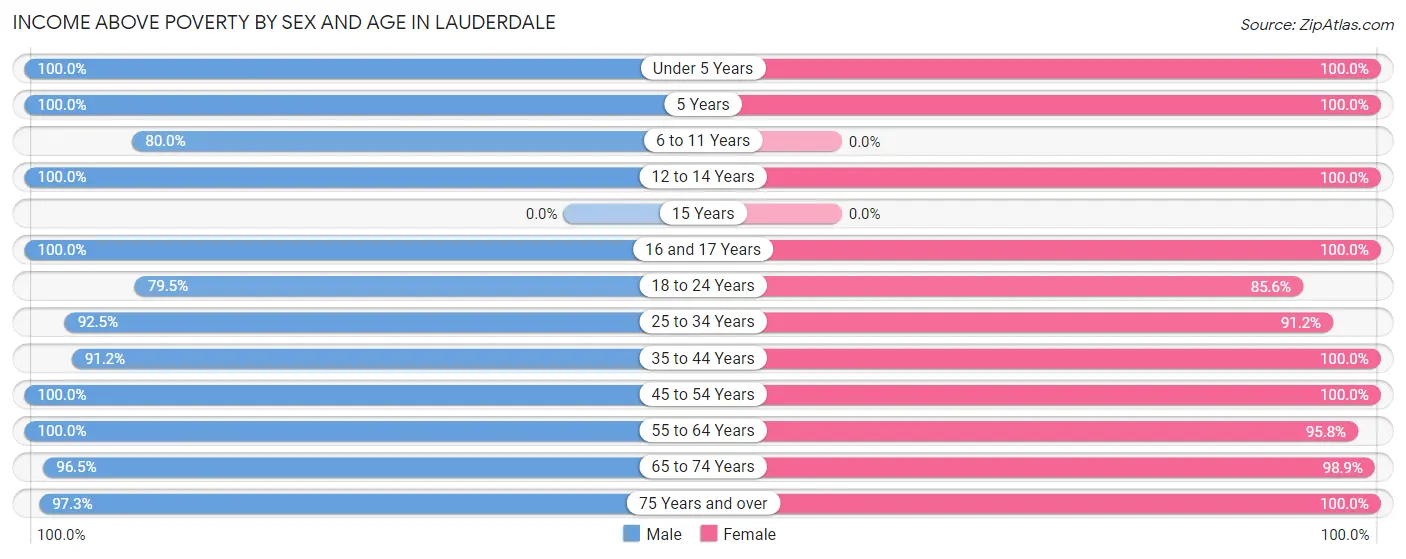
| Age Bracket | Male | Female |
| Under 5 Years | 68 (100.0%) | 53 (100.0%) |
| 5 Years | 19 (100.0%) | 15 (100.0%) |
| 6 to 11 Years | 40 (80.0%) | 0 (0.0%) |
| 12 to 14 Years | 18 (100.0%) | 17 (100.0%) |
| 15 Years | 0 (0.0%) | 0 (0.0%) |
| 16 and 17 Years | 55 (100.0%) | 3 (100.0%) |
| 18 to 24 Years | 101 (79.5%) | 154 (85.6%) |
| 25 to 34 Years | 310 (92.5%) | 268 (91.2%) |
| 35 to 44 Years | 187 (91.2%) | 106 (100.0%) |
| 45 to 54 Years | 94 (100.0%) | 78 (100.0%) |
| 55 to 64 Years | 86 (100.0%) | 137 (95.8%) |
| 65 to 74 Years | 111 (96.5%) | 185 (98.9%) |
| 75 Years and over | 143 (97.3%) | 50 (100.0%) |
| Total | 1,232 (93.4%) | 1,066 (94.7%) |
Income Below Poverty Among Married-Couple Families in Lauderdale
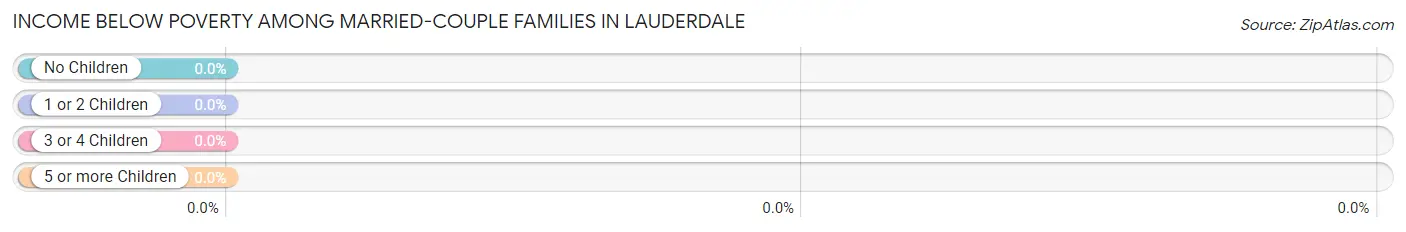
| Children | Above Poverty | Below Poverty |
| No Children | 250 (100.0%) | 0 (0.0%) |
| 1 or 2 Children | 100 (100.0%) | 0 (0.0%) |
| 3 or 4 Children | 20 (100.0%) | 0 (0.0%) |
| 5 or more Children | 0 (0.0%) | 0 (0.0%) |
| Total | 370 (100.0%) | 0 (0.0%) |
Income Below Poverty Among Single-Parent Households in Lauderdale
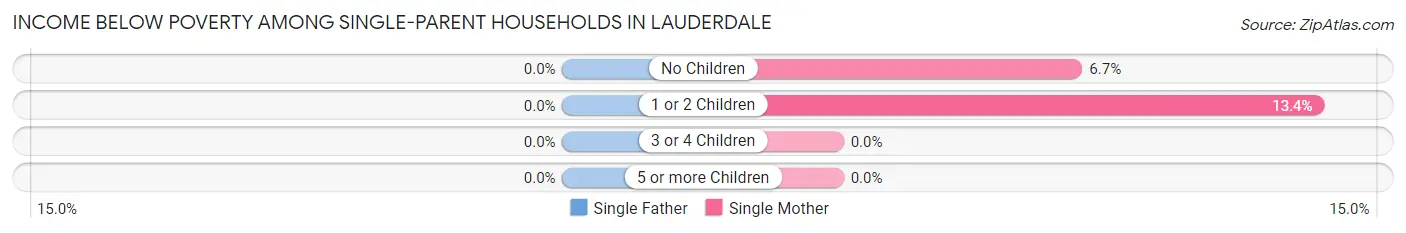
| Children | Single Father | Single Mother |
| No Children | 0 (0.0%) | 2 (6.7%) |
| 1 or 2 Children | 0 (0.0%) | 9 (13.4%) |
| 3 or 4 Children | 0 (0.0%) | 0 (0.0%) |
| 5 or more Children | 0 (0.0%) | 0 (0.0%) |
| Total | 0 (0.0%) | 11 (11.3%) |
Income Below Poverty Among Married-Couple vs Single-Parent Households in Lauderdale
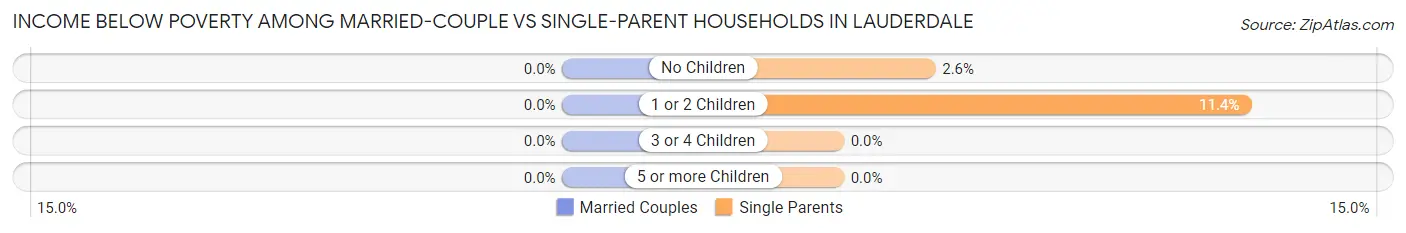
| Children | Married-Couple Families | Single-Parent Households |
| No Children | 0 (0.0%) | 2 (2.6%) |
| 1 or 2 Children | 0 (0.0%) | 9 (11.4%) |
| 3 or 4 Children | 0 (0.0%) | 0 (0.0%) |
| 5 or more Children | 0 (0.0%) | 0 (0.0%) |
| Total | 0 (0.0%) | 11 (7.0%) |
Race in Lauderdale
The most populous races in Lauderdale are White / Caucasian (1,649 | 67.2%), Asian (329 | 13.4%), and Two or more Races (279 | 11.4%).
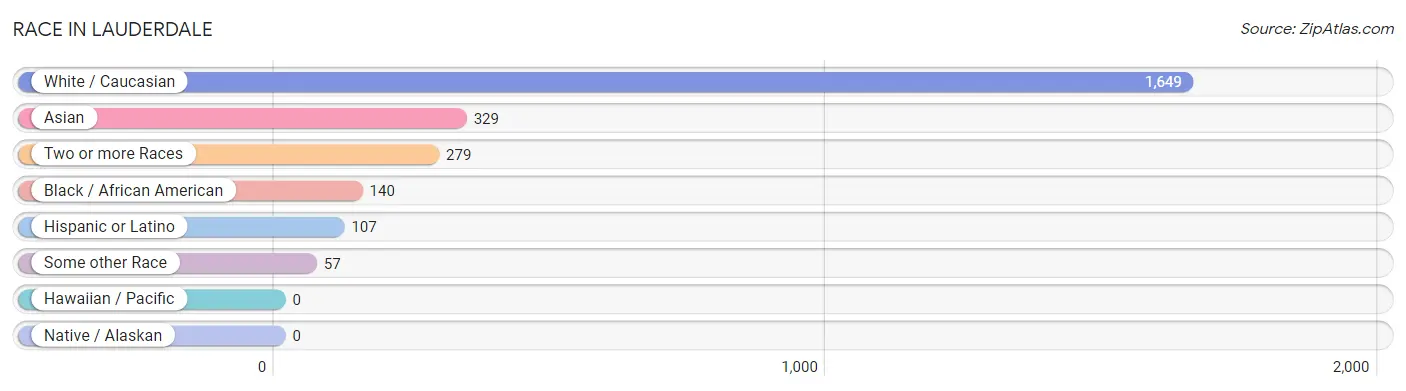
| Race | # Population | % Population |
| Asian | 329 | 13.4% |
| Black / African American | 140 | 5.7% |
| Hawaiian / Pacific | 0 | 0.0% |
| Hispanic or Latino | 107 | 4.4% |
| Native / Alaskan | 0 | 0.0% |
| White / Caucasian | 1,649 | 67.2% |
| Two or more Races | 279 | 11.4% |
| Some other Race | 57 | 2.3% |
| Total | 2,454 | 100.0% |
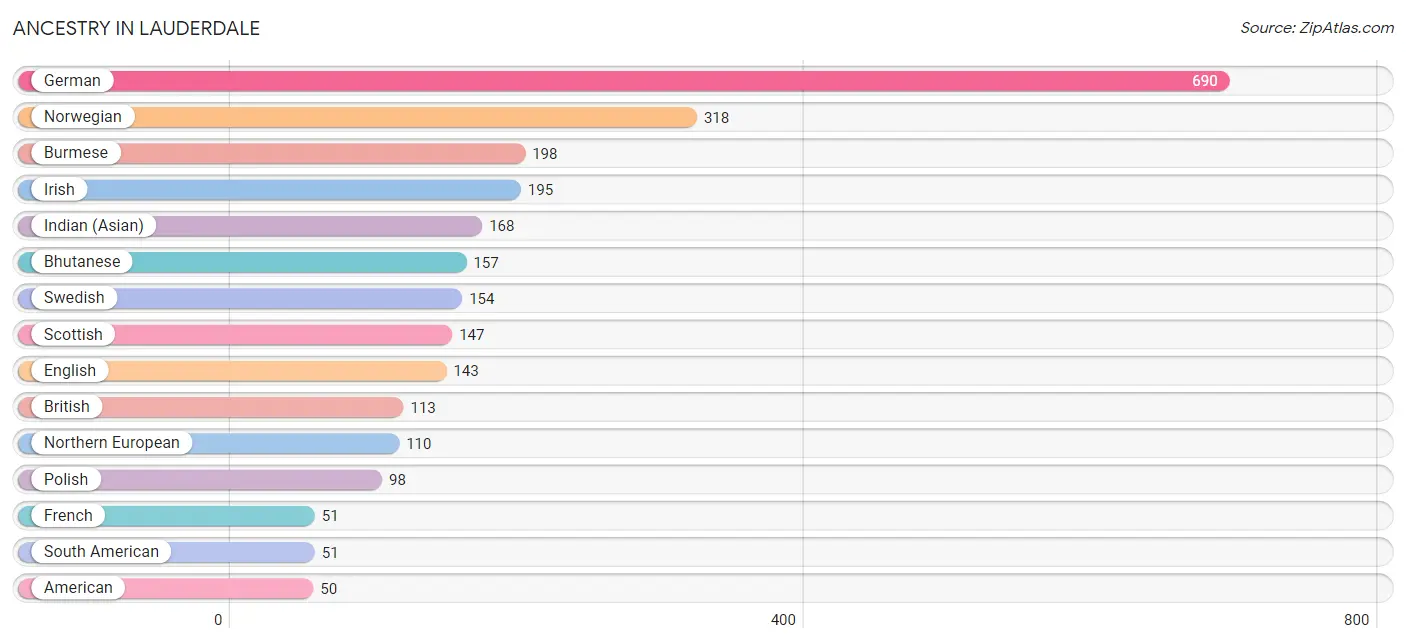
Ancestry in Lauderdale
The most populous ancestries reported in Lauderdale are German (690 | 28.1%), Norwegian (318 | 13.0%), Burmese (198 | 8.1%), Irish (195 | 8.0%), and Indian (Asian) (168 | 6.9%), together accounting for 63.9% of all Lauderdale residents.
| Ancestry | # Population | % Population |
| American | 50 | 2.0% |
| Argentinean | 27 | 1.1% |
| Austrian | 6 | 0.2% |
| Bangladeshi | 34 | 1.4% |
| Bhutanese | 157 | 6.4% |
| Blackfeet | 14 | 0.6% |
| British | 113 | 4.6% |
| Bulgarian | 13 | 0.5% |
| Burmese | 198 | 8.1% |
| Canadian | 11 | 0.4% |
| Central American | 21 | 0.9% |
| Chippewa | 22 | 0.9% |
| Choctaw | 14 | 0.6% |
| Colombian | 24 | 1.0% |
| Croatian | 16 | 0.6% |
| Czech | 26 | 1.1% |
| Czechoslovakian | 9 | 0.4% |
| Danish | 9 | 0.4% |
| Dutch | 15 | 0.6% |
| Eastern European | 5 | 0.2% |
| English | 143 | 5.8% |
| Ethiopian | 32 | 1.3% |
| European | 9 | 0.4% |
| Finnish | 27 | 1.1% |
| French | 51 | 2.1% |
| French Canadian | 4 | 0.2% |
| German | 690 | 28.1% |
| Greek | 20 | 0.8% |
| Hungarian | 11 | 0.4% |
| Indian (Asian) | 168 | 6.9% |
| Irish | 195 | 8.0% |
| Italian | 27 | 1.1% |
| Jamaican | 8 | 0.3% |
| Korean | 11 | 0.4% |
| Lithuanian | 5 | 0.2% |
| Luxembourger | 14 | 0.6% |
| Malaysian | 5 | 0.2% |
| Mexican | 29 | 1.2% |
| Nigerian | 10 | 0.4% |
| Northern European | 110 | 4.5% |
| Norwegian | 318 | 13.0% |
| Panamanian | 21 | 0.9% |
| Polish | 98 | 4.0% |
| Portuguese | 5 | 0.2% |
| Puerto Rican | 6 | 0.2% |
| Russian | 4 | 0.2% |
| Scandinavian | 27 | 1.1% |
| Scotch-Irish | 14 | 0.6% |
| Scottish | 147 | 6.0% |
| Slovak | 6 | 0.2% |
| Slovene | 1 | 0.0% |
| South American | 51 | 2.1% |
| Sri Lankan | 32 | 1.3% |
| Subsaharan African | 42 | 1.7% |
| Swedish | 154 | 6.3% |
| Swiss | 16 | 0.6% |
| Turkish | 19 | 0.8% |
| Ukrainian | 7 | 0.3% | View All 58 Rows |
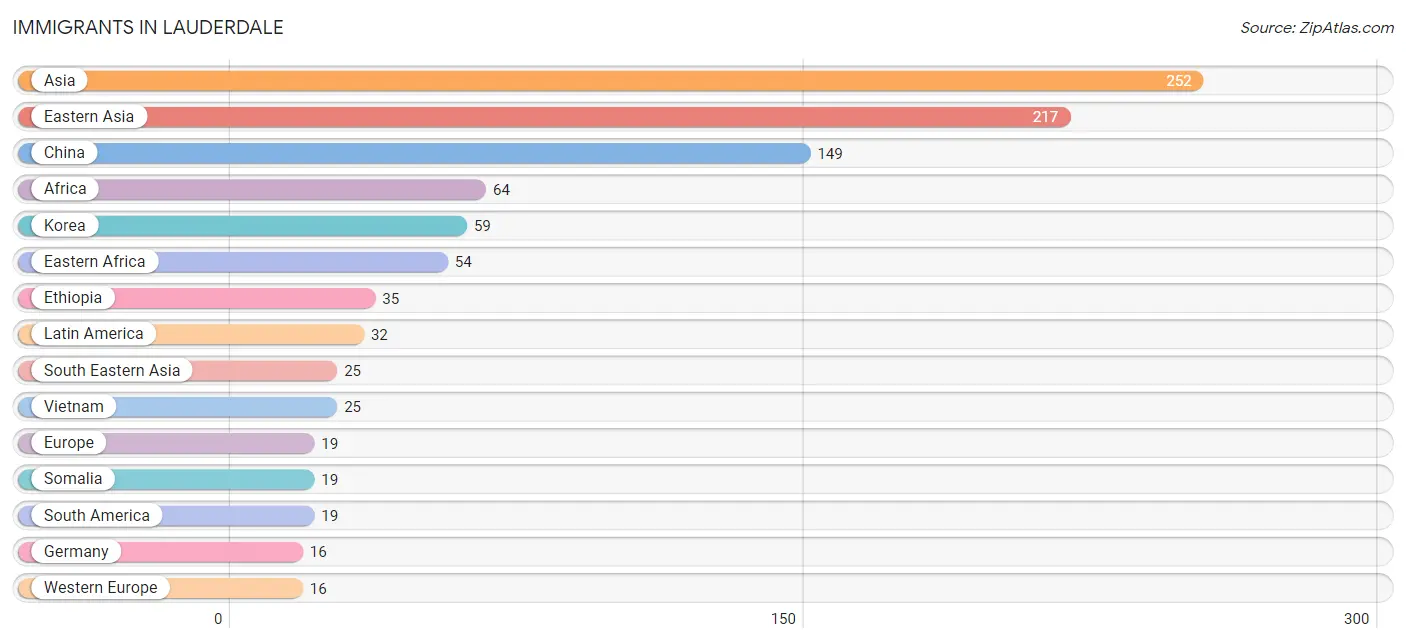
Immigrants in Lauderdale
The most numerous immigrant groups reported in Lauderdale came from Asia (252 | 10.3%), Eastern Asia (217 | 8.8%), China (149 | 6.1%), Africa (64 | 2.6%), and Korea (59 | 2.4%), together accounting for 30.2% of all Lauderdale residents.
| Immigration Origin | # Population | % Population |
| Africa | 64 | 2.6% |
| Argentina | 8 | 0.3% |
| Asia | 252 | 10.3% |
| Australia | 7 | 0.3% |
| Brazil | 5 | 0.2% |
| Canada | 4 | 0.2% |
| Caribbean | 8 | 0.3% |
| Central America | 5 | 0.2% |
| China | 149 | 6.1% |
| Colombia | 6 | 0.2% |
| Eastern Africa | 54 | 2.2% |
| Eastern Asia | 217 | 8.8% |
| Ethiopia | 35 | 1.4% |
| Europe | 19 | 0.8% |
| Germany | 16 | 0.6% |
| Jamaica | 8 | 0.3% |
| Japan | 9 | 0.4% |
| Korea | 59 | 2.4% |
| Latin America | 32 | 1.3% |
| Mexico | 5 | 0.2% |
| Nigeria | 10 | 0.4% |
| Northern Europe | 3 | 0.1% |
| Oceania | 7 | 0.3% |
| Somalia | 19 | 0.8% |
| South America | 19 | 0.8% |
| South Eastern Asia | 25 | 1.0% |
| Turkey | 10 | 0.4% |
| Vietnam | 25 | 1.0% |
| Western Africa | 10 | 0.4% |
| Western Asia | 10 | 0.4% |
| Western Europe | 16 | 0.6% | View All 31 Rows |
Sex and Age in Lauderdale
Sex and Age in Lauderdale
The most populous age groups in Lauderdale are 25 to 29 Years (201 | 15.1%) for men and 25 to 29 Years (165 | 14.6%) for women.
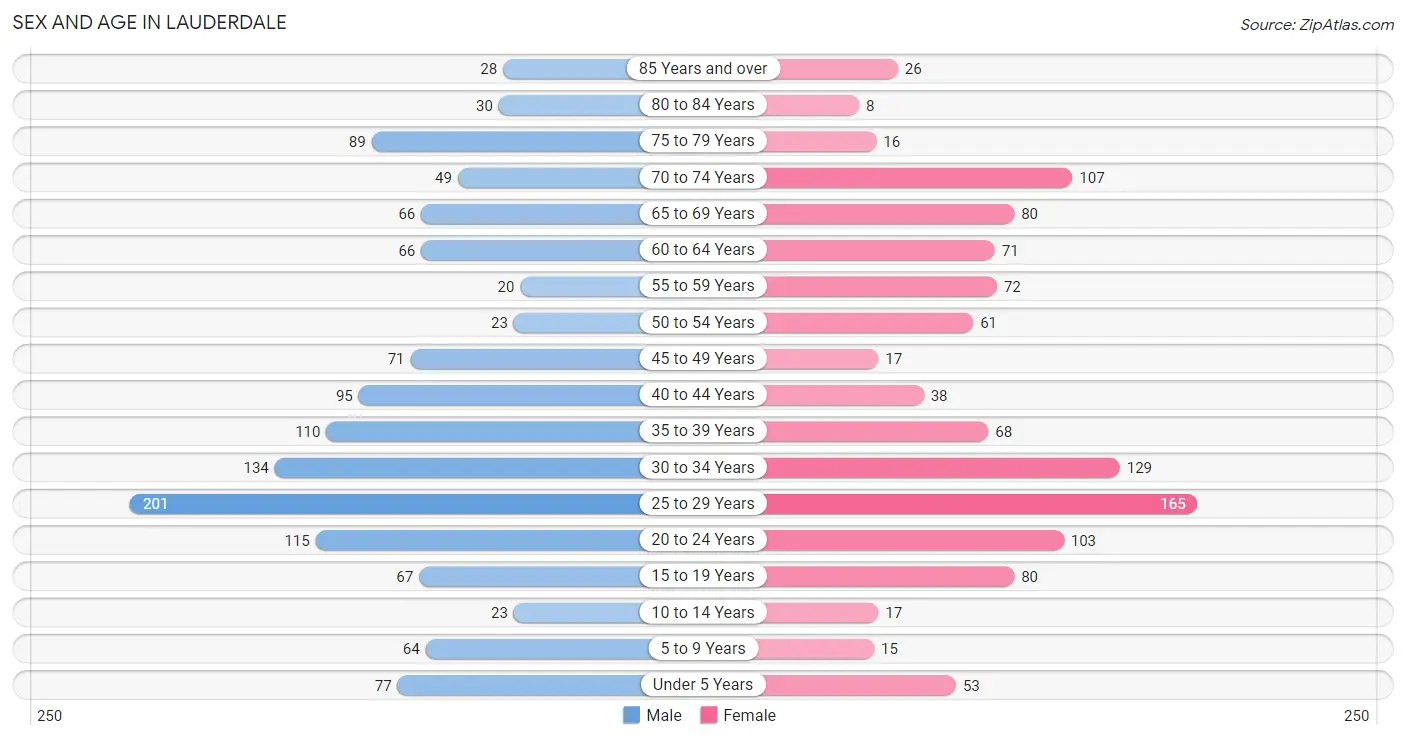
| Age Bracket | Male | Female |
| Under 5 Years | 77 (5.8%) | 53 (4.7%) |
| 5 to 9 Years | 64 (4.8%) | 15 (1.3%) |
| 10 to 14 Years | 23 (1.7%) | 17 (1.5%) |
| 15 to 19 Years | 67 (5.1%) | 80 (7.1%) |
| 20 to 24 Years | 115 (8.7%) | 103 (9.1%) |
| 25 to 29 Years | 201 (15.1%) | 165 (14.6%) |
| 30 to 34 Years | 134 (10.1%) | 129 (11.5%) |
| 35 to 39 Years | 110 (8.3%) | 68 (6.0%) |
| 40 to 44 Years | 95 (7.1%) | 38 (3.4%) |
| 45 to 49 Years | 71 (5.3%) | 17 (1.5%) |
| 50 to 54 Years | 23 (1.7%) | 61 (5.4%) |
| 55 to 59 Years | 20 (1.5%) | 72 (6.4%) |
| 60 to 64 Years | 66 (5.0%) | 71 (6.3%) |
| 65 to 69 Years | 66 (5.0%) | 80 (7.1%) |
| 70 to 74 Years | 49 (3.7%) | 107 (9.5%) |
| 75 to 79 Years | 89 (6.7%) | 16 (1.4%) |
| 80 to 84 Years | 30 (2.3%) | 8 (0.7%) |
| 85 Years and over | 28 (2.1%) | 26 (2.3%) |
| Total | 1,328 (100.0%) | 1,126 (100.0%) |
Families and Households in Lauderdale
Median Family Size in Lauderdale
The median family size in Lauderdale is 2.67 persons per family, with single female/mother families (97 | 18.4%) accounting for the largest median family size of 2.79 persons per family. On the other hand, single male/father families (60 | 11.4%) represent the smallest median family size with 2.10 persons per family.
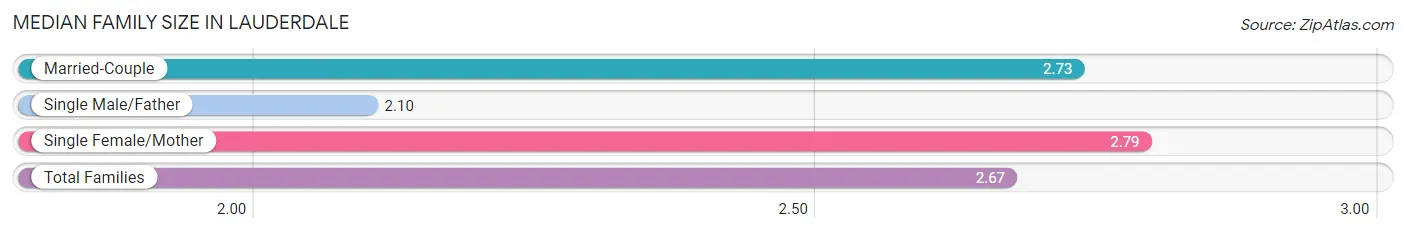
| Family Type | # Families | Family Size |
| Married-Couple | 370 (70.2%) | 2.73 |
| Single Male/Father | 60 (11.4%) | 2.10 |
| Single Female/Mother | 97 (18.4%) | 2.79 |
| Total Families | 527 (100.0%) | 2.67 |
Median Household Size in Lauderdale
The median household size in Lauderdale is 1.95 persons per household, with single female/mother households (97 | 7.7%) accounting for the largest median household size of 2.93 persons per household. non-family households (726 | 57.9%) represent the smallest median household size with 1.38 persons per household.
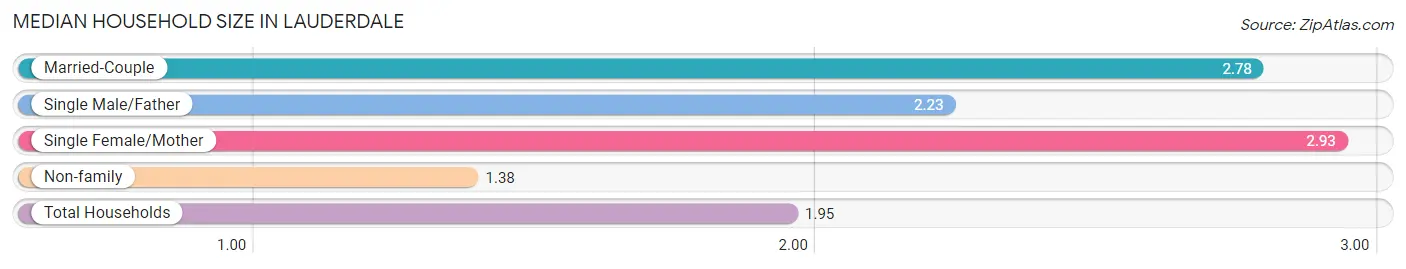
| Household Type | # Households | Household Size |
| Married-Couple | 370 (29.5%) | 2.78 |
| Single Male/Father | 60 (4.8%) | 2.23 |
| Single Female/Mother | 97 (7.7%) | 2.93 |
| Non-family | 726 (57.9%) | 1.38 |
| Total Households | 1,253 (100.0%) | 1.95 |
Household Size by Marriage Status in Lauderdale
Out of a total of 1,253 households in Lauderdale, 527 (42.1%) are family households, while 726 (57.9%) are nonfamily households. The most numerous type of family households are 2-person households, comprising 290, and the most common type of nonfamily households are 1-person households, comprising 534.
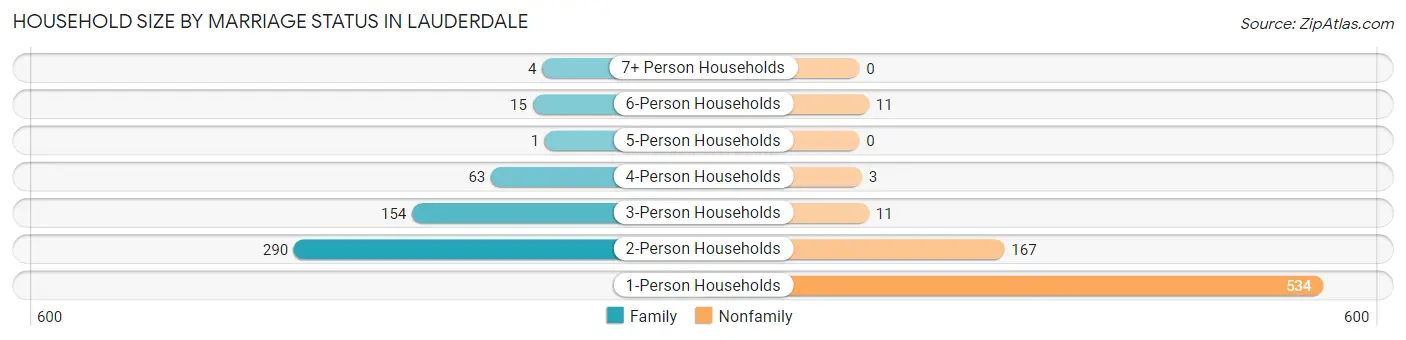
| Household Size | Family Households | Nonfamily Households |
| 1-Person Households | - | 534 (42.6%) |
| 2-Person Households | 290 (23.1%) | 167 (13.3%) |
| 3-Person Households | 154 (12.3%) | 11 (0.9%) |
| 4-Person Households | 63 (5.0%) | 3 (0.2%) |
| 5-Person Households | 1 (0.1%) | 0 (0.0%) |
| 6-Person Households | 15 (1.2%) | 11 (0.9%) |
| 7+ Person Households | 4 (0.3%) | 0 (0.0%) |
| Total | 527 (42.1%) | 726 (57.9%) |
Female Fertility in Lauderdale
Fertility by Age in Lauderdale
Average fertility rate in Lauderdale is 64.0 births per 1,000 women. Women in the age bracket of 35 to 50 years have the highest fertility rate with 117.0 births per 1,000 women. Women in the age bracket of 20 to 34 years acount for 61.5% of all women with births.
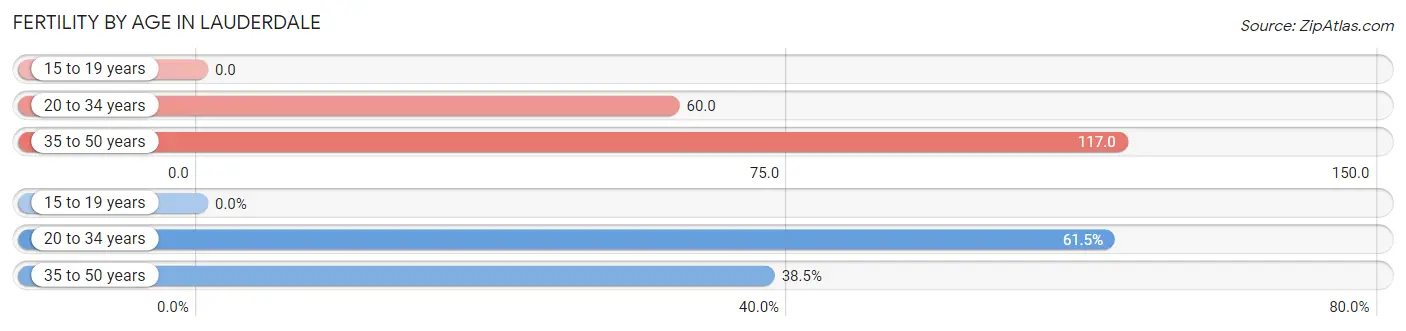
| Age Bracket | Women with Births | Births / 1,000 Women |
| 15 to 19 years | 0 (0.0%) | 0.0 |
| 20 to 34 years | 24 (61.5%) | 60.0 |
| 35 to 50 years | 15 (38.5%) | 117.0 |
| Total | 39 (100.0%) | 64.0 |
Fertility by Age by Marriage Status in Lauderdale
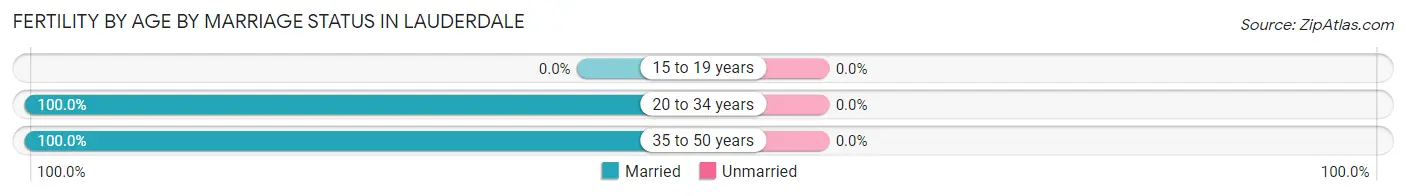
| Age Bracket | Married | Unmarried |
| 15 to 19 years | 0 (0.0%) | 0 (0.0%) |
| 20 to 34 years | 24 (100.0%) | 0 (0.0%) |
| 35 to 50 years | 15 (100.0%) | 0 (0.0%) |
| Total | 39 (100.0%) | 0 (0.0%) |
Fertility by Education in Lauderdale
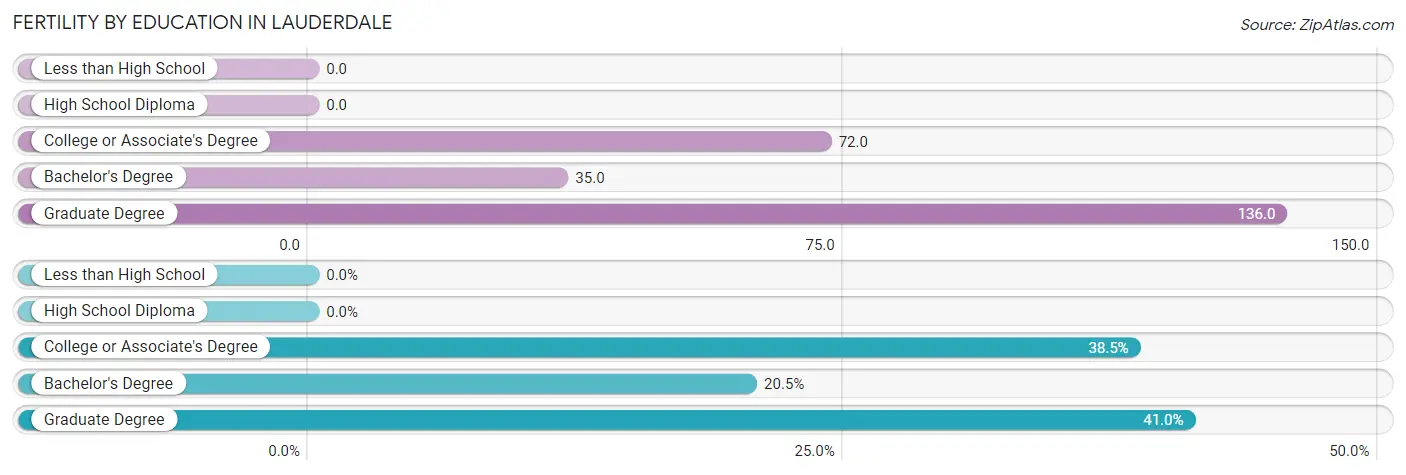
| Educational Attainment | Women with Births | Births / 1,000 Women |
| Less than High School | 0 (0.0%) | 0.0 |
| High School Diploma | 0 (0.0%) | 0.0 |
| College or Associate's Degree | 15 (38.5%) | 72.0 |
| Bachelor's Degree | 8 (20.5%) | 35.0 |
| Graduate Degree | 16 (41.0%) | 136.0 |
| Total | 39 (100.0%) | 64.0 |
Fertility by Education by Marriage Status in Lauderdale
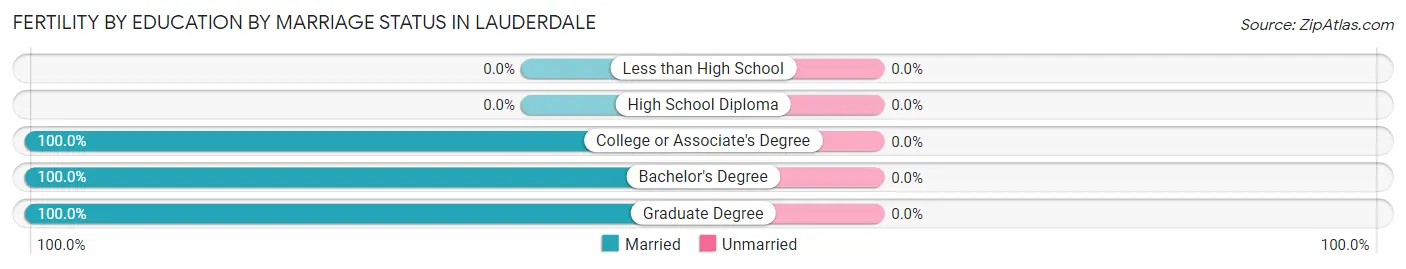
| Educational Attainment | Married | Unmarried |
| Less than High School | 0 (0.0%) | 0 (0.0%) |
| High School Diploma | 0 (0.0%) | 0 (0.0%) |
| College or Associate's Degree | 15 (100.0%) | 0 (0.0%) |
| Bachelor's Degree | 8 (100.0%) | 0 (0.0%) |
| Graduate Degree | 16 (100.0%) | 0 (0.0%) |
| Total | 39 (100.0%) | 0 (0.0%) |
Employment Characteristics in Lauderdale
Employment by Class of Employer in Lauderdale
Among the 1,375 employed individuals in Lauderdale, private company employees (761 | 55.3%), not-for-profit organizations (225 | 16.4%), and state government employees (177 | 12.9%) make up the most common classes of employment.
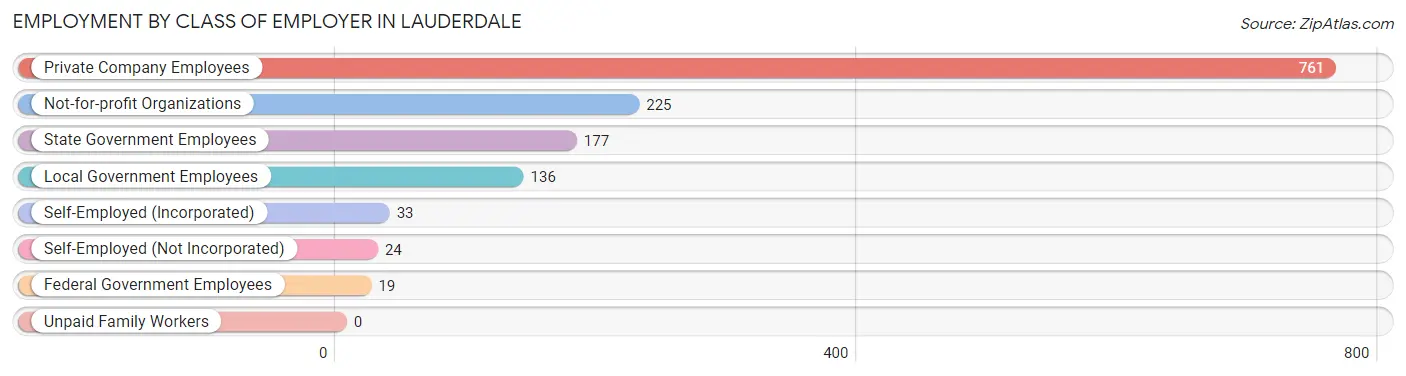
| Employer Class | # Employees | % Employees |
| Private Company Employees | 761 | 55.3% |
| Self-Employed (Incorporated) | 33 | 2.4% |
| Self-Employed (Not Incorporated) | 24 | 1.8% |
| Not-for-profit Organizations | 225 | 16.4% |
| Local Government Employees | 136 | 9.9% |
| State Government Employees | 177 | 12.9% |
| Federal Government Employees | 19 | 1.4% |
| Unpaid Family Workers | 0 | 0.0% |
| Total | 1,375 | 100.0% |
Employment Status by Age in Lauderdale
According to the labor force statistics for Lauderdale, out of the total population over 16 years of age (2,205), 71.6% or 1,579 individuals are in the labor force, with 10.7% or 169 of them unemployed. The age group with the highest labor force participation rate is 45 to 54 years, with 94.2% or 162 individuals in the labor force. Within the labor force, the 16 to 19 years age range has the highest percentage of unemployed individuals, with 90.9% or 120 of them being unemployed.
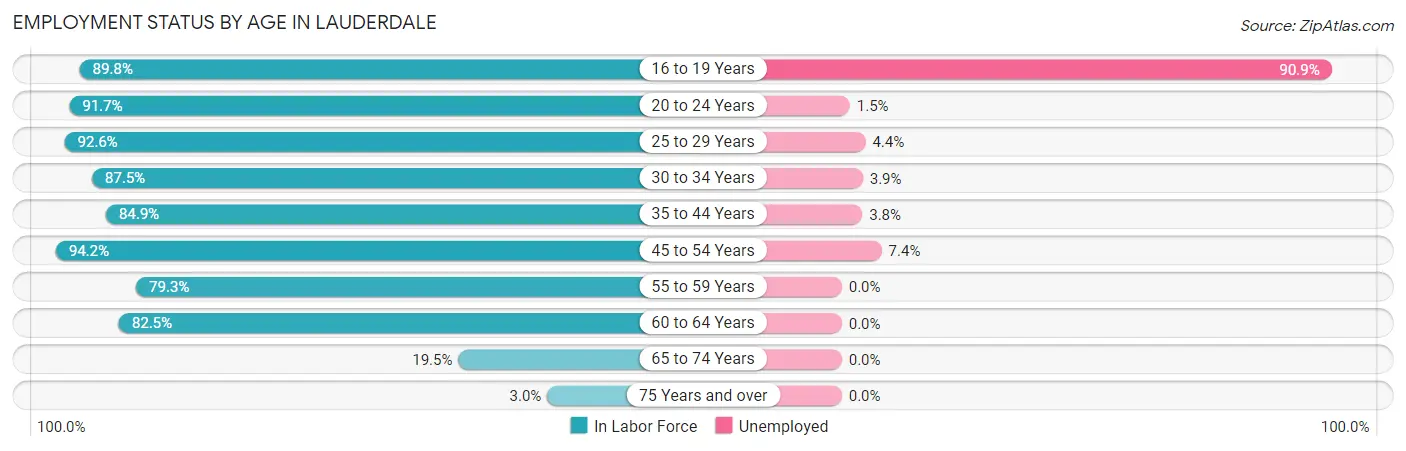
| Age Bracket | In Labor Force | Unemployed |
| 16 to 19 Years | 132 (89.8%) | 120 (90.9%) |
| 20 to 24 Years | 200 (91.7%) | 3 (1.5%) |
| 25 to 29 Years | 339 (92.6%) | 15 (4.4%) |
| 30 to 34 Years | 230 (87.5%) | 9 (3.9%) |
| 35 to 44 Years | 264 (84.9%) | 10 (3.8%) |
| 45 to 54 Years | 162 (94.2%) | 12 (7.4%) |
| 55 to 59 Years | 73 (79.3%) | 0 (0.0%) |
| 60 to 64 Years | 113 (82.5%) | 0 (0.0%) |
| 65 to 74 Years | 59 (19.5%) | 0 (0.0%) |
| 75 Years and over | 6 (3.0%) | 0 (0.0%) |
| Total | 1,579 (71.6%) | 169 (10.7%) |
Employment Status by Educational Attainment in Lauderdale
According to labor force statistics for Lauderdale, 88.1% of individuals (1,181) out of the total population between 25 and 64 years of age (1,341) are in the labor force, with 3.9% or 46 of them being unemployed. The group with the highest labor force participation rate are those with the educational attainment of high school diploma, with 98.2% or 54 individuals in the labor force. Within the labor force, individuals with less than high school education have the highest percentage of unemployment, with 31.0% or 9 of them being unemployed.

| Educational Attainment | In Labor Force | Unemployed |
| Less than High School | 29 (80.6%) | 11 (31.0%) |
| High School Diploma | 54 (98.2%) | 0 (0.0%) |
| College / Associate Degree | 256 (85.6%) | 26 (8.6%) |
| Bachelor's Degree or higher | 842 (88.5%) | 17 (1.8%) |
| Total | 1,181 (88.1%) | 52 (3.9%) |
Employment Occupations by Sex in Lauderdale
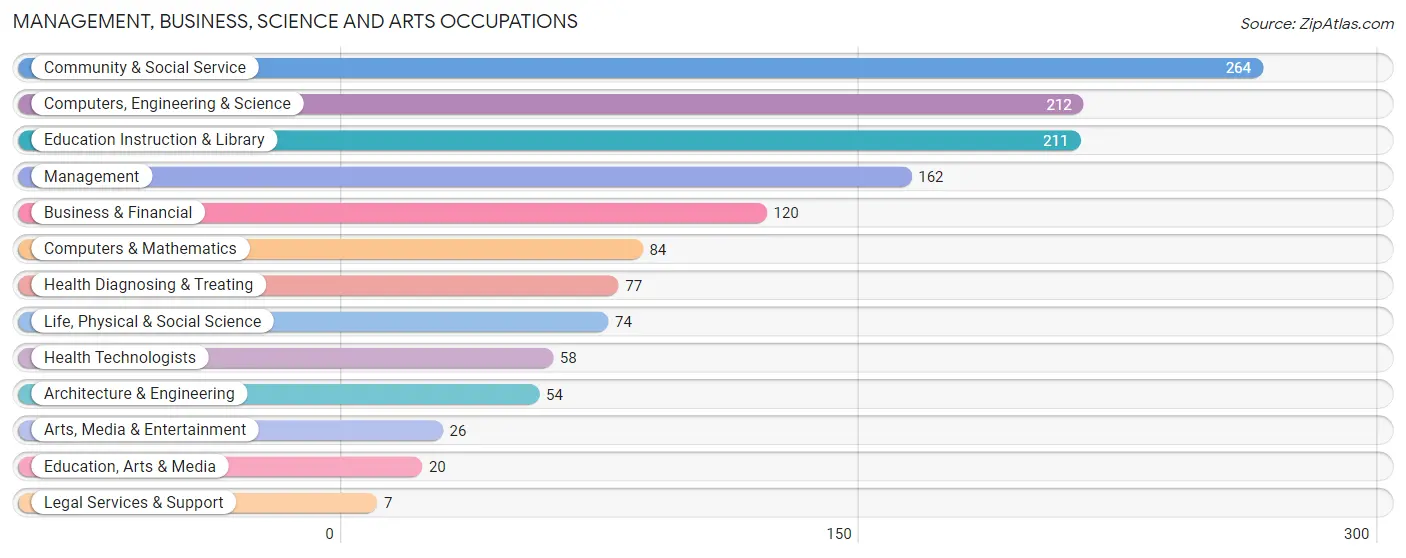
Management, Business, Science and Arts Occupations
The most common Management, Business, Science and Arts occupations in Lauderdale are Community & Social Service (264 | 18.7%), Computers, Engineering & Science (212 | 15.0%), Education Instruction & Library (211 | 15.0%), Management (162 | 11.5%), and Business & Financial (120 | 8.5%).
Management, Business, Science and Arts Occupations by Sex
Within the Management, Business, Science and Arts occupations in Lauderdale, the most male-oriented occupations are Legal Services & Support (100.0%), Life, Physical & Social Science (82.4%), and Management (77.2%), while the most female-oriented occupations are Arts, Media & Entertainment (88.5%), Education Instruction & Library (66.8%), and Community & Social Service (65.5%).
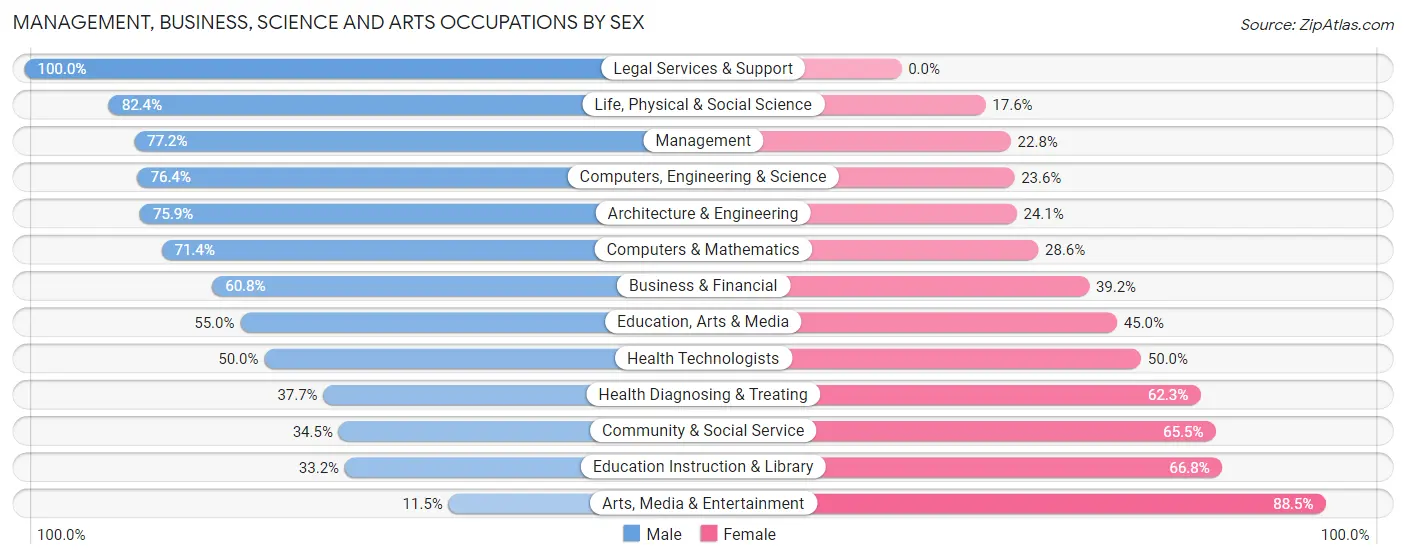
| Occupation | Male | Female |
| Management | 125 (77.2%) | 37 (22.8%) |
| Business & Financial | 73 (60.8%) | 47 (39.2%) |
| Computers, Engineering & Science | 162 (76.4%) | 50 (23.6%) |
| Computers & Mathematics | 60 (71.4%) | 24 (28.6%) |
| Architecture & Engineering | 41 (75.9%) | 13 (24.1%) |
| Life, Physical & Social Science | 61 (82.4%) | 13 (17.6%) |
| Community & Social Service | 91 (34.5%) | 173 (65.5%) |
| Education, Arts & Media | 11 (55.0%) | 9 (45.0%) |
| Legal Services & Support | 7 (100.0%) | 0 (0.0%) |
| Education Instruction & Library | 70 (33.2%) | 141 (66.8%) |
| Arts, Media & Entertainment | 3 (11.5%) | 23 (88.5%) |
| Health Diagnosing & Treating | 29 (37.7%) | 48 (62.3%) |
| Health Technologists | 29 (50.0%) | 29 (50.0%) |
| Total (Category) | 480 (57.5%) | 355 (42.5%) |
| Total (Overall) | 785 (55.7%) | 624 (44.3%) |
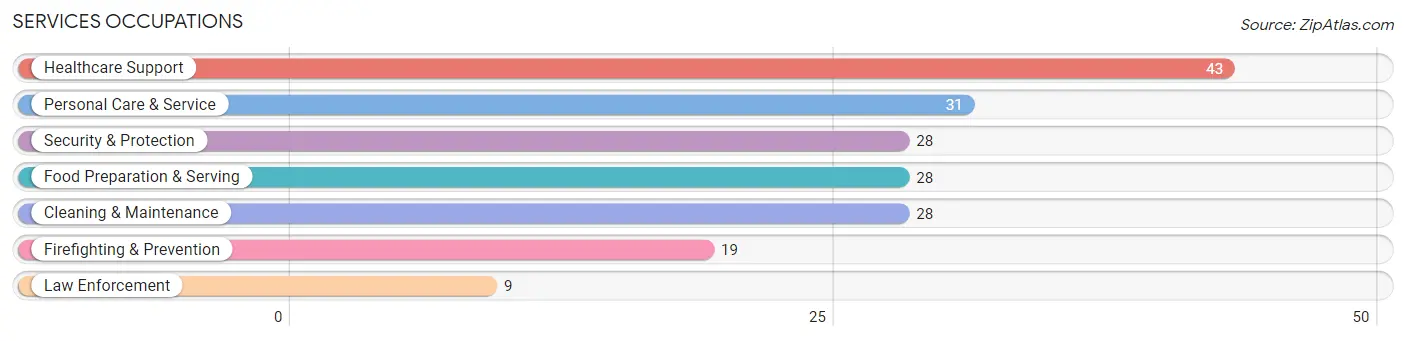
Services Occupations
The most common Services occupations in Lauderdale are Healthcare Support (43 | 3.0%), Personal Care & Service (31 | 2.2%), Security & Protection (28 | 2.0%), Food Preparation & Serving (28 | 2.0%), and Cleaning & Maintenance (28 | 2.0%).
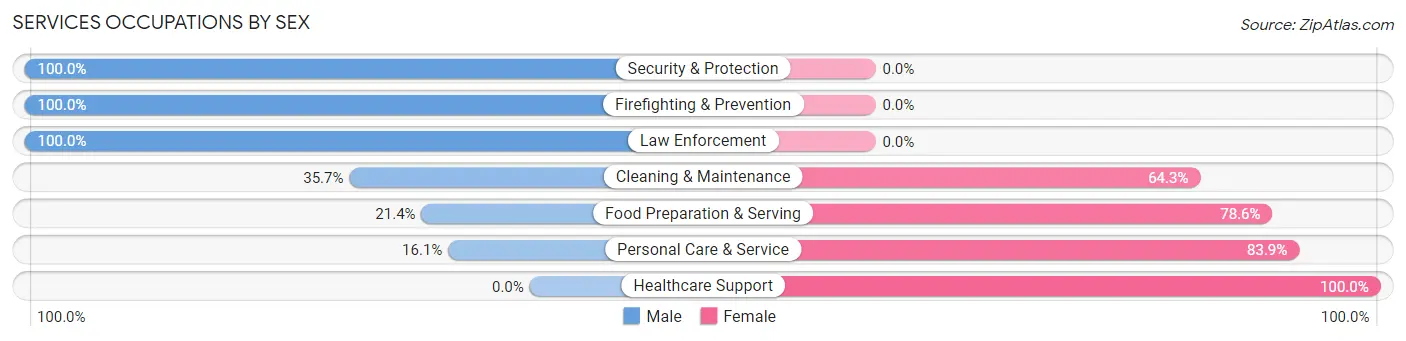
Services Occupations by Sex
Within the Services occupations in Lauderdale, the most male-oriented occupations are Security & Protection (100.0%), Firefighting & Prevention (100.0%), and Law Enforcement (100.0%), while the most female-oriented occupations are Healthcare Support (100.0%), Personal Care & Service (83.9%), and Food Preparation & Serving (78.6%).
| Occupation | Male | Female |
| Healthcare Support | 0 (0.0%) | 43 (100.0%) |
| Security & Protection | 28 (100.0%) | 0 (0.0%) |
| Firefighting & Prevention | 19 (100.0%) | 0 (0.0%) |
| Law Enforcement | 9 (100.0%) | 0 (0.0%) |
| Food Preparation & Serving | 6 (21.4%) | 22 (78.6%) |
| Cleaning & Maintenance | 10 (35.7%) | 18 (64.3%) |
| Personal Care & Service | 5 (16.1%) | 26 (83.9%) |
| Total (Category) | 49 (31.0%) | 109 (69.0%) |
| Total (Overall) | 785 (55.7%) | 624 (44.3%) |
Sales and Office Occupations
The most common Sales and Office occupations in Lauderdale are Office & Administration (120 | 8.5%), and Sales & Related (90 | 6.4%).

Sales and Office Occupations by Sex

| Occupation | Male | Female |
| Sales & Related | 46 (51.1%) | 44 (48.9%) |
| Office & Administration | 50 (41.7%) | 70 (58.3%) |
| Total (Category) | 96 (45.7%) | 114 (54.3%) |
| Total (Overall) | 785 (55.7%) | 624 (44.3%) |
Natural Resources, Construction and Maintenance Occupations
The most common Natural Resources, Construction and Maintenance occupations in Lauderdale are Construction & Extraction (47 | 3.3%), Installation, Maintenance & Repair (29 | 2.1%), and Farming, Fishing & Forestry (5 | 0.4%).

Natural Resources, Construction and Maintenance Occupations by Sex

| Occupation | Male | Female |
| Farming, Fishing & Forestry | 0 (0.0%) | 5 (100.0%) |
| Construction & Extraction | 47 (100.0%) | 0 (0.0%) |
| Installation, Maintenance & Repair | 24 (82.8%) | 5 (17.2%) |
| Total (Category) | 71 (87.6%) | 10 (12.3%) |
| Total (Overall) | 785 (55.7%) | 624 (44.3%) |
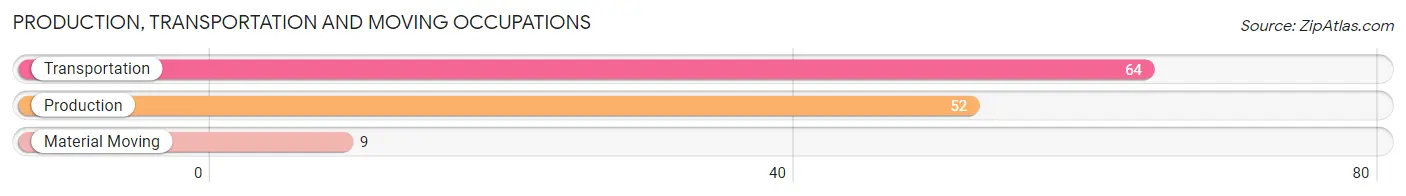
Production, Transportation and Moving Occupations
The most common Production, Transportation and Moving occupations in Lauderdale are Transportation (64 | 4.5%), Production (52 | 3.7%), and Material Moving (9 | 0.6%).
Production, Transportation and Moving Occupations by Sex

| Occupation | Male | Female |
| Production | 24 (46.2%) | 28 (53.8%) |
| Transportation | 56 (87.5%) | 8 (12.5%) |
| Material Moving | 9 (100.0%) | 0 (0.0%) |
| Total (Category) | 89 (71.2%) | 36 (28.8%) |
| Total (Overall) | 785 (55.7%) | 624 (44.3%) |
Employment Industries by Sex in Lauderdale
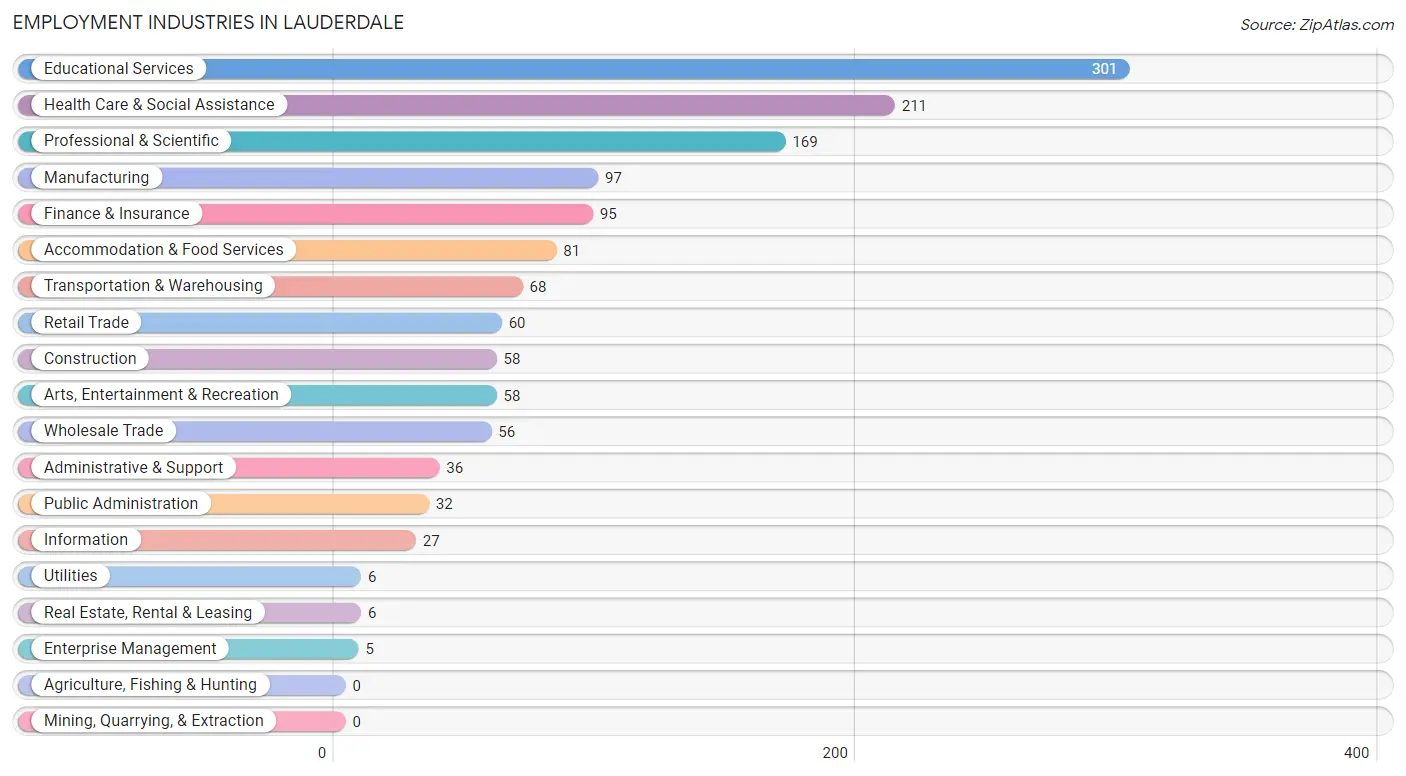
Employment Industries in Lauderdale
The major employment industries in Lauderdale include Educational Services (301 | 21.4%), Health Care & Social Assistance (211 | 15.0%), Professional & Scientific (169 | 12.0%), Manufacturing (97 | 6.9%), and Finance & Insurance (95 | 6.7%).
Employment Industries by Sex in Lauderdale
The Lauderdale industries that see more men than women are Construction (100.0%), Wholesale Trade (100.0%), and Utilities (100.0%), whereas the industries that tend to have a higher number of women are Information (100.0%), Enterprise Management (100.0%), and Accommodation & Food Services (80.2%).
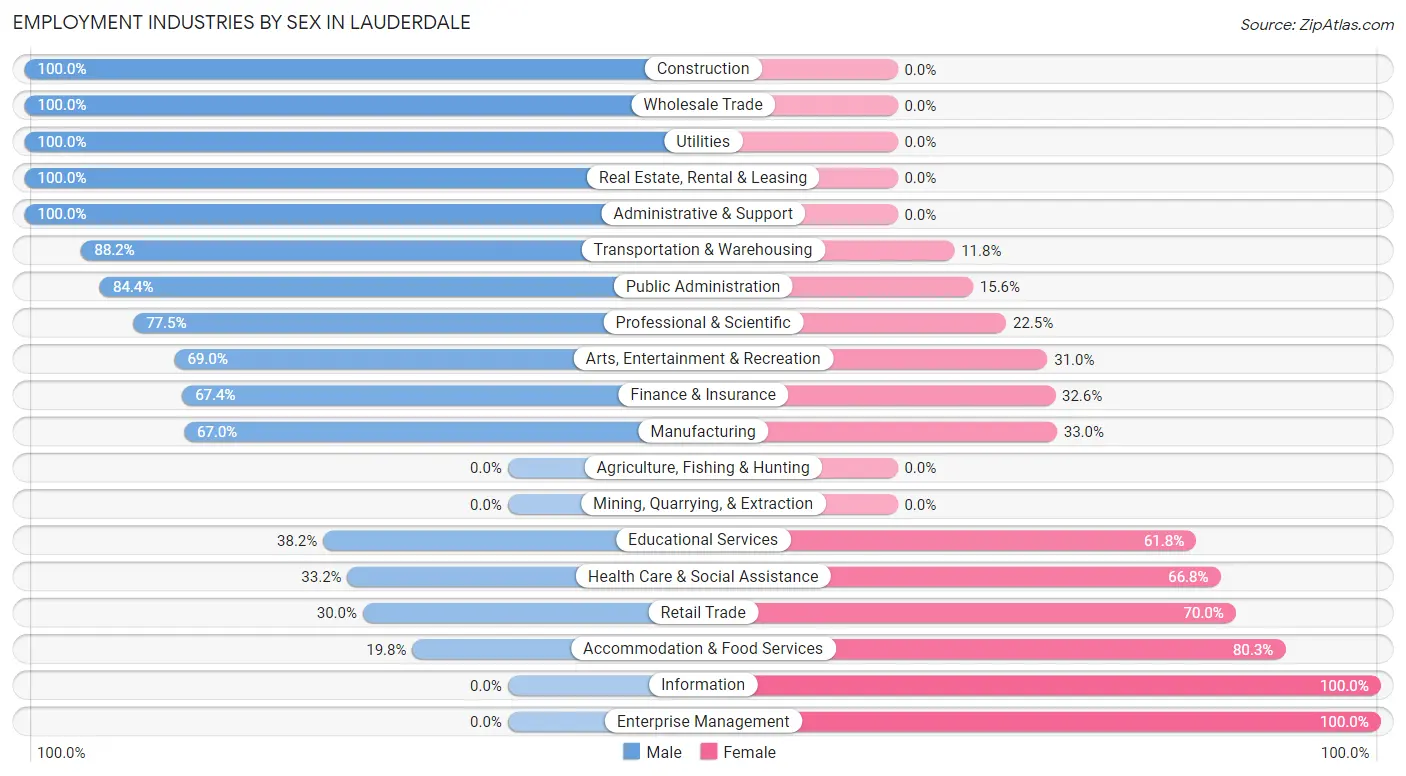
| Industry | Male | Female |
| Agriculture, Fishing & Hunting | 0 (0.0%) | 0 (0.0%) |
| Mining, Quarrying, & Extraction | 0 (0.0%) | 0 (0.0%) |
| Construction | 58 (100.0%) | 0 (0.0%) |
| Manufacturing | 65 (67.0%) | 32 (33.0%) |
| Wholesale Trade | 56 (100.0%) | 0 (0.0%) |
| Retail Trade | 18 (30.0%) | 42 (70.0%) |
| Transportation & Warehousing | 60 (88.2%) | 8 (11.8%) |
| Utilities | 6 (100.0%) | 0 (0.0%) |
| Information | 0 (0.0%) | 27 (100.0%) |
| Finance & Insurance | 64 (67.4%) | 31 (32.6%) |
| Real Estate, Rental & Leasing | 6 (100.0%) | 0 (0.0%) |
| Professional & Scientific | 131 (77.5%) | 38 (22.5%) |
| Enterprise Management | 0 (0.0%) | 5 (100.0%) |
| Administrative & Support | 36 (100.0%) | 0 (0.0%) |
| Educational Services | 115 (38.2%) | 186 (61.8%) |
| Health Care & Social Assistance | 70 (33.2%) | 141 (66.8%) |
| Arts, Entertainment & Recreation | 40 (69.0%) | 18 (31.0%) |
| Accommodation & Food Services | 16 (19.8%) | 65 (80.2%) |
| Public Administration | 27 (84.4%) | 5 (15.6%) |
| Total | 785 (55.7%) | 624 (44.3%) |
Education in Lauderdale
School Enrollment in Lauderdale
The most common levels of schooling among the 530 students in Lauderdale are college / undergraduate (194 | 36.6%), graduate / professional (149 | 28.1%), and high school (59 | 11.1%).
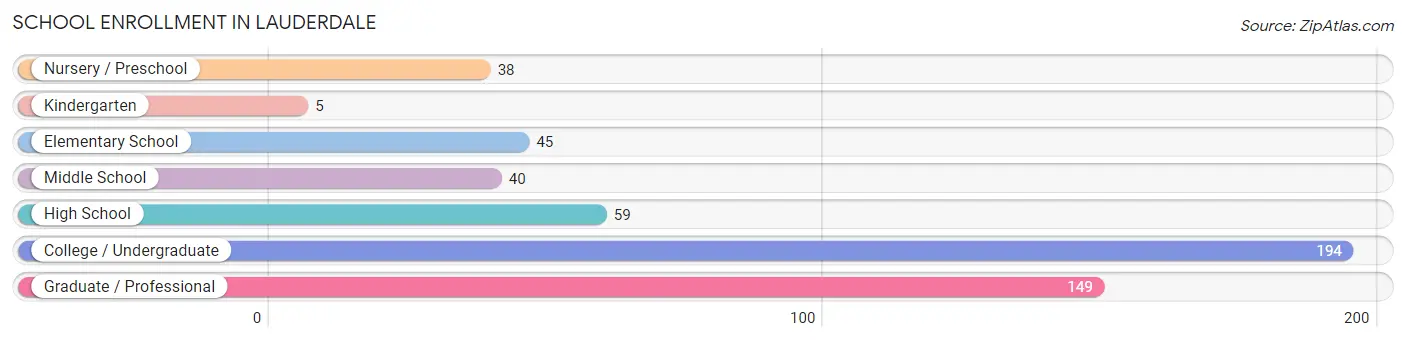
| School Level | # Students | % Students |
| Nursery / Preschool | 38 | 7.2% |
| Kindergarten | 5 | 0.9% |
| Elementary School | 45 | 8.5% |
| Middle School | 40 | 7.5% |
| High School | 59 | 11.1% |
| College / Undergraduate | 194 | 36.6% |
| Graduate / Professional | 149 | 28.1% |
| Total | 530 | 100.0% |
School Enrollment by Age by Funding Source in Lauderdale
Out of a total of 530 students who are enrolled in schools in Lauderdale, 222 (41.9%) attend a private institution, while the remaining 308 (58.1%) are enrolled in public schools. The age group of 18 to 19 year olds has the highest likelihood of being enrolled in private schools, with 76 (98.7% in the age bracket) enrolled. Conversely, the age group of 10 to 14 year olds has the lowest likelihood of being enrolled in a private school, with 40 (100.0% in the age bracket) attending a public institution.
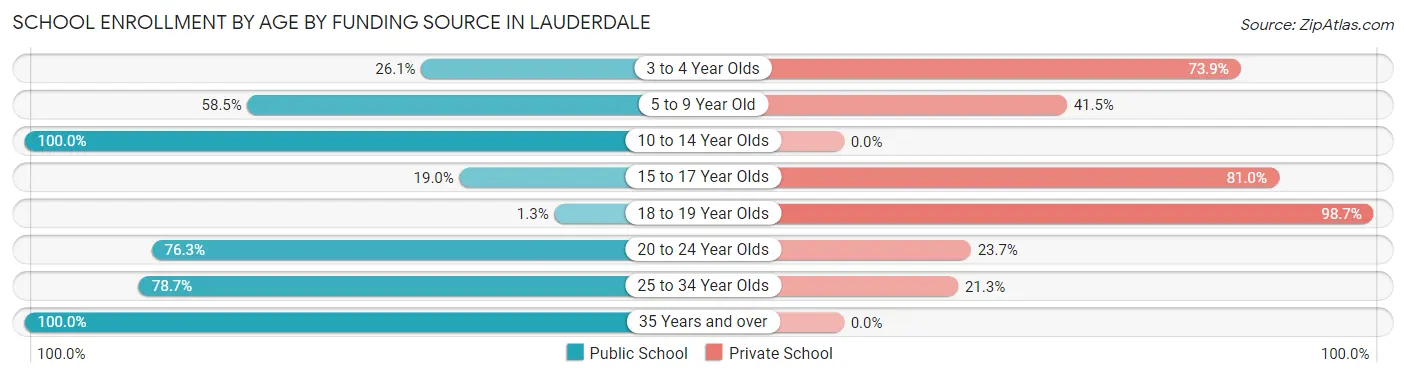
| Age Bracket | Public School | Private School |
| 3 to 4 Year Olds | 6 (26.1%) | 17 (73.9%) |
| 5 to 9 Year Old | 38 (58.5%) | 27 (41.5%) |
| 10 to 14 Year Olds | 40 (100.0%) | 0 (0.0%) |
| 15 to 17 Year Olds | 11 (19.0%) | 47 (81.0%) |
| 18 to 19 Year Olds | 1 (1.3%) | 76 (98.7%) |
| 20 to 24 Year Olds | 71 (76.3%) | 22 (23.7%) |
| 25 to 34 Year Olds | 122 (78.7%) | 33 (21.3%) |
| 35 Years and over | 19 (100.0%) | 0 (0.0%) |
| Total | 308 (58.1%) | 222 (41.9%) |
Educational Attainment by Field of Study in Lauderdale
Engineering (214 | 14.0%), computers & mathematics (197 | 12.9%), education (151 | 9.9%), bio, nature & agricultural (145 | 9.5%), and business (138 | 9.0%) are the most common fields of study among 1,525 individuals in Lauderdale who have obtained a bachelor's degree or higher.
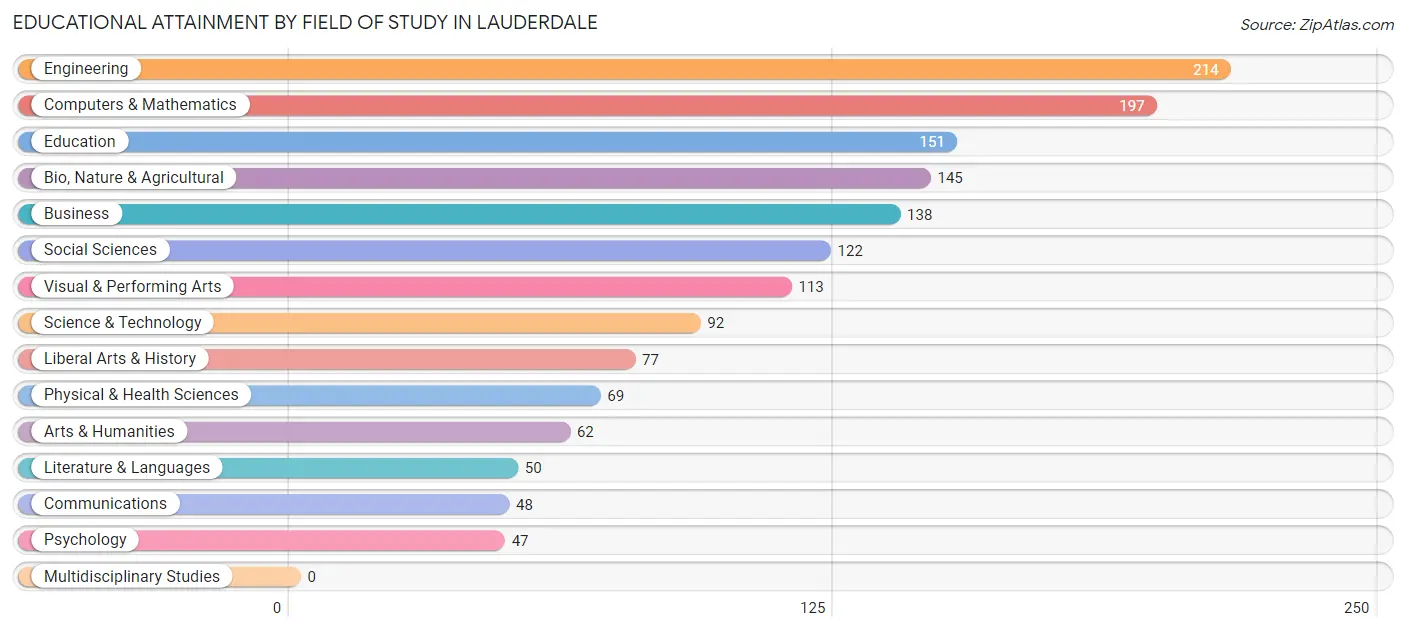
| Field of Study | # Graduates | % Graduates |
| Computers & Mathematics | 197 | 12.9% |
| Bio, Nature & Agricultural | 145 | 9.5% |
| Physical & Health Sciences | 69 | 4.5% |
| Psychology | 47 | 3.1% |
| Social Sciences | 122 | 8.0% |
| Engineering | 214 | 14.0% |
| Multidisciplinary Studies | 0 | 0.0% |
| Science & Technology | 92 | 6.0% |
| Business | 138 | 9.0% |
| Education | 151 | 9.9% |
| Literature & Languages | 50 | 3.3% |
| Liberal Arts & History | 77 | 5.1% |
| Visual & Performing Arts | 113 | 7.4% |
| Communications | 48 | 3.2% |
| Arts & Humanities | 62 | 4.1% |
| Total | 1,525 | 100.0% |
Transportation & Commute in Lauderdale
Vehicle Availability by Sex in Lauderdale
The most prevalent vehicle ownership categories in Lauderdale are males with 1 vehicle (315, accounting for 41.0%) and females with 1 vehicle (241, making up 52.0%).
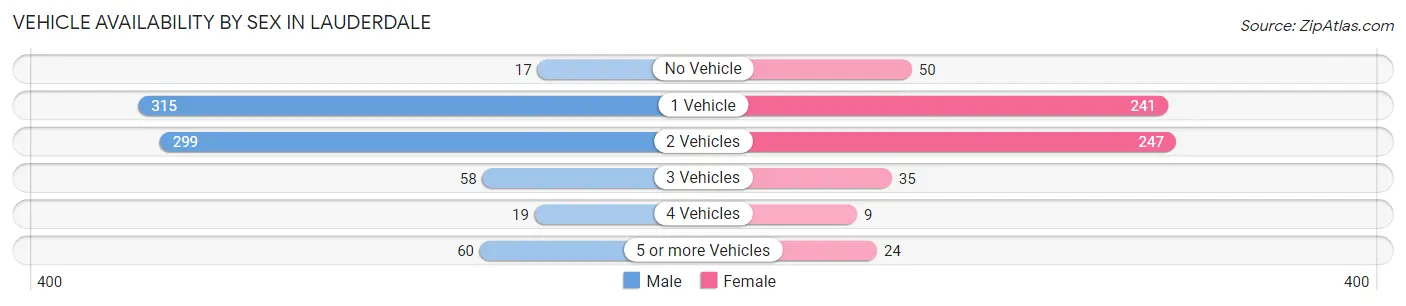
| Vehicles Available | Male | Female |
| No Vehicle | 17 (2.2%) | 50 (8.3%) |
| 1 Vehicle | 315 (41.0%) | 241 (39.8%) |
| 2 Vehicles | 299 (38.9%) | 247 (40.8%) |
| 3 Vehicles | 58 (7.5%) | 35 (5.8%) |
| 4 Vehicles | 19 (2.5%) | 9 (1.5%) |
| 5 or more Vehicles | 60 (7.8%) | 24 (4.0%) |
| Total | 768 (100.0%) | 606 (100.0%) |
Commute Time in Lauderdale
The most frequently occuring commute durations in Lauderdale are 20 to 24 minutes (324 commuters, 29.1%), 15 to 19 minutes (171 commuters, 15.3%), and 10 to 14 minutes (170 commuters, 15.3%).
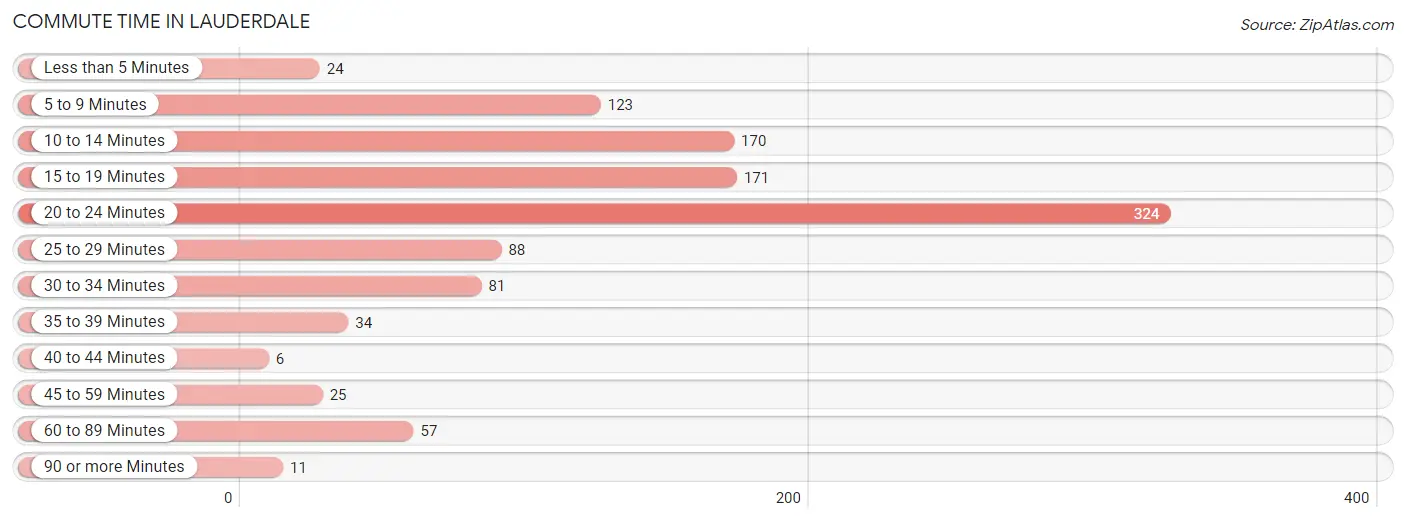
| Commute Time | # Commuters | % Commuters |
| Less than 5 Minutes | 24 | 2.1% |
| 5 to 9 Minutes | 123 | 11.0% |
| 10 to 14 Minutes | 170 | 15.3% |
| 15 to 19 Minutes | 171 | 15.3% |
| 20 to 24 Minutes | 324 | 29.1% |
| 25 to 29 Minutes | 88 | 7.9% |
| 30 to 34 Minutes | 81 | 7.3% |
| 35 to 39 Minutes | 34 | 3.0% |
| 40 to 44 Minutes | 6 | 0.5% |
| 45 to 59 Minutes | 25 | 2.2% |
| 60 to 89 Minutes | 57 | 5.1% |
| 90 or more Minutes | 11 | 1.0% |
Commute Time by Sex in Lauderdale
The most common commute times in Lauderdale are 20 to 24 minutes (157 commuters, 24.8%) for males and 20 to 24 minutes (167 commuters, 34.6%) for females.
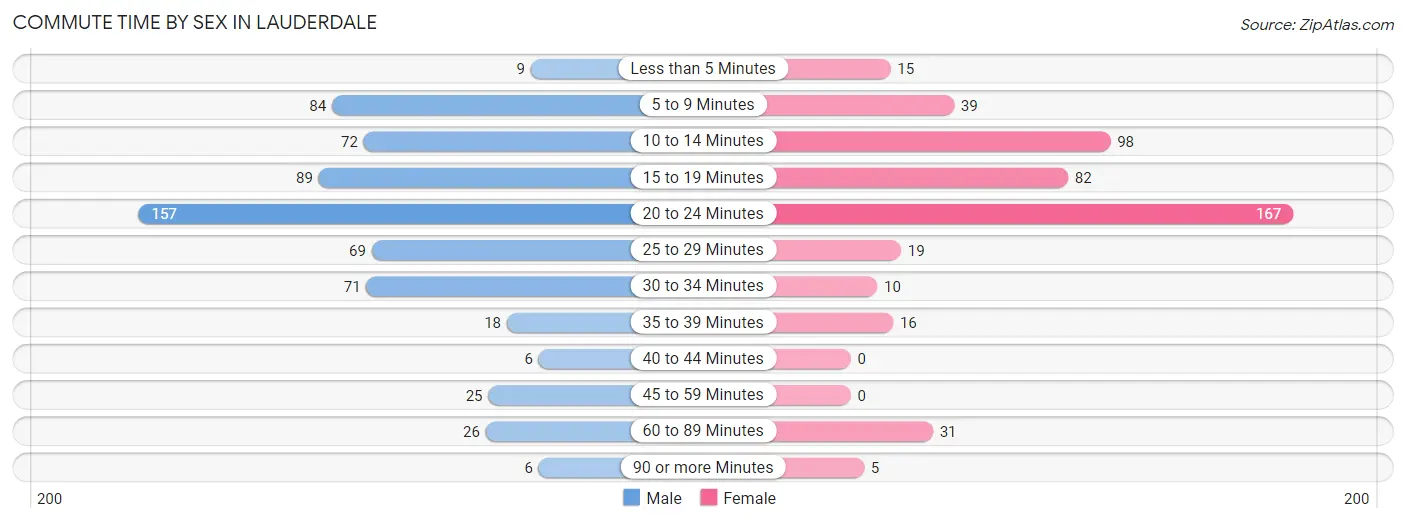
| Commute Time | Male | Female |
| Less than 5 Minutes | 9 (1.4%) | 15 (3.1%) |
| 5 to 9 Minutes | 84 (13.3%) | 39 (8.1%) |
| 10 to 14 Minutes | 72 (11.4%) | 98 (20.3%) |
| 15 to 19 Minutes | 89 (14.1%) | 82 (17.0%) |
| 20 to 24 Minutes | 157 (24.8%) | 167 (34.6%) |
| 25 to 29 Minutes | 69 (10.9%) | 19 (3.9%) |
| 30 to 34 Minutes | 71 (11.2%) | 10 (2.1%) |
| 35 to 39 Minutes | 18 (2.9%) | 16 (3.3%) |
| 40 to 44 Minutes | 6 (0.9%) | 0 (0.0%) |
| 45 to 59 Minutes | 25 (4.0%) | 0 (0.0%) |
| 60 to 89 Minutes | 26 (4.1%) | 31 (6.4%) |
| 90 or more Minutes | 6 (0.9%) | 5 (1.0%) |
Time of Departure to Work by Sex in Lauderdale
The most frequent times of departure to work in Lauderdale are 7:30 AM to 7:59 AM (157, 24.8%) for males and 7:30 AM to 7:59 AM (79, 16.4%) for females.
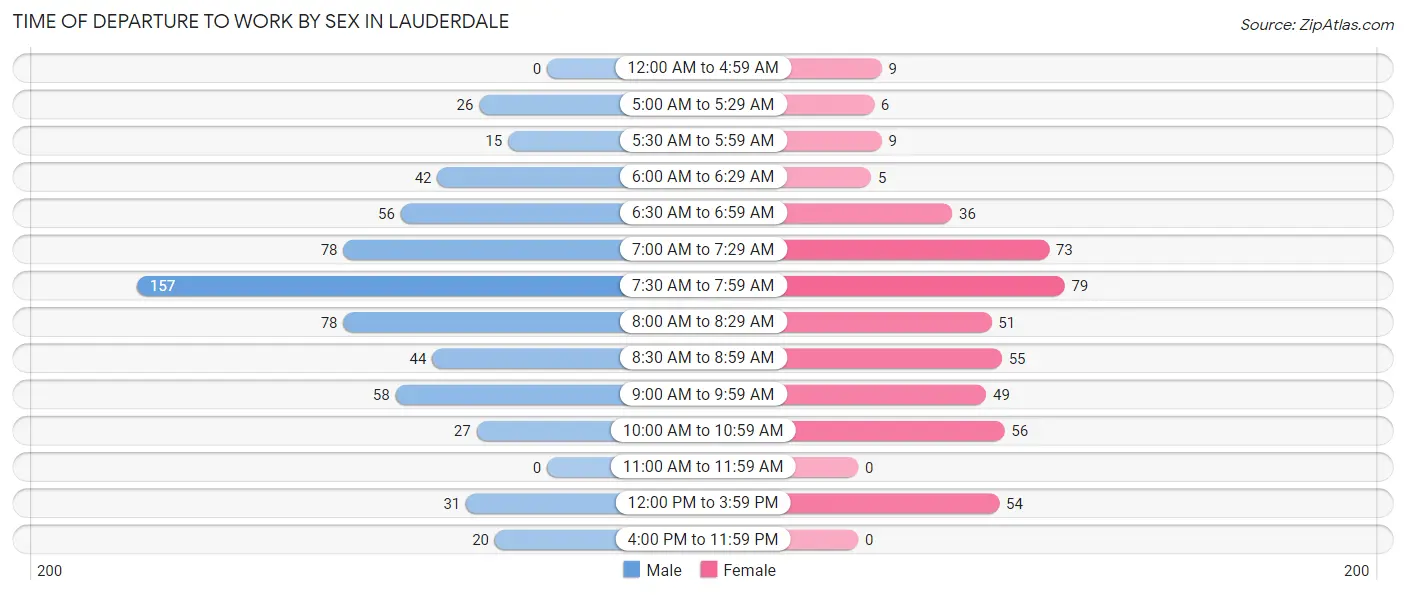
| Time of Departure | Male | Female |
| 12:00 AM to 4:59 AM | 0 (0.0%) | 9 (1.9%) |
| 5:00 AM to 5:29 AM | 26 (4.1%) | 6 (1.2%) |
| 5:30 AM to 5:59 AM | 15 (2.4%) | 9 (1.9%) |
| 6:00 AM to 6:29 AM | 42 (6.7%) | 5 (1.0%) |
| 6:30 AM to 6:59 AM | 56 (8.9%) | 36 (7.5%) |
| 7:00 AM to 7:29 AM | 78 (12.3%) | 73 (15.1%) |
| 7:30 AM to 7:59 AM | 157 (24.8%) | 79 (16.4%) |
| 8:00 AM to 8:29 AM | 78 (12.3%) | 51 (10.6%) |
| 8:30 AM to 8:59 AM | 44 (7.0%) | 55 (11.4%) |
| 9:00 AM to 9:59 AM | 58 (9.2%) | 49 (10.2%) |
| 10:00 AM to 10:59 AM | 27 (4.3%) | 56 (11.6%) |
| 11:00 AM to 11:59 AM | 0 (0.0%) | 0 (0.0%) |
| 12:00 PM to 3:59 PM | 31 (4.9%) | 54 (11.2%) |
| 4:00 PM to 11:59 PM | 20 (3.2%) | 0 (0.0%) |
| Total | 632 (100.0%) | 482 (100.0%) |
Housing Occupancy in Lauderdale
Occupancy by Ownership in Lauderdale
Of the total 1,253 dwellings in Lauderdale, owner-occupied units account for 649 (51.8%), while renter-occupied units make up 604 (48.2%).
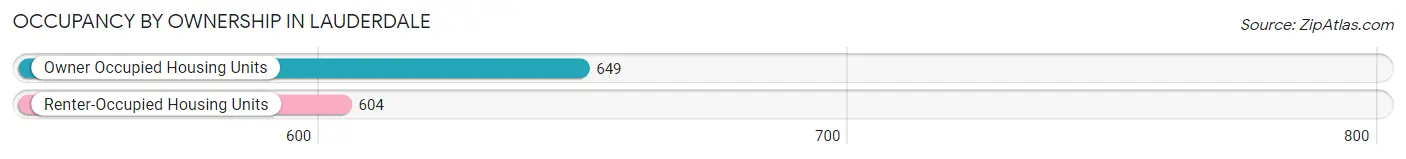
| Occupancy | # Housing Units | % Housing Units |
| Owner Occupied Housing Units | 649 | 51.8% |
| Renter-Occupied Housing Units | 604 | 48.2% |
| Total Occupied Housing Units | 1,253 | 100.0% |
Occupancy by Household Size in Lauderdale
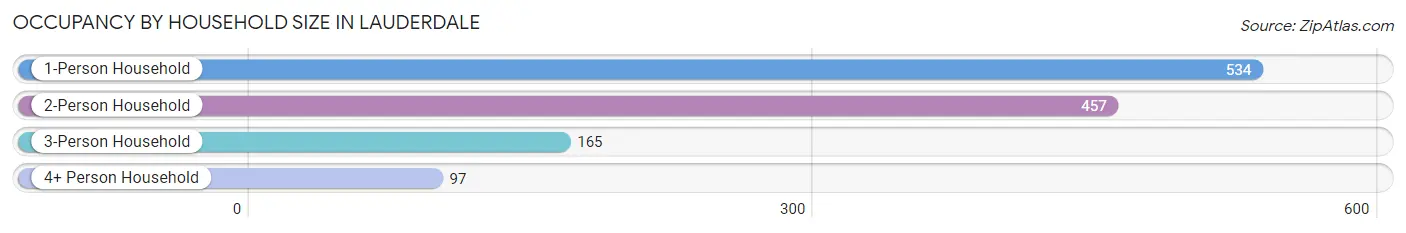
| Household Size | # Housing Units | % Housing Units |
| 1-Person Household | 534 | 42.6% |
| 2-Person Household | 457 | 36.5% |
| 3-Person Household | 165 | 13.2% |
| 4+ Person Household | 97 | 7.7% |
| Total Housing Units | 1,253 | 100.0% |
Occupancy by Ownership by Household Size in Lauderdale
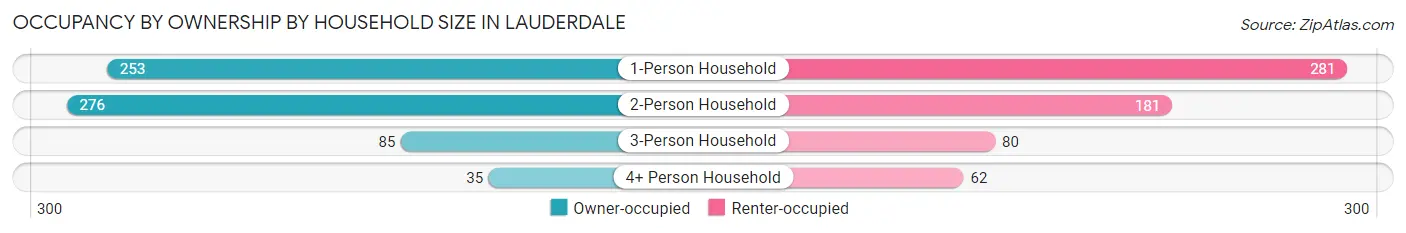
| Household Size | Owner-occupied | Renter-occupied |
| 1-Person Household | 253 (47.4%) | 281 (52.6%) |
| 2-Person Household | 276 (60.4%) | 181 (39.6%) |
| 3-Person Household | 85 (51.5%) | 80 (48.5%) |
| 4+ Person Household | 35 (36.1%) | 62 (63.9%) |
| Total Housing Units | 649 (51.8%) | 604 (48.2%) |
Occupancy by Educational Attainment in Lauderdale
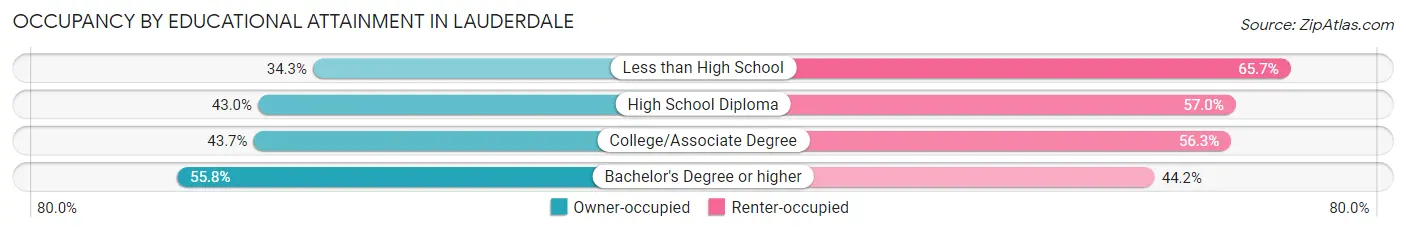
| Household Size | Owner-occupied | Renter-occupied |
| Less than High School | 12 (34.3%) | 23 (65.7%) |
| High School Diploma | 43 (43.0%) | 57 (57.0%) |
| College/Associate Degree | 108 (43.7%) | 139 (56.3%) |
| Bachelor's Degree or higher | 486 (55.8%) | 385 (44.2%) |
Occupancy by Age of Householder in Lauderdale
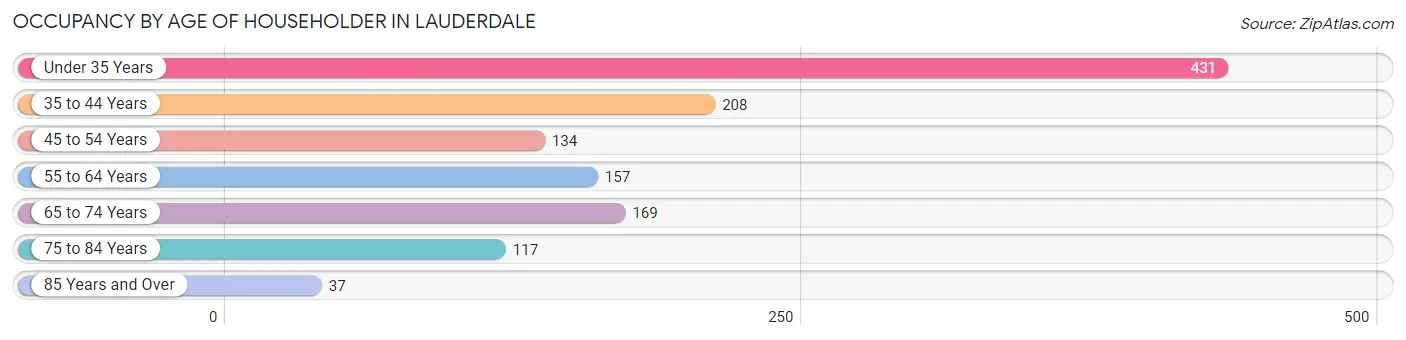
| Age Bracket | # Households | % Households |
| Under 35 Years | 431 | 34.4% |
| 35 to 44 Years | 208 | 16.6% |
| 45 to 54 Years | 134 | 10.7% |
| 55 to 64 Years | 157 | 12.5% |
| 65 to 74 Years | 169 | 13.5% |
| 75 to 84 Years | 117 | 9.3% |
| 85 Years and Over | 37 | 2.9% |
| Total | 1,253 | 100.0% |
Housing Finances in Lauderdale
Median Income by Occupancy in Lauderdale
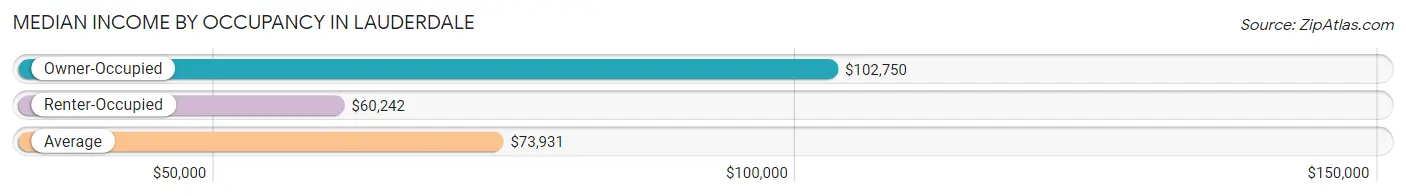
| Occupancy Type | # Households | Median Income |
| Owner-Occupied | 649 (51.8%) | $102,750 |
| Renter-Occupied | 604 (48.2%) | $60,242 |
| Average | 1,253 (100.0%) | $73,931 |
Occupancy by Householder Income Bracket in Lauderdale
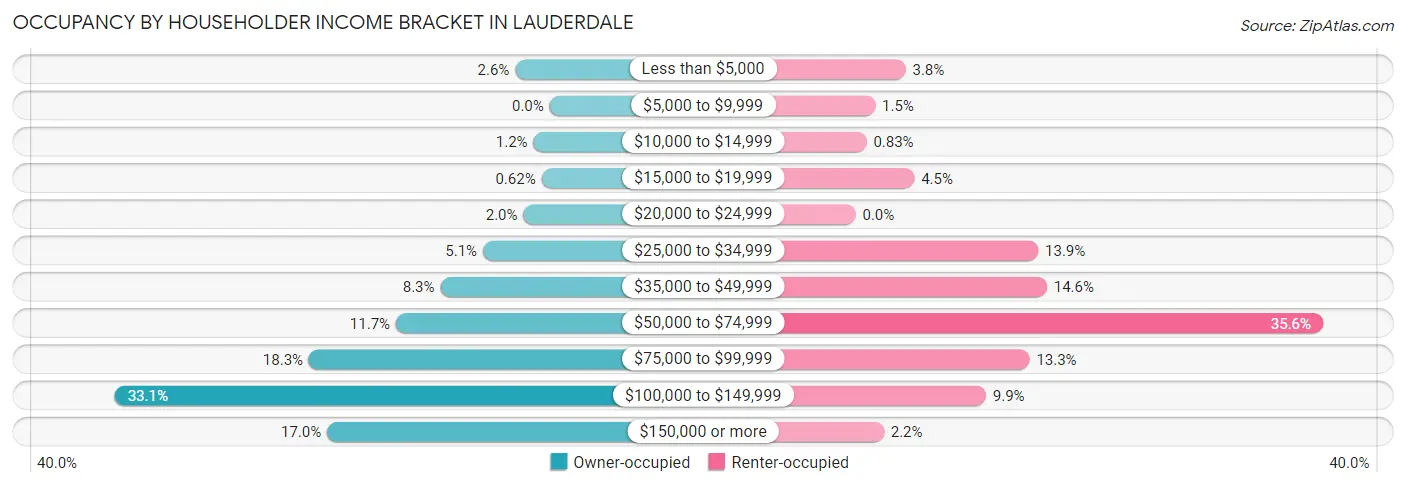
| Income Bracket | Owner-occupied | Renter-occupied |
| Less than $5,000 | 17 (2.6%) | 23 (3.8%) |
| $5,000 to $9,999 | 0 (0.0%) | 9 (1.5%) |
| $10,000 to $14,999 | 8 (1.2%) | 5 (0.8%) |
| $15,000 to $19,999 | 4 (0.6%) | 27 (4.5%) |
| $20,000 to $24,999 | 13 (2.0%) | 0 (0.0%) |
| $25,000 to $34,999 | 33 (5.1%) | 84 (13.9%) |
| $35,000 to $49,999 | 54 (8.3%) | 88 (14.6%) |
| $50,000 to $74,999 | 76 (11.7%) | 215 (35.6%) |
| $75,000 to $99,999 | 119 (18.3%) | 80 (13.3%) |
| $100,000 to $149,999 | 215 (33.1%) | 60 (9.9%) |
| $150,000 or more | 110 (17.0%) | 13 (2.1%) |
| Total | 649 (100.0%) | 604 (100.0%) |
Monthly Housing Cost Tiers in Lauderdale
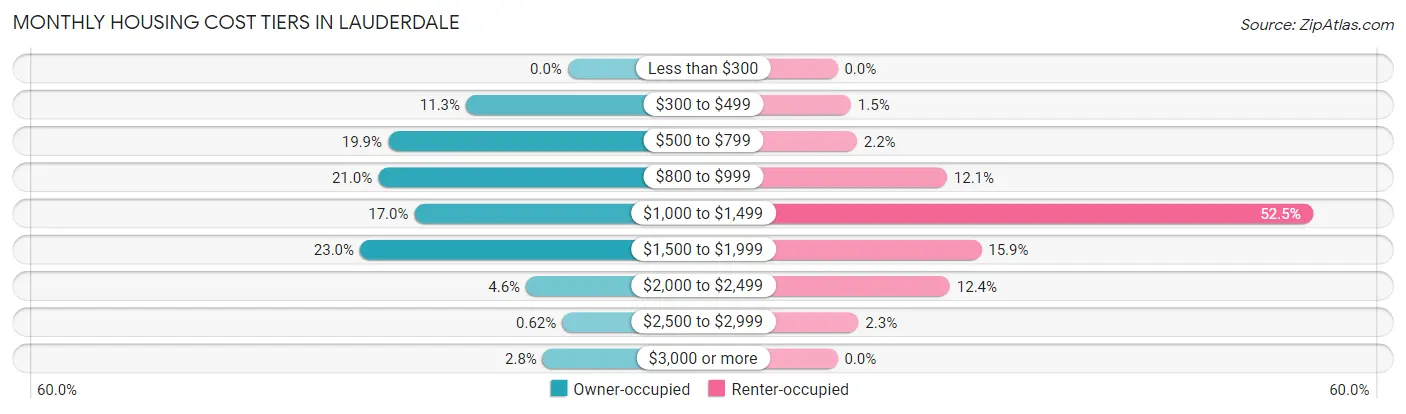
| Monthly Cost | Owner-occupied | Renter-occupied |
| Less than $300 | 0 (0.0%) | 0 (0.0%) |
| $300 to $499 | 73 (11.3%) | 9 (1.5%) |
| $500 to $799 | 129 (19.9%) | 13 (2.1%) |
| $800 to $999 | 136 (21.0%) | 73 (12.1%) |
| $1,000 to $1,499 | 110 (17.0%) | 317 (52.5%) |
| $1,500 to $1,999 | 149 (23.0%) | 96 (15.9%) |
| $2,000 to $2,499 | 30 (4.6%) | 75 (12.4%) |
| $2,500 to $2,999 | 4 (0.6%) | 14 (2.3%) |
| $3,000 or more | 18 (2.8%) | 0 (0.0%) |
| Total | 649 (100.0%) | 604 (100.0%) |
Physical Housing Characteristics in Lauderdale
Housing Structures in Lauderdale
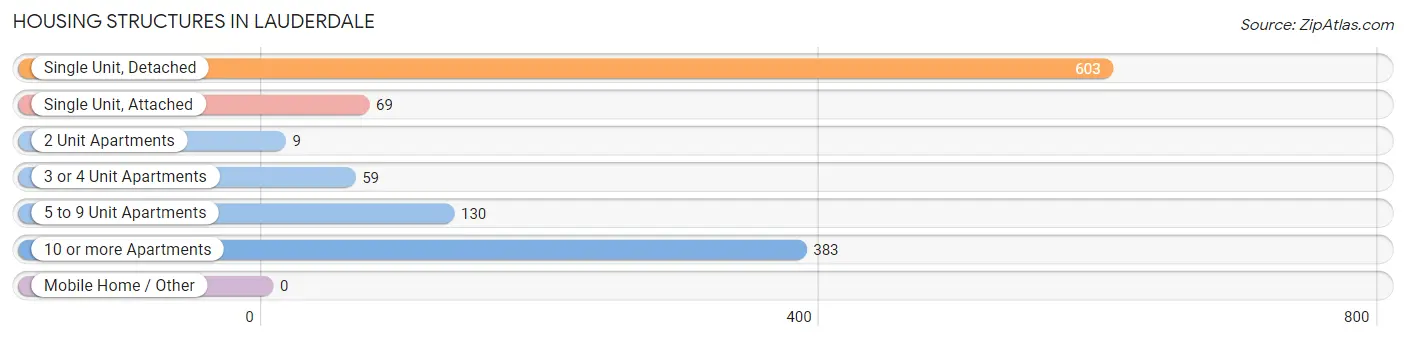
| Structure Type | # Housing Units | % Housing Units |
| Single Unit, Detached | 603 | 48.1% |
| Single Unit, Attached | 69 | 5.5% |
| 2 Unit Apartments | 9 | 0.7% |
| 3 or 4 Unit Apartments | 59 | 4.7% |
| 5 to 9 Unit Apartments | 130 | 10.4% |
| 10 or more Apartments | 383 | 30.6% |
| Mobile Home / Other | 0 | 0.0% |
| Total | 1,253 | 100.0% |
Housing Structures by Occupancy in Lauderdale
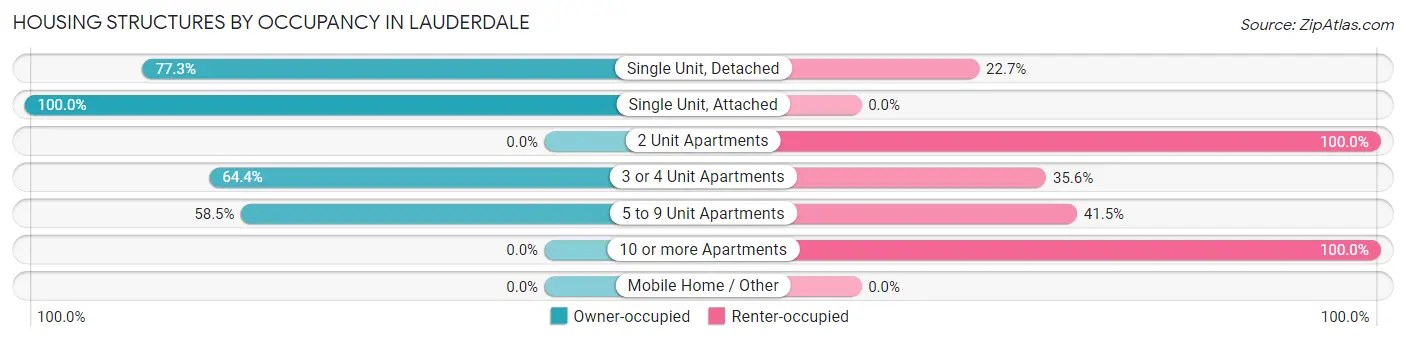
| Structure Type | Owner-occupied | Renter-occupied |
| Single Unit, Detached | 466 (77.3%) | 137 (22.7%) |
| Single Unit, Attached | 69 (100.0%) | 0 (0.0%) |
| 2 Unit Apartments | 0 (0.0%) | 9 (100.0%) |
| 3 or 4 Unit Apartments | 38 (64.4%) | 21 (35.6%) |
| 5 to 9 Unit Apartments | 76 (58.5%) | 54 (41.5%) |
| 10 or more Apartments | 0 (0.0%) | 383 (100.0%) |
| Mobile Home / Other | 0 (0.0%) | 0 (0.0%) |
| Total | 649 (51.8%) | 604 (48.2%) |
Housing Structures by Number of Rooms in Lauderdale
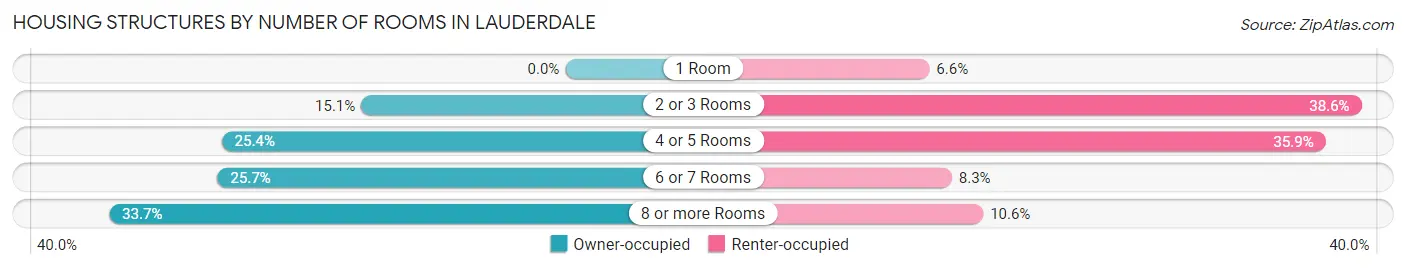
| Number of Rooms | Owner-occupied | Renter-occupied |
| 1 Room | 0 (0.0%) | 40 (6.6%) |
| 2 or 3 Rooms | 98 (15.1%) | 233 (38.6%) |
| 4 or 5 Rooms | 165 (25.4%) | 217 (35.9%) |
| 6 or 7 Rooms | 167 (25.7%) | 50 (8.3%) |
| 8 or more Rooms | 219 (33.7%) | 64 (10.6%) |
| Total | 649 (100.0%) | 604 (100.0%) |
Housing Structure by Heating Type in Lauderdale
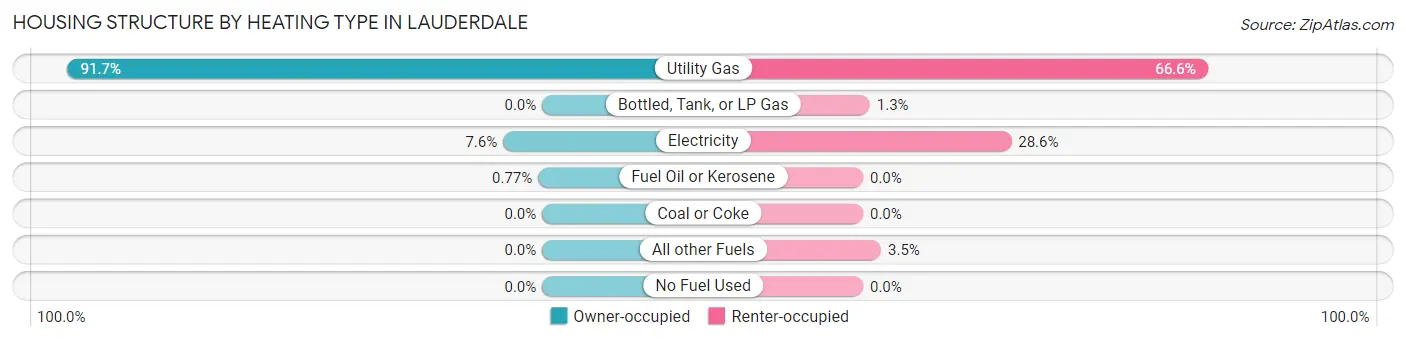
| Heating Type | Owner-occupied | Renter-occupied |
| Utility Gas | 595 (91.7%) | 402 (66.6%) |
| Bottled, Tank, or LP Gas | 0 (0.0%) | 8 (1.3%) |
| Electricity | 49 (7.5%) | 173 (28.6%) |
| Fuel Oil or Kerosene | 5 (0.8%) | 0 (0.0%) |
| Coal or Coke | 0 (0.0%) | 0 (0.0%) |
| All other Fuels | 0 (0.0%) | 21 (3.5%) |
| No Fuel Used | 0 (0.0%) | 0 (0.0%) |
| Total | 649 (100.0%) | 604 (100.0%) |
Household Vehicle Usage in Lauderdale
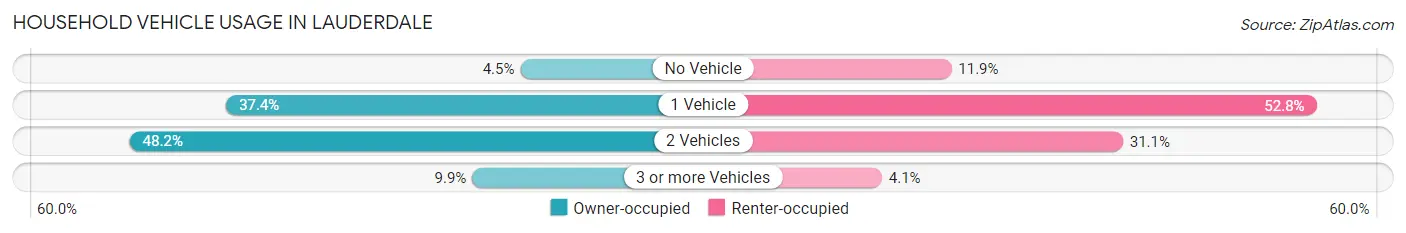
| Vehicles per Household | Owner-occupied | Renter-occupied |
| No Vehicle | 29 (4.5%) | 72 (11.9%) |
| 1 Vehicle | 243 (37.4%) | 319 (52.8%) |
| 2 Vehicles | 313 (48.2%) | 188 (31.1%) |
| 3 or more Vehicles | 64 (9.9%) | 25 (4.1%) |
| Total | 649 (100.0%) | 604 (100.0%) |
Real Estate & Mortgages in Lauderdale
Real Estate and Mortgage Overview in Lauderdale
| Characteristic | Without Mortgage | With Mortgage |
| Housing Units | 333 | 316 |
| Median Property Value | $272,800 | $276,500 |
| Median Household Income | $94,625 | $74 |
| Monthly Housing Costs | $673 | $18 |
| Real Estate Taxes | $3,530 | $0 |
Property Value by Mortgage Status in Lauderdale
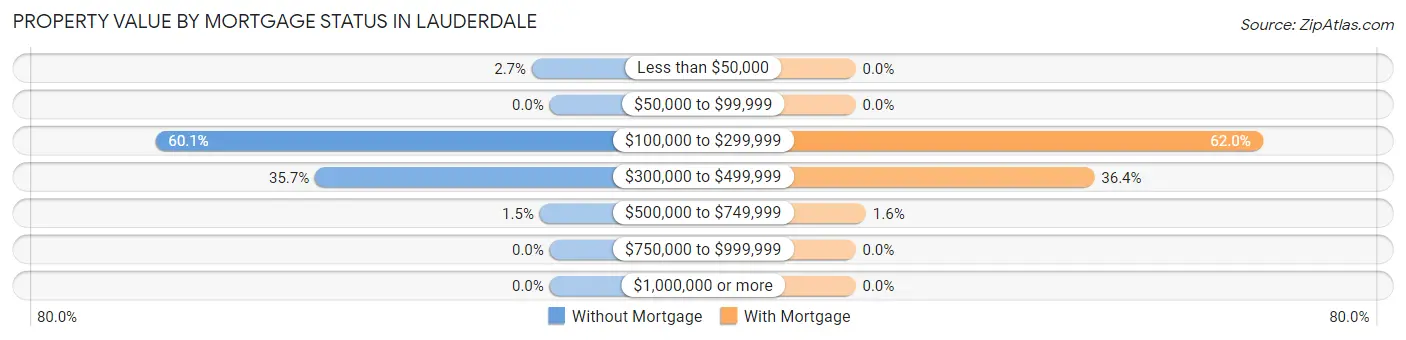
| Property Value | Without Mortgage | With Mortgage |
| Less than $50,000 | 9 (2.7%) | 0 (0.0%) |
| $50,000 to $99,999 | 0 (0.0%) | 0 (0.0%) |
| $100,000 to $299,999 | 200 (60.1%) | 196 (62.0%) |
| $300,000 to $499,999 | 119 (35.7%) | 115 (36.4%) |
| $500,000 to $749,999 | 5 (1.5%) | 5 (1.6%) |
| $750,000 to $999,999 | 0 (0.0%) | 0 (0.0%) |
| $1,000,000 or more | 0 (0.0%) | 0 (0.0%) |
| Total | 333 (100.0%) | 316 (100.0%) |
Household Income by Mortgage Status in Lauderdale
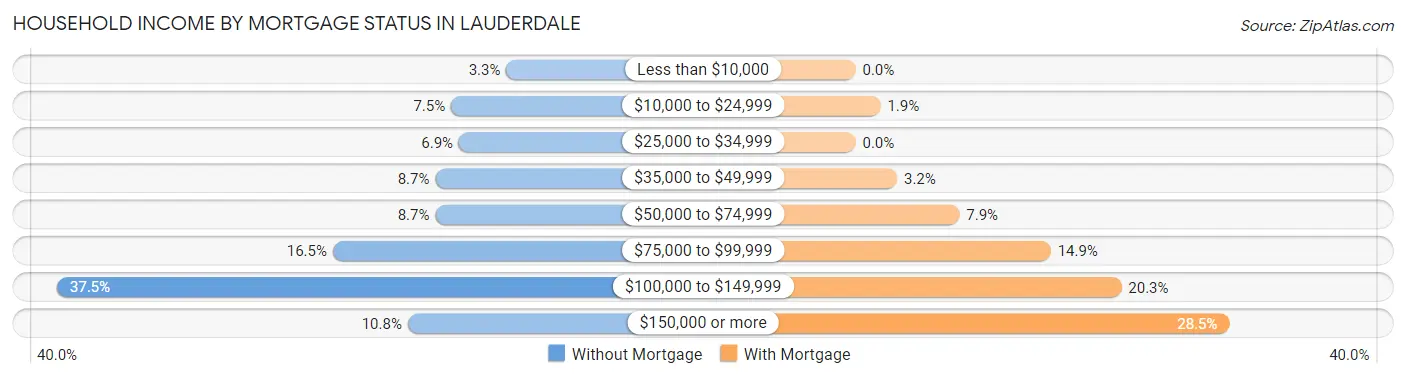
| Household Income | Without Mortgage | With Mortgage |
| Less than $10,000 | 11 (3.3%) | 0 (0.0%) |
| $10,000 to $24,999 | 25 (7.5%) | 6 (1.9%) |
| $25,000 to $34,999 | 23 (6.9%) | 0 (0.0%) |
| $35,000 to $49,999 | 29 (8.7%) | 10 (3.2%) |
| $50,000 to $74,999 | 29 (8.7%) | 25 (7.9%) |
| $75,000 to $99,999 | 55 (16.5%) | 47 (14.9%) |
| $100,000 to $149,999 | 125 (37.5%) | 64 (20.3%) |
| $150,000 or more | 36 (10.8%) | 90 (28.5%) |
| Total | 333 (100.0%) | 316 (100.0%) |
Property Value to Household Income Ratio in Lauderdale
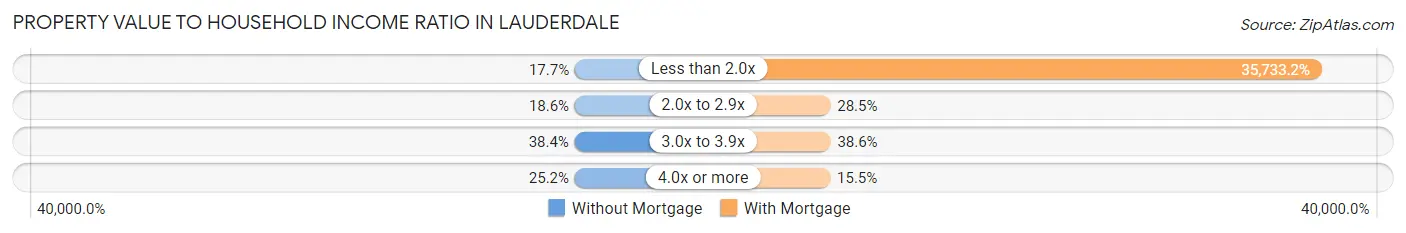
| Value-to-Income Ratio | Without Mortgage | With Mortgage |
| Less than 2.0x | 59 (17.7%) | 112,917 (35,733.2%) |
| 2.0x to 2.9x | 62 (18.6%) | 90 (28.5%) |
| 3.0x to 3.9x | 128 (38.4%) | 122 (38.6%) |
| 4.0x or more | 84 (25.2%) | 49 (15.5%) |
| Total | 333 (100.0%) | 316 (100.0%) |
Real Estate Taxes by Mortgage Status in Lauderdale

| Property Taxes | Without Mortgage | With Mortgage |
| Less than $800 | 0 (0.0%) | 6 (1.9%) |
| $800 to $1,499 | 42 (12.6%) | 5 (1.6%) |
| $800 to $1,499 | 282 (84.7%) | 46 (14.6%) |
| Total | 333 (100.0%) | 316 (100.0%) |
Health & Disability in Lauderdale
Health Insurance Coverage by Age in Lauderdale
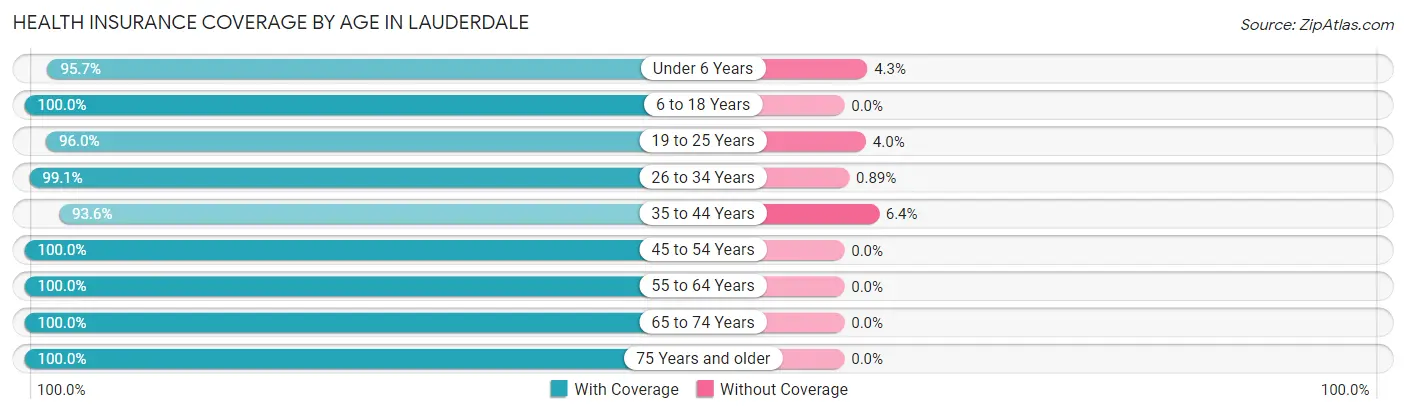
| Age Bracket | With Coverage | Without Coverage |
| Under 6 Years | 157 (95.7%) | 7 (4.3%) |
| 6 to 18 Years | 144 (100.0%) | 0 (0.0%) |
| 19 to 25 Years | 357 (96.0%) | 15 (4.0%) |
| 26 to 34 Years | 558 (99.1%) | 5 (0.9%) |
| 35 to 44 Years | 291 (93.6%) | 20 (6.4%) |
| 45 to 54 Years | 172 (100.0%) | 0 (0.0%) |
| 55 to 64 Years | 229 (100.0%) | 0 (0.0%) |
| 65 to 74 Years | 302 (100.0%) | 0 (0.0%) |
| 75 Years and older | 197 (100.0%) | 0 (0.0%) |
| Total | 2,407 (98.1%) | 47 (1.9%) |
Health Insurance Coverage by Citizenship Status in Lauderdale

| Citizenship Status | With Coverage | Without Coverage |
| Native Born | 157 (95.7%) | 7 (4.3%) |
| Foreign Born, Citizen | 144 (100.0%) | 0 (0.0%) |
| Foreign Born, not a Citizen | 357 (96.0%) | 15 (4.0%) |
Health Insurance Coverage by Household Income in Lauderdale
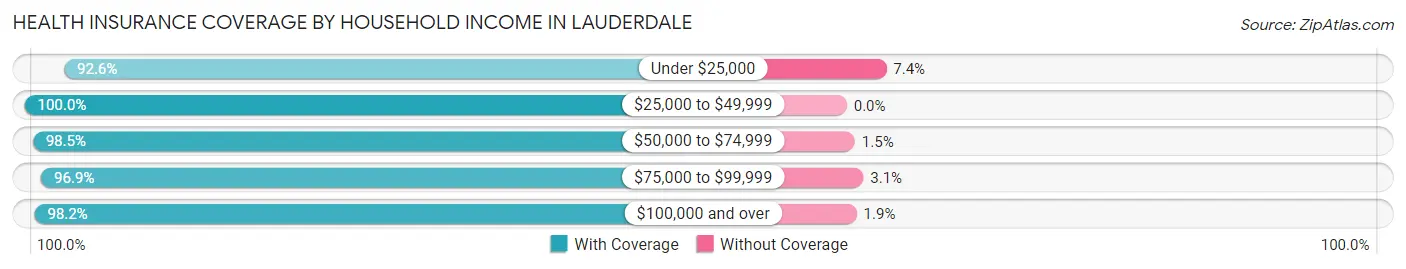
| Household Income | With Coverage | Without Coverage |
| Under $25,000 | 125 (92.6%) | 10 (7.4%) |
| $25,000 to $49,999 | 413 (100.0%) | 0 (0.0%) |
| $50,000 to $74,999 | 648 (98.5%) | 10 (1.5%) |
| $75,000 to $99,999 | 313 (96.9%) | 10 (3.1%) |
| $100,000 and over | 903 (98.2%) | 17 (1.8%) |
Public vs Private Health Insurance Coverage by Age in Lauderdale
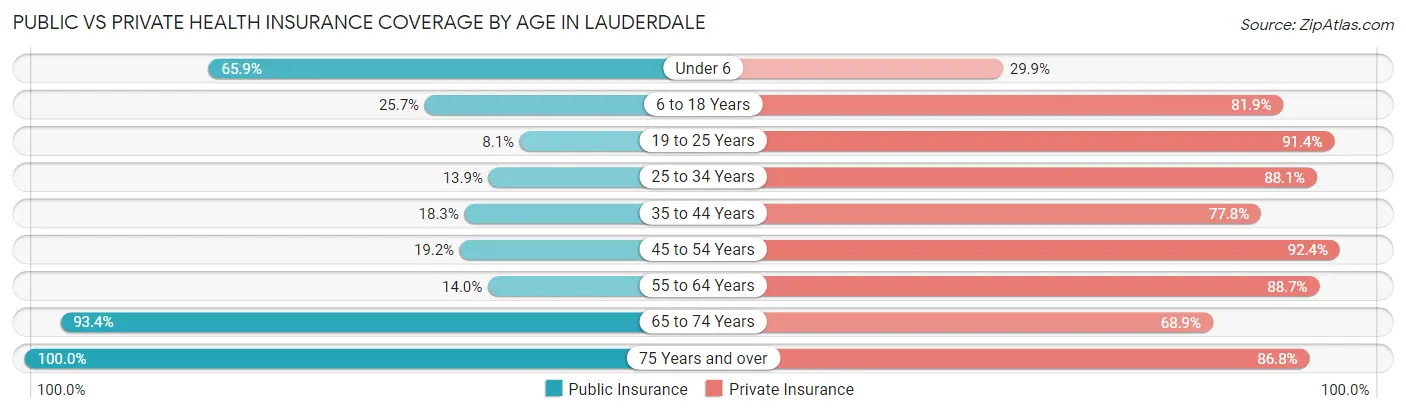
| Age Bracket | Public Insurance | Private Insurance |
| Under 6 | 108 (65.8%) | 49 (29.9%) |
| 6 to 18 Years | 37 (25.7%) | 118 (81.9%) |
| 19 to 25 Years | 30 (8.1%) | 340 (91.4%) |
| 25 to 34 Years | 78 (13.9%) | 496 (88.1%) |
| 35 to 44 Years | 57 (18.3%) | 242 (77.8%) |
| 45 to 54 Years | 33 (19.2%) | 159 (92.4%) |
| 55 to 64 Years | 32 (14.0%) | 203 (88.6%) |
| 65 to 74 Years | 282 (93.4%) | 208 (68.9%) |
| 75 Years and over | 197 (100.0%) | 171 (86.8%) |
| Total | 854 (34.8%) | 1,986 (80.9%) |
Disability Status by Sex by Age in Lauderdale
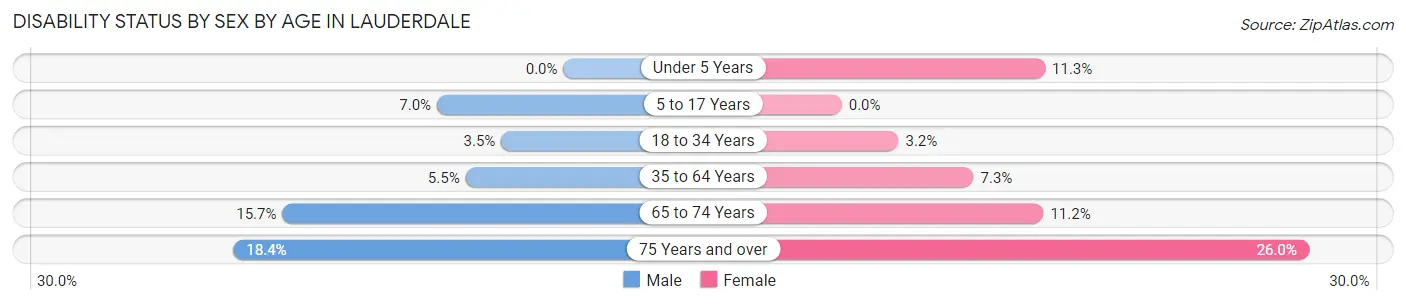
| Age Bracket | Male | Female |
| Under 5 Years | 0 (0.0%) | 6 (11.3%) |
| 5 to 17 Years | 10 (7.0%) | 0 (0.0%) |
| 18 to 34 Years | 16 (3.5%) | 15 (3.2%) |
| 35 to 64 Years | 21 (5.4%) | 24 (7.3%) |
| 65 to 74 Years | 18 (15.7%) | 21 (11.2%) |
| 75 Years and over | 27 (18.4%) | 13 (26.0%) |
Disability Class by Sex by Age in Lauderdale
Disability Class: Hearing Difficulty
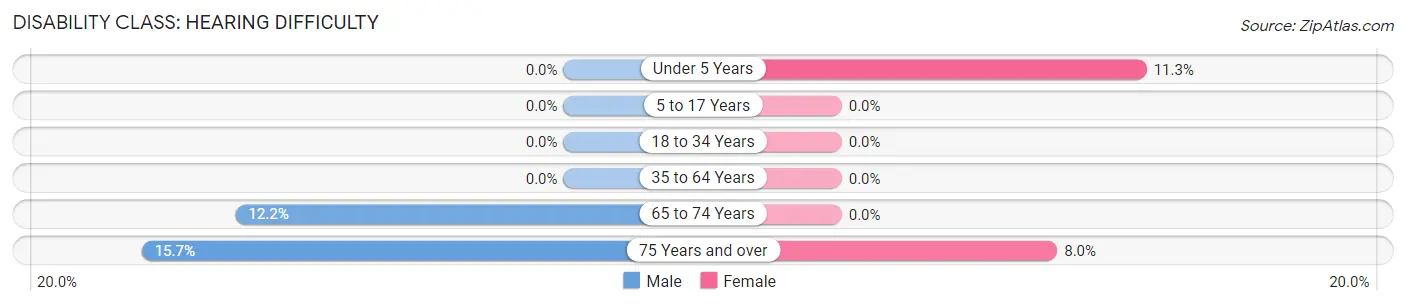
| Age Bracket | Male | Female |
| Under 5 Years | 0 (0.0%) | 6 (11.3%) |
| 5 to 17 Years | 0 (0.0%) | 0 (0.0%) |
| 18 to 34 Years | 0 (0.0%) | 0 (0.0%) |
| 35 to 64 Years | 0 (0.0%) | 0 (0.0%) |
| 65 to 74 Years | 14 (12.2%) | 0 (0.0%) |
| 75 Years and over | 23 (15.7%) | 4 (8.0%) |
Disability Class: Vision Difficulty
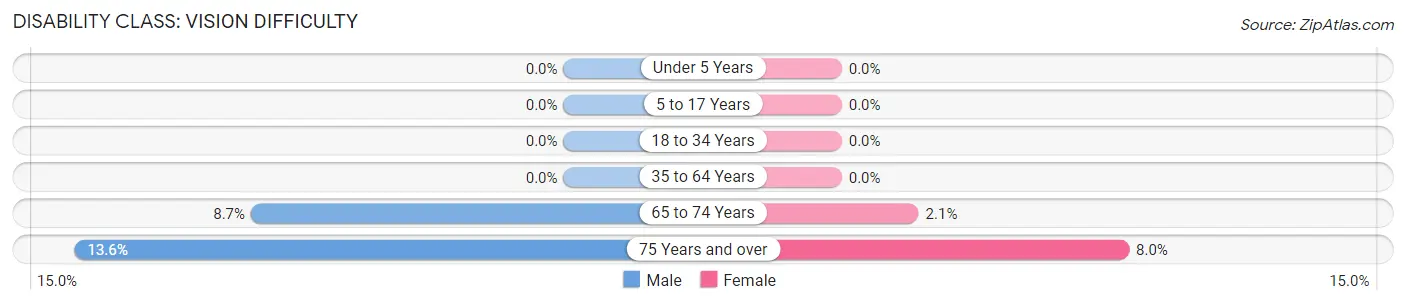
| Age Bracket | Male | Female |
| Under 5 Years | 0 (0.0%) | 0 (0.0%) |
| 5 to 17 Years | 0 (0.0%) | 0 (0.0%) |
| 18 to 34 Years | 0 (0.0%) | 0 (0.0%) |
| 35 to 64 Years | 0 (0.0%) | 0 (0.0%) |
| 65 to 74 Years | 10 (8.7%) | 4 (2.1%) |
| 75 Years and over | 20 (13.6%) | 4 (8.0%) |
Disability Class: Cognitive Difficulty
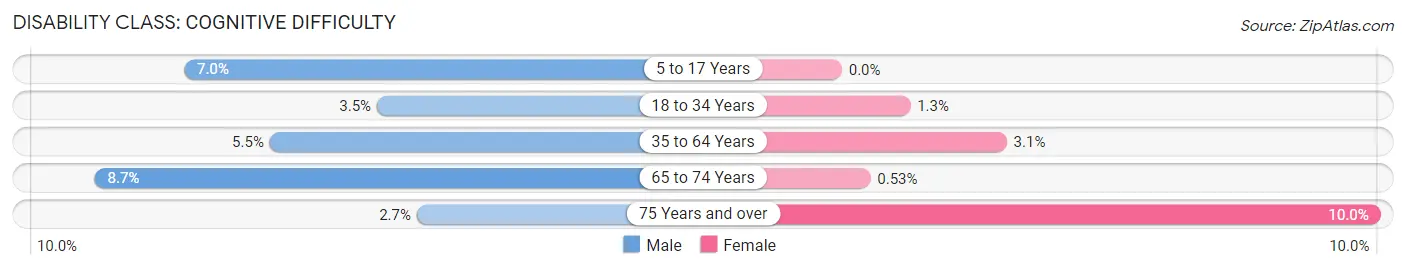
| Age Bracket | Male | Female |
| 5 to 17 Years | 10 (7.0%) | 0 (0.0%) |
| 18 to 34 Years | 16 (3.5%) | 6 (1.3%) |
| 35 to 64 Years | 21 (5.4%) | 10 (3.1%) |
| 65 to 74 Years | 10 (8.7%) | 1 (0.5%) |
| 75 Years and over | 4 (2.7%) | 5 (10.0%) |
Disability Class: Ambulatory Difficulty
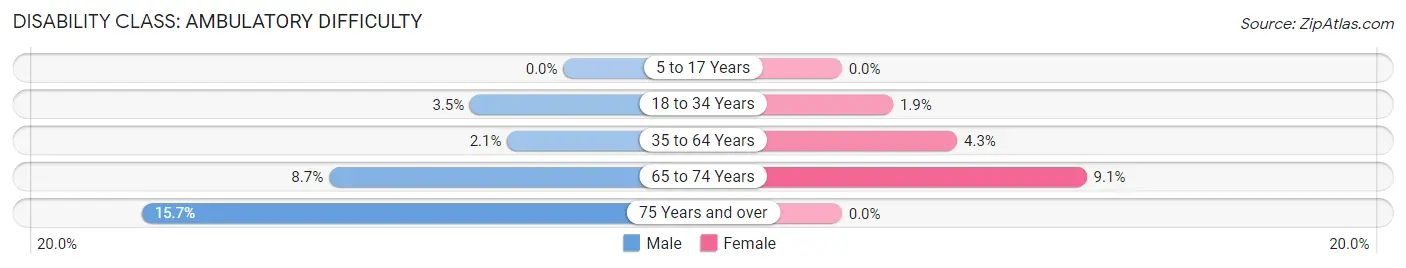
| Age Bracket | Male | Female |
| 5 to 17 Years | 0 (0.0%) | 0 (0.0%) |
| 18 to 34 Years | 16 (3.5%) | 9 (1.9%) |
| 35 to 64 Years | 8 (2.1%) | 14 (4.3%) |
| 65 to 74 Years | 10 (8.7%) | 17 (9.1%) |
| 75 Years and over | 23 (15.7%) | 0 (0.0%) |
Disability Class: Self-Care Difficulty
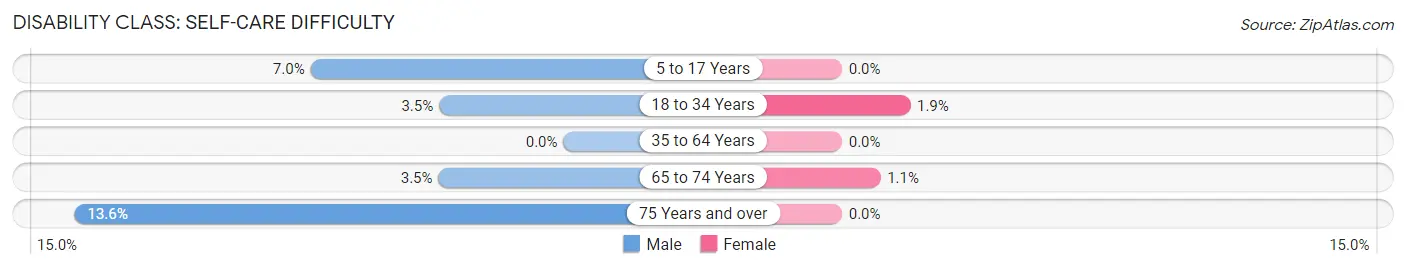
| Age Bracket | Male | Female |
| 5 to 17 Years | 10 (7.0%) | 0 (0.0%) |
| 18 to 34 Years | 16 (3.5%) | 9 (1.9%) |
| 35 to 64 Years | 0 (0.0%) | 0 (0.0%) |
| 65 to 74 Years | 4 (3.5%) | 2 (1.1%) |
| 75 Years and over | 20 (13.6%) | 0 (0.0%) |
Technology Access in Lauderdale
Computing Device Access in Lauderdale
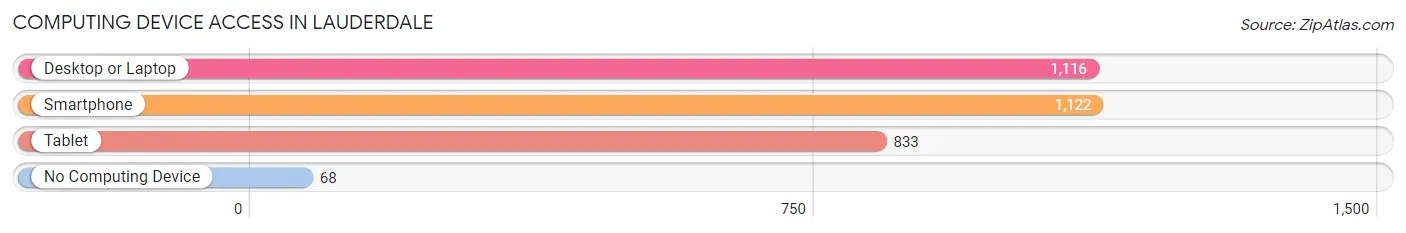
| Device Type | # Households | % Households |
| Desktop or Laptop | 1,116 | 89.1% |
| Smartphone | 1,122 | 89.5% |
| Tablet | 833 | 66.5% |
| No Computing Device | 68 | 5.4% |
| Total | 1,253 | 100.0% |
Internet Access in Lauderdale
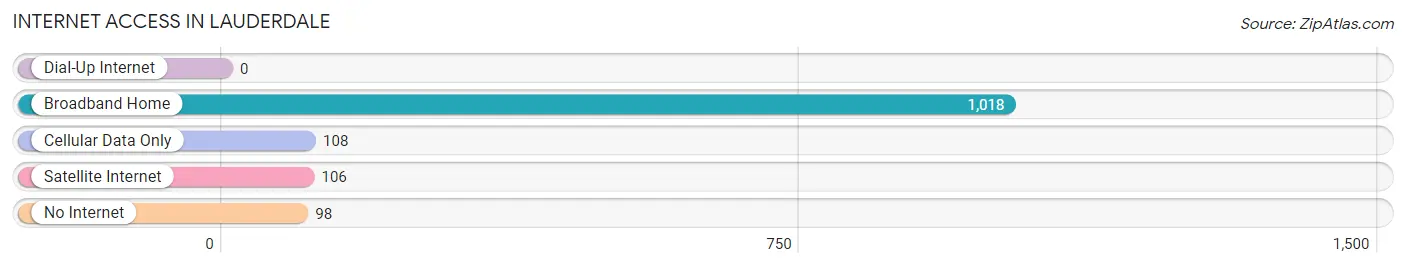
| Internet Type | # Households | % Households |
| Dial-Up Internet | 0 | 0.0% |
| Broadband Home | 1,018 | 81.2% |
| Cellular Data Only | 108 | 8.6% |
| Satellite Internet | 106 | 8.5% |
| No Internet | 98 | 7.8% |
| Total | 1,253 | 100.0% |
Lauderdale Summary
Lauderdale is a small city located in Ramsey County, Minnesota, United States. It is a suburb of the Twin Cities metropolitan area and is located just north of Minneapolis. The population was 8,845 at the 2010 census.
History
Lauderdale was first settled in 1851 by a group of German immigrants. The city was named after the Scottish town of Lauderdale, which was the birthplace of one of the settlers. The city was incorporated in 1887.
In the early 1900s, Lauderdale was a popular destination for wealthy Minneapolis residents who wanted to escape the city and enjoy the rural atmosphere. The city was known for its large estates and beautiful gardens.
In the 1950s, the city began to experience rapid growth as the Twin Cities metropolitan area expanded. The population of Lauderdale increased from 1,000 in 1950 to 8,845 in 2010.
Geography
Lauderdale is located in Ramsey County, Minnesota. It is situated on the east bank of the Mississippi River, just north of Minneapolis. The city has a total area of 4.2 square miles, all of which is land.
The city is located in the Anoka Sand Plain, which is a flat, sandy area with rolling hills and small lakes. The city is bordered by the cities of Roseville, Falcon Heights, and St. Anthony.
Economy
Lauderdale is primarily a residential community, but it does have some commercial and industrial businesses. The city is home to several large employers, including the University of Minnesota, the Minnesota Department of Transportation, and the Minnesota State Fair.
The city also has a number of small businesses, including restaurants, retail stores, and professional services. The city is also home to several parks and recreational facilities, including the Lauderdale Community Center and the Lauderdale Aquatic Center.
Demographics
As of the 2010 census, the population of Lauderdale was 8,845. The racial makeup of the city was 79.2% White, 8.3% African American, 0.3% Native American, 5.2% Asian, 0.1% Pacific Islander, 4.2% from other races, and 2.9% from two or more races. Hispanic or Latino of any race were 8.3% of the population.
The median income for a household in the city was $50,945, and the median income for a family was $62,917. The per capita income for the city was $27,945. About 4.3% of families and 6.2% of the population were below the poverty line, including 8.2% of those under age 18 and 4.2% of those age 65 or over.
Lauderdale is a diverse community with a variety of cultures and backgrounds. The city is home to a large number of immigrants from all over the world, including Africa, Asia, Europe, and Latin America. The city is also home to a large number of students from the University of Minnesota.
Common Questions
What is Per Capita Income in Lauderdale?
Per Capita income in Lauderdale is $42,250.
What is the Median Family Income in Lauderdale?
Median Family Income in Lauderdale is $89,219.
What is the Median Household income in Lauderdale?
Median Household Income in Lauderdale is $73,931.
What is Income or Wage Gap in Lauderdale?
Income or Wage Gap in Lauderdale is 22.1%.
Women in Lauderdale earn 77.9 cents for every dollar earned by a man.
What is Inequality or Gini Index in Lauderdale?
Inequality or Gini Index in Lauderdale is 0.34.
What is the Total Population of Lauderdale?
Total Population of Lauderdale is 2,454.
What is the Total Male Population of Lauderdale?
Total Male Population of Lauderdale is 1,328.
What is the Total Female Population of Lauderdale?
Total Female Population of Lauderdale is 1,126.
What is the Ratio of Males per 100 Females in Lauderdale?
There are 117.94 Males per 100 Females in Lauderdale.
What is the Ratio of Females per 100 Males in Lauderdale?
There are 84.79 Females per 100 Males in Lauderdale.
What is the Median Population Age in Lauderdale?
Median Population Age in Lauderdale is 34.2 Years.
What is the Average Family Size in Lauderdale
Average Family Size in Lauderdale is 2.7 People.
What is the Average Household Size in Lauderdale
Average Household Size in Lauderdale is 1.9 People.
How Large is the Labor Force in Lauderdale?
There are 1,579 People in the Labor Forcein in Lauderdale.
What is the Percentage of People in the Labor Force in Lauderdale?
71.6% of People are in the Labor Force in Lauderdale.
What is the Unemployment Rate in Lauderdale?
Unemployment Rate in Lauderdale is 10.7%.