Zip Codes with the Highest Percentage of Population Employed in Computer, Engineering & Science in Minnesota
RELATED REPORTS & OPTIONS
Computer, Engineering & Science
Minnesota
Compare Zip Codes
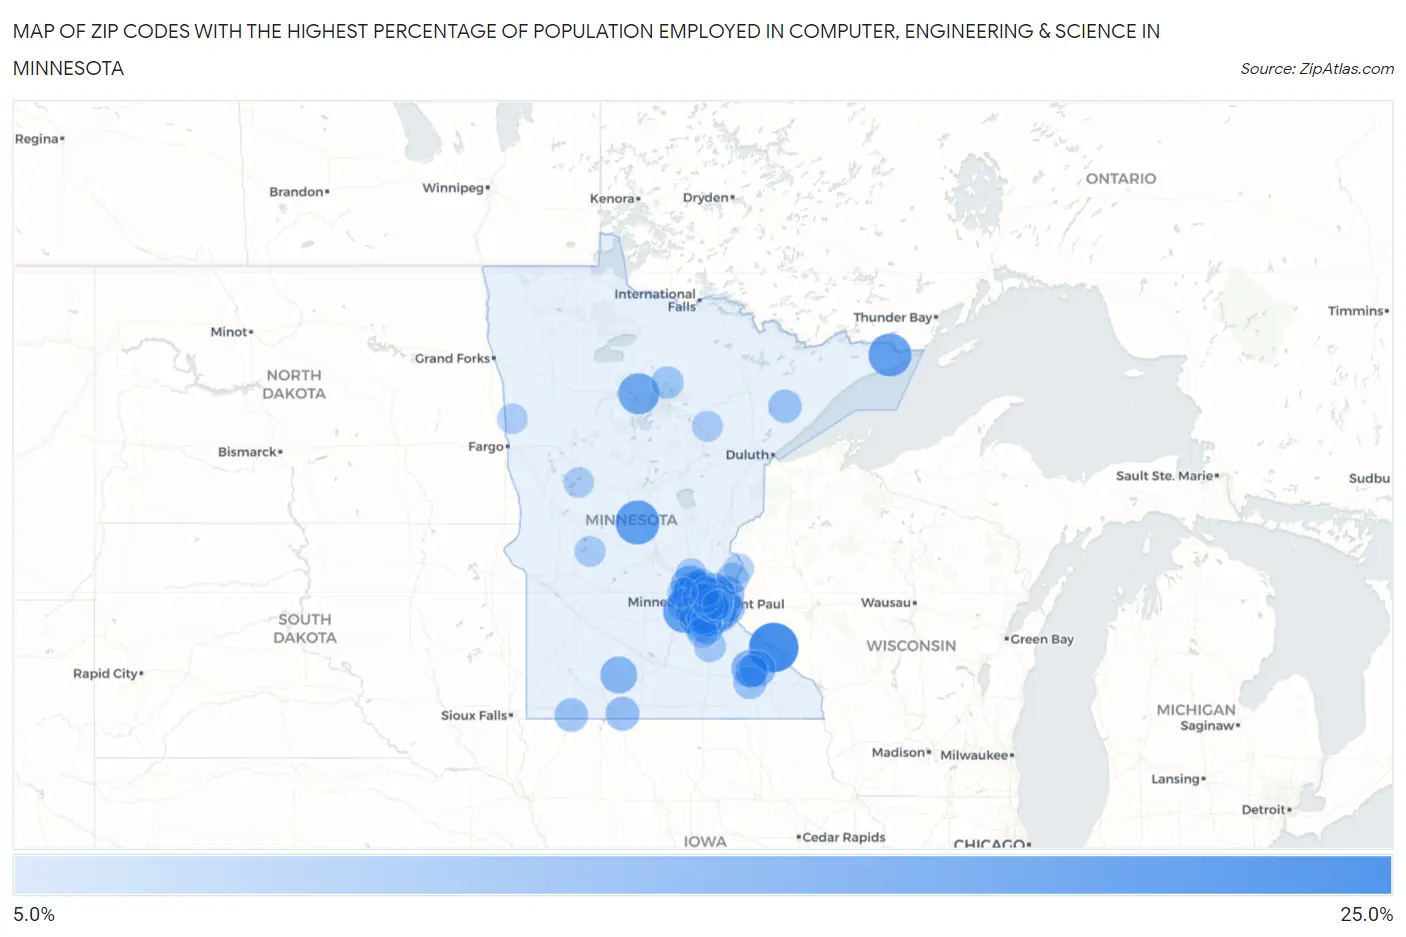
Map of Zip Codes with the Highest Percentage of Population Employed in Computer, Engineering & Science in Minnesota
5.0%
25.0%
Zip Codes with the Highest Percentage of Population Employed in Computer, Engineering & Science in Minnesota
| Zip Code | % Employed | vs State | vs National | |
| 1. | 55968 | 22.0% | 7.5%(+14.5)#1 | 6.8%(+15.2)#391 |
| 2. | 56328 | 18.0% | 7.5%(+10.5)#2 | 6.8%(+11.2)#683 |
| 3. | 55346 | 17.9% | 7.5%(+10.4)#3 | 6.8%(+11.2)#689 |
| 4. | 55386 | 17.8% | 7.5%(+10.3)#4 | 6.8%(+11.0)#716 |
| 5. | 55415 | 17.7% | 7.5%(+10.2)#5 | 6.8%(+11.0)#726 |
| 6. | 55446 | 17.5% | 7.5%(+10.1)#6 | 6.8%(+10.8)#747 |
| 7. | 55606 | 17.3% | 7.5%(+9.87)#7 | 6.8%(+10.6)#769 |
| 8. | 55401 | 16.9% | 7.5%(+9.42)#8 | 6.8%(+10.1)#830 |
| 9. | 55114 | 16.5% | 7.5%(+8.99)#9 | 6.8%(+9.70)#892 |
| 10. | 55344 | 16.1% | 7.5%(+8.63)#10 | 6.8%(+9.34)#941 |
| 11. | 56663 | 15.9% | 7.5%(+8.43)#11 | 6.8%(+9.14)#976 |
| 12. | 55311 | 14.8% | 7.5%(+7.30)#12 | 6.8%(+8.01)#1,158 |
| 13. | 55123 | 14.3% | 7.5%(+6.85)#13 | 6.8%(+7.57)#1,257 |
| 14. | 55374 | 14.1% | 7.5%(+6.66)#14 | 6.8%(+7.37)#1,303 |
| 15. | 55126 | 14.0% | 7.5%(+6.57)#15 | 6.8%(+7.28)#1,326 |
| 16. | 55960 | 13.4% | 7.5%(+5.92)#16 | 6.8%(+6.64)#1,506 |
| 17. | 55101 | 13.4% | 7.5%(+5.89)#17 | 6.8%(+6.60)#1,514 |
| 18. | 55435 | 13.3% | 7.5%(+5.84)#18 | 6.8%(+6.55)#1,538 |
| 19. | 55426 | 13.1% | 7.5%(+5.58)#19 | 6.8%(+6.29)#1,631 |
| 20. | 55108 | 13.1% | 7.5%(+5.57)#20 | 6.8%(+6.29)#1,635 |
| 21. | 56022 | 13.0% | 7.5%(+5.57)#21 | 6.8%(+6.28)#1,637 |
| 22. | 55417 | 12.7% | 7.5%(+5.26)#22 | 6.8%(+5.97)#1,734 |
| 23. | 55416 | 12.7% | 7.5%(+5.24)#23 | 6.8%(+5.95)#1,744 |
| 24. | 55113 | 12.7% | 7.5%(+5.21)#24 | 6.8%(+5.92)#1,753 |
| 25. | 55402 | 12.6% | 7.5%(+5.09)#25 | 6.8%(+5.80)#1,796 |
| 26. | 55419 | 12.5% | 7.5%(+5.05)#26 | 6.8%(+5.76)#1,806 |
| 27. | 55906 | 12.5% | 7.5%(+5.05)#27 | 6.8%(+5.76)#1,807 |
| 28. | 55413 | 12.5% | 7.5%(+5.03)#28 | 6.8%(+5.74)#1,814 |
| 29. | 55408 | 12.5% | 7.5%(+5.02)#29 | 6.8%(+5.73)#1,826 |
| 30. | 55340 | 12.4% | 7.5%(+4.97)#30 | 6.8%(+5.68)#1,845 |
| 31. | 55115 | 12.4% | 7.5%(+4.90)#31 | 6.8%(+5.61)#1,871 |
| 32. | 55369 | 12.2% | 7.5%(+4.73)#32 | 6.8%(+5.45)#1,943 |
| 33. | 55403 | 12.1% | 7.5%(+4.61)#33 | 6.8%(+5.33)#1,995 |
| 34. | 55345 | 12.0% | 7.5%(+4.55)#34 | 6.8%(+5.26)#2,026 |
| 35. | 55410 | 12.0% | 7.5%(+4.49)#35 | 6.8%(+5.20)#2,052 |
| 36. | 55431 | 11.9% | 7.5%(+4.42)#36 | 6.8%(+5.13)#2,085 |
| 37. | 55447 | 11.9% | 7.5%(+4.42)#37 | 6.8%(+5.13)#2,088 |
| 38. | 55129 | 11.8% | 7.5%(+4.32)#38 | 6.8%(+5.03)#2,137 |
| 39. | 55076 | 11.8% | 7.5%(+4.29)#39 | 6.8%(+5.00)#2,144 |
| 40. | 55102 | 11.6% | 7.5%(+4.15)#40 | 6.8%(+4.87)#2,219 |
| 41. | 55127 | 11.6% | 7.5%(+4.11)#41 | 6.8%(+4.83)#2,243 |
| 42. | 55305 | 11.6% | 7.5%(+4.09)#42 | 6.8%(+4.81)#2,254 |
| 43. | 55347 | 11.6% | 7.5%(+4.09)#43 | 6.8%(+4.80)#2,257 |
| 44. | 55343 | 11.6% | 7.5%(+4.09)#44 | 6.8%(+4.80)#2,258 |
| 45. | 55105 | 11.5% | 7.5%(+4.06)#45 | 6.8%(+4.78)#2,274 |
| 46. | 55437 | 11.5% | 7.5%(+4.01)#46 | 6.8%(+4.72)#2,306 |
| 47. | 55409 | 11.5% | 7.5%(+4.00)#47 | 6.8%(+4.71)#2,317 |
| 48. | 55439 | 11.4% | 7.5%(+3.94)#48 | 6.8%(+4.65)#2,348 |
| 49. | 55418 | 11.3% | 7.5%(+3.78)#49 | 6.8%(+4.49)#2,437 |
| 50. | 55445 | 11.2% | 7.5%(+3.74)#50 | 6.8%(+4.45)#2,452 |
| 51. | 55077 | 11.2% | 7.5%(+3.70)#51 | 6.8%(+4.41)#2,471 |
| 52. | 56127 | 11.1% | 7.5%(+3.64)#52 | 6.8%(+4.35)#2,506 |
| 53. | 55427 | 11.0% | 7.5%(+3.56)#53 | 6.8%(+4.27)#2,547 |
| 54. | 55405 | 11.0% | 7.5%(+3.54)#54 | 6.8%(+4.25)#2,563 |
| 55. | 55436 | 11.0% | 7.5%(+3.52)#55 | 6.8%(+4.23)#2,568 |
| 56. | 55441 | 10.9% | 7.5%(+3.38)#56 | 6.8%(+4.09)#2,649 |
| 57. | 56117 | 10.8% | 7.5%(+3.35)#57 | 6.8%(+4.06)#2,667 |
| 58. | 55122 | 10.8% | 7.5%(+3.33)#58 | 6.8%(+4.04)#2,675 |
| 59. | 55414 | 10.7% | 7.5%(+3.24)#59 | 6.8%(+3.95)#2,721 |
| 60. | 55364 | 10.7% | 7.5%(+3.22)#60 | 6.8%(+3.93)#2,731 |
| 61. | 55406 | 10.7% | 7.5%(+3.20)#61 | 6.8%(+3.91)#2,741 |
| 62. | 55124 | 10.7% | 7.5%(+3.20)#62 | 6.8%(+3.91)#2,743 |
| 63. | 55423 | 10.6% | 7.5%(+3.15)#63 | 6.8%(+3.86)#2,783 |
| 64. | 55602 | 10.6% | 7.5%(+3.14)#64 | 6.8%(+3.85)#2,788 |
| 65. | 55442 | 10.5% | 7.5%(+3.05)#65 | 6.8%(+3.76)#2,850 |
| 66. | 55902 | 10.5% | 7.5%(+3.01)#66 | 6.8%(+3.73)#2,875 |
| 67. | 55438 | 10.4% | 7.5%(+2.93)#67 | 6.8%(+3.64)#2,924 |
| 68. | 55120 | 10.4% | 7.5%(+2.92)#68 | 6.8%(+3.63)#2,936 |
| 69. | 55901 | 10.4% | 7.5%(+2.90)#69 | 6.8%(+3.61)#2,948 |
| 70. | 55112 | 10.3% | 7.5%(+2.82)#70 | 6.8%(+3.53)#2,997 |
| 71. | 55125 | 10.3% | 7.5%(+2.81)#71 | 6.8%(+3.53)#3,003 |
| 72. | 55118 | 10.3% | 7.5%(+2.79)#72 | 6.8%(+3.51)#3,015 |
| 73. | 55316 | 10.2% | 7.5%(+2.68)#73 | 6.8%(+3.39)#3,110 |
| 74. | 55150 | 10.0% | 7.5%(+2.52)#74 | 6.8%(+3.24)#3,217 |
| 75. | 56680 | 10.0% | 7.5%(+2.52)#75 | 6.8%(+3.24)#3,220 |
| 76. | 55073 | 9.7% | 7.5%(+2.26)#76 | 6.8%(+2.97)#3,415 |
| 77. | 55372 | 9.7% | 7.5%(+2.24)#77 | 6.8%(+2.95)#3,430 |
| 78. | 55019 | 9.7% | 7.5%(+2.19)#78 | 6.8%(+2.90)#3,470 |
| 79. | 55337 | 9.5% | 7.5%(+2.01)#79 | 6.8%(+2.72)#3,613 |
| 80. | 55379 | 9.4% | 7.5%(+1.96)#80 | 6.8%(+2.68)#3,652 |
| 81. | 55044 | 9.4% | 7.5%(+1.93)#81 | 6.8%(+2.64)#3,681 |
| 82. | 55317 | 9.2% | 7.5%(+1.76)#82 | 6.8%(+2.47)#3,833 |
| 83. | 55378 | 9.2% | 7.5%(+1.73)#83 | 6.8%(+2.44)#3,859 |
| 84. | 55117 | 9.2% | 7.5%(+1.72)#84 | 6.8%(+2.43)#3,865 |
| 85. | 55306 | 9.1% | 7.5%(+1.67)#85 | 6.8%(+2.38)#3,917 |
| 86. | 55020 | 9.1% | 7.5%(+1.62)#86 | 6.8%(+2.33)#3,966 |
| 87. | 55104 | 9.1% | 7.5%(+1.61)#87 | 6.8%(+2.32)#3,980 |
| 88. | 56334 | 9.0% | 7.5%(+1.53)#88 | 6.8%(+2.24)#4,069 |
| 89. | 55330 | 9.0% | 7.5%(+1.50)#89 | 6.8%(+2.21)#4,092 |
| 90. | 55116 | 9.0% | 7.5%(+1.50)#90 | 6.8%(+2.21)#4,094 |
| 91. | 55793 | 8.9% | 7.5%(+1.43)#91 | 6.8%(+2.14)#4,166 |
| 92. | 55412 | 8.9% | 7.5%(+1.41)#92 | 6.8%(+2.12)#4,190 |
| 93. | 56574 | 8.7% | 7.5%(+1.19)#93 | 6.8%(+1.91)#4,405 |
| 94. | 56571 | 8.6% | 7.5%(+1.16)#94 | 6.8%(+1.87)#4,439 |
| 95. | 55074 | 8.6% | 7.5%(+1.14)#95 | 6.8%(+1.85)#4,464 |
| 96. | 55407 | 8.6% | 7.5%(+1.13)#96 | 6.8%(+1.84)#4,474 |
| 97. | 55422 | 8.6% | 7.5%(+1.12)#97 | 6.8%(+1.83)#4,491 |
| 98. | 55444 | 8.6% | 7.5%(+1.11)#98 | 6.8%(+1.82)#4,512 |
| 99. | 55373 | 8.6% | 7.5%(+1.10)#99 | 6.8%(+1.81)#4,516 |
| 100. | 55107 | 8.6% | 7.5%(+1.08)#100 | 6.8%(+1.79)#4,543 |
Common Questions
What are the Top 10 Zip Codes with the Highest Percentage of Population Employed in Computer, Engineering & Science in Minnesota?
Top 10 Zip Codes with the Highest Percentage of Population Employed in Computer, Engineering & Science in Minnesota are:
What zip code has the Highest Percentage of Population Employed in Computer, Engineering & Science in Minnesota?
55968 has the Highest Percentage of Population Employed in Computer, Engineering & Science in Minnesota with 22.0%.
What is the Percentage of Population Employed in Computer, Engineering & Science in the State of Minnesota?
Percentage of Population Employed in Computer, Engineering & Science in Minnesota is 7.5%.
What is the Percentage of Population Employed in Computer, Engineering & Science in the United States?
Percentage of Population Employed in Computer, Engineering & Science in the United States is 6.8%.