Canby, MN Map & Demographics
Canby Map
Canby Overview
$34,154
PER CAPITA INCOME
$82,000
AVG FAMILY INCOME
$55,870
AVG HOUSEHOLD INCOME
45.9%
WAGE / INCOME GAP [ % ]
54.1¢/ $1
WAGE / INCOME GAP [ $ ]
0.45
INEQUALITY / GINI INDEX
1,479
TOTAL POPULATION
721
MALE POPULATION
758
FEMALE POPULATION
95.12
MALES / 100 FEMALES
105.13
FEMALES / 100 MALES
42.8
MEDIAN AGE
2.6
AVG FAMILY SIZE
2.0
AVG HOUSEHOLD SIZE
678
LABOR FORCE [ PEOPLE ]
54.4%
PERCENT IN LABOR FORCE
6.3%
UNEMPLOYMENT RATE
Canby Zip Codes
Canby Area Codes
Income in Canby
Income Overview in Canby
Per Capita Income in Canby is $34,154, while median incomes of families and households are $82,000 and $55,870 respectively.
| Characteristic | Number | Measure |
| Per Capita Income | 1,479 | $34,154 |
| Median Family Income | 406 | $82,000 |
| Mean Family Income | 406 | $94,071 |
| Median Household Income | 680 | $55,870 |
| Mean Household Income | 680 | $71,888 |
| Income Deficit | 406 | $0 |
| Wage / Income Gap (%) | 1,479 | 45.89% |
| Wage / Income Gap ($) | 1,479 | 54.11¢ per $1 |
| Gini / Inequality Index | 1,479 | 0.45 |
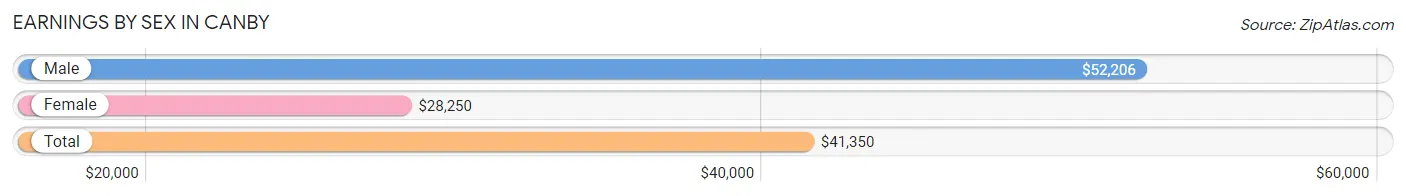
Earnings by Sex in Canby
Average Earnings in Canby are $41,350, $52,206 for men and $28,250 for women, a difference of 45.9%.
| Sex | Number | Average Earnings |
| Male | 360 (50.8%) | $52,206 |
| Female | 349 (49.2%) | $28,250 |
| Total | 709 (100.0%) | $41,350 |
Earnings by Sex by Income Bracket in Canby
The most common earnings brackets in Canby are $55,000 to $64,999 for men (69 | 19.2%) and $2,500 to $4,999 for women (50 | 14.3%).
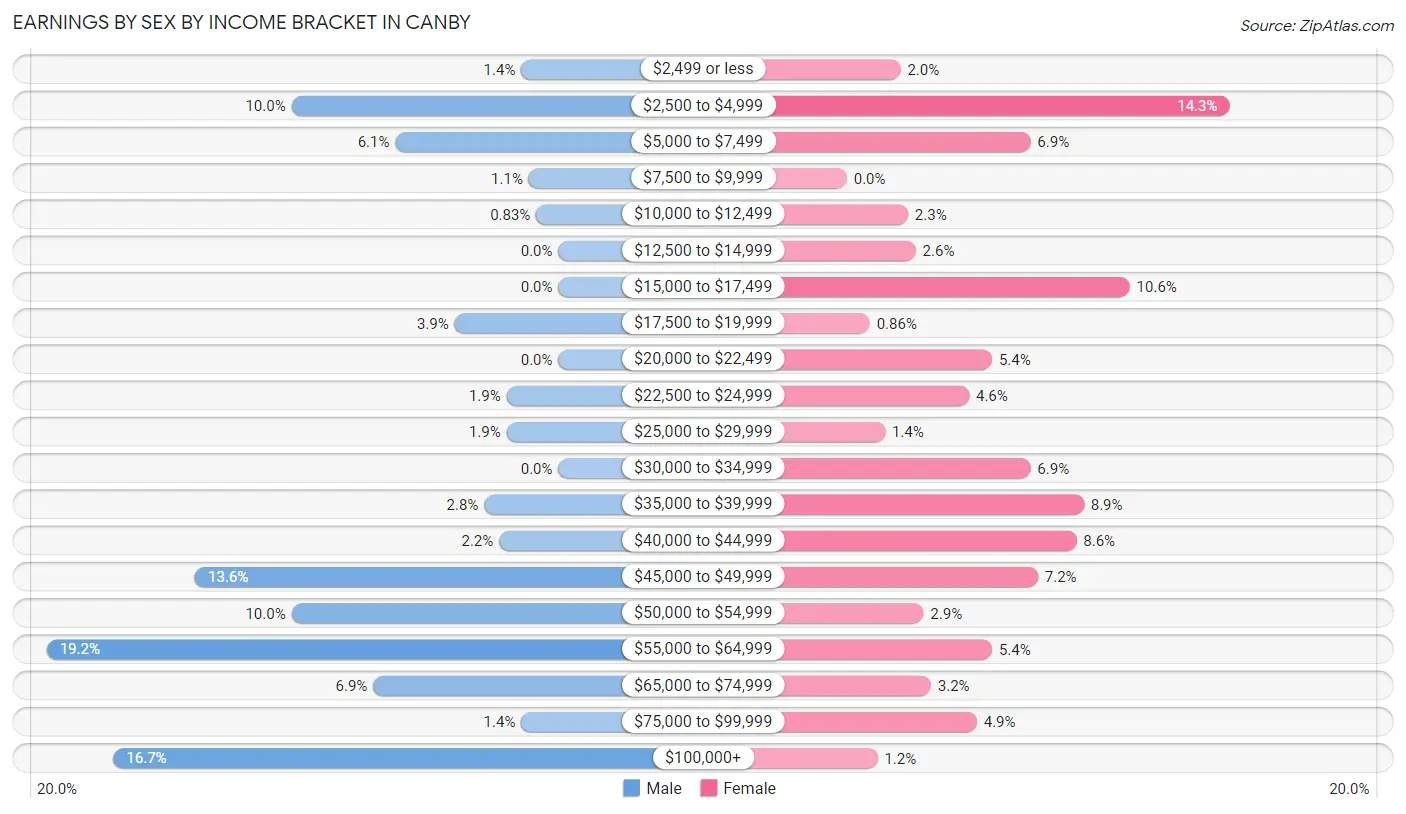
| Income | Male | Female |
| $2,499 or less | 5 (1.4%) | 7 (2.0%) |
| $2,500 to $4,999 | 36 (10.0%) | 50 (14.3%) |
| $5,000 to $7,499 | 22 (6.1%) | 24 (6.9%) |
| $7,500 to $9,999 | 4 (1.1%) | 0 (0.0%) |
| $10,000 to $12,499 | 3 (0.8%) | 8 (2.3%) |
| $12,500 to $14,999 | 0 (0.0%) | 9 (2.6%) |
| $15,000 to $17,499 | 0 (0.0%) | 37 (10.6%) |
| $17,500 to $19,999 | 14 (3.9%) | 3 (0.9%) |
| $20,000 to $22,499 | 0 (0.0%) | 19 (5.4%) |
| $22,500 to $24,999 | 7 (1.9%) | 16 (4.6%) |
| $25,000 to $29,999 | 7 (1.9%) | 5 (1.4%) |
| $30,000 to $34,999 | 0 (0.0%) | 24 (6.9%) |
| $35,000 to $39,999 | 10 (2.8%) | 31 (8.9%) |
| $40,000 to $44,999 | 8 (2.2%) | 30 (8.6%) |
| $45,000 to $49,999 | 49 (13.6%) | 25 (7.2%) |
| $50,000 to $54,999 | 36 (10.0%) | 10 (2.9%) |
| $55,000 to $64,999 | 69 (19.2%) | 19 (5.4%) |
| $65,000 to $74,999 | 25 (6.9%) | 11 (3.2%) |
| $75,000 to $99,999 | 5 (1.4%) | 17 (4.9%) |
| $100,000+ | 60 (16.7%) | 4 (1.1%) |
| Total | 360 (100.0%) | 349 (100.0%) |
Earnings by Sex by Educational Attainment in Canby
Average earnings in Canby are $56,544 for men and $34,205 for women, a difference of 39.5%. Men with an educational attainment of college or associate's degree enjoy the highest average annual earnings of $55,551, while those with bachelor's degree education earn the least with $50,625. Women with an educational attainment of graduate degree earn the most with the average annual earnings of $60,000, while those with high school diploma education have the smallest earnings of $18,750.
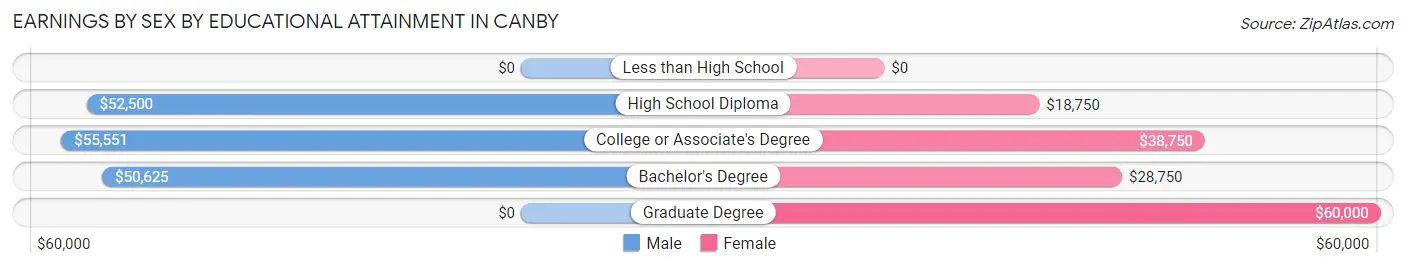
| Educational Attainment | Male Income | Female Income |
| Less than High School | - | - |
| High School Diploma | $52,500 | $18,750 |
| College or Associate's Degree | $55,551 | $38,750 |
| Bachelor's Degree | $50,625 | $28,750 |
| Graduate Degree | - | - |
| Total | $56,544 | $34,205 |
Family Income in Canby
Family Income Brackets in Canby
According to the Canby family income data, there are 92 families falling into the $50,000 to $74,999 income range, which is the most common income bracket and makes up 22.7% of all families.
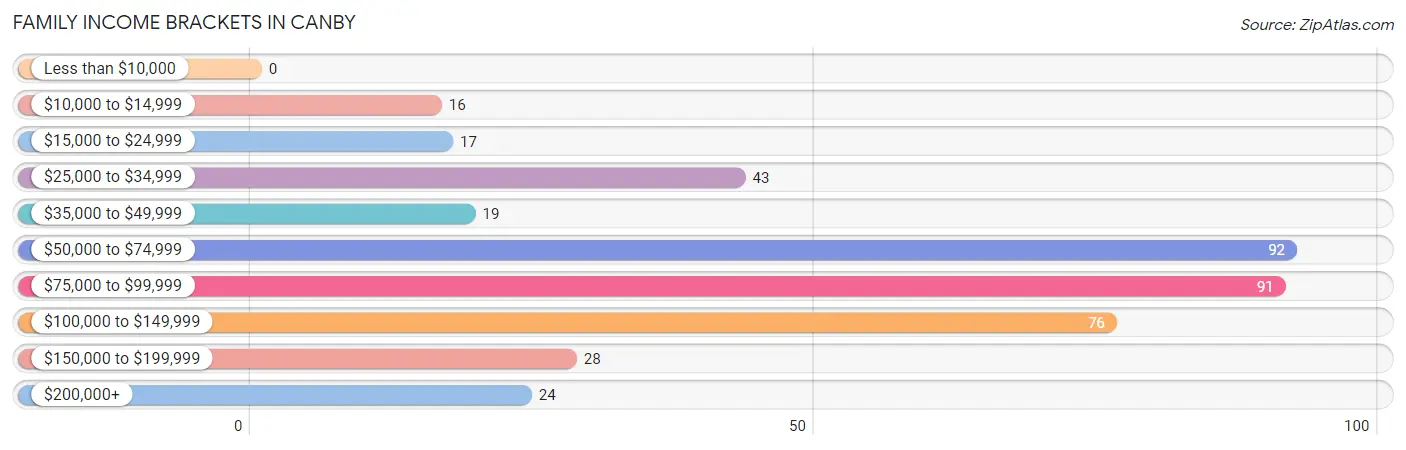
| Income Bracket | # Families | % Families |
| Less than $10,000 | 0 | 0.0% |
| $10,000 to $14,999 | 16 | 3.9% |
| $15,000 to $24,999 | 17 | 4.2% |
| $25,000 to $34,999 | 43 | 10.6% |
| $35,000 to $49,999 | 19 | 4.7% |
| $50,000 to $74,999 | 92 | 22.7% |
| $75,000 to $99,999 | 91 | 22.4% |
| $100,000 to $149,999 | 76 | 18.7% |
| $150,000 to $199,999 | 28 | 6.9% |
| $200,000+ | 24 | 5.9% |
Family Income by Famaliy Size in Canby
2-person families (234 | 57.6%) account for the highest median family income in Canby with $86,800 per family, while 2-person families (234 | 57.6%) have the highest median income of $43,400 per family member.
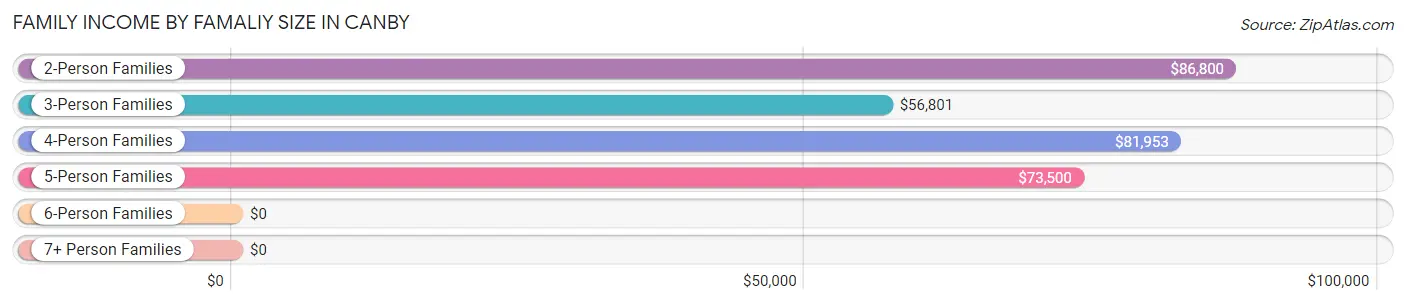
| Income Bracket | # Families | Median Income |
| 2-Person Families | 234 (57.6%) | $86,800 |
| 3-Person Families | 85 (20.9%) | $56,801 |
| 4-Person Families | 61 (15.0%) | $81,953 |
| 5-Person Families | 26 (6.4%) | $73,500 |
| 6-Person Families | 0 (0.0%) | $0 |
| 7+ Person Families | 0 (0.0%) | $0 |
| Total | 406 (100.0%) | $82,000 |
Family Income by Number of Earners in Canby
The median family income in Canby is $82,000, with families comprising 3+ earners (43) having the highest median family income of $121,250, while families with no earners (92) have the lowest median family income of $36,000, accounting for 10.6% and 22.7% of families, respectively.
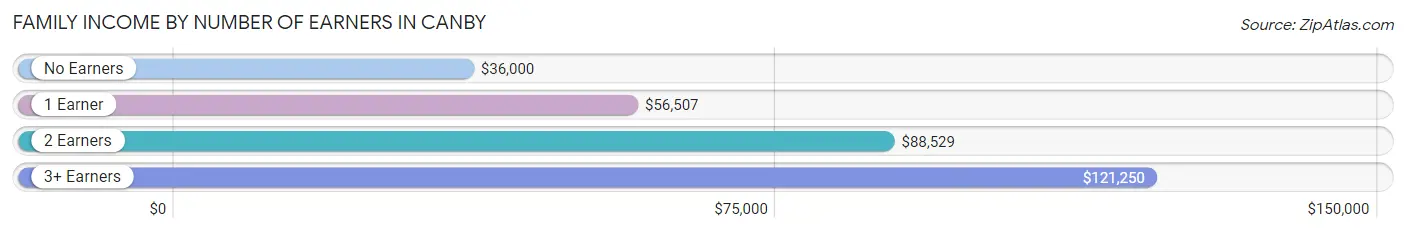
| Number of Earners | # Families | Median Income |
| No Earners | 92 (22.7%) | $36,000 |
| 1 Earner | 99 (24.4%) | $56,507 |
| 2 Earners | 172 (42.4%) | $88,529 |
| 3+ Earners | 43 (10.6%) | $121,250 |
| Total | 406 (100.0%) | $82,000 |
Household Income in Canby
Household Income Brackets in Canby
With 123 households falling in the category, the $50,000 to $74,999 income range is the most frequent in Canby, accounting for 18.1% of all households. In contrast, only 18 households (2.6%) fall into the less than $10,000 income bracket, making it the least populous group.
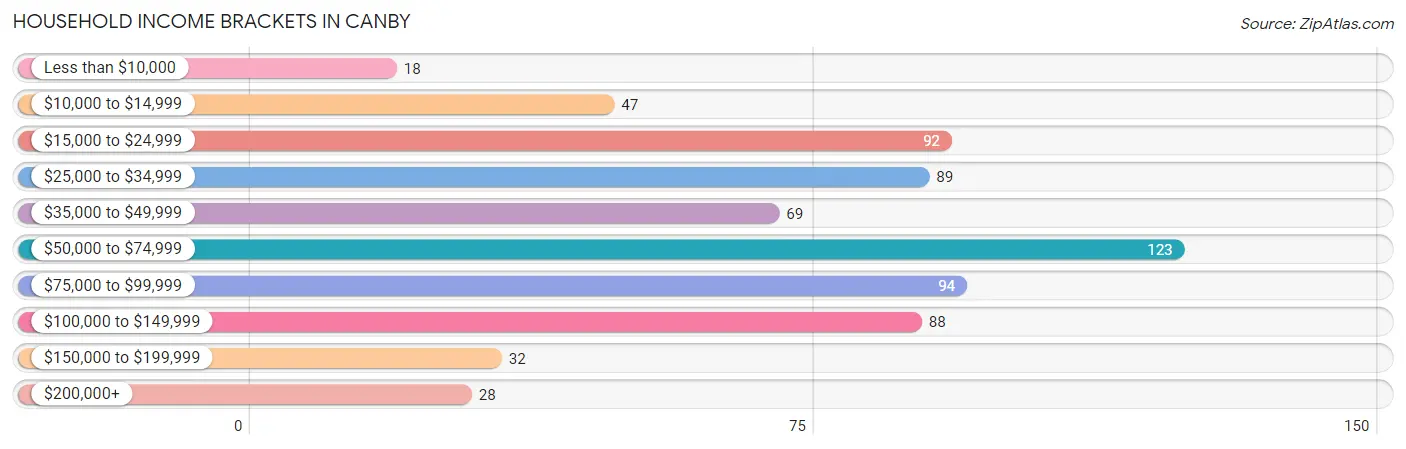
| Income Bracket | # Households | % Households |
| Less than $10,000 | 18 | 2.6% |
| $10,000 to $14,999 | 47 | 6.9% |
| $15,000 to $24,999 | 92 | 13.5% |
| $25,000 to $34,999 | 89 | 13.1% |
| $35,000 to $49,999 | 69 | 10.1% |
| $50,000 to $74,999 | 123 | 18.1% |
| $75,000 to $99,999 | 94 | 13.8% |
| $100,000 to $149,999 | 88 | 12.9% |
| $150,000 to $199,999 | 32 | 4.7% |
| $200,000+ | 28 | 4.1% |
Household Income by Householder Age in Canby
The median household income in Canby is $55,870, with the highest median household income of $86,429 found in the 45 to 64 years age bracket for the primary householder. A total of 188 households (27.7%) fall into this category. Meanwhile, the 15 to 24 years age bracket for the primary householder has the lowest median household income of $24,091, with 40 households (5.9%) in this group.
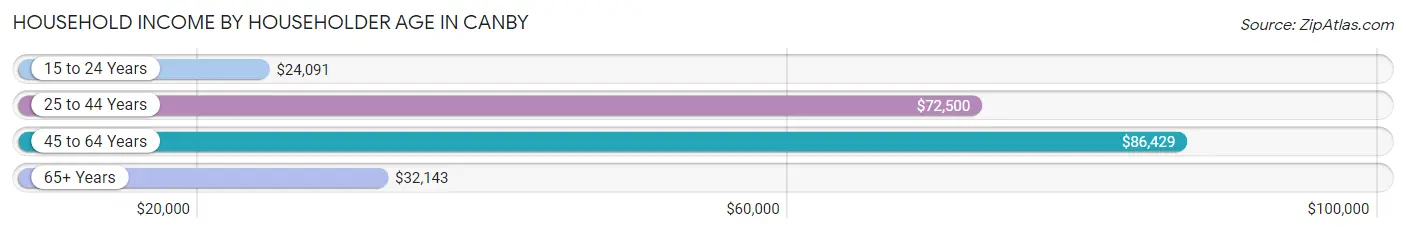
| Income Bracket | # Households | Median Income |
| 15 to 24 Years | 40 (5.9%) | $24,091 |
| 25 to 44 Years | 186 (27.4%) | $72,500 |
| 45 to 64 Years | 188 (27.7%) | $86,429 |
| 65+ Years | 266 (39.1%) | $32,143 |
| Total | 680 (100.0%) | $55,870 |
Poverty in Canby
Income Below Poverty by Sex and Age in Canby
With 19.7% poverty level for males and 11.7% for females among the residents of Canby, 5 year old males and 18 to 24 year old females are the most vulnerable to poverty, with 6 males (100.0%) and 16 females (50.0%) in their respective age groups living below the poverty level.
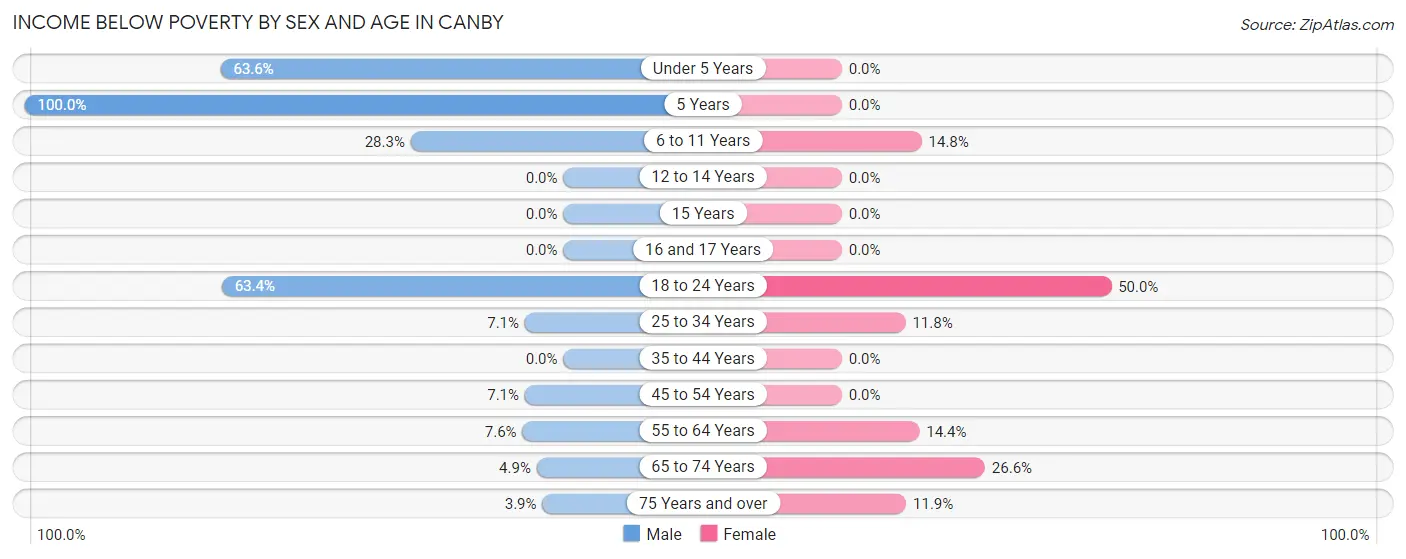
| Age Bracket | Male | Female |
| Under 5 Years | 14 (63.6%) | 0 (0.0%) |
| 5 Years | 6 (100.0%) | 0 (0.0%) |
| 6 to 11 Years | 17 (28.3%) | 4 (14.8%) |
| 12 to 14 Years | 0 (0.0%) | 0 (0.0%) |
| 15 Years | 0 (0.0%) | 0 (0.0%) |
| 16 and 17 Years | 0 (0.0%) | 0 (0.0%) |
| 18 to 24 Years | 78 (63.4%) | 16 (50.0%) |
| 25 to 34 Years | 6 (7.1%) | 13 (11.8%) |
| 35 to 44 Years | 0 (0.0%) | 0 (0.0%) |
| 45 to 54 Years | 3 (7.1%) | 0 (0.0%) |
| 55 to 64 Years | 6 (7.6%) | 20 (14.4%) |
| 65 to 74 Years | 4 (4.9%) | 17 (26.6%) |
| 75 Years and over | 3 (3.9%) | 16 (11.9%) |
| Total | 137 (19.7%) | 86 (11.7%) |
Income Above Poverty by Sex and Age in Canby
According to the poverty statistics in Canby, males aged 12 to 14 years and females aged under 5 years are the age groups that are most secure financially, with 100.0% of males and 100.0% of females in these age groups living above the poverty line.
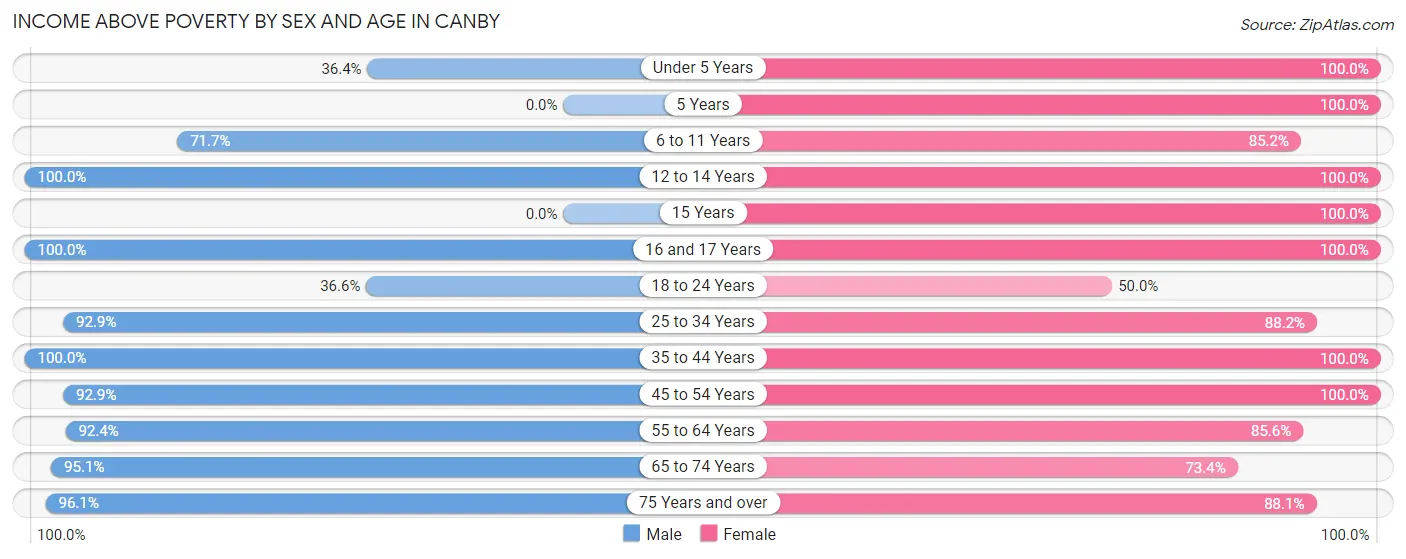
| Age Bracket | Male | Female |
| Under 5 Years | 8 (36.4%) | 38 (100.0%) |
| 5 Years | 0 (0.0%) | 12 (100.0%) |
| 6 to 11 Years | 43 (71.7%) | 23 (85.2%) |
| 12 to 14 Years | 21 (100.0%) | 37 (100.0%) |
| 15 Years | 0 (0.0%) | 9 (100.0%) |
| 16 and 17 Years | 21 (100.0%) | 42 (100.0%) |
| 18 to 24 Years | 45 (36.6%) | 16 (50.0%) |
| 25 to 34 Years | 78 (92.9%) | 97 (88.2%) |
| 35 to 44 Years | 81 (100.0%) | 27 (100.0%) |
| 45 to 54 Years | 39 (92.9%) | 64 (100.0%) |
| 55 to 64 Years | 73 (92.4%) | 119 (85.6%) |
| 65 to 74 Years | 77 (95.1%) | 47 (73.4%) |
| 75 Years and over | 74 (96.1%) | 118 (88.1%) |
| Total | 560 (80.3%) | 649 (88.3%) |
Income Below Poverty Among Married-Couple Families in Canby
The poverty statistics for married-couple families in Canby show that 2.4% or 7 of the total 291 families live below the poverty line. Families with no children have the highest poverty rate of 3.7%, comprising of 7 families. On the other hand, families with 1 or 2 children have the lowest poverty rate of 0.0%, which includes 0 families.
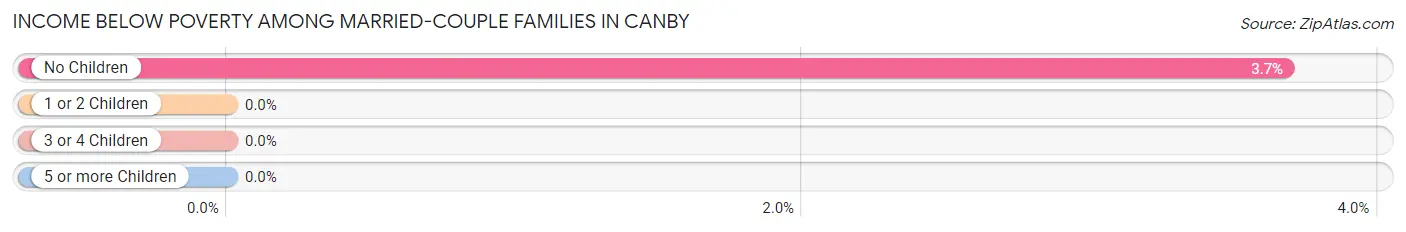
| Children | Above Poverty | Below Poverty |
| No Children | 183 (96.3%) | 7 (3.7%) |
| 1 or 2 Children | 79 (100.0%) | 0 (0.0%) |
| 3 or 4 Children | 22 (100.0%) | 0 (0.0%) |
| 5 or more Children | 0 (0.0%) | 0 (0.0%) |
| Total | 284 (97.6%) | 7 (2.4%) |
Income Below Poverty Among Single-Parent Households in Canby
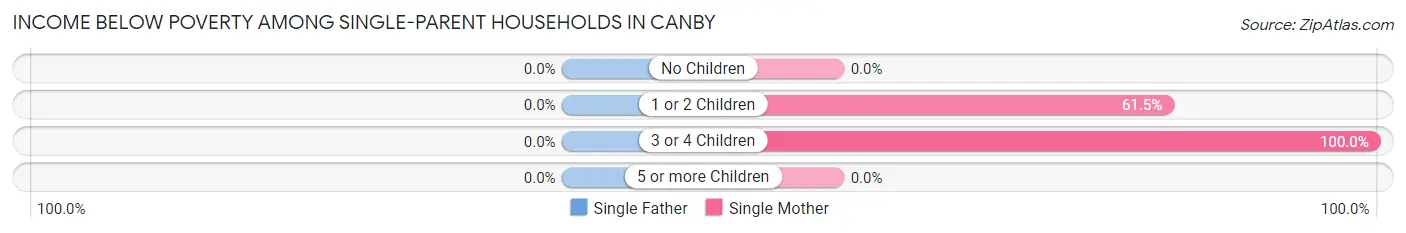
| Children | Single Father | Single Mother |
| No Children | 0 (0.0%) | 0 (0.0%) |
| 1 or 2 Children | 0 (0.0%) | 16 (61.5%) |
| 3 or 4 Children | 0 (0.0%) | 4 (100.0%) |
| 5 or more Children | 0 (0.0%) | 0 (0.0%) |
| Total | 0 (0.0%) | 20 (30.8%) |
Income Below Poverty Among Married-Couple vs Single-Parent Households in Canby
The poverty data for Canby shows that 7 of the married-couple family households (2.4%) and 20 of the single-parent households (17.4%) are living below the poverty level. Within the married-couple family households, those with no children have the highest poverty rate, with 7 households (3.7%) falling below the poverty line. Among the single-parent households, those with 3 or 4 children have the highest poverty rate, with 4 household (100.0%) living below poverty.
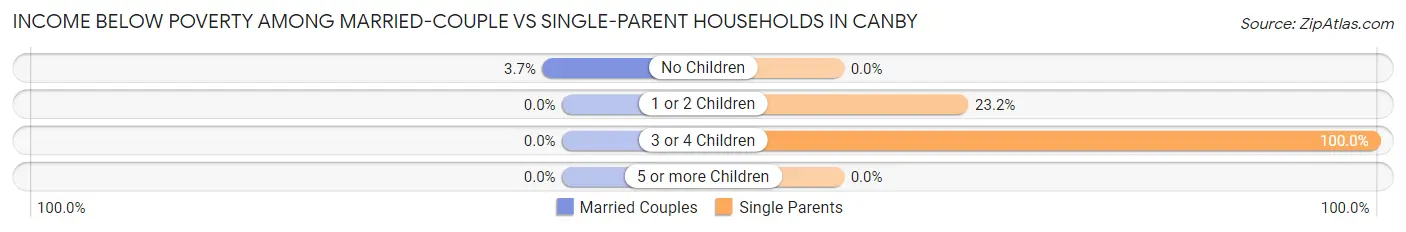
| Children | Married-Couple Families | Single-Parent Households |
| No Children | 7 (3.7%) | 0 (0.0%) |
| 1 or 2 Children | 0 (0.0%) | 16 (23.2%) |
| 3 or 4 Children | 0 (0.0%) | 4 (100.0%) |
| 5 or more Children | 0 (0.0%) | 0 (0.0%) |
| Total | 7 (2.4%) | 20 (17.4%) |
Race in Canby
The most populous races in Canby are White / Caucasian (1,434 | 97.0%), Two or more Races (20 | 1.3%), and Hispanic or Latino (18 | 1.2%).
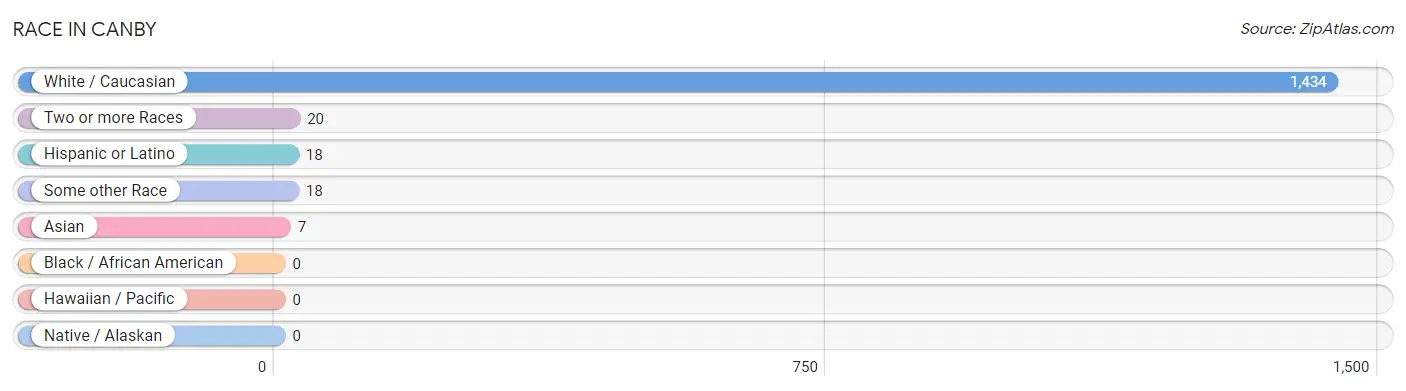
| Race | # Population | % Population |
| Asian | 7 | 0.5% |
| Black / African American | 0 | 0.0% |
| Hawaiian / Pacific | 0 | 0.0% |
| Hispanic or Latino | 18 | 1.2% |
| Native / Alaskan | 0 | 0.0% |
| White / Caucasian | 1,434 | 97.0% |
| Two or more Races | 20 | 1.3% |
| Some other Race | 18 | 1.2% |
| Total | 1,479 | 100.0% |
Ancestry in Canby
The most populous ancestries reported in Canby are German (548 | 37.0%), Norwegian (412 | 27.9%), Polish (152 | 10.3%), English (107 | 7.2%), and Irish (70 | 4.7%), together accounting for 87.2% of all Canby residents.
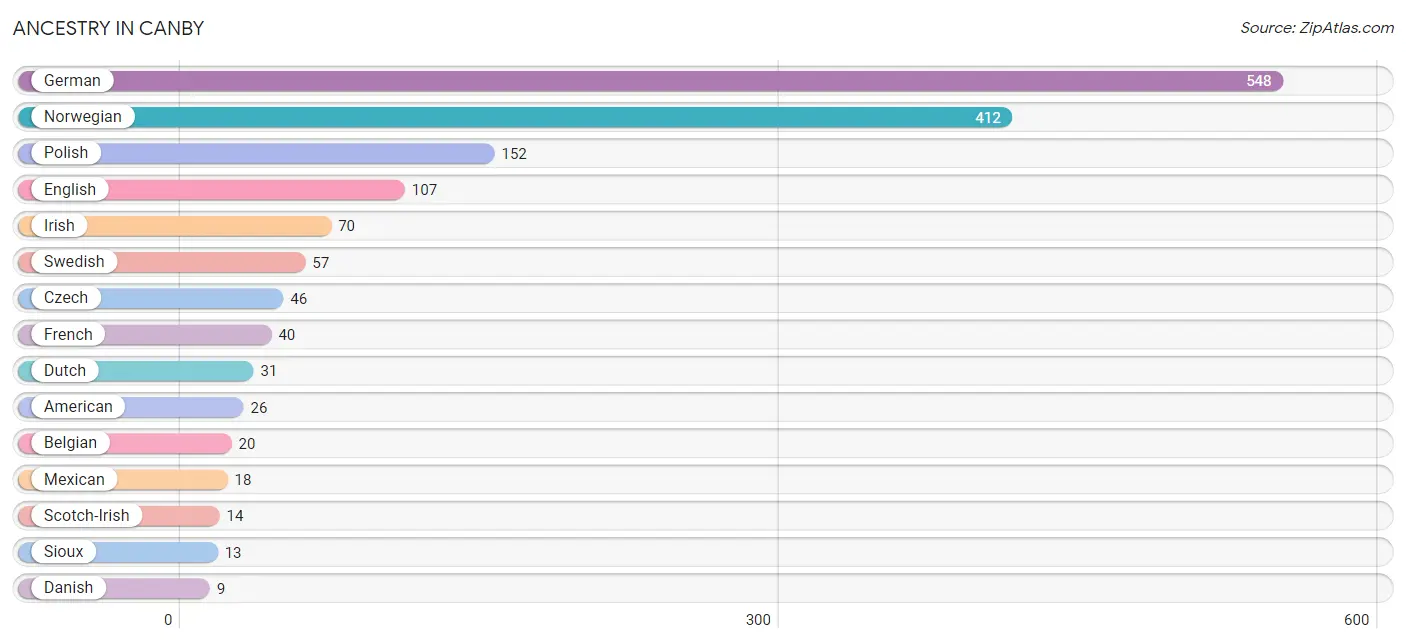
| Ancestry | # Population | % Population |
| American | 26 | 1.8% |
| Arab | 1 | 0.1% |
| Belgian | 20 | 1.3% |
| British | 7 | 0.5% |
| Czech | 46 | 3.1% |
| Czechoslovakian | 4 | 0.3% |
| Danish | 9 | 0.6% |
| Dutch | 31 | 2.1% |
| English | 107 | 7.2% |
| French | 40 | 2.7% |
| French Canadian | 3 | 0.2% |
| German | 548 | 37.0% |
| Icelander | 3 | 0.2% |
| Indian (Asian) | 7 | 0.5% |
| Irish | 70 | 4.7% |
| Italian | 5 | 0.3% |
| Lebanese | 1 | 0.1% |
| Luxembourger | 4 | 0.3% |
| Mexican | 18 | 1.2% |
| Norwegian | 412 | 27.9% |
| Polish | 152 | 10.3% |
| Scandinavian | 6 | 0.4% |
| Scotch-Irish | 14 | 0.9% |
| Scottish | 4 | 0.3% |
| Sioux | 13 | 0.9% |
| Slovak | 1 | 0.1% |
| South African | 3 | 0.2% |
| Subsaharan African | 3 | 0.2% |
| Swedish | 57 | 3.8% |
| Ukrainian | 4 | 0.3% | View All 30 Rows |
Immigrants in Canby
The most numerous immigrant groups reported in Canby came from Central America (12 | 0.8%), Latin America (12 | 0.8%), Mexico (12 | 0.8%), Asia (7 | 0.5%), and China (7 | 0.5%), together accounting for 3.4% of all Canby residents.
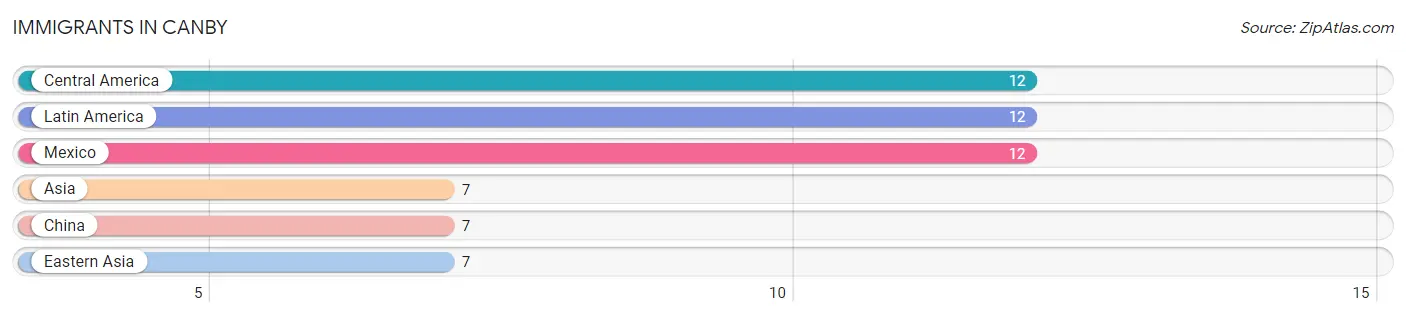
| Immigration Origin | # Population | % Population |
| Asia | 7 | 0.5% |
| Central America | 12 | 0.8% |
| China | 7 | 0.5% |
| Eastern Asia | 7 | 0.5% |
| Latin America | 12 | 0.8% |
| Mexico | 12 | 0.8% | View All 6 Rows |
Sex and Age in Canby
Sex and Age in Canby
The most populous age groups in Canby are 20 to 24 Years (97 | 13.5%) for men and 15 to 19 Years (81 | 10.7%) for women.
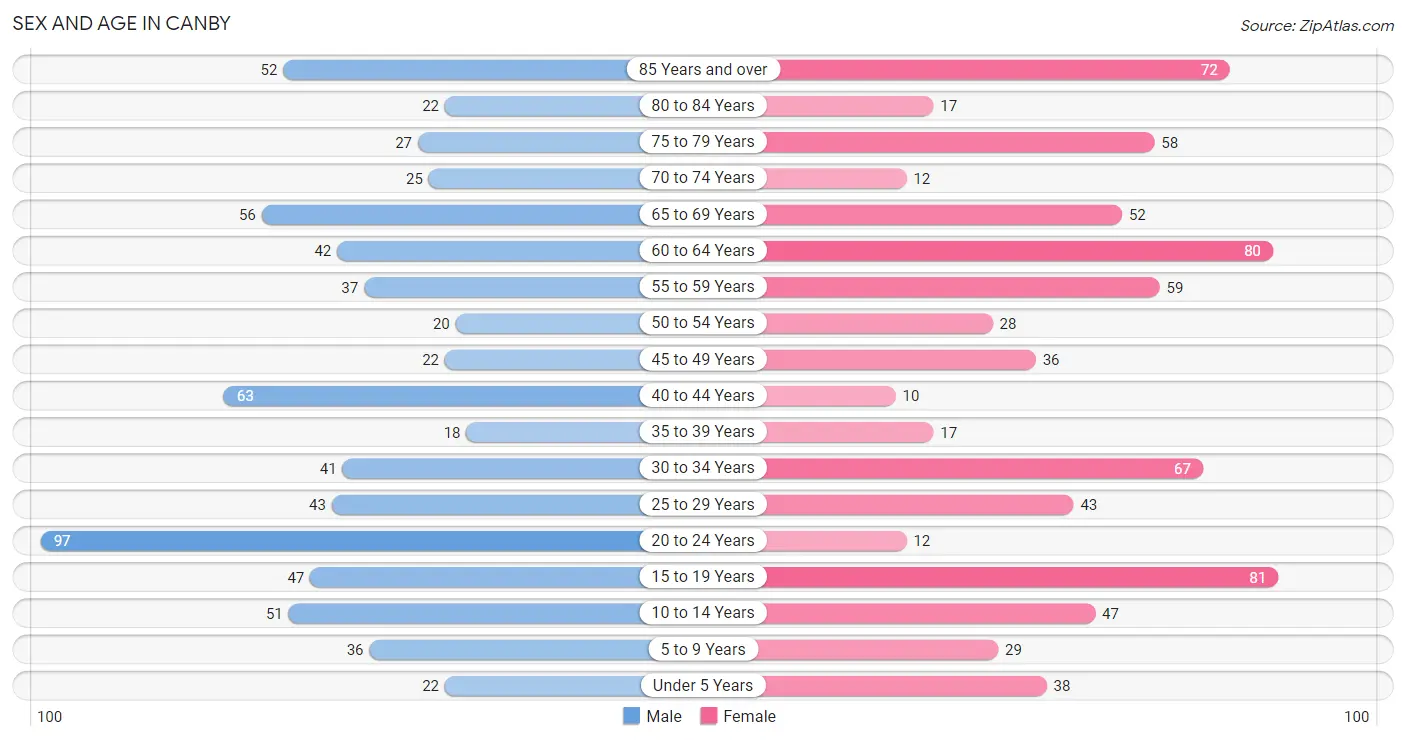
| Age Bracket | Male | Female |
| Under 5 Years | 22 (3.0%) | 38 (5.0%) |
| 5 to 9 Years | 36 (5.0%) | 29 (3.8%) |
| 10 to 14 Years | 51 (7.1%) | 47 (6.2%) |
| 15 to 19 Years | 47 (6.5%) | 81 (10.7%) |
| 20 to 24 Years | 97 (13.5%) | 12 (1.6%) |
| 25 to 29 Years | 43 (6.0%) | 43 (5.7%) |
| 30 to 34 Years | 41 (5.7%) | 67 (8.8%) |
| 35 to 39 Years | 18 (2.5%) | 17 (2.2%) |
| 40 to 44 Years | 63 (8.7%) | 10 (1.3%) |
| 45 to 49 Years | 22 (3.0%) | 36 (4.8%) |
| 50 to 54 Years | 20 (2.8%) | 28 (3.7%) |
| 55 to 59 Years | 37 (5.1%) | 59 (7.8%) |
| 60 to 64 Years | 42 (5.8%) | 80 (10.5%) |
| 65 to 69 Years | 56 (7.8%) | 52 (6.9%) |
| 70 to 74 Years | 25 (3.5%) | 12 (1.6%) |
| 75 to 79 Years | 27 (3.7%) | 58 (7.6%) |
| 80 to 84 Years | 22 (3.0%) | 17 (2.2%) |
| 85 Years and over | 52 (7.2%) | 72 (9.5%) |
| Total | 721 (100.0%) | 758 (100.0%) |
Families and Households in Canby
Median Family Size in Canby
The median family size in Canby is 2.63 persons per family, with married-couple families (291 | 71.7%) accounting for the largest median family size of 2.7 persons per family. On the other hand, single male/father families (50 | 12.3%) represent the smallest median family size with 2.16 persons per family.
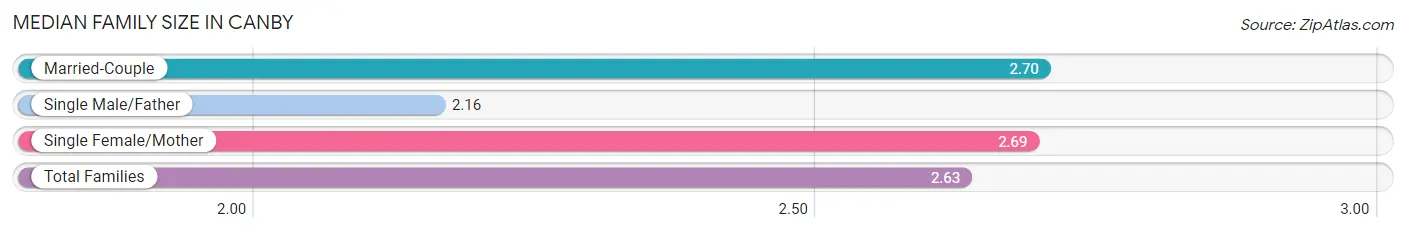
| Family Type | # Families | Family Size |
| Married-Couple | 291 (71.7%) | 2.70 |
| Single Male/Father | 50 (12.3%) | 2.16 |
| Single Female/Mother | 65 (16.0%) | 2.69 |
| Total Families | 406 (100.0%) | 2.63 |
Median Household Size in Canby
The median household size in Canby is 2.02 persons per household, with single female/mother households (65 | 9.6%) accounting for the largest median household size of 2.78 persons per household. non-family households (274 | 40.3%) represent the smallest median household size with 1.10 persons per household.
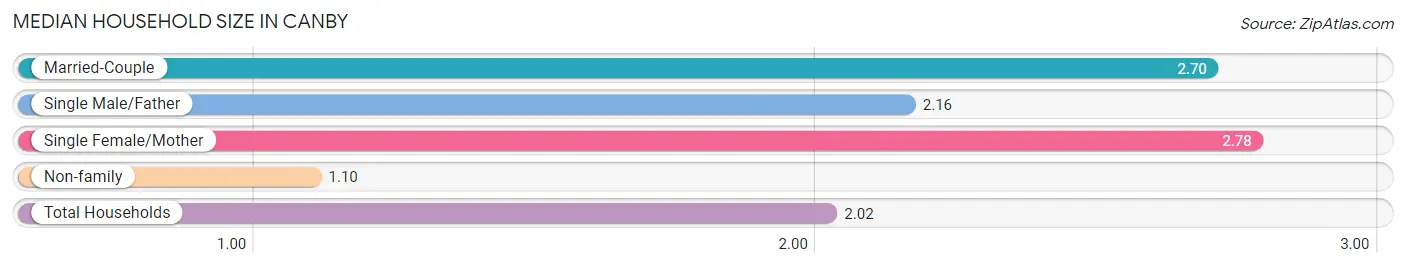
| Household Type | # Households | Household Size |
| Married-Couple | 291 (42.8%) | 2.70 |
| Single Male/Father | 50 (7.3%) | 2.16 |
| Single Female/Mother | 65 (9.6%) | 2.78 |
| Non-family | 274 (40.3%) | 1.10 |
| Total Households | 680 (100.0%) | 2.02 |
Household Size by Marriage Status in Canby
Out of a total of 680 households in Canby, 406 (59.7%) are family households, while 274 (40.3%) are nonfamily households. The most numerous type of family households are 2-person households, comprising 234, and the most common type of nonfamily households are 1-person households, comprising 246.
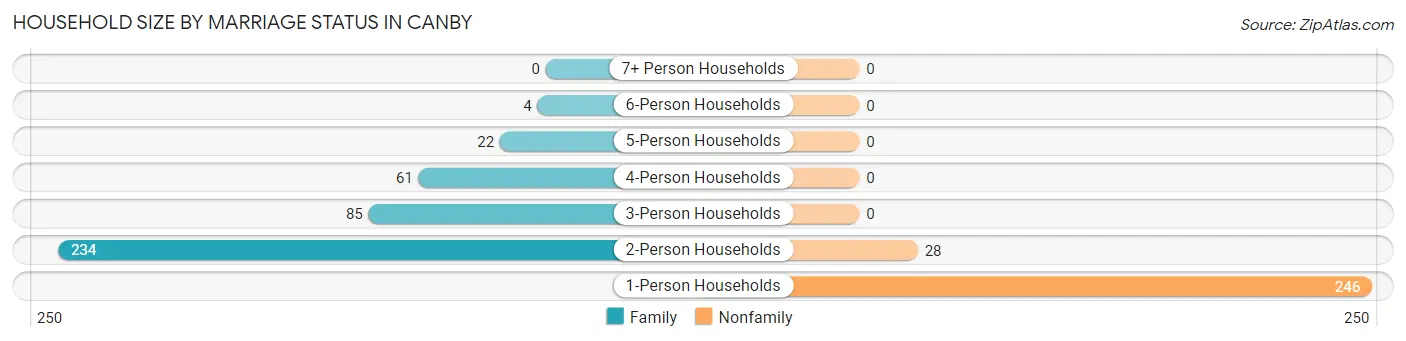
| Household Size | Family Households | Nonfamily Households |
| 1-Person Households | - | 246 (36.2%) |
| 2-Person Households | 234 (34.4%) | 28 (4.1%) |
| 3-Person Households | 85 (12.5%) | 0 (0.0%) |
| 4-Person Households | 61 (9.0%) | 0 (0.0%) |
| 5-Person Households | 22 (3.2%) | 0 (0.0%) |
| 6-Person Households | 4 (0.6%) | 0 (0.0%) |
| 7+ Person Households | 0 (0.0%) | 0 (0.0%) |
| Total | 406 (59.7%) | 274 (40.3%) |
Female Fertility in Canby
Fertility by Age in Canby
Average fertility rate in Canby is 30.0 births per 1,000 women. Women in the age bracket of 20 to 34 years have the highest fertility rate with 66.0 births per 1,000 women. Women in the age bracket of 20 to 34 years acount for 100.0% of all women with births.
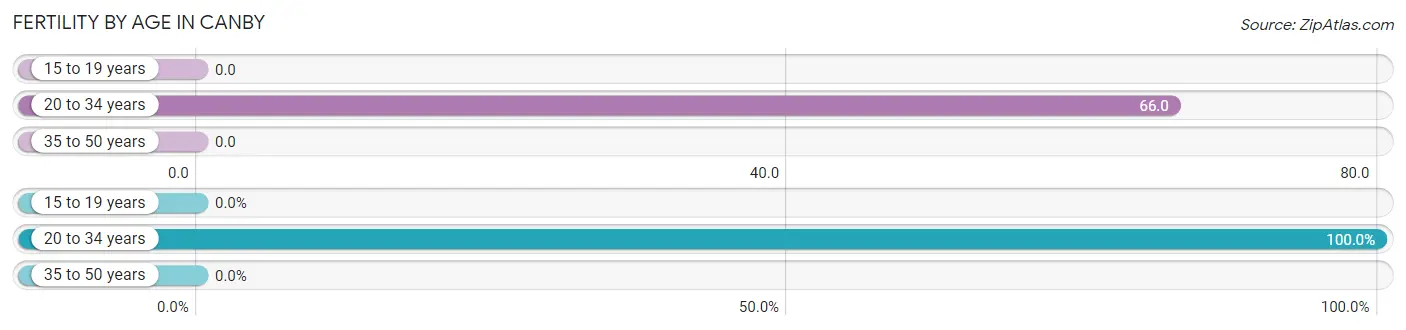
| Age Bracket | Women with Births | Births / 1,000 Women |
| 15 to 19 years | 0 (0.0%) | 0.0 |
| 20 to 34 years | 8 (100.0%) | 66.0 |
| 35 to 50 years | 0 (0.0%) | 0.0 |
| Total | 8 (100.0%) | 30.0 |
Fertility by Age by Marriage Status in Canby
50.0% of women with births (8) in Canby are married. The highest percentage of unmarried women with births falls into 20 to 34 years age bracket with 50.0% of them unmarried at the time of birth, while the lowest percentage of unmarried women with births belong to 20 to 34 years age bracket with 50.0% of them unmarried.
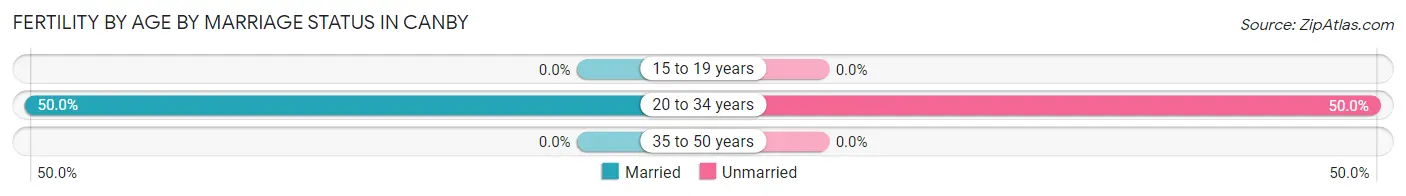
| Age Bracket | Married | Unmarried |
| 15 to 19 years | 0 (0.0%) | 0 (0.0%) |
| 20 to 34 years | 4 (50.0%) | 4 (50.0%) |
| 35 to 50 years | 0 (0.0%) | 0 (0.0%) |
| Total | 4 (50.0%) | 4 (50.0%) |
Fertility by Education in Canby
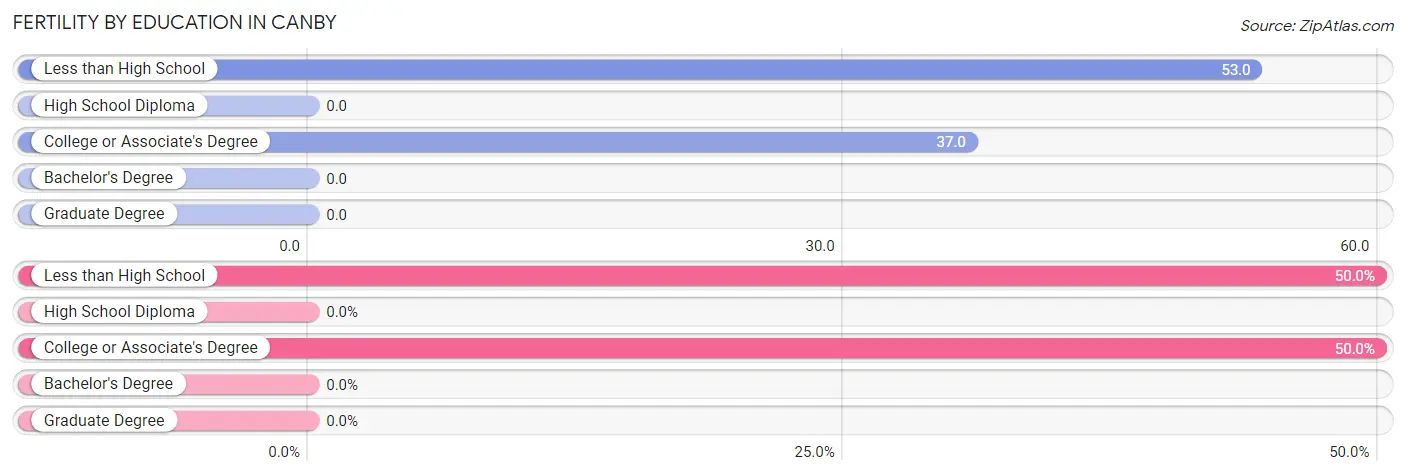
| Educational Attainment | Women with Births | Births / 1,000 Women |
| Less than High School | 4 (50.0%) | 53.0 |
| High School Diploma | 0 (0.0%) | 0.0 |
| College or Associate's Degree | 4 (50.0%) | 37.0 |
| Bachelor's Degree | 0 (0.0%) | 0.0 |
| Graduate Degree | 0 (0.0%) | 0.0 |
| Total | 8 (100.0%) | 30.0 |
Fertility by Education by Marriage Status in Canby
50.0% of women with births in Canby are unmarried. Women with the educational attainment of college or associate's degree are most likely to be married with 100.0% of them married at childbirth, while women with the educational attainment of less than high school are least likely to be married with 100.0% of them unmarried at childbirth.
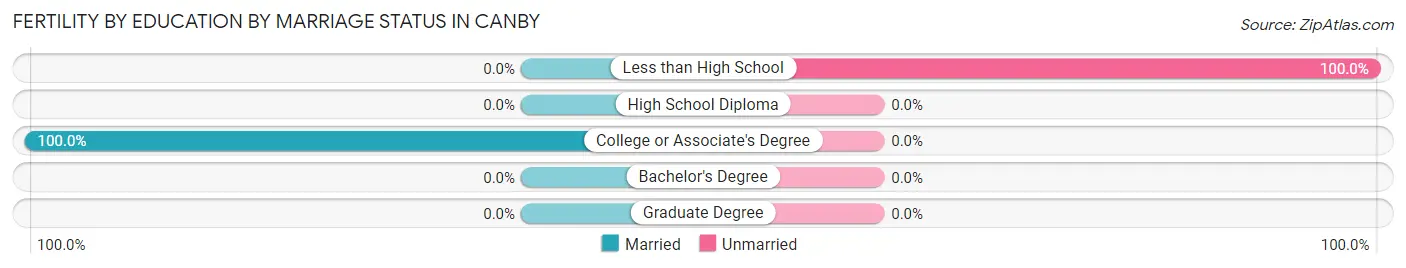
| Educational Attainment | Married | Unmarried |
| Less than High School | 0 (0.0%) | 4 (100.0%) |
| High School Diploma | 0 (0.0%) | 0 (0.0%) |
| College or Associate's Degree | 4 (100.0%) | 0 (0.0%) |
| Bachelor's Degree | 0 (0.0%) | 0 (0.0%) |
| Graduate Degree | 0 (0.0%) | 0 (0.0%) |
| Total | 4 (50.0%) | 4 (50.0%) |
Employment Characteristics in Canby
Employment by Class of Employer in Canby
Among the 631 employed individuals in Canby, private company employees (445 | 70.5%), not-for-profit organizations (66 | 10.5%), and self-employed (not incorporated) (37 | 5.9%) make up the most common classes of employment.
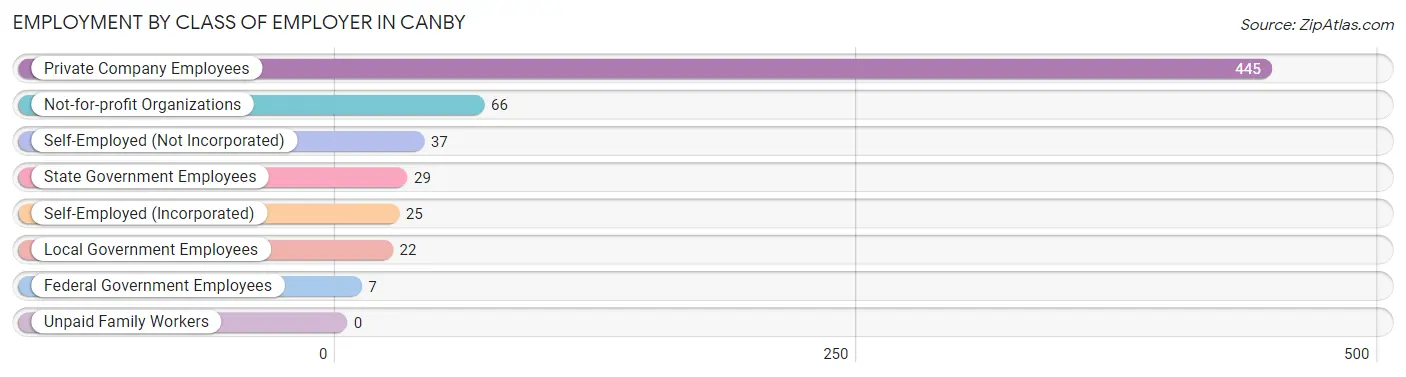
| Employer Class | # Employees | % Employees |
| Private Company Employees | 445 | 70.5% |
| Self-Employed (Incorporated) | 25 | 4.0% |
| Self-Employed (Not Incorporated) | 37 | 5.9% |
| Not-for-profit Organizations | 66 | 10.5% |
| Local Government Employees | 22 | 3.5% |
| State Government Employees | 29 | 4.6% |
| Federal Government Employees | 7 | 1.1% |
| Unpaid Family Workers | 0 | 0.0% |
| Total | 631 | 100.0% |
Employment Status by Age in Canby
According to the labor force statistics for Canby, out of the total population over 16 years of age (1,247), 54.4% or 678 individuals are in the labor force, with 6.3% or 43 of them unemployed. The age group with the highest labor force participation rate is 25 to 29 years, with 100.0% or 86 individuals in the labor force. Within the labor force, the 75 years and over age range has the highest percentage of unemployed individuals, with 100.0% or 3 of them being unemployed.
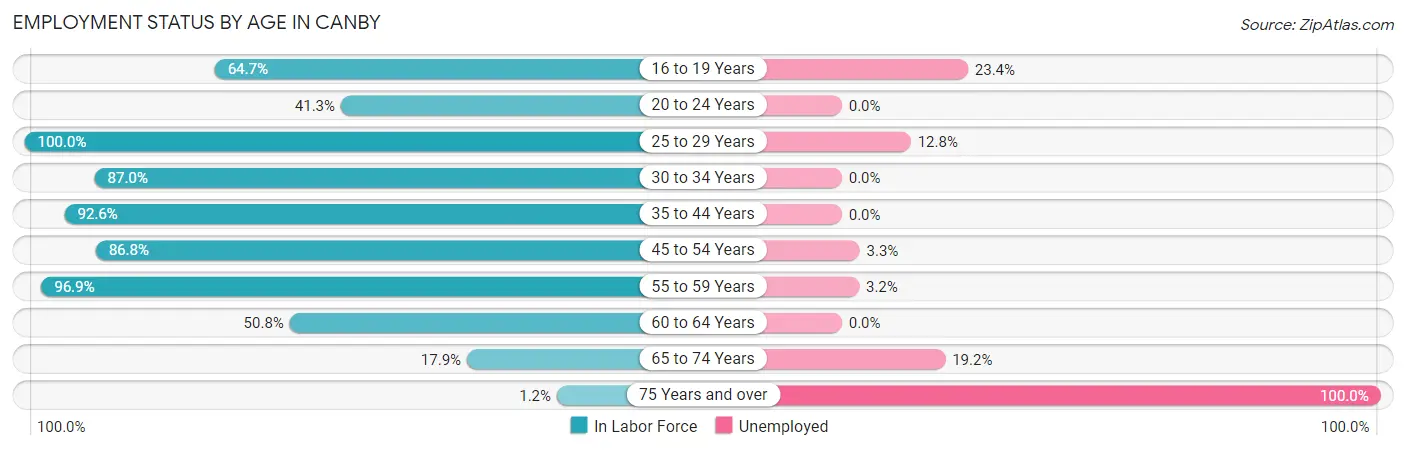
| Age Bracket | In Labor Force | Unemployed |
| 16 to 19 Years | 77 (64.7%) | 18 (23.4%) |
| 20 to 24 Years | 45 (41.3%) | 0 (0.0%) |
| 25 to 29 Years | 86 (100.0%) | 11 (12.8%) |
| 30 to 34 Years | 94 (87.0%) | 0 (0.0%) |
| 35 to 44 Years | 100 (92.6%) | 0 (0.0%) |
| 45 to 54 Years | 92 (86.8%) | 3 (3.3%) |
| 55 to 59 Years | 93 (96.9%) | 3 (3.2%) |
| 60 to 64 Years | 62 (50.8%) | 0 (0.0%) |
| 65 to 74 Years | 26 (17.9%) | 5 (19.2%) |
| 75 Years and over | 3 (1.2%) | 3 (100.0%) |
| Total | 678 (54.4%) | 43 (6.3%) |
Employment Status by Educational Attainment in Canby
According to labor force statistics for Canby, 84.2% of individuals (527) out of the total population between 25 and 64 years of age (626) are in the labor force, with 3.2% or 17 of them being unemployed. The group with the highest labor force participation rate are those with the educational attainment of bachelor's degree or higher, with 86.1% or 124 individuals in the labor force. Within the labor force, individuals with high school diploma education have the highest percentage of unemployment, with 5.2% or 6 of them being unemployed.
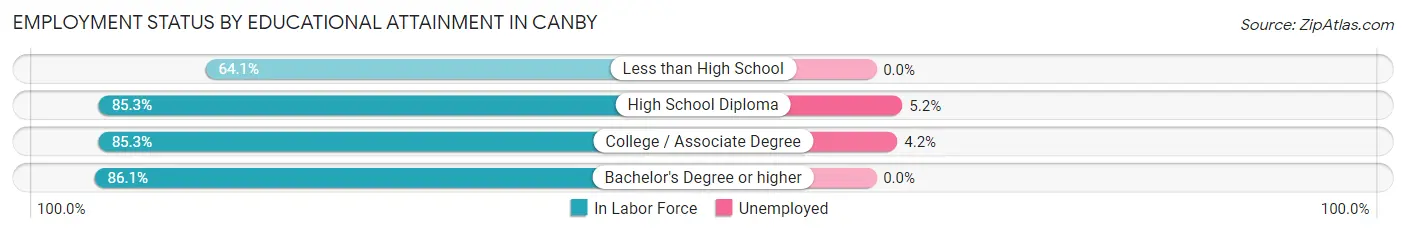
| Educational Attainment | In Labor Force | Unemployed |
| Less than High School | 25 (64.1%) | 0 (0.0%) |
| High School Diploma | 116 (85.3%) | 7 (5.2%) |
| College / Associate Degree | 262 (85.3%) | 13 (4.2%) |
| Bachelor's Degree or higher | 124 (86.1%) | 0 (0.0%) |
| Total | 527 (84.2%) | 20 (3.2%) |
Employment Occupations by Sex in Canby
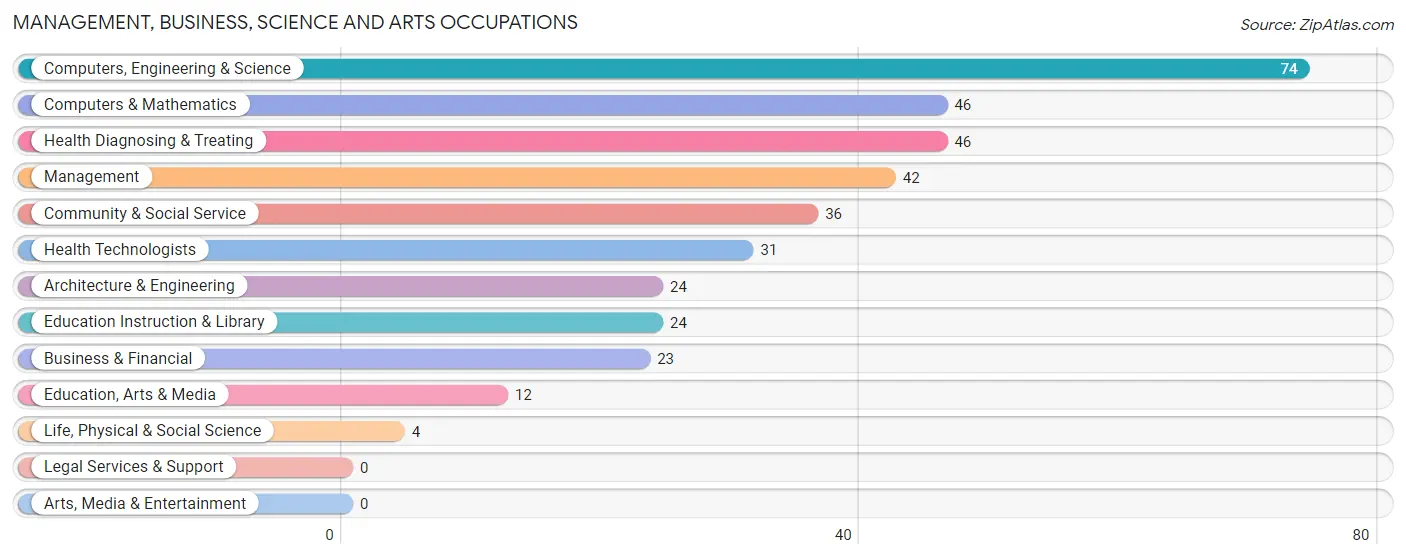
Management, Business, Science and Arts Occupations
The most common Management, Business, Science and Arts occupations in Canby are Computers, Engineering & Science (74 | 11.7%), Computers & Mathematics (46 | 7.2%), Health Diagnosing & Treating (46 | 7.2%), Management (42 | 6.6%), and Community & Social Service (36 | 5.7%).
Management, Business, Science and Arts Occupations by Sex
Within the Management, Business, Science and Arts occupations in Canby, the most male-oriented occupations are Computers, Engineering & Science (100.0%), Computers & Mathematics (100.0%), and Architecture & Engineering (100.0%), while the most female-oriented occupations are Business & Financial (100.0%), Education, Arts & Media (100.0%), and Health Diagnosing & Treating (91.3%).
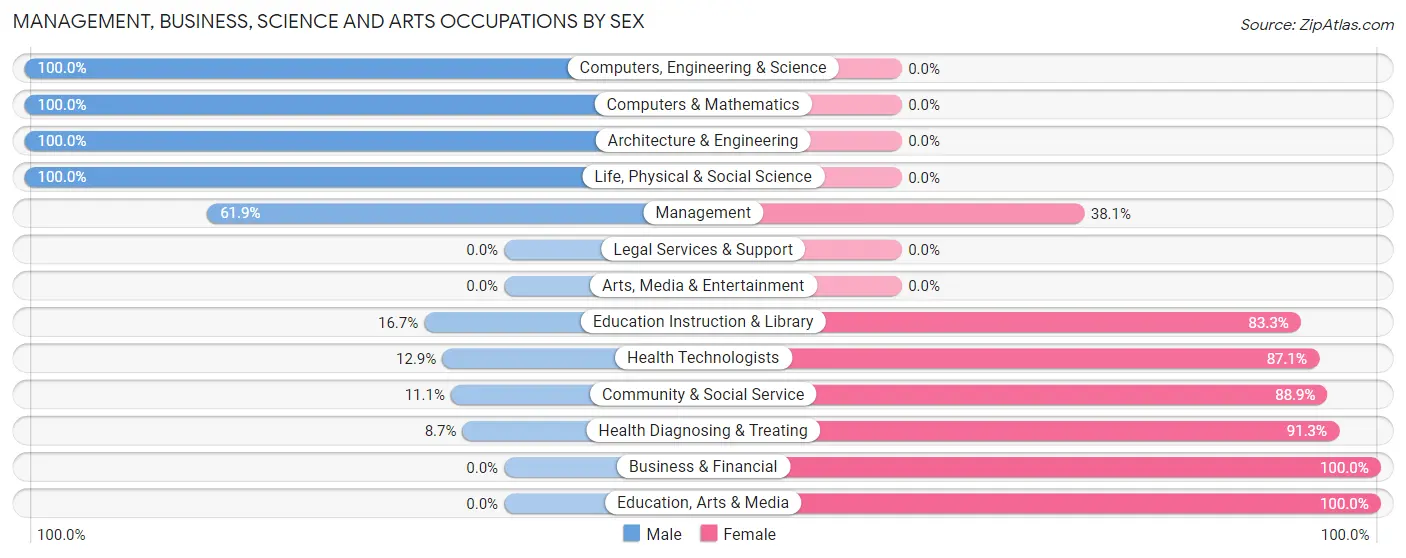
| Occupation | Male | Female |
| Management | 26 (61.9%) | 16 (38.1%) |
| Business & Financial | 0 (0.0%) | 23 (100.0%) |
| Computers, Engineering & Science | 74 (100.0%) | 0 (0.0%) |
| Computers & Mathematics | 46 (100.0%) | 0 (0.0%) |
| Architecture & Engineering | 24 (100.0%) | 0 (0.0%) |
| Life, Physical & Social Science | 4 (100.0%) | 0 (0.0%) |
| Community & Social Service | 4 (11.1%) | 32 (88.9%) |
| Education, Arts & Media | 0 (0.0%) | 12 (100.0%) |
| Legal Services & Support | 0 (0.0%) | 0 (0.0%) |
| Education Instruction & Library | 4 (16.7%) | 20 (83.3%) |
| Arts, Media & Entertainment | 0 (0.0%) | 0 (0.0%) |
| Health Diagnosing & Treating | 4 (8.7%) | 42 (91.3%) |
| Health Technologists | 4 (12.9%) | 27 (87.1%) |
| Total (Category) | 108 (48.9%) | 113 (51.1%) |
| Total (Overall) | 330 (52.0%) | 305 (48.0%) |
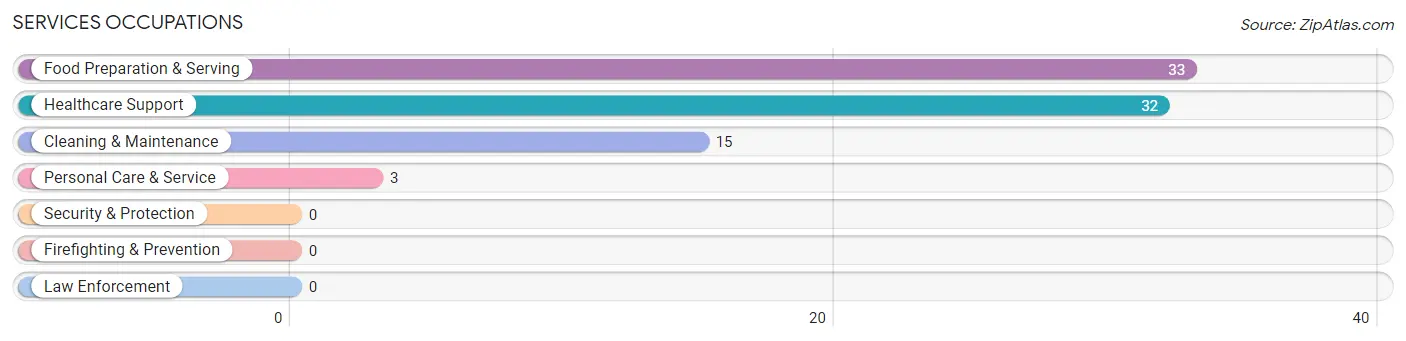
Services Occupations
The most common Services occupations in Canby are Food Preparation & Serving (33 | 5.2%), Healthcare Support (32 | 5.0%), Cleaning & Maintenance (15 | 2.4%), and Personal Care & Service (3 | 0.5%).
Services Occupations by Sex
Within the Services occupations in Canby, the most male-oriented occupations are Cleaning & Maintenance (80.0%), and Food Preparation & Serving (18.2%), while the most female-oriented occupations are Healthcare Support (100.0%), Personal Care & Service (100.0%), and Food Preparation & Serving (81.8%).
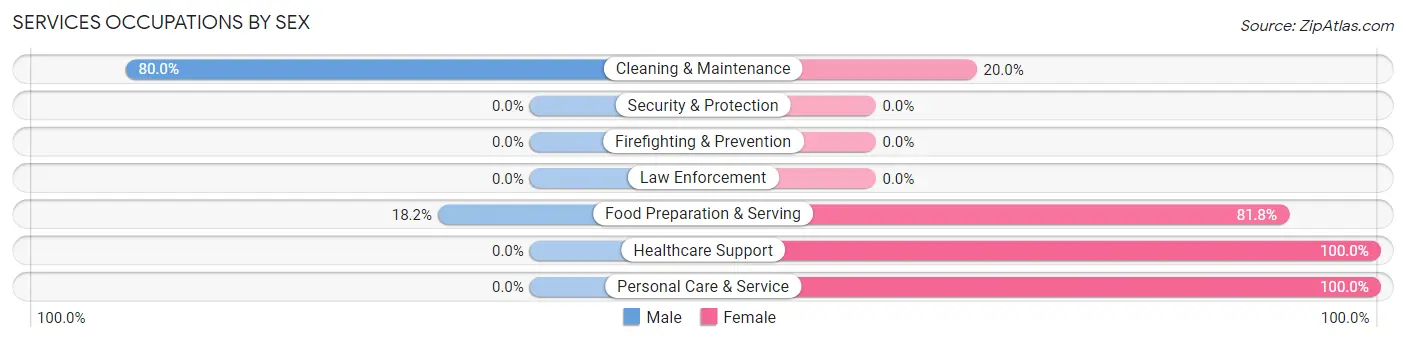
| Occupation | Male | Female |
| Healthcare Support | 0 (0.0%) | 32 (100.0%) |
| Security & Protection | 0 (0.0%) | 0 (0.0%) |
| Firefighting & Prevention | 0 (0.0%) | 0 (0.0%) |
| Law Enforcement | 0 (0.0%) | 0 (0.0%) |
| Food Preparation & Serving | 6 (18.2%) | 27 (81.8%) |
| Cleaning & Maintenance | 12 (80.0%) | 3 (20.0%) |
| Personal Care & Service | 0 (0.0%) | 3 (100.0%) |
| Total (Category) | 18 (21.7%) | 65 (78.3%) |
| Total (Overall) | 330 (52.0%) | 305 (48.0%) |
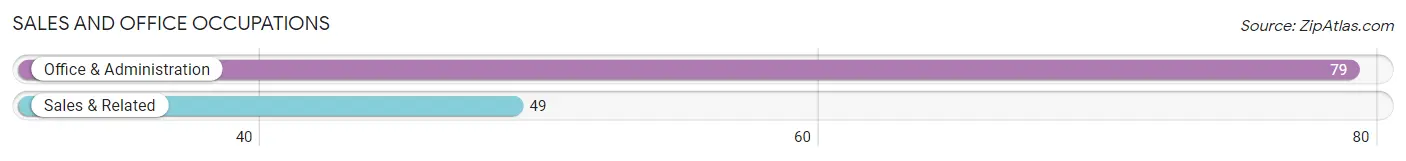
Sales and Office Occupations
The most common Sales and Office occupations in Canby are Office & Administration (79 | 12.4%), and Sales & Related (49 | 7.7%).
Sales and Office Occupations by Sex
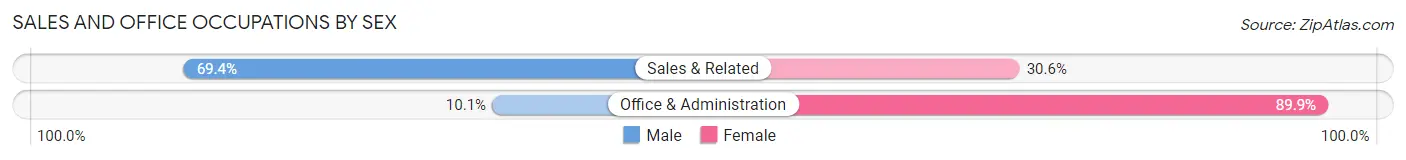
| Occupation | Male | Female |
| Sales & Related | 34 (69.4%) | 15 (30.6%) |
| Office & Administration | 8 (10.1%) | 71 (89.9%) |
| Total (Category) | 42 (32.8%) | 86 (67.2%) |
| Total (Overall) | 330 (52.0%) | 305 (48.0%) |
Natural Resources, Construction and Maintenance Occupations
The most common Natural Resources, Construction and Maintenance occupations in Canby are Construction & Extraction (51 | 8.0%), Farming, Fishing & Forestry (43 | 6.8%), and Installation, Maintenance & Repair (17 | 2.7%).
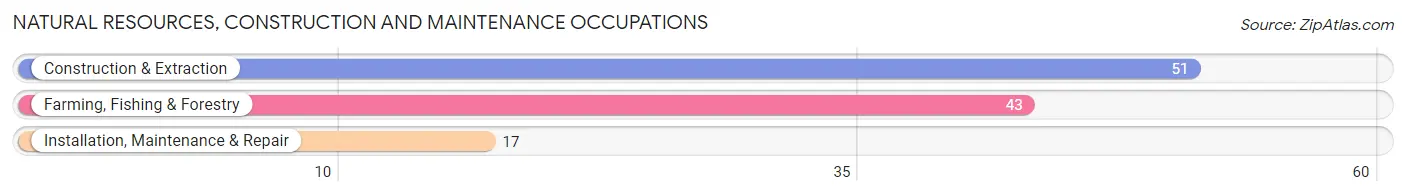
Natural Resources, Construction and Maintenance Occupations by Sex
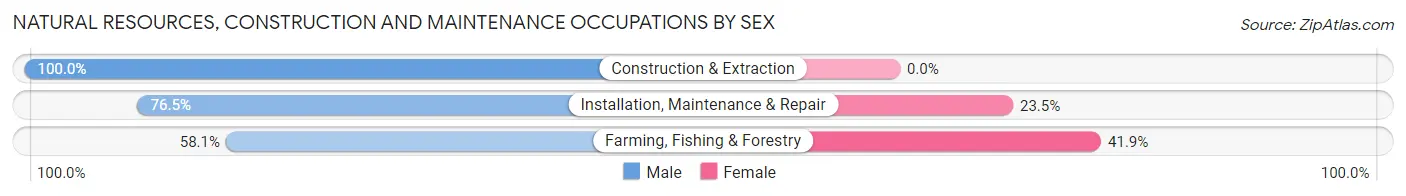
| Occupation | Male | Female |
| Farming, Fishing & Forestry | 25 (58.1%) | 18 (41.9%) |
| Construction & Extraction | 51 (100.0%) | 0 (0.0%) |
| Installation, Maintenance & Repair | 13 (76.5%) | 4 (23.5%) |
| Total (Category) | 89 (80.2%) | 22 (19.8%) |
| Total (Overall) | 330 (52.0%) | 305 (48.0%) |
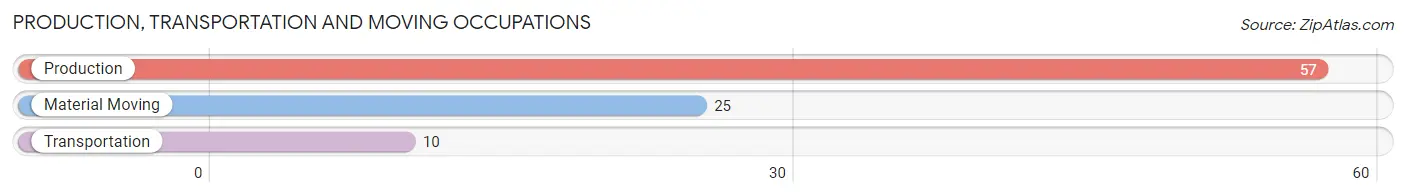
Production, Transportation and Moving Occupations
The most common Production, Transportation and Moving occupations in Canby are Production (57 | 9.0%), Material Moving (25 | 3.9%), and Transportation (10 | 1.6%).
Production, Transportation and Moving Occupations by Sex
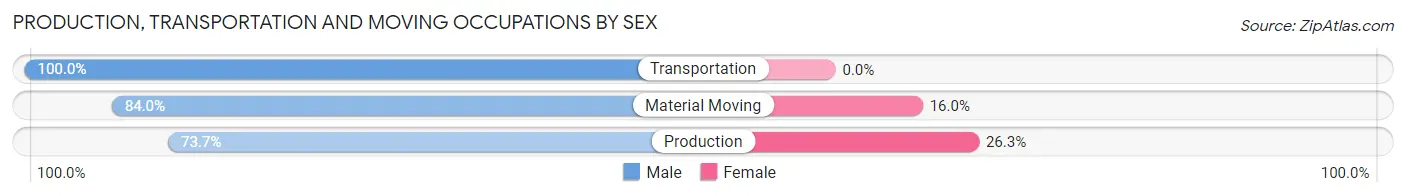
| Occupation | Male | Female |
| Production | 42 (73.7%) | 15 (26.3%) |
| Transportation | 10 (100.0%) | 0 (0.0%) |
| Material Moving | 21 (84.0%) | 4 (16.0%) |
| Total (Category) | 73 (79.3%) | 19 (20.6%) |
| Total (Overall) | 330 (52.0%) | 305 (48.0%) |
Employment Industries by Sex in Canby
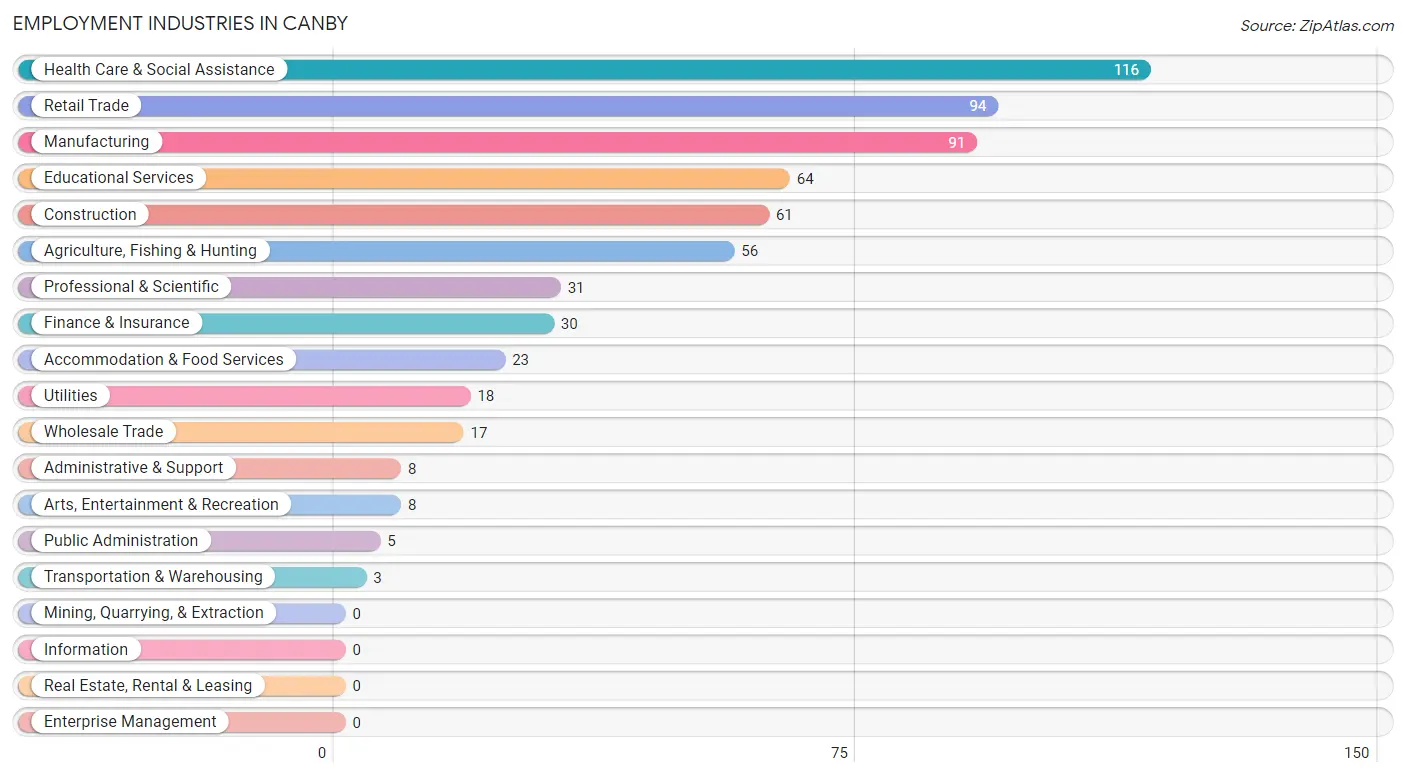
Employment Industries in Canby
The major employment industries in Canby include Health Care & Social Assistance (116 | 18.3%), Retail Trade (94 | 14.8%), Manufacturing (91 | 14.3%), Educational Services (64 | 10.1%), and Construction (61 | 9.6%).
Employment Industries by Sex in Canby
The Canby industries that see more men than women are Construction (100.0%), Transportation & Warehousing (100.0%), and Arts, Entertainment & Recreation (100.0%), whereas the industries that tend to have a higher number of women are Public Administration (100.0%), Health Care & Social Assistance (96.6%), and Professional & Scientific (80.6%).
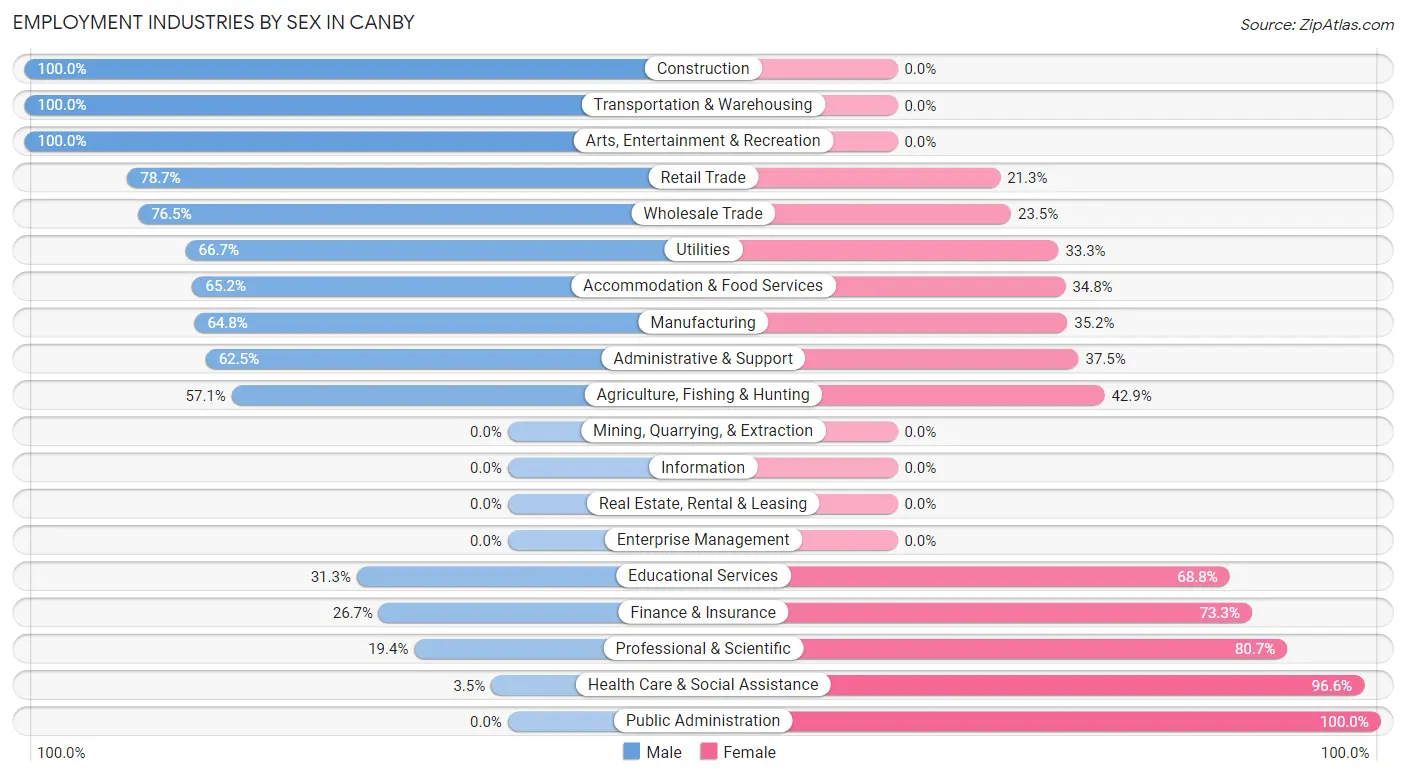
| Industry | Male | Female |
| Agriculture, Fishing & Hunting | 32 (57.1%) | 24 (42.9%) |
| Mining, Quarrying, & Extraction | 0 (0.0%) | 0 (0.0%) |
| Construction | 61 (100.0%) | 0 (0.0%) |
| Manufacturing | 59 (64.8%) | 32 (35.2%) |
| Wholesale Trade | 13 (76.5%) | 4 (23.5%) |
| Retail Trade | 74 (78.7%) | 20 (21.3%) |
| Transportation & Warehousing | 3 (100.0%) | 0 (0.0%) |
| Utilities | 12 (66.7%) | 6 (33.3%) |
| Information | 0 (0.0%) | 0 (0.0%) |
| Finance & Insurance | 8 (26.7%) | 22 (73.3%) |
| Real Estate, Rental & Leasing | 0 (0.0%) | 0 (0.0%) |
| Professional & Scientific | 6 (19.4%) | 25 (80.6%) |
| Enterprise Management | 0 (0.0%) | 0 (0.0%) |
| Administrative & Support | 5 (62.5%) | 3 (37.5%) |
| Educational Services | 20 (31.2%) | 44 (68.8%) |
| Health Care & Social Assistance | 4 (3.5%) | 112 (96.6%) |
| Arts, Entertainment & Recreation | 8 (100.0%) | 0 (0.0%) |
| Accommodation & Food Services | 15 (65.2%) | 8 (34.8%) |
| Public Administration | 0 (0.0%) | 5 (100.0%) |
| Total | 330 (52.0%) | 305 (48.0%) |
Education in Canby
School Enrollment in Canby
The most common levels of schooling among the 337 students in Canby are high school (108 | 32.1%), middle school (70 | 20.8%), and elementary school (56 | 16.6%).
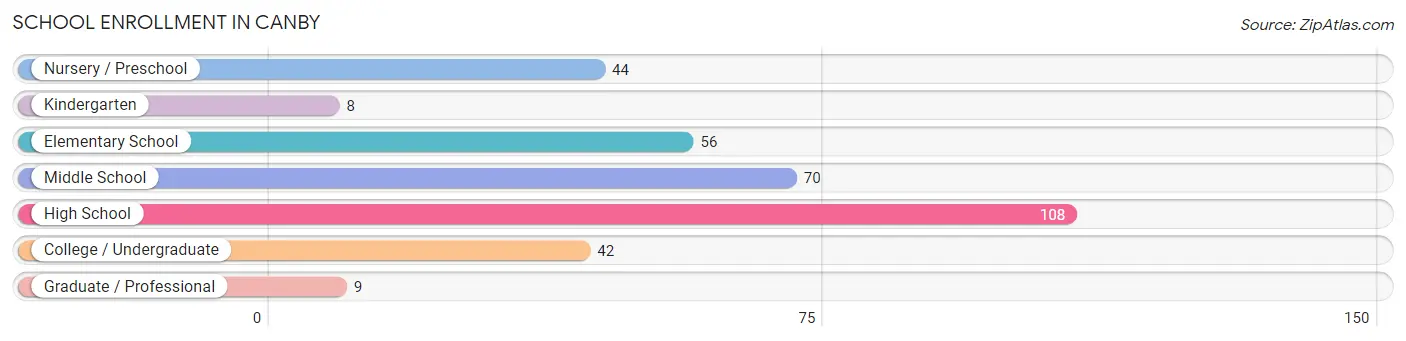
| School Level | # Students | % Students |
| Nursery / Preschool | 44 | 13.1% |
| Kindergarten | 8 | 2.4% |
| Elementary School | 56 | 16.6% |
| Middle School | 70 | 20.8% |
| High School | 108 | 32.1% |
| College / Undergraduate | 42 | 12.5% |
| Graduate / Professional | 9 | 2.7% |
| Total | 337 | 100.0% |
School Enrollment by Age by Funding Source in Canby
Out of a total of 337 students who are enrolled in schools in Canby, 28 (8.3%) attend a private institution, while the remaining 309 (91.7%) are enrolled in public schools. The age group of 25 to 34 year olds has the highest likelihood of being enrolled in private schools, with 6 (42.9% in the age bracket) enrolled. Conversely, the age group of 3 to 4 year olds has the lowest likelihood of being enrolled in a private school, with 26 (100.0% in the age bracket) attending a public institution.
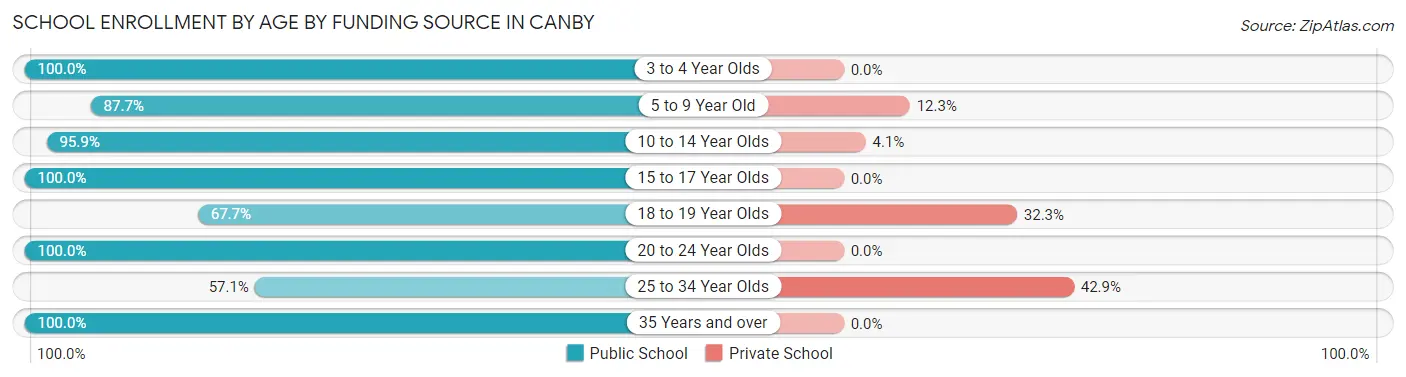
| Age Bracket | Public School | Private School |
| 3 to 4 Year Olds | 26 (100.0%) | 0 (0.0%) |
| 5 to 9 Year Old | 57 (87.7%) | 8 (12.3%) |
| 10 to 14 Year Olds | 94 (95.9%) | 4 (4.1%) |
| 15 to 17 Year Olds | 72 (100.0%) | 0 (0.0%) |
| 18 to 19 Year Olds | 21 (67.7%) | 10 (32.3%) |
| 20 to 24 Year Olds | 17 (100.0%) | 0 (0.0%) |
| 25 to 34 Year Olds | 8 (57.1%) | 6 (42.9%) |
| 35 Years and over | 14 (100.0%) | 0 (0.0%) |
| Total | 309 (91.7%) | 28 (8.3%) |
Educational Attainment by Field of Study in Canby
Science & technology (56 | 25.7%), education (47 | 21.6%), business (27 | 12.4%), literature & languages (16 | 7.3%), and bio, nature & agricultural (13 | 6.0%) are the most common fields of study among 218 individuals in Canby who have obtained a bachelor's degree or higher.
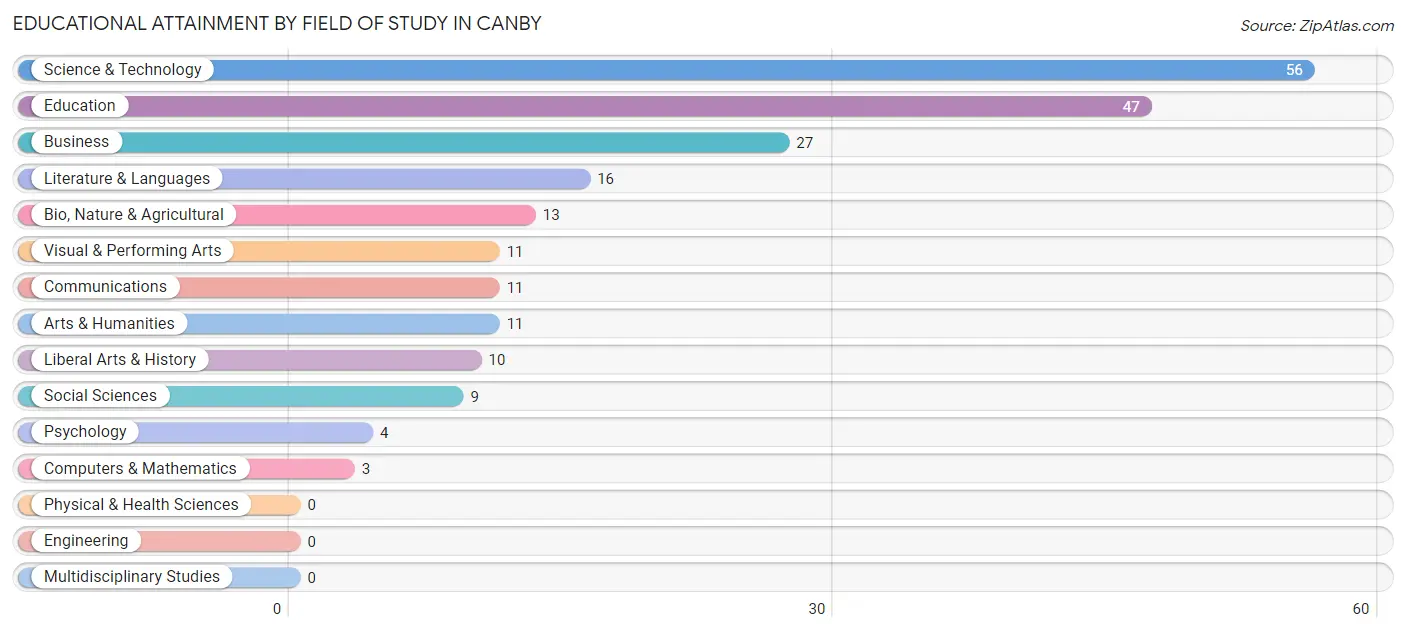
| Field of Study | # Graduates | % Graduates |
| Computers & Mathematics | 3 | 1.4% |
| Bio, Nature & Agricultural | 13 | 6.0% |
| Physical & Health Sciences | 0 | 0.0% |
| Psychology | 4 | 1.8% |
| Social Sciences | 9 | 4.1% |
| Engineering | 0 | 0.0% |
| Multidisciplinary Studies | 0 | 0.0% |
| Science & Technology | 56 | 25.7% |
| Business | 27 | 12.4% |
| Education | 47 | 21.6% |
| Literature & Languages | 16 | 7.3% |
| Liberal Arts & History | 10 | 4.6% |
| Visual & Performing Arts | 11 | 5.1% |
| Communications | 11 | 5.1% |
| Arts & Humanities | 11 | 5.1% |
| Total | 218 | 100.0% |
Transportation & Commute in Canby
Vehicle Availability by Sex in Canby
The most prevalent vehicle ownership categories in Canby are males with 2 vehicles (111, accounting for 33.6%) and females with 2 vehicles (97, making up 38.1%).
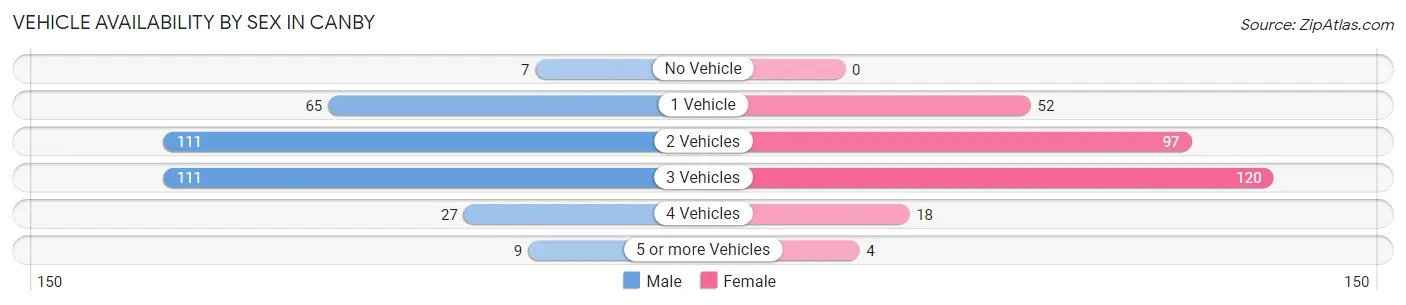
| Vehicles Available | Male | Female |
| No Vehicle | 7 (2.1%) | 0 (0.0%) |
| 1 Vehicle | 65 (19.7%) | 52 (17.9%) |
| 2 Vehicles | 111 (33.6%) | 97 (33.3%) |
| 3 Vehicles | 111 (33.6%) | 120 (41.2%) |
| 4 Vehicles | 27 (8.2%) | 18 (6.2%) |
| 5 or more Vehicles | 9 (2.7%) | 4 (1.4%) |
| Total | 330 (100.0%) | 291 (100.0%) |
Commute Time in Canby
The most frequently occuring commute durations in Canby are 5 to 9 minutes (171 commuters, 30.4%), less than 5 minutes (137 commuters, 24.3%), and 30 to 34 minutes (56 commuters, 10.0%).
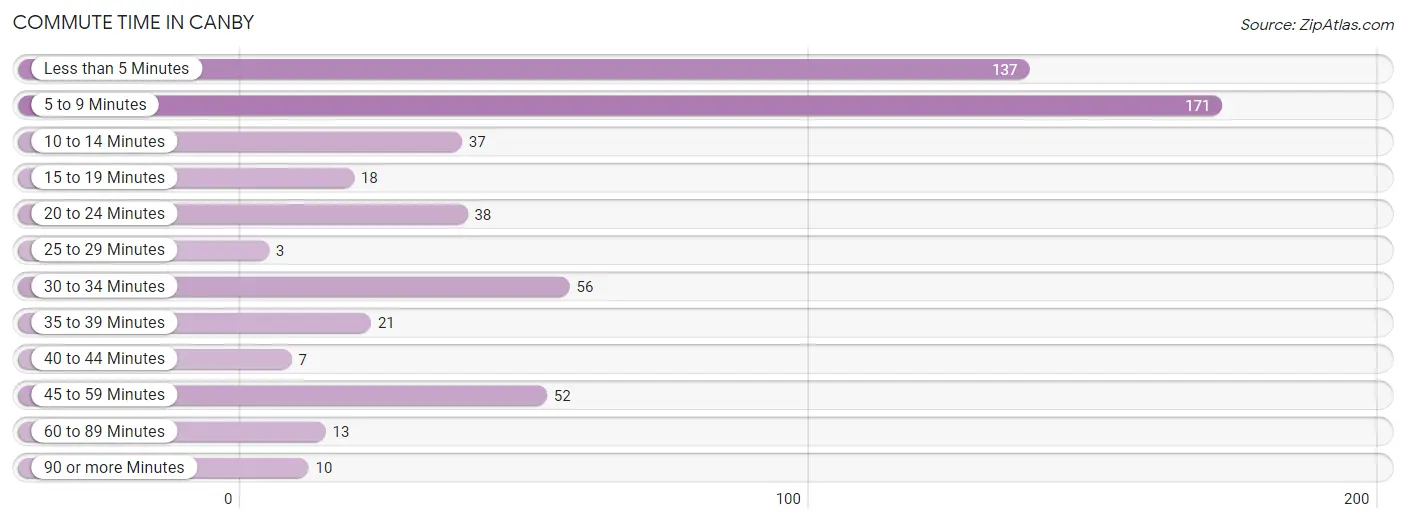
| Commute Time | # Commuters | % Commuters |
| Less than 5 Minutes | 137 | 24.3% |
| 5 to 9 Minutes | 171 | 30.4% |
| 10 to 14 Minutes | 37 | 6.6% |
| 15 to 19 Minutes | 18 | 3.2% |
| 20 to 24 Minutes | 38 | 6.8% |
| 25 to 29 Minutes | 3 | 0.5% |
| 30 to 34 Minutes | 56 | 10.0% |
| 35 to 39 Minutes | 21 | 3.7% |
| 40 to 44 Minutes | 7 | 1.2% |
| 45 to 59 Minutes | 52 | 9.2% |
| 60 to 89 Minutes | 13 | 2.3% |
| 90 or more Minutes | 10 | 1.8% |
Commute Time by Sex in Canby
The most common commute times in Canby are less than 5 minutes (91 commuters, 29.4%) for males and 5 to 9 minutes (92 commuters, 36.2%) for females.
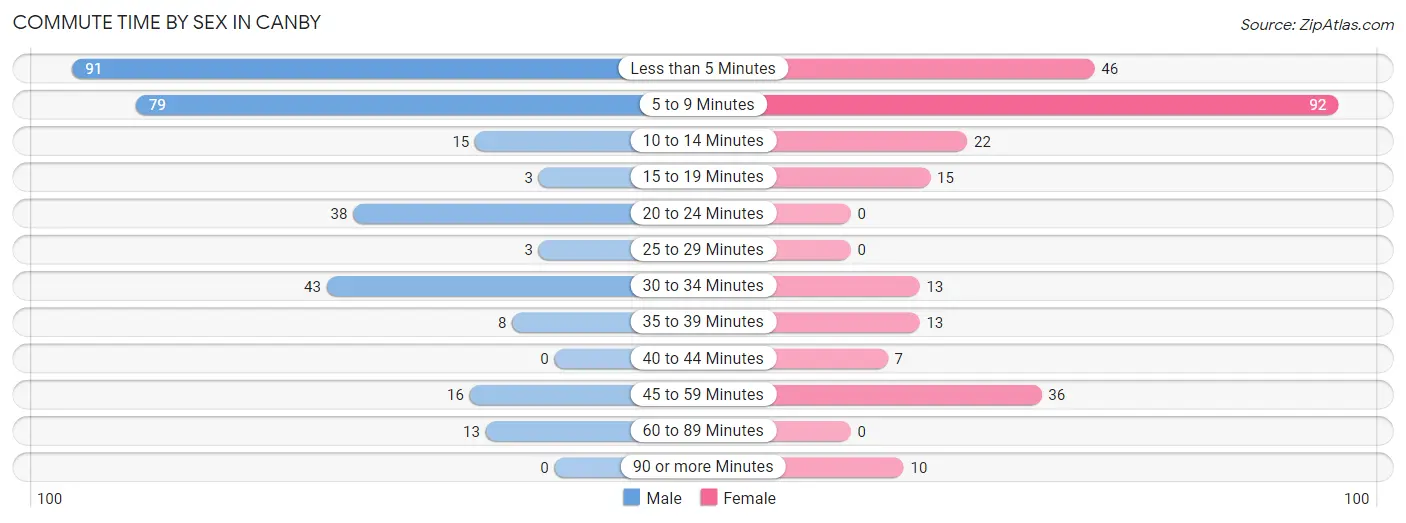
| Commute Time | Male | Female |
| Less than 5 Minutes | 91 (29.4%) | 46 (18.1%) |
| 5 to 9 Minutes | 79 (25.6%) | 92 (36.2%) |
| 10 to 14 Minutes | 15 (4.9%) | 22 (8.7%) |
| 15 to 19 Minutes | 3 (1.0%) | 15 (5.9%) |
| 20 to 24 Minutes | 38 (12.3%) | 0 (0.0%) |
| 25 to 29 Minutes | 3 (1.0%) | 0 (0.0%) |
| 30 to 34 Minutes | 43 (13.9%) | 13 (5.1%) |
| 35 to 39 Minutes | 8 (2.6%) | 13 (5.1%) |
| 40 to 44 Minutes | 0 (0.0%) | 7 (2.8%) |
| 45 to 59 Minutes | 16 (5.2%) | 36 (14.2%) |
| 60 to 89 Minutes | 13 (4.2%) | 0 (0.0%) |
| 90 or more Minutes | 0 (0.0%) | 10 (3.9%) |
Time of Departure to Work by Sex in Canby
The most frequent times of departure to work in Canby are 7:30 AM to 7:59 AM (62, 20.1%) for males and 7:00 AM to 7:29 AM (65, 25.6%) for females.
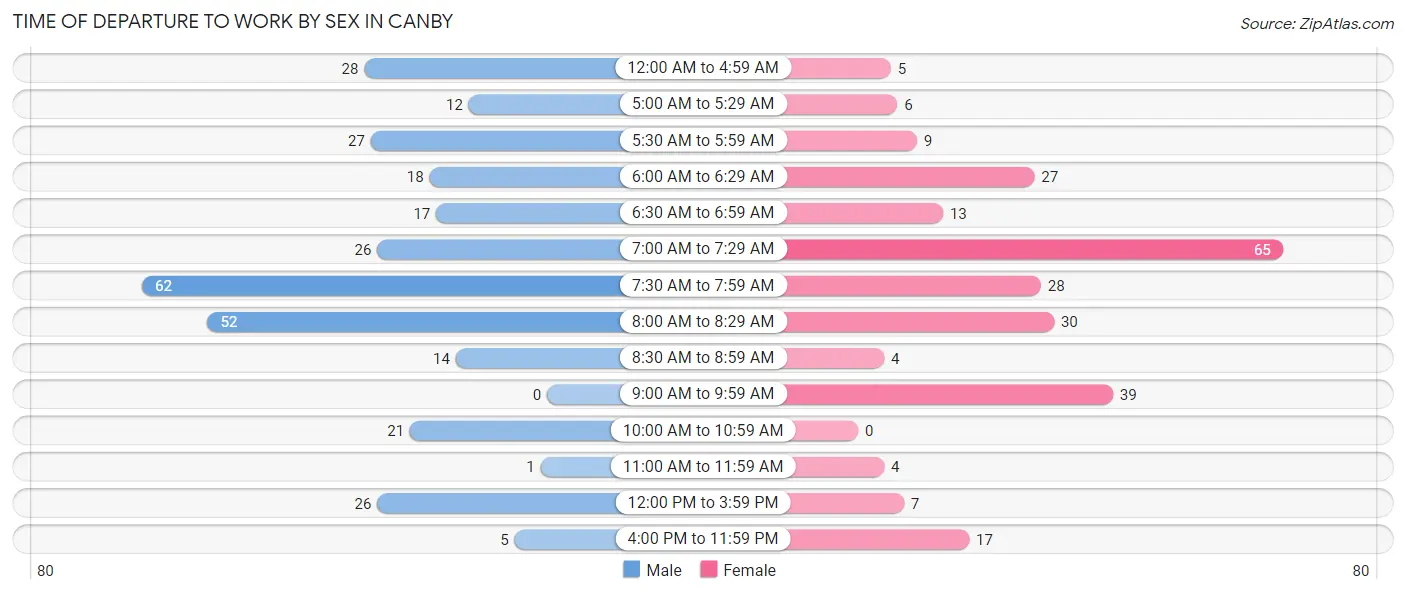
| Time of Departure | Male | Female |
| 12:00 AM to 4:59 AM | 28 (9.1%) | 5 (2.0%) |
| 5:00 AM to 5:29 AM | 12 (3.9%) | 6 (2.4%) |
| 5:30 AM to 5:59 AM | 27 (8.7%) | 9 (3.5%) |
| 6:00 AM to 6:29 AM | 18 (5.8%) | 27 (10.6%) |
| 6:30 AM to 6:59 AM | 17 (5.5%) | 13 (5.1%) |
| 7:00 AM to 7:29 AM | 26 (8.4%) | 65 (25.6%) |
| 7:30 AM to 7:59 AM | 62 (20.1%) | 28 (11.0%) |
| 8:00 AM to 8:29 AM | 52 (16.8%) | 30 (11.8%) |
| 8:30 AM to 8:59 AM | 14 (4.5%) | 4 (1.6%) |
| 9:00 AM to 9:59 AM | 0 (0.0%) | 39 (15.3%) |
| 10:00 AM to 10:59 AM | 21 (6.8%) | 0 (0.0%) |
| 11:00 AM to 11:59 AM | 1 (0.3%) | 4 (1.6%) |
| 12:00 PM to 3:59 PM | 26 (8.4%) | 7 (2.8%) |
| 4:00 PM to 11:59 PM | 5 (1.6%) | 17 (6.7%) |
| Total | 309 (100.0%) | 254 (100.0%) |
Housing Occupancy in Canby
Occupancy by Ownership in Canby
Of the total 680 dwellings in Canby, owner-occupied units account for 548 (80.6%), while renter-occupied units make up 132 (19.4%).
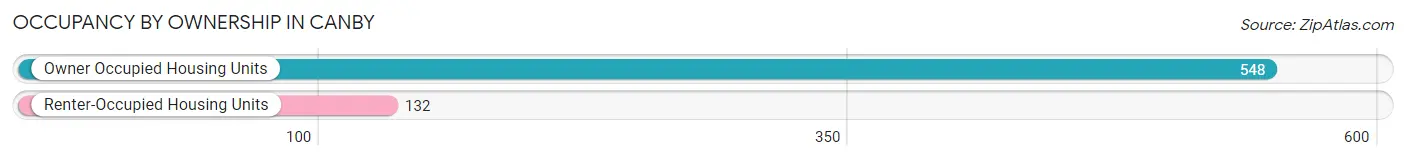
| Occupancy | # Housing Units | % Housing Units |
| Owner Occupied Housing Units | 548 | 80.6% |
| Renter-Occupied Housing Units | 132 | 19.4% |
| Total Occupied Housing Units | 680 | 100.0% |
Occupancy by Household Size in Canby
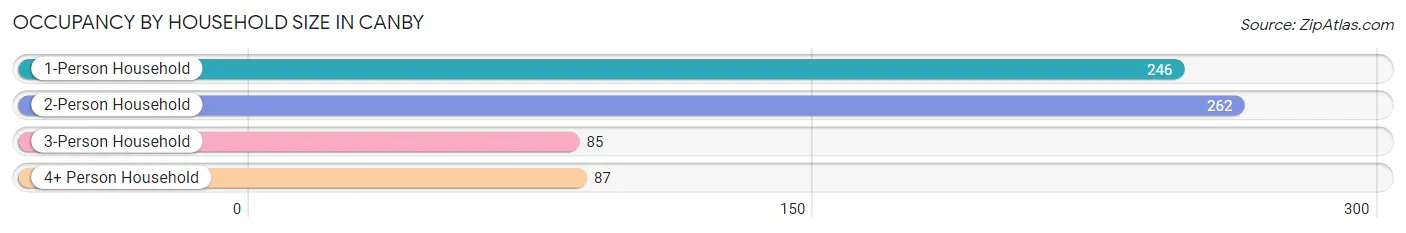
| Household Size | # Housing Units | % Housing Units |
| 1-Person Household | 246 | 36.2% |
| 2-Person Household | 262 | 38.5% |
| 3-Person Household | 85 | 12.5% |
| 4+ Person Household | 87 | 12.8% |
| Total Housing Units | 680 | 100.0% |
Occupancy by Ownership by Household Size in Canby
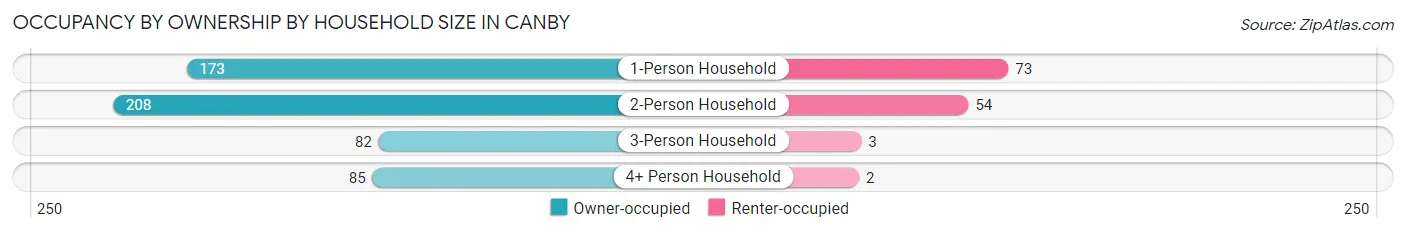
| Household Size | Owner-occupied | Renter-occupied |
| 1-Person Household | 173 (70.3%) | 73 (29.7%) |
| 2-Person Household | 208 (79.4%) | 54 (20.6%) |
| 3-Person Household | 82 (96.5%) | 3 (3.5%) |
| 4+ Person Household | 85 (97.7%) | 2 (2.3%) |
| Total Housing Units | 548 (80.6%) | 132 (19.4%) |
Occupancy by Educational Attainment in Canby
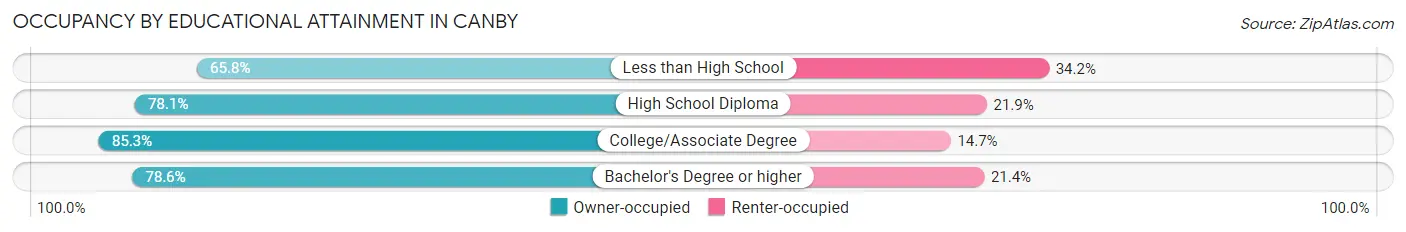
| Household Size | Owner-occupied | Renter-occupied |
| Less than High School | 25 (65.8%) | 13 (34.2%) |
| High School Diploma | 182 (78.1%) | 51 (21.9%) |
| College/Associate Degree | 249 (85.3%) | 43 (14.7%) |
| Bachelor's Degree or higher | 92 (78.6%) | 25 (21.4%) |
Occupancy by Age of Householder in Canby
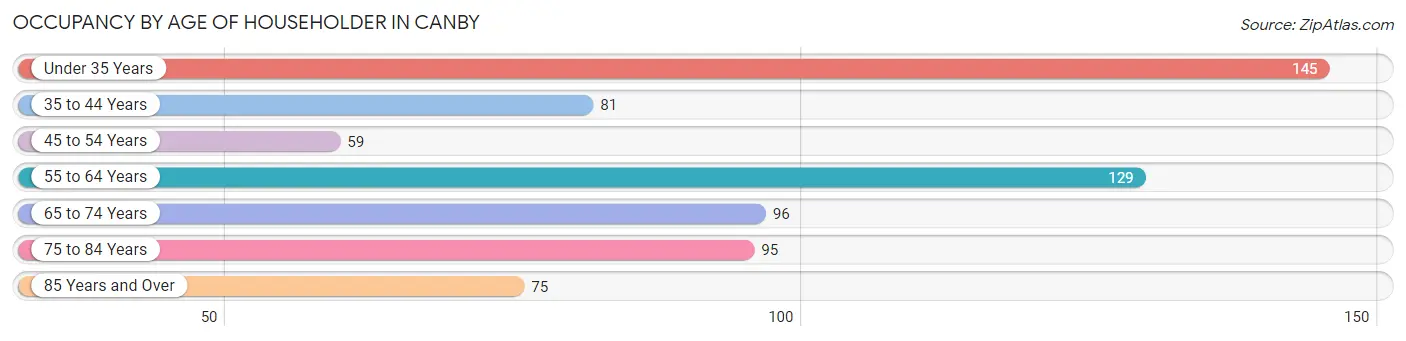
| Age Bracket | # Households | % Households |
| Under 35 Years | 145 | 21.3% |
| 35 to 44 Years | 81 | 11.9% |
| 45 to 54 Years | 59 | 8.7% |
| 55 to 64 Years | 129 | 19.0% |
| 65 to 74 Years | 96 | 14.1% |
| 75 to 84 Years | 95 | 14.0% |
| 85 Years and Over | 75 | 11.0% |
| Total | 680 | 100.0% |
Housing Finances in Canby
Median Income by Occupancy in Canby
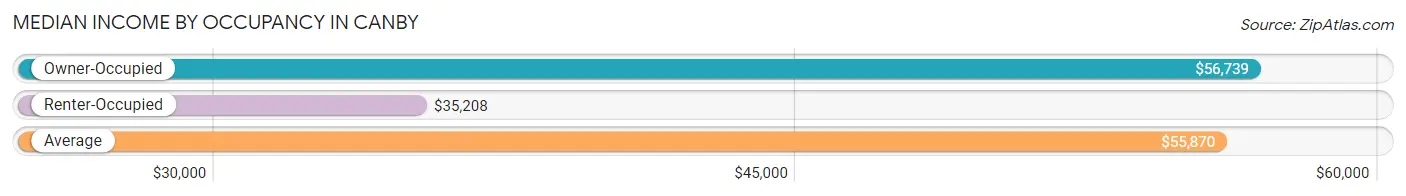
| Occupancy Type | # Households | Median Income |
| Owner-Occupied | 548 (80.6%) | $56,739 |
| Renter-Occupied | 132 (19.4%) | $35,208 |
| Average | 680 (100.0%) | $55,870 |
Occupancy by Householder Income Bracket in Canby
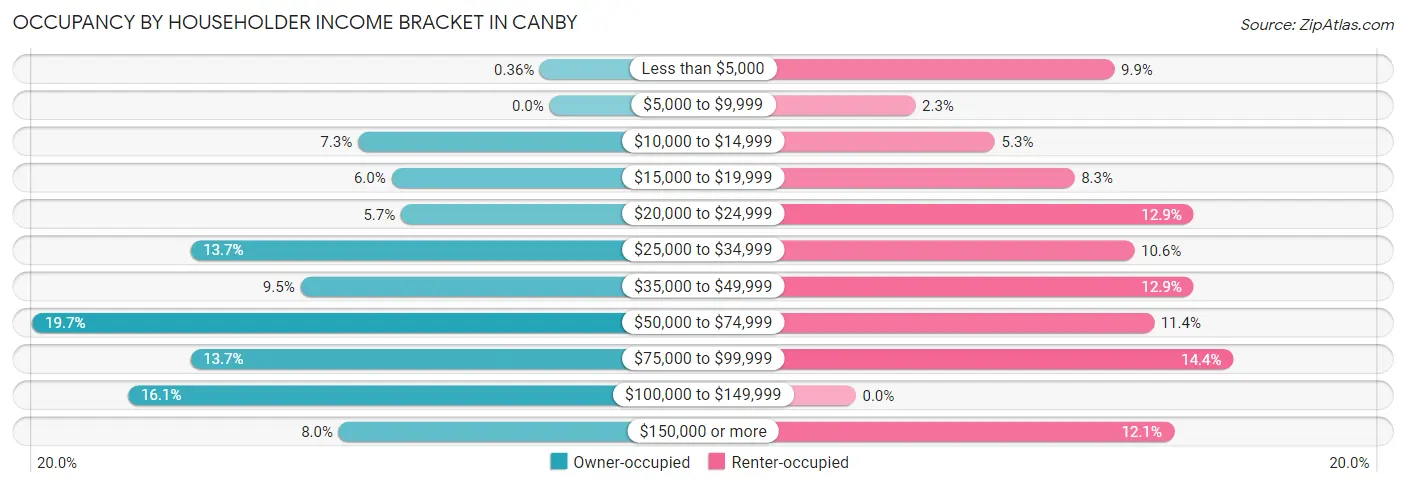
| Income Bracket | Owner-occupied | Renter-occupied |
| Less than $5,000 | 2 (0.4%) | 13 (9.9%) |
| $5,000 to $9,999 | 0 (0.0%) | 3 (2.3%) |
| $10,000 to $14,999 | 40 (7.3%) | 7 (5.3%) |
| $15,000 to $19,999 | 33 (6.0%) | 11 (8.3%) |
| $20,000 to $24,999 | 31 (5.7%) | 17 (12.9%) |
| $25,000 to $34,999 | 75 (13.7%) | 14 (10.6%) |
| $35,000 to $49,999 | 52 (9.5%) | 17 (12.9%) |
| $50,000 to $74,999 | 108 (19.7%) | 15 (11.4%) |
| $75,000 to $99,999 | 75 (13.7%) | 19 (14.4%) |
| $100,000 to $149,999 | 88 (16.1%) | 0 (0.0%) |
| $150,000 or more | 44 (8.0%) | 16 (12.1%) |
| Total | 548 (100.0%) | 132 (100.0%) |
Monthly Housing Cost Tiers in Canby
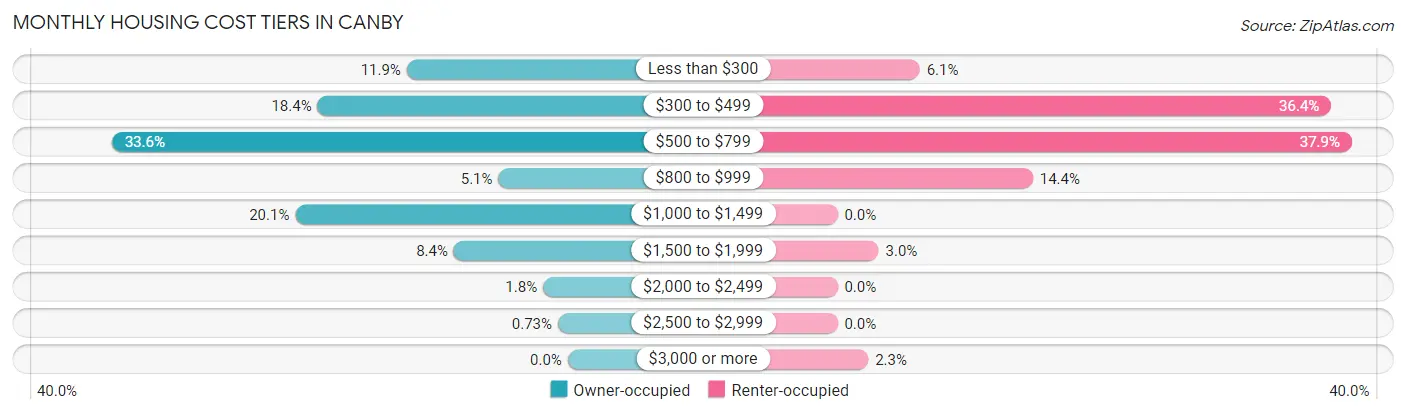
| Monthly Cost | Owner-occupied | Renter-occupied |
| Less than $300 | 65 (11.9%) | 8 (6.1%) |
| $300 to $499 | 101 (18.4%) | 48 (36.4%) |
| $500 to $799 | 184 (33.6%) | 50 (37.9%) |
| $800 to $999 | 28 (5.1%) | 19 (14.4%) |
| $1,000 to $1,499 | 110 (20.1%) | 0 (0.0%) |
| $1,500 to $1,999 | 46 (8.4%) | 4 (3.0%) |
| $2,000 to $2,499 | 10 (1.8%) | 0 (0.0%) |
| $2,500 to $2,999 | 4 (0.7%) | 0 (0.0%) |
| $3,000 or more | 0 (0.0%) | 3 (2.3%) |
| Total | 548 (100.0%) | 132 (100.0%) |
Physical Housing Characteristics in Canby
Housing Structures in Canby
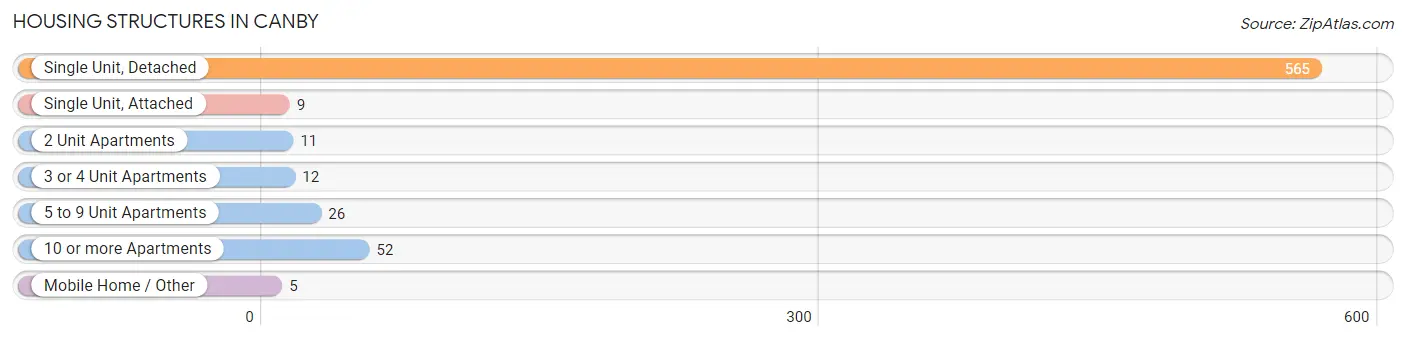
| Structure Type | # Housing Units | % Housing Units |
| Single Unit, Detached | 565 | 83.1% |
| Single Unit, Attached | 9 | 1.3% |
| 2 Unit Apartments | 11 | 1.6% |
| 3 or 4 Unit Apartments | 12 | 1.8% |
| 5 to 9 Unit Apartments | 26 | 3.8% |
| 10 or more Apartments | 52 | 7.6% |
| Mobile Home / Other | 5 | 0.7% |
| Total | 680 | 100.0% |
Housing Structures by Occupancy in Canby
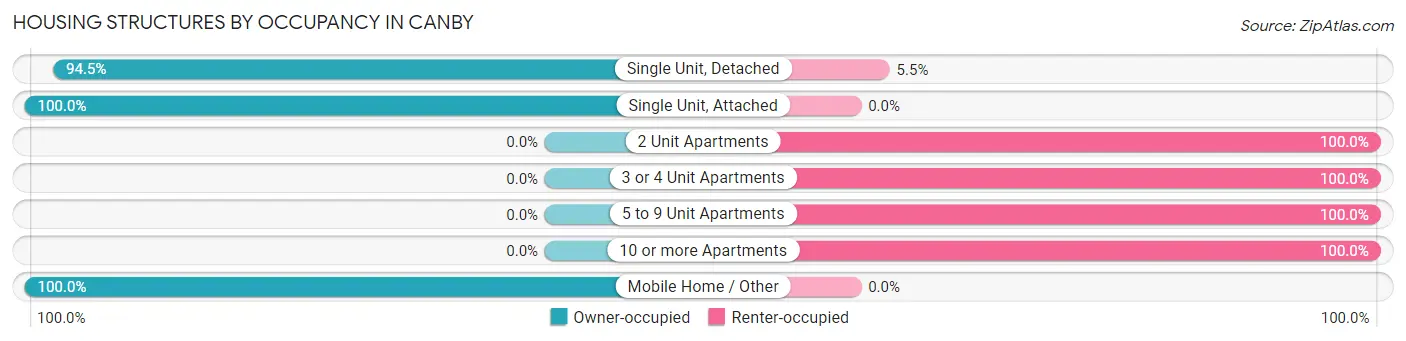
| Structure Type | Owner-occupied | Renter-occupied |
| Single Unit, Detached | 534 (94.5%) | 31 (5.5%) |
| Single Unit, Attached | 9 (100.0%) | 0 (0.0%) |
| 2 Unit Apartments | 0 (0.0%) | 11 (100.0%) |
| 3 or 4 Unit Apartments | 0 (0.0%) | 12 (100.0%) |
| 5 to 9 Unit Apartments | 0 (0.0%) | 26 (100.0%) |
| 10 or more Apartments | 0 (0.0%) | 52 (100.0%) |
| Mobile Home / Other | 5 (100.0%) | 0 (0.0%) |
| Total | 548 (80.6%) | 132 (19.4%) |
Housing Structures by Number of Rooms in Canby
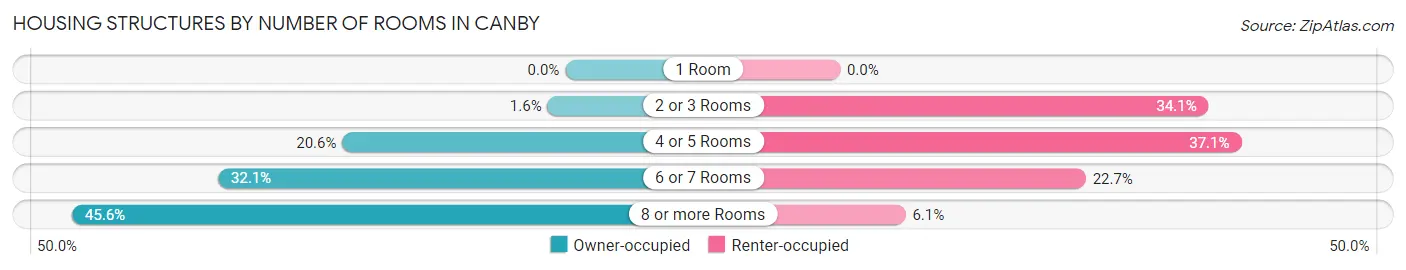
| Number of Rooms | Owner-occupied | Renter-occupied |
| 1 Room | 0 (0.0%) | 0 (0.0%) |
| 2 or 3 Rooms | 9 (1.6%) | 45 (34.1%) |
| 4 or 5 Rooms | 113 (20.6%) | 49 (37.1%) |
| 6 or 7 Rooms | 176 (32.1%) | 30 (22.7%) |
| 8 or more Rooms | 250 (45.6%) | 8 (6.1%) |
| Total | 548 (100.0%) | 132 (100.0%) |
Housing Structure by Heating Type in Canby
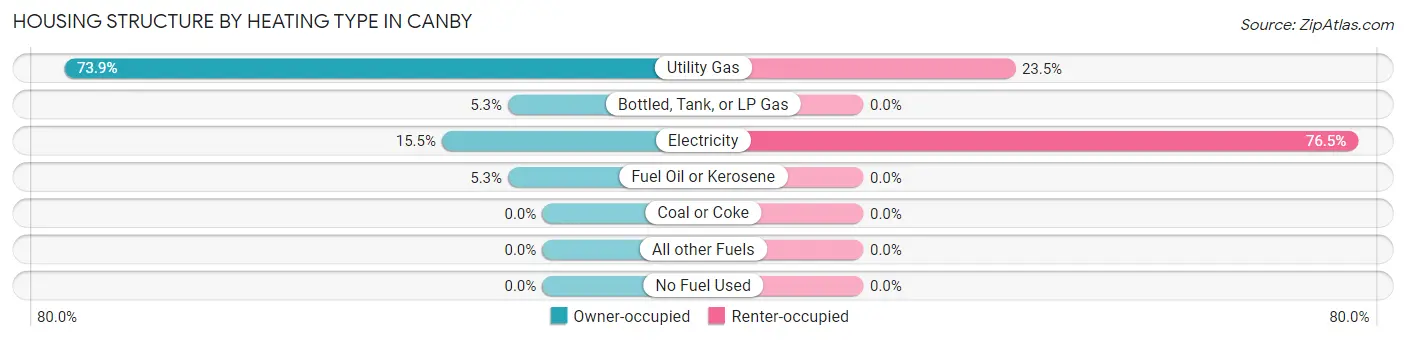
| Heating Type | Owner-occupied | Renter-occupied |
| Utility Gas | 405 (73.9%) | 31 (23.5%) |
| Bottled, Tank, or LP Gas | 29 (5.3%) | 0 (0.0%) |
| Electricity | 85 (15.5%) | 101 (76.5%) |
| Fuel Oil or Kerosene | 29 (5.3%) | 0 (0.0%) |
| Coal or Coke | 0 (0.0%) | 0 (0.0%) |
| All other Fuels | 0 (0.0%) | 0 (0.0%) |
| No Fuel Used | 0 (0.0%) | 0 (0.0%) |
| Total | 548 (100.0%) | 132 (100.0%) |
Household Vehicle Usage in Canby
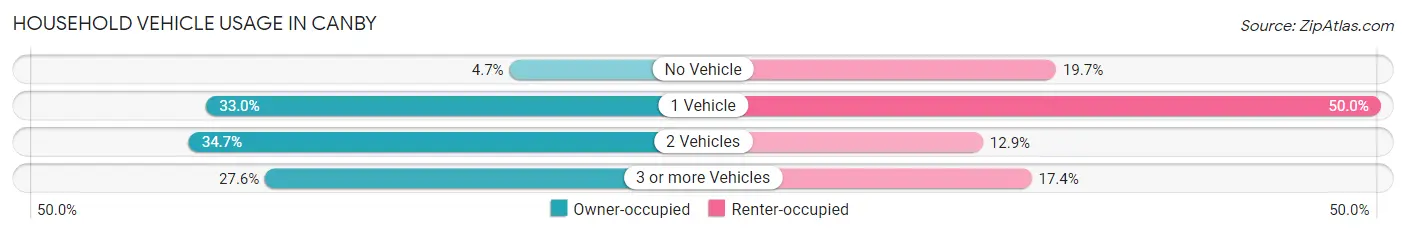
| Vehicles per Household | Owner-occupied | Renter-occupied |
| No Vehicle | 26 (4.7%) | 26 (19.7%) |
| 1 Vehicle | 181 (33.0%) | 66 (50.0%) |
| 2 Vehicles | 190 (34.7%) | 17 (12.9%) |
| 3 or more Vehicles | 151 (27.6%) | 23 (17.4%) |
| Total | 548 (100.0%) | 132 (100.0%) |
Real Estate & Mortgages in Canby
Real Estate and Mortgage Overview in Canby
| Characteristic | Without Mortgage | With Mortgage |
| Housing Units | 327 | 221 |
| Median Property Value | $115,100 | $153,500 |
| Median Household Income | $40,781 | $31 |
| Monthly Housing Costs | $506 | $0 |
| Real Estate Taxes | $1,620 | $0 |
Property Value by Mortgage Status in Canby
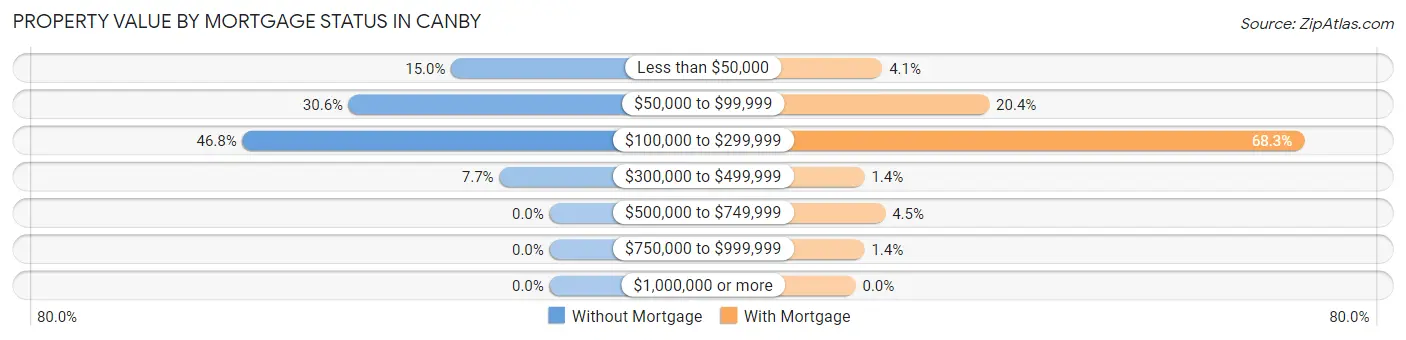
| Property Value | Without Mortgage | With Mortgage |
| Less than $50,000 | 49 (15.0%) | 9 (4.1%) |
| $50,000 to $99,999 | 100 (30.6%) | 45 (20.4%) |
| $100,000 to $299,999 | 153 (46.8%) | 151 (68.3%) |
| $300,000 to $499,999 | 25 (7.6%) | 3 (1.4%) |
| $500,000 to $749,999 | 0 (0.0%) | 10 (4.5%) |
| $750,000 to $999,999 | 0 (0.0%) | 3 (1.4%) |
| $1,000,000 or more | 0 (0.0%) | 0 (0.0%) |
| Total | 327 (100.0%) | 221 (100.0%) |
Household Income by Mortgage Status in Canby
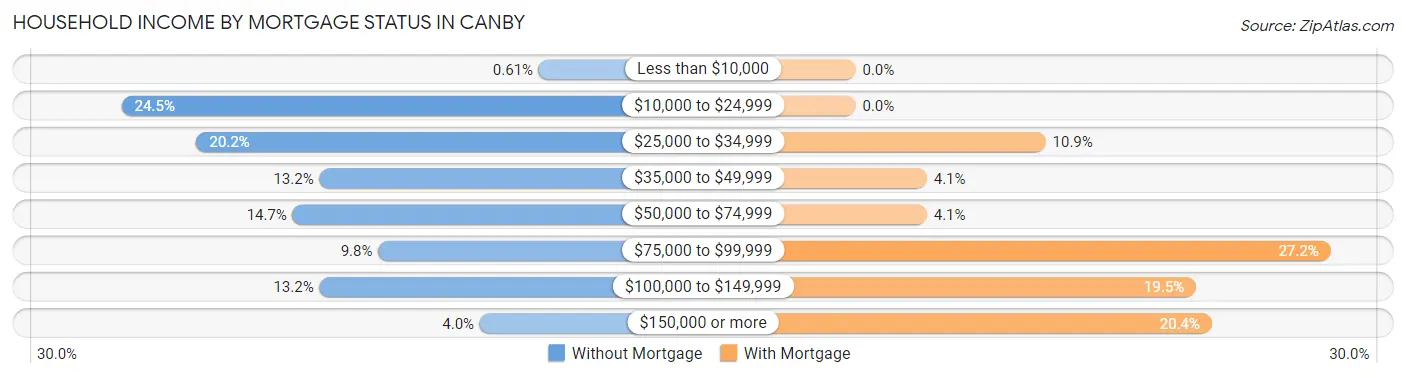
| Household Income | Without Mortgage | With Mortgage |
| Less than $10,000 | 2 (0.6%) | 0 (0.0%) |
| $10,000 to $24,999 | 80 (24.5%) | 0 (0.0%) |
| $25,000 to $34,999 | 66 (20.2%) | 24 (10.9%) |
| $35,000 to $49,999 | 43 (13.2%) | 9 (4.1%) |
| $50,000 to $74,999 | 48 (14.7%) | 9 (4.1%) |
| $75,000 to $99,999 | 32 (9.8%) | 60 (27.2%) |
| $100,000 to $149,999 | 43 (13.2%) | 43 (19.5%) |
| $150,000 or more | 13 (4.0%) | 45 (20.4%) |
| Total | 327 (100.0%) | 221 (100.0%) |
Property Value to Household Income Ratio in Canby
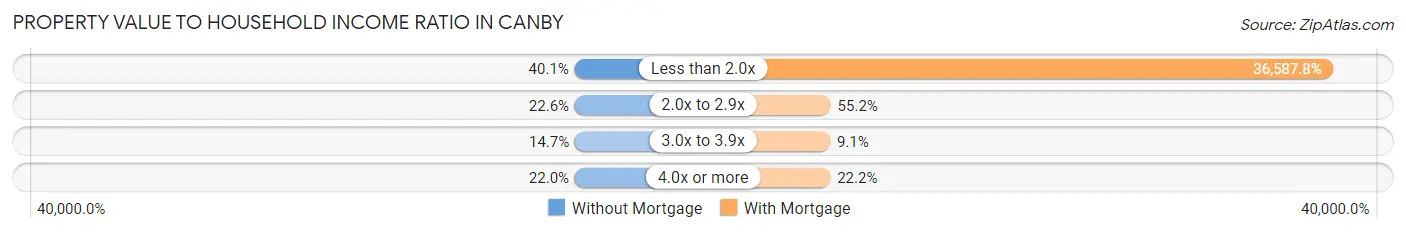
| Value-to-Income Ratio | Without Mortgage | With Mortgage |
| Less than 2.0x | 131 (40.1%) | 80,859 (36,587.8%) |
| 2.0x to 2.9x | 74 (22.6%) | 122 (55.2%) |
| 3.0x to 3.9x | 48 (14.7%) | 20 (9.0%) |
| 4.0x or more | 72 (22.0%) | 49 (22.2%) |
| Total | 327 (100.0%) | 221 (100.0%) |
Real Estate Taxes by Mortgage Status in Canby
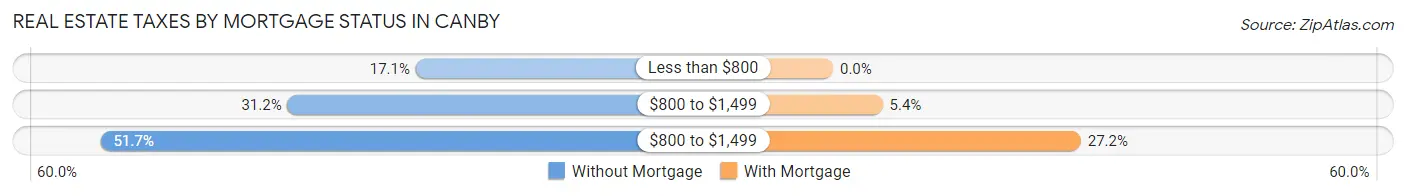
| Property Taxes | Without Mortgage | With Mortgage |
| Less than $800 | 56 (17.1%) | 0 (0.0%) |
| $800 to $1,499 | 102 (31.2%) | 12 (5.4%) |
| $800 to $1,499 | 169 (51.7%) | 60 (27.2%) |
| Total | 327 (100.0%) | 221 (100.0%) |
Health & Disability in Canby
Health Insurance Coverage by Age in Canby
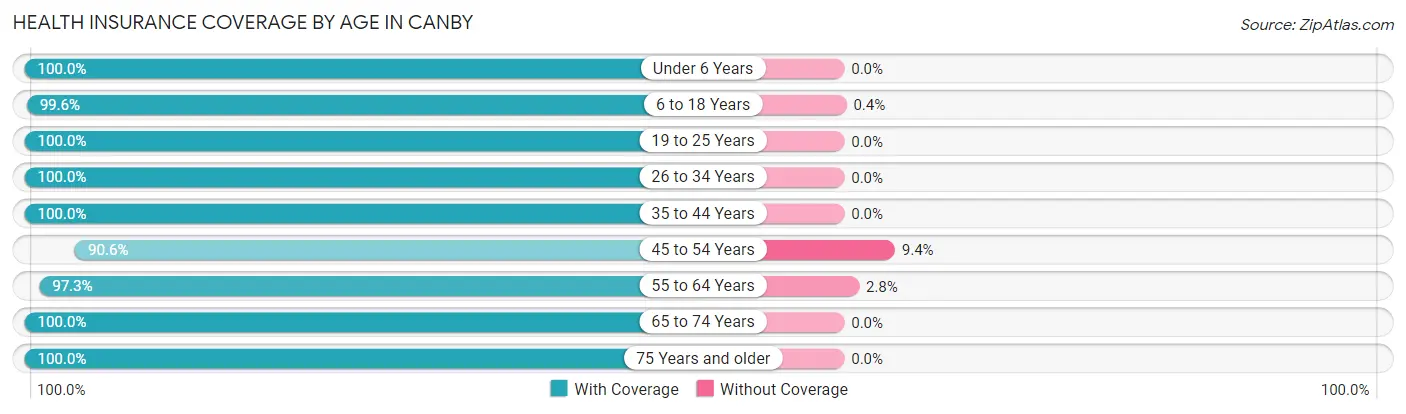
| Age Bracket | With Coverage | Without Coverage |
| Under 6 Years | 78 (100.0%) | 0 (0.0%) |
| 6 to 18 Years | 247 (99.6%) | 1 (0.4%) |
| 19 to 25 Years | 150 (100.0%) | 0 (0.0%) |
| 26 to 34 Years | 178 (100.0%) | 0 (0.0%) |
| 35 to 44 Years | 108 (100.0%) | 0 (0.0%) |
| 45 to 54 Years | 96 (90.6%) | 10 (9.4%) |
| 55 to 64 Years | 212 (97.3%) | 6 (2.8%) |
| 65 to 74 Years | 145 (100.0%) | 0 (0.0%) |
| 75 Years and older | 211 (100.0%) | 0 (0.0%) |
| Total | 1,425 (98.8%) | 17 (1.2%) |
Health Insurance Coverage by Citizenship Status in Canby
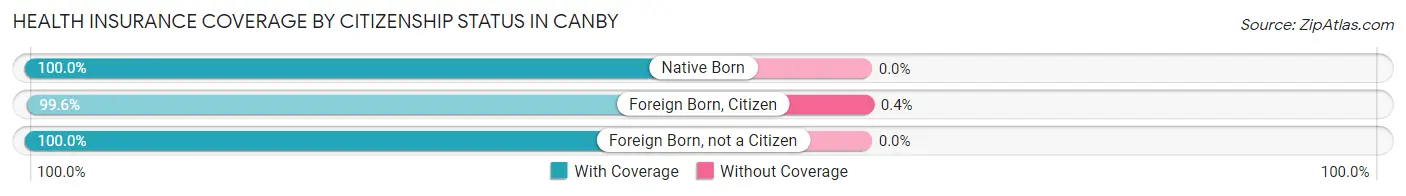
| Citizenship Status | With Coverage | Without Coverage |
| Native Born | 78 (100.0%) | 0 (0.0%) |
| Foreign Born, Citizen | 247 (99.6%) | 1 (0.4%) |
| Foreign Born, not a Citizen | 150 (100.0%) | 0 (0.0%) |
Health Insurance Coverage by Household Income in Canby
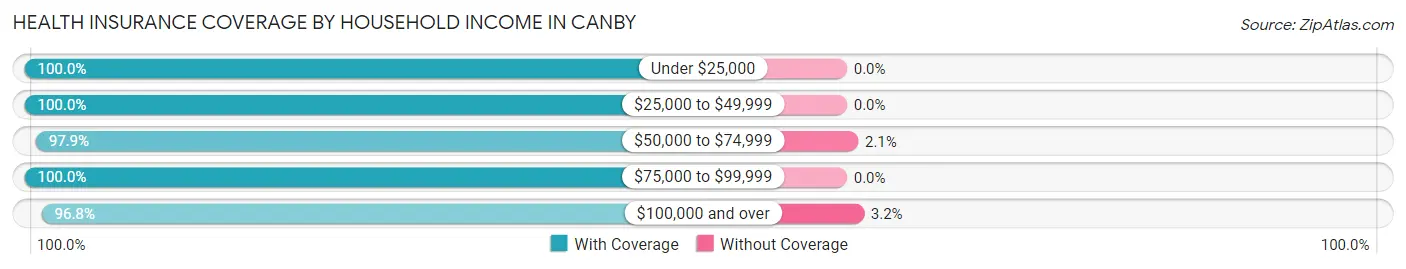
| Household Income | With Coverage | Without Coverage |
| Under $25,000 | 218 (100.0%) | 0 (0.0%) |
| $25,000 to $49,999 | 288 (100.0%) | 0 (0.0%) |
| $50,000 to $74,999 | 278 (97.9%) | 6 (2.1%) |
| $75,000 to $99,999 | 240 (100.0%) | 0 (0.0%) |
| $100,000 and over | 334 (96.8%) | 11 (3.2%) |
Public vs Private Health Insurance Coverage by Age in Canby
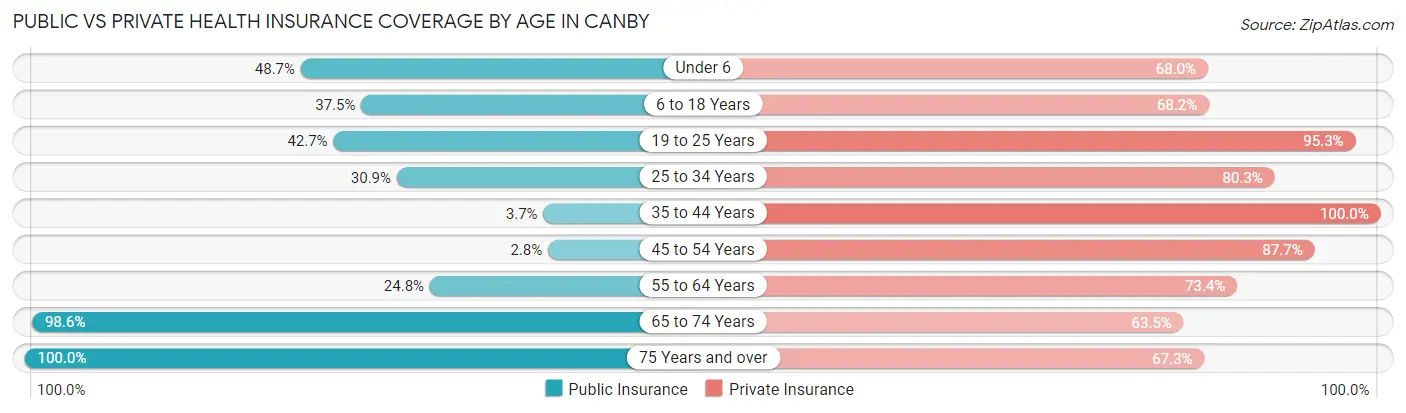
| Age Bracket | Public Insurance | Private Insurance |
| Under 6 | 38 (48.7%) | 53 (67.9%) |
| 6 to 18 Years | 93 (37.5%) | 169 (68.1%) |
| 19 to 25 Years | 64 (42.7%) | 143 (95.3%) |
| 25 to 34 Years | 55 (30.9%) | 143 (80.3%) |
| 35 to 44 Years | 4 (3.7%) | 108 (100.0%) |
| 45 to 54 Years | 3 (2.8%) | 93 (87.7%) |
| 55 to 64 Years | 54 (24.8%) | 160 (73.4%) |
| 65 to 74 Years | 143 (98.6%) | 92 (63.4%) |
| 75 Years and over | 211 (100.0%) | 142 (67.3%) |
| Total | 665 (46.1%) | 1,103 (76.5%) |
Disability Status by Sex by Age in Canby
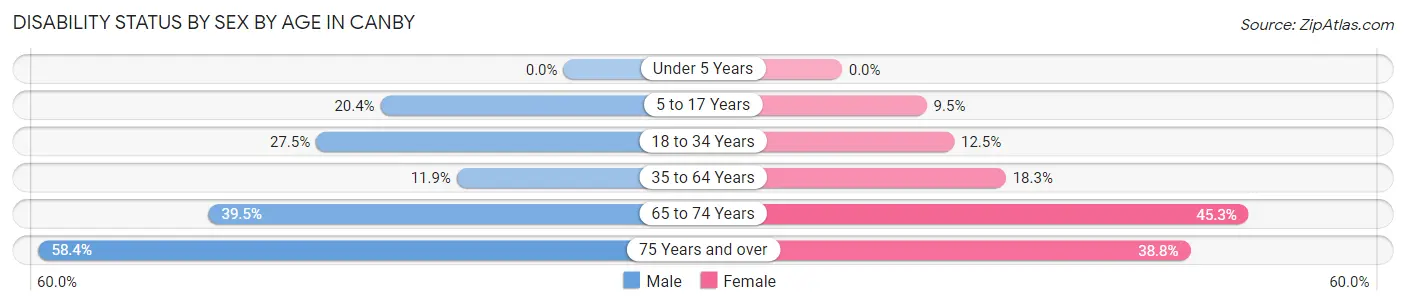
| Age Bracket | Male | Female |
| Under 5 Years | 0 (0.0%) | 0 (0.0%) |
| 5 to 17 Years | 22 (20.4%) | 12 (9.5%) |
| 18 to 34 Years | 57 (27.5%) | 19 (12.5%) |
| 35 to 64 Years | 24 (11.9%) | 42 (18.3%) |
| 65 to 74 Years | 32 (39.5%) | 29 (45.3%) |
| 75 Years and over | 45 (58.4%) | 52 (38.8%) |
Disability Class by Sex by Age in Canby
Disability Class: Hearing Difficulty
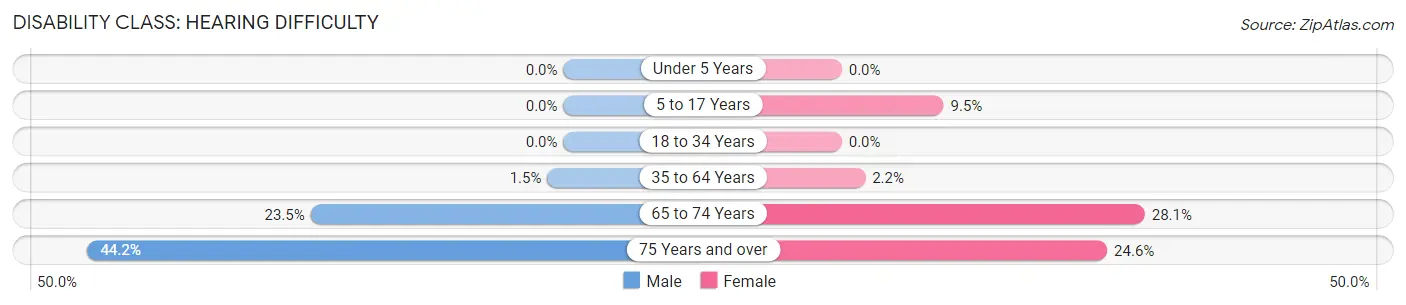
| Age Bracket | Male | Female |
| Under 5 Years | 0 (0.0%) | 0 (0.0%) |
| 5 to 17 Years | 0 (0.0%) | 12 (9.5%) |
| 18 to 34 Years | 0 (0.0%) | 0 (0.0%) |
| 35 to 64 Years | 3 (1.5%) | 5 (2.2%) |
| 65 to 74 Years | 19 (23.5%) | 18 (28.1%) |
| 75 Years and over | 34 (44.2%) | 33 (24.6%) |
Disability Class: Vision Difficulty
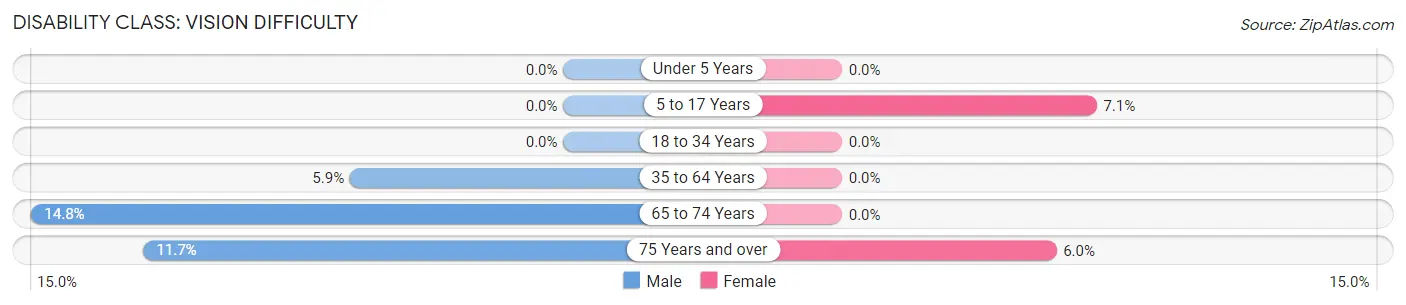
| Age Bracket | Male | Female |
| Under 5 Years | 0 (0.0%) | 0 (0.0%) |
| 5 to 17 Years | 0 (0.0%) | 9 (7.1%) |
| 18 to 34 Years | 0 (0.0%) | 0 (0.0%) |
| 35 to 64 Years | 12 (5.9%) | 0 (0.0%) |
| 65 to 74 Years | 12 (14.8%) | 0 (0.0%) |
| 75 Years and over | 9 (11.7%) | 8 (6.0%) |
Disability Class: Cognitive Difficulty
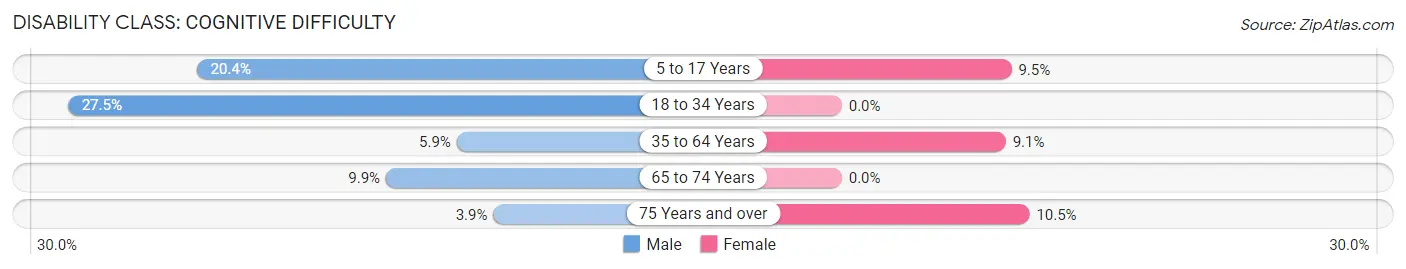
| Age Bracket | Male | Female |
| 5 to 17 Years | 22 (20.4%) | 12 (9.5%) |
| 18 to 34 Years | 57 (27.5%) | 0 (0.0%) |
| 35 to 64 Years | 12 (5.9%) | 21 (9.1%) |
| 65 to 74 Years | 8 (9.9%) | 0 (0.0%) |
| 75 Years and over | 3 (3.9%) | 14 (10.4%) |
Disability Class: Ambulatory Difficulty
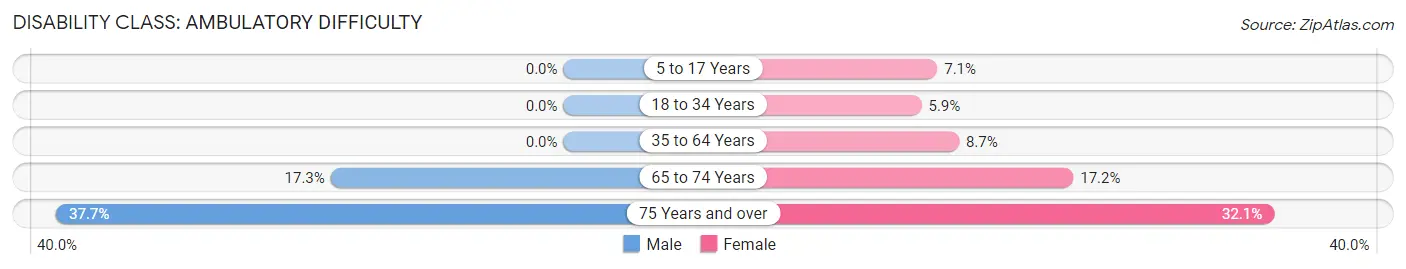
| Age Bracket | Male | Female |
| 5 to 17 Years | 0 (0.0%) | 9 (7.1%) |
| 18 to 34 Years | 0 (0.0%) | 9 (5.9%) |
| 35 to 64 Years | 0 (0.0%) | 20 (8.7%) |
| 65 to 74 Years | 14 (17.3%) | 11 (17.2%) |
| 75 Years and over | 29 (37.7%) | 43 (32.1%) |
Disability Class: Self-Care Difficulty
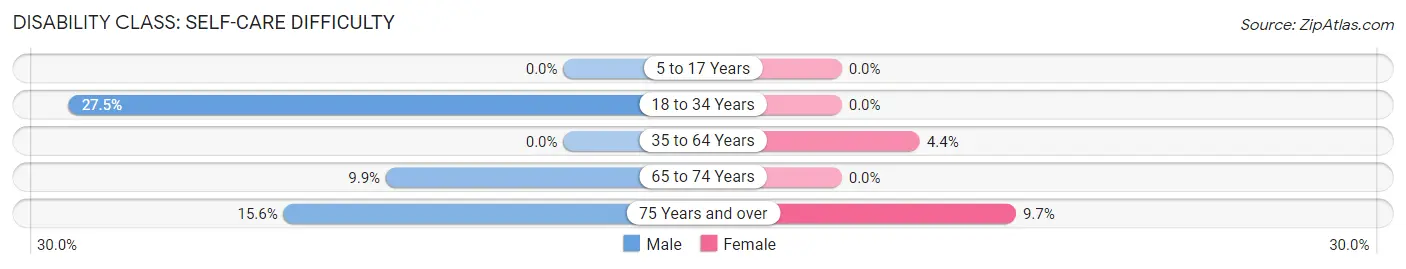
| Age Bracket | Male | Female |
| 5 to 17 Years | 0 (0.0%) | 0 (0.0%) |
| 18 to 34 Years | 57 (27.5%) | 0 (0.0%) |
| 35 to 64 Years | 0 (0.0%) | 10 (4.3%) |
| 65 to 74 Years | 8 (9.9%) | 0 (0.0%) |
| 75 Years and over | 12 (15.6%) | 13 (9.7%) |
Technology Access in Canby
Computing Device Access in Canby
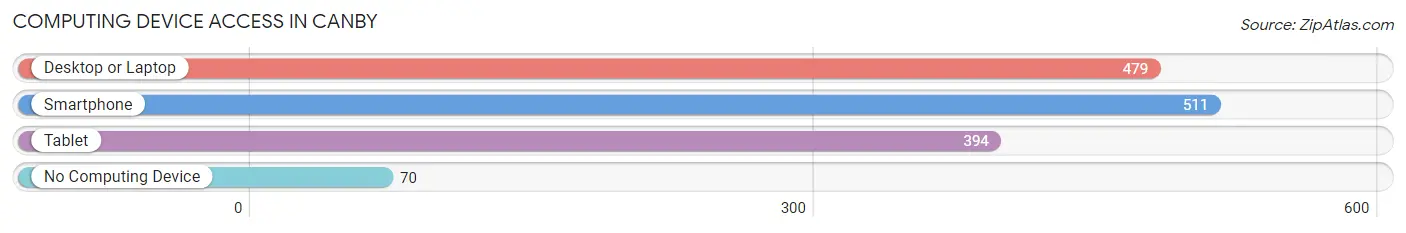
| Device Type | # Households | % Households |
| Desktop or Laptop | 479 | 70.4% |
| Smartphone | 511 | 75.1% |
| Tablet | 394 | 57.9% |
| No Computing Device | 70 | 10.3% |
| Total | 680 | 100.0% |
Internet Access in Canby
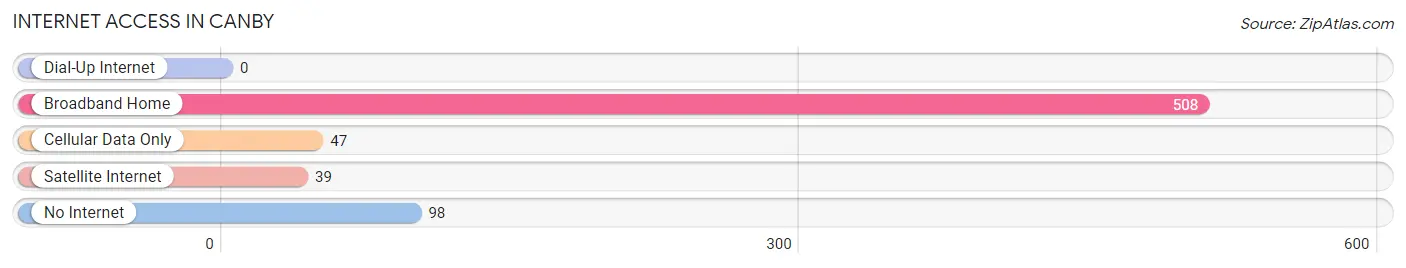
| Internet Type | # Households | % Households |
| Dial-Up Internet | 0 | 0.0% |
| Broadband Home | 508 | 74.7% |
| Cellular Data Only | 47 | 6.9% |
| Satellite Internet | 39 | 5.7% |
| No Internet | 98 | 14.4% |
| Total | 680 | 100.0% |
Canby Summary
Canby, Minnesota is a small city located in Yellow Medicine County in the southwestern part of the state. It is situated on the banks of the Chippewa River, and is home to a population of just over 2,000 people. The city is known for its rich history, diverse geography, and vibrant economy.
History
Canby was founded in 1876 by a group of Swedish immigrants who were looking for a place to settle and start a new life. The city was named after the Swedish city of Canby, and the settlers quickly began to build a thriving community. The first settlers were mainly farmers, but soon the city began to attract other businesses, such as a sawmill, a flour mill, and a brickyard.
In the early 1900s, Canby began to experience a period of growth and prosperity. The city was home to a number of businesses, including a bank, a hotel, a newspaper, and a variety of stores. The city also had a thriving cultural life, with a theater, a library, and a number of churches.
Geography
Canby is located in the southwestern part of Minnesota, in Yellow Medicine County. The city is situated on the banks of the Chippewa River, and is surrounded by rolling hills and farmland. The city is located about 50 miles from the state capital of St. Paul, and is about a two-hour drive from Minneapolis.
The city has a total area of 1.7 square miles, and is home to a variety of wildlife, including deer, foxes, and a variety of birds. The city is also home to a number of parks, including a city park, a county park, and a state park.
Economy
Canby’s economy is largely based on agriculture, with the city being home to a number of farms and ranches. The city is also home to a number of businesses, including a grocery store, a hardware store, and a variety of restaurants. The city is also home to a number of manufacturing companies, including a furniture factory and a plastics factory.
The city is also home to a number of educational institutions, including a public school system, a community college, and a technical college. The city is also home to a number of healthcare facilities, including a hospital and a number of clinics.
Demographics
As of the 2010 census, Canby had a population of 2,039 people. The city has a median age of 38.7 years, and a median household income of $41,944. The city is predominantly white, with 92.3% of the population being white, and the remaining 7.7% being of other races. The city is also home to a number of immigrants, with 8.3% of the population being foreign-born.
Canby is a small city with a rich history, diverse geography, and vibrant economy. The city is home to a number of businesses, educational institutions, and healthcare facilities, and is a great place to live and work.
Common Questions
What is Per Capita Income in Canby?
Per Capita income in Canby is $34,154.
What is the Median Family Income in Canby?
Median Family Income in Canby is $82,000.
What is the Median Household income in Canby?
Median Household Income in Canby is $55,870.
What is Income or Wage Gap in Canby?
Income or Wage Gap in Canby is 45.9%.
Women in Canby earn 54.1 cents for every dollar earned by a man.
What is Inequality or Gini Index in Canby?
Inequality or Gini Index in Canby is 0.45.
What is the Total Population of Canby?
Total Population of Canby is 1,479.
What is the Total Male Population of Canby?
Total Male Population of Canby is 721.
What is the Total Female Population of Canby?
Total Female Population of Canby is 758.
What is the Ratio of Males per 100 Females in Canby?
There are 95.12 Males per 100 Females in Canby.
What is the Ratio of Females per 100 Males in Canby?
There are 105.13 Females per 100 Males in Canby.
What is the Median Population Age in Canby?
Median Population Age in Canby is 42.8 Years.
What is the Average Family Size in Canby
Average Family Size in Canby is 2.6 People.
What is the Average Household Size in Canby
Average Household Size in Canby is 2.0 People.
How Large is the Labor Force in Canby?
There are 678 People in the Labor Forcein in Canby.
What is the Percentage of People in the Labor Force in Canby?
54.4% of People are in the Labor Force in Canby.
What is the Unemployment Rate in Canby?
Unemployment Rate in Canby is 6.3%.