Dellwood, MN Map & Demographics
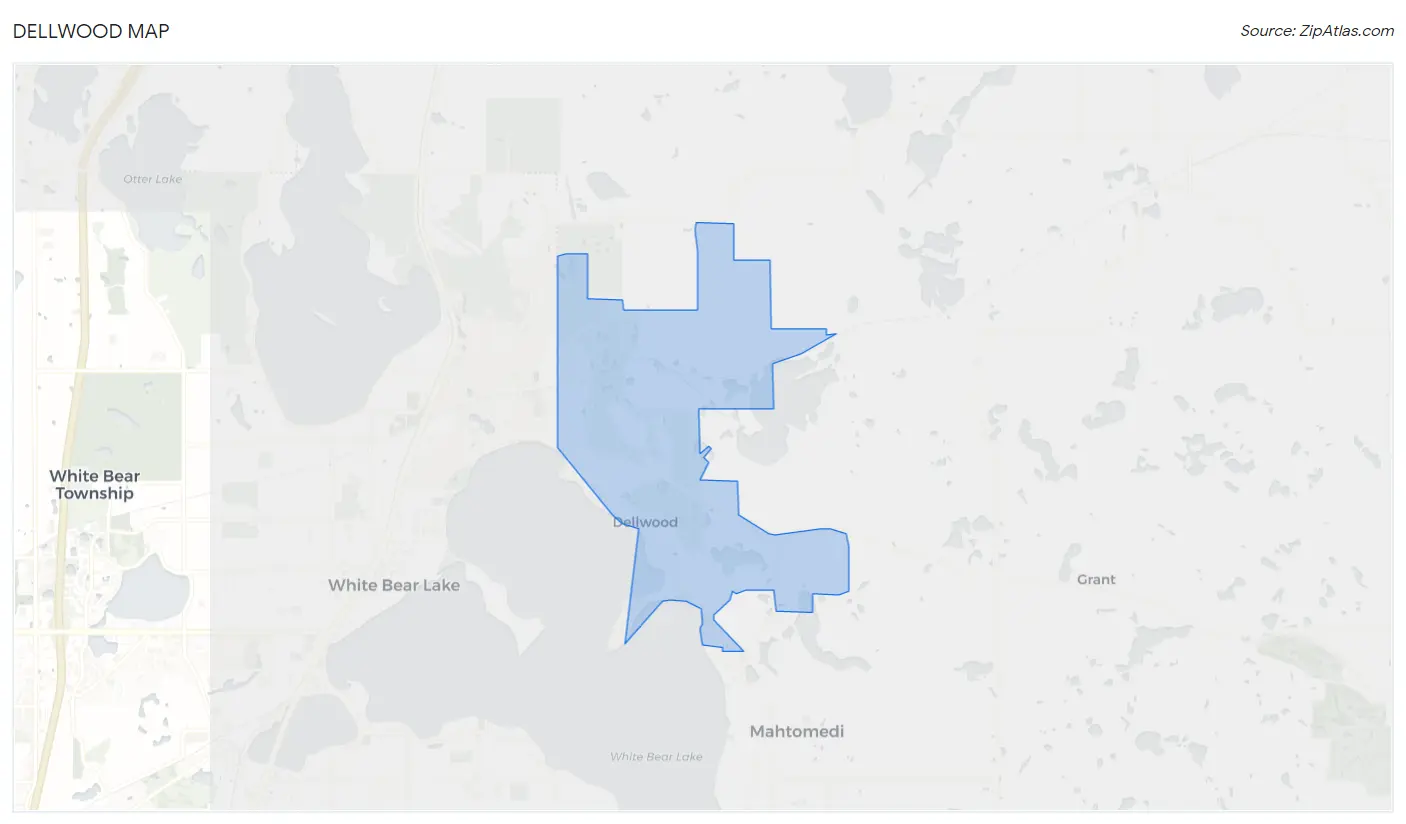
Dellwood Map
Dellwood Overview
$94,775
PER CAPITA INCOME
$233,375
AVG FAMILY INCOME
$216,000
AVG HOUSEHOLD INCOME
38.0%
WAGE / INCOME GAP [ % ]
62.0¢/ $1
WAGE / INCOME GAP [ $ ]
0.44
INEQUALITY / GINI INDEX
1,228
TOTAL POPULATION
614
MALE POPULATION
614
FEMALE POPULATION
100.00
MALES / 100 FEMALES
100.00
FEMALES / 100 MALES
44.1
MEDIAN AGE
3.3
AVG FAMILY SIZE
3.1
AVG HOUSEHOLD SIZE
597
LABOR FORCE [ PEOPLE ]
62.8%
PERCENT IN LABOR FORCE
2.5%
UNEMPLOYMENT RATE
Dellwood Area Codes
Income in Dellwood
Income Overview in Dellwood
Per Capita Income in Dellwood is $94,775, while median incomes of families and households are $233,375 and $216,000 respectively.
| Characteristic | Number | Measure |
| Per Capita Income | 1,228 | $94,775 |
| Median Family Income | 344 | $233,375 |
| Mean Family Income | 344 | $294,498 |
| Median Household Income | 400 | $216,000 |
| Mean Household Income | 400 | $275,770 |
| Income Deficit | 344 | $0 |
| Wage / Income Gap (%) | 1,228 | 38.04% |
| Wage / Income Gap ($) | 1,228 | 61.96¢ per $1 |
| Gini / Inequality Index | 1,228 | 0.44 |
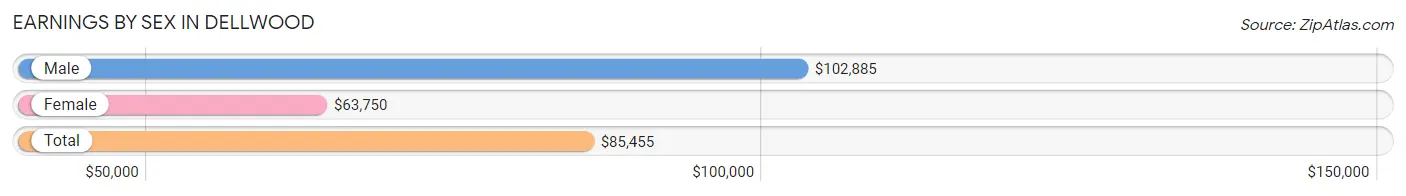
Earnings by Sex in Dellwood
Average Earnings in Dellwood are $85,455, $102,885 for men and $63,750 for women, a difference of 38.0%.
| Sex | Number | Average Earnings |
| Male | 380 (58.3%) | $102,885 |
| Female | 272 (41.7%) | $63,750 |
| Total | 652 (100.0%) | $85,455 |
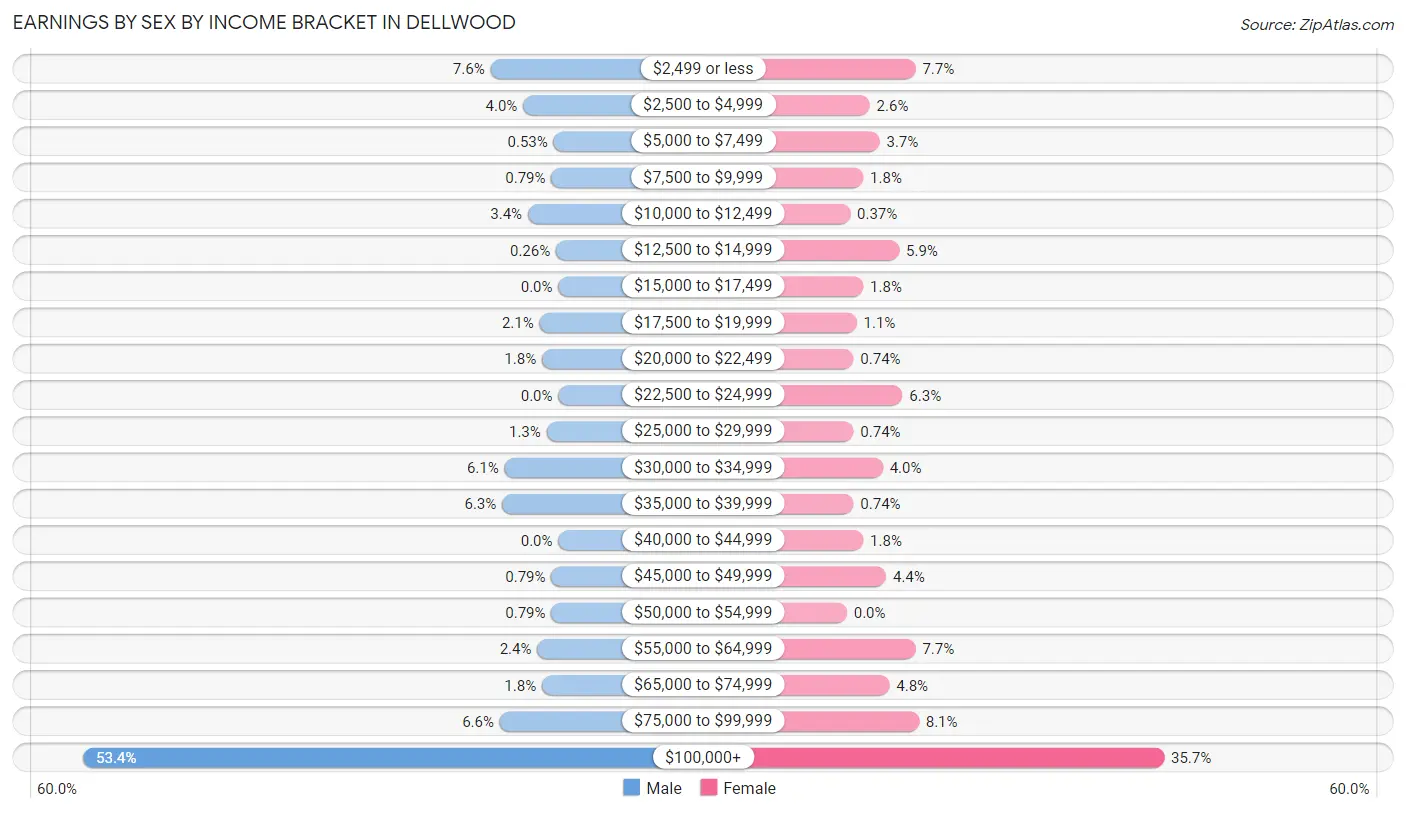
Earnings by Sex by Income Bracket in Dellwood
The most common earnings brackets in Dellwood are $100,000+ for men (203 | 53.4%) and $100,000+ for women (97 | 35.7%).
| Income | Male | Female |
| $2,499 or less | 29 (7.6%) | 21 (7.7%) |
| $2,500 to $4,999 | 15 (4.0%) | 7 (2.6%) |
| $5,000 to $7,499 | 2 (0.5%) | 10 (3.7%) |
| $7,500 to $9,999 | 3 (0.8%) | 5 (1.8%) |
| $10,000 to $12,499 | 13 (3.4%) | 1 (0.4%) |
| $12,500 to $14,999 | 1 (0.3%) | 16 (5.9%) |
| $15,000 to $17,499 | 0 (0.0%) | 5 (1.8%) |
| $17,500 to $19,999 | 8 (2.1%) | 3 (1.1%) |
| $20,000 to $22,499 | 7 (1.8%) | 2 (0.7%) |
| $22,500 to $24,999 | 0 (0.0%) | 17 (6.2%) |
| $25,000 to $29,999 | 5 (1.3%) | 2 (0.7%) |
| $30,000 to $34,999 | 23 (6.0%) | 11 (4.0%) |
| $35,000 to $39,999 | 24 (6.3%) | 2 (0.7%) |
| $40,000 to $44,999 | 0 (0.0%) | 5 (1.8%) |
| $45,000 to $49,999 | 3 (0.8%) | 12 (4.4%) |
| $50,000 to $54,999 | 3 (0.8%) | 0 (0.0%) |
| $55,000 to $64,999 | 9 (2.4%) | 21 (7.7%) |
| $65,000 to $74,999 | 7 (1.8%) | 13 (4.8%) |
| $75,000 to $99,999 | 25 (6.6%) | 22 (8.1%) |
| $100,000+ | 203 (53.4%) | 97 (35.7%) |
| Total | 380 (100.0%) | 272 (100.0%) |
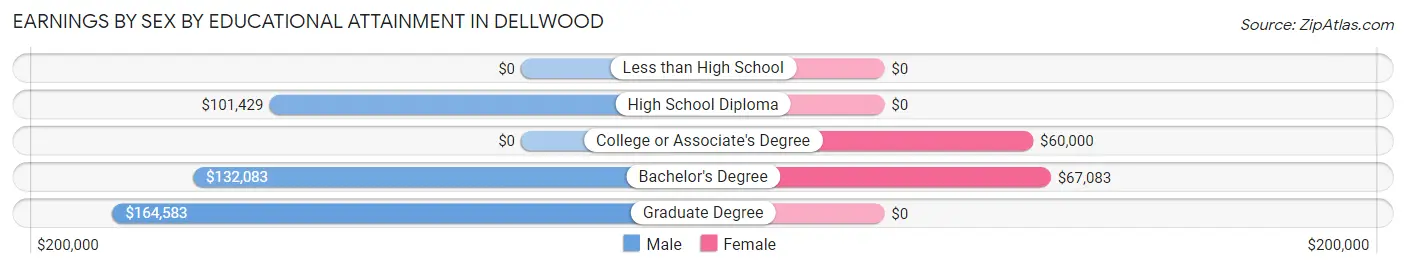
Earnings by Sex by Educational Attainment in Dellwood
Average earnings in Dellwood are $114,375 for men and $74,250 for women, a difference of 35.1%. Men with an educational attainment of graduate degree enjoy the highest average annual earnings of $164,583, while those with high school diploma education earn the least with $101,429. Women with an educational attainment of bachelor's degree earn the most with the average annual earnings of $67,083, while those with college or associate's degree education have the smallest earnings of $60,000.
| Educational Attainment | Male Income | Female Income |
| Less than High School | - | - |
| High School Diploma | $101,429 | $0 |
| College or Associate's Degree | - | - |
| Bachelor's Degree | $132,083 | $67,083 |
| Graduate Degree | $164,583 | $0 |
| Total | $114,375 | $74,250 |
Family Income in Dellwood
Family Income Brackets in Dellwood
According to the Dellwood family income data, there are 201 families falling into the $200,000+ income range, which is the most common income bracket and makes up 58.4% of all families.
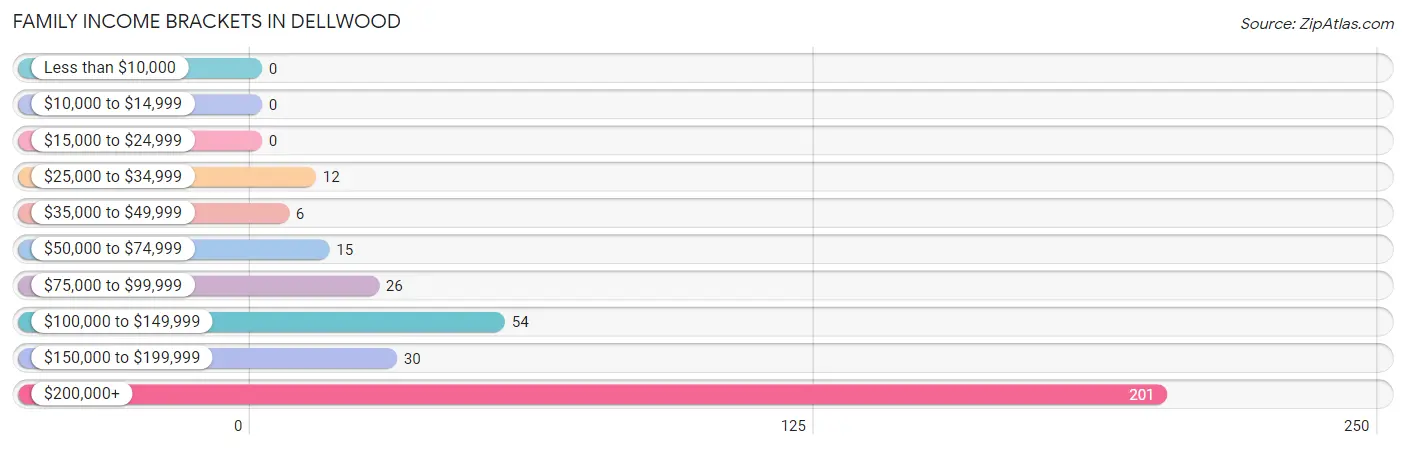
| Income Bracket | # Families | % Families |
| Less than $10,000 | 0 | 0.0% |
| $10,000 to $14,999 | 0 | 0.0% |
| $15,000 to $24,999 | 0 | 0.0% |
| $25,000 to $34,999 | 12 | 3.5% |
| $35,000 to $49,999 | 6 | 1.7% |
| $50,000 to $74,999 | 15 | 4.4% |
| $75,000 to $99,999 | 26 | 7.6% |
| $100,000 to $149,999 | 54 | 15.7% |
| $150,000 to $199,999 | 30 | 8.7% |
| $200,000+ | 201 | 58.4% |
Family Income by Famaliy Size in Dellwood
5-person families (42 | 12.2%) account for the highest median family income in Dellwood with $243,750 per family, while 2-person families (147 | 42.7%) have the highest median income of $91,875 per family member.
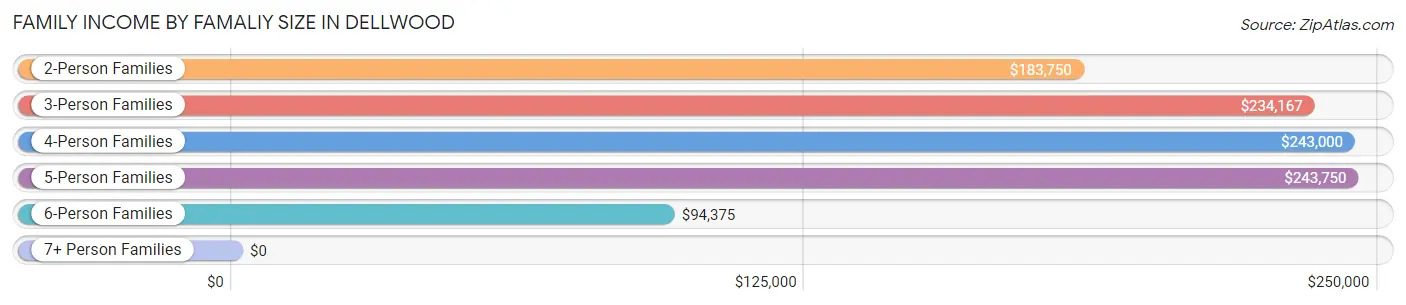
| Income Bracket | # Families | Median Income |
| 2-Person Families | 147 (42.7%) | $183,750 |
| 3-Person Families | 74 (21.5%) | $234,167 |
| 4-Person Families | 68 (19.8%) | $243,000 |
| 5-Person Families | 42 (12.2%) | $243,750 |
| 6-Person Families | 13 (3.8%) | $94,375 |
| 7+ Person Families | 0 (0.0%) | $0 |
| Total | 344 (100.0%) | $233,375 |
Family Income by Number of Earners in Dellwood
The median family income in Dellwood is $233,375, with families comprising 2 earners (176) having the highest median family income of $241,429, while families with no earners (41) have the lowest median family income of $76,641, accounting for 51.2% and 11.9% of families, respectively.
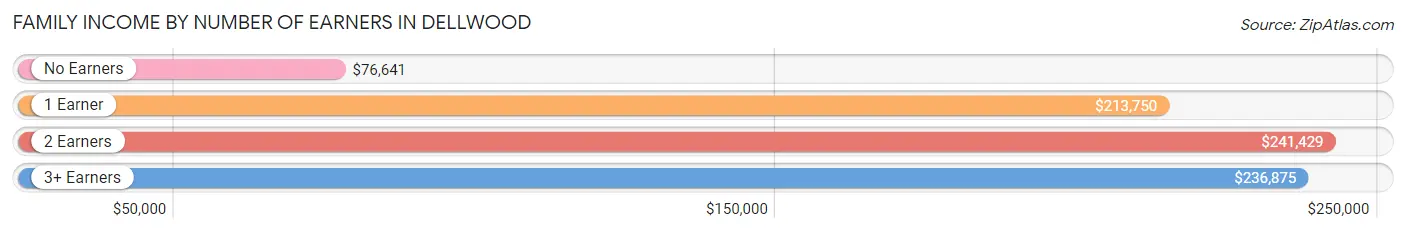
| Number of Earners | # Families | Median Income |
| No Earners | 41 (11.9%) | $76,641 |
| 1 Earner | 90 (26.2%) | $213,750 |
| 2 Earners | 176 (51.2%) | $241,429 |
| 3+ Earners | 37 (10.8%) | $236,875 |
| Total | 344 (100.0%) | $233,375 |
Household Income in Dellwood
Household Income Brackets in Dellwood
With 219 households falling in the category, the $200,000+ income range is the most frequent in Dellwood, accounting for 54.7% of all households.
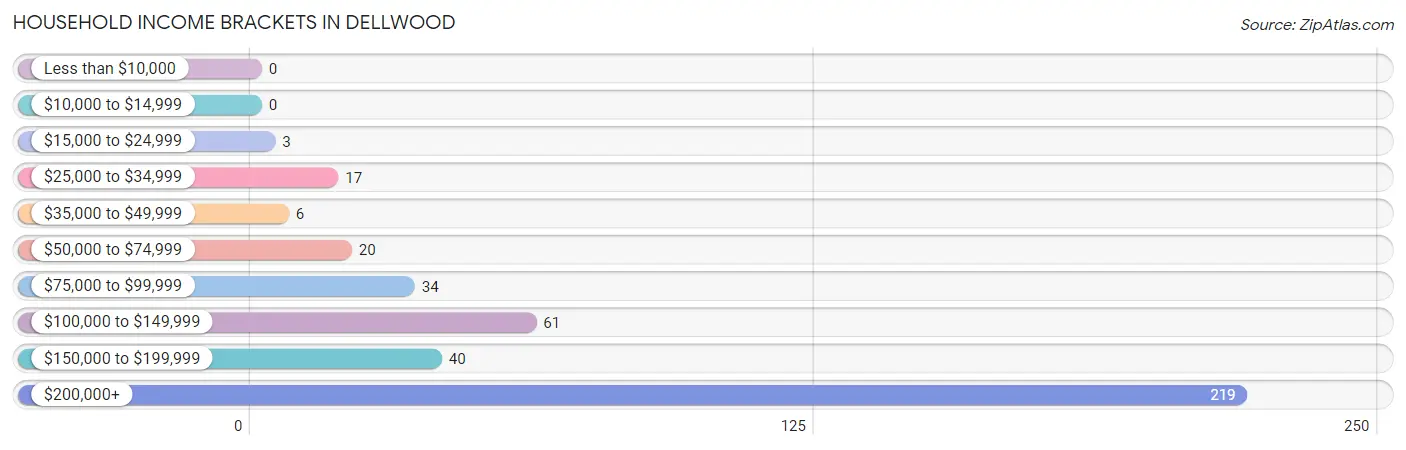
| Income Bracket | # Households | % Households |
| Less than $10,000 | 0 | 0.0% |
| $10,000 to $14,999 | 0 | 0.0% |
| $15,000 to $24,999 | 3 | 0.8% |
| $25,000 to $34,999 | 17 | 4.3% |
| $35,000 to $49,999 | 6 | 1.5% |
| $50,000 to $74,999 | 20 | 5.0% |
| $75,000 to $99,999 | 34 | 8.5% |
| $100,000 to $149,999 | 61 | 15.3% |
| $150,000 to $199,999 | 40 | 10.0% |
| $200,000+ | 219 | 54.8% |
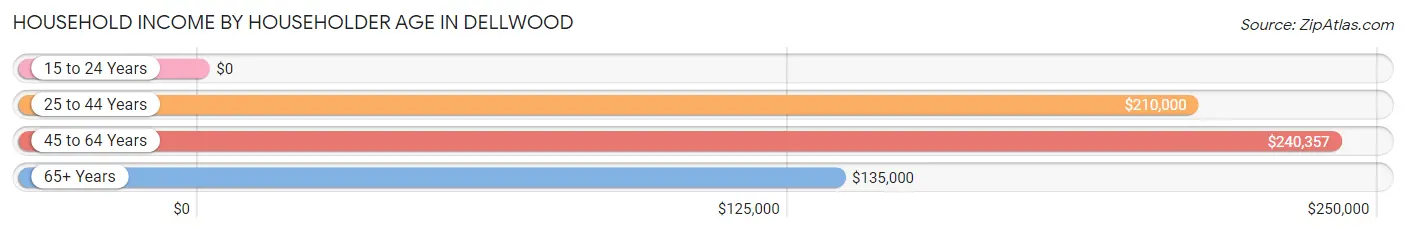
Household Income by Householder Age in Dellwood
The median household income in Dellwood is $216,000, with the highest median household income of $240,357 found in the 45 to 64 years age bracket for the primary householder. A total of 170 households (42.5%) fall into this category.
| Income Bracket | # Households | Median Income |
| 15 to 24 Years | 0 (0.0%) | $0 |
| 25 to 44 Years | 82 (20.5%) | $210,000 |
| 45 to 64 Years | 170 (42.5%) | $240,357 |
| 65+ Years | 148 (37.0%) | $135,000 |
| Total | 400 (100.0%) | $216,000 |
Poverty in Dellwood
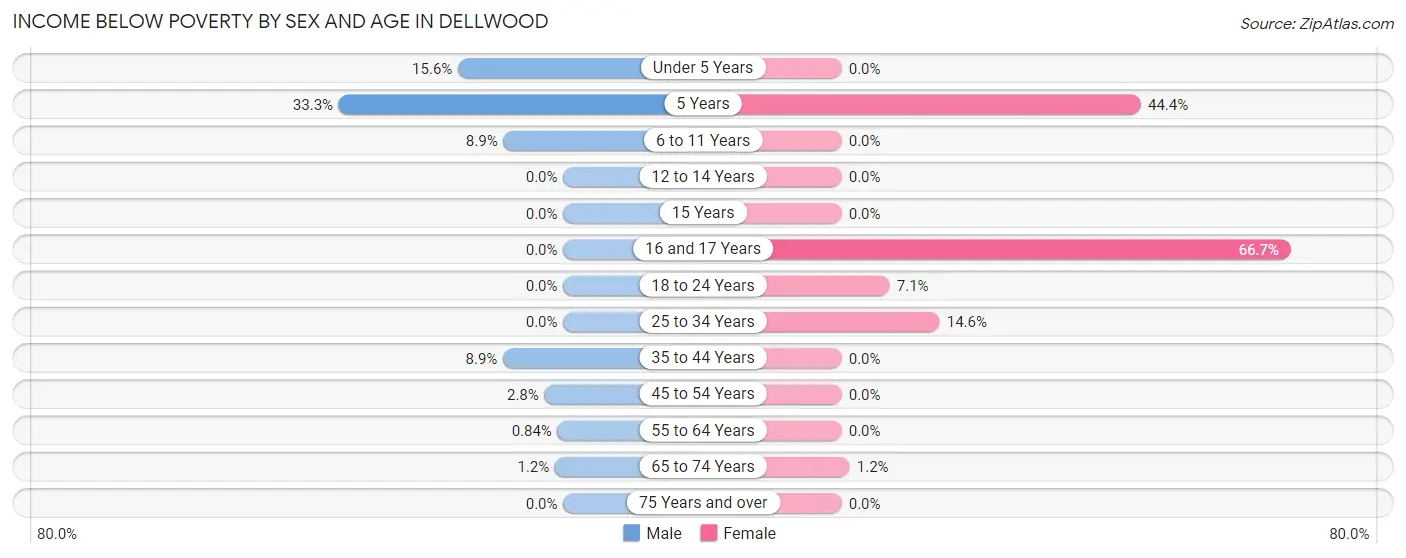
Income Below Poverty by Sex and Age in Dellwood
With 3.6% poverty level for males and 2.9% for females among the residents of Dellwood, 5 year old males and 16 and 17 year old females are the most vulnerable to poverty, with 4 males (33.3%) and 2 females (66.7%) in their respective age groups living below the poverty level.
| Age Bracket | Male | Female |
| Under 5 Years | 5 (15.6%) | 0 (0.0%) |
| 5 Years | 4 (33.3%) | 4 (44.4%) |
| 6 to 11 Years | 4 (8.9%) | 0 (0.0%) |
| 12 to 14 Years | 0 (0.0%) | 0 (0.0%) |
| 15 Years | 0 (0.0%) | 0 (0.0%) |
| 16 and 17 Years | 0 (0.0%) | 2 (66.7%) |
| 18 to 24 Years | 0 (0.0%) | 3 (7.1%) |
| 25 to 34 Years | 0 (0.0%) | 8 (14.5%) |
| 35 to 44 Years | 5 (8.9%) | 0 (0.0%) |
| 45 to 54 Years | 2 (2.8%) | 0 (0.0%) |
| 55 to 64 Years | 1 (0.8%) | 0 (0.0%) |
| 65 to 74 Years | 1 (1.2%) | 1 (1.2%) |
| 75 Years and over | 0 (0.0%) | 0 (0.0%) |
| Total | 22 (3.6%) | 18 (2.9%) |
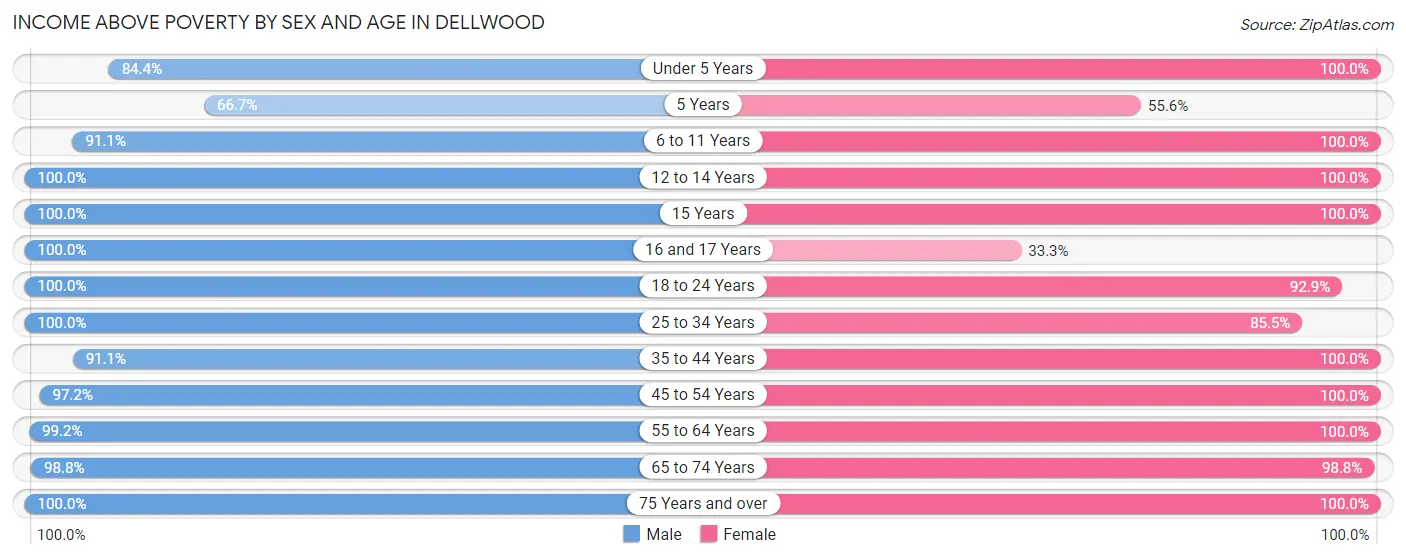
Income Above Poverty by Sex and Age in Dellwood
According to the poverty statistics in Dellwood, males aged 12 to 14 years and females aged under 5 years are the age groups that are most secure financially, with 100.0% of males and 100.0% of females in these age groups living above the poverty line.
| Age Bracket | Male | Female |
| Under 5 Years | 27 (84.4%) | 67 (100.0%) |
| 5 Years | 8 (66.7%) | 5 (55.6%) |
| 6 to 11 Years | 41 (91.1%) | 38 (100.0%) |
| 12 to 14 Years | 25 (100.0%) | 29 (100.0%) |
| 15 Years | 5 (100.0%) | 13 (100.0%) |
| 16 and 17 Years | 24 (100.0%) | 1 (33.3%) |
| 18 to 24 Years | 47 (100.0%) | 39 (92.9%) |
| 25 to 34 Years | 50 (100.0%) | 47 (85.5%) |
| 35 to 44 Years | 51 (91.1%) | 80 (100.0%) |
| 45 to 54 Years | 70 (97.2%) | 76 (100.0%) |
| 55 to 64 Years | 118 (99.2%) | 75 (100.0%) |
| 65 to 74 Years | 81 (98.8%) | 82 (98.8%) |
| 75 Years and over | 45 (100.0%) | 42 (100.0%) |
| Total | 592 (96.4%) | 594 (97.1%) |
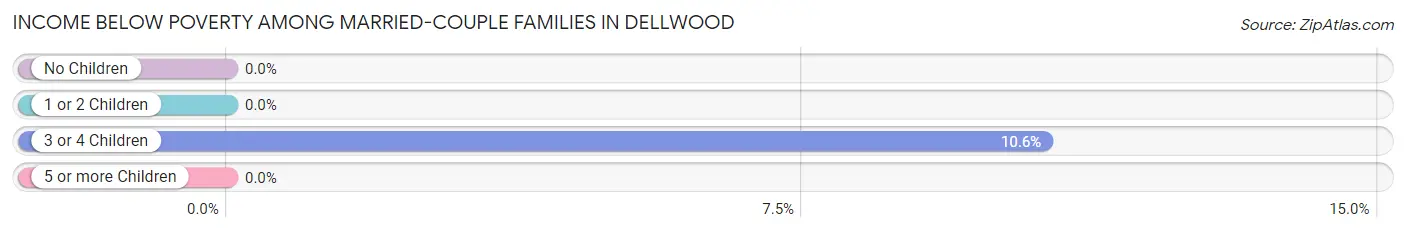
Income Below Poverty Among Married-Couple Families in Dellwood
The poverty statistics for married-couple families in Dellwood show that 1.6% or 5 of the total 319 families live below the poverty line. Families with 3 or 4 children have the highest poverty rate of 10.6%, comprising of 5 families. On the other hand, families with no children have the lowest poverty rate of 0.0%, which includes 0 families.
| Children | Above Poverty | Below Poverty |
| No Children | 185 (100.0%) | 0 (0.0%) |
| 1 or 2 Children | 87 (100.0%) | 0 (0.0%) |
| 3 or 4 Children | 42 (89.4%) | 5 (10.6%) |
| 5 or more Children | 0 (0.0%) | 0 (0.0%) |
| Total | 314 (98.4%) | 5 (1.6%) |
Income Below Poverty Among Single-Parent Households in Dellwood
| Children | Single Father | Single Mother |
| No Children | 0 (0.0%) | 0 (0.0%) |
| 1 or 2 Children | 0 (0.0%) | 0 (0.0%) |
| 3 or 4 Children | 0 (0.0%) | 0 (0.0%) |
| 5 or more Children | 0 (0.0%) | 0 (0.0%) |
| Total | 0 (0.0%) | 0 (0.0%) |
Income Below Poverty Among Married-Couple vs Single-Parent Households in Dellwood
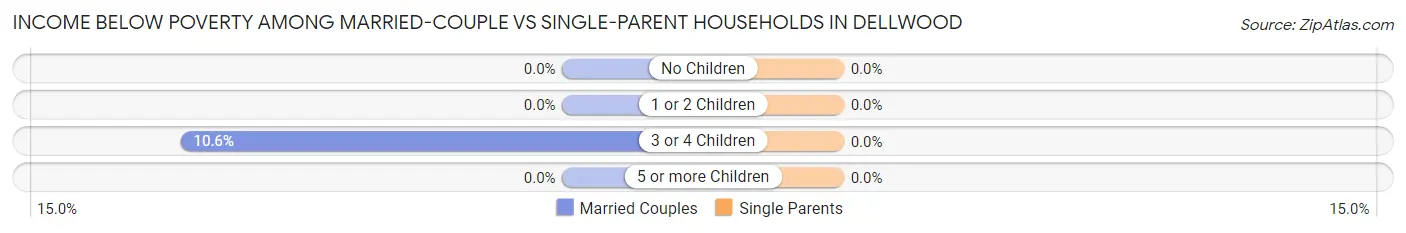
| Children | Married-Couple Families | Single-Parent Households |
| No Children | 0 (0.0%) | 0 (0.0%) |
| 1 or 2 Children | 0 (0.0%) | 0 (0.0%) |
| 3 or 4 Children | 5 (10.6%) | 0 (0.0%) |
| 5 or more Children | 0 (0.0%) | 0 (0.0%) |
| Total | 5 (1.6%) | 0 (0.0%) |
Race in Dellwood
The most populous races in Dellwood are White / Caucasian (1,157 | 94.2%), Two or more Races (32 | 2.6%), and Black / African American (25 | 2.0%).
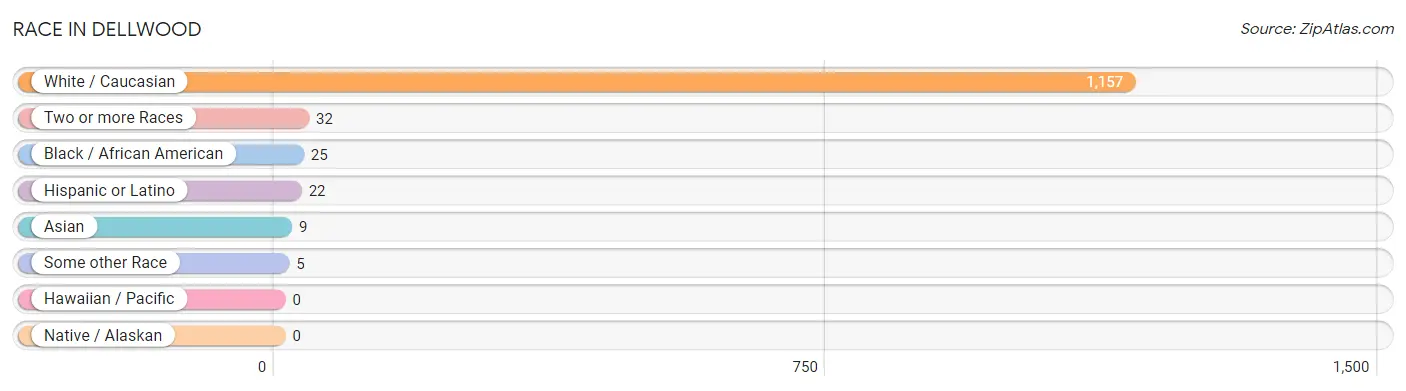
| Race | # Population | % Population |
| Asian | 9 | 0.7% |
| Black / African American | 25 | 2.0% |
| Hawaiian / Pacific | 0 | 0.0% |
| Hispanic or Latino | 22 | 1.8% |
| Native / Alaskan | 0 | 0.0% |
| White / Caucasian | 1,157 | 94.2% |
| Two or more Races | 32 | 2.6% |
| Some other Race | 5 | 0.4% |
| Total | 1,228 | 100.0% |
Ancestry in Dellwood
The most populous ancestries reported in Dellwood are German (307 | 25.0%), Irish (177 | 14.4%), English (170 | 13.8%), Norwegian (112 | 9.1%), and Swedish (107 | 8.7%), together accounting for 71.1% of all Dellwood residents.
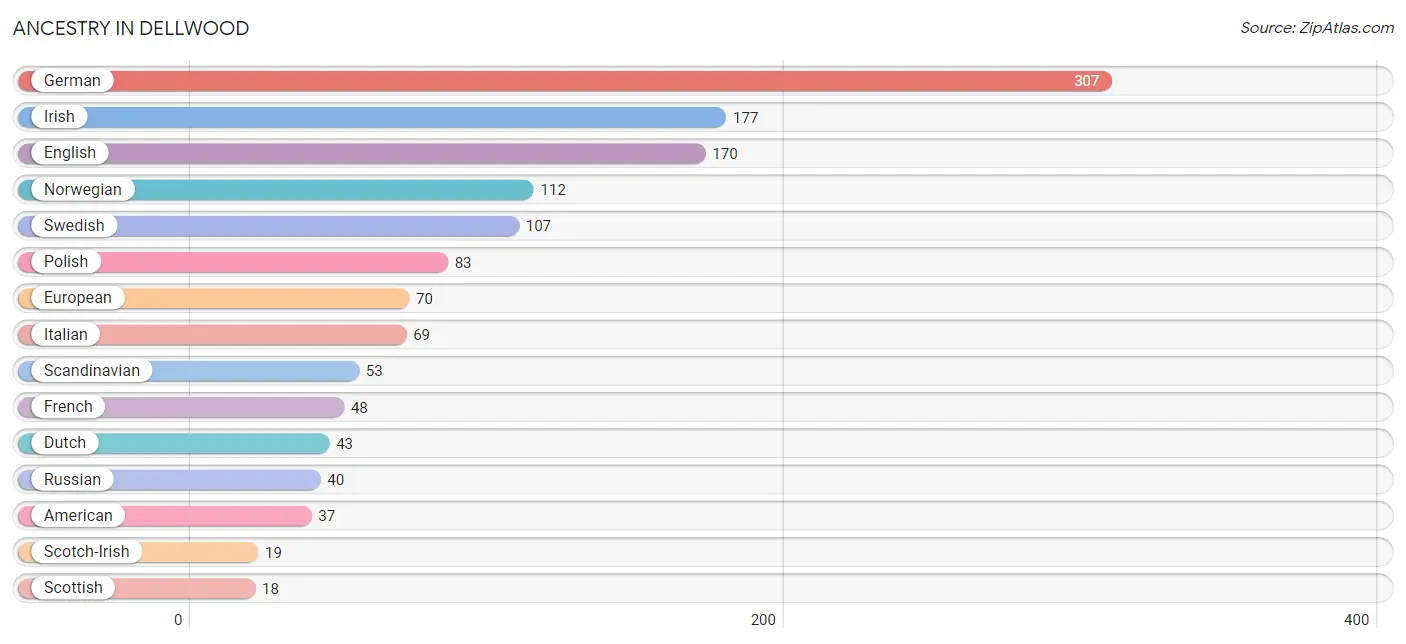
| Ancestry | # Population | % Population |
| American | 37 | 3.0% |
| Arab | 2 | 0.2% |
| Austrian | 6 | 0.5% |
| Belgian | 4 | 0.3% |
| British | 7 | 0.6% |
| Central American | 5 | 0.4% |
| Croatian | 3 | 0.2% |
| Cuban | 10 | 0.8% |
| Czech | 13 | 1.1% |
| Danish | 11 | 0.9% |
| Dutch | 43 | 3.5% |
| Eastern European | 6 | 0.5% |
| English | 170 | 13.8% |
| European | 70 | 5.7% |
| Finnish | 11 | 0.9% |
| French | 48 | 3.9% |
| German | 307 | 25.0% |
| Greek | 3 | 0.2% |
| Guatemalan | 5 | 0.4% |
| Indian (Asian) | 8 | 0.6% |
| Irish | 177 | 14.4% |
| Italian | 69 | 5.6% |
| Kenyan | 1 | 0.1% |
| Korean | 13 | 1.1% |
| Lebanese | 2 | 0.2% |
| Northern European | 7 | 0.6% |
| Norwegian | 112 | 9.1% |
| Polish | 83 | 6.8% |
| Puerto Rican | 7 | 0.6% |
| Romanian | 14 | 1.1% |
| Russian | 40 | 3.3% |
| Scandinavian | 53 | 4.3% |
| Scotch-Irish | 19 | 1.5% |
| Scottish | 18 | 1.5% |
| Slovene | 3 | 0.2% |
| Subsaharan African | 3 | 0.2% |
| Swedish | 107 | 8.7% |
| Swiss | 6 | 0.5% |
| Welsh | 2 | 0.2% | View All 39 Rows |
Immigrants in Dellwood
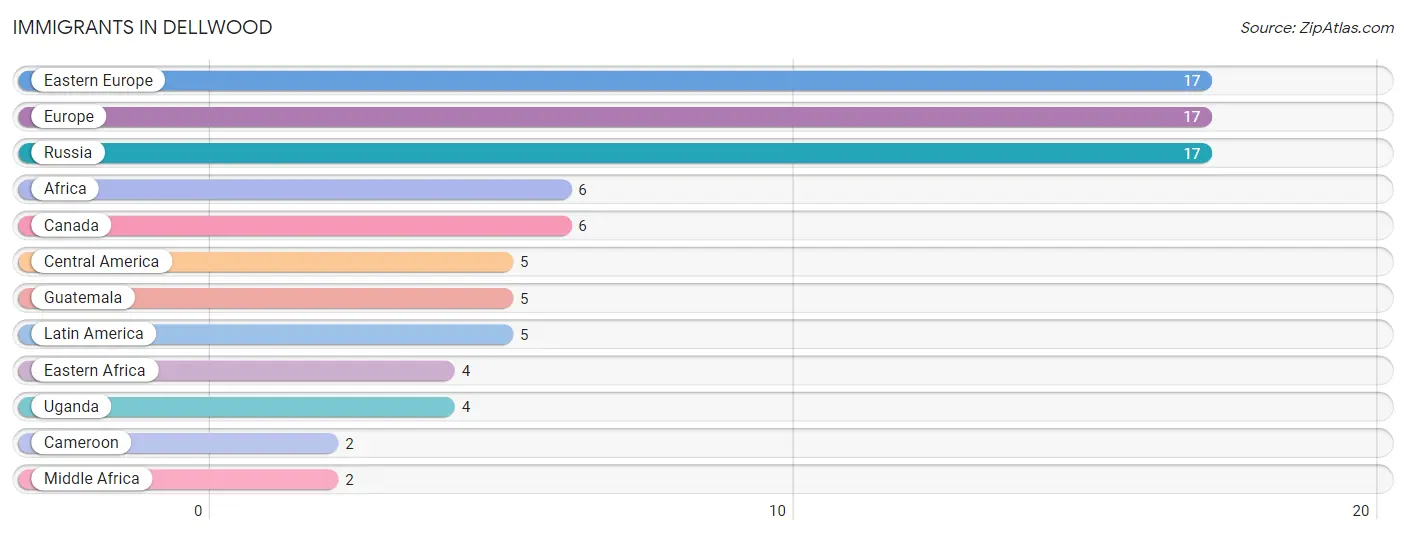
The most numerous immigrant groups reported in Dellwood came from Eastern Europe (17 | 1.4%), Europe (17 | 1.4%), Russia (17 | 1.4%), Africa (6 | 0.5%), and Canada (6 | 0.5%), together accounting for 5.1% of all Dellwood residents.
| Immigration Origin | # Population | % Population |
| Africa | 6 | 0.5% |
| Cameroon | 2 | 0.2% |
| Canada | 6 | 0.5% |
| Central America | 5 | 0.4% |
| Eastern Africa | 4 | 0.3% |
| Eastern Europe | 17 | 1.4% |
| Europe | 17 | 1.4% |
| Guatemala | 5 | 0.4% |
| Latin America | 5 | 0.4% |
| Middle Africa | 2 | 0.2% |
| Russia | 17 | 1.4% |
| Uganda | 4 | 0.3% | View All 12 Rows |
Sex and Age in Dellwood
Sex and Age in Dellwood
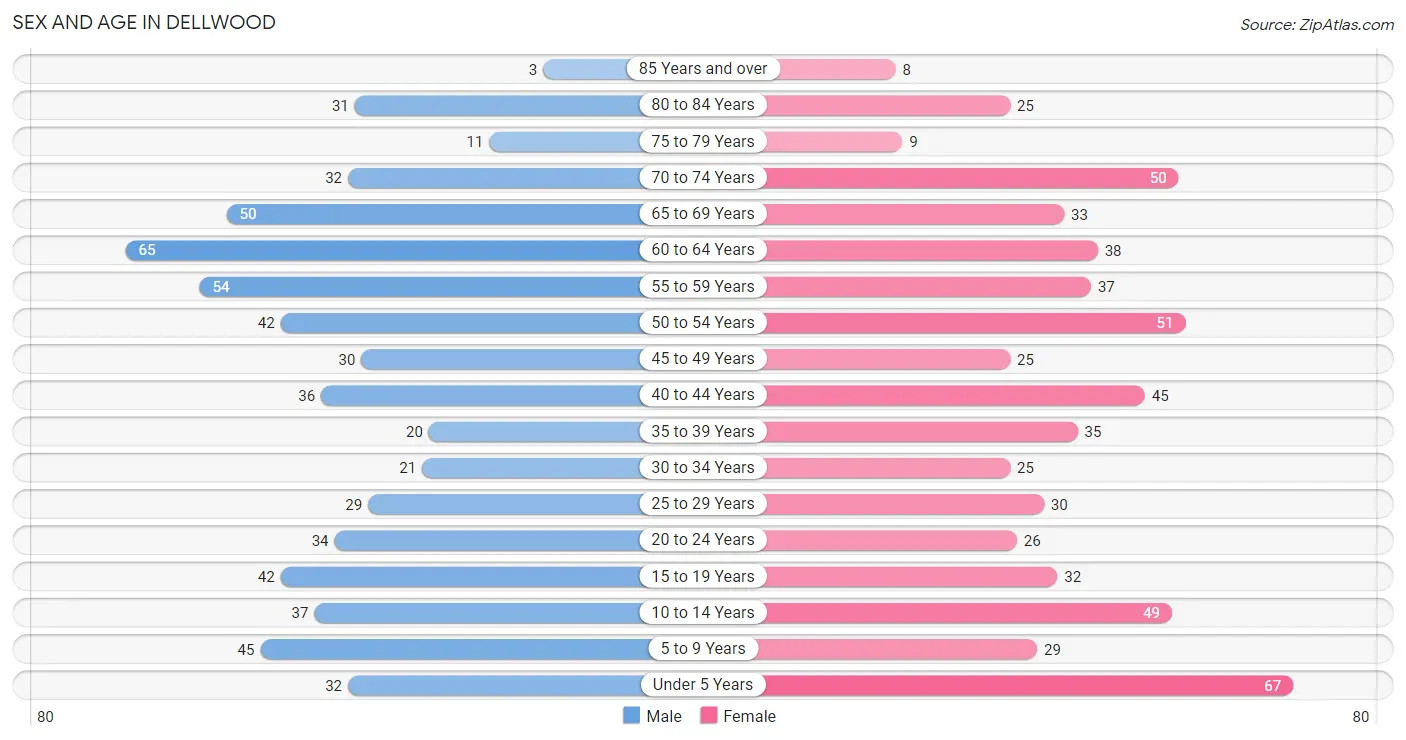
The most populous age groups in Dellwood are 60 to 64 Years (65 | 10.6%) for men and Under 5 Years (67 | 10.9%) for women.
| Age Bracket | Male | Female |
| Under 5 Years | 32 (5.2%) | 67 (10.9%) |
| 5 to 9 Years | 45 (7.3%) | 29 (4.7%) |
| 10 to 14 Years | 37 (6.0%) | 49 (8.0%) |
| 15 to 19 Years | 42 (6.8%) | 32 (5.2%) |
| 20 to 24 Years | 34 (5.5%) | 26 (4.2%) |
| 25 to 29 Years | 29 (4.7%) | 30 (4.9%) |
| 30 to 34 Years | 21 (3.4%) | 25 (4.1%) |
| 35 to 39 Years | 20 (3.3%) | 35 (5.7%) |
| 40 to 44 Years | 36 (5.9%) | 45 (7.3%) |
| 45 to 49 Years | 30 (4.9%) | 25 (4.1%) |
| 50 to 54 Years | 42 (6.8%) | 51 (8.3%) |
| 55 to 59 Years | 54 (8.8%) | 37 (6.0%) |
| 60 to 64 Years | 65 (10.6%) | 38 (6.2%) |
| 65 to 69 Years | 50 (8.1%) | 33 (5.4%) |
| 70 to 74 Years | 32 (5.2%) | 50 (8.1%) |
| 75 to 79 Years | 11 (1.8%) | 9 (1.5%) |
| 80 to 84 Years | 31 (5.1%) | 25 (4.1%) |
| 85 Years and over | 3 (0.5%) | 8 (1.3%) |
| Total | 614 (100.0%) | 614 (100.0%) |
Families and Households in Dellwood
Median Family Size in Dellwood
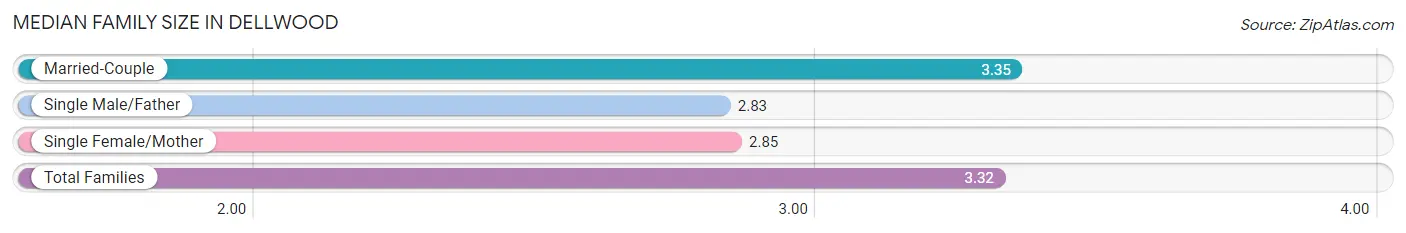
The median family size in Dellwood is 3.32 persons per family, with married-couple families (319 | 92.7%) accounting for the largest median family size of 3.35 persons per family. On the other hand, single male/father families (12 | 3.5%) represent the smallest median family size with 2.83 persons per family.
| Family Type | # Families | Family Size |
| Married-Couple | 319 (92.7%) | 3.35 |
| Single Male/Father | 12 (3.5%) | 2.83 |
| Single Female/Mother | 13 (3.8%) | 2.85 |
| Total Families | 344 (100.0%) | 3.32 |
Median Household Size in Dellwood
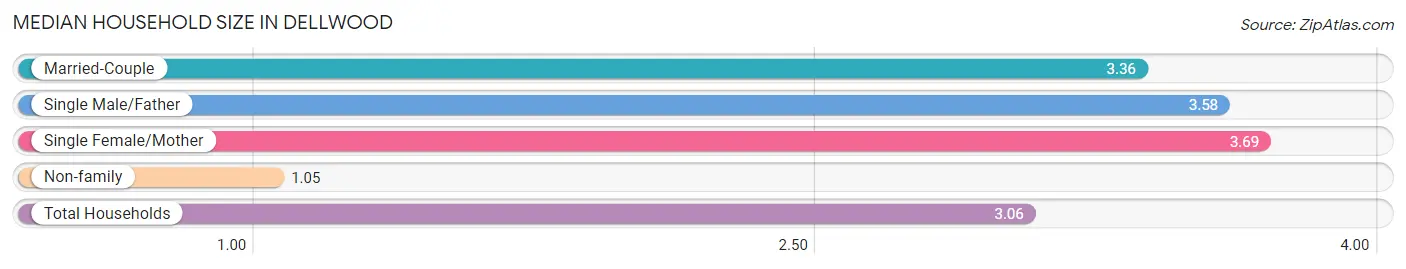
The median household size in Dellwood is 3.06 persons per household, with single female/mother households (13 | 3.3%) accounting for the largest median household size of 3.69 persons per household. non-family households (56 | 14.0%) represent the smallest median household size with 1.05 persons per household.
| Household Type | # Households | Household Size |
| Married-Couple | 319 (79.7%) | 3.36 |
| Single Male/Father | 12 (3.0%) | 3.58 |
| Single Female/Mother | 13 (3.3%) | 3.69 |
| Non-family | 56 (14.0%) | 1.05 |
| Total Households | 400 (100.0%) | 3.06 |
Household Size by Marriage Status in Dellwood
Out of a total of 400 households in Dellwood, 344 (86.0%) are family households, while 56 (14.0%) are nonfamily households. The most numerous type of family households are 2-person households, comprising 140, and the most common type of nonfamily households are 1-person households, comprising 53.
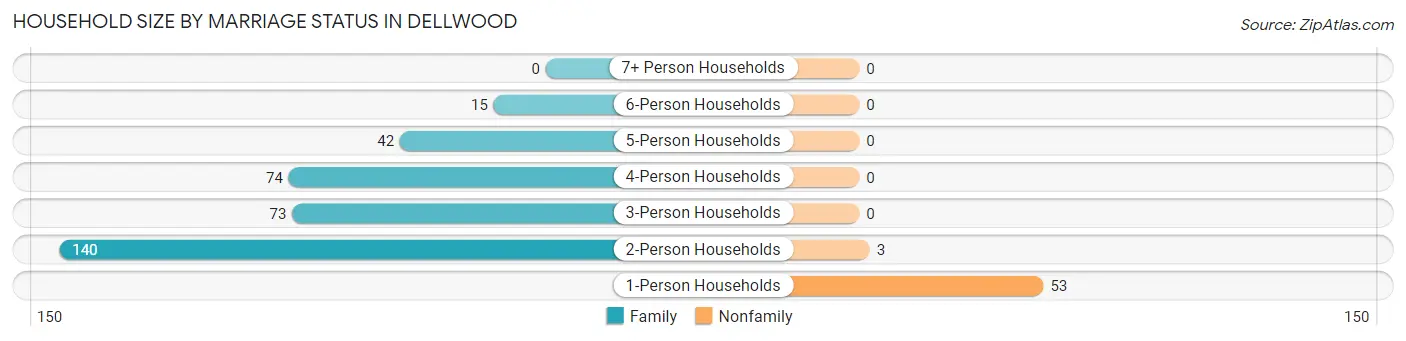
| Household Size | Family Households | Nonfamily Households |
| 1-Person Households | - | 53 (13.3%) |
| 2-Person Households | 140 (35.0%) | 3 (0.7%) |
| 3-Person Households | 73 (18.2%) | 0 (0.0%) |
| 4-Person Households | 74 (18.5%) | 0 (0.0%) |
| 5-Person Households | 42 (10.5%) | 0 (0.0%) |
| 6-Person Households | 15 (3.7%) | 0 (0.0%) |
| 7+ Person Households | 0 (0.0%) | 0 (0.0%) |
| Total | 344 (86.0%) | 56 (14.0%) |
Female Fertility in Dellwood
Fertility by Age in Dellwood
Average fertility rate in Dellwood is 76.0 births per 1,000 women. Women in the age bracket of 20 to 34 years have the highest fertility rate with 160.0 births per 1,000 women. Women in the age bracket of 20 to 34 years acount for 76.5% of all women with births.
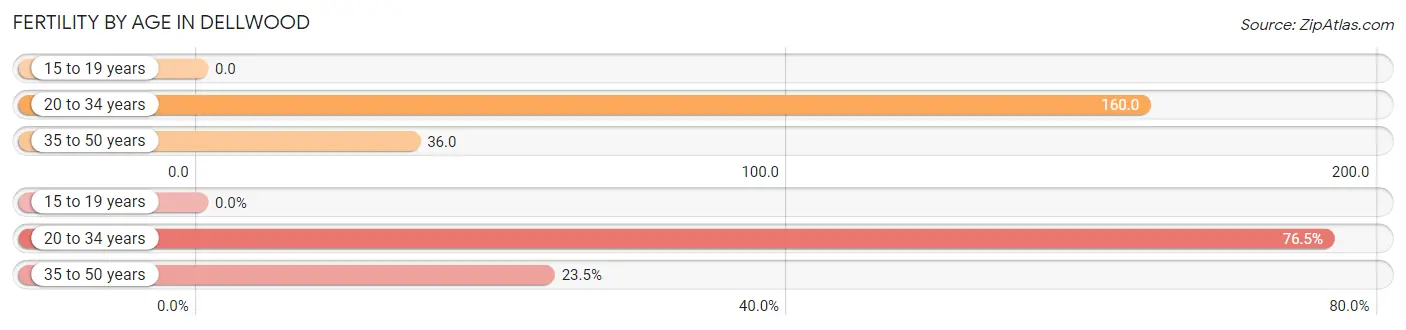
| Age Bracket | Women with Births | Births / 1,000 Women |
| 15 to 19 years | 0 (0.0%) | 0.0 |
| 20 to 34 years | 13 (76.5%) | 160.0 |
| 35 to 50 years | 4 (23.5%) | 36.0 |
| Total | 17 (100.0%) | 76.0 |
Fertility by Age by Marriage Status in Dellwood
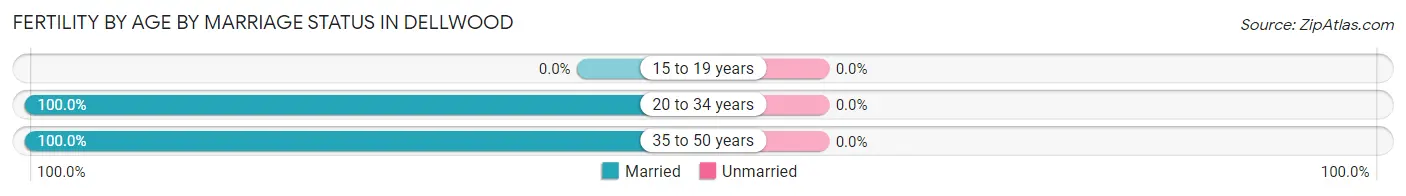
| Age Bracket | Married | Unmarried |
| 15 to 19 years | 0 (0.0%) | 0 (0.0%) |
| 20 to 34 years | 13 (100.0%) | 0 (0.0%) |
| 35 to 50 years | 4 (100.0%) | 0 (0.0%) |
| Total | 17 (100.0%) | 0 (0.0%) |
Fertility by Education in Dellwood
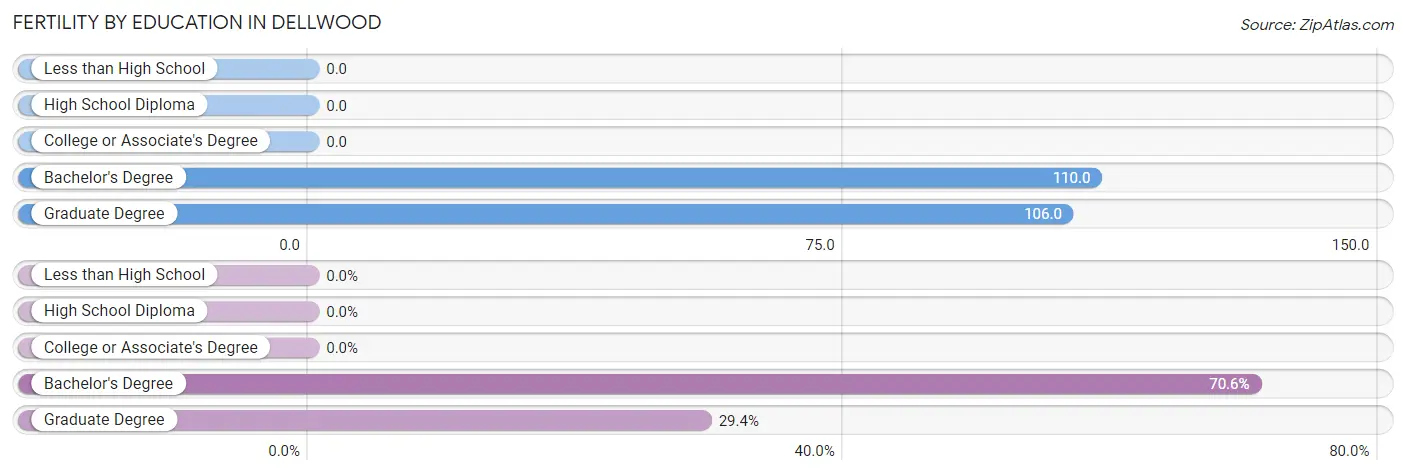
| Educational Attainment | Women with Births | Births / 1,000 Women |
| Less than High School | 0 (0.0%) | 0.0 |
| High School Diploma | 0 (0.0%) | 0.0 |
| College or Associate's Degree | 0 (0.0%) | 0.0 |
| Bachelor's Degree | 12 (70.6%) | 110.0 |
| Graduate Degree | 5 (29.4%) | 106.0 |
| Total | 17 (100.0%) | 76.0 |
Fertility by Education by Marriage Status in Dellwood
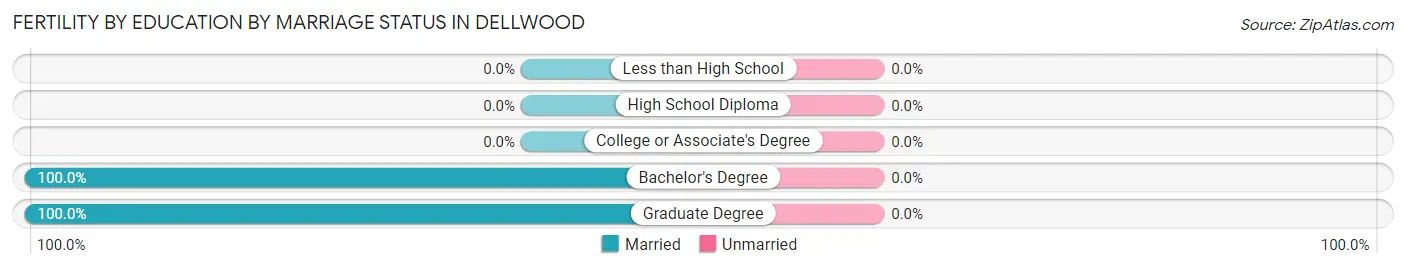
| Educational Attainment | Married | Unmarried |
| Less than High School | 0 (0.0%) | 0 (0.0%) |
| High School Diploma | 0 (0.0%) | 0 (0.0%) |
| College or Associate's Degree | 0 (0.0%) | 0 (0.0%) |
| Bachelor's Degree | 12 (100.0%) | 0 (0.0%) |
| Graduate Degree | 5 (100.0%) | 0 (0.0%) |
| Total | 17 (100.0%) | 0 (0.0%) |
Employment Characteristics in Dellwood
Employment by Class of Employer in Dellwood
Among the 581 employed individuals in Dellwood, private company employees (372 | 64.0%), self-employed (incorporated) (89 | 15.3%), and self-employed (not incorporated) (46 | 7.9%) make up the most common classes of employment.
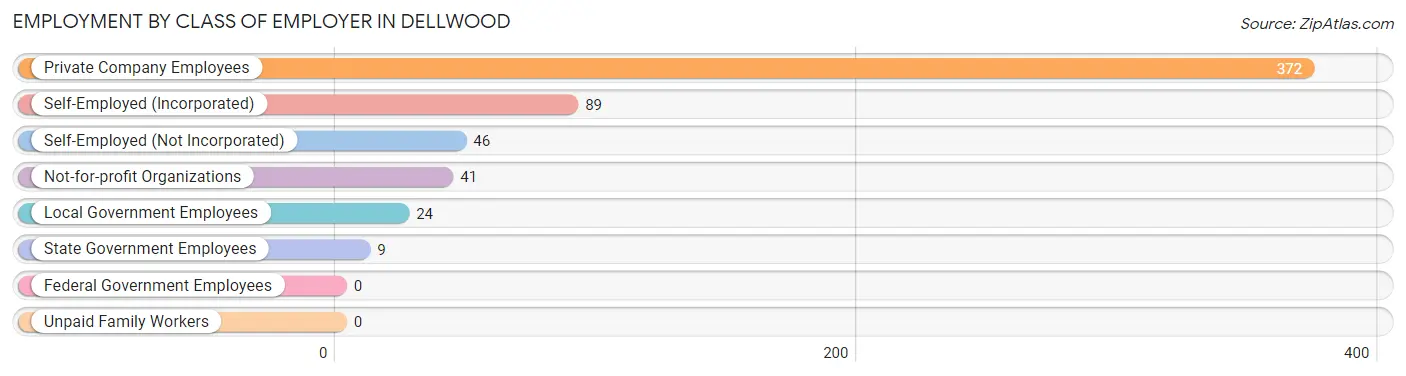
| Employer Class | # Employees | % Employees |
| Private Company Employees | 372 | 64.0% |
| Self-Employed (Incorporated) | 89 | 15.3% |
| Self-Employed (Not Incorporated) | 46 | 7.9% |
| Not-for-profit Organizations | 41 | 7.1% |
| Local Government Employees | 24 | 4.1% |
| State Government Employees | 9 | 1.5% |
| Federal Government Employees | 0 | 0.0% |
| Unpaid Family Workers | 0 | 0.0% |
| Total | 581 | 100.0% |
Employment Status by Age in Dellwood
According to the labor force statistics for Dellwood, out of the total population over 16 years of age (951), 62.8% or 597 individuals are in the labor force, with 2.5% or 15 of them unemployed. The age group with the highest labor force participation rate is 35 to 44 years, with 84.6% or 115 individuals in the labor force. Within the labor force, the 30 to 34 years age range has the highest percentage of unemployed individuals, with 17.1% or 6 of them being unemployed.
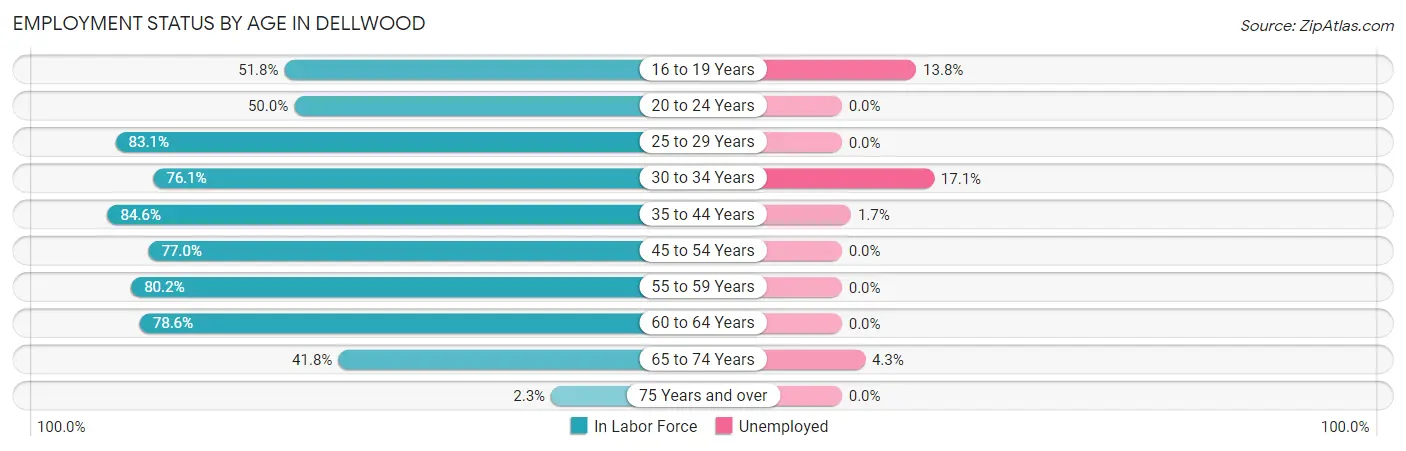
| Age Bracket | In Labor Force | Unemployed |
| 16 to 19 Years | 29 (51.8%) | 4 (13.8%) |
| 20 to 24 Years | 30 (50.0%) | 0 (0.0%) |
| 25 to 29 Years | 49 (83.1%) | 0 (0.0%) |
| 30 to 34 Years | 35 (76.1%) | 6 (17.1%) |
| 35 to 44 Years | 115 (84.6%) | 2 (1.7%) |
| 45 to 54 Years | 114 (77.0%) | 0 (0.0%) |
| 55 to 59 Years | 73 (80.2%) | 0 (0.0%) |
| 60 to 64 Years | 81 (78.6%) | 0 (0.0%) |
| 65 to 74 Years | 69 (41.8%) | 3 (4.3%) |
| 75 Years and over | 2 (2.3%) | 0 (0.0%) |
| Total | 597 (62.8%) | 15 (2.5%) |
Employment Status by Educational Attainment in Dellwood
According to labor force statistics for Dellwood, 80.1% of individuals (467) out of the total population between 25 and 64 years of age (583) are in the labor force, with 1.7% or 8 of them being unemployed. The group with the highest labor force participation rate are those with the educational attainment of bachelor's degree or higher, with 83.2% or 347 individuals in the labor force. Within the labor force, individuals with college / associate degree education have the highest percentage of unemployment, with 2.6% or 2 of them being unemployed.
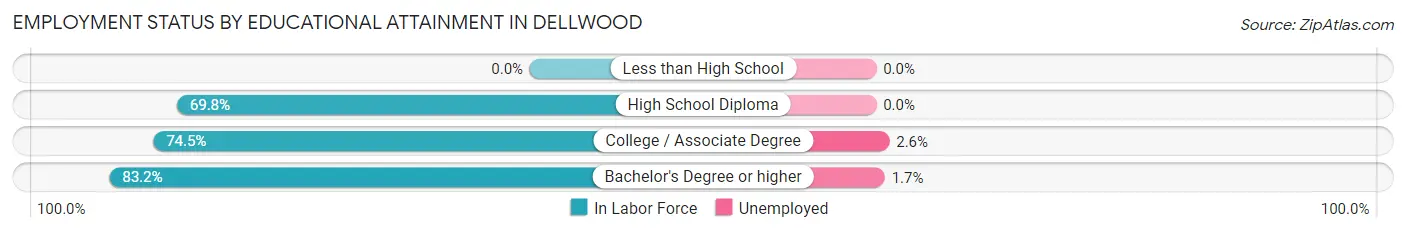
| Educational Attainment | In Labor Force | Unemployed |
| Less than High School | 0 (0.0%) | 0 (0.0%) |
| High School Diploma | 44 (69.8%) | 0 (0.0%) |
| College / Associate Degree | 76 (74.5%) | 3 (2.6%) |
| Bachelor's Degree or higher | 347 (83.2%) | 7 (1.7%) |
| Total | 467 (80.1%) | 10 (1.7%) |
Employment Occupations by Sex in Dellwood
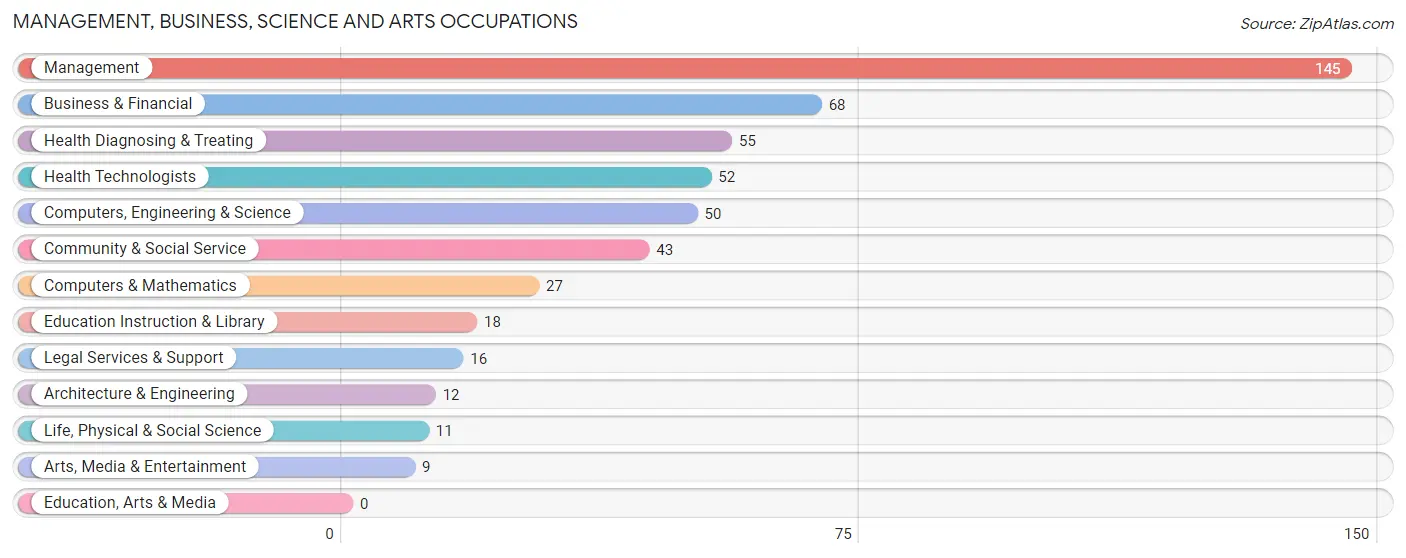
Management, Business, Science and Arts Occupations
The most common Management, Business, Science and Arts occupations in Dellwood are Management (145 | 24.9%), Business & Financial (68 | 11.7%), Health Diagnosing & Treating (55 | 9.5%), Health Technologists (52 | 8.9%), and Computers, Engineering & Science (50 | 8.6%).
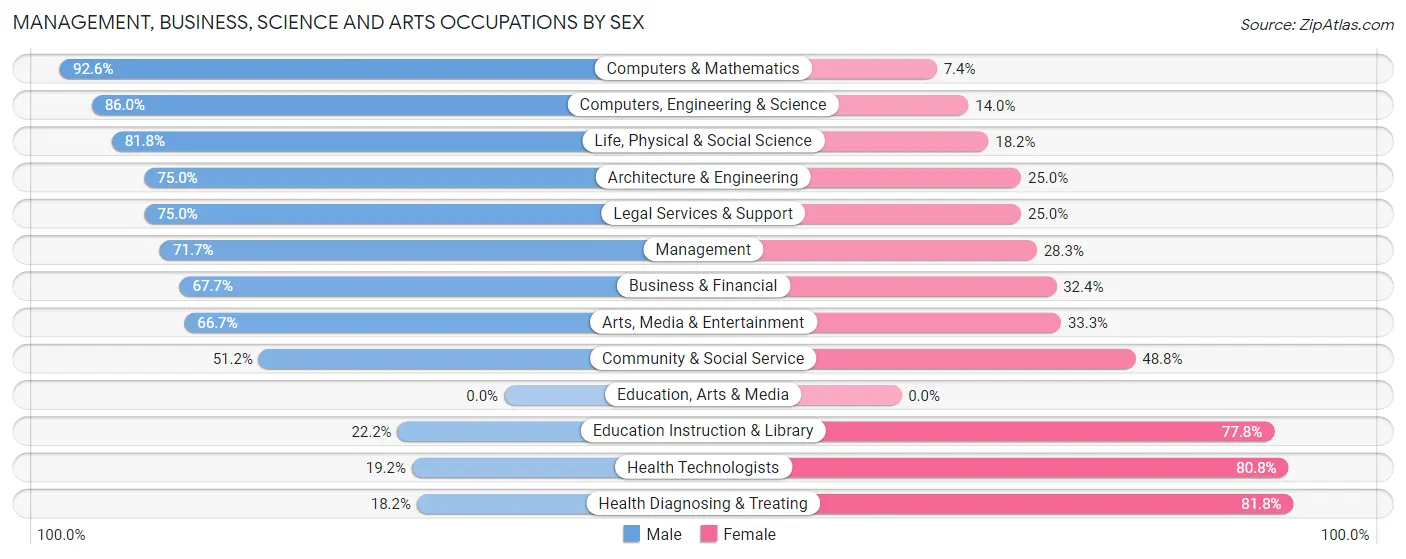
Management, Business, Science and Arts Occupations by Sex
Within the Management, Business, Science and Arts occupations in Dellwood, the most male-oriented occupations are Computers & Mathematics (92.6%), Computers, Engineering & Science (86.0%), and Life, Physical & Social Science (81.8%), while the most female-oriented occupations are Health Diagnosing & Treating (81.8%), Health Technologists (80.8%), and Education Instruction & Library (77.8%).
| Occupation | Male | Female |
| Management | 104 (71.7%) | 41 (28.3%) |
| Business & Financial | 46 (67.6%) | 22 (32.4%) |
| Computers, Engineering & Science | 43 (86.0%) | 7 (14.0%) |
| Computers & Mathematics | 25 (92.6%) | 2 (7.4%) |
| Architecture & Engineering | 9 (75.0%) | 3 (25.0%) |
| Life, Physical & Social Science | 9 (81.8%) | 2 (18.2%) |
| Community & Social Service | 22 (51.2%) | 21 (48.8%) |
| Education, Arts & Media | 0 (0.0%) | 0 (0.0%) |
| Legal Services & Support | 12 (75.0%) | 4 (25.0%) |
| Education Instruction & Library | 4 (22.2%) | 14 (77.8%) |
| Arts, Media & Entertainment | 6 (66.7%) | 3 (33.3%) |
| Health Diagnosing & Treating | 10 (18.2%) | 45 (81.8%) |
| Health Technologists | 10 (19.2%) | 42 (80.8%) |
| Total (Category) | 225 (62.3%) | 136 (37.7%) |
| Total (Overall) | 349 (60.0%) | 233 (40.0%) |
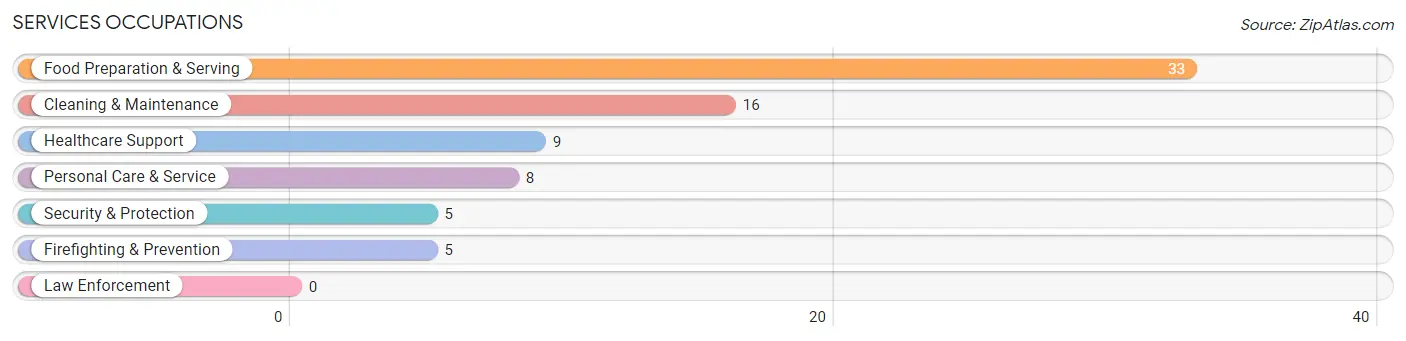
Services Occupations
The most common Services occupations in Dellwood are Food Preparation & Serving (33 | 5.7%), Cleaning & Maintenance (16 | 2.8%), Healthcare Support (9 | 1.5%), Personal Care & Service (8 | 1.4%), and Security & Protection (5 | 0.9%).
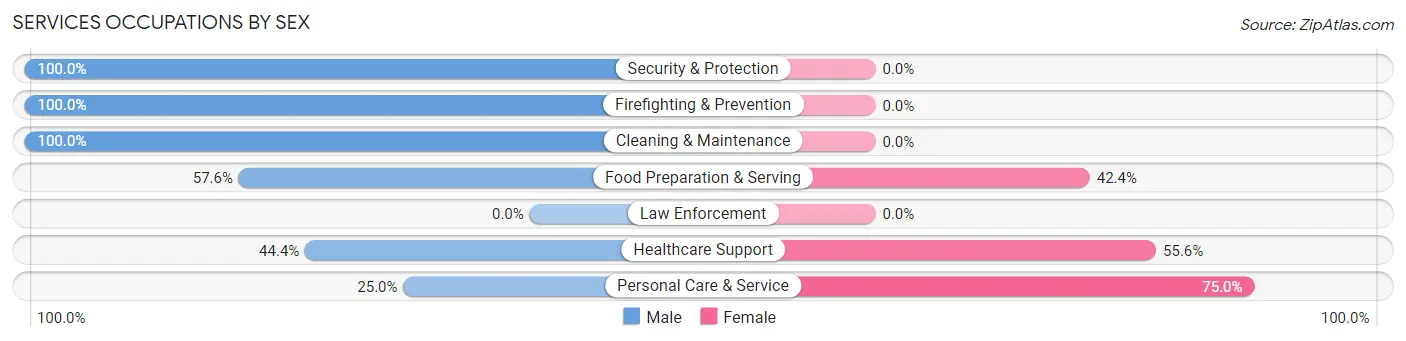
Services Occupations by Sex
Within the Services occupations in Dellwood, the most male-oriented occupations are Security & Protection (100.0%), Firefighting & Prevention (100.0%), and Cleaning & Maintenance (100.0%), while the most female-oriented occupations are Personal Care & Service (75.0%), Healthcare Support (55.6%), and Food Preparation & Serving (42.4%).
| Occupation | Male | Female |
| Healthcare Support | 4 (44.4%) | 5 (55.6%) |
| Security & Protection | 5 (100.0%) | 0 (0.0%) |
| Firefighting & Prevention | 5 (100.0%) | 0 (0.0%) |
| Law Enforcement | 0 (0.0%) | 0 (0.0%) |
| Food Preparation & Serving | 19 (57.6%) | 14 (42.4%) |
| Cleaning & Maintenance | 16 (100.0%) | 0 (0.0%) |
| Personal Care & Service | 2 (25.0%) | 6 (75.0%) |
| Total (Category) | 46 (64.8%) | 25 (35.2%) |
| Total (Overall) | 349 (60.0%) | 233 (40.0%) |
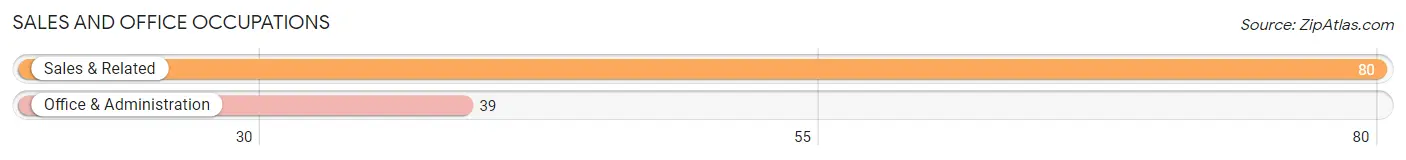
Sales and Office Occupations
The most common Sales and Office occupations in Dellwood are Sales & Related (80 | 13.8%), and Office & Administration (39 | 6.7%).
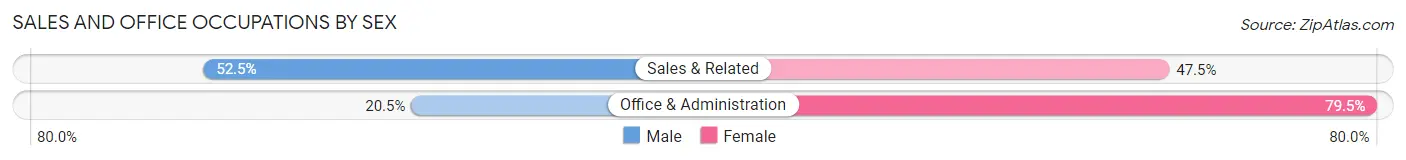
Sales and Office Occupations by Sex
| Occupation | Male | Female |
| Sales & Related | 42 (52.5%) | 38 (47.5%) |
| Office & Administration | 8 (20.5%) | 31 (79.5%) |
| Total (Category) | 50 (42.0%) | 69 (58.0%) |
| Total (Overall) | 349 (60.0%) | 233 (40.0%) |
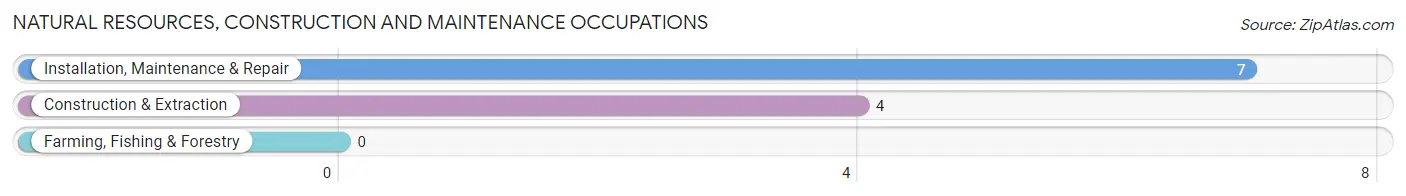
Natural Resources, Construction and Maintenance Occupations
The most common Natural Resources, Construction and Maintenance occupations in Dellwood are Installation, Maintenance & Repair (7 | 1.2%), and Construction & Extraction (4 | 0.7%).
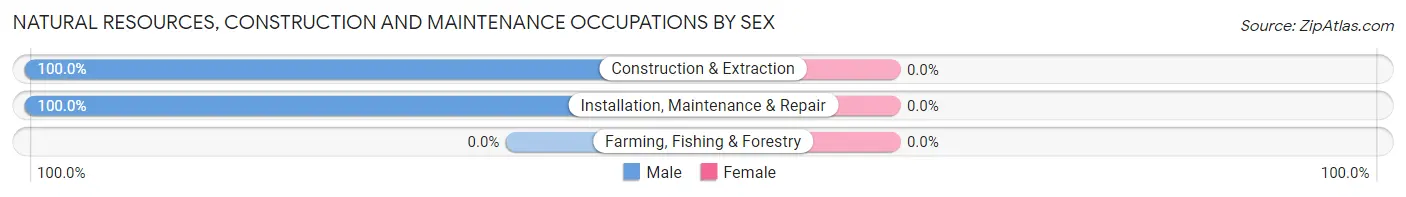
Natural Resources, Construction and Maintenance Occupations by Sex
| Occupation | Male | Female |
| Farming, Fishing & Forestry | 0 (0.0%) | 0 (0.0%) |
| Construction & Extraction | 4 (100.0%) | 0 (0.0%) |
| Installation, Maintenance & Repair | 7 (100.0%) | 0 (0.0%) |
| Total (Category) | 11 (100.0%) | 0 (0.0%) |
| Total (Overall) | 349 (60.0%) | 233 (40.0%) |
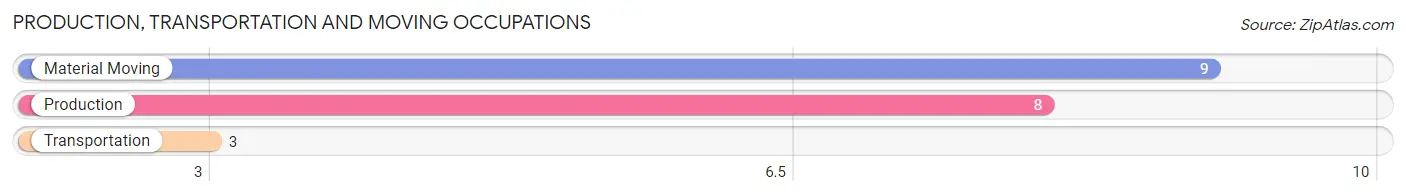
Production, Transportation and Moving Occupations
The most common Production, Transportation and Moving occupations in Dellwood are Material Moving (9 | 1.5%), Production (8 | 1.4%), and Transportation (3 | 0.5%).
Production, Transportation and Moving Occupations by Sex
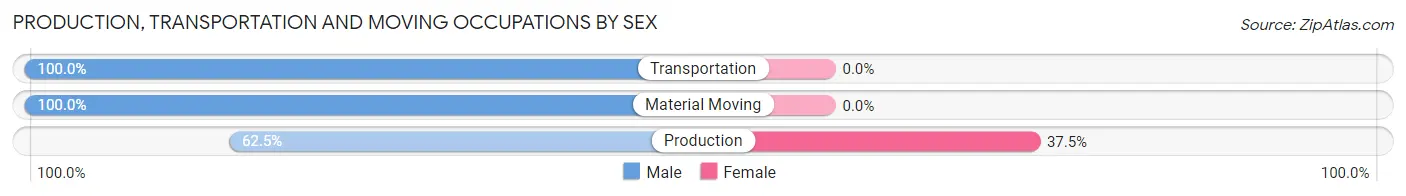
| Occupation | Male | Female |
| Production | 5 (62.5%) | 3 (37.5%) |
| Transportation | 3 (100.0%) | 0 (0.0%) |
| Material Moving | 9 (100.0%) | 0 (0.0%) |
| Total (Category) | 17 (85.0%) | 3 (15.0%) |
| Total (Overall) | 349 (60.0%) | 233 (40.0%) |
Employment Industries by Sex in Dellwood
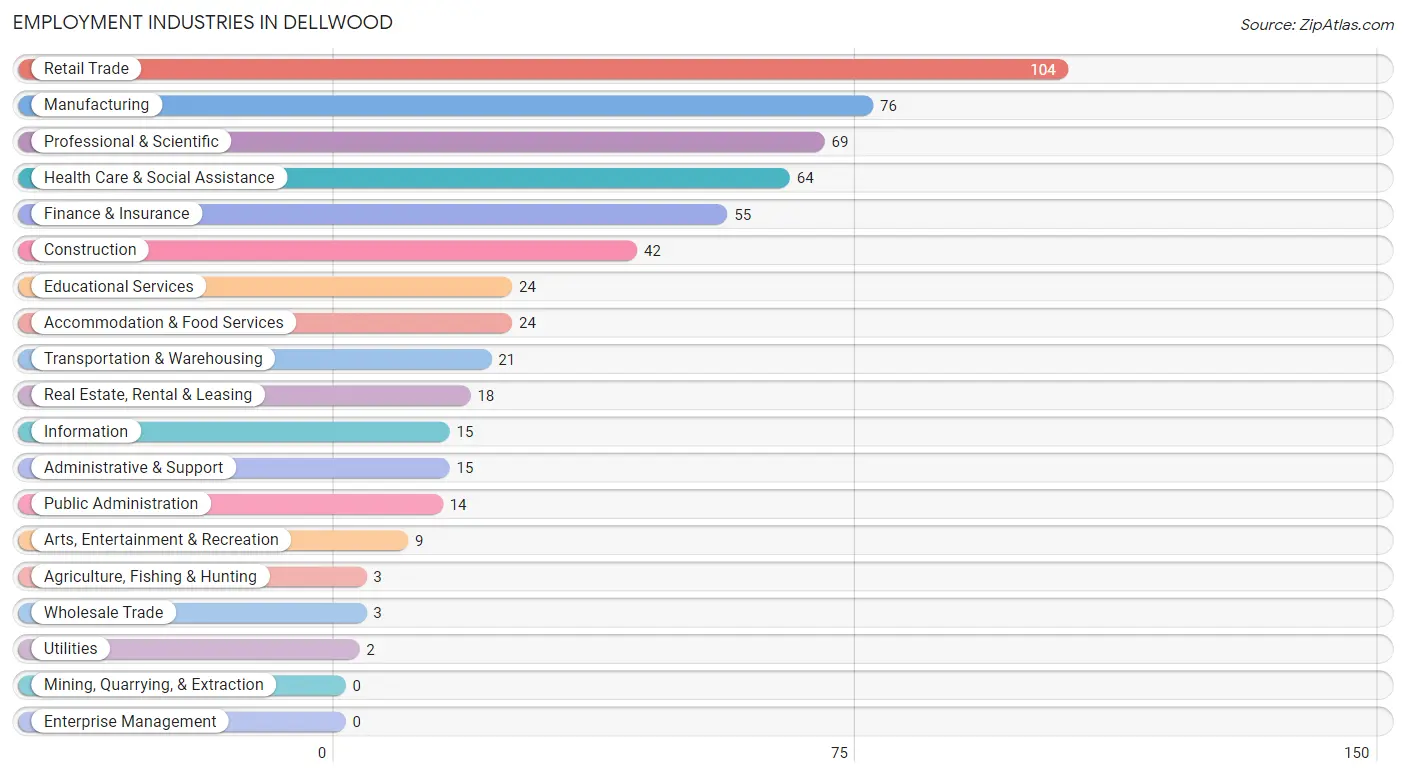
Employment Industries in Dellwood
The major employment industries in Dellwood include Retail Trade (104 | 17.9%), Manufacturing (76 | 13.1%), Professional & Scientific (69 | 11.9%), Health Care & Social Assistance (64 | 11.0%), and Finance & Insurance (55 | 9.5%).
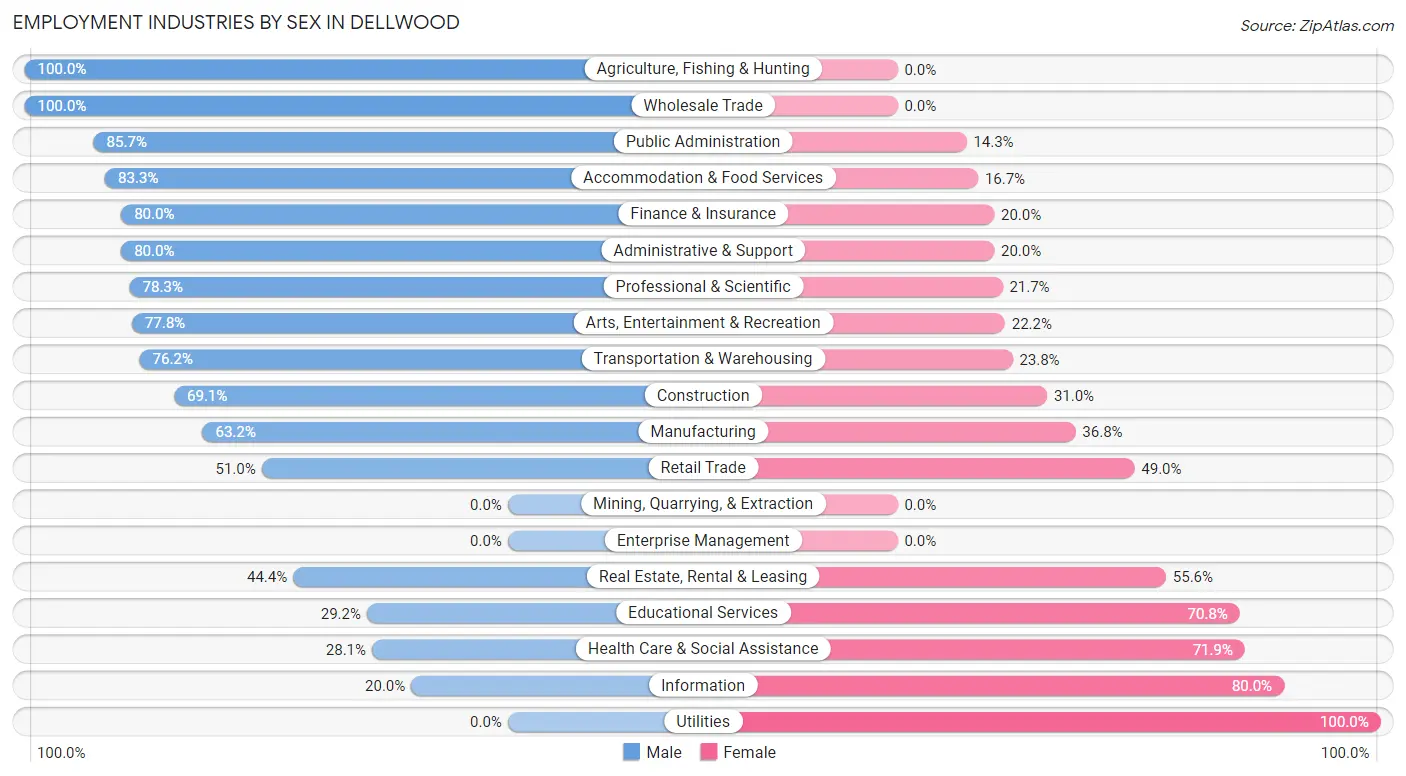
Employment Industries by Sex in Dellwood
The Dellwood industries that see more men than women are Agriculture, Fishing & Hunting (100.0%), Wholesale Trade (100.0%), and Public Administration (85.7%), whereas the industries that tend to have a higher number of women are Utilities (100.0%), Information (80.0%), and Health Care & Social Assistance (71.9%).
| Industry | Male | Female |
| Agriculture, Fishing & Hunting | 3 (100.0%) | 0 (0.0%) |
| Mining, Quarrying, & Extraction | 0 (0.0%) | 0 (0.0%) |
| Construction | 29 (69.1%) | 13 (30.9%) |
| Manufacturing | 48 (63.2%) | 28 (36.8%) |
| Wholesale Trade | 3 (100.0%) | 0 (0.0%) |
| Retail Trade | 53 (51.0%) | 51 (49.0%) |
| Transportation & Warehousing | 16 (76.2%) | 5 (23.8%) |
| Utilities | 0 (0.0%) | 2 (100.0%) |
| Information | 3 (20.0%) | 12 (80.0%) |
| Finance & Insurance | 44 (80.0%) | 11 (20.0%) |
| Real Estate, Rental & Leasing | 8 (44.4%) | 10 (55.6%) |
| Professional & Scientific | 54 (78.3%) | 15 (21.7%) |
| Enterprise Management | 0 (0.0%) | 0 (0.0%) |
| Administrative & Support | 12 (80.0%) | 3 (20.0%) |
| Educational Services | 7 (29.2%) | 17 (70.8%) |
| Health Care & Social Assistance | 18 (28.1%) | 46 (71.9%) |
| Arts, Entertainment & Recreation | 7 (77.8%) | 2 (22.2%) |
| Accommodation & Food Services | 20 (83.3%) | 4 (16.7%) |
| Public Administration | 12 (85.7%) | 2 (14.3%) |
| Total | 349 (60.0%) | 233 (40.0%) |
Education in Dellwood
School Enrollment in Dellwood
The most common levels of schooling among the 290 students in Dellwood are high school (71 | 24.5%), middle school (68 | 23.4%), and elementary school (48 | 16.6%).
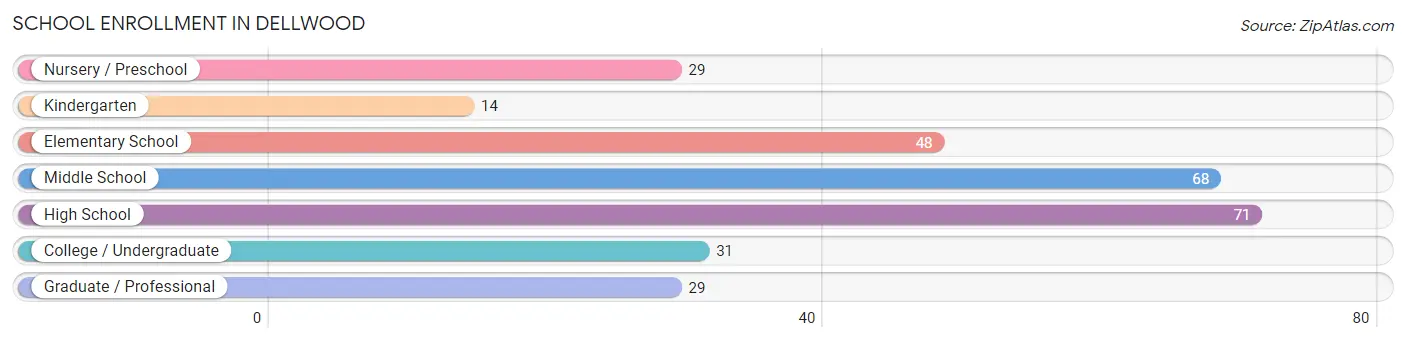
| School Level | # Students | % Students |
| Nursery / Preschool | 29 | 10.0% |
| Kindergarten | 14 | 4.8% |
| Elementary School | 48 | 16.6% |
| Middle School | 68 | 23.4% |
| High School | 71 | 24.5% |
| College / Undergraduate | 31 | 10.7% |
| Graduate / Professional | 29 | 10.0% |
| Total | 290 | 100.0% |
School Enrollment by Age by Funding Source in Dellwood
Out of a total of 290 students who are enrolled in schools in Dellwood, 95 (32.8%) attend a private institution, while the remaining 195 (67.2%) are enrolled in public schools. The age group of 35 years and over has the highest likelihood of being enrolled in private schools, with 8 (66.7% in the age bracket) enrolled. Conversely, the age group of 18 to 19 year olds has the lowest likelihood of being enrolled in a private school, with 26 (100.0% in the age bracket) attending a public institution.
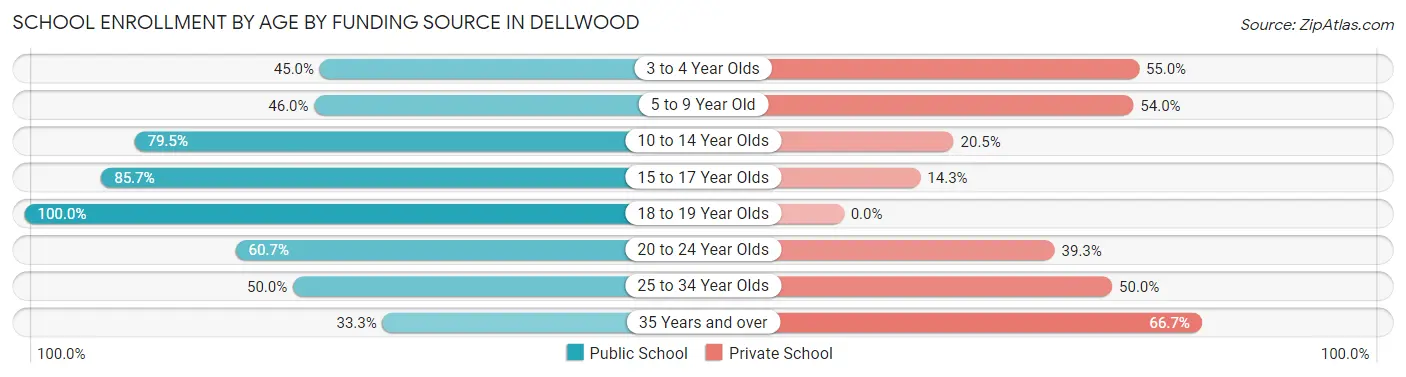
| Age Bracket | Public School | Private School |
| 3 to 4 Year Olds | 9 (45.0%) | 11 (55.0%) |
| 5 to 9 Year Old | 29 (46.0%) | 34 (54.0%) |
| 10 to 14 Year Olds | 66 (79.5%) | 17 (20.5%) |
| 15 to 17 Year Olds | 36 (85.7%) | 6 (14.3%) |
| 18 to 19 Year Olds | 26 (100.0%) | 0 (0.0%) |
| 20 to 24 Year Olds | 17 (60.7%) | 11 (39.3%) |
| 25 to 34 Year Olds | 8 (50.0%) | 8 (50.0%) |
| 35 Years and over | 4 (33.3%) | 8 (66.7%) |
| Total | 195 (67.2%) | 95 (32.8%) |
Educational Attainment by Field of Study in Dellwood
Business (140 | 22.1%), social sciences (82 | 12.9%), education (61 | 9.6%), bio, nature & agricultural (57 | 9.0%), and science & technology (51 | 8.0%) are the most common fields of study among 634 individuals in Dellwood who have obtained a bachelor's degree or higher.
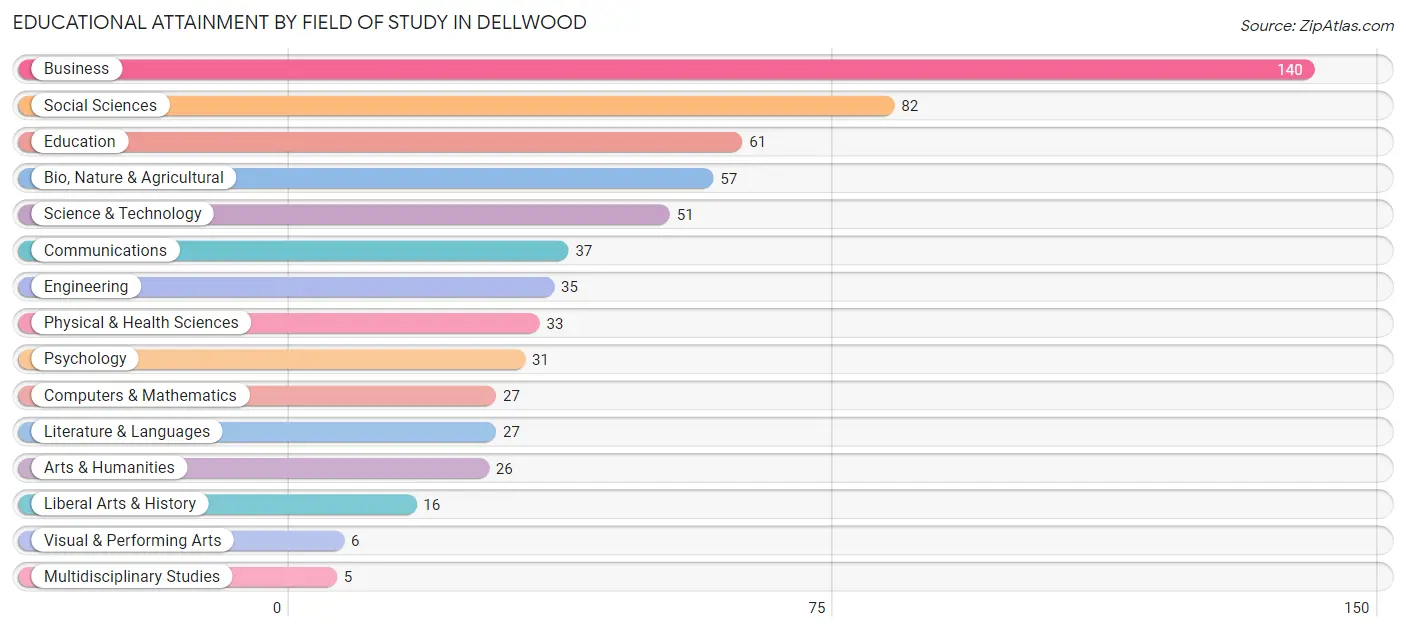
| Field of Study | # Graduates | % Graduates |
| Computers & Mathematics | 27 | 4.3% |
| Bio, Nature & Agricultural | 57 | 9.0% |
| Physical & Health Sciences | 33 | 5.2% |
| Psychology | 31 | 4.9% |
| Social Sciences | 82 | 12.9% |
| Engineering | 35 | 5.5% |
| Multidisciplinary Studies | 5 | 0.8% |
| Science & Technology | 51 | 8.0% |
| Business | 140 | 22.1% |
| Education | 61 | 9.6% |
| Literature & Languages | 27 | 4.3% |
| Liberal Arts & History | 16 | 2.5% |
| Visual & Performing Arts | 6 | 0.9% |
| Communications | 37 | 5.8% |
| Arts & Humanities | 26 | 4.1% |
| Total | 634 | 100.0% |
Transportation & Commute in Dellwood
Vehicle Availability by Sex in Dellwood
The most prevalent vehicle ownership categories in Dellwood are males with 2 vehicles (145, accounting for 41.7%) and females with 2 vehicles (118, making up 62.5%).
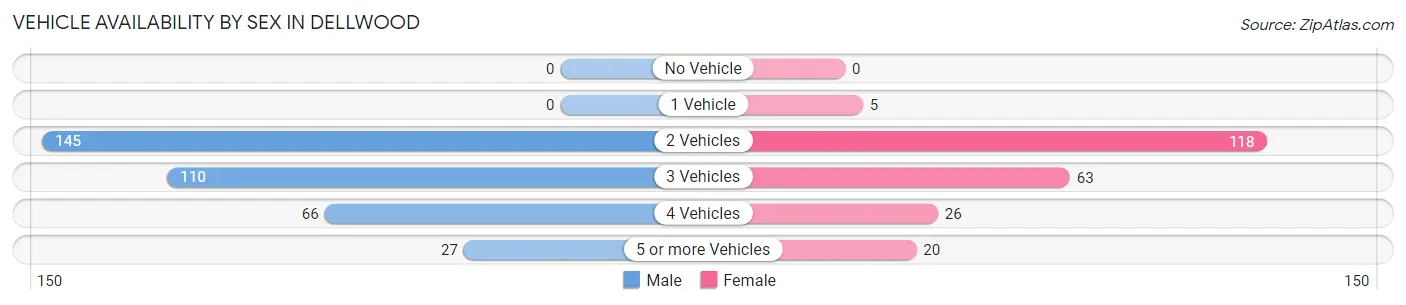
| Vehicles Available | Male | Female |
| No Vehicle | 0 (0.0%) | 0 (0.0%) |
| 1 Vehicle | 0 (0.0%) | 5 (2.2%) |
| 2 Vehicles | 145 (41.7%) | 118 (50.9%) |
| 3 Vehicles | 110 (31.6%) | 63 (27.2%) |
| 4 Vehicles | 66 (19.0%) | 26 (11.2%) |
| 5 or more Vehicles | 27 (7.8%) | 20 (8.6%) |
| Total | 348 (100.0%) | 232 (100.0%) |
Commute Time in Dellwood
The most frequently occuring commute durations in Dellwood are 20 to 24 minutes (111 commuters, 24.7%), 30 to 34 minutes (88 commuters, 19.6%), and 15 to 19 minutes (56 commuters, 12.5%).
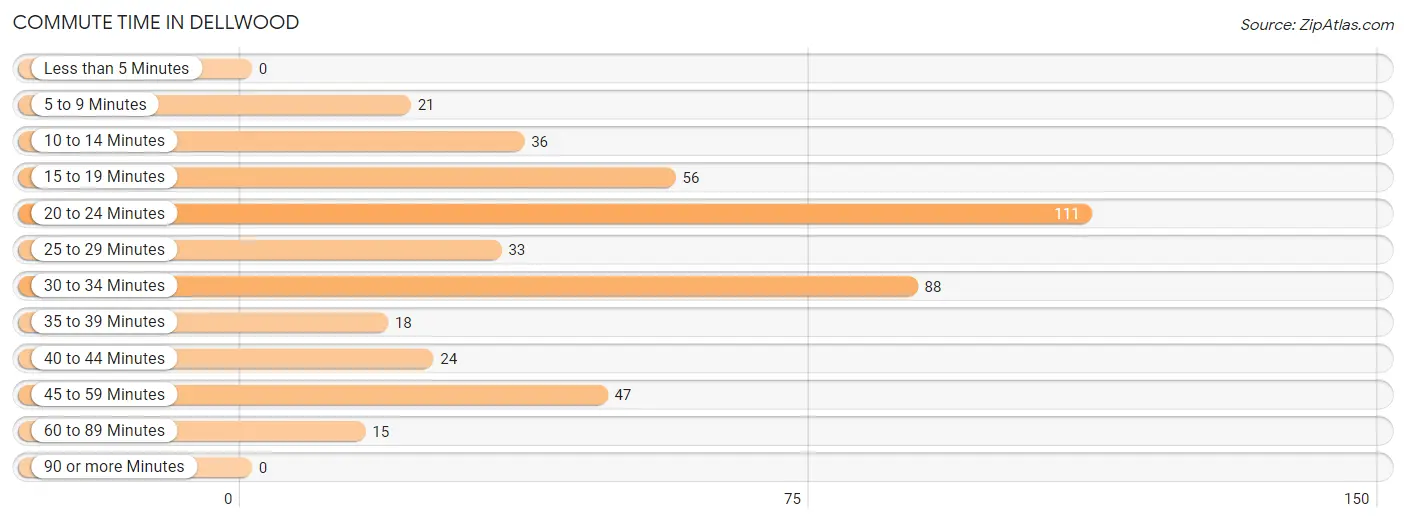
| Commute Time | # Commuters | % Commuters |
| Less than 5 Minutes | 0 | 0.0% |
| 5 to 9 Minutes | 21 | 4.7% |
| 10 to 14 Minutes | 36 | 8.0% |
| 15 to 19 Minutes | 56 | 12.5% |
| 20 to 24 Minutes | 111 | 24.7% |
| 25 to 29 Minutes | 33 | 7.3% |
| 30 to 34 Minutes | 88 | 19.6% |
| 35 to 39 Minutes | 18 | 4.0% |
| 40 to 44 Minutes | 24 | 5.3% |
| 45 to 59 Minutes | 47 | 10.5% |
| 60 to 89 Minutes | 15 | 3.3% |
| 90 or more Minutes | 0 | 0.0% |
Commute Time by Sex in Dellwood
The most common commute times in Dellwood are 20 to 24 minutes (61 commuters, 22.4%) for males and 20 to 24 minutes (50 commuters, 28.2%) for females.
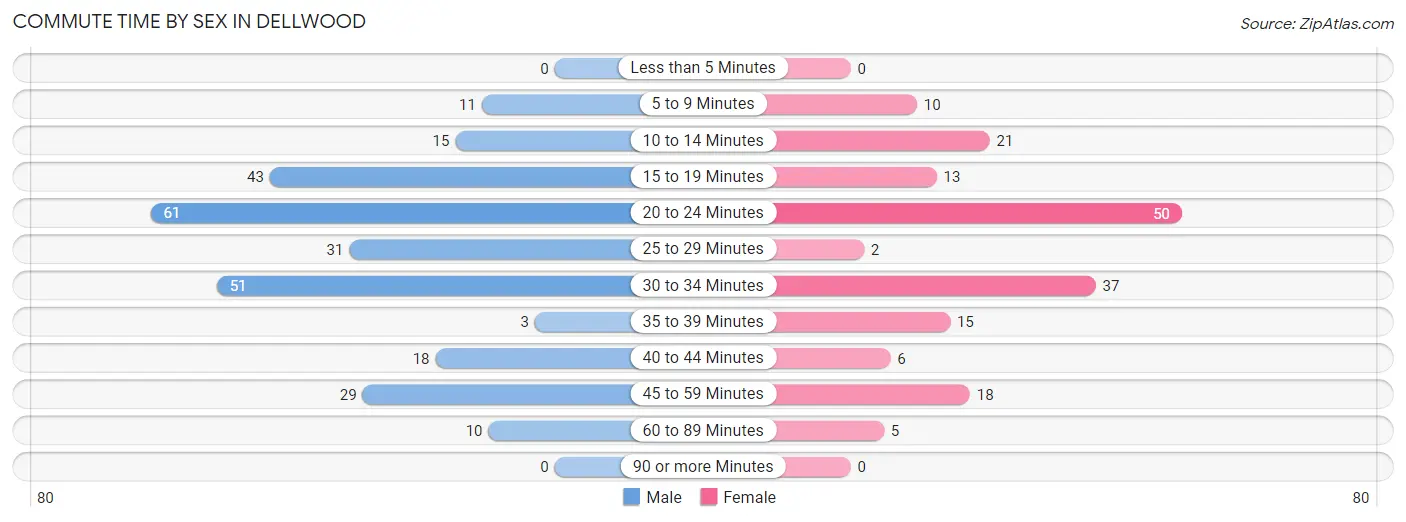
| Commute Time | Male | Female |
| Less than 5 Minutes | 0 (0.0%) | 0 (0.0%) |
| 5 to 9 Minutes | 11 (4.0%) | 10 (5.7%) |
| 10 to 14 Minutes | 15 (5.5%) | 21 (11.9%) |
| 15 to 19 Minutes | 43 (15.8%) | 13 (7.3%) |
| 20 to 24 Minutes | 61 (22.4%) | 50 (28.2%) |
| 25 to 29 Minutes | 31 (11.4%) | 2 (1.1%) |
| 30 to 34 Minutes | 51 (18.8%) | 37 (20.9%) |
| 35 to 39 Minutes | 3 (1.1%) | 15 (8.5%) |
| 40 to 44 Minutes | 18 (6.6%) | 6 (3.4%) |
| 45 to 59 Minutes | 29 (10.7%) | 18 (10.2%) |
| 60 to 89 Minutes | 10 (3.7%) | 5 (2.8%) |
| 90 or more Minutes | 0 (0.0%) | 0 (0.0%) |
Time of Departure to Work by Sex in Dellwood
The most frequent times of departure to work in Dellwood are 8:00 AM to 8:29 AM (54, 19.9%) for males and 9:00 AM to 9:59 AM (31, 17.5%) for females.
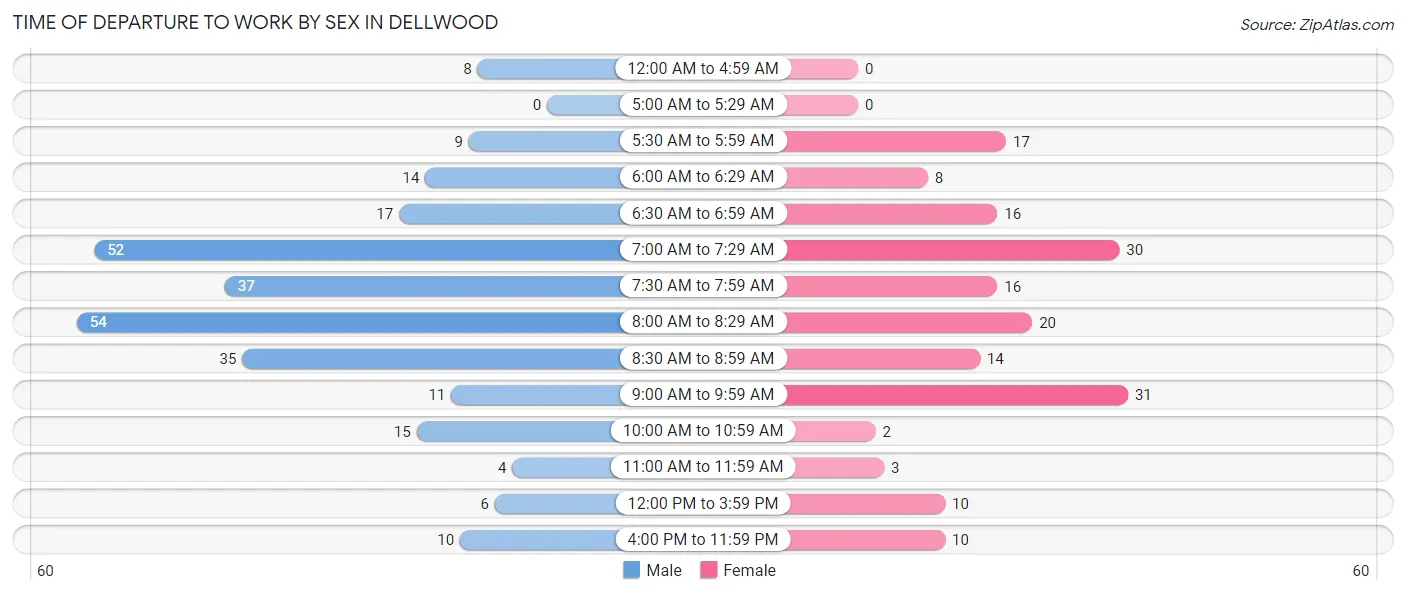
| Time of Departure | Male | Female |
| 12:00 AM to 4:59 AM | 8 (2.9%) | 0 (0.0%) |
| 5:00 AM to 5:29 AM | 0 (0.0%) | 0 (0.0%) |
| 5:30 AM to 5:59 AM | 9 (3.3%) | 17 (9.6%) |
| 6:00 AM to 6:29 AM | 14 (5.1%) | 8 (4.5%) |
| 6:30 AM to 6:59 AM | 17 (6.2%) | 16 (9.0%) |
| 7:00 AM to 7:29 AM | 52 (19.1%) | 30 (17.0%) |
| 7:30 AM to 7:59 AM | 37 (13.6%) | 16 (9.0%) |
| 8:00 AM to 8:29 AM | 54 (19.9%) | 20 (11.3%) |
| 8:30 AM to 8:59 AM | 35 (12.9%) | 14 (7.9%) |
| 9:00 AM to 9:59 AM | 11 (4.0%) | 31 (17.5%) |
| 10:00 AM to 10:59 AM | 15 (5.5%) | 2 (1.1%) |
| 11:00 AM to 11:59 AM | 4 (1.5%) | 3 (1.7%) |
| 12:00 PM to 3:59 PM | 6 (2.2%) | 10 (5.7%) |
| 4:00 PM to 11:59 PM | 10 (3.7%) | 10 (5.7%) |
| Total | 272 (100.0%) | 177 (100.0%) |
Housing Occupancy in Dellwood
Occupancy by Ownership in Dellwood
Of the total 400 dwellings in Dellwood, owner-occupied units account for 385 (96.3%), while renter-occupied units make up 15 (3.7%).
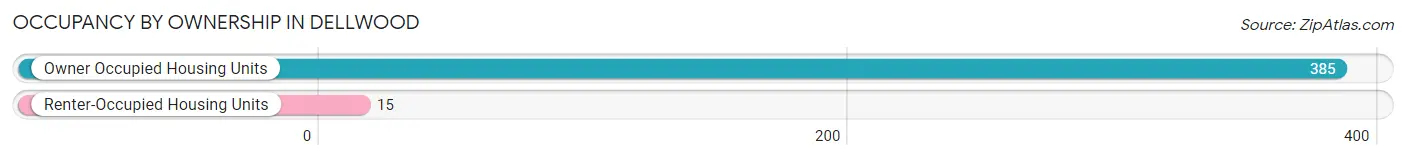
| Occupancy | # Housing Units | % Housing Units |
| Owner Occupied Housing Units | 385 | 96.3% |
| Renter-Occupied Housing Units | 15 | 3.7% |
| Total Occupied Housing Units | 400 | 100.0% |
Occupancy by Household Size in Dellwood
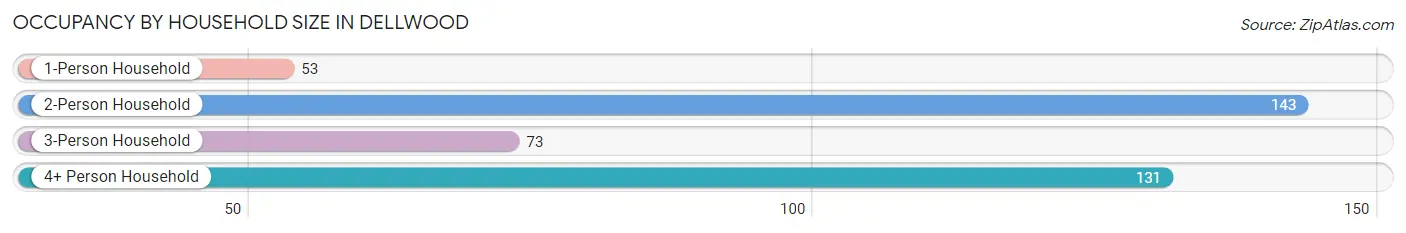
| Household Size | # Housing Units | % Housing Units |
| 1-Person Household | 53 | 13.3% |
| 2-Person Household | 143 | 35.7% |
| 3-Person Household | 73 | 18.2% |
| 4+ Person Household | 131 | 32.8% |
| Total Housing Units | 400 | 100.0% |
Occupancy by Ownership by Household Size in Dellwood
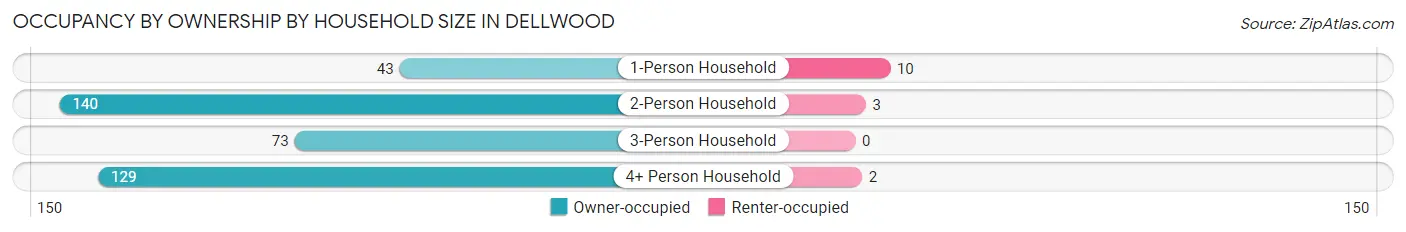
| Household Size | Owner-occupied | Renter-occupied |
| 1-Person Household | 43 (81.1%) | 10 (18.9%) |
| 2-Person Household | 140 (97.9%) | 3 (2.1%) |
| 3-Person Household | 73 (100.0%) | 0 (0.0%) |
| 4+ Person Household | 129 (98.5%) | 2 (1.5%) |
| Total Housing Units | 385 (96.3%) | 15 (3.7%) |
Occupancy by Educational Attainment in Dellwood
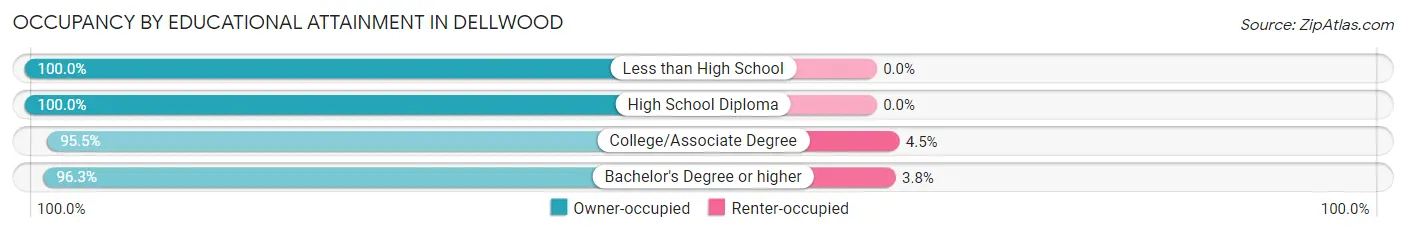
| Household Size | Owner-occupied | Renter-occupied |
| Less than High School | 2 (100.0%) | 0 (0.0%) |
| High School Diploma | 16 (100.0%) | 0 (0.0%) |
| College/Associate Degree | 85 (95.5%) | 4 (4.5%) |
| Bachelor's Degree or higher | 282 (96.3%) | 11 (3.7%) |
Occupancy by Age of Householder in Dellwood
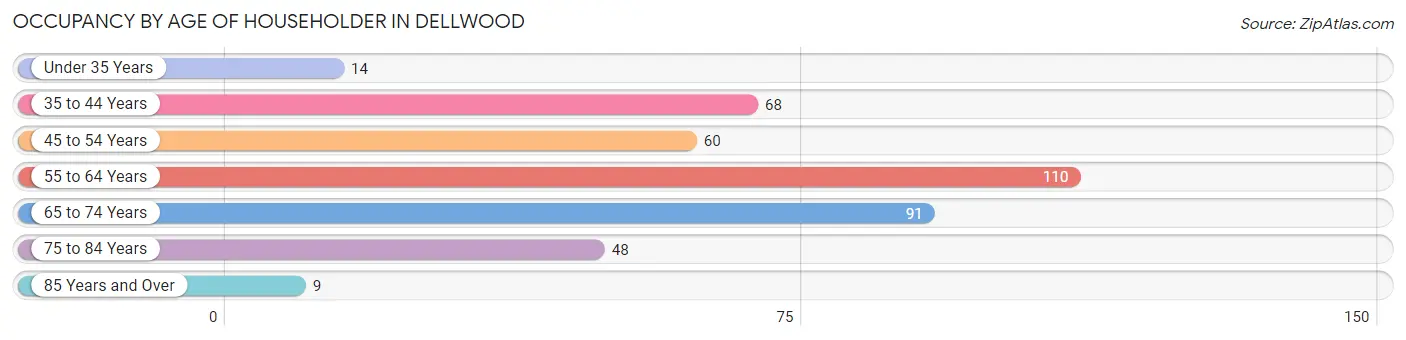
| Age Bracket | # Households | % Households |
| Under 35 Years | 14 | 3.5% |
| 35 to 44 Years | 68 | 17.0% |
| 45 to 54 Years | 60 | 15.0% |
| 55 to 64 Years | 110 | 27.5% |
| 65 to 74 Years | 91 | 22.8% |
| 75 to 84 Years | 48 | 12.0% |
| 85 Years and Over | 9 | 2.2% |
| Total | 400 | 100.0% |
Housing Finances in Dellwood
Median Income by Occupancy in Dellwood
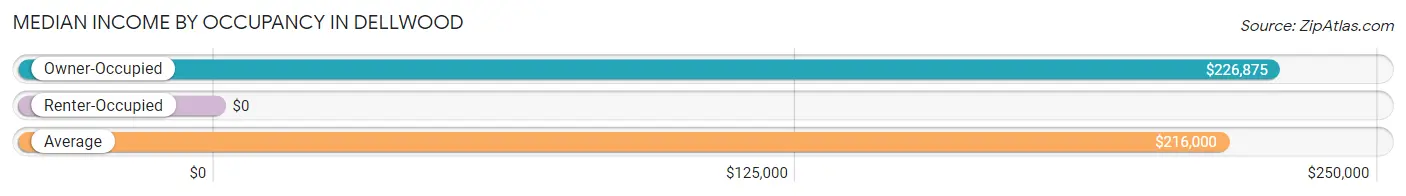
| Occupancy Type | # Households | Median Income |
| Owner-Occupied | 385 (96.3%) | $226,875 |
| Renter-Occupied | 15 (3.7%) | $0 |
| Average | 400 (100.0%) | $216,000 |
Occupancy by Householder Income Bracket in Dellwood
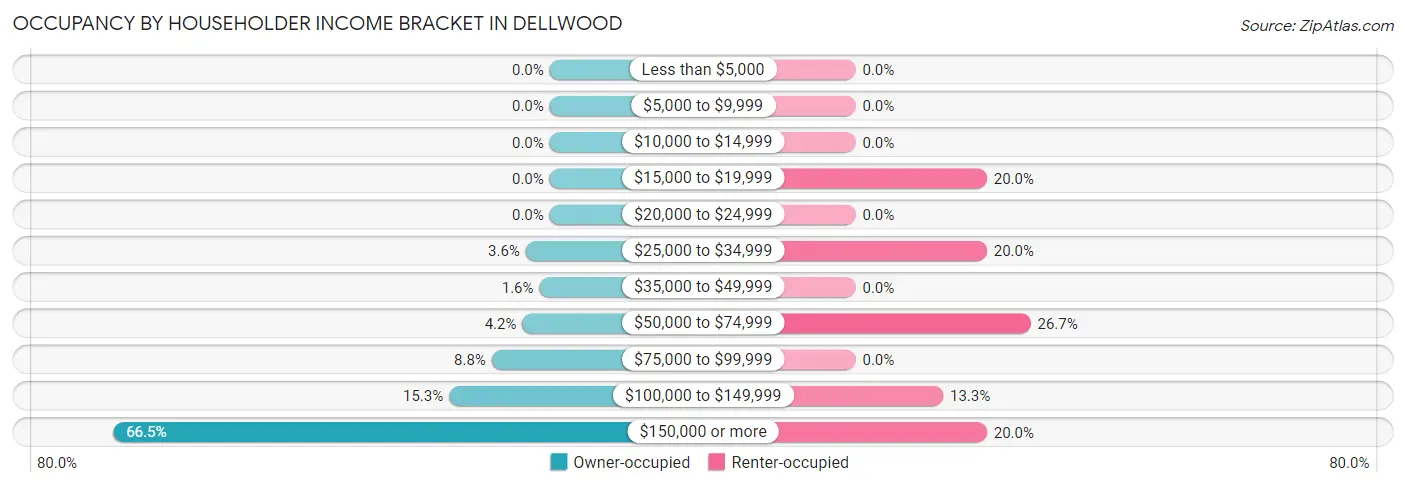
| Income Bracket | Owner-occupied | Renter-occupied |
| Less than $5,000 | 0 (0.0%) | 0 (0.0%) |
| $5,000 to $9,999 | 0 (0.0%) | 0 (0.0%) |
| $10,000 to $14,999 | 0 (0.0%) | 0 (0.0%) |
| $15,000 to $19,999 | 0 (0.0%) | 3 (20.0%) |
| $20,000 to $24,999 | 0 (0.0%) | 0 (0.0%) |
| $25,000 to $34,999 | 14 (3.6%) | 3 (20.0%) |
| $35,000 to $49,999 | 6 (1.6%) | 0 (0.0%) |
| $50,000 to $74,999 | 16 (4.2%) | 4 (26.7%) |
| $75,000 to $99,999 | 34 (8.8%) | 0 (0.0%) |
| $100,000 to $149,999 | 59 (15.3%) | 2 (13.3%) |
| $150,000 or more | 256 (66.5%) | 3 (20.0%) |
| Total | 385 (100.0%) | 15 (100.0%) |
Monthly Housing Cost Tiers in Dellwood
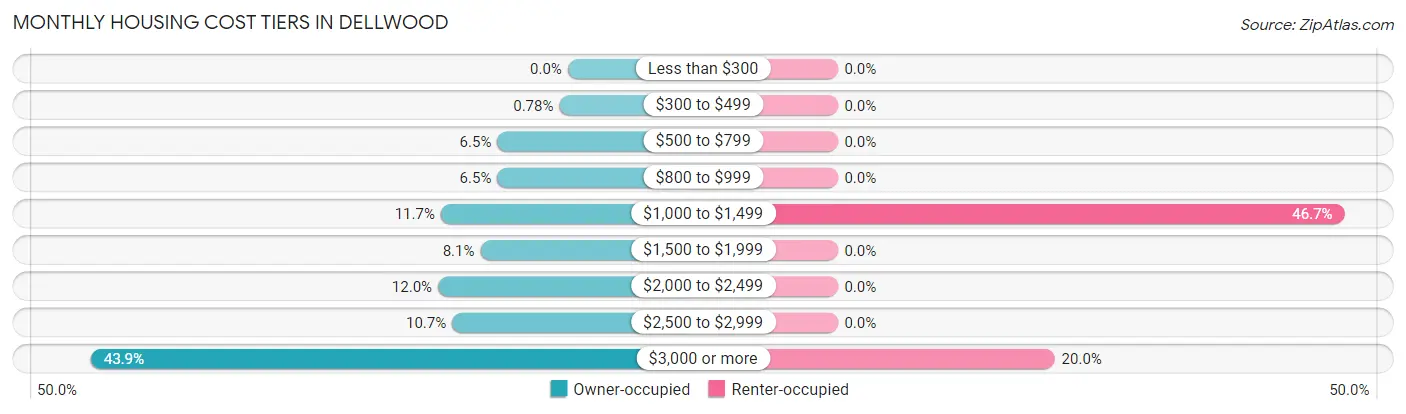
| Monthly Cost | Owner-occupied | Renter-occupied |
| Less than $300 | 0 (0.0%) | 0 (0.0%) |
| $300 to $499 | 3 (0.8%) | 0 (0.0%) |
| $500 to $799 | 25 (6.5%) | 0 (0.0%) |
| $800 to $999 | 25 (6.5%) | 0 (0.0%) |
| $1,000 to $1,499 | 45 (11.7%) | 7 (46.7%) |
| $1,500 to $1,999 | 31 (8.1%) | 0 (0.0%) |
| $2,000 to $2,499 | 46 (11.9%) | 0 (0.0%) |
| $2,500 to $2,999 | 41 (10.6%) | 0 (0.0%) |
| $3,000 or more | 169 (43.9%) | 3 (20.0%) |
| Total | 385 (100.0%) | 15 (100.0%) |
Physical Housing Characteristics in Dellwood
Housing Structures in Dellwood
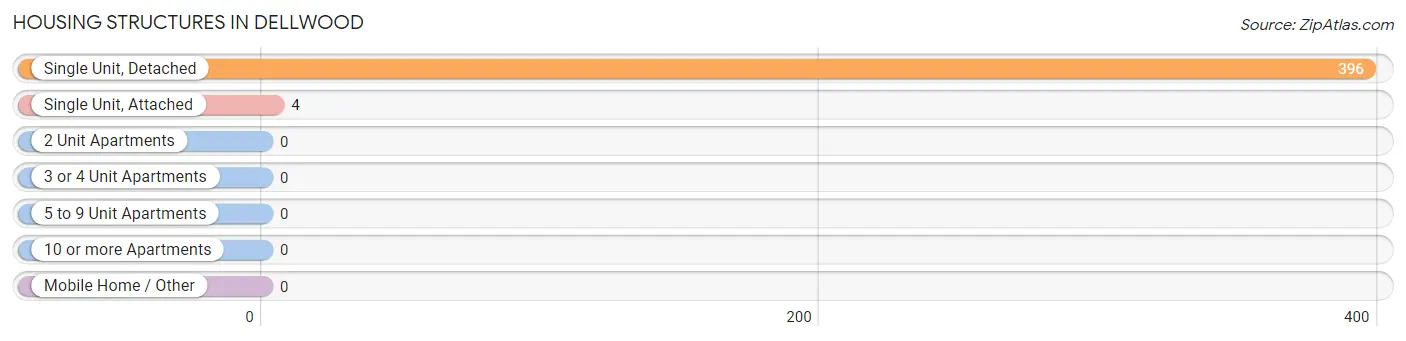
| Structure Type | # Housing Units | % Housing Units |
| Single Unit, Detached | 396 | 99.0% |
| Single Unit, Attached | 4 | 1.0% |
| 2 Unit Apartments | 0 | 0.0% |
| 3 or 4 Unit Apartments | 0 | 0.0% |
| 5 to 9 Unit Apartments | 0 | 0.0% |
| 10 or more Apartments | 0 | 0.0% |
| Mobile Home / Other | 0 | 0.0% |
| Total | 400 | 100.0% |
Housing Structures by Occupancy in Dellwood
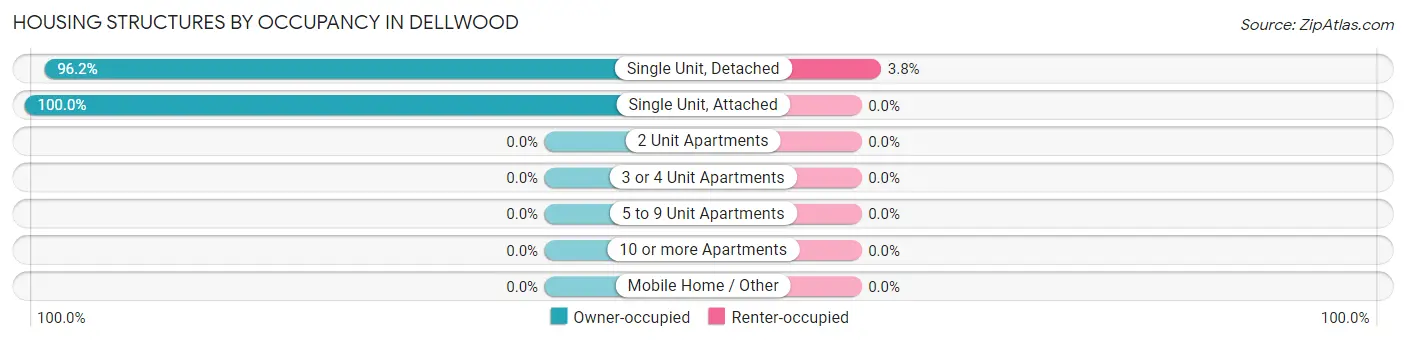
| Structure Type | Owner-occupied | Renter-occupied |
| Single Unit, Detached | 381 (96.2%) | 15 (3.8%) |
| Single Unit, Attached | 4 (100.0%) | 0 (0.0%) |
| 2 Unit Apartments | 0 (0.0%) | 0 (0.0%) |
| 3 or 4 Unit Apartments | 0 (0.0%) | 0 (0.0%) |
| 5 to 9 Unit Apartments | 0 (0.0%) | 0 (0.0%) |
| 10 or more Apartments | 0 (0.0%) | 0 (0.0%) |
| Mobile Home / Other | 0 (0.0%) | 0 (0.0%) |
| Total | 385 (96.3%) | 15 (3.7%) |
Housing Structures by Number of Rooms in Dellwood
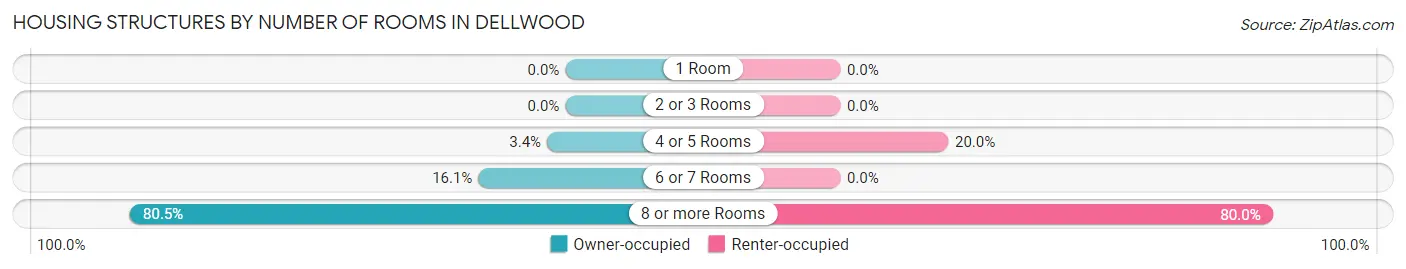
| Number of Rooms | Owner-occupied | Renter-occupied |
| 1 Room | 0 (0.0%) | 0 (0.0%) |
| 2 or 3 Rooms | 0 (0.0%) | 0 (0.0%) |
| 4 or 5 Rooms | 13 (3.4%) | 3 (20.0%) |
| 6 or 7 Rooms | 62 (16.1%) | 0 (0.0%) |
| 8 or more Rooms | 310 (80.5%) | 12 (80.0%) |
| Total | 385 (100.0%) | 15 (100.0%) |
Housing Structure by Heating Type in Dellwood
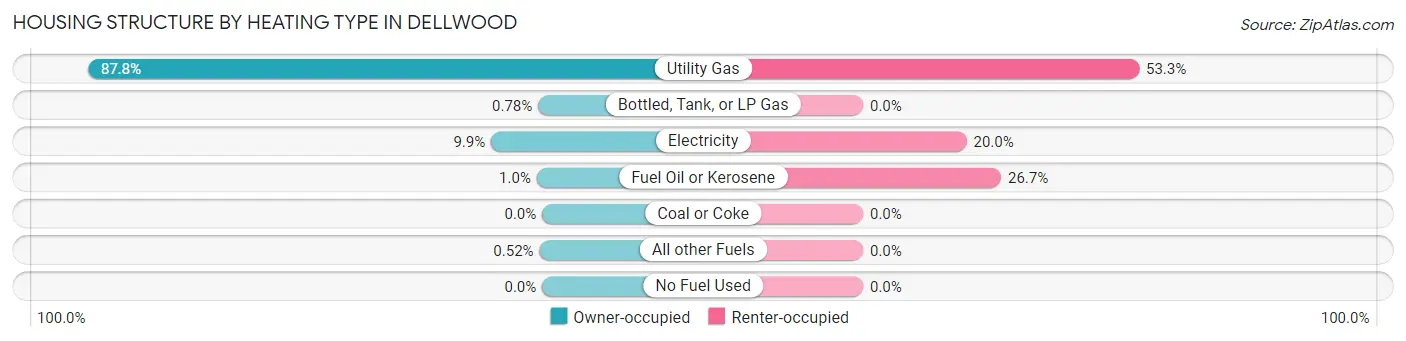
| Heating Type | Owner-occupied | Renter-occupied |
| Utility Gas | 338 (87.8%) | 8 (53.3%) |
| Bottled, Tank, or LP Gas | 3 (0.8%) | 0 (0.0%) |
| Electricity | 38 (9.9%) | 3 (20.0%) |
| Fuel Oil or Kerosene | 4 (1.0%) | 4 (26.7%) |
| Coal or Coke | 0 (0.0%) | 0 (0.0%) |
| All other Fuels | 2 (0.5%) | 0 (0.0%) |
| No Fuel Used | 0 (0.0%) | 0 (0.0%) |
| Total | 385 (100.0%) | 15 (100.0%) |
Household Vehicle Usage in Dellwood
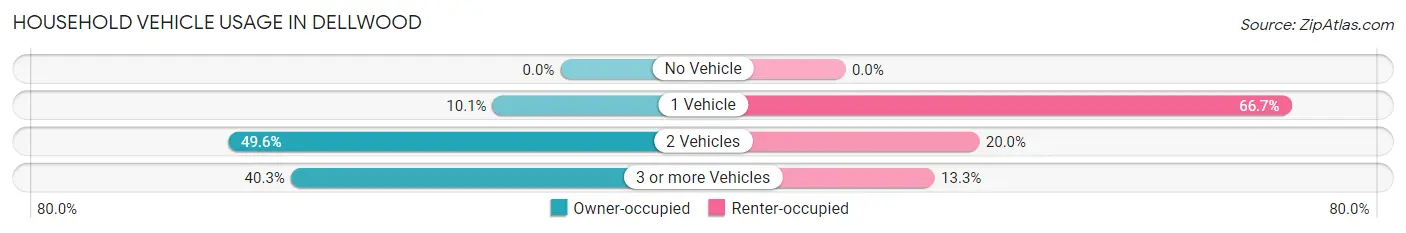
| Vehicles per Household | Owner-occupied | Renter-occupied |
| No Vehicle | 0 (0.0%) | 0 (0.0%) |
| 1 Vehicle | 39 (10.1%) | 10 (66.7%) |
| 2 Vehicles | 191 (49.6%) | 3 (20.0%) |
| 3 or more Vehicles | 155 (40.3%) | 2 (13.3%) |
| Total | 385 (100.0%) | 15 (100.0%) |
Real Estate & Mortgages in Dellwood
Real Estate and Mortgage Overview in Dellwood
| Characteristic | Without Mortgage | With Mortgage |
| Housing Units | 166 | 219 |
| Median Property Value | $1,008,100 | $653,300 |
| Median Household Income | $201,250 | $157 |
| Monthly Housing Costs | $1,383 | $138 |
| Real Estate Taxes | $8,676 | $3 |
Property Value by Mortgage Status in Dellwood
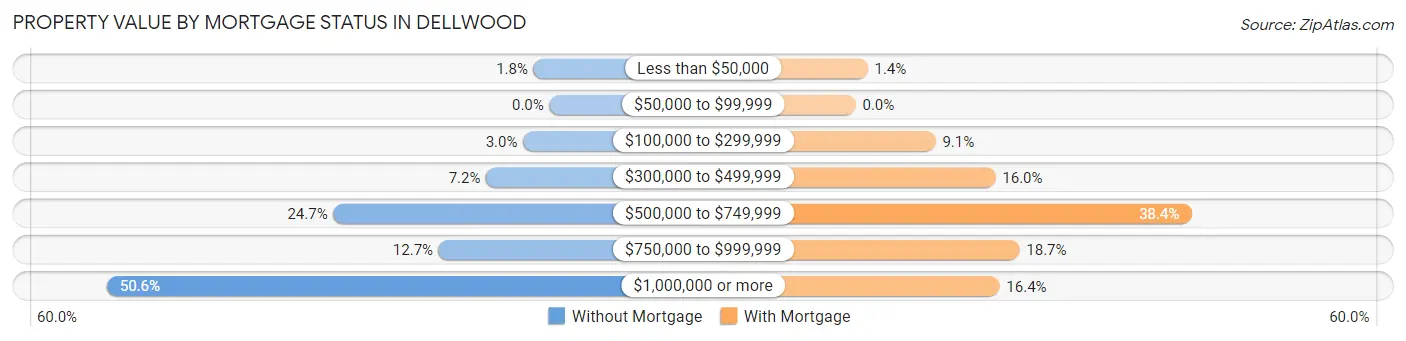
| Property Value | Without Mortgage | With Mortgage |
| Less than $50,000 | 3 (1.8%) | 3 (1.4%) |
| $50,000 to $99,999 | 0 (0.0%) | 0 (0.0%) |
| $100,000 to $299,999 | 5 (3.0%) | 20 (9.1%) |
| $300,000 to $499,999 | 12 (7.2%) | 35 (16.0%) |
| $500,000 to $749,999 | 41 (24.7%) | 84 (38.4%) |
| $750,000 to $999,999 | 21 (12.7%) | 41 (18.7%) |
| $1,000,000 or more | 84 (50.6%) | 36 (16.4%) |
| Total | 166 (100.0%) | 219 (100.0%) |
Household Income by Mortgage Status in Dellwood
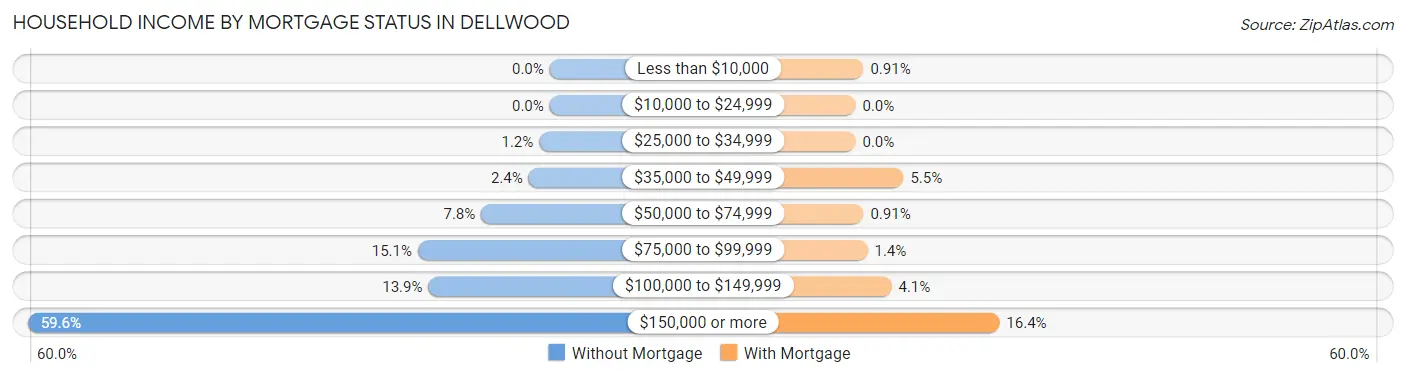
| Household Income | Without Mortgage | With Mortgage |
| Less than $10,000 | 0 (0.0%) | 2 (0.9%) |
| $10,000 to $24,999 | 0 (0.0%) | 0 (0.0%) |
| $25,000 to $34,999 | 2 (1.2%) | 0 (0.0%) |
| $35,000 to $49,999 | 4 (2.4%) | 12 (5.5%) |
| $50,000 to $74,999 | 13 (7.8%) | 2 (0.9%) |
| $75,000 to $99,999 | 25 (15.1%) | 3 (1.4%) |
| $100,000 to $149,999 | 23 (13.9%) | 9 (4.1%) |
| $150,000 or more | 99 (59.6%) | 36 (16.4%) |
| Total | 166 (100.0%) | 219 (100.0%) |
Property Value to Household Income Ratio in Dellwood
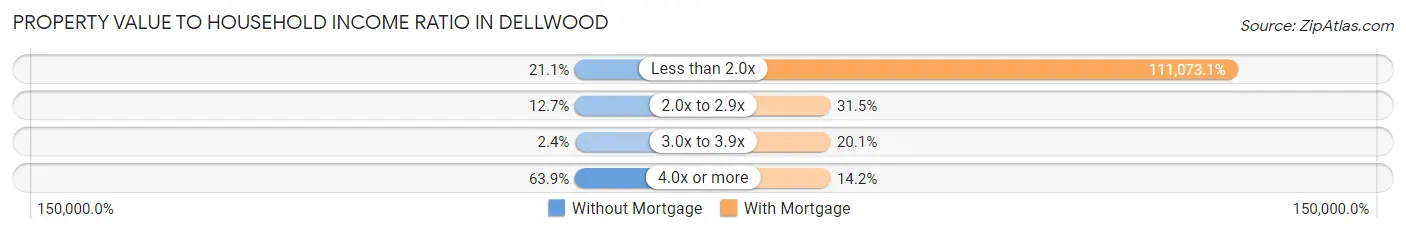
| Value-to-Income Ratio | Without Mortgage | With Mortgage |
| Less than 2.0x | 35 (21.1%) | 243,250 (111,073.1%) |
| 2.0x to 2.9x | 21 (12.7%) | 69 (31.5%) |
| 3.0x to 3.9x | 4 (2.4%) | 44 (20.1%) |
| 4.0x or more | 106 (63.9%) | 31 (14.2%) |
| Total | 166 (100.0%) | 219 (100.0%) |
Real Estate Taxes by Mortgage Status in Dellwood
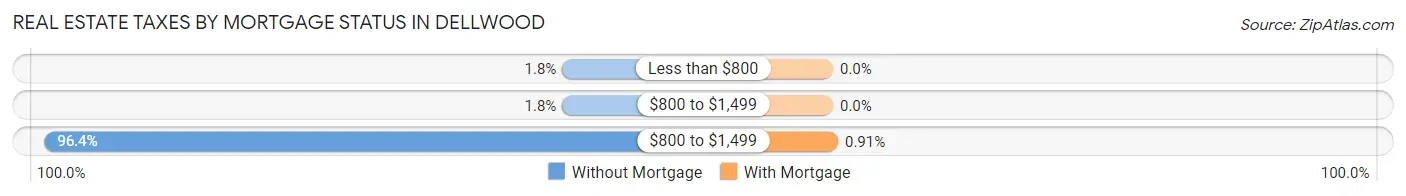
| Property Taxes | Without Mortgage | With Mortgage |
| Less than $800 | 3 (1.8%) | 0 (0.0%) |
| $800 to $1,499 | 3 (1.8%) | 0 (0.0%) |
| $800 to $1,499 | 160 (96.4%) | 2 (0.9%) |
| Total | 166 (100.0%) | 219 (100.0%) |
Health & Disability in Dellwood
Health Insurance Coverage by Age in Dellwood
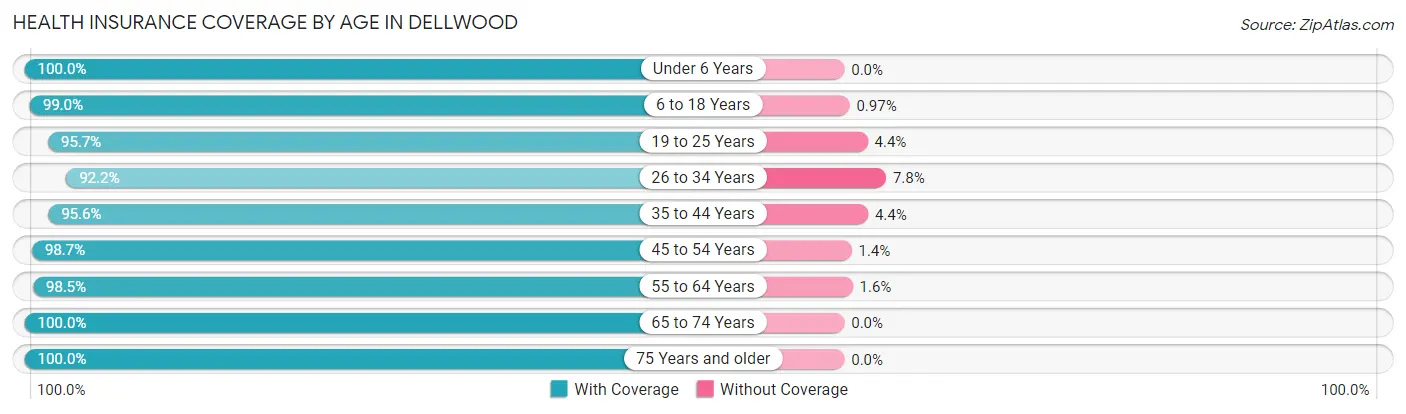
| Age Bracket | With Coverage | Without Coverage |
| Under 6 Years | 120 (100.0%) | 0 (0.0%) |
| 6 to 18 Years | 204 (99.0%) | 2 (1.0%) |
| 19 to 25 Years | 66 (95.7%) | 3 (4.3%) |
| 26 to 34 Years | 95 (92.2%) | 8 (7.8%) |
| 35 to 44 Years | 130 (95.6%) | 6 (4.4%) |
| 45 to 54 Years | 146 (98.7%) | 2 (1.3%) |
| 55 to 64 Years | 191 (98.5%) | 3 (1.5%) |
| 65 to 74 Years | 165 (100.0%) | 0 (0.0%) |
| 75 Years and older | 87 (100.0%) | 0 (0.0%) |
| Total | 1,204 (98.1%) | 24 (1.9%) |
Health Insurance Coverage by Citizenship Status in Dellwood
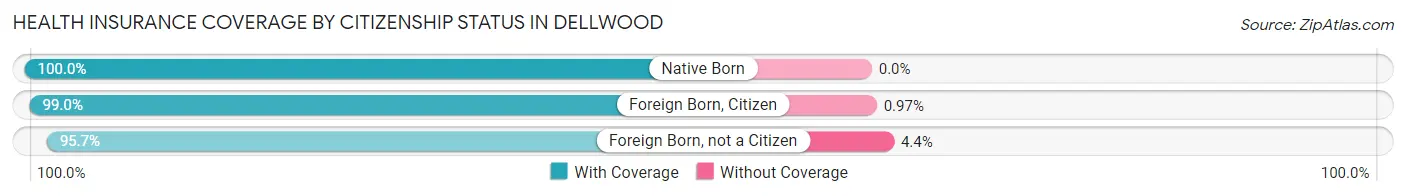
| Citizenship Status | With Coverage | Without Coverage |
| Native Born | 120 (100.0%) | 0 (0.0%) |
| Foreign Born, Citizen | 204 (99.0%) | 2 (1.0%) |
| Foreign Born, not a Citizen | 66 (95.7%) | 3 (4.3%) |
Health Insurance Coverage by Household Income in Dellwood
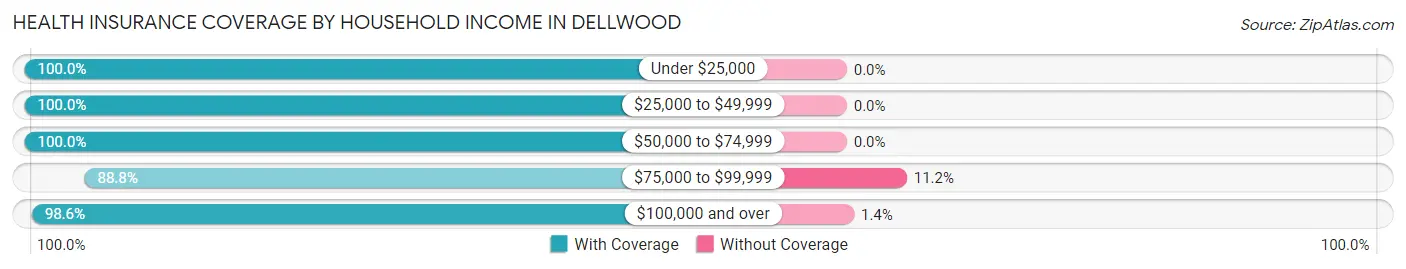
| Household Income | With Coverage | Without Coverage |
| Under $25,000 | 3 (100.0%) | 0 (0.0%) |
| $25,000 to $49,999 | 69 (100.0%) | 0 (0.0%) |
| $50,000 to $74,999 | 35 (100.0%) | 0 (0.0%) |
| $75,000 to $99,999 | 79 (88.8%) | 10 (11.2%) |
| $100,000 and over | 1,013 (98.6%) | 14 (1.4%) |
Public vs Private Health Insurance Coverage by Age in Dellwood
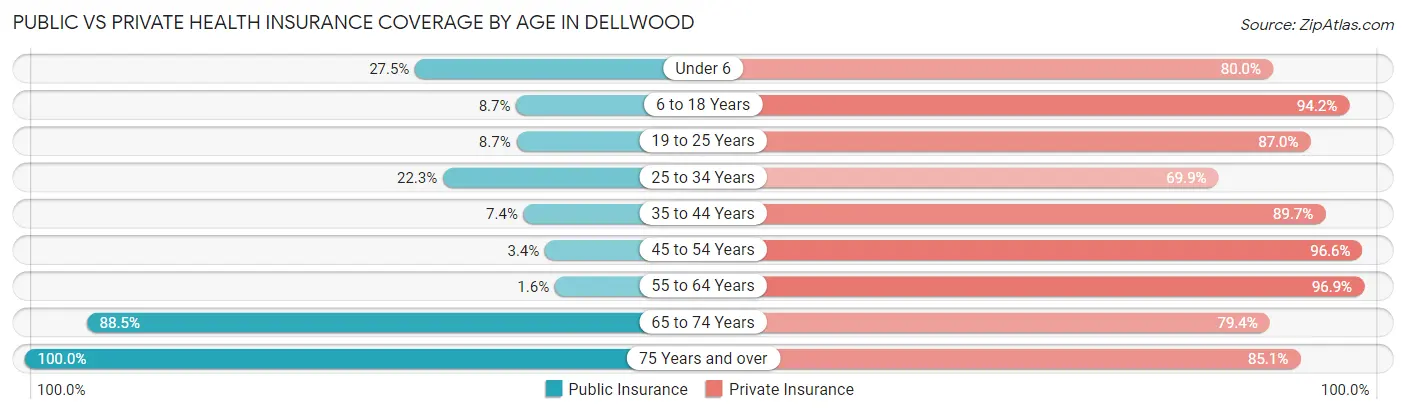
| Age Bracket | Public Insurance | Private Insurance |
| Under 6 | 33 (27.5%) | 96 (80.0%) |
| 6 to 18 Years | 18 (8.7%) | 194 (94.2%) |
| 19 to 25 Years | 6 (8.7%) | 60 (87.0%) |
| 25 to 34 Years | 23 (22.3%) | 72 (69.9%) |
| 35 to 44 Years | 10 (7.3%) | 122 (89.7%) |
| 45 to 54 Years | 5 (3.4%) | 143 (96.6%) |
| 55 to 64 Years | 3 (1.5%) | 188 (96.9%) |
| 65 to 74 Years | 146 (88.5%) | 131 (79.4%) |
| 75 Years and over | 87 (100.0%) | 74 (85.1%) |
| Total | 331 (27.0%) | 1,080 (87.9%) |
Disability Status by Sex by Age in Dellwood
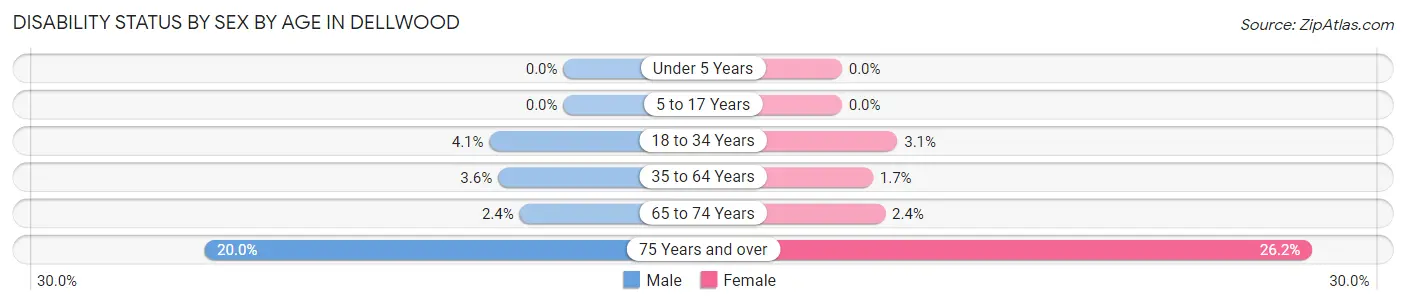
| Age Bracket | Male | Female |
| Under 5 Years | 0 (0.0%) | 0 (0.0%) |
| 5 to 17 Years | 0 (0.0%) | 0 (0.0%) |
| 18 to 34 Years | 4 (4.1%) | 3 (3.1%) |
| 35 to 64 Years | 9 (3.6%) | 4 (1.7%) |
| 65 to 74 Years | 2 (2.4%) | 2 (2.4%) |
| 75 Years and over | 9 (20.0%) | 11 (26.2%) |
Disability Class by Sex by Age in Dellwood
Disability Class: Hearing Difficulty
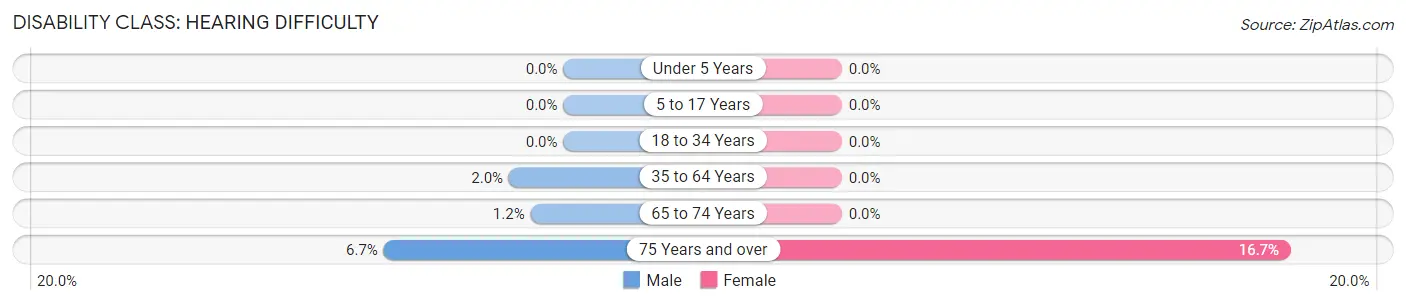
| Age Bracket | Male | Female |
| Under 5 Years | 0 (0.0%) | 0 (0.0%) |
| 5 to 17 Years | 0 (0.0%) | 0 (0.0%) |
| 18 to 34 Years | 0 (0.0%) | 0 (0.0%) |
| 35 to 64 Years | 5 (2.0%) | 0 (0.0%) |
| 65 to 74 Years | 1 (1.2%) | 0 (0.0%) |
| 75 Years and over | 3 (6.7%) | 7 (16.7%) |
Disability Class: Vision Difficulty
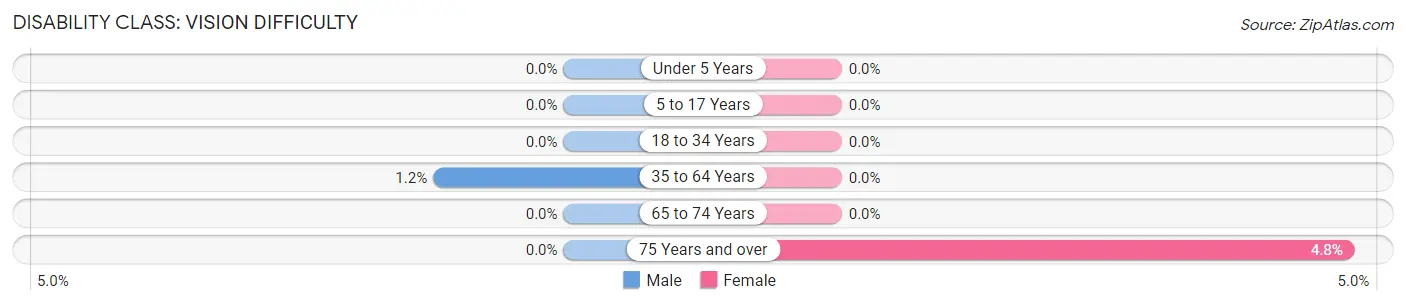
| Age Bracket | Male | Female |
| Under 5 Years | 0 (0.0%) | 0 (0.0%) |
| 5 to 17 Years | 0 (0.0%) | 0 (0.0%) |
| 18 to 34 Years | 0 (0.0%) | 0 (0.0%) |
| 35 to 64 Years | 3 (1.2%) | 0 (0.0%) |
| 65 to 74 Years | 0 (0.0%) | 0 (0.0%) |
| 75 Years and over | 0 (0.0%) | 2 (4.8%) |
Disability Class: Cognitive Difficulty
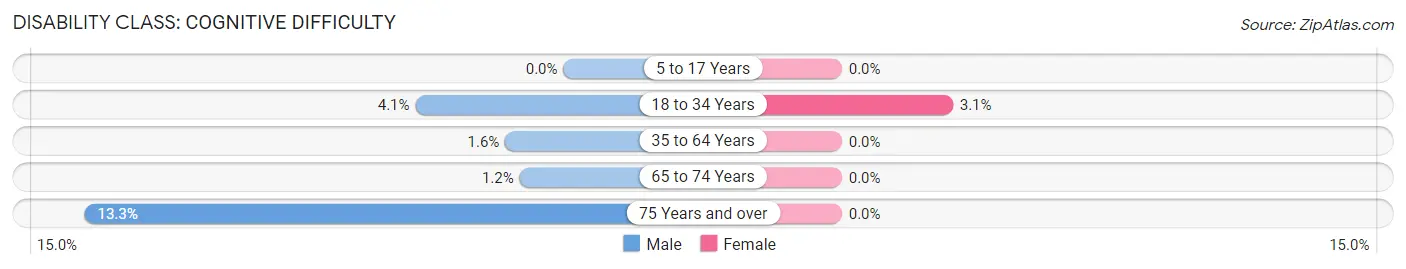
| Age Bracket | Male | Female |
| 5 to 17 Years | 0 (0.0%) | 0 (0.0%) |
| 18 to 34 Years | 4 (4.1%) | 3 (3.1%) |
| 35 to 64 Years | 4 (1.6%) | 0 (0.0%) |
| 65 to 74 Years | 1 (1.2%) | 0 (0.0%) |
| 75 Years and over | 6 (13.3%) | 0 (0.0%) |
Disability Class: Ambulatory Difficulty
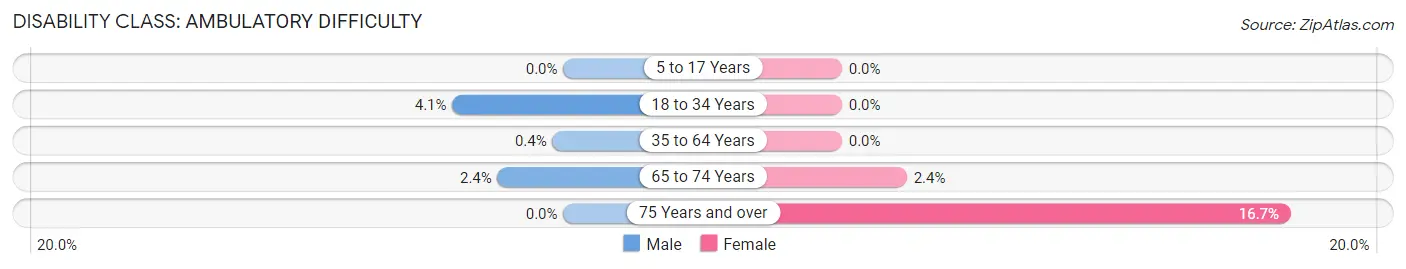
| Age Bracket | Male | Female |
| 5 to 17 Years | 0 (0.0%) | 0 (0.0%) |
| 18 to 34 Years | 4 (4.1%) | 0 (0.0%) |
| 35 to 64 Years | 1 (0.4%) | 0 (0.0%) |
| 65 to 74 Years | 2 (2.4%) | 2 (2.4%) |
| 75 Years and over | 0 (0.0%) | 7 (16.7%) |
Disability Class: Self-Care Difficulty
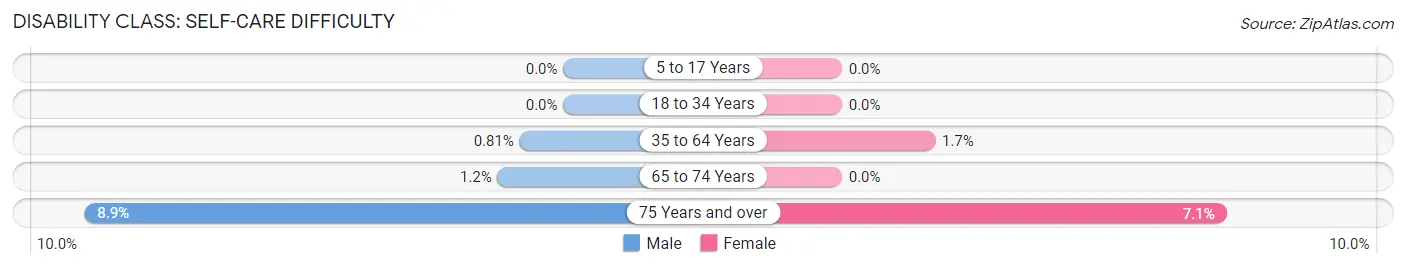
| Age Bracket | Male | Female |
| 5 to 17 Years | 0 (0.0%) | 0 (0.0%) |
| 18 to 34 Years | 0 (0.0%) | 0 (0.0%) |
| 35 to 64 Years | 2 (0.8%) | 4 (1.7%) |
| 65 to 74 Years | 1 (1.2%) | 0 (0.0%) |
| 75 Years and over | 4 (8.9%) | 3 (7.1%) |
Technology Access in Dellwood
Computing Device Access in Dellwood
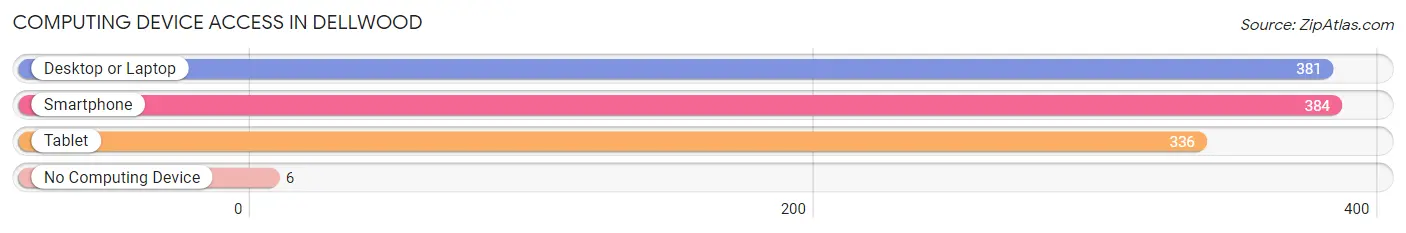
| Device Type | # Households | % Households |
| Desktop or Laptop | 381 | 95.3% |
| Smartphone | 384 | 96.0% |
| Tablet | 336 | 84.0% |
| No Computing Device | 6 | 1.5% |
| Total | 400 | 100.0% |
Internet Access in Dellwood
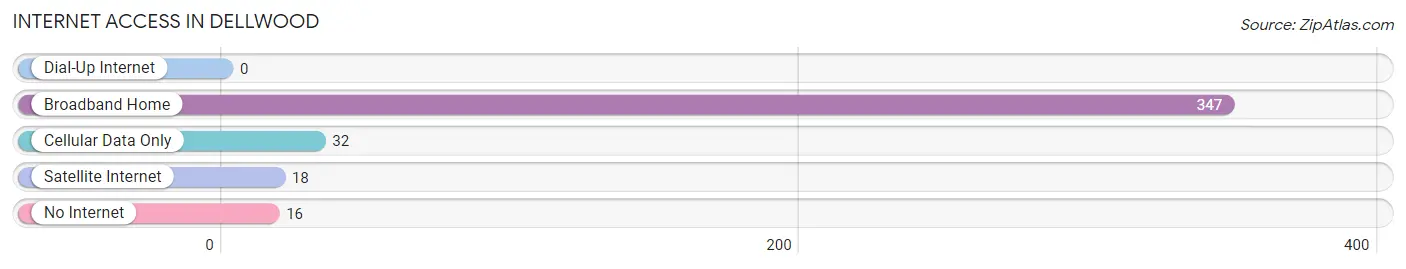
| Internet Type | # Households | % Households |
| Dial-Up Internet | 0 | 0.0% |
| Broadband Home | 347 | 86.8% |
| Cellular Data Only | 32 | 8.0% |
| Satellite Internet | 18 | 4.5% |
| No Internet | 16 | 4.0% |
| Total | 400 | 100.0% |
Dellwood Summary
Dellwood is a small city located in Washington County, Minnesota, United States. It is situated on the north shore of White Bear Lake, approximately 20 miles northeast of Minneapolis. The city was incorporated in 1957 and has a population of approximately 2,500 people.
History
The area that is now Dellwood was originally inhabited by the Dakota Sioux. The first white settlers arrived in the area in the late 1800s and began to farm the land. In the early 1900s, the area began to develop as a resort destination, with the construction of several hotels and resorts. The area was known as White Bear Lake Village until 1957, when it was incorporated as the City of Dellwood.
Geography
Dellwood is located in Washington County, Minnesota, approximately 20 miles northeast of Minneapolis. It is situated on the north shore of White Bear Lake, a large lake that covers approximately 4,400 acres. The city is bordered by the cities of White Bear Lake, Mahtomedi, and Birchwood. The city has a total area of 1.2 square miles, all of which is land.
Economy
Dellwood’s economy is largely based on tourism and recreation. The city is home to several resorts and hotels, as well as a variety of restaurants and shops. The city also has a number of parks and recreational areas, including a public beach on White Bear Lake.
Demographics
As of the 2010 census, Dellwood had a population of 2,521 people. The racial makeup of the city was 94.3% White, 1.2% African American, 0.3% Native American, 1.2% Asian, 0.1% Pacific Islander, 1.2% from other races, and 1.9% from two or more races. Hispanic or Latino of any race were 3.2% of the population.
The median household income in Dellwood was $63,958, and the median family income was $76,944. The per capita income for the city was $30,945. About 4.2% of families and 5.7% of the population were below the poverty line, including 6.3% of those under age 18 and 4.2% of those age 65 or over.
Conclusion
Dellwood is a small city located in Washington County, Minnesota, United States. It is situated on the north shore of White Bear Lake, approximately 20 miles northeast of Minneapolis. The city was incorporated in 1957 and has a population of approximately 2,500 people. Dellwood’s economy is largely based on tourism and recreation, and the city is home to several resorts and hotels, as well as a variety of restaurants and shops. The racial makeup of the city is 94.3% White, 1.2% African American, 0.3% Native American, 1.2% Asian, 0.1% Pacific Islander, 1.2% from other races, and 1.9% from two or more races. The median household income in Dellwood was $63,958, and the median family income was $76,944.
Common Questions
What is Per Capita Income in Dellwood?
Per Capita income in Dellwood is $94,775.
What is the Median Family Income in Dellwood?
Median Family Income in Dellwood is $233,375.
What is the Median Household income in Dellwood?
Median Household Income in Dellwood is $216,000.
What is Income or Wage Gap in Dellwood?
Income or Wage Gap in Dellwood is 38.0%.
Women in Dellwood earn 62.0 cents for every dollar earned by a man.
What is Inequality or Gini Index in Dellwood?
Inequality or Gini Index in Dellwood is 0.44.
What is the Total Population of Dellwood?
Total Population of Dellwood is 1,228.
What is the Total Male Population of Dellwood?
Total Male Population of Dellwood is 614.
What is the Total Female Population of Dellwood?
Total Female Population of Dellwood is 614.
What is the Ratio of Males per 100 Females in Dellwood?
There are 100.00 Males per 100 Females in Dellwood.
What is the Ratio of Females per 100 Males in Dellwood?
There are 100.00 Females per 100 Males in Dellwood.
What is the Median Population Age in Dellwood?
Median Population Age in Dellwood is 44.1 Years.
What is the Average Family Size in Dellwood
Average Family Size in Dellwood is 3.3 People.
What is the Average Household Size in Dellwood
Average Household Size in Dellwood is 3.1 People.
How Large is the Labor Force in Dellwood?
There are 597 People in the Labor Forcein in Dellwood.
What is the Percentage of People in the Labor Force in Dellwood?
62.8% of People are in the Labor Force in Dellwood.
What is the Unemployment Rate in Dellwood?
Unemployment Rate in Dellwood is 2.5%.