Littlefork, MN Map & Demographics
Littlefork Map
Littlefork Overview
$37,649
PER CAPITA INCOME
$107,188
AVG FAMILY INCOME
$58,641
AVG HOUSEHOLD INCOME
0.37
INEQUALITY / GINI INDEX
611
TOTAL POPULATION
287
MALE POPULATION
324
FEMALE POPULATION
88.58
MALES / 100 FEMALES
112.89
FEMALES / 100 MALES
51.7
MEDIAN AGE
2.9
AVG FAMILY SIZE
2.0
AVG HOUSEHOLD SIZE
326
LABOR FORCE [ PEOPLE ]
59.6%
PERCENT IN LABOR FORCE
1.5%
UNEMPLOYMENT RATE
Littlefork Zip Codes
Littlefork Area Codes
Income in Littlefork
Income Overview in Littlefork
Per Capita Income in Littlefork is $37,649, while median incomes of families and households are $107,188 and $58,641 respectively.
| Characteristic | Number | Measure |
| Per Capita Income | 611 | $37,649 |
| Median Family Income | 140 | $107,188 |
| Mean Family Income | 140 | $97,455 |
| Median Household Income | 281 | $58,641 |
| Mean Household Income | 281 | $73,766 |
| Income Deficit | 140 | $0 |
| Wage / Income Gap (%) | 611 | 0.00% |
| Wage / Income Gap ($) | 611 | 100.00¢ per $1 |
| Gini / Inequality Index | 611 | 0.37 |
Earnings by Sex in Littlefork
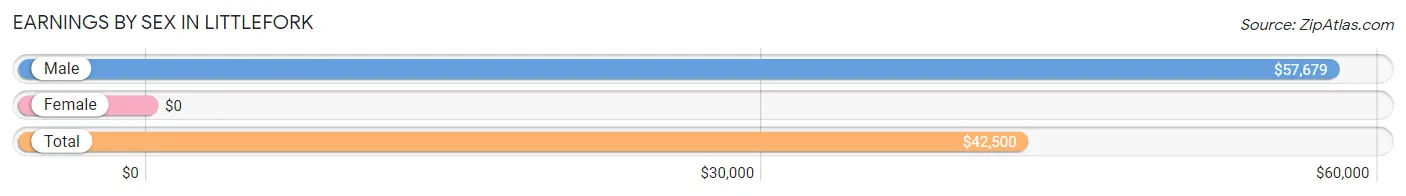
| Sex | Number | Average Earnings |
| Male | 227 (61.7%) | $57,679 |
| Female | 141 (38.3%) | $0 |
| Total | 368 (100.0%) | $42,500 |
Earnings by Sex by Income Bracket in Littlefork
The most common earnings brackets in Littlefork are $100,000+ for men (49 | 21.6%) and $35,000 to $39,999 for women (24 | 17.0%).
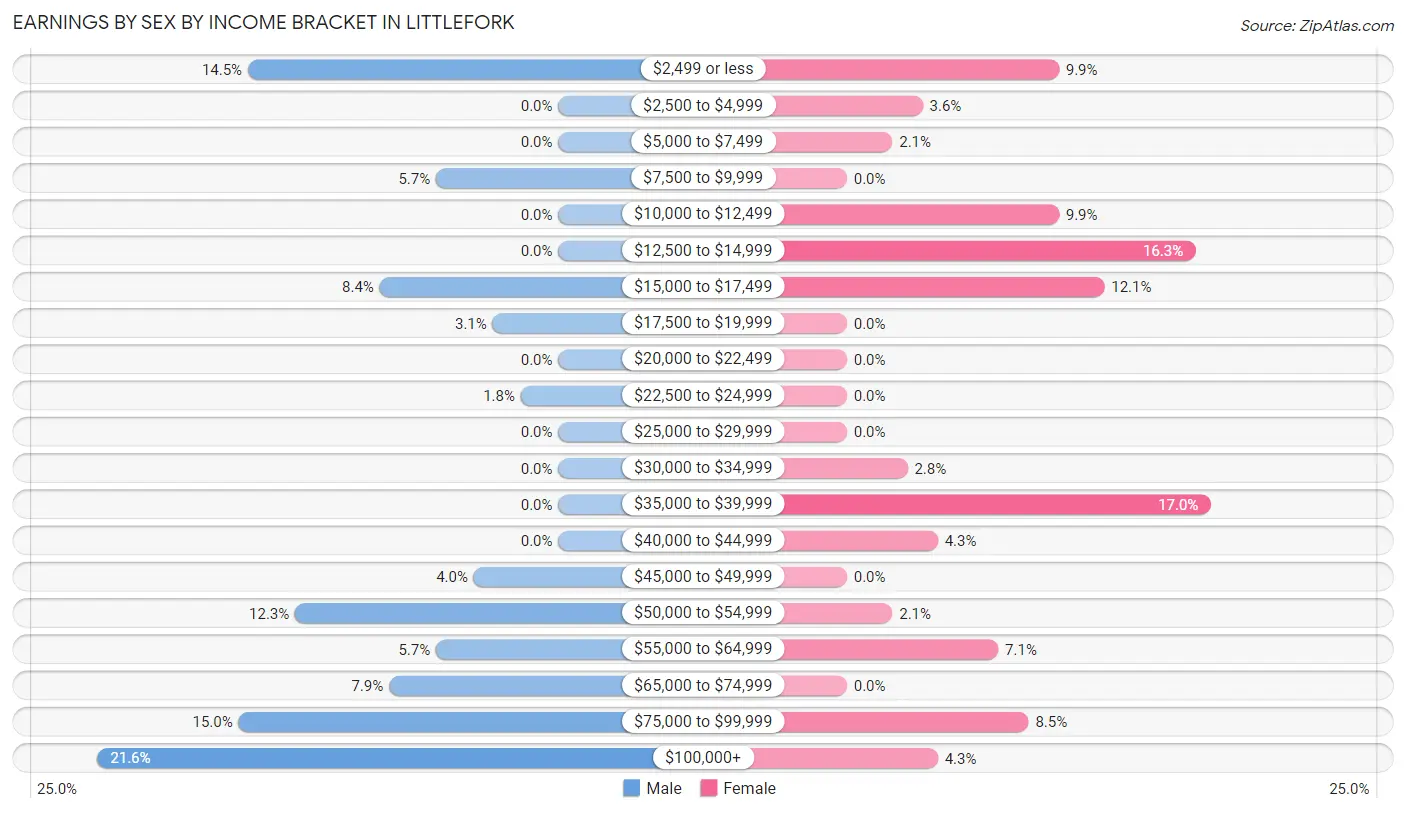
| Income | Male | Female |
| $2,499 or less | 33 (14.5%) | 14 (9.9%) |
| $2,500 to $4,999 | 0 (0.0%) | 5 (3.5%) |
| $5,000 to $7,499 | 0 (0.0%) | 3 (2.1%) |
| $7,500 to $9,999 | 13 (5.7%) | 0 (0.0%) |
| $10,000 to $12,499 | 0 (0.0%) | 14 (9.9%) |
| $12,500 to $14,999 | 0 (0.0%) | 23 (16.3%) |
| $15,000 to $17,499 | 19 (8.4%) | 17 (12.1%) |
| $17,500 to $19,999 | 7 (3.1%) | 0 (0.0%) |
| $20,000 to $22,499 | 0 (0.0%) | 0 (0.0%) |
| $22,500 to $24,999 | 4 (1.8%) | 0 (0.0%) |
| $25,000 to $29,999 | 0 (0.0%) | 0 (0.0%) |
| $30,000 to $34,999 | 0 (0.0%) | 4 (2.8%) |
| $35,000 to $39,999 | 0 (0.0%) | 24 (17.0%) |
| $40,000 to $44,999 | 0 (0.0%) | 6 (4.3%) |
| $45,000 to $49,999 | 9 (4.0%) | 0 (0.0%) |
| $50,000 to $54,999 | 28 (12.3%) | 3 (2.1%) |
| $55,000 to $64,999 | 13 (5.7%) | 10 (7.1%) |
| $65,000 to $74,999 | 18 (7.9%) | 0 (0.0%) |
| $75,000 to $99,999 | 34 (15.0%) | 12 (8.5%) |
| $100,000+ | 49 (21.6%) | 6 (4.3%) |
| Total | 227 (100.0%) | 141 (100.0%) |
Earnings by Sex by Educational Attainment in Littlefork
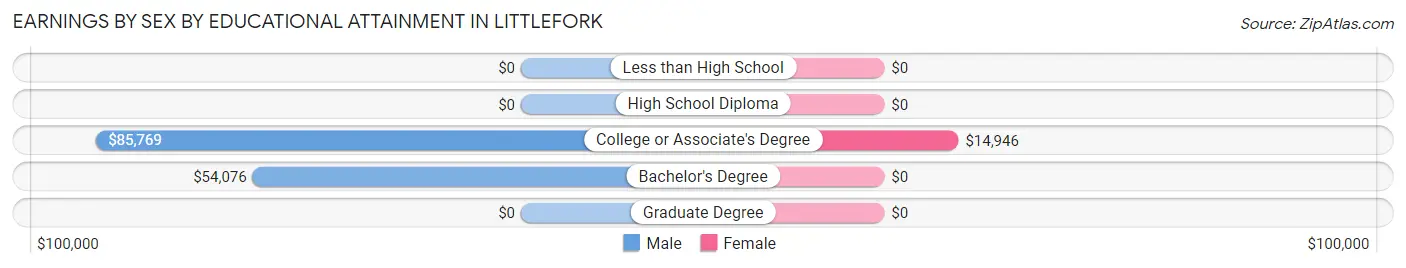
| Educational Attainment | Male Income | Female Income |
| Less than High School | - | - |
| High School Diploma | - | - |
| College or Associate's Degree | $85,769 | $14,946 |
| Bachelor's Degree | $54,076 | $0 |
| Graduate Degree | - | - |
| Total | $64,583 | $0 |
Family Income in Littlefork
Family Income Brackets in Littlefork
According to the Littlefork family income data, there are 52 families falling into the $100,000 to $149,999 income range, which is the most common income bracket and makes up 37.1% of all families.
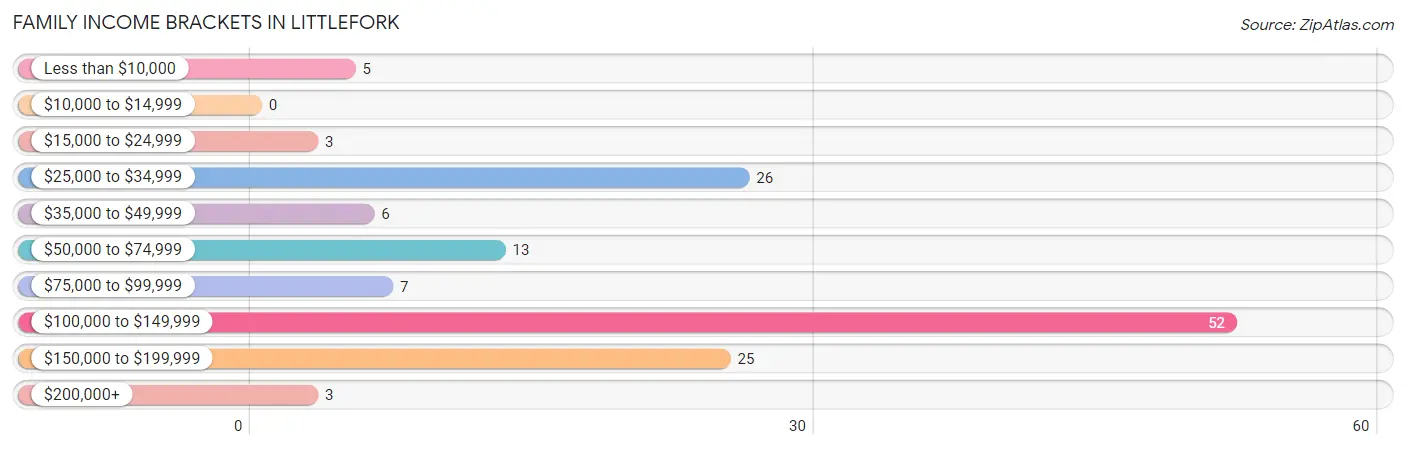
| Income Bracket | # Families | % Families |
| Less than $10,000 | 5 | 3.6% |
| $10,000 to $14,999 | 0 | 0.0% |
| $15,000 to $24,999 | 3 | 2.1% |
| $25,000 to $34,999 | 26 | 18.6% |
| $35,000 to $49,999 | 6 | 4.3% |
| $50,000 to $74,999 | 13 | 9.3% |
| $75,000 to $99,999 | 7 | 5.0% |
| $100,000 to $149,999 | 52 | 37.1% |
| $150,000 to $199,999 | 25 | 17.9% |
| $200,000+ | 3 | 2.1% |
Family Income by Famaliy Size in Littlefork
2-person families (65 | 46.4%) account for the highest median family income in Littlefork with $107,344 per family, while 2-person families (65 | 46.4%) have the highest median income of $53,672 per family member.
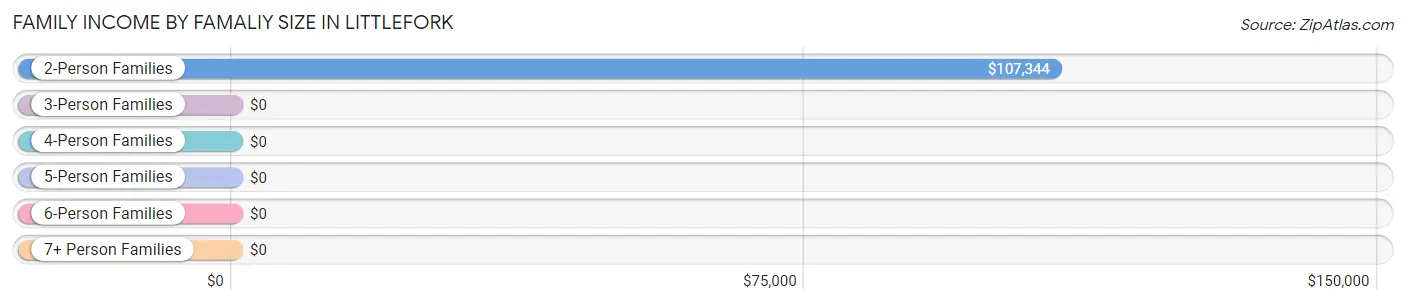
| Income Bracket | # Families | Median Income |
| 2-Person Families | 65 (46.4%) | $107,344 |
| 3-Person Families | 6 (4.3%) | $0 |
| 4-Person Families | 55 (39.3%) | $0 |
| 5-Person Families | 14 (10.0%) | $0 |
| 6-Person Families | 0 (0.0%) | $0 |
| 7+ Person Families | 0 (0.0%) | $0 |
| Total | 140 (100.0%) | $107,188 |
Family Income by Number of Earners in Littlefork
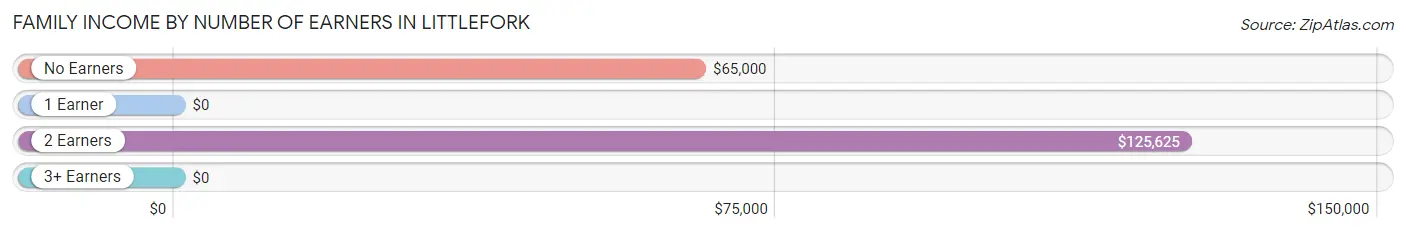
| Number of Earners | # Families | Median Income |
| No Earners | 20 (14.3%) | $65,000 |
| 1 Earner | 20 (14.3%) | $0 |
| 2 Earners | 59 (42.1%) | $125,625 |
| 3+ Earners | 41 (29.3%) | $0 |
| Total | 140 (100.0%) | $107,188 |
Household Income in Littlefork
Household Income Brackets in Littlefork
With 60 households falling in the category, the $50,000 to $74,999 income range is the most frequent in Littlefork, accounting for 21.3% of all households. In contrast, only 3 households (1.1%) fall into the $200,000+ income bracket, making it the least populous group.
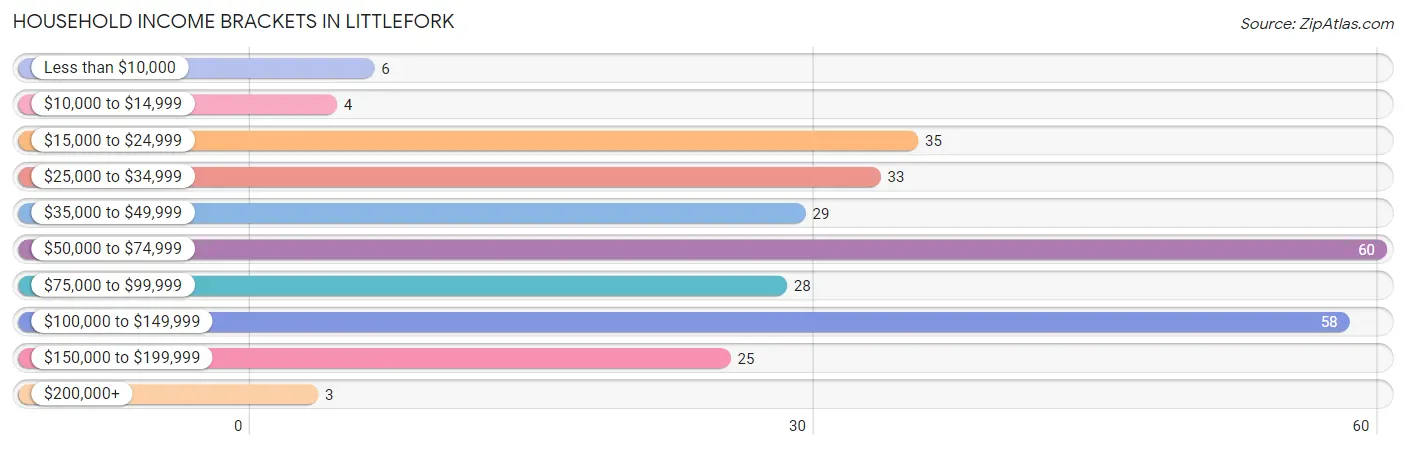
| Income Bracket | # Households | % Households |
| Less than $10,000 | 6 | 2.1% |
| $10,000 to $14,999 | 4 | 1.4% |
| $15,000 to $24,999 | 35 | 12.5% |
| $25,000 to $34,999 | 33 | 11.7% |
| $35,000 to $49,999 | 29 | 10.3% |
| $50,000 to $74,999 | 60 | 21.4% |
| $75,000 to $99,999 | 28 | 10.0% |
| $100,000 to $149,999 | 58 | 20.6% |
| $150,000 to $199,999 | 25 | 8.9% |
| $200,000+ | 3 | 1.1% |
Household Income by Householder Age in Littlefork
The median household income in Littlefork is $58,641, with the highest median household income of $101,667 found in the 45 to 64 years age bracket for the primary householder. A total of 116 households (41.3%) fall into this category. Meanwhile, the 15 to 24 years age bracket for the primary householder has the lowest median household income of $0, with 4 households (1.4%) in this group.
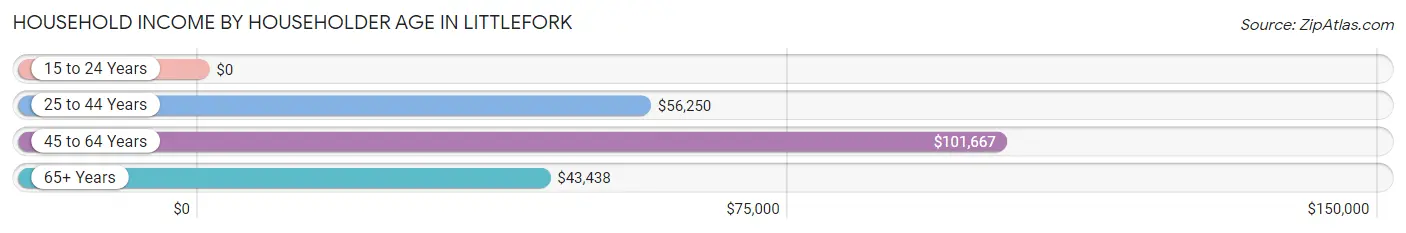
| Income Bracket | # Households | Median Income |
| 15 to 24 Years | 4 (1.4%) | $0 |
| 25 to 44 Years | 68 (24.2%) | $56,250 |
| 45 to 64 Years | 116 (41.3%) | $101,667 |
| 65+ Years | 93 (33.1%) | $43,438 |
| Total | 281 (100.0%) | $58,641 |
Poverty in Littlefork
Income Below Poverty by Sex and Age in Littlefork
With 4.5% poverty level for males and 5.9% for females among the residents of Littlefork, 35 to 44 year old males and 25 to 34 year old females are the most vulnerable to poverty, with 10 males (27.0%) and 5 females (21.7%) in their respective age groups living below the poverty level.
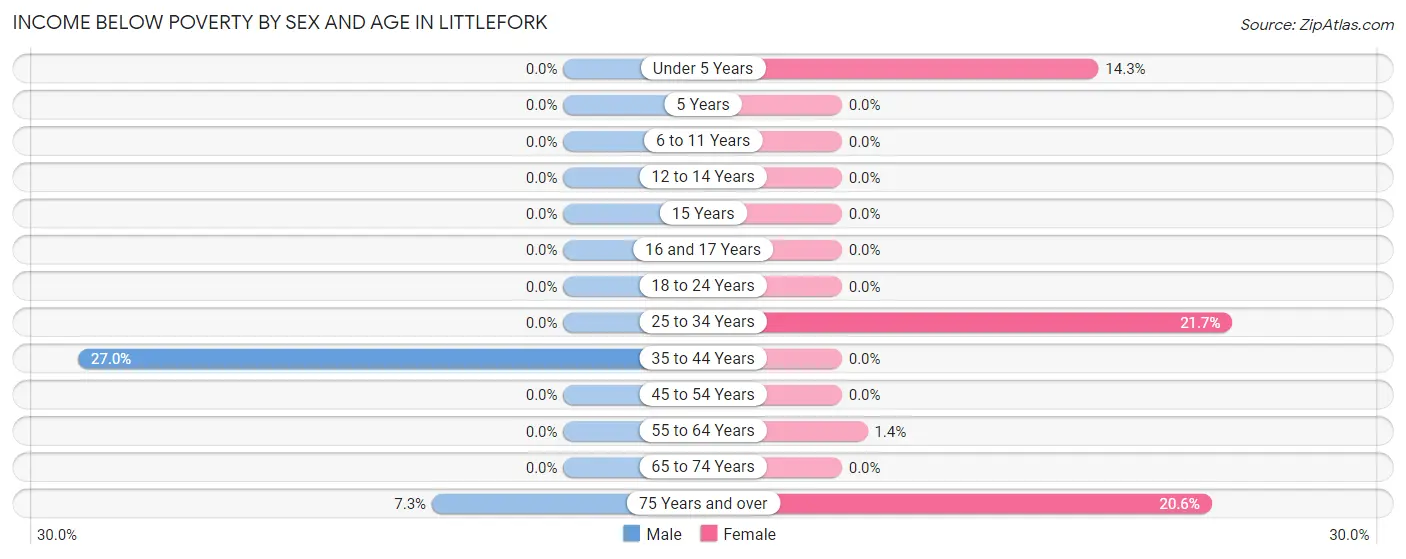
| Age Bracket | Male | Female |
| Under 5 Years | 0 (0.0%) | 3 (14.3%) |
| 5 Years | 0 (0.0%) | 0 (0.0%) |
| 6 to 11 Years | 0 (0.0%) | 0 (0.0%) |
| 12 to 14 Years | 0 (0.0%) | 0 (0.0%) |
| 15 Years | 0 (0.0%) | 0 (0.0%) |
| 16 and 17 Years | 0 (0.0%) | 0 (0.0%) |
| 18 to 24 Years | 0 (0.0%) | 0 (0.0%) |
| 25 to 34 Years | 0 (0.0%) | 5 (21.7%) |
| 35 to 44 Years | 10 (27.0%) | 0 (0.0%) |
| 45 to 54 Years | 0 (0.0%) | 0 (0.0%) |
| 55 to 64 Years | 0 (0.0%) | 1 (1.4%) |
| 65 to 74 Years | 0 (0.0%) | 0 (0.0%) |
| 75 Years and over | 3 (7.3%) | 7 (20.6%) |
| Total | 13 (4.5%) | 16 (5.9%) |
Income Above Poverty by Sex and Age in Littlefork
According to the poverty statistics in Littlefork, males aged 6 to 11 years and females aged 6 to 11 years are the age groups that are most secure financially, with 100.0% of males and 100.0% of females in these age groups living above the poverty line.
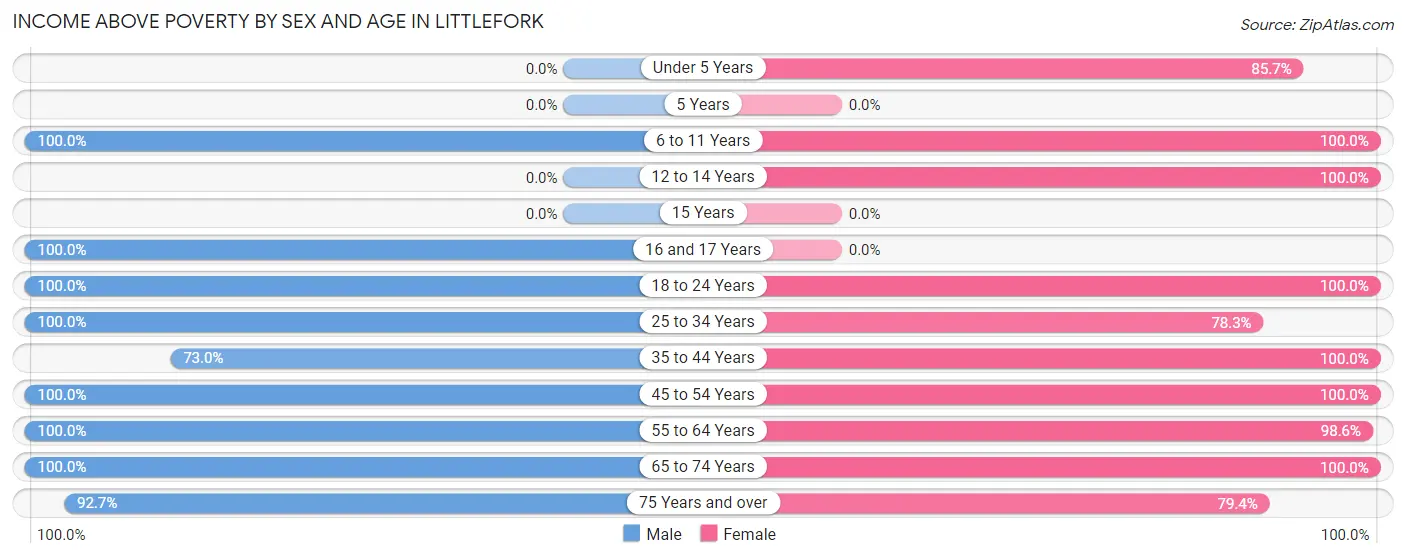
| Age Bracket | Male | Female |
| Under 5 Years | 0 (0.0%) | 18 (85.7%) |
| 5 Years | 0 (0.0%) | 0 (0.0%) |
| 6 to 11 Years | 1 (100.0%) | 18 (100.0%) |
| 12 to 14 Years | 0 (0.0%) | 24 (100.0%) |
| 15 Years | 0 (0.0%) | 0 (0.0%) |
| 16 and 17 Years | 7 (100.0%) | 0 (0.0%) |
| 18 to 24 Years | 17 (100.0%) | 18 (100.0%) |
| 25 to 34 Years | 48 (100.0%) | 18 (78.3%) |
| 35 to 44 Years | 27 (73.0%) | 23 (100.0%) |
| 45 to 54 Years | 58 (100.0%) | 26 (100.0%) |
| 55 to 64 Years | 53 (100.0%) | 69 (98.6%) |
| 65 to 74 Years | 25 (100.0%) | 13 (100.0%) |
| 75 Years and over | 38 (92.7%) | 27 (79.4%) |
| Total | 274 (95.5%) | 254 (94.1%) |
Income Below Poverty Among Married-Couple Families in Littlefork
The poverty statistics for married-couple families in Littlefork show that 2.3% or 3 of the total 128 families live below the poverty line. Families with no children have the highest poverty rate of 3.6%, comprising of 3 families. On the other hand, families with 1 or 2 children have the lowest poverty rate of 0.0%, which includes 0 families.
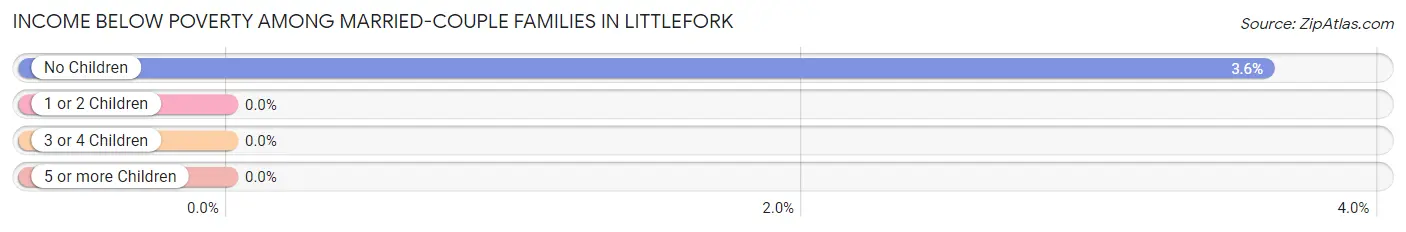
| Children | Above Poverty | Below Poverty |
| No Children | 80 (96.4%) | 3 (3.6%) |
| 1 or 2 Children | 38 (100.0%) | 0 (0.0%) |
| 3 or 4 Children | 7 (100.0%) | 0 (0.0%) |
| 5 or more Children | 0 (0.0%) | 0 (0.0%) |
| Total | 125 (97.7%) | 3 (2.3%) |
Income Below Poverty Among Single-Parent Households in Littlefork
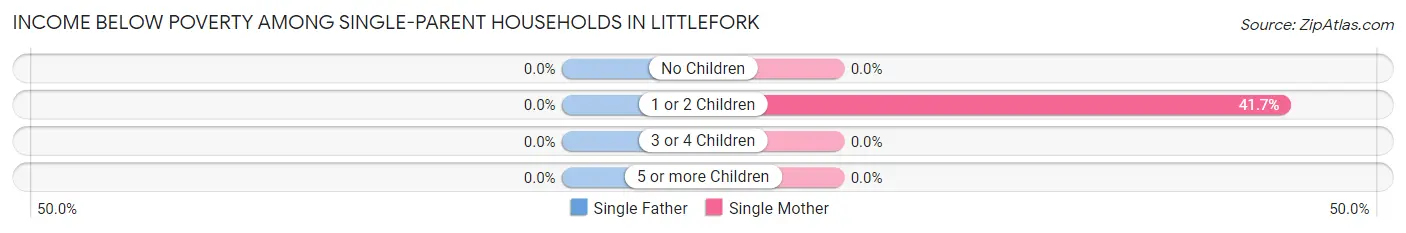
| Children | Single Father | Single Mother |
| No Children | 0 (0.0%) | 0 (0.0%) |
| 1 or 2 Children | 0 (0.0%) | 5 (41.7%) |
| 3 or 4 Children | 0 (0.0%) | 0 (0.0%) |
| 5 or more Children | 0 (0.0%) | 0 (0.0%) |
| Total | 0 (0.0%) | 5 (41.7%) |
Income Below Poverty Among Married-Couple vs Single-Parent Households in Littlefork
The poverty data for Littlefork shows that 3 of the married-couple family households (2.3%) and 5 of the single-parent households (41.7%) are living below the poverty level. Within the married-couple family households, those with no children have the highest poverty rate, with 3 households (3.6%) falling below the poverty line. Among the single-parent households, those with 1 or 2 children have the highest poverty rate, with 5 household (41.7%) living below poverty.
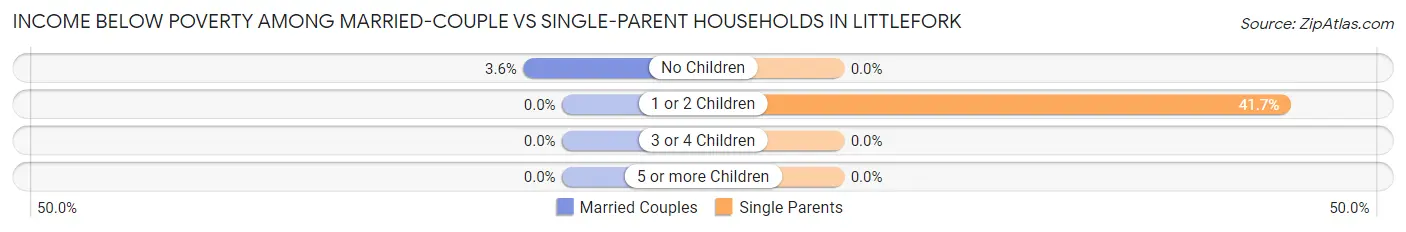
| Children | Married-Couple Families | Single-Parent Households |
| No Children | 3 (3.6%) | 0 (0.0%) |
| 1 or 2 Children | 0 (0.0%) | 5 (41.7%) |
| 3 or 4 Children | 0 (0.0%) | 0 (0.0%) |
| 5 or more Children | 0 (0.0%) | 0 (0.0%) |
| Total | 3 (2.3%) | 5 (41.7%) |
Race in Littlefork
The most populous races in Littlefork are White / Caucasian (601 | 98.4%), Hispanic or Latino (12 | 2.0%), and Native / Alaskan (8 | 1.3%).
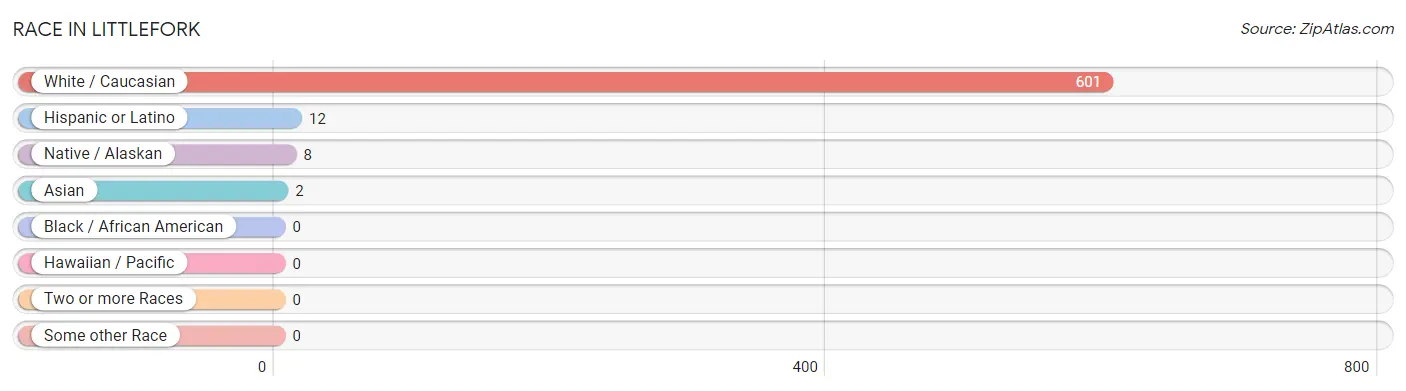
| Race | # Population | % Population |
| Asian | 2 | 0.3% |
| Black / African American | 0 | 0.0% |
| Hawaiian / Pacific | 0 | 0.0% |
| Hispanic or Latino | 12 | 2.0% |
| Native / Alaskan | 8 | 1.3% |
| White / Caucasian | 601 | 98.4% |
| Two or more Races | 0 | 0.0% |
| Some other Race | 0 | 0.0% |
| Total | 611 | 100.0% |
Ancestry in Littlefork
The most populous ancestries reported in Littlefork are German (246 | 40.3%), Norwegian (130 | 21.3%), Irish (120 | 19.6%), English (43 | 7.0%), and Scandinavian (41 | 6.7%), together accounting for 94.9% of all Littlefork residents.
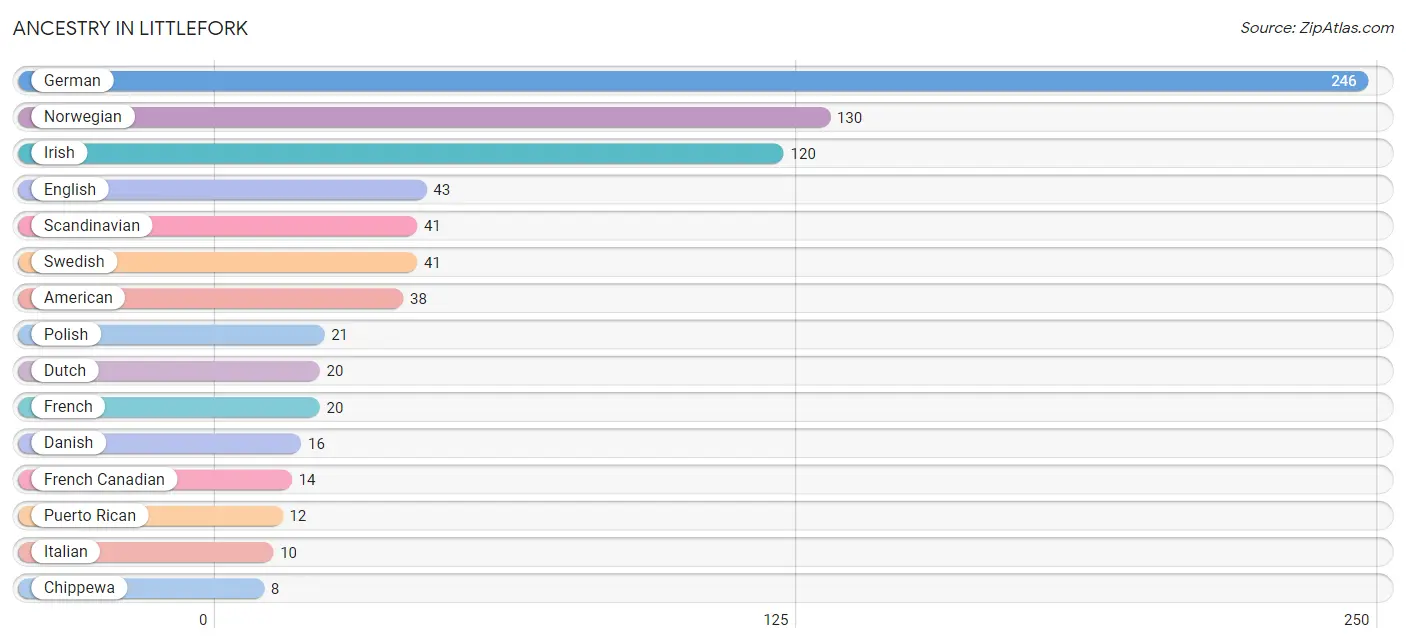
| Ancestry | # Population | % Population |
| American | 38 | 6.2% |
| Bhutanese | 2 | 0.3% |
| Chippewa | 8 | 1.3% |
| Danish | 16 | 2.6% |
| Dutch | 20 | 3.3% |
| English | 43 | 7.0% |
| European | 7 | 1.1% |
| Finnish | 4 | 0.6% |
| French | 20 | 3.3% |
| French Canadian | 14 | 2.3% |
| German | 246 | 40.3% |
| Hungarian | 4 | 0.6% |
| Irish | 120 | 19.6% |
| Italian | 10 | 1.6% |
| Northern European | 7 | 1.1% |
| Norwegian | 130 | 21.3% |
| Polish | 21 | 3.4% |
| Puerto Rican | 12 | 2.0% |
| Scandinavian | 41 | 6.7% |
| Swedish | 41 | 6.7% |
| Swiss | 5 | 0.8% | View All 21 Rows |
Immigrants in Littlefork
The most numerous immigrant groups reported in Littlefork came from Asia (2 | 0.3%), Eastern Asia (2 | 0.3%), Japan (2 | 0.3%), Europe (1 | 0.2%), and Netherlands (1 | 0.2%), together accounting for 1.3% of all Littlefork residents.
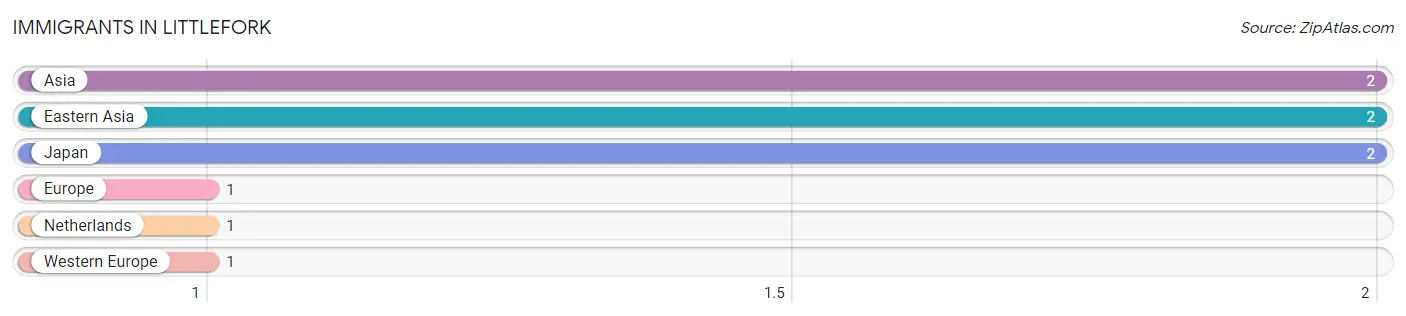
| Immigration Origin | # Population | % Population |
| Asia | 2 | 0.3% |
| Eastern Asia | 2 | 0.3% |
| Europe | 1 | 0.2% |
| Japan | 2 | 0.3% |
| Netherlands | 1 | 0.2% |
| Western Europe | 1 | 0.2% | View All 6 Rows |
Sex and Age in Littlefork
Sex and Age in Littlefork
The most populous age groups in Littlefork are 50 to 54 Years (51 | 17.8%) for men and 60 to 64 Years (45 | 13.9%) for women.
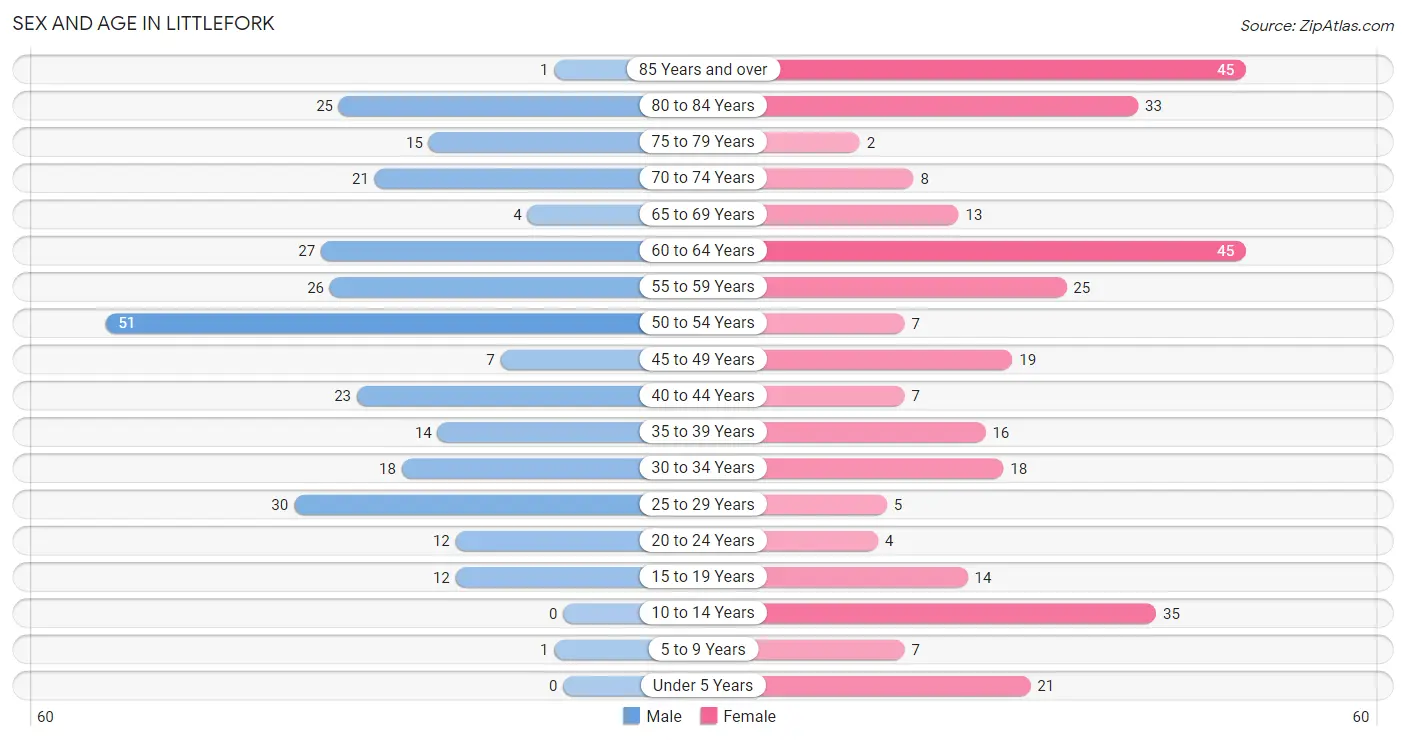
| Age Bracket | Male | Female |
| Under 5 Years | 0 (0.0%) | 21 (6.5%) |
| 5 to 9 Years | 1 (0.4%) | 7 (2.2%) |
| 10 to 14 Years | 0 (0.0%) | 35 (10.8%) |
| 15 to 19 Years | 12 (4.2%) | 14 (4.3%) |
| 20 to 24 Years | 12 (4.2%) | 4 (1.2%) |
| 25 to 29 Years | 30 (10.4%) | 5 (1.5%) |
| 30 to 34 Years | 18 (6.3%) | 18 (5.6%) |
| 35 to 39 Years | 14 (4.9%) | 16 (4.9%) |
| 40 to 44 Years | 23 (8.0%) | 7 (2.2%) |
| 45 to 49 Years | 7 (2.4%) | 19 (5.9%) |
| 50 to 54 Years | 51 (17.8%) | 7 (2.2%) |
| 55 to 59 Years | 26 (9.1%) | 25 (7.7%) |
| 60 to 64 Years | 27 (9.4%) | 45 (13.9%) |
| 65 to 69 Years | 4 (1.4%) | 13 (4.0%) |
| 70 to 74 Years | 21 (7.3%) | 8 (2.5%) |
| 75 to 79 Years | 15 (5.2%) | 2 (0.6%) |
| 80 to 84 Years | 25 (8.7%) | 33 (10.2%) |
| 85 Years and over | 1 (0.4%) | 45 (13.9%) |
| Total | 287 (100.0%) | 324 (100.0%) |
Families and Households in Littlefork
Median Family Size in Littlefork
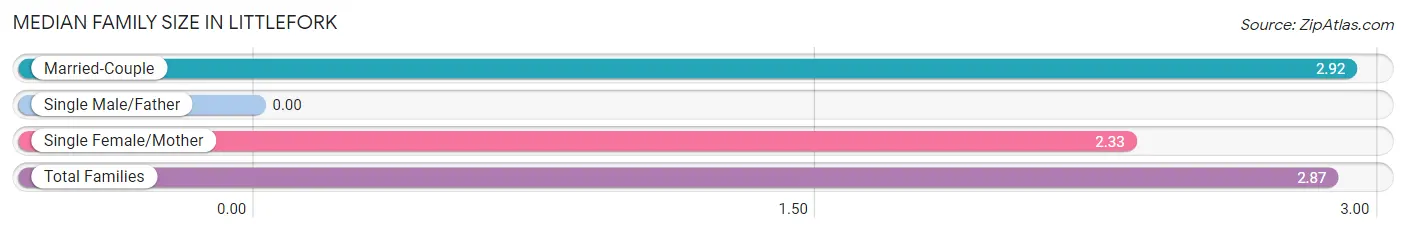
| Family Type | # Families | Family Size |
| Married-Couple | 128 (91.4%) | 2.92 |
| Single Male/Father | 0 (0.0%) | - |
| Single Female/Mother | 12 (8.6%) | 2.33 |
| Total Families | 140 (100.0%) | 2.87 |
Median Household Size in Littlefork
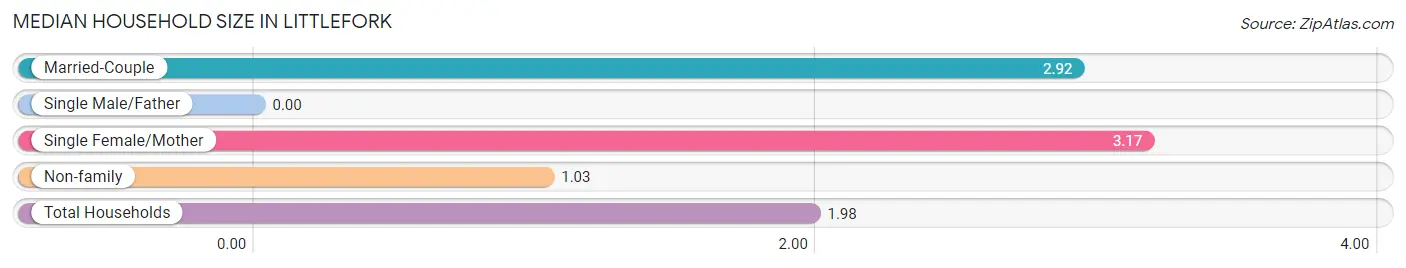
| Household Type | # Households | Household Size |
| Married-Couple | 128 (45.6%) | 2.92 |
| Single Male/Father | 0 (0.0%) | - |
| Single Female/Mother | 12 (4.3%) | 3.17 |
| Non-family | 141 (50.2%) | 1.03 |
| Total Households | 281 (100.0%) | 1.98 |
Household Size by Marriage Status in Littlefork
Out of a total of 281 households in Littlefork, 140 (49.8%) are family households, while 141 (50.2%) are nonfamily households. The most numerous type of family households are 2-person households, comprising 60, and the most common type of nonfamily households are 1-person households, comprising 137.
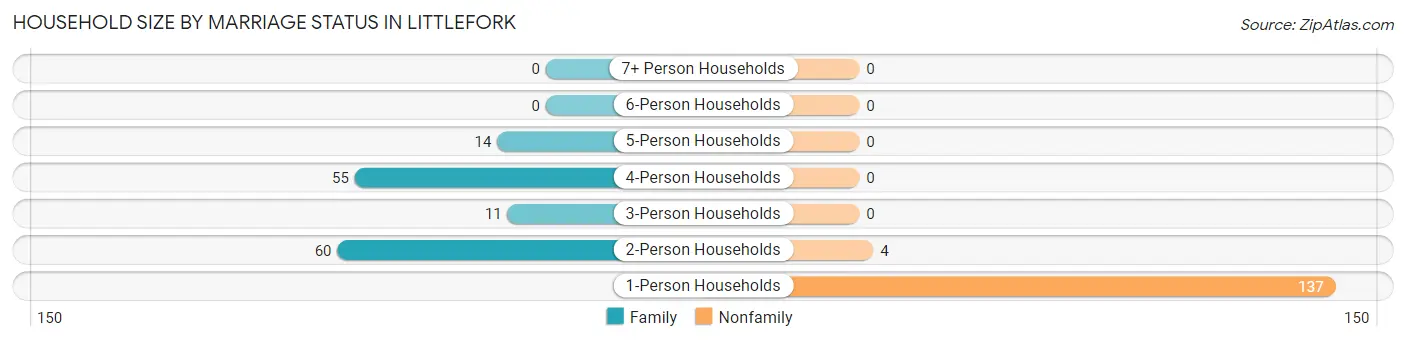
| Household Size | Family Households | Nonfamily Households |
| 1-Person Households | - | 137 (48.7%) |
| 2-Person Households | 60 (21.3%) | 4 (1.4%) |
| 3-Person Households | 11 (3.9%) | 0 (0.0%) |
| 4-Person Households | 55 (19.6%) | 0 (0.0%) |
| 5-Person Households | 14 (5.0%) | 0 (0.0%) |
| 6-Person Households | 0 (0.0%) | 0 (0.0%) |
| 7+ Person Households | 0 (0.0%) | 0 (0.0%) |
| Total | 140 (49.8%) | 141 (50.2%) |
Female Fertility in Littlefork
Fertility by Age in Littlefork
Average fertility rate in Littlefork is 57.0 births per 1,000 women. Women in the age bracket of 20 to 34 years have the highest fertility rate with 185.0 births per 1,000 women. Women in the age bracket of 20 to 34 years acount for 100.0% of all women with births.
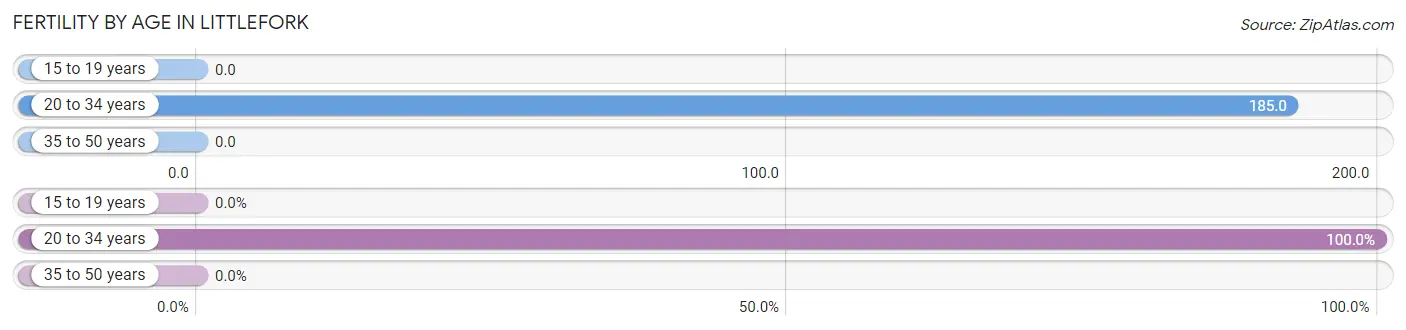
| Age Bracket | Women with Births | Births / 1,000 Women |
| 15 to 19 years | 0 (0.0%) | 0.0 |
| 20 to 34 years | 5 (100.0%) | 185.0 |
| 35 to 50 years | 0 (0.0%) | 0.0 |
| Total | 5 (100.0%) | 57.0 |
Fertility by Age by Marriage Status in Littlefork
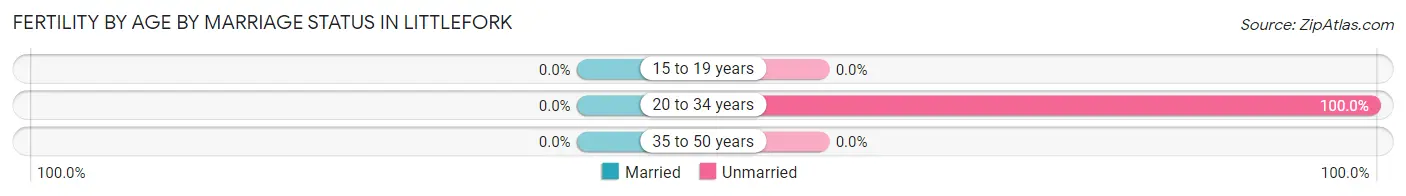
| Age Bracket | Married | Unmarried |
| 15 to 19 years | 0 (0.0%) | 0 (0.0%) |
| 20 to 34 years | 0 (0.0%) | 5 (100.0%) |
| 35 to 50 years | 0 (0.0%) | 0 (0.0%) |
| Total | 0 (0.0%) | 5 (100.0%) |
Fertility by Education in Littlefork
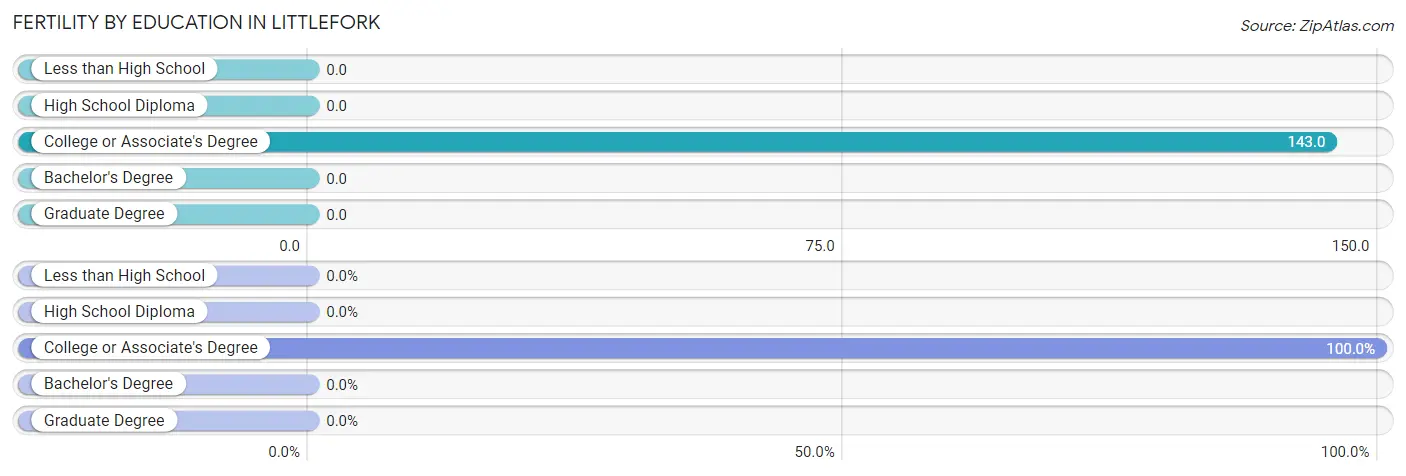
| Educational Attainment | Women with Births | Births / 1,000 Women |
| Less than High School | 0 (0.0%) | 0.0 |
| High School Diploma | 0 (0.0%) | 0.0 |
| College or Associate's Degree | 5 (100.0%) | 143.0 |
| Bachelor's Degree | 0 (0.0%) | 0.0 |
| Graduate Degree | 0 (0.0%) | 0.0 |
| Total | 5 (100.0%) | 57.0 |
Fertility by Education by Marriage Status in Littlefork
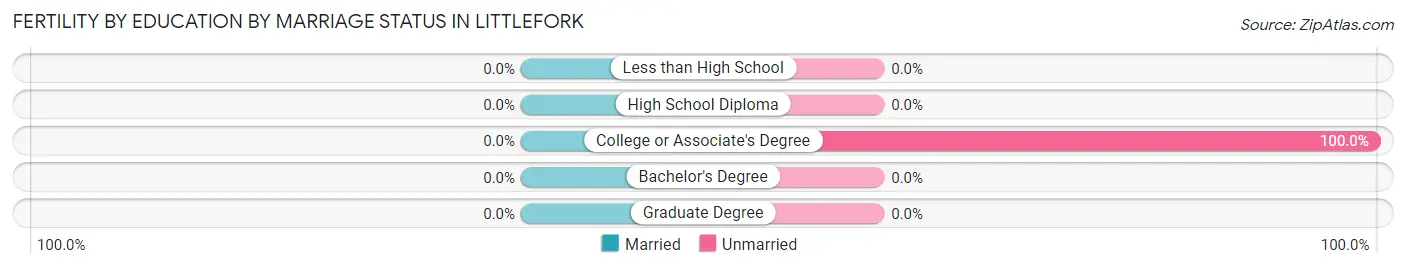
| Educational Attainment | Married | Unmarried |
| Less than High School | 0 (0.0%) | 0 (0.0%) |
| High School Diploma | 0 (0.0%) | 0 (0.0%) |
| College or Associate's Degree | 0 (0.0%) | 5 (100.0%) |
| Bachelor's Degree | 0 (0.0%) | 0 (0.0%) |
| Graduate Degree | 0 (0.0%) | 0 (0.0%) |
| Total | 0 (0.0%) | 5 (100.0%) |
Employment Characteristics in Littlefork
Employment by Class of Employer in Littlefork
Among the 302 employed individuals in Littlefork, private company employees (194 | 64.2%), state government employees (33 | 10.9%), and self-employed (not incorporated) (28 | 9.3%) make up the most common classes of employment.
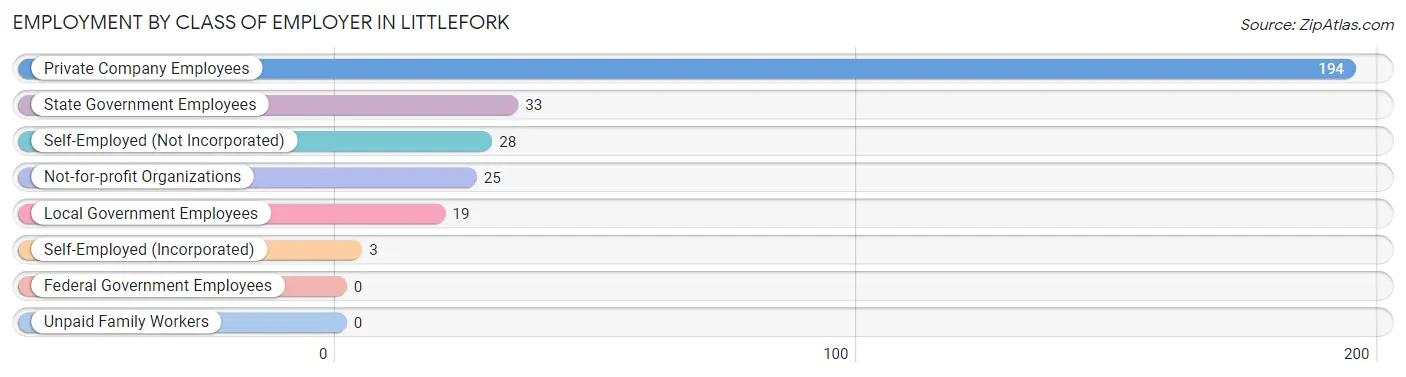
| Employer Class | # Employees | % Employees |
| Private Company Employees | 194 | 64.2% |
| Self-Employed (Incorporated) | 3 | 1.0% |
| Self-Employed (Not Incorporated) | 28 | 9.3% |
| Not-for-profit Organizations | 25 | 8.3% |
| Local Government Employees | 19 | 6.3% |
| State Government Employees | 33 | 10.9% |
| Federal Government Employees | 0 | 0.0% |
| Unpaid Family Workers | 0 | 0.0% |
| Total | 302 | 100.0% |
Employment Status by Age in Littlefork
According to the labor force statistics for Littlefork, out of the total population over 16 years of age (547), 59.6% or 326 individuals are in the labor force, with 1.5% or 5 of them unemployed. The age group with the highest labor force participation rate is 20 to 24 years, with 100.0% or 16 individuals in the labor force. Within the labor force, the 20 to 24 years age range has the highest percentage of unemployed individuals, with 25.0% or 4 of them being unemployed.
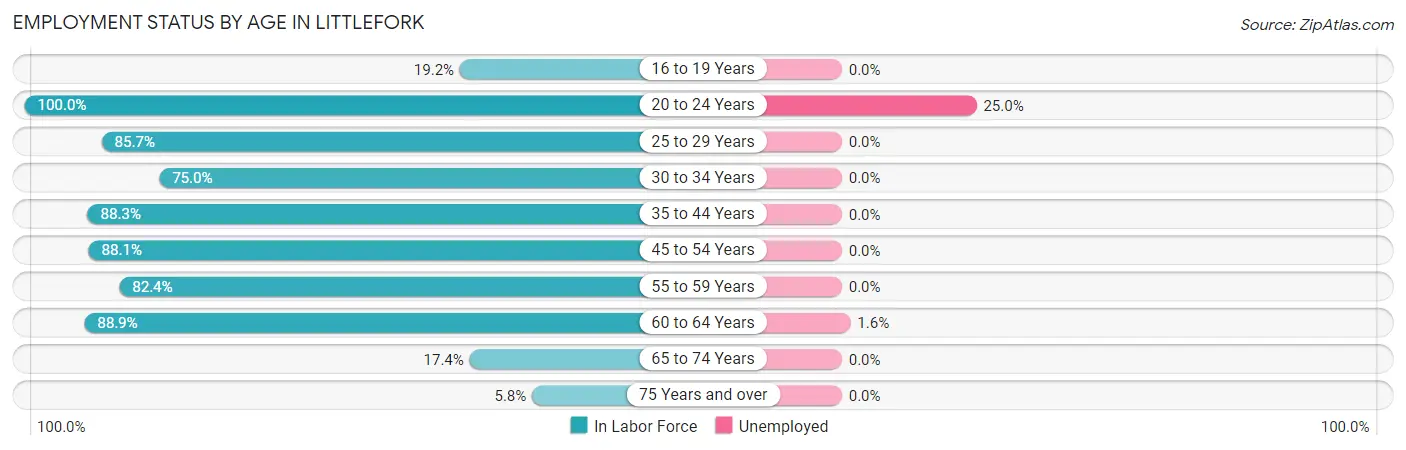
| Age Bracket | In Labor Force | Unemployed |
| 16 to 19 Years | 5 (19.2%) | 0 (0.0%) |
| 20 to 24 Years | 16 (100.0%) | 4 (25.0%) |
| 25 to 29 Years | 30 (85.7%) | 0 (0.0%) |
| 30 to 34 Years | 27 (75.0%) | 0 (0.0%) |
| 35 to 44 Years | 53 (88.3%) | 0 (0.0%) |
| 45 to 54 Years | 74 (88.1%) | 0 (0.0%) |
| 55 to 59 Years | 42 (82.4%) | 0 (0.0%) |
| 60 to 64 Years | 64 (88.9%) | 1 (1.6%) |
| 65 to 74 Years | 8 (17.4%) | 0 (0.0%) |
| 75 Years and over | 7 (5.8%) | 0 (0.0%) |
| Total | 326 (59.6%) | 5 (1.5%) |
Employment Status by Educational Attainment in Littlefork
According to labor force statistics for Littlefork, 85.8% of individuals (290) out of the total population between 25 and 64 years of age (338) are in the labor force, with 0.3% or 1 of them being unemployed. The group with the highest labor force participation rate are those with the educational attainment of bachelor's degree or higher, with 96.9% or 63 individuals in the labor force. Within the labor force, individuals with college / associate degree education have the highest percentage of unemployment, with 0.7% or 1 of them being unemployed.
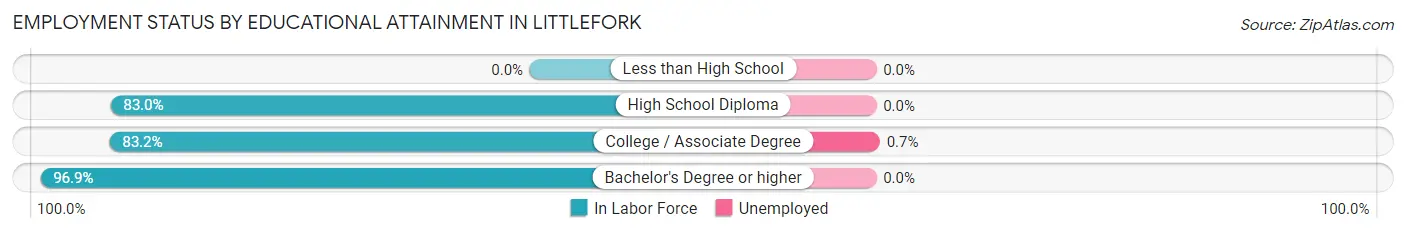
| Educational Attainment | In Labor Force | Unemployed |
| Less than High School | 0 (0.0%) | 0 (0.0%) |
| High School Diploma | 78 (83.0%) | 0 (0.0%) |
| College / Associate Degree | 149 (83.2%) | 1 (0.7%) |
| Bachelor's Degree or higher | 63 (96.9%) | 0 (0.0%) |
| Total | 290 (85.8%) | 1 (0.3%) |
Employment Occupations by Sex in Littlefork
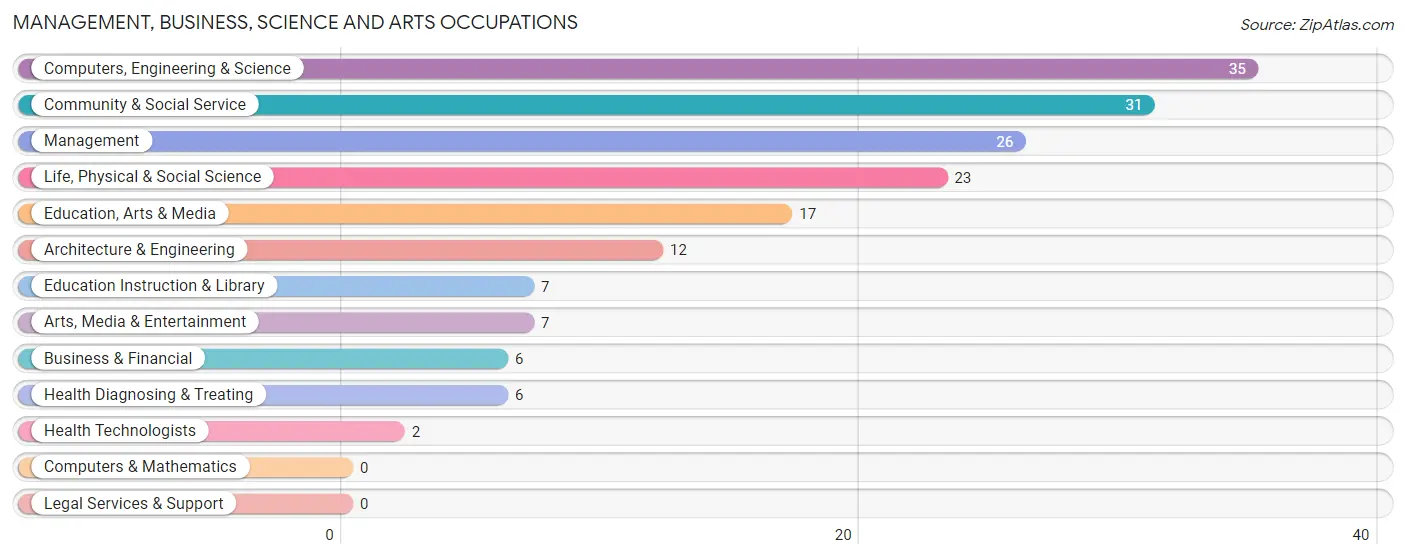
Management, Business, Science and Arts Occupations
The most common Management, Business, Science and Arts occupations in Littlefork are Computers, Engineering & Science (35 | 10.9%), Community & Social Service (31 | 9.7%), Management (26 | 8.1%), Life, Physical & Social Science (23 | 7.2%), and Education, Arts & Media (17 | 5.3%).
Management, Business, Science and Arts Occupations by Sex
Within the Management, Business, Science and Arts occupations in Littlefork, the most male-oriented occupations are Life, Physical & Social Science (100.0%), Education, Arts & Media (100.0%), and Management (76.9%), while the most female-oriented occupations are Business & Financial (100.0%), Architecture & Engineering (100.0%), and Education Instruction & Library (100.0%).
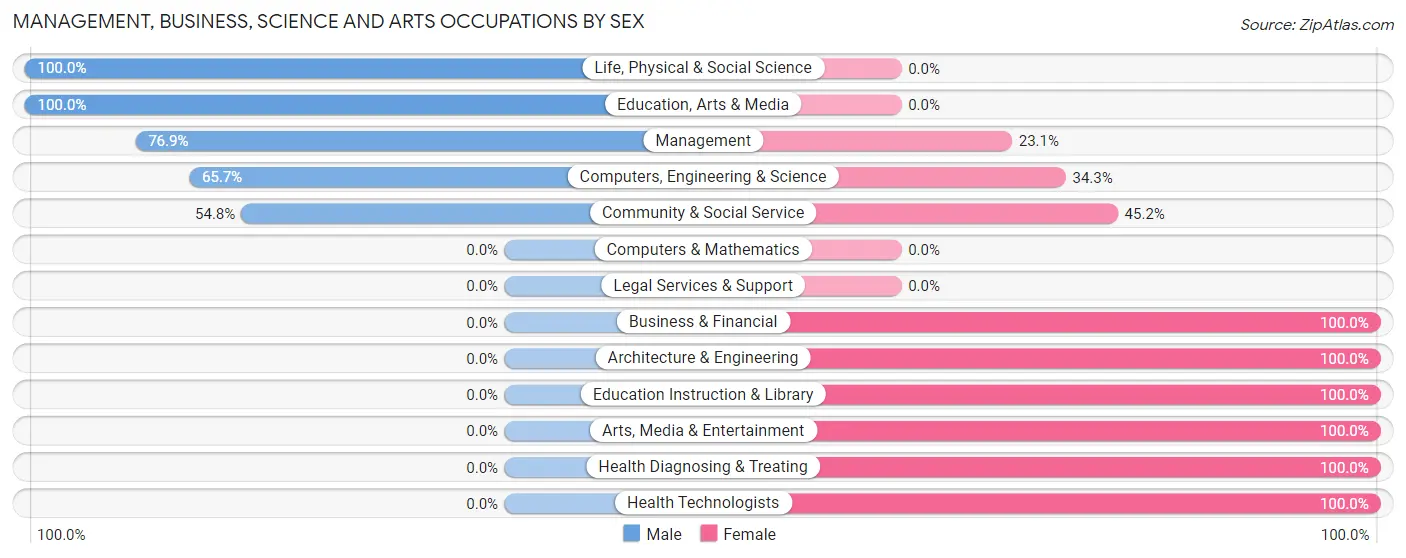
| Occupation | Male | Female |
| Management | 20 (76.9%) | 6 (23.1%) |
| Business & Financial | 0 (0.0%) | 6 (100.0%) |
| Computers, Engineering & Science | 23 (65.7%) | 12 (34.3%) |
| Computers & Mathematics | 0 (0.0%) | 0 (0.0%) |
| Architecture & Engineering | 0 (0.0%) | 12 (100.0%) |
| Life, Physical & Social Science | 23 (100.0%) | 0 (0.0%) |
| Community & Social Service | 17 (54.8%) | 14 (45.2%) |
| Education, Arts & Media | 17 (100.0%) | 0 (0.0%) |
| Legal Services & Support | 0 (0.0%) | 0 (0.0%) |
| Education Instruction & Library | 0 (0.0%) | 7 (100.0%) |
| Arts, Media & Entertainment | 0 (0.0%) | 7 (100.0%) |
| Health Diagnosing & Treating | 0 (0.0%) | 6 (100.0%) |
| Health Technologists | 0 (0.0%) | 2 (100.0%) |
| Total (Category) | 60 (57.7%) | 44 (42.3%) |
| Total (Overall) | 216 (67.3%) | 105 (32.7%) |
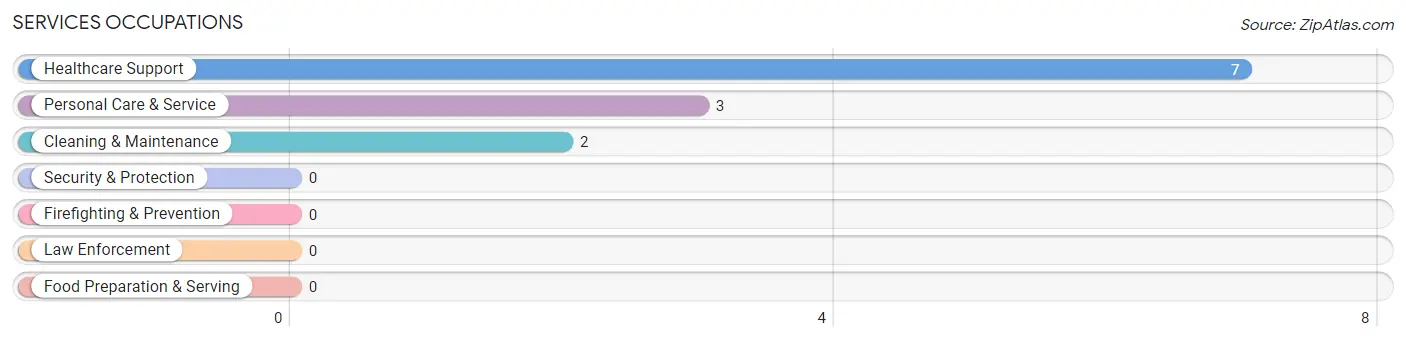
Services Occupations
The most common Services occupations in Littlefork are Healthcare Support (7 | 2.2%), Personal Care & Service (3 | 0.9%), and Cleaning & Maintenance (2 | 0.6%).
Services Occupations by Sex
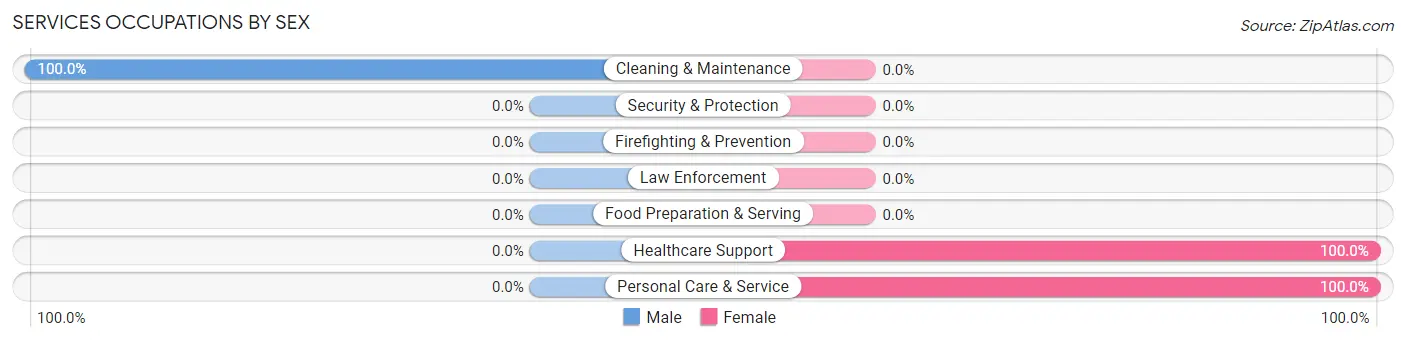
| Occupation | Male | Female |
| Healthcare Support | 0 (0.0%) | 7 (100.0%) |
| Security & Protection | 0 (0.0%) | 0 (0.0%) |
| Firefighting & Prevention | 0 (0.0%) | 0 (0.0%) |
| Law Enforcement | 0 (0.0%) | 0 (0.0%) |
| Food Preparation & Serving | 0 (0.0%) | 0 (0.0%) |
| Cleaning & Maintenance | 2 (100.0%) | 0 (0.0%) |
| Personal Care & Service | 0 (0.0%) | 3 (100.0%) |
| Total (Category) | 2 (16.7%) | 10 (83.3%) |
| Total (Overall) | 216 (67.3%) | 105 (32.7%) |
Sales and Office Occupations
The most common Sales and Office occupations in Littlefork are Sales & Related (54 | 16.8%), and Office & Administration (18 | 5.6%).

Sales and Office Occupations by Sex

| Occupation | Male | Female |
| Sales & Related | 23 (42.6%) | 31 (57.4%) |
| Office & Administration | 0 (0.0%) | 18 (100.0%) |
| Total (Category) | 23 (31.9%) | 49 (68.1%) |
| Total (Overall) | 216 (67.3%) | 105 (32.7%) |
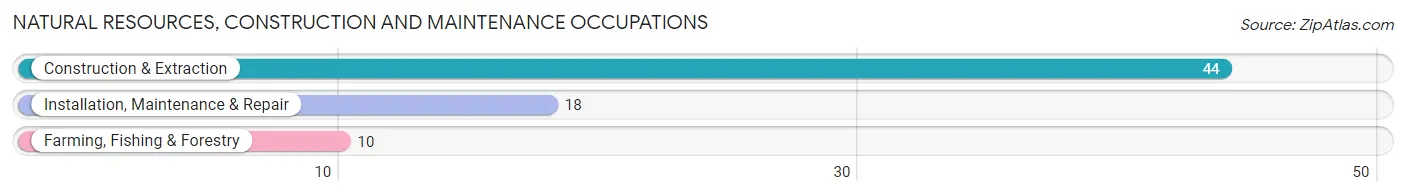
Natural Resources, Construction and Maintenance Occupations
The most common Natural Resources, Construction and Maintenance occupations in Littlefork are Construction & Extraction (44 | 13.7%), Installation, Maintenance & Repair (18 | 5.6%), and Farming, Fishing & Forestry (10 | 3.1%).
Natural Resources, Construction and Maintenance Occupations by Sex
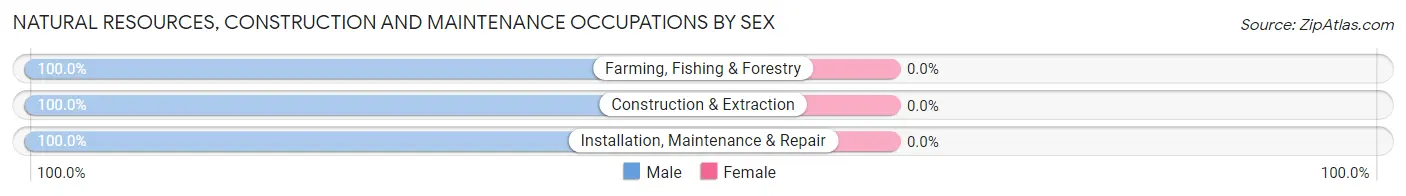
| Occupation | Male | Female |
| Farming, Fishing & Forestry | 10 (100.0%) | 0 (0.0%) |
| Construction & Extraction | 44 (100.0%) | 0 (0.0%) |
| Installation, Maintenance & Repair | 18 (100.0%) | 0 (0.0%) |
| Total (Category) | 72 (100.0%) | 0 (0.0%) |
| Total (Overall) | 216 (67.3%) | 105 (32.7%) |
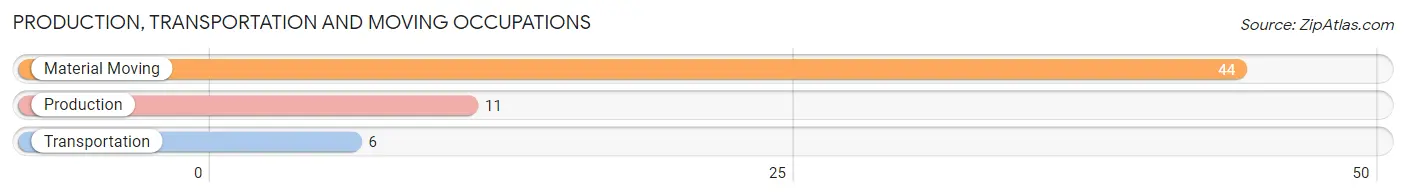
Production, Transportation and Moving Occupations
The most common Production, Transportation and Moving occupations in Littlefork are Material Moving (44 | 13.7%), Production (11 | 3.4%), and Transportation (6 | 1.9%).
Production, Transportation and Moving Occupations by Sex
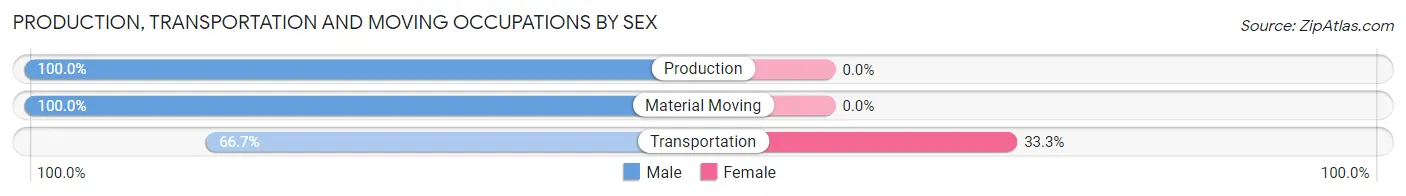
| Occupation | Male | Female |
| Production | 11 (100.0%) | 0 (0.0%) |
| Transportation | 4 (66.7%) | 2 (33.3%) |
| Material Moving | 44 (100.0%) | 0 (0.0%) |
| Total (Category) | 59 (96.7%) | 2 (3.3%) |
| Total (Overall) | 216 (67.3%) | 105 (32.7%) |
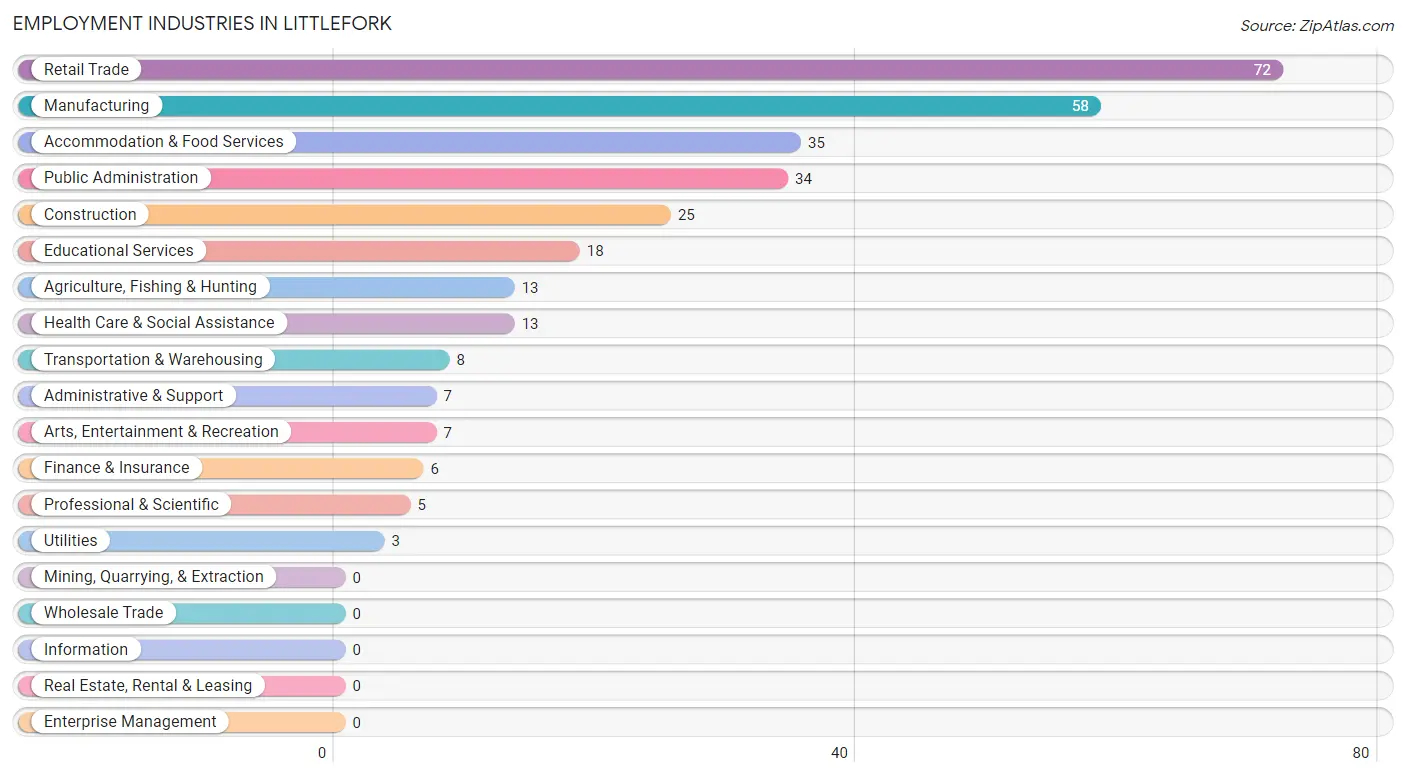
Employment Industries by Sex in Littlefork
Employment Industries in Littlefork
The major employment industries in Littlefork include Retail Trade (72 | 22.4%), Manufacturing (58 | 18.1%), Accommodation & Food Services (35 | 10.9%), Public Administration (34 | 10.6%), and Construction (25 | 7.8%).
Employment Industries by Sex in Littlefork
The Littlefork industries that see more men than women are Agriculture, Fishing & Hunting (100.0%), Construction (100.0%), and Administrative & Support (100.0%), whereas the industries that tend to have a higher number of women are Utilities (100.0%), Finance & Insurance (100.0%), and Professional & Scientific (100.0%).
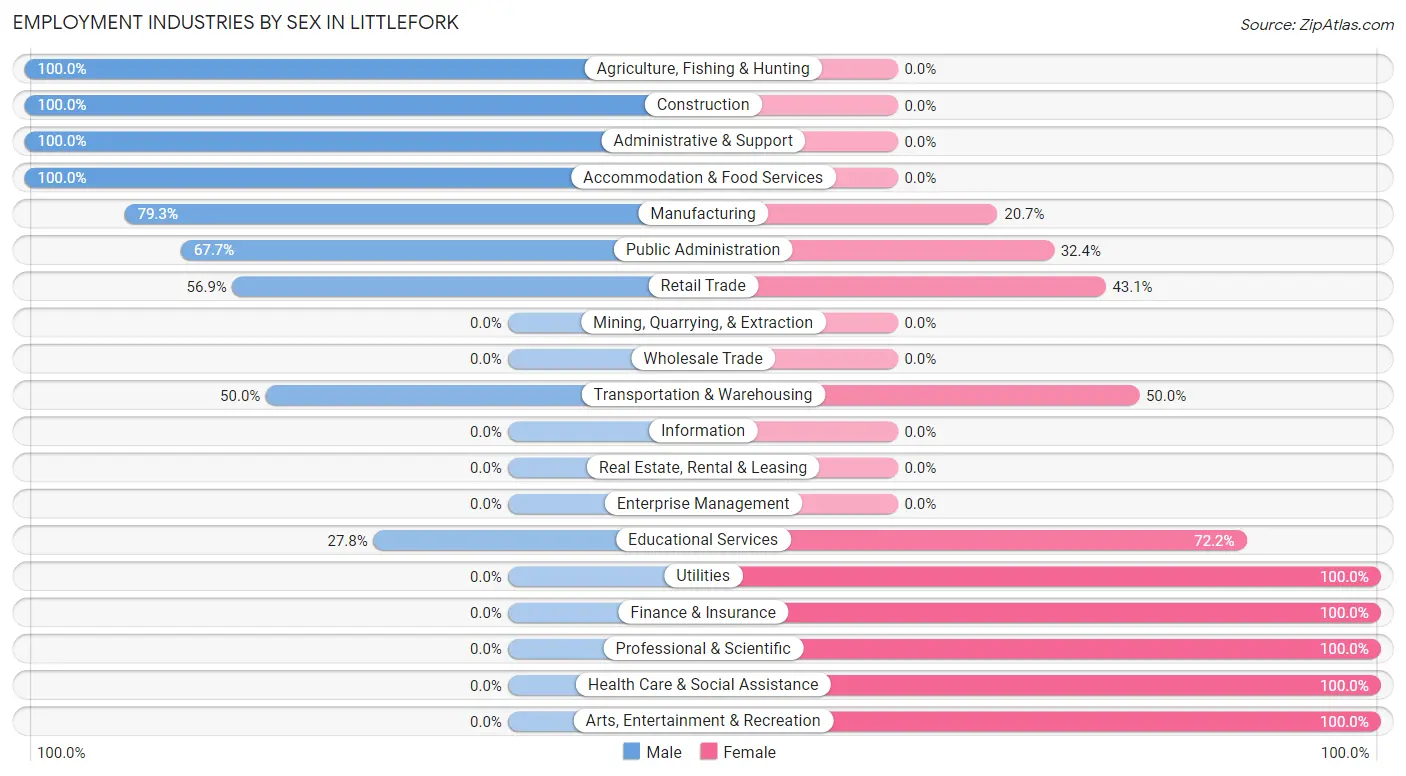
| Industry | Male | Female |
| Agriculture, Fishing & Hunting | 13 (100.0%) | 0 (0.0%) |
| Mining, Quarrying, & Extraction | 0 (0.0%) | 0 (0.0%) |
| Construction | 25 (100.0%) | 0 (0.0%) |
| Manufacturing | 46 (79.3%) | 12 (20.7%) |
| Wholesale Trade | 0 (0.0%) | 0 (0.0%) |
| Retail Trade | 41 (56.9%) | 31 (43.1%) |
| Transportation & Warehousing | 4 (50.0%) | 4 (50.0%) |
| Utilities | 0 (0.0%) | 3 (100.0%) |
| Information | 0 (0.0%) | 0 (0.0%) |
| Finance & Insurance | 0 (0.0%) | 6 (100.0%) |
| Real Estate, Rental & Leasing | 0 (0.0%) | 0 (0.0%) |
| Professional & Scientific | 0 (0.0%) | 5 (100.0%) |
| Enterprise Management | 0 (0.0%) | 0 (0.0%) |
| Administrative & Support | 7 (100.0%) | 0 (0.0%) |
| Educational Services | 5 (27.8%) | 13 (72.2%) |
| Health Care & Social Assistance | 0 (0.0%) | 13 (100.0%) |
| Arts, Entertainment & Recreation | 0 (0.0%) | 7 (100.0%) |
| Accommodation & Food Services | 35 (100.0%) | 0 (0.0%) |
| Public Administration | 23 (67.6%) | 11 (32.4%) |
| Total | 216 (67.3%) | 105 (32.7%) |
Education in Littlefork
School Enrollment in Littlefork
The most common levels of schooling among the 75 students in Littlefork are college / undergraduate (29 | 38.7%), middle school (15 | 20.0%), and high school (15 | 20.0%).
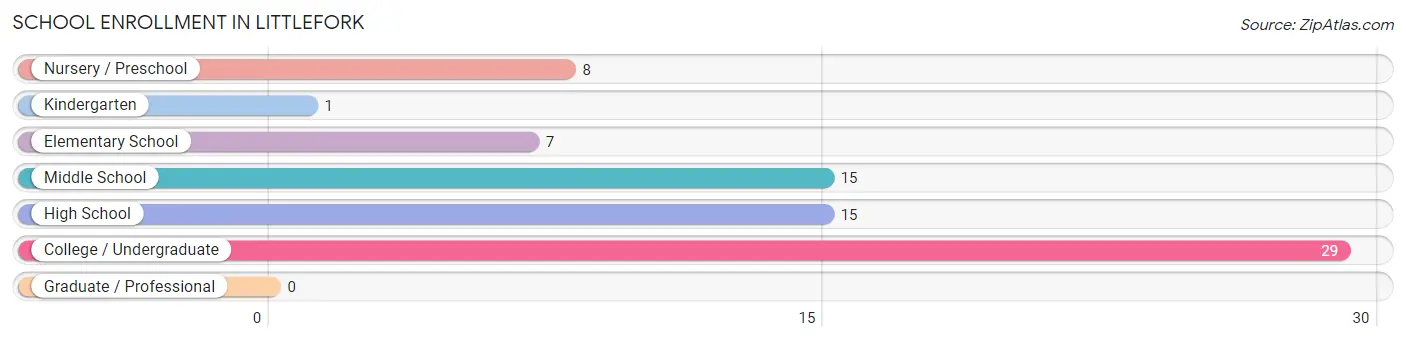
| School Level | # Students | % Students |
| Nursery / Preschool | 8 | 10.7% |
| Kindergarten | 1 | 1.3% |
| Elementary School | 7 | 9.3% |
| Middle School | 15 | 20.0% |
| High School | 15 | 20.0% |
| College / Undergraduate | 29 | 38.7% |
| Graduate / Professional | 0 | 0.0% |
| Total | 75 | 100.0% |
School Enrollment by Age by Funding Source in Littlefork
Out of a total of 75 students who are enrolled in schools in Littlefork, 7 (9.3%) attend a private institution, while the remaining 68 (90.7%) are enrolled in public schools. The age group of 15 to 17 year olds has the highest likelihood of being enrolled in private schools, with 7 (100.0% in the age bracket) enrolled. Conversely, the age group of 3 to 4 year olds has the lowest likelihood of being enrolled in a private school, with 8 (100.0% in the age bracket) attending a public institution.
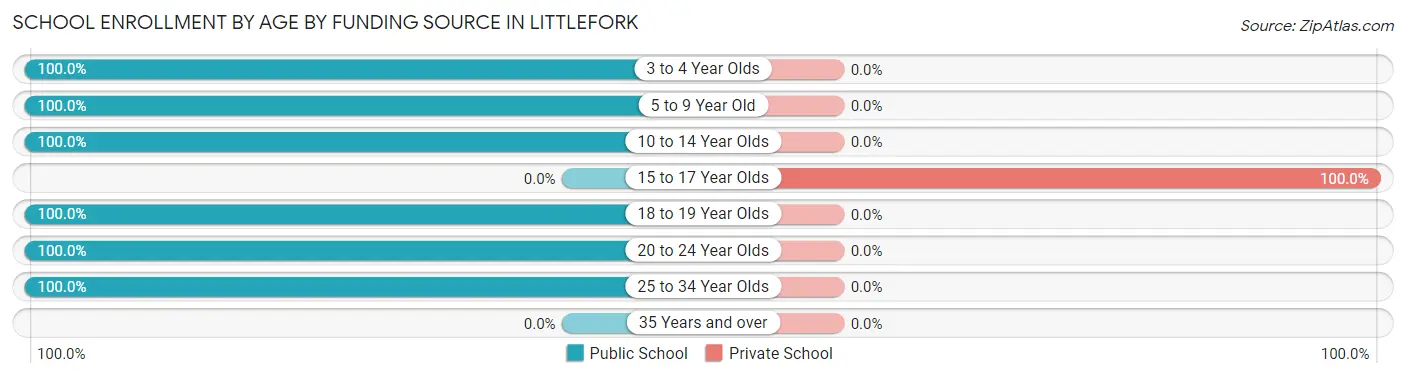
| Age Bracket | Public School | Private School |
| 3 to 4 Year Olds | 8 (100.0%) | 0 (0.0%) |
| 5 to 9 Year Old | 2 (100.0%) | 0 (0.0%) |
| 10 to 14 Year Olds | 29 (100.0%) | 0 (0.0%) |
| 15 to 17 Year Olds | 0 (0.0%) | 7 (100.0%) |
| 18 to 19 Year Olds | 19 (100.0%) | 0 (0.0%) |
| 20 to 24 Year Olds | 8 (100.0%) | 0 (0.0%) |
| 25 to 34 Year Olds | 2 (100.0%) | 0 (0.0%) |
| 35 Years and over | 0 (0.0%) | 0 (0.0%) |
| Total | 68 (90.7%) | 7 (9.3%) |
Educational Attainment by Field of Study in Littlefork
Bio, nature & agricultural (47 | 35.6%), social sciences (22 | 16.7%), education (18 | 13.6%), business (14 | 10.6%), and liberal arts & history (12 | 9.1%) are the most common fields of study among 132 individuals in Littlefork who have obtained a bachelor's degree or higher.
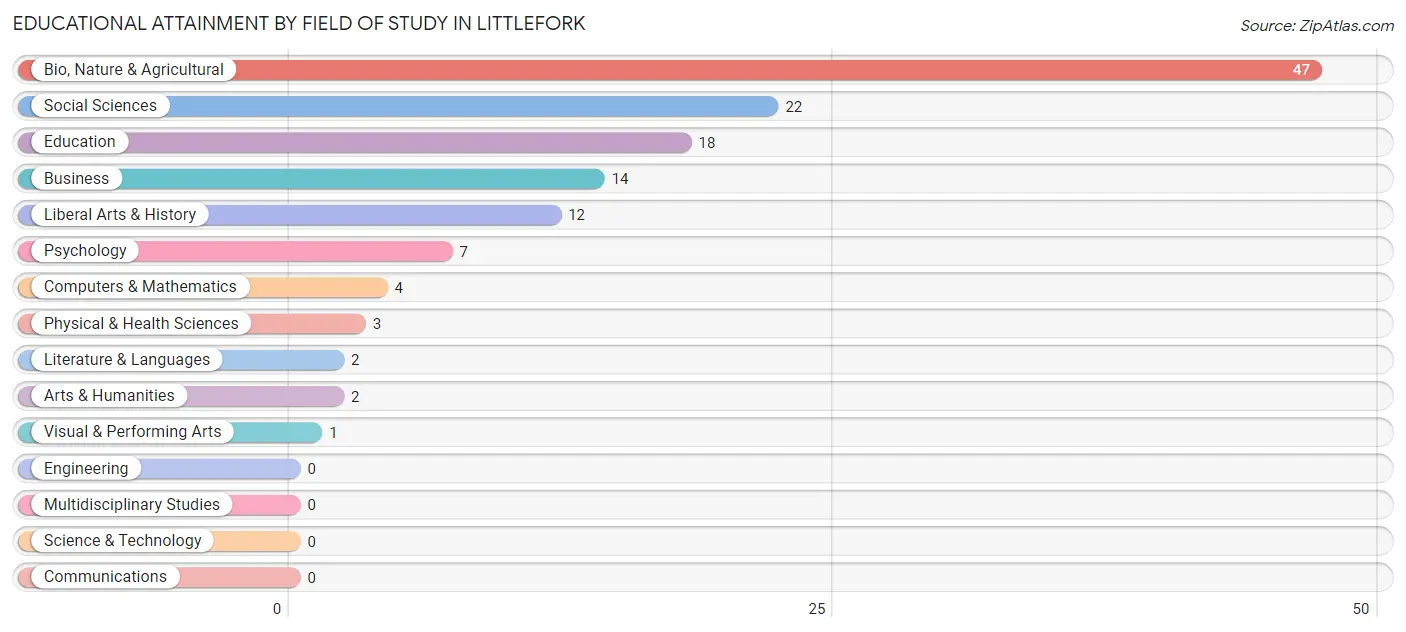
| Field of Study | # Graduates | % Graduates |
| Computers & Mathematics | 4 | 3.0% |
| Bio, Nature & Agricultural | 47 | 35.6% |
| Physical & Health Sciences | 3 | 2.3% |
| Psychology | 7 | 5.3% |
| Social Sciences | 22 | 16.7% |
| Engineering | 0 | 0.0% |
| Multidisciplinary Studies | 0 | 0.0% |
| Science & Technology | 0 | 0.0% |
| Business | 14 | 10.6% |
| Education | 18 | 13.6% |
| Literature & Languages | 2 | 1.5% |
| Liberal Arts & History | 12 | 9.1% |
| Visual & Performing Arts | 1 | 0.8% |
| Communications | 0 | 0.0% |
| Arts & Humanities | 2 | 1.5% |
| Total | 132 | 100.0% |
Transportation & Commute in Littlefork
Vehicle Availability by Sex in Littlefork
The most prevalent vehicle ownership categories in Littlefork are males with 1 vehicle (62, accounting for 31.5%) and females with 1 vehicle (40, making up 59.1%).
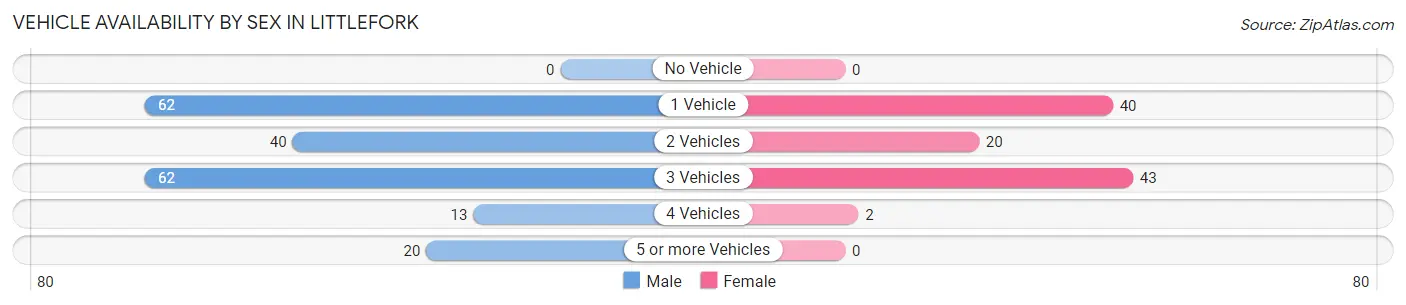
| Vehicles Available | Male | Female |
| No Vehicle | 0 (0.0%) | 0 (0.0%) |
| 1 Vehicle | 62 (31.5%) | 40 (38.1%) |
| 2 Vehicles | 40 (20.3%) | 20 (19.1%) |
| 3 Vehicles | 62 (31.5%) | 43 (40.9%) |
| 4 Vehicles | 13 (6.6%) | 2 (1.9%) |
| 5 or more Vehicles | 20 (10.2%) | 0 (0.0%) |
| Total | 197 (100.0%) | 105 (100.0%) |
Commute Time in Littlefork
The most frequently occuring commute durations in Littlefork are 25 to 29 minutes (61 commuters, 21.3%), 5 to 9 minutes (58 commuters, 20.3%), and 20 to 24 minutes (51 commuters, 17.8%).
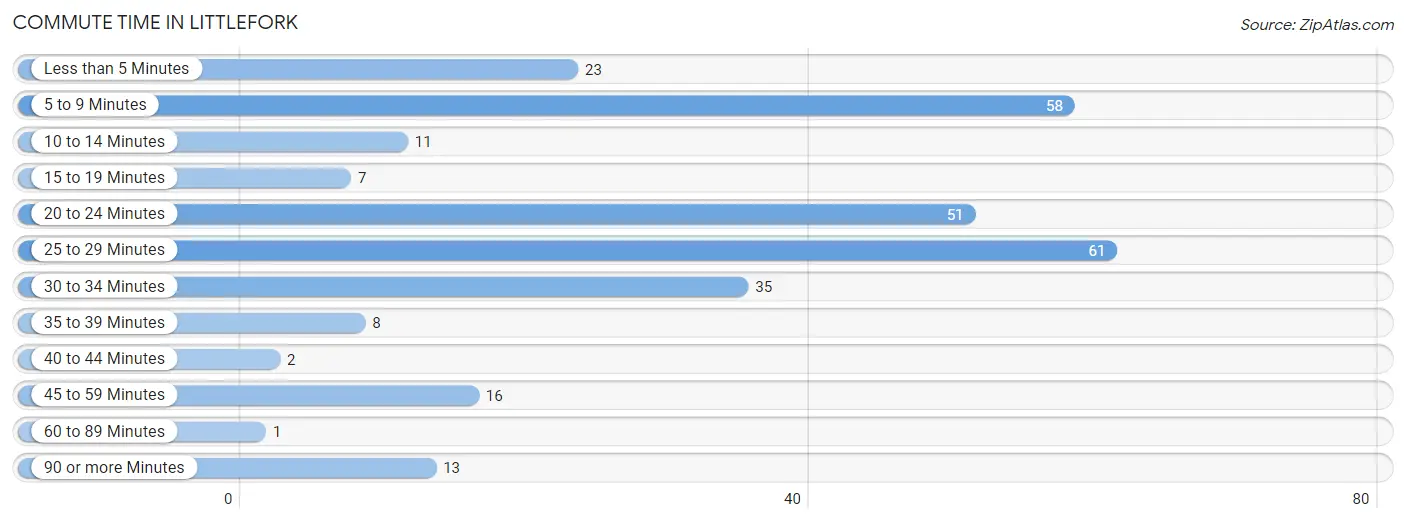
| Commute Time | # Commuters | % Commuters |
| Less than 5 Minutes | 23 | 8.0% |
| 5 to 9 Minutes | 58 | 20.3% |
| 10 to 14 Minutes | 11 | 3.8% |
| 15 to 19 Minutes | 7 | 2.5% |
| 20 to 24 Minutes | 51 | 17.8% |
| 25 to 29 Minutes | 61 | 21.3% |
| 30 to 34 Minutes | 35 | 12.2% |
| 35 to 39 Minutes | 8 | 2.8% |
| 40 to 44 Minutes | 2 | 0.7% |
| 45 to 59 Minutes | 16 | 5.6% |
| 60 to 89 Minutes | 1 | 0.4% |
| 90 or more Minutes | 13 | 4.5% |
Commute Time by Sex in Littlefork
The most common commute times in Littlefork are 20 to 24 minutes (44 commuters, 22.3%) for males and 5 to 9 minutes (38 commuters, 42.7%) for females.
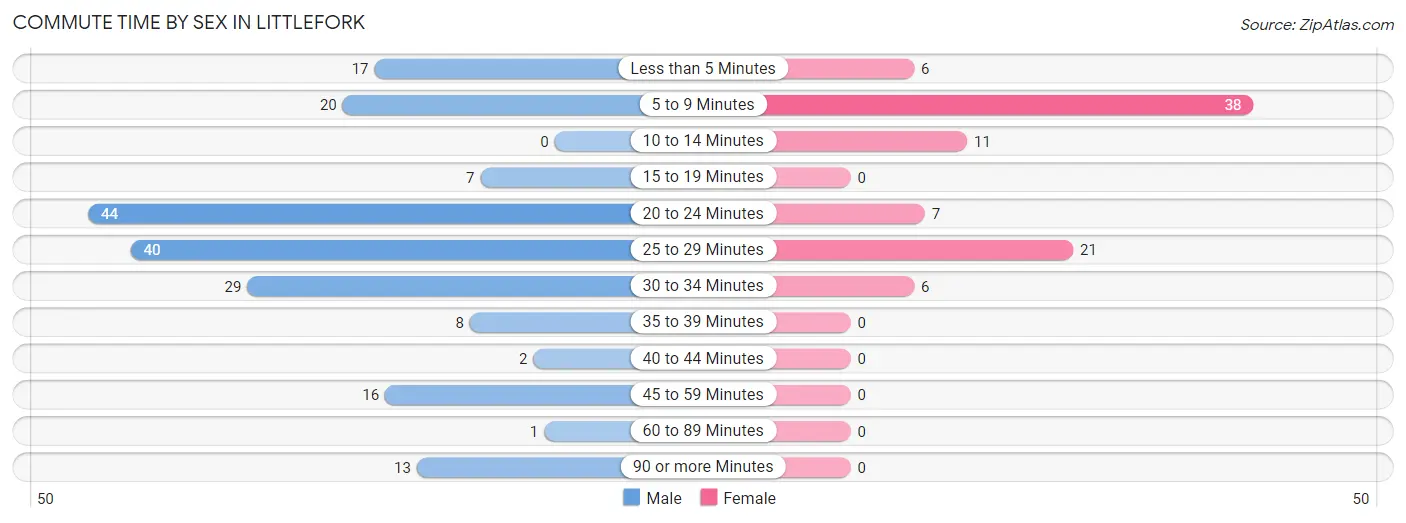
| Commute Time | Male | Female |
| Less than 5 Minutes | 17 (8.6%) | 6 (6.7%) |
| 5 to 9 Minutes | 20 (10.2%) | 38 (42.7%) |
| 10 to 14 Minutes | 0 (0.0%) | 11 (12.4%) |
| 15 to 19 Minutes | 7 (3.5%) | 0 (0.0%) |
| 20 to 24 Minutes | 44 (22.3%) | 7 (7.9%) |
| 25 to 29 Minutes | 40 (20.3%) | 21 (23.6%) |
| 30 to 34 Minutes | 29 (14.7%) | 6 (6.7%) |
| 35 to 39 Minutes | 8 (4.1%) | 0 (0.0%) |
| 40 to 44 Minutes | 2 (1.0%) | 0 (0.0%) |
| 45 to 59 Minutes | 16 (8.1%) | 0 (0.0%) |
| 60 to 89 Minutes | 1 (0.5%) | 0 (0.0%) |
| 90 or more Minutes | 13 (6.6%) | 0 (0.0%) |
Time of Departure to Work by Sex in Littlefork
The most frequent times of departure to work in Littlefork are 7:00 AM to 7:29 AM (47, 23.9%) for males and 5:30 AM to 5:59 AM (23, 25.8%) for females.
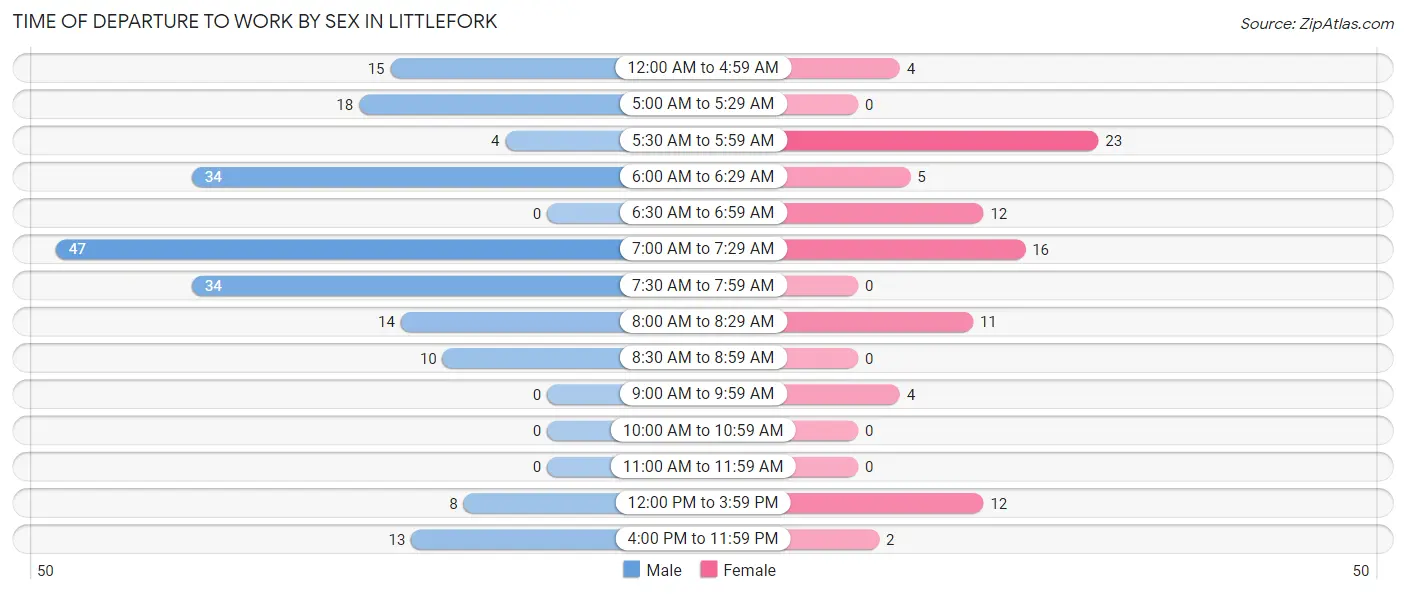
| Time of Departure | Male | Female |
| 12:00 AM to 4:59 AM | 15 (7.6%) | 4 (4.5%) |
| 5:00 AM to 5:29 AM | 18 (9.1%) | 0 (0.0%) |
| 5:30 AM to 5:59 AM | 4 (2.0%) | 23 (25.8%) |
| 6:00 AM to 6:29 AM | 34 (17.3%) | 5 (5.6%) |
| 6:30 AM to 6:59 AM | 0 (0.0%) | 12 (13.5%) |
| 7:00 AM to 7:29 AM | 47 (23.9%) | 16 (18.0%) |
| 7:30 AM to 7:59 AM | 34 (17.3%) | 0 (0.0%) |
| 8:00 AM to 8:29 AM | 14 (7.1%) | 11 (12.4%) |
| 8:30 AM to 8:59 AM | 10 (5.1%) | 0 (0.0%) |
| 9:00 AM to 9:59 AM | 0 (0.0%) | 4 (4.5%) |
| 10:00 AM to 10:59 AM | 0 (0.0%) | 0 (0.0%) |
| 11:00 AM to 11:59 AM | 0 (0.0%) | 0 (0.0%) |
| 12:00 PM to 3:59 PM | 8 (4.1%) | 12 (13.5%) |
| 4:00 PM to 11:59 PM | 13 (6.6%) | 2 (2.2%) |
| Total | 197 (100.0%) | 89 (100.0%) |
Housing Occupancy in Littlefork
Occupancy by Ownership in Littlefork
Of the total 281 dwellings in Littlefork, owner-occupied units account for 207 (73.7%), while renter-occupied units make up 74 (26.3%).
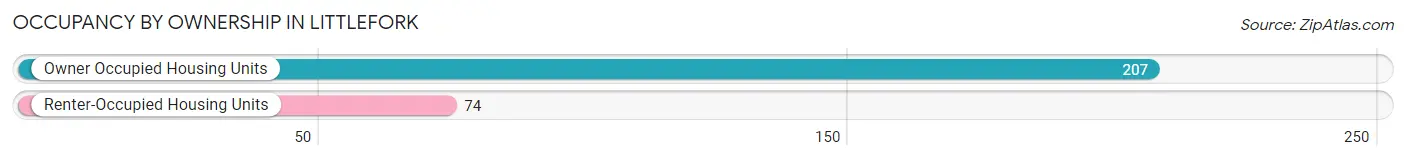
| Occupancy | # Housing Units | % Housing Units |
| Owner Occupied Housing Units | 207 | 73.7% |
| Renter-Occupied Housing Units | 74 | 26.3% |
| Total Occupied Housing Units | 281 | 100.0% |
Occupancy by Household Size in Littlefork
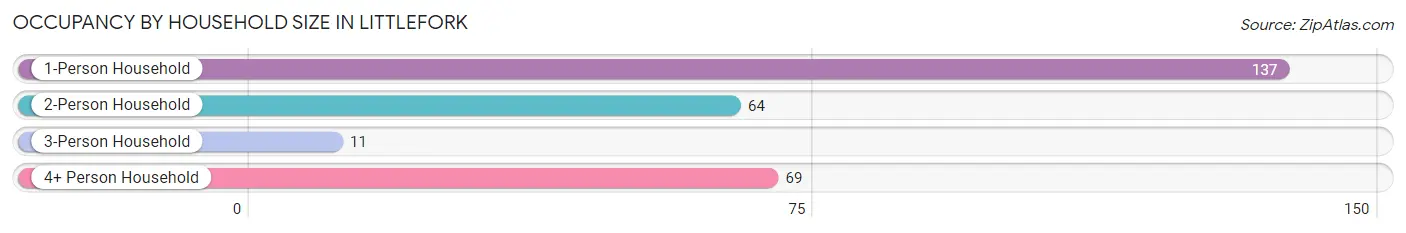
| Household Size | # Housing Units | % Housing Units |
| 1-Person Household | 137 | 48.7% |
| 2-Person Household | 64 | 22.8% |
| 3-Person Household | 11 | 3.9% |
| 4+ Person Household | 69 | 24.6% |
| Total Housing Units | 281 | 100.0% |
Occupancy by Ownership by Household Size in Littlefork
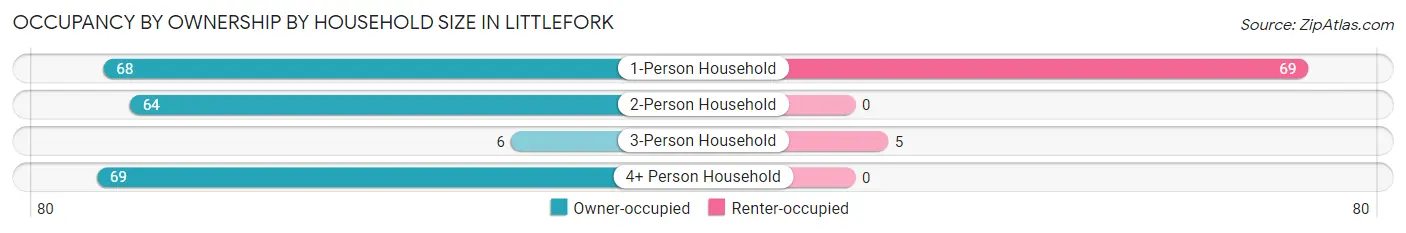
| Household Size | Owner-occupied | Renter-occupied |
| 1-Person Household | 68 (49.6%) | 69 (50.4%) |
| 2-Person Household | 64 (100.0%) | 0 (0.0%) |
| 3-Person Household | 6 (54.5%) | 5 (45.5%) |
| 4+ Person Household | 69 (100.0%) | 0 (0.0%) |
| Total Housing Units | 207 (73.7%) | 74 (26.3%) |
Occupancy by Educational Attainment in Littlefork
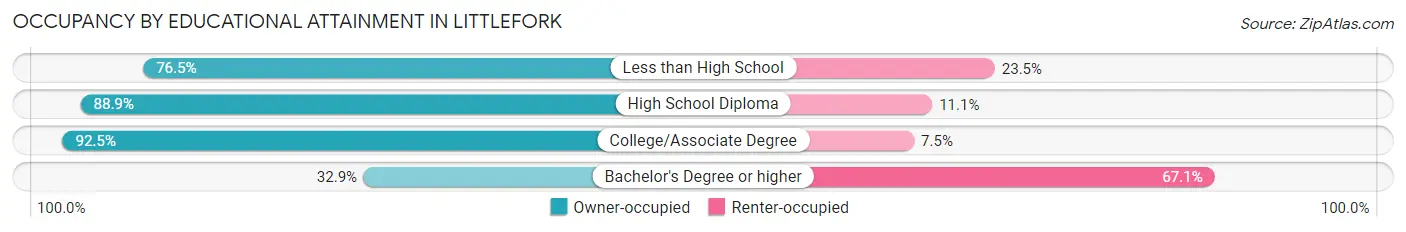
| Household Size | Owner-occupied | Renter-occupied |
| Less than High School | 13 (76.5%) | 4 (23.5%) |
| High School Diploma | 32 (88.9%) | 4 (11.1%) |
| College/Associate Degree | 135 (92.5%) | 11 (7.5%) |
| Bachelor's Degree or higher | 27 (32.9%) | 55 (67.1%) |
Occupancy by Age of Householder in Littlefork
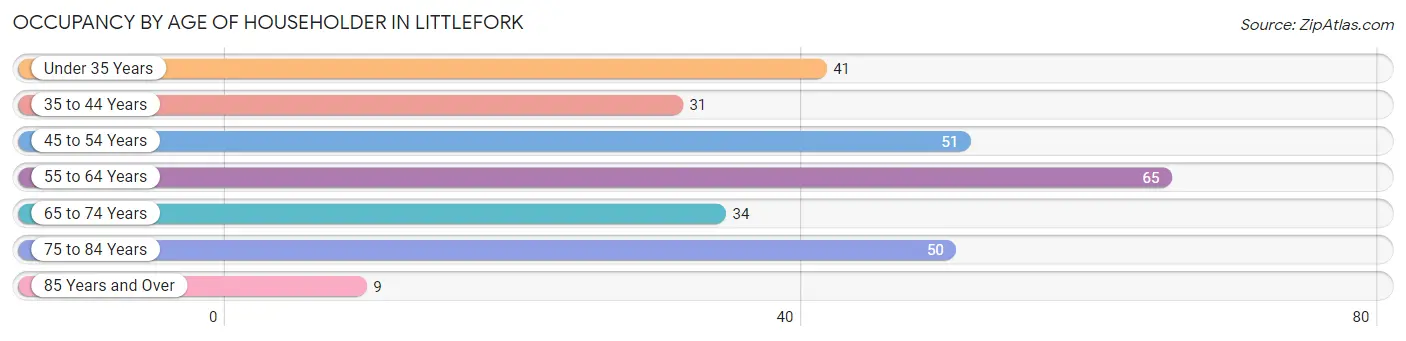
| Age Bracket | # Households | % Households |
| Under 35 Years | 41 | 14.6% |
| 35 to 44 Years | 31 | 11.0% |
| 45 to 54 Years | 51 | 18.1% |
| 55 to 64 Years | 65 | 23.1% |
| 65 to 74 Years | 34 | 12.1% |
| 75 to 84 Years | 50 | 17.8% |
| 85 Years and Over | 9 | 3.2% |
| Total | 281 | 100.0% |
Housing Finances in Littlefork
Median Income by Occupancy in Littlefork
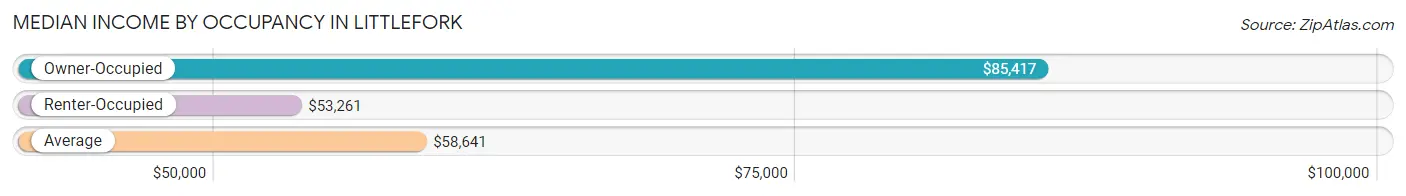
| Occupancy Type | # Households | Median Income |
| Owner-Occupied | 207 (73.7%) | $85,417 |
| Renter-Occupied | 74 (26.3%) | $53,261 |
| Average | 281 (100.0%) | $58,641 |
Occupancy by Householder Income Bracket in Littlefork
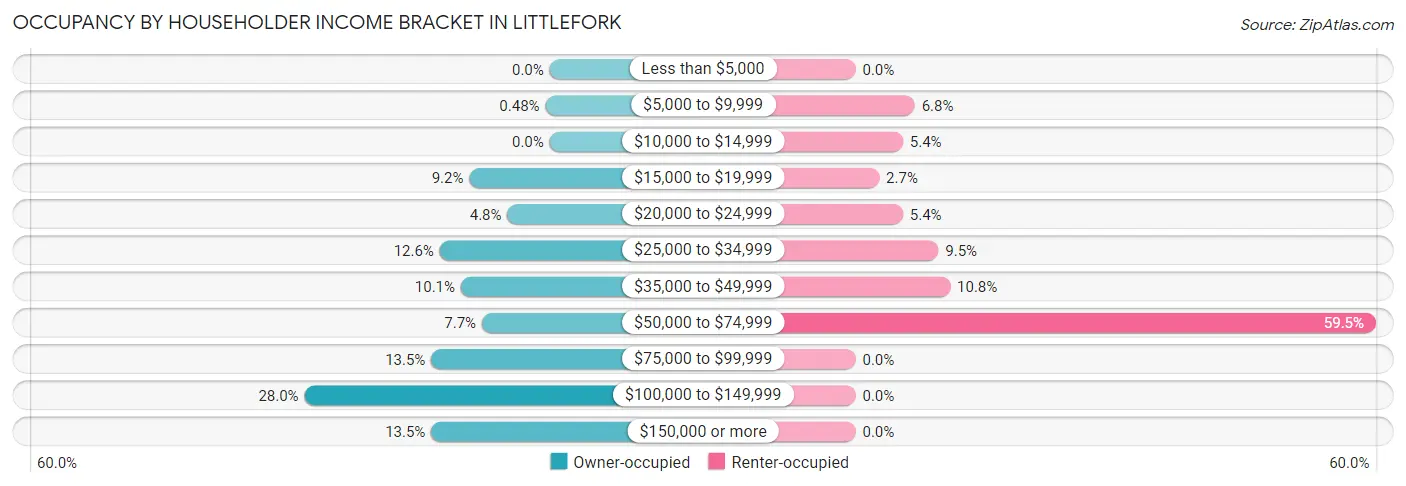
| Income Bracket | Owner-occupied | Renter-occupied |
| Less than $5,000 | 0 (0.0%) | 0 (0.0%) |
| $5,000 to $9,999 | 1 (0.5%) | 5 (6.8%) |
| $10,000 to $14,999 | 0 (0.0%) | 4 (5.4%) |
| $15,000 to $19,999 | 19 (9.2%) | 2 (2.7%) |
| $20,000 to $24,999 | 10 (4.8%) | 4 (5.4%) |
| $25,000 to $34,999 | 26 (12.6%) | 7 (9.5%) |
| $35,000 to $49,999 | 21 (10.1%) | 8 (10.8%) |
| $50,000 to $74,999 | 16 (7.7%) | 44 (59.5%) |
| $75,000 to $99,999 | 28 (13.5%) | 0 (0.0%) |
| $100,000 to $149,999 | 58 (28.0%) | 0 (0.0%) |
| $150,000 or more | 28 (13.5%) | 0 (0.0%) |
| Total | 207 (100.0%) | 74 (100.0%) |
Monthly Housing Cost Tiers in Littlefork
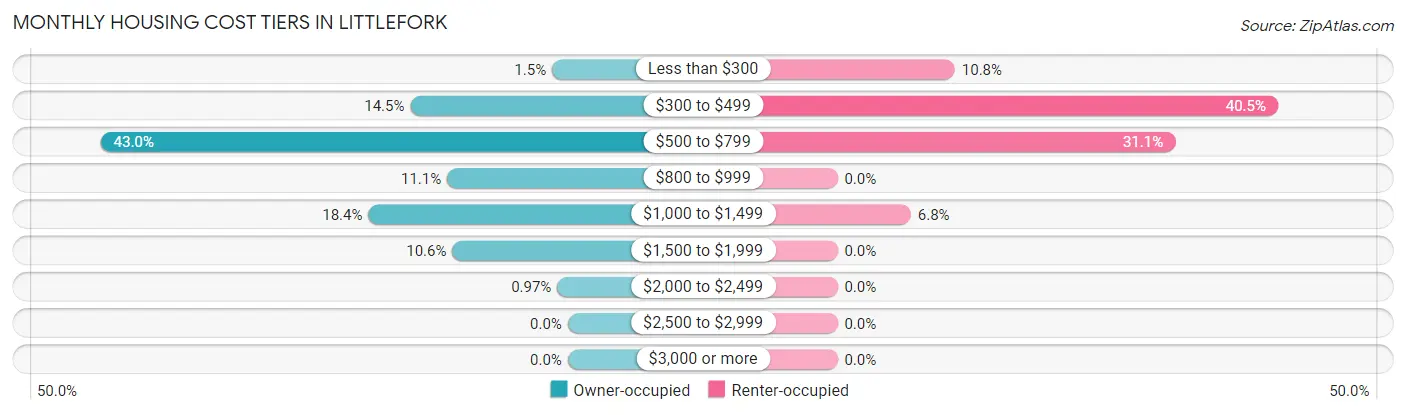
| Monthly Cost | Owner-occupied | Renter-occupied |
| Less than $300 | 3 (1.5%) | 8 (10.8%) |
| $300 to $499 | 30 (14.5%) | 30 (40.5%) |
| $500 to $799 | 89 (43.0%) | 23 (31.1%) |
| $800 to $999 | 23 (11.1%) | 0 (0.0%) |
| $1,000 to $1,499 | 38 (18.4%) | 5 (6.8%) |
| $1,500 to $1,999 | 22 (10.6%) | 0 (0.0%) |
| $2,000 to $2,499 | 2 (1.0%) | 0 (0.0%) |
| $2,500 to $2,999 | 0 (0.0%) | 0 (0.0%) |
| $3,000 or more | 0 (0.0%) | 0 (0.0%) |
| Total | 207 (100.0%) | 74 (100.0%) |
Physical Housing Characteristics in Littlefork
Housing Structures in Littlefork
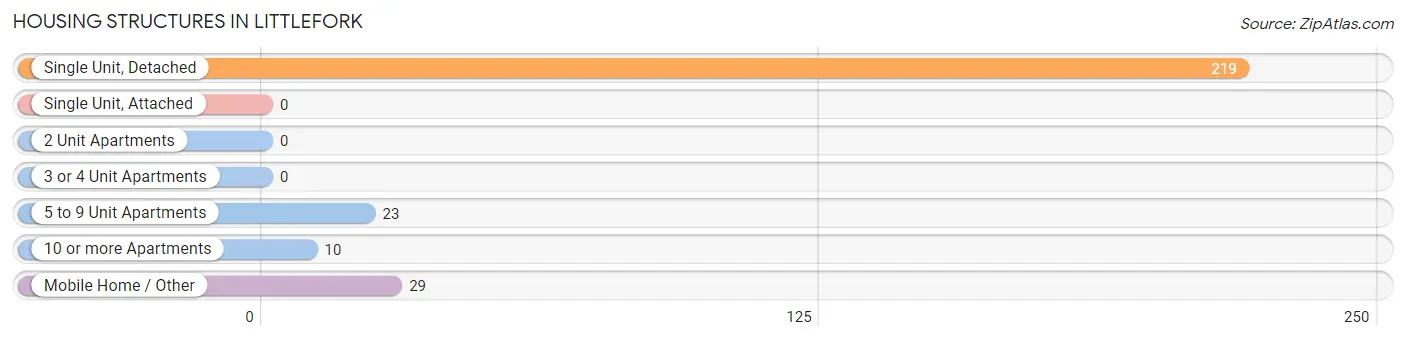
| Structure Type | # Housing Units | % Housing Units |
| Single Unit, Detached | 219 | 77.9% |
| Single Unit, Attached | 0 | 0.0% |
| 2 Unit Apartments | 0 | 0.0% |
| 3 or 4 Unit Apartments | 0 | 0.0% |
| 5 to 9 Unit Apartments | 23 | 8.2% |
| 10 or more Apartments | 10 | 3.6% |
| Mobile Home / Other | 29 | 10.3% |
| Total | 281 | 100.0% |
Housing Structures by Occupancy in Littlefork
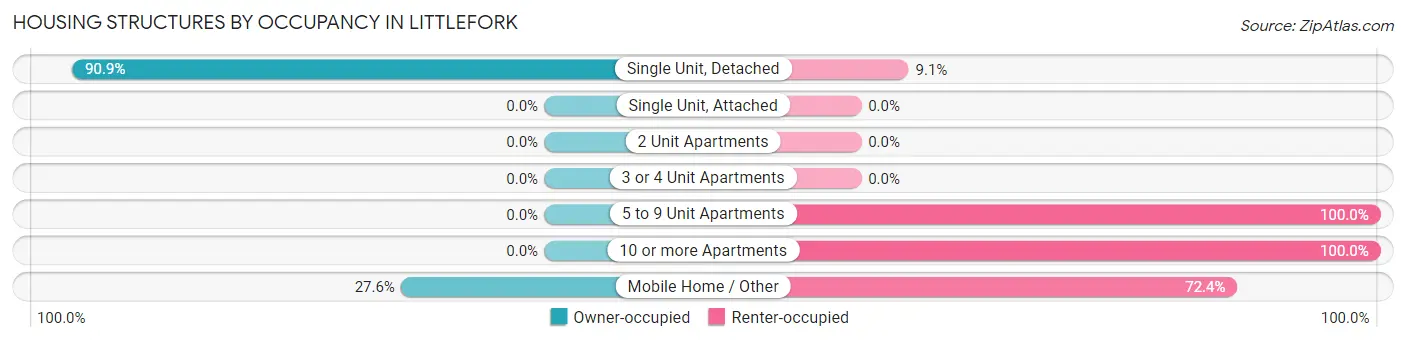
| Structure Type | Owner-occupied | Renter-occupied |
| Single Unit, Detached | 199 (90.9%) | 20 (9.1%) |
| Single Unit, Attached | 0 (0.0%) | 0 (0.0%) |
| 2 Unit Apartments | 0 (0.0%) | 0 (0.0%) |
| 3 or 4 Unit Apartments | 0 (0.0%) | 0 (0.0%) |
| 5 to 9 Unit Apartments | 0 (0.0%) | 23 (100.0%) |
| 10 or more Apartments | 0 (0.0%) | 10 (100.0%) |
| Mobile Home / Other | 8 (27.6%) | 21 (72.4%) |
| Total | 207 (73.7%) | 74 (26.3%) |
Housing Structures by Number of Rooms in Littlefork
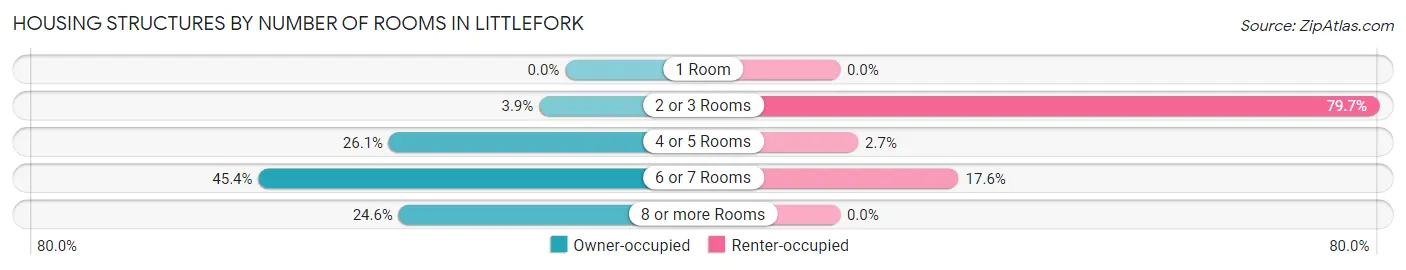
| Number of Rooms | Owner-occupied | Renter-occupied |
| 1 Room | 0 (0.0%) | 0 (0.0%) |
| 2 or 3 Rooms | 8 (3.9%) | 59 (79.7%) |
| 4 or 5 Rooms | 54 (26.1%) | 2 (2.7%) |
| 6 or 7 Rooms | 94 (45.4%) | 13 (17.6%) |
| 8 or more Rooms | 51 (24.6%) | 0 (0.0%) |
| Total | 207 (100.0%) | 74 (100.0%) |
Housing Structure by Heating Type in Littlefork
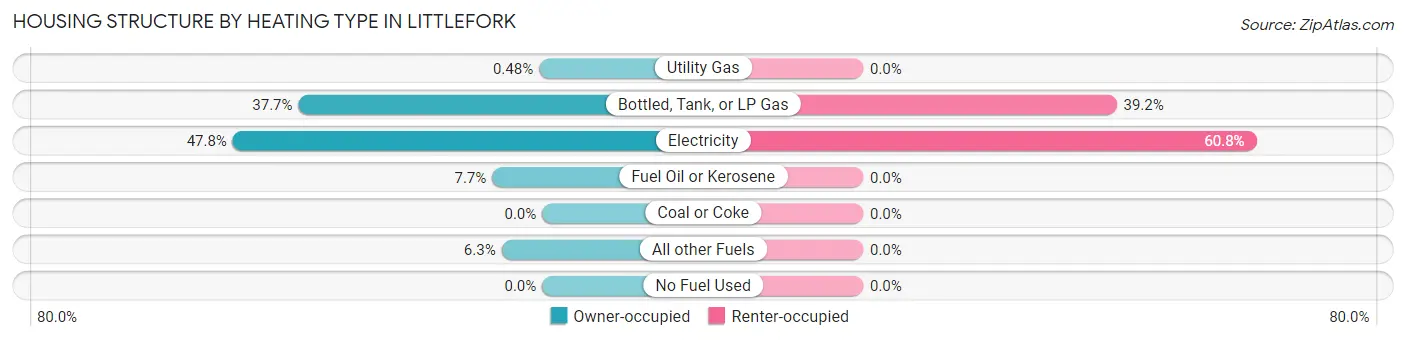
| Heating Type | Owner-occupied | Renter-occupied |
| Utility Gas | 1 (0.5%) | 0 (0.0%) |
| Bottled, Tank, or LP Gas | 78 (37.7%) | 29 (39.2%) |
| Electricity | 99 (47.8%) | 45 (60.8%) |
| Fuel Oil or Kerosene | 16 (7.7%) | 0 (0.0%) |
| Coal or Coke | 0 (0.0%) | 0 (0.0%) |
| All other Fuels | 13 (6.3%) | 0 (0.0%) |
| No Fuel Used | 0 (0.0%) | 0 (0.0%) |
| Total | 207 (100.0%) | 74 (100.0%) |
Household Vehicle Usage in Littlefork
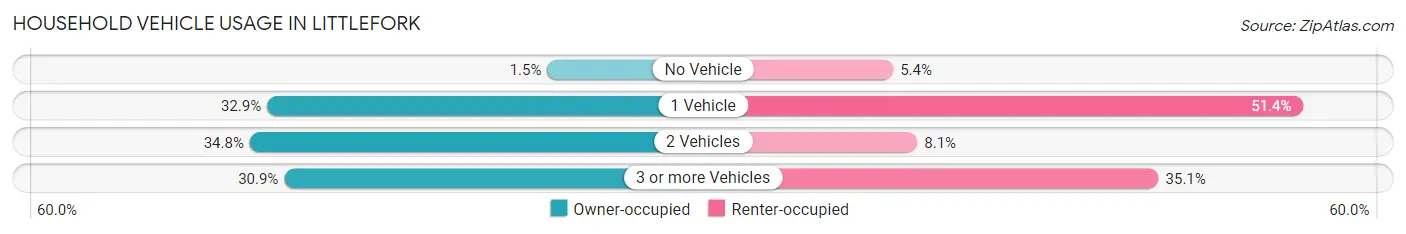
| Vehicles per Household | Owner-occupied | Renter-occupied |
| No Vehicle | 3 (1.5%) | 4 (5.4%) |
| 1 Vehicle | 68 (32.9%) | 38 (51.3%) |
| 2 Vehicles | 72 (34.8%) | 6 (8.1%) |
| 3 or more Vehicles | 64 (30.9%) | 26 (35.1%) |
| Total | 207 (100.0%) | 74 (100.0%) |
Real Estate & Mortgages in Littlefork
Real Estate and Mortgage Overview in Littlefork
| Characteristic | Without Mortgage | With Mortgage |
| Housing Units | 127 | 80 |
| Median Property Value | $67,700 | $152,800 |
| Median Household Income | $46,250 | $17 |
| Monthly Housing Costs | $614 | $0 |
| Real Estate Taxes | $803 | $0 |
Property Value by Mortgage Status in Littlefork
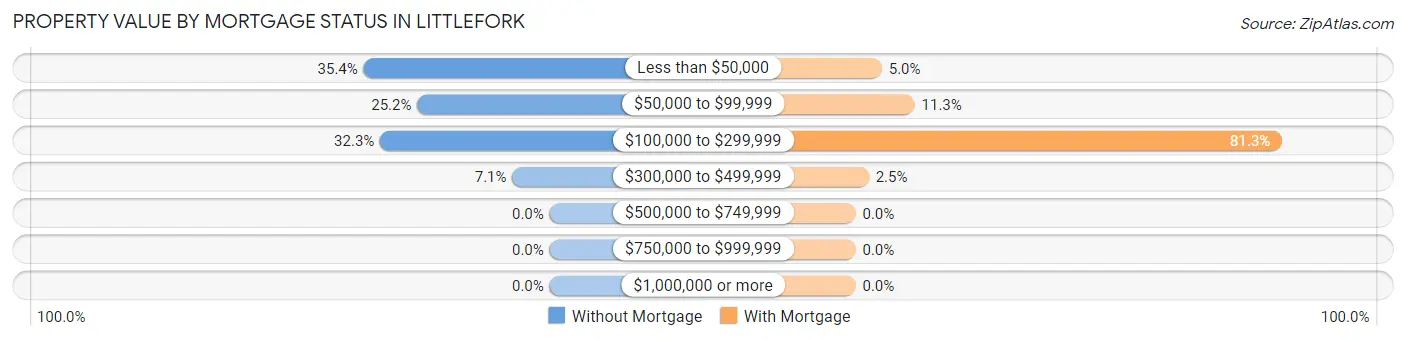
| Property Value | Without Mortgage | With Mortgage |
| Less than $50,000 | 45 (35.4%) | 4 (5.0%) |
| $50,000 to $99,999 | 32 (25.2%) | 9 (11.3%) |
| $100,000 to $299,999 | 41 (32.3%) | 65 (81.2%) |
| $300,000 to $499,999 | 9 (7.1%) | 2 (2.5%) |
| $500,000 to $749,999 | 0 (0.0%) | 0 (0.0%) |
| $750,000 to $999,999 | 0 (0.0%) | 0 (0.0%) |
| $1,000,000 or more | 0 (0.0%) | 0 (0.0%) |
| Total | 127 (100.0%) | 80 (100.0%) |
Household Income by Mortgage Status in Littlefork
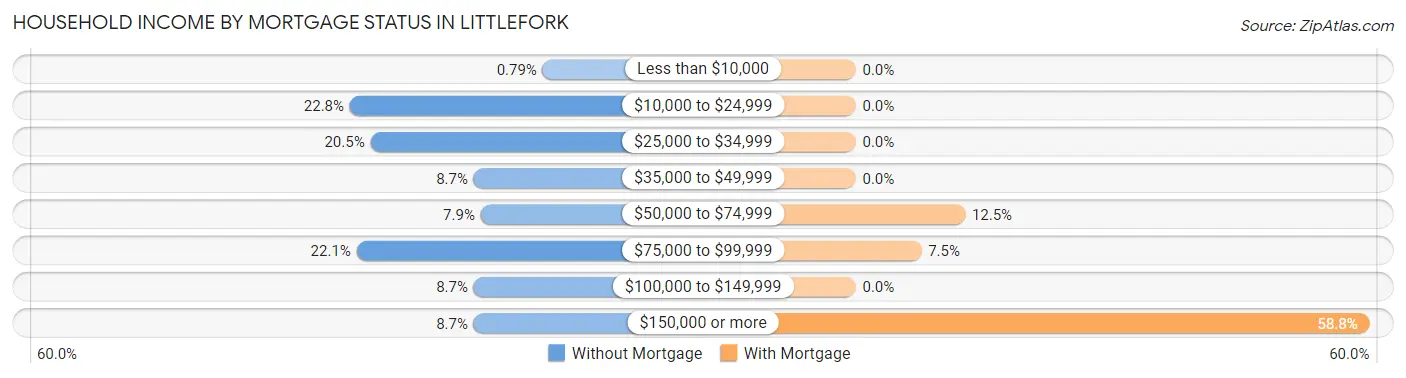
| Household Income | Without Mortgage | With Mortgage |
| Less than $10,000 | 1 (0.8%) | 0 (0.0%) |
| $10,000 to $24,999 | 29 (22.8%) | 0 (0.0%) |
| $25,000 to $34,999 | 26 (20.5%) | 0 (0.0%) |
| $35,000 to $49,999 | 11 (8.7%) | 0 (0.0%) |
| $50,000 to $74,999 | 10 (7.9%) | 10 (12.5%) |
| $75,000 to $99,999 | 28 (22.1%) | 6 (7.5%) |
| $100,000 to $149,999 | 11 (8.7%) | 0 (0.0%) |
| $150,000 or more | 11 (8.7%) | 47 (58.8%) |
| Total | 127 (100.0%) | 80 (100.0%) |
Property Value to Household Income Ratio in Littlefork
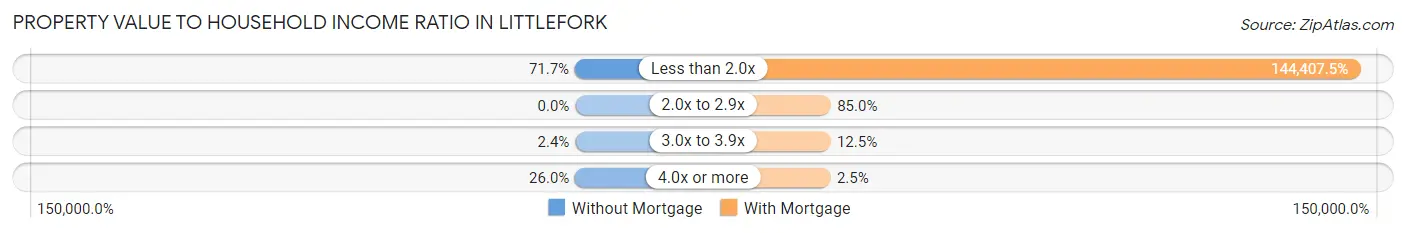
| Value-to-Income Ratio | Without Mortgage | With Mortgage |
| Less than 2.0x | 91 (71.7%) | 115,526 (144,407.5%) |
| 2.0x to 2.9x | 0 (0.0%) | 68 (85.0%) |
| 3.0x to 3.9x | 3 (2.4%) | 10 (12.5%) |
| 4.0x or more | 33 (26.0%) | 2 (2.5%) |
| Total | 127 (100.0%) | 80 (100.0%) |
Real Estate Taxes by Mortgage Status in Littlefork
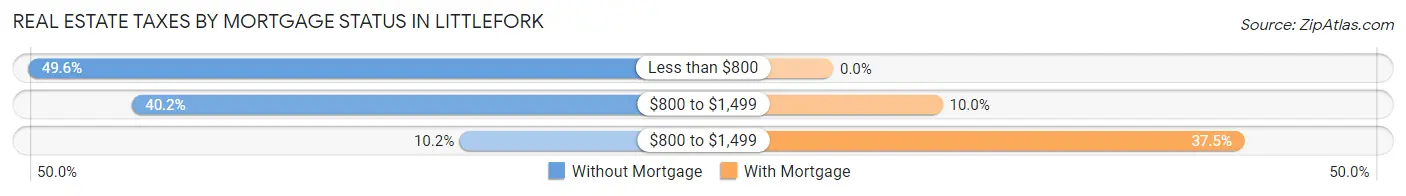
| Property Taxes | Without Mortgage | With Mortgage |
| Less than $800 | 63 (49.6%) | 0 (0.0%) |
| $800 to $1,499 | 51 (40.2%) | 8 (10.0%) |
| $800 to $1,499 | 13 (10.2%) | 30 (37.5%) |
| Total | 127 (100.0%) | 80 (100.0%) |
Health & Disability in Littlefork
Health Insurance Coverage by Age in Littlefork
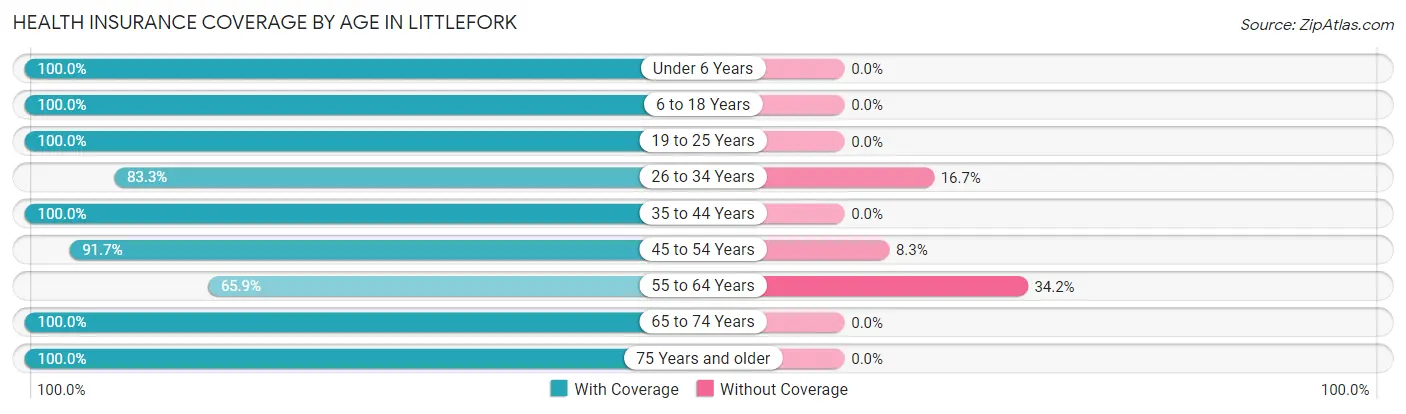
| Age Bracket | With Coverage | Without Coverage |
| Under 6 Years | 21 (100.0%) | 0 (0.0%) |
| 6 to 18 Years | 50 (100.0%) | 0 (0.0%) |
| 19 to 25 Years | 58 (100.0%) | 0 (0.0%) |
| 26 to 34 Years | 40 (83.3%) | 8 (16.7%) |
| 35 to 44 Years | 60 (100.0%) | 0 (0.0%) |
| 45 to 54 Years | 77 (91.7%) | 7 (8.3%) |
| 55 to 64 Years | 81 (65.8%) | 42 (34.2%) |
| 65 to 74 Years | 38 (100.0%) | 0 (0.0%) |
| 75 Years and older | 75 (100.0%) | 0 (0.0%) |
| Total | 500 (89.8%) | 57 (10.2%) |
Health Insurance Coverage by Citizenship Status in Littlefork

| Citizenship Status | With Coverage | Without Coverage |
| Native Born | 21 (100.0%) | 0 (0.0%) |
| Foreign Born, Citizen | 50 (100.0%) | 0 (0.0%) |
| Foreign Born, not a Citizen | 58 (100.0%) | 0 (0.0%) |
Health Insurance Coverage by Household Income in Littlefork
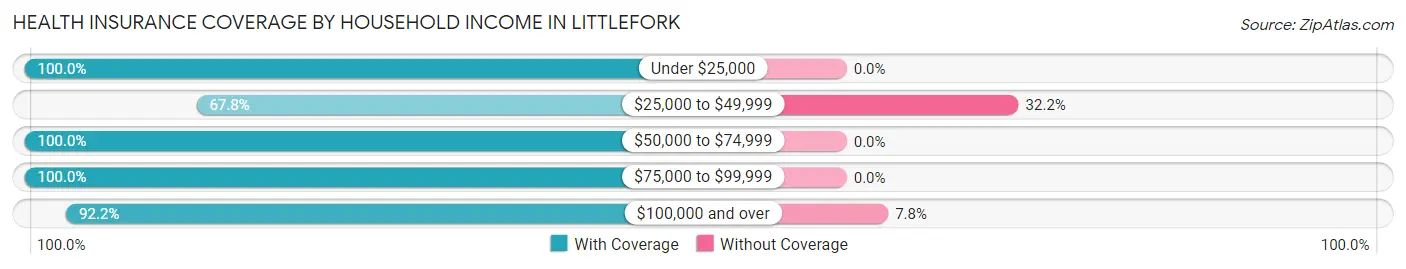
| Household Income | With Coverage | Without Coverage |
| Under $25,000 | 61 (100.0%) | 0 (0.0%) |
| $25,000 to $49,999 | 80 (67.8%) | 38 (32.2%) |
| $50,000 to $74,999 | 78 (100.0%) | 0 (0.0%) |
| $75,000 to $99,999 | 55 (100.0%) | 0 (0.0%) |
| $100,000 and over | 226 (92.2%) | 19 (7.8%) |
Public vs Private Health Insurance Coverage by Age in Littlefork
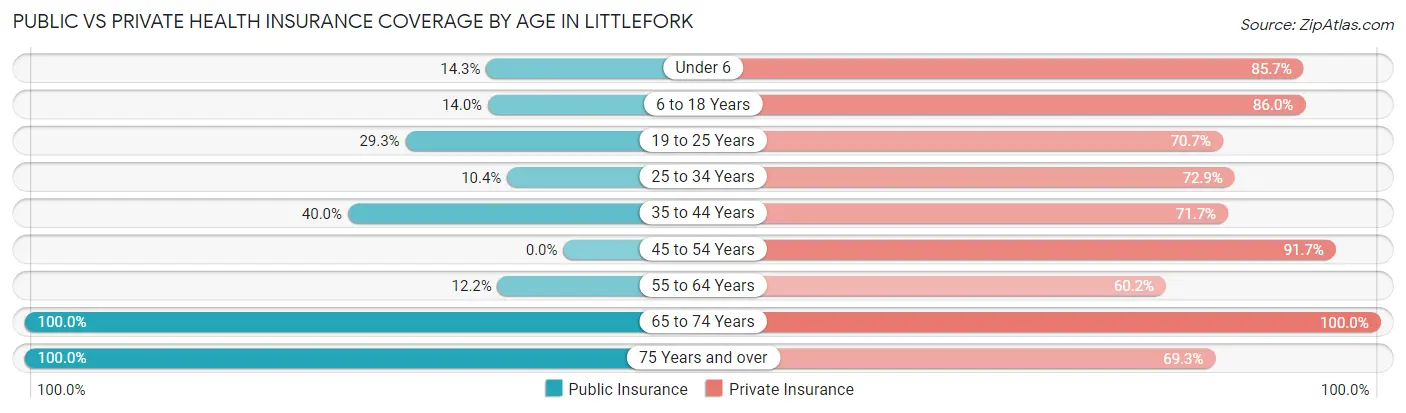
| Age Bracket | Public Insurance | Private Insurance |
| Under 6 | 3 (14.3%) | 18 (85.7%) |
| 6 to 18 Years | 7 (14.0%) | 43 (86.0%) |
| 19 to 25 Years | 17 (29.3%) | 41 (70.7%) |
| 25 to 34 Years | 5 (10.4%) | 35 (72.9%) |
| 35 to 44 Years | 24 (40.0%) | 43 (71.7%) |
| 45 to 54 Years | 0 (0.0%) | 77 (91.7%) |
| 55 to 64 Years | 15 (12.2%) | 74 (60.2%) |
| 65 to 74 Years | 38 (100.0%) | 38 (100.0%) |
| 75 Years and over | 75 (100.0%) | 52 (69.3%) |
| Total | 184 (33.0%) | 421 (75.6%) |
Disability Status by Sex by Age in Littlefork
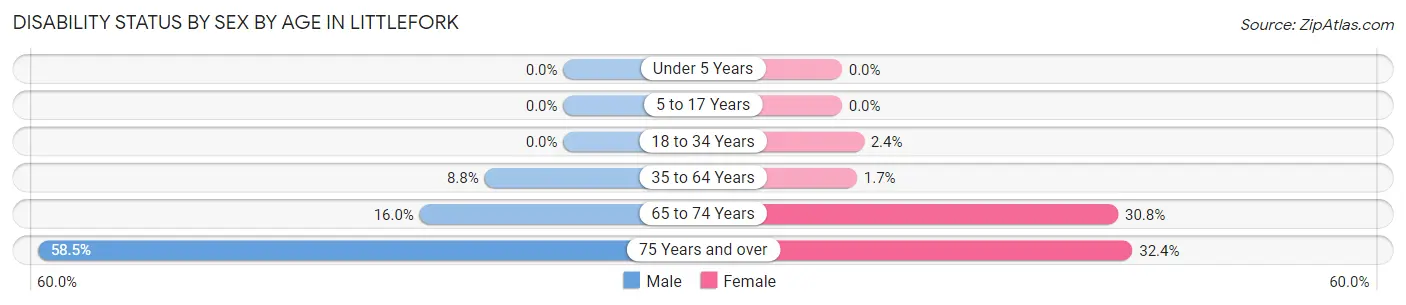
| Age Bracket | Male | Female |
| Under 5 Years | 0 (0.0%) | 0 (0.0%) |
| 5 to 17 Years | 0 (0.0%) | 0 (0.0%) |
| 18 to 34 Years | 0 (0.0%) | 1 (2.4%) |
| 35 to 64 Years | 13 (8.8%) | 2 (1.7%) |
| 65 to 74 Years | 4 (16.0%) | 4 (30.8%) |
| 75 Years and over | 24 (58.5%) | 11 (32.4%) |
Disability Class by Sex by Age in Littlefork
Disability Class: Hearing Difficulty
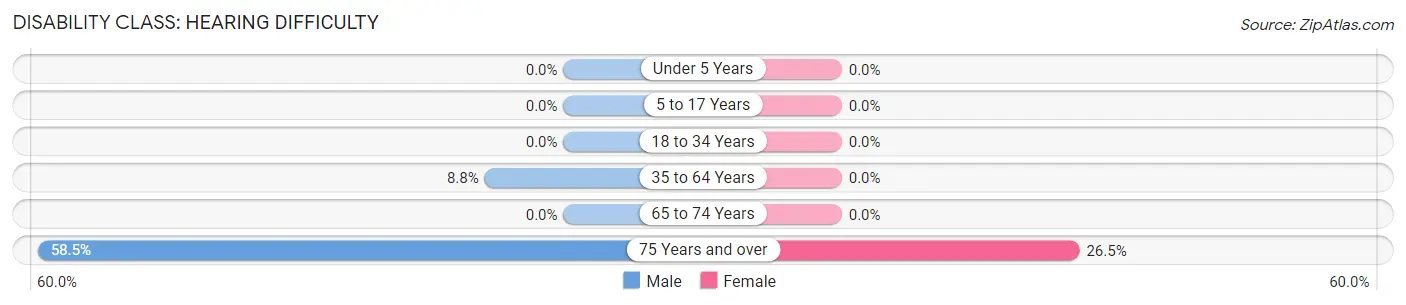
| Age Bracket | Male | Female |
| Under 5 Years | 0 (0.0%) | 0 (0.0%) |
| 5 to 17 Years | 0 (0.0%) | 0 (0.0%) |
| 18 to 34 Years | 0 (0.0%) | 0 (0.0%) |
| 35 to 64 Years | 13 (8.8%) | 0 (0.0%) |
| 65 to 74 Years | 0 (0.0%) | 0 (0.0%) |
| 75 Years and over | 24 (58.5%) | 9 (26.5%) |
Disability Class: Vision Difficulty
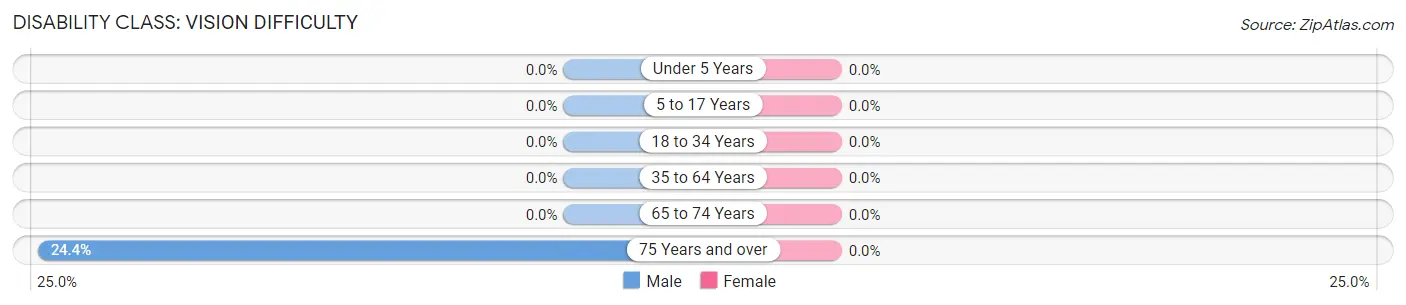
| Age Bracket | Male | Female |
| Under 5 Years | 0 (0.0%) | 0 (0.0%) |
| 5 to 17 Years | 0 (0.0%) | 0 (0.0%) |
| 18 to 34 Years | 0 (0.0%) | 0 (0.0%) |
| 35 to 64 Years | 0 (0.0%) | 0 (0.0%) |
| 65 to 74 Years | 0 (0.0%) | 0 (0.0%) |
| 75 Years and over | 10 (24.4%) | 0 (0.0%) |
Disability Class: Cognitive Difficulty
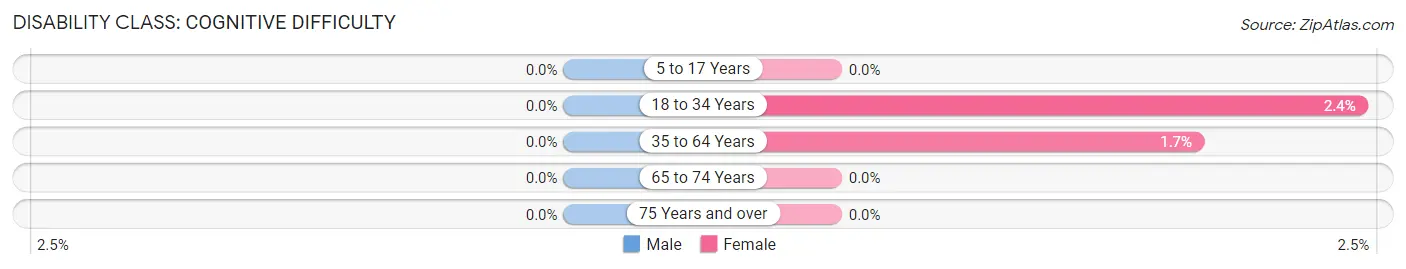
| Age Bracket | Male | Female |
| 5 to 17 Years | 0 (0.0%) | 0 (0.0%) |
| 18 to 34 Years | 0 (0.0%) | 1 (2.4%) |
| 35 to 64 Years | 0 (0.0%) | 2 (1.7%) |
| 65 to 74 Years | 0 (0.0%) | 0 (0.0%) |
| 75 Years and over | 0 (0.0%) | 0 (0.0%) |
Disability Class: Ambulatory Difficulty
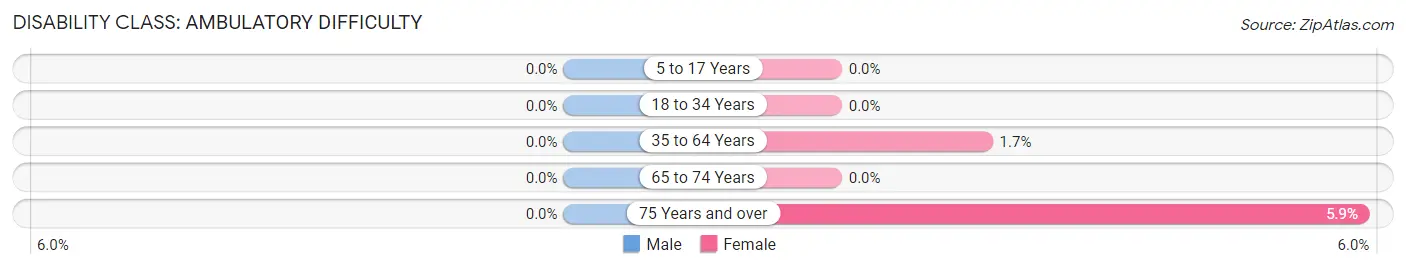
| Age Bracket | Male | Female |
| 5 to 17 Years | 0 (0.0%) | 0 (0.0%) |
| 18 to 34 Years | 0 (0.0%) | 0 (0.0%) |
| 35 to 64 Years | 0 (0.0%) | 2 (1.7%) |
| 65 to 74 Years | 0 (0.0%) | 0 (0.0%) |
| 75 Years and over | 0 (0.0%) | 2 (5.9%) |
Disability Class: Self-Care Difficulty
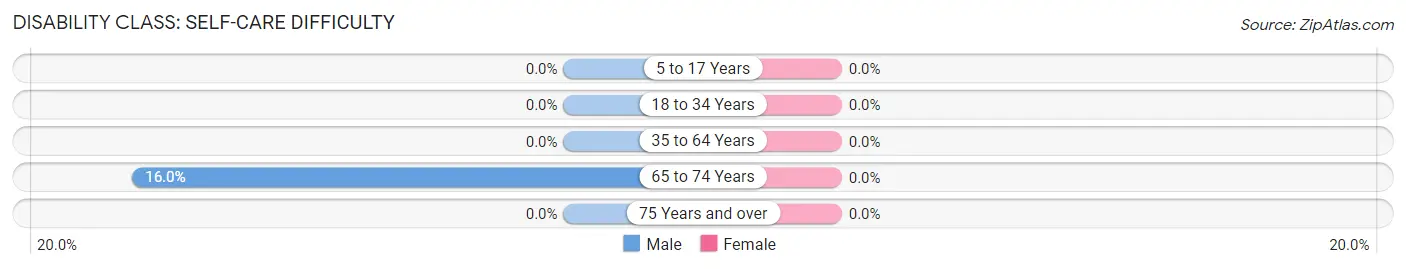
| Age Bracket | Male | Female |
| 5 to 17 Years | 0 (0.0%) | 0 (0.0%) |
| 18 to 34 Years | 0 (0.0%) | 0 (0.0%) |
| 35 to 64 Years | 0 (0.0%) | 0 (0.0%) |
| 65 to 74 Years | 4 (16.0%) | 0 (0.0%) |
| 75 Years and over | 0 (0.0%) | 0 (0.0%) |
Technology Access in Littlefork
Computing Device Access in Littlefork
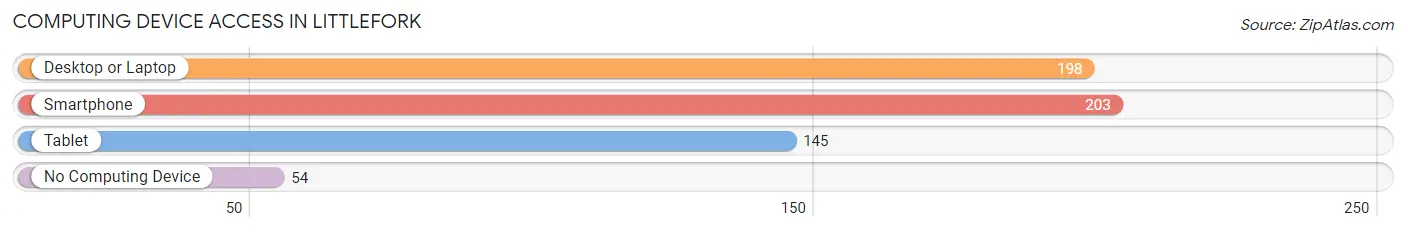
| Device Type | # Households | % Households |
| Desktop or Laptop | 198 | 70.5% |
| Smartphone | 203 | 72.2% |
| Tablet | 145 | 51.6% |
| No Computing Device | 54 | 19.2% |
| Total | 281 | 100.0% |
Internet Access in Littlefork
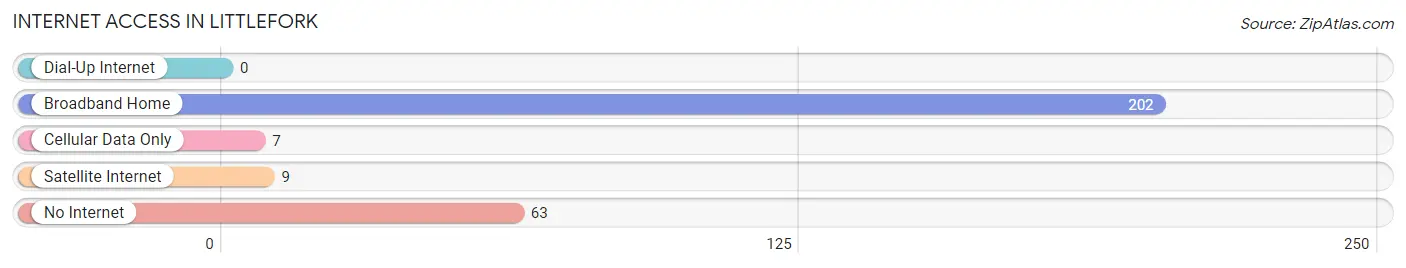
| Internet Type | # Households | % Households |
| Dial-Up Internet | 0 | 0.0% |
| Broadband Home | 202 | 71.9% |
| Cellular Data Only | 7 | 2.5% |
| Satellite Internet | 9 | 3.2% |
| No Internet | 63 | 22.4% |
| Total | 281 | 100.0% |
Littlefork Summary
Forked River, Minnesota is a small town located in the northern part of the state, near the Canadian border. It is situated in Koochiching County, and is part of the International Falls Micropolitan Statistical Area. The town was founded in 1887 and has a population of approximately 500 people.
History
Littlefork, Minnesota was founded in 1887 by a group of Finnish immigrants who were looking for a place to settle and start a new life. The town was originally called “Forked River” due to the two rivers that ran through the area. The town was officially incorporated in 1891 and the name was changed to Littlefork in 1895.
The town was originally a logging and farming community, and the economy was largely based on these two industries. The logging industry was especially important to the town, as it provided jobs and income for many of the residents. The town also had a sawmill, which was used to process the logs that were harvested from the surrounding forests.
In the early 1900s, the town began to experience a period of growth and development. The railroad was extended to the town in 1906, which allowed for easier transportation of goods and people. This helped to spur the growth of the town, as it allowed for more people to move to the area and for businesses to be established.
The town continued to grow throughout the 20th century, and by the year 2000, the population had grown to approximately 500 people.
Geography
Littlefork, Minnesota is located in the northern part of the state, near the Canadian border. It is situated in Koochiching County, and is part of the International Falls Micropolitan Statistical Area. The town is located on the banks of the Littlefork River, which is a tributary of the Rainy River.
The town is surrounded by forests and lakes, and is a popular destination for outdoor activities such as fishing, hunting, and camping. The town is also located near Voyageurs National Park, which is a popular destination for tourists.
Economy
The economy of Littlefork, Minnesota is largely based on tourism and outdoor recreation. The town is a popular destination for fishing, hunting, and camping, and there are several resorts and lodges in the area. The town also has a few small businesses, such as a grocery store, a hardware store, and a few restaurants.
The town is also home to a few manufacturing companies, such as a paper mill and a wood products plant. These companies provide jobs for many of the residents of the town.
Demographics
As of the 2010 census, the population of Littlefork, Minnesota was 498 people. The racial makeup of the town was 97.2% White, 0.2% African American, 0.2% Native American, 0.2% Asian, 0.2% from other races, and 1.8% from two or more races. Hispanic or Latino of any race were 0.8% of the population.
The median income for a household in the town was $35,625, and the median income for a family was $41,250. The per capita income for the town was $17,845. About 11.2% of families and 14.2% of the population were below the poverty line, including 18.2% of those under age 18 and none of those age 65 or over.
Common Questions
What is Per Capita Income in Littlefork?
Per Capita income in Littlefork is $37,649.
What is the Median Family Income in Littlefork?
Median Family Income in Littlefork is $107,188.
What is the Median Household income in Littlefork?
Median Household Income in Littlefork is $58,641.
What is Inequality or Gini Index in Littlefork?
Inequality or Gini Index in Littlefork is 0.37.
What is the Total Population of Littlefork?
Total Population of Littlefork is 611.
What is the Total Male Population of Littlefork?
Total Male Population of Littlefork is 287.
What is the Total Female Population of Littlefork?
Total Female Population of Littlefork is 324.
What is the Ratio of Males per 100 Females in Littlefork?
There are 88.58 Males per 100 Females in Littlefork.
What is the Ratio of Females per 100 Males in Littlefork?
There are 112.89 Females per 100 Males in Littlefork.
What is the Median Population Age in Littlefork?
Median Population Age in Littlefork is 51.7 Years.
What is the Average Family Size in Littlefork
Average Family Size in Littlefork is 2.9 People.
What is the Average Household Size in Littlefork
Average Household Size in Littlefork is 2.0 People.
How Large is the Labor Force in Littlefork?
There are 326 People in the Labor Forcein in Littlefork.
What is the Percentage of People in the Labor Force in Littlefork?
59.6% of People are in the Labor Force in Littlefork.
What is the Unemployment Rate in Littlefork?
Unemployment Rate in Littlefork is 1.5%.