Cities with the Youngest Female Population in Minnesota
RELATED REPORTS & OPTIONS
Youngest Population | Female
Minnesota
Compare Cities
Map of Cities with the Youngest Female Population in Minnesota
40.0
0.0
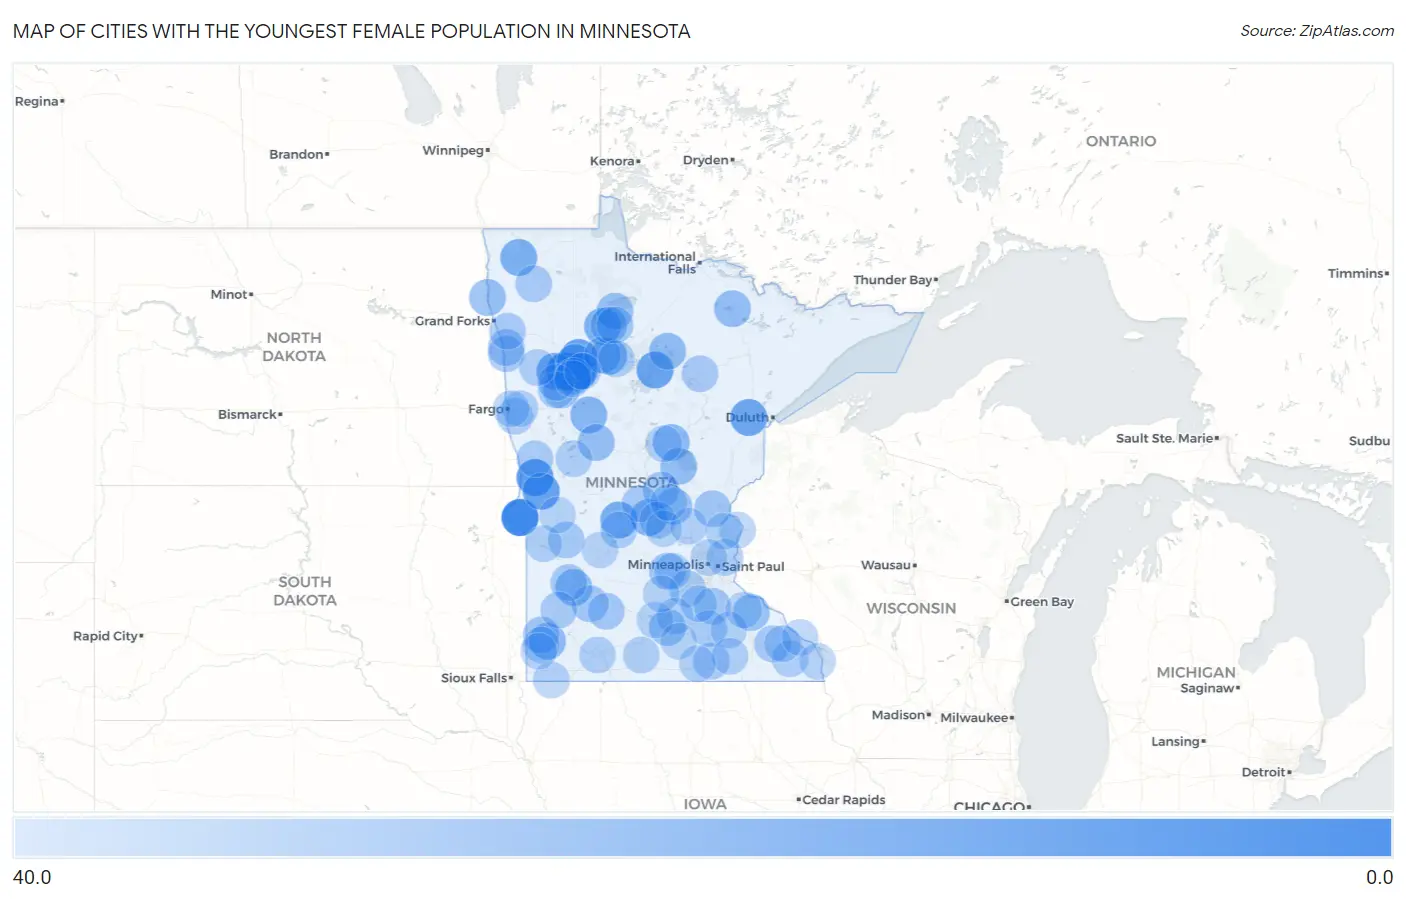
Cities with the Youngest Female Population in Minnesota
| City | Median Age | vs State | vs National | |
| 1. | West Roy Lake | 7.9 | 39.2 (-31.3)#1 | 39.7 (-31.8)#32 |
| 2. | Midway | 9.5 | 39.2 (-29.7)#2 | 39.7 (-30.2)#51 |
| 3. | Barry | 9.5 | 39.2 (-29.7)#3 | 39.7 (-30.2)#53 |
| 4. | Nashua | 14.6 | 39.2 (-24.6)#4 | 39.7 (-25.1)#169 |
| 5. | Roy Lake | 14.9 | 39.2 (-24.3)#5 | 39.7 (-24.8)#191 |
| 6. | Norcross | 16.9 | 39.2 (-22.3)#6 | 39.7 (-22.8)#285 |
| 7. | Ebro | 17.3 | 39.2 (-21.9)#7 | 39.7 (-22.4)#305 |
| 8. | Bena | 17.7 | 39.2 (-21.5)#8 | 39.7 (-22.0)#328 |
| 9. | Mahnomen | 18.2 | 39.2 (-21.0)#9 | 39.7 (-21.5)#361 |
| 10. | St. John's University | 19.7 | 39.2 (-19.5)#10 | 39.7 (-20.0)#486 |
| 11. | Riverland | 19.7 | 39.2 (-19.5)#11 | 39.7 (-20.0)#488 |
| 12. | Spring Hill | 20.0 | 39.2 (-19.2)#12 | 39.7 (-19.7)#543 |
| 13. | Little Rock | 20.8 | 39.2 (-18.4)#13 | 39.7 (-18.9)#641 |
| 14. | Halma | 20.8 | 39.2 (-18.4)#14 | 39.7 (-18.9)#651 |
| 15. | Crown College | 21.1 | 39.2 (-18.1)#15 | 39.7 (-18.6)#688 |
| 16. | St Joseph | 22.3 | 39.2 (-16.9)#16 | 39.7 (-17.4)#848 |
| 17. | Pine Bend | 22.3 | 39.2 (-16.9)#17 | 39.7 (-17.4)#858 |
| 18. | Wilton | 22.4 | 39.2 (-16.8)#18 | 39.7 (-17.3)#866 |
| 19. | Wolf Lake | 22.8 | 39.2 (-16.4)#19 | 39.7 (-16.9)#943 |
| 20. | Woodstock | 23.7 | 39.2 (-15.5)#20 | 39.7 (-16.0)#1,090 |
| 21. | Deerwood | 24.0 | 39.2 (-15.2)#21 | 39.7 (-15.7)#1,138 |
| 22. | Inger | 24.9 | 39.2 (-14.3)#22 | 39.7 (-14.8)#1,315 |
| 23. | Hanley Falls | 25.0 | 39.2 (-14.2)#23 | 39.7 (-14.7)#1,326 |
| 24. | Orr | 25.1 | 39.2 (-14.1)#24 | 39.7 (-14.6)#1,345 |
| 25. | Vineland | 25.4 | 39.2 (-13.8)#25 | 39.7 (-14.3)#1,377 |
| 26. | Bluffton | 25.5 | 39.2 (-13.7)#26 | 39.7 (-14.2)#1,397 |
| 27. | Oslo | 25.7 | 39.2 (-13.5)#27 | 39.7 (-14.0)#1,446 |
| 28. | Solway | 25.8 | 39.2 (-13.4)#28 | 39.7 (-13.9)#1,473 |
| 29. | Ponemah | 26.4 | 39.2 (-12.8)#29 | 39.7 (-13.3)#1,562 |
| 30. | Bellechester | 26.5 | 39.2 (-12.7)#30 | 39.7 (-13.2)#1,600 |
| 31. | Ronneby | 26.5 | 39.2 (-12.7)#31 | 39.7 (-13.2)#1,604 |
| 32. | White Earth | 26.9 | 39.2 (-12.3)#32 | 39.7 (-12.8)#1,702 |
| 33. | New Germany | 26.9 | 39.2 (-12.3)#33 | 39.7 (-12.8)#1,704 |
| 34. | Mankato | 27.1 | 39.2 (-12.1)#34 | 39.7 (-12.6)#1,751 |
| 35. | Red Lake | 27.1 | 39.2 (-12.1)#35 | 39.7 (-12.6)#1,757 |
| 36. | Naytahwaush | 27.5 | 39.2 (-11.7)#36 | 39.7 (-12.2)#1,863 |
| 37. | Climax | 27.5 | 39.2 (-11.7)#37 | 39.7 (-12.2)#1,868 |
| 38. | Seaforth | 27.6 | 39.2 (-11.6)#38 | 39.7 (-12.1)#1,896 |
| 39. | Northfield | 27.7 | 39.2 (-11.5)#39 | 39.7 (-12.0)#1,899 |
| 40. | Stanchfield | 27.7 | 39.2 (-11.5)#40 | 39.7 (-12.0)#1,922 |
| 41. | Holland | 27.8 | 39.2 (-11.4)#41 | 39.7 (-11.9)#1,954 |
| 42. | Redby | 27.9 | 39.2 (-11.3)#42 | 39.7 (-11.8)#1,982 |
| 43. | Buckman | 28.0 | 39.2 (-11.2)#43 | 39.7 (-11.7)#2,035 |
| 44. | Clements | 28.5 | 39.2 (-10.7)#44 | 39.7 (-11.2)#2,181 |
| 45. | Danvers | 28.7 | 39.2 (-10.5)#45 | 39.7 (-11.0)#2,275 |
| 46. | Hazel Run | 28.9 | 39.2 (-10.3)#46 | 39.7 (-10.8)#2,364 |
| 47. | Dover | 29.0 | 39.2 (-10.2)#47 | 39.7 (-10.7)#2,385 |
| 48. | Ogema | 29.1 | 39.2 (-10.1)#48 | 39.7 (-10.6)#2,438 |
| 49. | Nielsville | 29.1 | 39.2 (-10.1)#49 | 39.7 (-10.6)#2,445 |
| 50. | Bovey | 29.2 | 39.2 (-10.0)#50 | 39.7 (-10.5)#2,469 |
| 51. | Lynd | 29.2 | 39.2 (-10.0)#51 | 39.7 (-10.5)#2,470 |
| 52. | Fisher | 29.2 | 39.2 (-10.0)#52 | 39.7 (-10.5)#2,471 |
| 53. | Hollandale | 29.2 | 39.2 (-10.0)#53 | 39.7 (-10.5)#2,473 |
| 54. | Holdingford | 29.3 | 39.2 (-9.90)#54 | 39.7 (-10.4)#2,501 |
| 55. | Newfolden | 29.3 | 39.2 (-9.90)#55 | 39.7 (-10.4)#2,507 |
| 56. | Waubun | 29.3 | 39.2 (-9.90)#56 | 39.7 (-10.4)#2,511 |
| 57. | Bemidji | 29.5 | 39.2 (-9.70)#57 | 39.7 (-10.2)#2,582 |
| 58. | Jordan | 29.5 | 39.2 (-9.70)#58 | 39.7 (-10.2)#2,585 |
| 59. | Medford | 29.5 | 39.2 (-9.70)#59 | 39.7 (-10.2)#2,596 |
| 60. | Foxhome | 29.5 | 39.2 (-9.70)#60 | 39.7 (-10.2)#2,623 |
| 61. | Regal | 29.5 | 39.2 (-9.70)#61 | 39.7 (-10.2)#2,627 |
| 62. | St Cloud | 29.9 | 39.2 (-9.30)#62 | 39.7 (-9.80)#2,764 |
| 63. | Sabin | 29.9 | 39.2 (-9.30)#63 | 39.7 (-9.80)#2,800 |
| 64. | Clitherall | 29.9 | 39.2 (-9.30)#64 | 39.7 (-9.80)#2,818 |
| 65. | Wilder | 29.9 | 39.2 (-9.30)#65 | 39.7 (-9.80)#2,822 |
| 66. | Cleveland | 30.0 | 39.2 (-9.20)#66 | 39.7 (-9.70)#2,859 |
| 67. | Gary | 30.0 | 39.2 (-9.20)#67 | 39.7 (-9.70)#2,872 |
| 68. | Mayer | 30.1 | 39.2 (-9.10)#68 | 39.7 (-9.60)#2,891 |
| 69. | Truman | 30.1 | 39.2 (-9.10)#69 | 39.7 (-9.60)#2,896 |
| 70. | Peterson | 30.3 | 39.2 (-8.90)#70 | 39.7 (-9.40)#2,989 |
| 71. | Hatfield | 30.3 | 39.2 (-8.90)#71 | 39.7 (-9.40)#2,998 |
| 72. | Correll | 30.3 | 39.2 (-8.90)#72 | 39.7 (-9.40)#2,999 |
| 73. | Lonsdale | 30.4 | 39.2 (-8.80)#73 | 39.7 (-9.30)#3,010 |
| 74. | Utica | 30.4 | 39.2 (-8.80)#74 | 39.7 (-9.30)#3,036 |
| 75. | West Concord | 30.5 | 39.2 (-8.70)#75 | 39.7 (-9.20)#3,077 |
| 76. | Twin Lakes | 30.5 | 39.2 (-8.70)#76 | 39.7 (-9.20)#3,100 |
| 77. | Waltham | 30.5 | 39.2 (-8.70)#77 | 39.7 (-9.20)#3,104 |
| 78. | St Anthony City Stearns County | 30.5 | 39.2 (-8.70)#78 | 39.7 (-9.20)#3,114 |
| 79. | Manchester | 30.5 | 39.2 (-8.70)#79 | 39.7 (-9.20)#3,115 |
| 80. | Glyndon | 30.6 | 39.2 (-8.60)#80 | 39.7 (-9.10)#3,145 |
| 81. | Willernie | 30.6 | 39.2 (-8.60)#81 | 39.7 (-9.10)#3,160 |
| 82. | Winona | 30.7 | 39.2 (-8.50)#82 | 39.7 (-9.00)#3,181 |
| 83. | Zimmerman | 30.8 | 39.2 (-8.40)#83 | 39.7 (-8.90)#3,233 |
| 84. | South End | 30.8 | 39.2 (-8.40)#84 | 39.7 (-8.90)#3,286 |
| 85. | Shafer | 30.9 | 39.2 (-8.30)#85 | 39.7 (-8.80)#3,321 |
| 86. | Ellsworth | 30.9 | 39.2 (-8.30)#86 | 39.7 (-8.80)#3,331 |
| 87. | Moorhead | 31.0 | 39.2 (-8.20)#87 | 39.7 (-8.70)#3,350 |
| 88. | Riverton | 31.0 | 39.2 (-8.20)#88 | 39.7 (-8.70)#3,397 |
| 89. | Morris | 31.1 | 39.2 (-8.10)#89 | 39.7 (-8.60)#3,414 |
| 90. | Goodhue | 31.1 | 39.2 (-8.10)#90 | 39.7 (-8.60)#3,426 |
| 91. | Clearwater | 31.2 | 39.2 (-8.00)#91 | 39.7 (-8.50)#3,459 |
| 92. | Nicollet | 31.2 | 39.2 (-8.00)#92 | 39.7 (-8.50)#3,471 |
| 93. | Stacy | 31.3 | 39.2 (-7.90)#93 | 39.7 (-8.40)#3,514 |
| 94. | Gilman | 31.3 | 39.2 (-7.90)#94 | 39.7 (-8.40)#3,540 |
| 95. | Arlington | 31.4 | 39.2 (-7.80)#95 | 39.7 (-8.30)#3,571 |
| 96. | Hilltop | 31.5 | 39.2 (-7.70)#96 | 39.7 (-8.20)#3,627 |
| 97. | Trosky | 31.5 | 39.2 (-7.70)#97 | 39.7 (-8.20)#3,669 |
| 98. | Hokah | 31.6 | 39.2 (-7.60)#98 | 39.7 (-8.10)#3,704 |
| 99. | Pennock | 31.6 | 39.2 (-7.60)#99 | 39.7 (-8.10)#3,707 |
| 100. | Pemberton | 31.6 | 39.2 (-7.60)#100 | 39.7 (-8.10)#3,716 |
Common Questions
What are the Top 10 Cities with the Youngest Female Population in Minnesota?
Top 10 Cities with the Youngest Female Population in Minnesota are:
What city has the Youngest Female Population in Minnesota?
West Roy Lake has the Youngest Female Population in Minnesota with 7.9.
What is the Median Female Age in the State of Minnesota?
Median Female Age in Minnesota is 39.2.
What is the Median Female Age in the United States?
Median Female Age in the United States is 39.7.