Birchwood Village, MN Map & Demographics
Birchwood Village Map
Birchwood Village Overview
$67,803
PER CAPITA INCOME
$130,625
AVG FAMILY INCOME
$148,417
AVG HOUSEHOLD INCOME
39.5%
WAGE / INCOME GAP [ % ]
60.5¢/ $1
WAGE / INCOME GAP [ $ ]
0.41
INEQUALITY / GINI INDEX
1,069
TOTAL POPULATION
574
MALE POPULATION
495
FEMALE POPULATION
115.96
MALES / 100 FEMALES
86.24
FEMALES / 100 MALES
39.4
MEDIAN AGE
2.9
AVG FAMILY SIZE
2.7
AVG HOUSEHOLD SIZE
603
LABOR FORCE [ PEOPLE ]
69.2%
PERCENT IN LABOR FORCE
1.7%
UNEMPLOYMENT RATE
Income in Birchwood Village
Income Overview in Birchwood Village
Per Capita Income in Birchwood Village is $67,803, while median incomes of families and households are $130,625 and $148,417 respectively.
| Characteristic | Number | Measure |
| Per Capita Income | 1,069 | $67,803 |
| Median Family Income | 315 | $130,625 |
| Mean Family Income | 315 | $186,158 |
| Median Household Income | 394 | $148,417 |
| Mean Household Income | 394 | $181,928 |
| Income Deficit | 315 | $0 |
| Wage / Income Gap (%) | 1,069 | 39.49% |
| Wage / Income Gap ($) | 1,069 | 60.51¢ per $1 |
| Gini / Inequality Index | 1,069 | 0.41 |
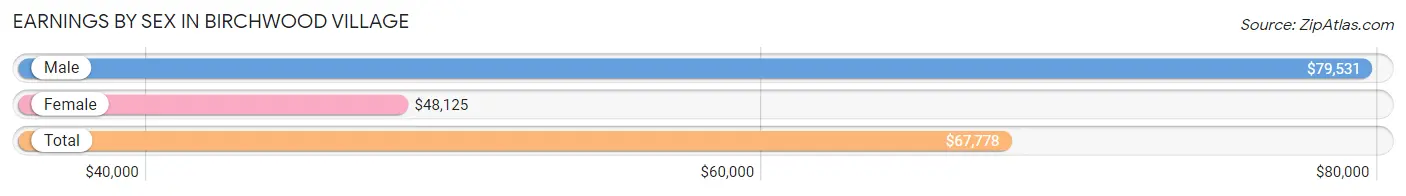
Earnings by Sex in Birchwood Village
Average Earnings in Birchwood Village are $67,778, $79,531 for men and $48,125 for women, a difference of 39.5%.
| Sex | Number | Average Earnings |
| Male | 375 (59.3%) | $79,531 |
| Female | 257 (40.7%) | $48,125 |
| Total | 632 (100.0%) | $67,778 |
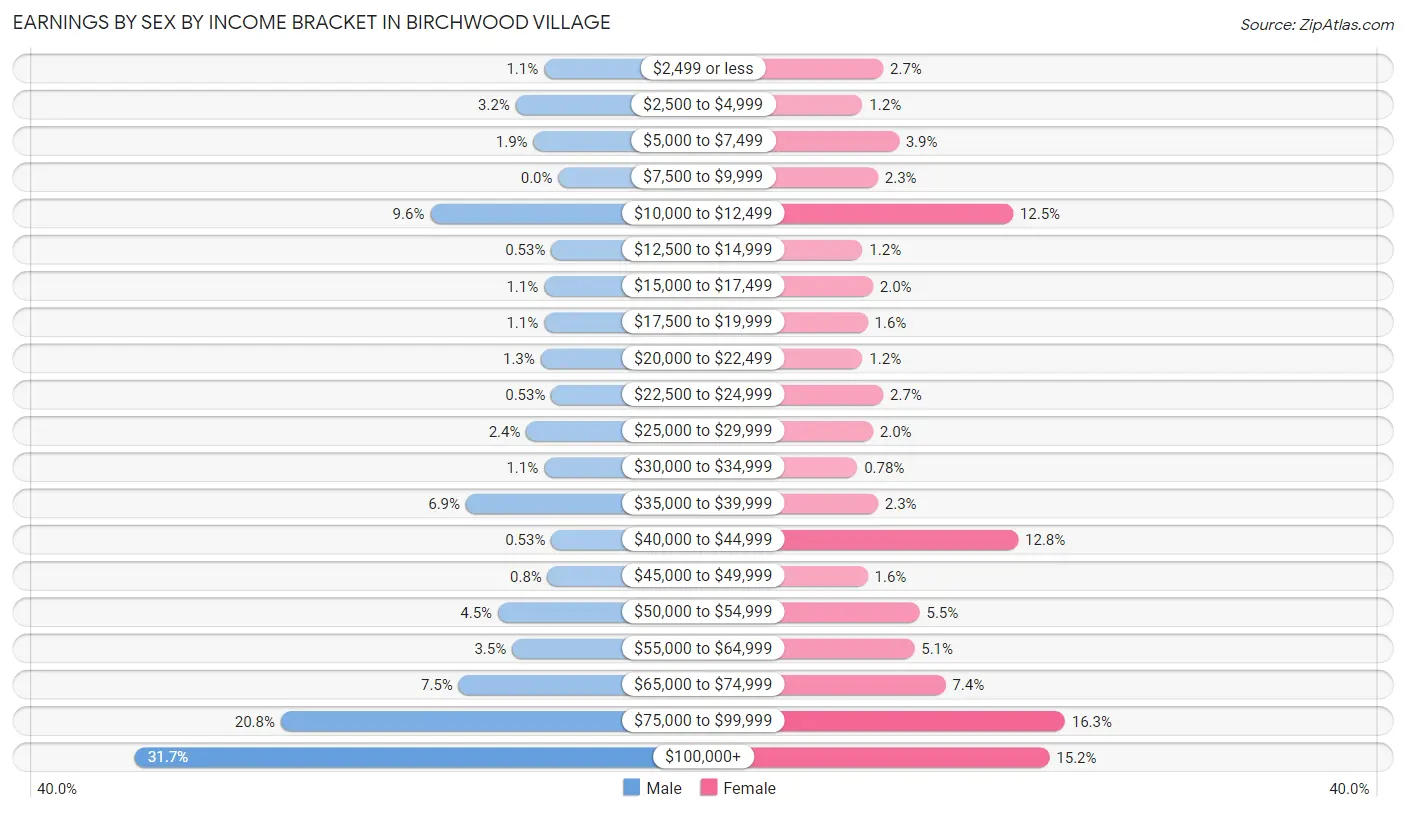
Earnings by Sex by Income Bracket in Birchwood Village
The most common earnings brackets in Birchwood Village are $100,000+ for men (119 | 31.7%) and $75,000 to $99,999 for women (42 | 16.3%).
| Income | Male | Female |
| $2,499 or less | 4 (1.1%) | 7 (2.7%) |
| $2,500 to $4,999 | 12 (3.2%) | 3 (1.2%) |
| $5,000 to $7,499 | 7 (1.9%) | 10 (3.9%) |
| $7,500 to $9,999 | 0 (0.0%) | 6 (2.3%) |
| $10,000 to $12,499 | 36 (9.6%) | 32 (12.4%) |
| $12,500 to $14,999 | 2 (0.5%) | 3 (1.2%) |
| $15,000 to $17,499 | 4 (1.1%) | 5 (1.9%) |
| $17,500 to $19,999 | 4 (1.1%) | 4 (1.6%) |
| $20,000 to $22,499 | 5 (1.3%) | 3 (1.2%) |
| $22,500 to $24,999 | 2 (0.5%) | 7 (2.7%) |
| $25,000 to $29,999 | 9 (2.4%) | 5 (1.9%) |
| $30,000 to $34,999 | 4 (1.1%) | 2 (0.8%) |
| $35,000 to $39,999 | 26 (6.9%) | 6 (2.3%) |
| $40,000 to $44,999 | 2 (0.5%) | 33 (12.8%) |
| $45,000 to $49,999 | 3 (0.8%) | 4 (1.6%) |
| $50,000 to $54,999 | 17 (4.5%) | 14 (5.4%) |
| $55,000 to $64,999 | 13 (3.5%) | 13 (5.1%) |
| $65,000 to $74,999 | 28 (7.5%) | 19 (7.4%) |
| $75,000 to $99,999 | 78 (20.8%) | 42 (16.3%) |
| $100,000+ | 119 (31.7%) | 39 (15.2%) |
| Total | 375 (100.0%) | 257 (100.0%) |
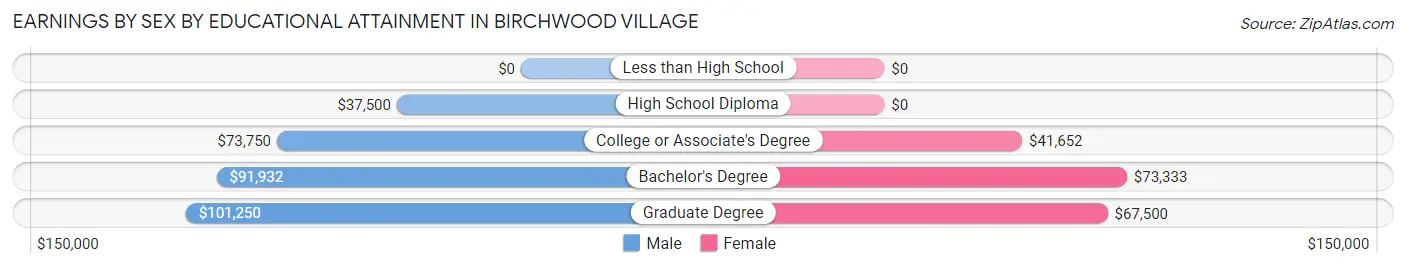
Earnings by Sex by Educational Attainment in Birchwood Village
Average earnings in Birchwood Village are $90,845 for men and $53,500 for women, a difference of 41.1%. Men with an educational attainment of graduate degree enjoy the highest average annual earnings of $101,250, while those with high school diploma education earn the least with $37,500. Women with an educational attainment of bachelor's degree earn the most with the average annual earnings of $73,333, while those with college or associate's degree education have the smallest earnings of $41,652.
| Educational Attainment | Male Income | Female Income |
| Less than High School | - | - |
| High School Diploma | $37,500 | $0 |
| College or Associate's Degree | $73,750 | $41,652 |
| Bachelor's Degree | $91,932 | $73,333 |
| Graduate Degree | $101,250 | $67,500 |
| Total | $90,845 | $53,500 |
Family Income in Birchwood Village
Family Income Brackets in Birchwood Village
According to the Birchwood Village family income data, there are 83 families falling into the $200,000+ income range, which is the most common income bracket and makes up 26.4% of all families.
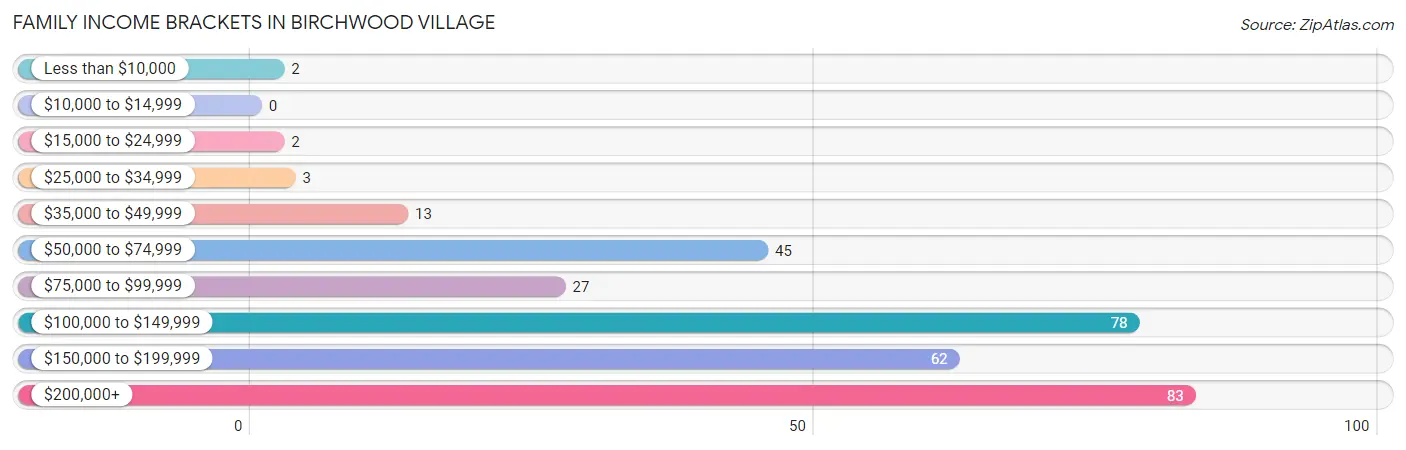
| Income Bracket | # Families | % Families |
| Less than $10,000 | 2 | 0.6% |
| $10,000 to $14,999 | 0 | 0.0% |
| $15,000 to $24,999 | 2 | 0.6% |
| $25,000 to $34,999 | 3 | 1.0% |
| $35,000 to $49,999 | 13 | 4.1% |
| $50,000 to $74,999 | 45 | 14.3% |
| $75,000 to $99,999 | 27 | 8.6% |
| $100,000 to $149,999 | 78 | 24.8% |
| $150,000 to $199,999 | 62 | 19.7% |
| $200,000+ | 83 | 26.3% |
Family Income by Famaliy Size in Birchwood Village
5-person families (21 | 6.7%) account for the highest median family income in Birchwood Village with $250,001 per family, while 2-person families (157 | 49.8%) have the highest median income of $61,420 per family member.
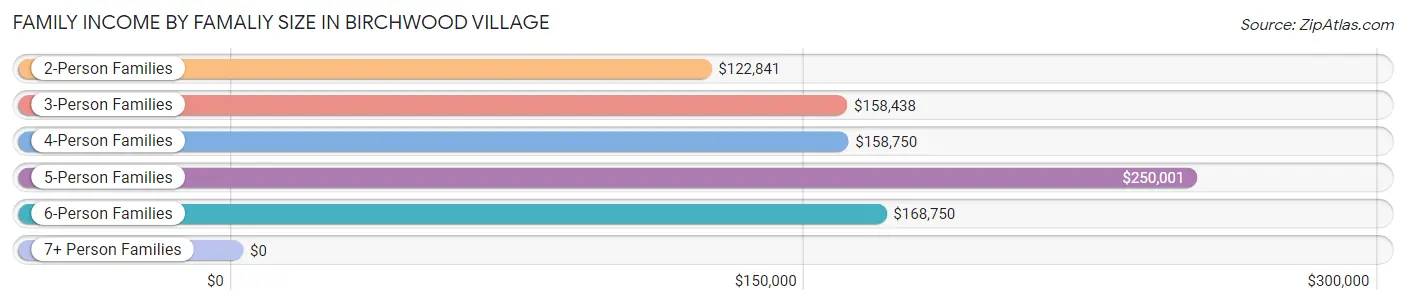
| Income Bracket | # Families | Median Income |
| 2-Person Families | 157 (49.8%) | $122,841 |
| 3-Person Families | 72 (22.9%) | $158,438 |
| 4-Person Families | 56 (17.8%) | $158,750 |
| 5-Person Families | 21 (6.7%) | $250,001 |
| 6-Person Families | 8 (2.5%) | $168,750 |
| 7+ Person Families | 1 (0.3%) | $0 |
| Total | 315 (100.0%) | $130,625 |
Family Income by Number of Earners in Birchwood Village
The median family income in Birchwood Village is $130,625, with families comprising 3+ earners (36) having the highest median family income of $176,389, while families with 1 earner (104) have the lowest median family income of $86,250, accounting for 11.4% and 33.0% of families, respectively.
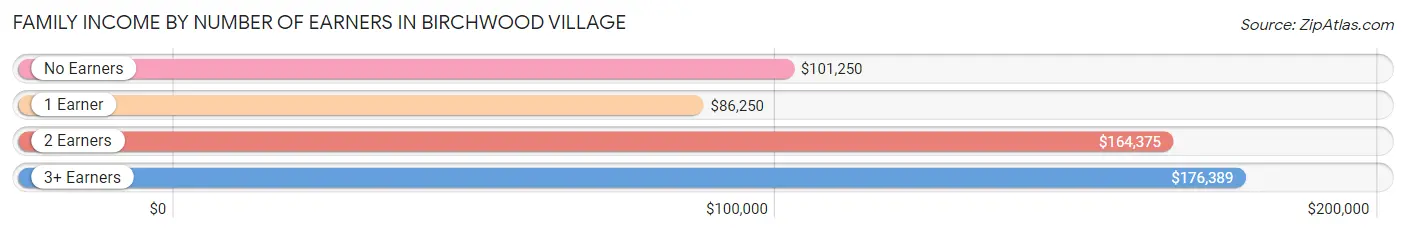
| Number of Earners | # Families | Median Income |
| No Earners | 36 (11.4%) | $101,250 |
| 1 Earner | 104 (33.0%) | $86,250 |
| 2 Earners | 139 (44.1%) | $164,375 |
| 3+ Earners | 36 (11.4%) | $176,389 |
| Total | 315 (100.0%) | $130,625 |
Household Income in Birchwood Village
Household Income Brackets in Birchwood Village
With 116 households falling in the category, the $100,000 to $149,999 income range is the most frequent in Birchwood Village, accounting for 29.4% of all households. In contrast, only 4 households (1.0%) fall into the $10,000 to $14,999 income bracket, making it the least populous group.
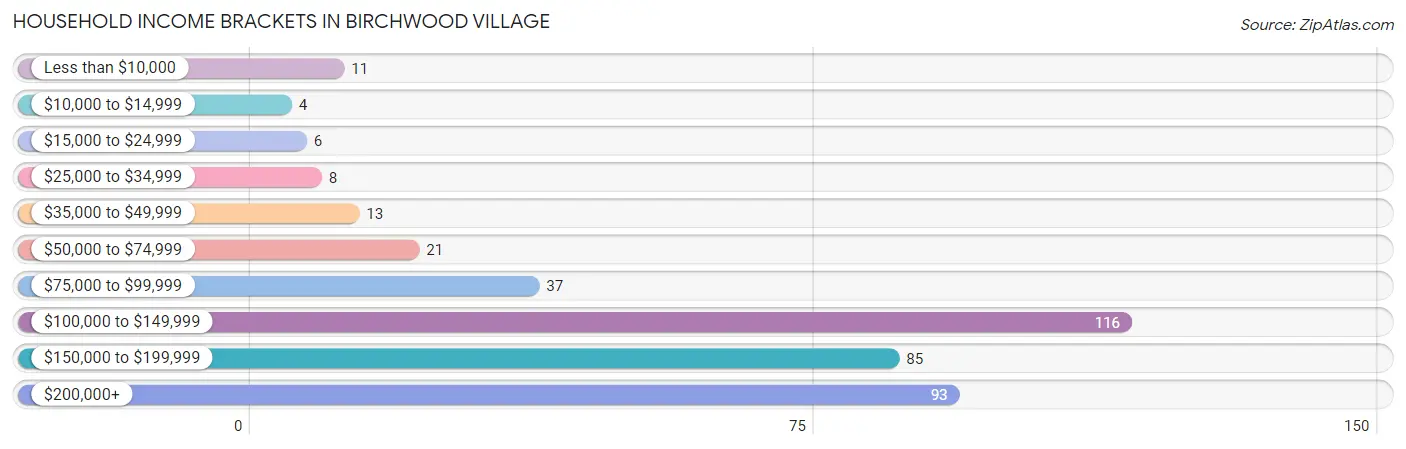
| Income Bracket | # Households | % Households |
| Less than $10,000 | 11 | 2.8% |
| $10,000 to $14,999 | 4 | 1.0% |
| $15,000 to $24,999 | 6 | 1.5% |
| $25,000 to $34,999 | 8 | 2.0% |
| $35,000 to $49,999 | 13 | 3.3% |
| $50,000 to $74,999 | 21 | 5.3% |
| $75,000 to $99,999 | 37 | 9.4% |
| $100,000 to $149,999 | 116 | 29.4% |
| $150,000 to $199,999 | 85 | 21.6% |
| $200,000+ | 93 | 23.6% |
Household Income by Householder Age in Birchwood Village
The median household income in Birchwood Village is $148,417, with the highest median household income of $166,563 found in the 45 to 64 years age bracket for the primary householder. A total of 169 households (42.9%) fall into this category.
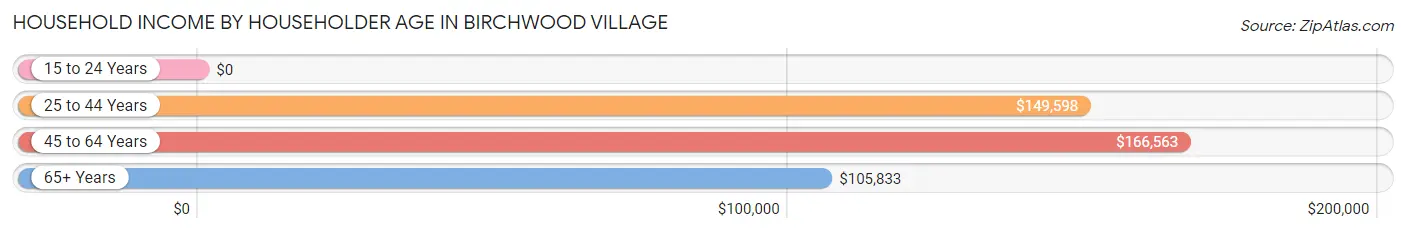
| Income Bracket | # Households | Median Income |
| 15 to 24 Years | 0 (0.0%) | $0 |
| 25 to 44 Years | 119 (30.2%) | $149,598 |
| 45 to 64 Years | 169 (42.9%) | $166,563 |
| 65+ Years | 106 (26.9%) | $105,833 |
| Total | 394 (100.0%) | $148,417 |
Poverty in Birchwood Village
Income Below Poverty by Sex and Age in Birchwood Village
With 2.6% poverty level for males and 6.5% for females among the residents of Birchwood Village, 18 to 24 year old males and 45 to 54 year old females are the most vulnerable to poverty, with 6 males (9.5%) and 13 females (18.8%) in their respective age groups living below the poverty level.
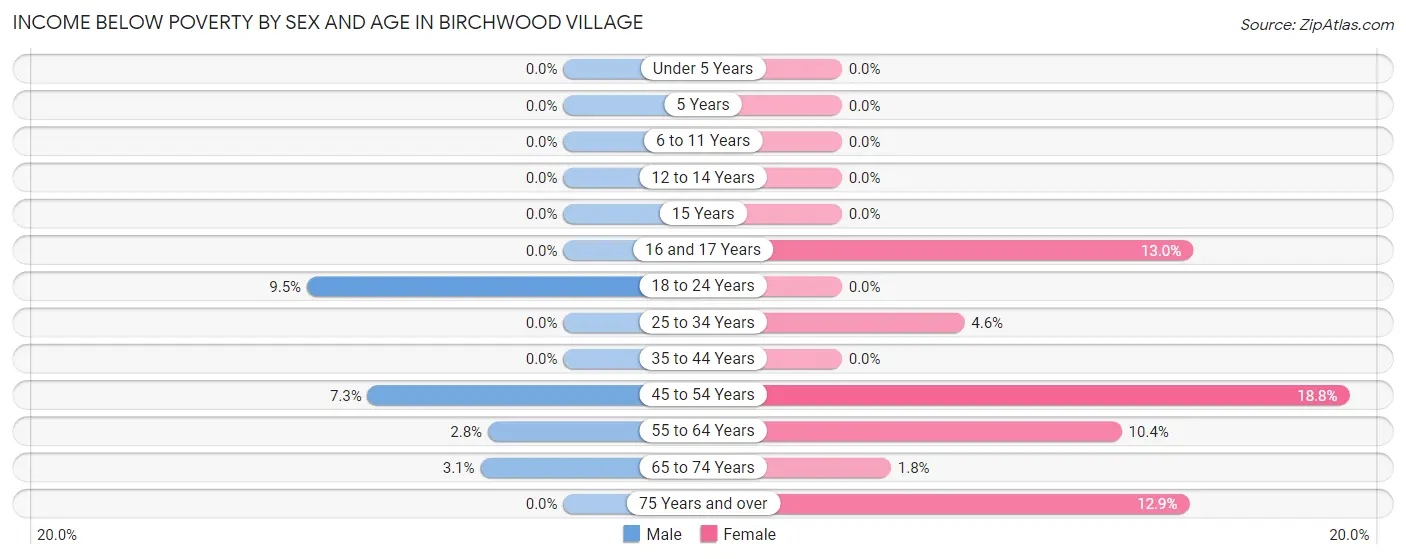
| Age Bracket | Male | Female |
| Under 5 Years | 0 (0.0%) | 0 (0.0%) |
| 5 Years | 0 (0.0%) | 0 (0.0%) |
| 6 to 11 Years | 0 (0.0%) | 0 (0.0%) |
| 12 to 14 Years | 0 (0.0%) | 0 (0.0%) |
| 15 Years | 0 (0.0%) | 0 (0.0%) |
| 16 and 17 Years | 0 (0.0%) | 3 (13.0%) |
| 18 to 24 Years | 6 (9.5%) | 0 (0.0%) |
| 25 to 34 Years | 0 (0.0%) | 3 (4.5%) |
| 35 to 44 Years | 0 (0.0%) | 0 (0.0%) |
| 45 to 54 Years | 4 (7.3%) | 13 (18.8%) |
| 55 to 64 Years | 3 (2.8%) | 8 (10.4%) |
| 65 to 74 Years | 2 (3.1%) | 1 (1.8%) |
| 75 Years and over | 0 (0.0%) | 4 (12.9%) |
| Total | 15 (2.6%) | 32 (6.5%) |
Income Above Poverty by Sex and Age in Birchwood Village
According to the poverty statistics in Birchwood Village, males aged under 5 years and females aged under 5 years are the age groups that are most secure financially, with 100.0% of males and 100.0% of females in these age groups living above the poverty line.
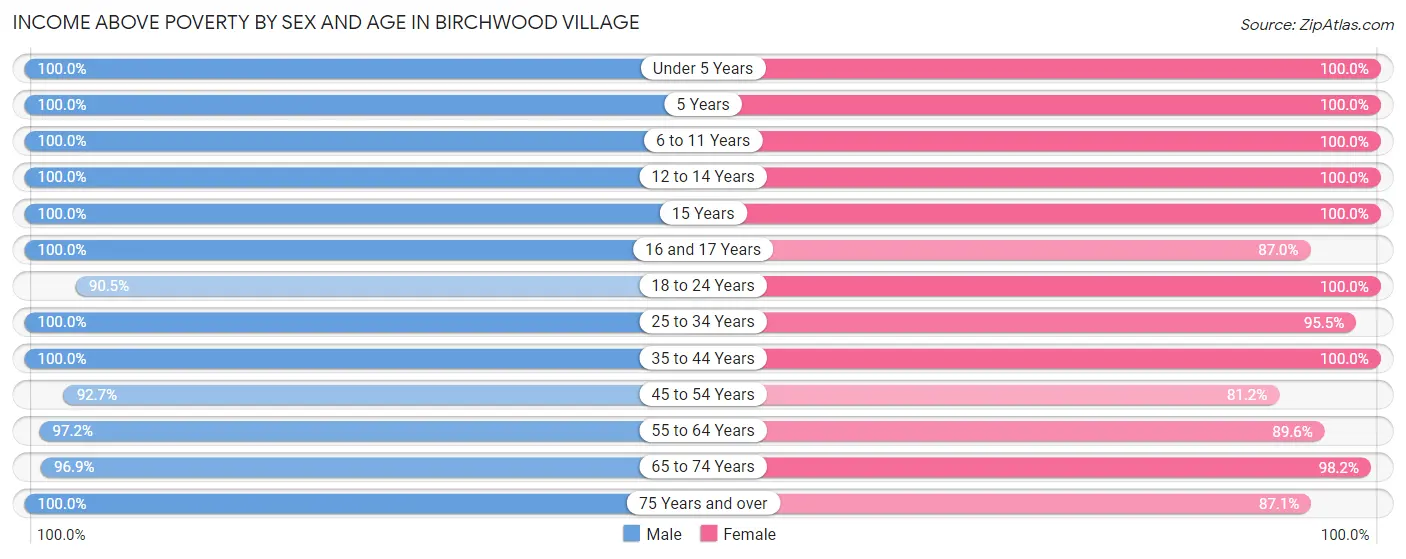
| Age Bracket | Male | Female |
| Under 5 Years | 29 (100.0%) | 31 (100.0%) |
| 5 Years | 18 (100.0%) | 10 (100.0%) |
| 6 to 11 Years | 37 (100.0%) | 45 (100.0%) |
| 12 to 14 Years | 12 (100.0%) | 10 (100.0%) |
| 15 Years | 2 (100.0%) | 3 (100.0%) |
| 16 and 17 Years | 25 (100.0%) | 20 (87.0%) |
| 18 to 24 Years | 57 (90.5%) | 22 (100.0%) |
| 25 to 34 Years | 74 (100.0%) | 63 (95.5%) |
| 35 to 44 Years | 65 (100.0%) | 53 (100.0%) |
| 45 to 54 Years | 51 (92.7%) | 56 (81.2%) |
| 55 to 64 Years | 104 (97.2%) | 69 (89.6%) |
| 65 to 74 Years | 63 (96.9%) | 54 (98.2%) |
| 75 Years and over | 22 (100.0%) | 27 (87.1%) |
| Total | 559 (97.4%) | 463 (93.5%) |
Income Below Poverty Among Married-Couple Families in Birchwood Village
The poverty statistics for married-couple families in Birchwood Village show that 1.6% or 4 of the total 249 families live below the poverty line. Families with 1 or 2 children have the highest poverty rate of 2.9%, comprising of 2 families. On the other hand, families with 3 or 4 children have the lowest poverty rate of 0.0%, which includes 0 families.
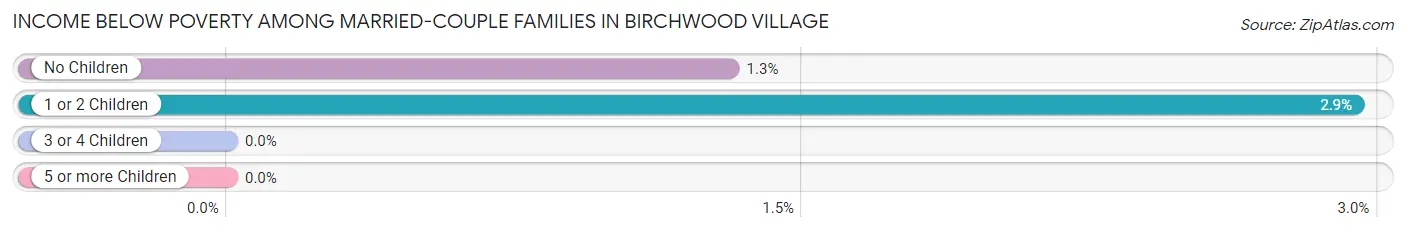
| Children | Above Poverty | Below Poverty |
| No Children | 151 (98.7%) | 2 (1.3%) |
| 1 or 2 Children | 66 (97.1%) | 2 (2.9%) |
| 3 or 4 Children | 27 (100.0%) | 0 (0.0%) |
| 5 or more Children | 1 (100.0%) | 0 (0.0%) |
| Total | 245 (98.4%) | 4 (1.6%) |
Income Below Poverty Among Single-Parent Households in Birchwood Village
| Children | Single Father | Single Mother |
| No Children | 0 (0.0%) | 0 (0.0%) |
| 1 or 2 Children | 0 (0.0%) | 0 (0.0%) |
| 3 or 4 Children | 0 (0.0%) | 0 (0.0%) |
| 5 or more Children | 0 (0.0%) | 0 (0.0%) |
| Total | 0 (0.0%) | 0 (0.0%) |
Income Below Poverty Among Married-Couple vs Single-Parent Households in Birchwood Village
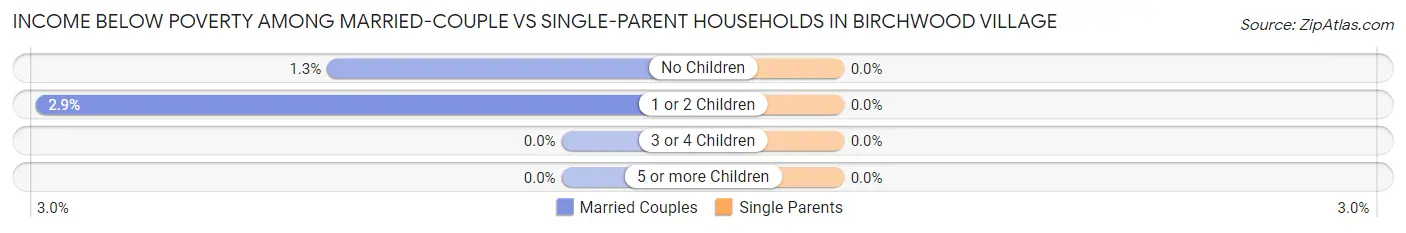
| Children | Married-Couple Families | Single-Parent Households |
| No Children | 2 (1.3%) | 0 (0.0%) |
| 1 or 2 Children | 2 (2.9%) | 0 (0.0%) |
| 3 or 4 Children | 0 (0.0%) | 0 (0.0%) |
| 5 or more Children | 0 (0.0%) | 0 (0.0%) |
| Total | 4 (1.6%) | 0 (0.0%) |
Race in Birchwood Village
The most populous races in Birchwood Village are White / Caucasian (922 | 86.3%), Two or more Races (86 | 8.0%), and Black / African American (44 | 4.1%).
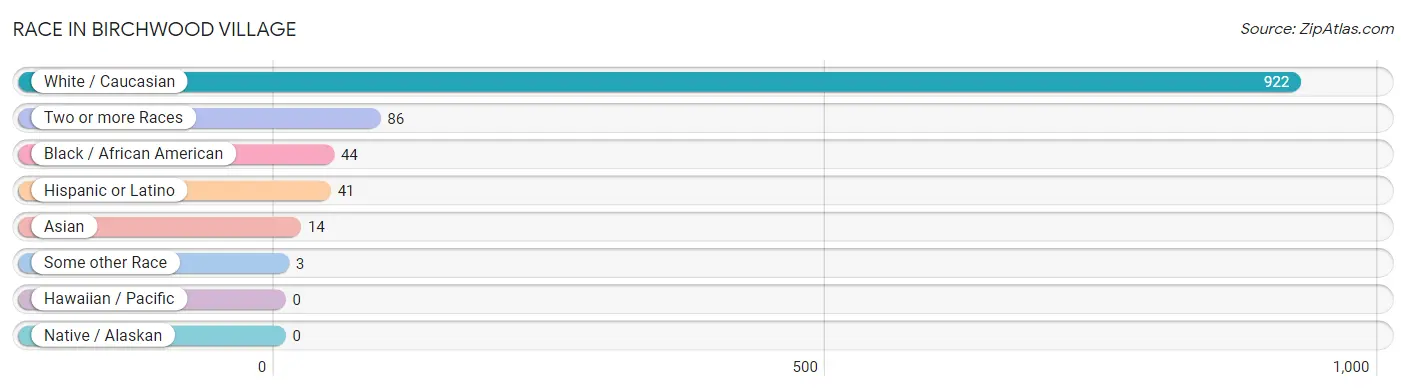
| Race | # Population | % Population |
| Asian | 14 | 1.3% |
| Black / African American | 44 | 4.1% |
| Hawaiian / Pacific | 0 | 0.0% |
| Hispanic or Latino | 41 | 3.8% |
| Native / Alaskan | 0 | 0.0% |
| White / Caucasian | 922 | 86.3% |
| Two or more Races | 86 | 8.0% |
| Some other Race | 3 | 0.3% |
| Total | 1,069 | 100.0% |
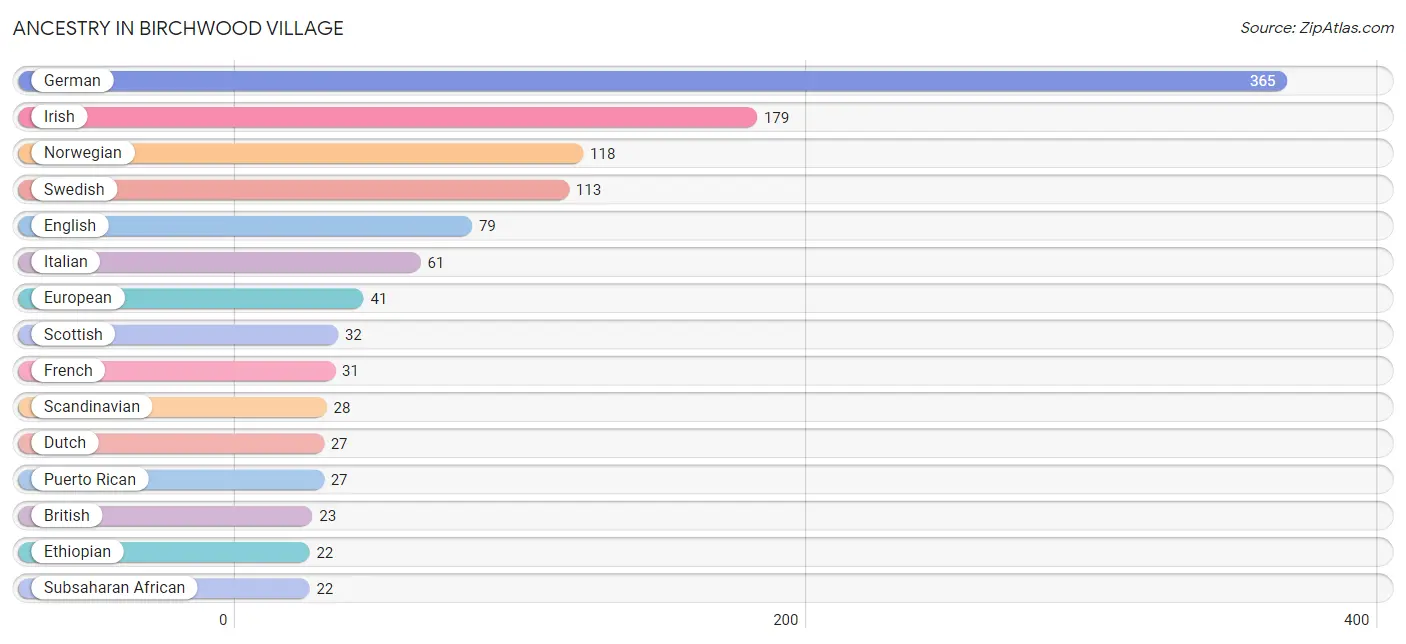
Ancestry in Birchwood Village
The most populous ancestries reported in Birchwood Village are German (365 | 34.1%), Irish (179 | 16.7%), Norwegian (118 | 11.0%), Swedish (113 | 10.6%), and English (79 | 7.4%), together accounting for 79.9% of all Birchwood Village residents.
| Ancestry | # Population | % Population |
| American | 6 | 0.6% |
| Arab | 2 | 0.2% |
| Austrian | 2 | 0.2% |
| Bangladeshi | 2 | 0.2% |
| Bhutanese | 3 | 0.3% |
| British | 23 | 2.1% |
| Canadian | 2 | 0.2% |
| Central American | 1 | 0.1% |
| Chippewa | 13 | 1.2% |
| Czech | 7 | 0.6% |
| Danish | 14 | 1.3% |
| Dutch | 27 | 2.5% |
| English | 79 | 7.4% |
| Ethiopian | 22 | 2.1% |
| European | 41 | 3.8% |
| Finnish | 16 | 1.5% |
| French | 31 | 2.9% |
| French Canadian | 21 | 2.0% |
| German | 365 | 34.1% |
| Guatemalan | 1 | 0.1% |
| Hungarian | 6 | 0.6% |
| Irish | 179 | 16.7% |
| Italian | 61 | 5.7% |
| Korean | 5 | 0.5% |
| Lebanese | 2 | 0.2% |
| Mexican | 4 | 0.4% |
| Northern European | 2 | 0.2% |
| Norwegian | 118 | 11.0% |
| Pakistani | 8 | 0.7% |
| Polish | 16 | 1.5% |
| Portuguese | 2 | 0.2% |
| Puerto Rican | 27 | 2.5% |
| Russian | 7 | 0.6% |
| Scandinavian | 28 | 2.6% |
| Scotch-Irish | 6 | 0.6% |
| Scottish | 32 | 3.0% |
| Spanish | 9 | 0.8% |
| Subsaharan African | 22 | 2.1% |
| Swedish | 113 | 10.6% |
| Swiss | 2 | 0.2% |
| Thai | 2 | 0.2% |
| Ukrainian | 2 | 0.2% |
| Welsh | 4 | 0.4% | View All 43 Rows |
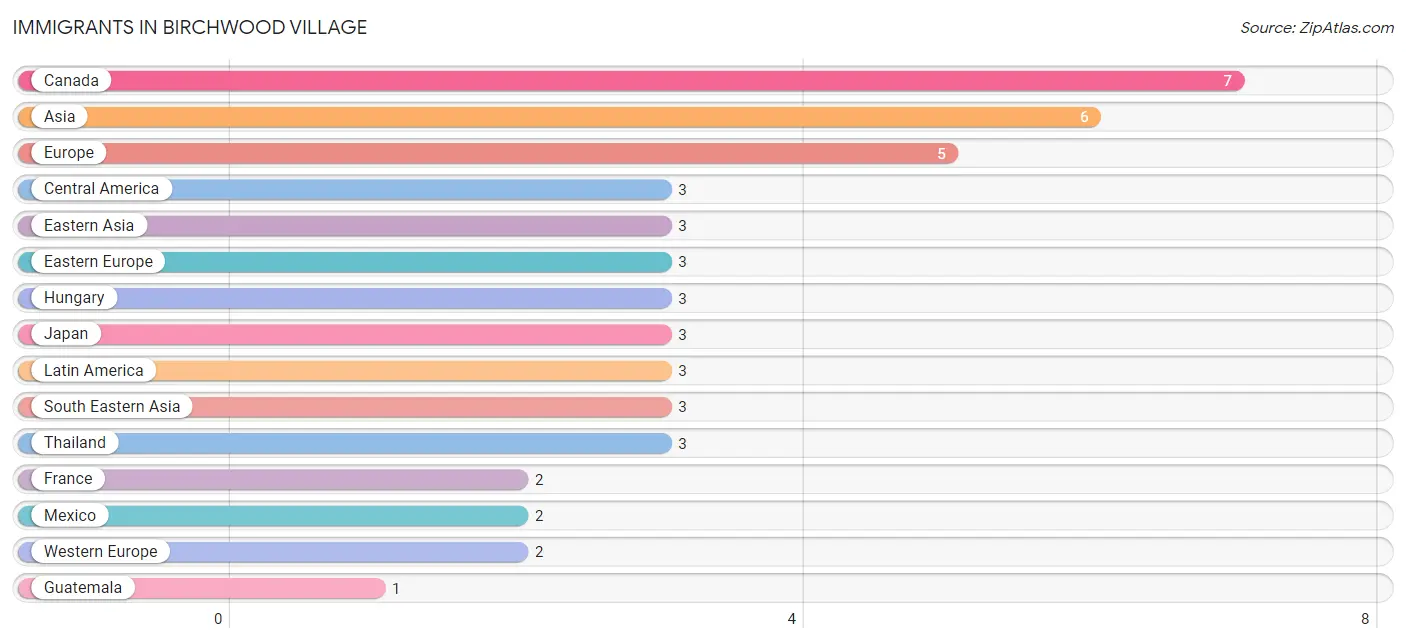
Immigrants in Birchwood Village
The most numerous immigrant groups reported in Birchwood Village came from Canada (7 | 0.6%), Asia (6 | 0.6%), Europe (5 | 0.5%), Central America (3 | 0.3%), and Eastern Asia (3 | 0.3%), together accounting for 2.2% of all Birchwood Village residents.
| Immigration Origin | # Population | % Population |
| Asia | 6 | 0.6% |
| Canada | 7 | 0.6% |
| Central America | 3 | 0.3% |
| Eastern Asia | 3 | 0.3% |
| Eastern Europe | 3 | 0.3% |
| Europe | 5 | 0.5% |
| France | 2 | 0.2% |
| Guatemala | 1 | 0.1% |
| Hungary | 3 | 0.3% |
| Japan | 3 | 0.3% |
| Latin America | 3 | 0.3% |
| Mexico | 2 | 0.2% |
| South Eastern Asia | 3 | 0.3% |
| Thailand | 3 | 0.3% |
| Western Europe | 2 | 0.2% | View All 15 Rows |
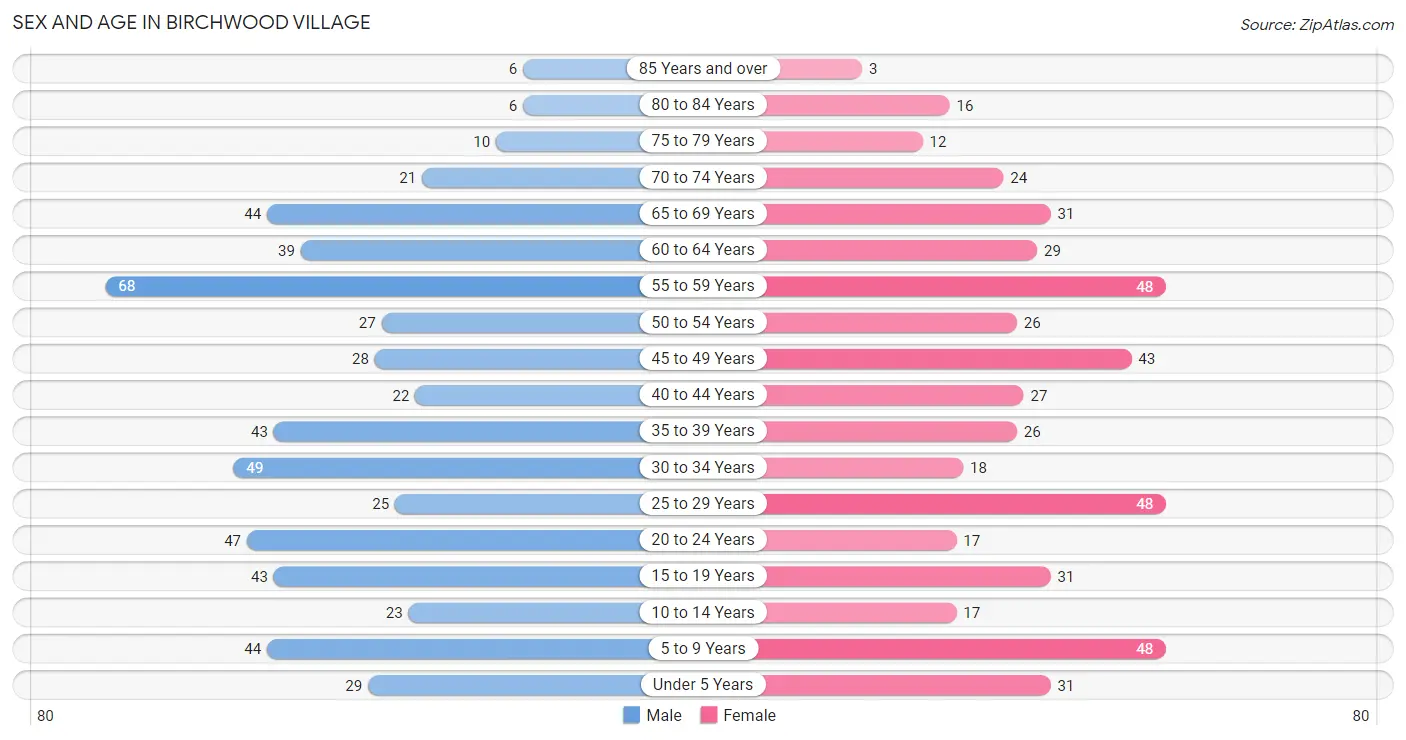
Sex and Age in Birchwood Village
Sex and Age in Birchwood Village
The most populous age groups in Birchwood Village are 55 to 59 Years (68 | 11.8%) for men and 5 to 9 Years (48 | 9.7%) for women.
| Age Bracket | Male | Female |
| Under 5 Years | 29 (5.1%) | 31 (6.3%) |
| 5 to 9 Years | 44 (7.7%) | 48 (9.7%) |
| 10 to 14 Years | 23 (4.0%) | 17 (3.4%) |
| 15 to 19 Years | 43 (7.5%) | 31 (6.3%) |
| 20 to 24 Years | 47 (8.2%) | 17 (3.4%) |
| 25 to 29 Years | 25 (4.4%) | 48 (9.7%) |
| 30 to 34 Years | 49 (8.5%) | 18 (3.6%) |
| 35 to 39 Years | 43 (7.5%) | 26 (5.2%) |
| 40 to 44 Years | 22 (3.8%) | 27 (5.4%) |
| 45 to 49 Years | 28 (4.9%) | 43 (8.7%) |
| 50 to 54 Years | 27 (4.7%) | 26 (5.2%) |
| 55 to 59 Years | 68 (11.8%) | 48 (9.7%) |
| 60 to 64 Years | 39 (6.8%) | 29 (5.9%) |
| 65 to 69 Years | 44 (7.7%) | 31 (6.3%) |
| 70 to 74 Years | 21 (3.7%) | 24 (4.9%) |
| 75 to 79 Years | 10 (1.7%) | 12 (2.4%) |
| 80 to 84 Years | 6 (1.1%) | 16 (3.2%) |
| 85 Years and over | 6 (1.1%) | 3 (0.6%) |
| Total | 574 (100.0%) | 495 (100.0%) |
Families and Households in Birchwood Village
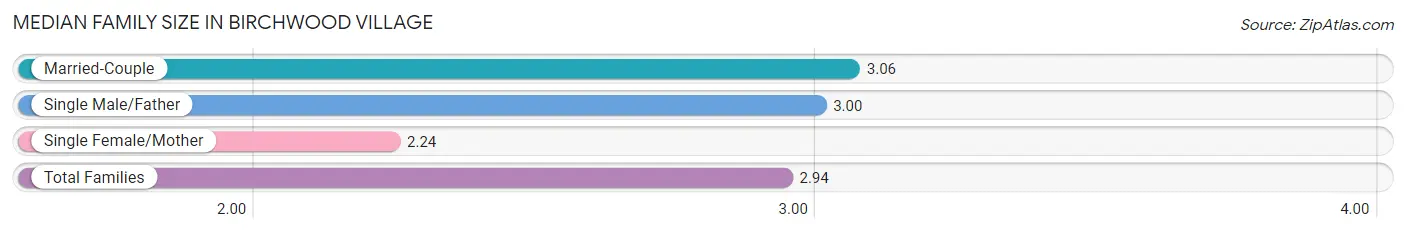
Median Family Size in Birchwood Village
The median family size in Birchwood Village is 2.94 persons per family, with married-couple families (249 | 79.0%) accounting for the largest median family size of 3.06 persons per family. On the other hand, single female/mother families (46 | 14.6%) represent the smallest median family size with 2.24 persons per family.
| Family Type | # Families | Family Size |
| Married-Couple | 249 (79.0%) | 3.06 |
| Single Male/Father | 20 (6.4%) | 3.00 |
| Single Female/Mother | 46 (14.6%) | 2.24 |
| Total Families | 315 (100.0%) | 2.94 |
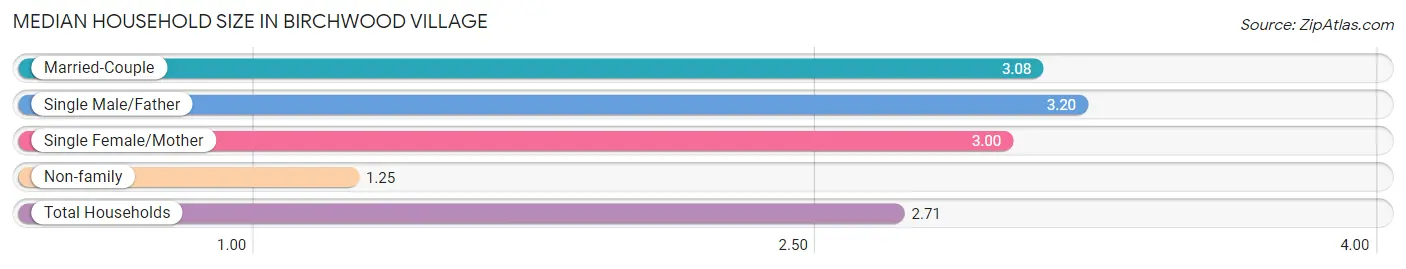
Median Household Size in Birchwood Village
The median household size in Birchwood Village is 2.71 persons per household, with single male/father households (20 | 5.1%) accounting for the largest median household size of 3.2 persons per household. non-family households (79 | 20.1%) represent the smallest median household size with 1.25 persons per household.
| Household Type | # Households | Household Size |
| Married-Couple | 249 (63.2%) | 3.08 |
| Single Male/Father | 20 (5.1%) | 3.20 |
| Single Female/Mother | 46 (11.7%) | 3.00 |
| Non-family | 79 (20.1%) | 1.25 |
| Total Households | 394 (100.0%) | 2.71 |
Household Size by Marriage Status in Birchwood Village
Out of a total of 394 households in Birchwood Village, 315 (79.9%) are family households, while 79 (20.1%) are nonfamily households. The most numerous type of family households are 2-person households, comprising 125, and the most common type of nonfamily households are 1-person households, comprising 58.
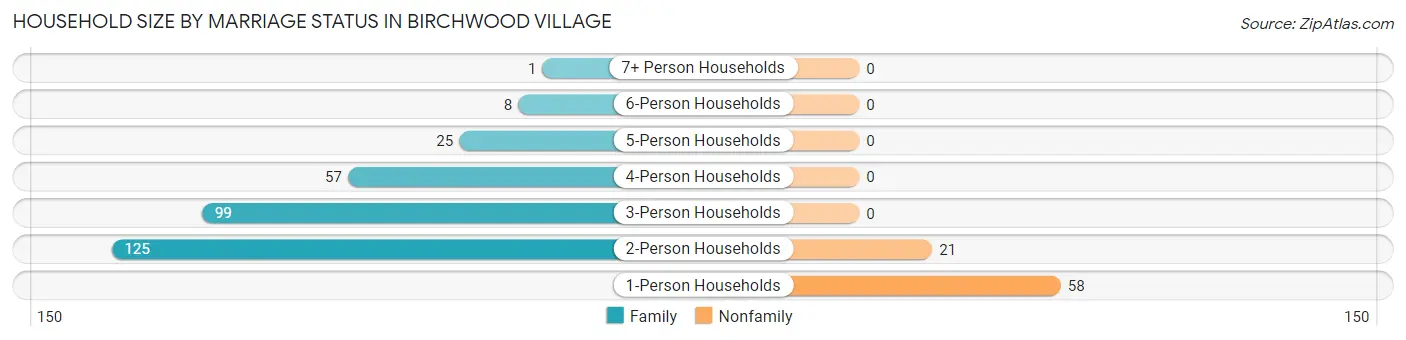
| Household Size | Family Households | Nonfamily Households |
| 1-Person Households | - | 58 (14.7%) |
| 2-Person Households | 125 (31.7%) | 21 (5.3%) |
| 3-Person Households | 99 (25.1%) | 0 (0.0%) |
| 4-Person Households | 57 (14.5%) | 0 (0.0%) |
| 5-Person Households | 25 (6.4%) | 0 (0.0%) |
| 6-Person Households | 8 (2.0%) | 0 (0.0%) |
| 7+ Person Households | 1 (0.3%) | 0 (0.0%) |
| Total | 315 (79.9%) | 79 (20.1%) |
Female Fertility in Birchwood Village
Fertility by Age in Birchwood Village
Average fertility rate in Birchwood Village is 112.0 births per 1,000 women. Women in the age bracket of 20 to 34 years have the highest fertility rate with 169.0 births per 1,000 women. Women in the age bracket of 20 to 34 years acount for 58.3% of all women with births.
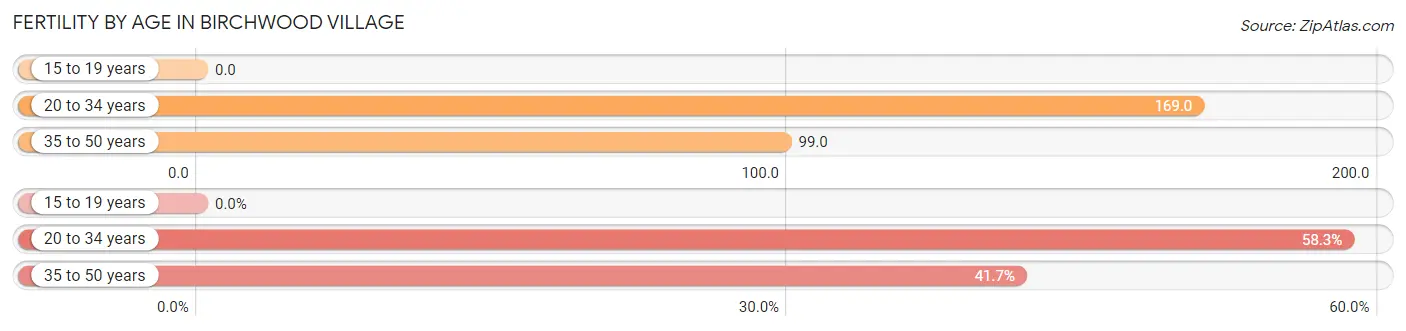
| Age Bracket | Women with Births | Births / 1,000 Women |
| 15 to 19 years | 0 (0.0%) | 0.0 |
| 20 to 34 years | 14 (58.3%) | 169.0 |
| 35 to 50 years | 10 (41.7%) | 99.0 |
| Total | 24 (100.0%) | 112.0 |
Fertility by Age by Marriage Status in Birchwood Village
91.7% of women with births (24) in Birchwood Village are married. The highest percentage of unmarried women with births falls into 35 to 50 years age bracket with 20.0% of them unmarried at the time of birth, while the lowest percentage of unmarried women with births belong to 20 to 34 years age bracket with 0.0% of them unmarried.
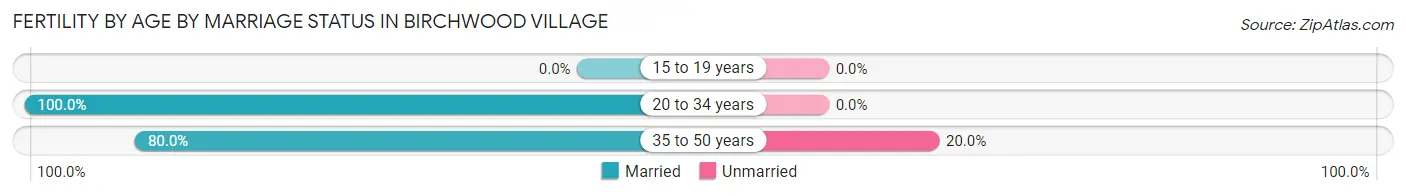
| Age Bracket | Married | Unmarried |
| 15 to 19 years | 0 (0.0%) | 0 (0.0%) |
| 20 to 34 years | 14 (100.0%) | 0 (0.0%) |
| 35 to 50 years | 8 (80.0%) | 2 (20.0%) |
| Total | 22 (91.7%) | 2 (8.3%) |
Fertility by Education in Birchwood Village
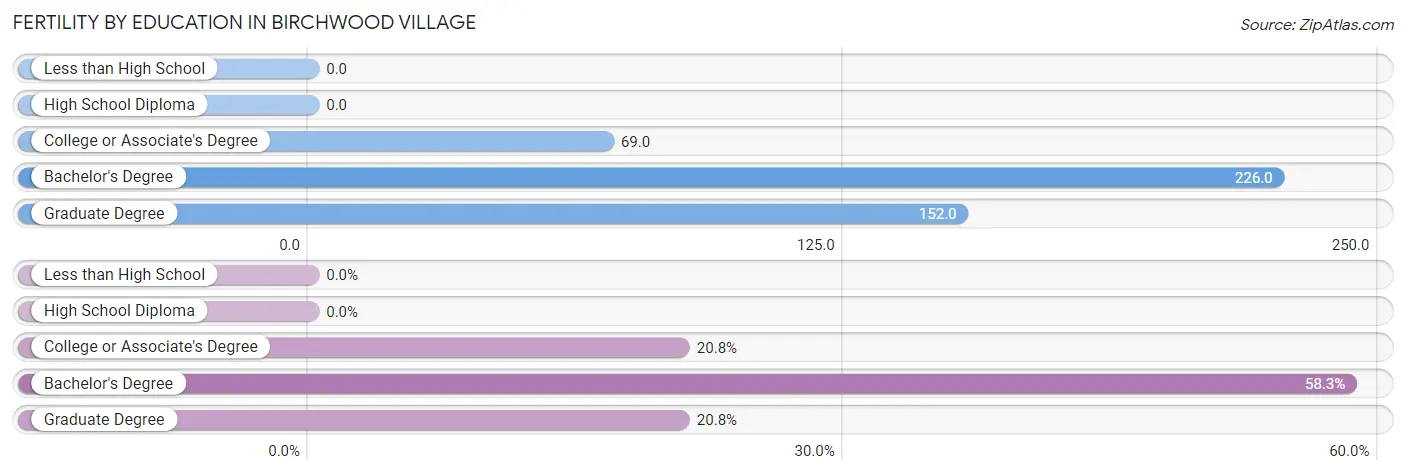
| Educational Attainment | Women with Births | Births / 1,000 Women |
| Less than High School | 0 (0.0%) | 0.0 |
| High School Diploma | 0 (0.0%) | 0.0 |
| College or Associate's Degree | 5 (20.8%) | 69.0 |
| Bachelor's Degree | 14 (58.3%) | 226.0 |
| Graduate Degree | 5 (20.8%) | 152.0 |
| Total | 24 (100.0%) | 112.0 |
Fertility by Education by Marriage Status in Birchwood Village
8.3% of women with births in Birchwood Village are unmarried. Women with the educational attainment of college or associate's degree are most likely to be married with 100.0% of them married at childbirth, while women with the educational attainment of bachelor's degree are least likely to be married with 14.3% of them unmarried at childbirth.
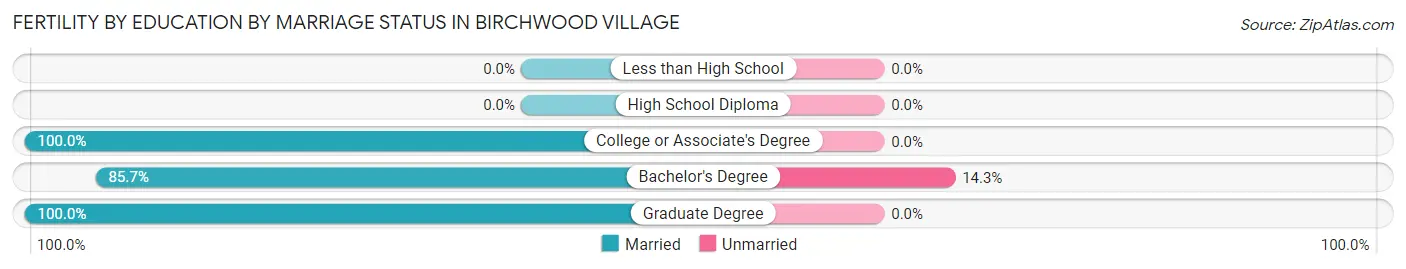
| Educational Attainment | Married | Unmarried |
| Less than High School | 0 (0.0%) | 0 (0.0%) |
| High School Diploma | 0 (0.0%) | 0 (0.0%) |
| College or Associate's Degree | 5 (100.0%) | 0 (0.0%) |
| Bachelor's Degree | 12 (85.7%) | 2 (14.3%) |
| Graduate Degree | 5 (100.0%) | 0 (0.0%) |
| Total | 22 (91.7%) | 2 (8.3%) |
Employment Characteristics in Birchwood Village
Employment by Class of Employer in Birchwood Village
Among the 586 employed individuals in Birchwood Village, private company employees (348 | 59.4%), not-for-profit organizations (93 | 15.9%), and local government employees (63 | 10.7%) make up the most common classes of employment.
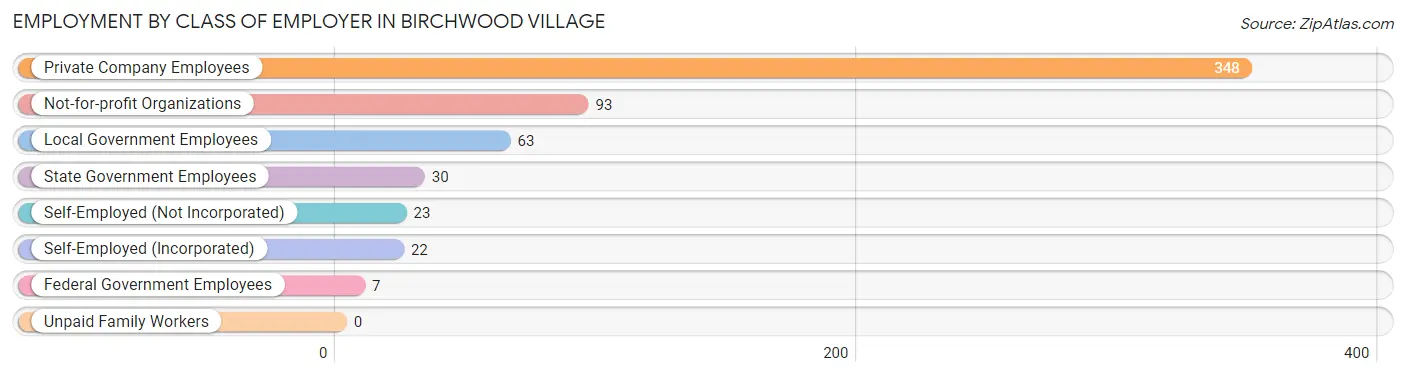
| Employer Class | # Employees | % Employees |
| Private Company Employees | 348 | 59.4% |
| Self-Employed (Incorporated) | 22 | 3.7% |
| Self-Employed (Not Incorporated) | 23 | 3.9% |
| Not-for-profit Organizations | 93 | 15.9% |
| Local Government Employees | 63 | 10.7% |
| State Government Employees | 30 | 5.1% |
| Federal Government Employees | 7 | 1.2% |
| Unpaid Family Workers | 0 | 0.0% |
| Total | 586 | 100.0% |
Employment Status by Age in Birchwood Village
According to the labor force statistics for Birchwood Village, out of the total population over 16 years of age (872), 69.2% or 603 individuals are in the labor force, with 1.7% or 10 of them unemployed. The age group with the highest labor force participation rate is 25 to 29 years, with 97.3% or 71 individuals in the labor force. Within the labor force, the 20 to 24 years age range has the highest percentage of unemployed individuals, with 13.2% or 7 of them being unemployed.
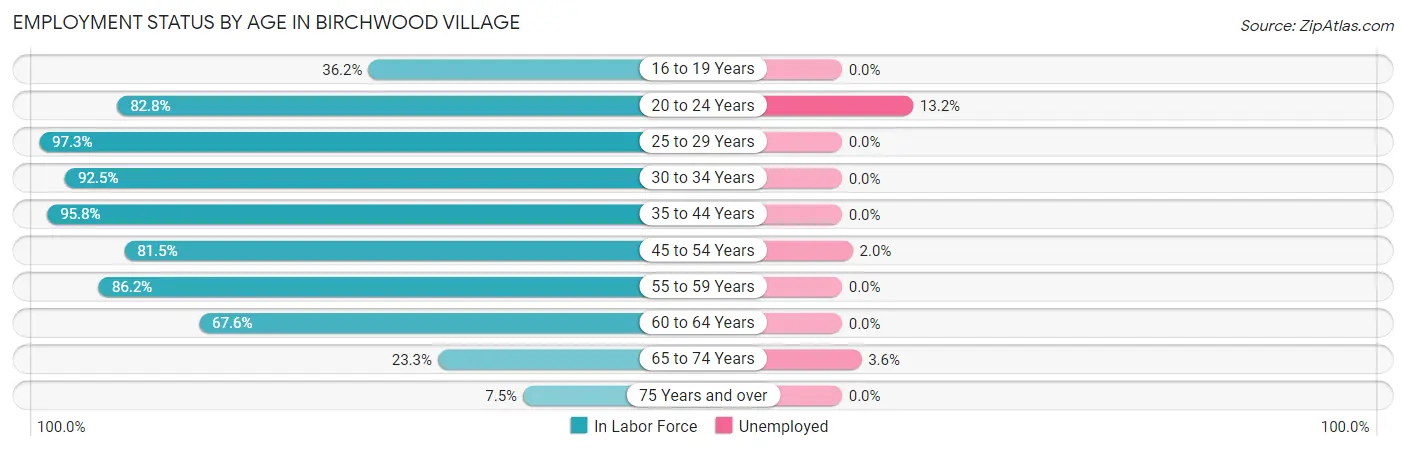
| Age Bracket | In Labor Force | Unemployed |
| 16 to 19 Years | 25 (36.2%) | 0 (0.0%) |
| 20 to 24 Years | 53 (82.8%) | 7 (13.2%) |
| 25 to 29 Years | 71 (97.3%) | 0 (0.0%) |
| 30 to 34 Years | 62 (92.5%) | 0 (0.0%) |
| 35 to 44 Years | 113 (95.8%) | 0 (0.0%) |
| 45 to 54 Years | 101 (81.5%) | 2 (2.0%) |
| 55 to 59 Years | 100 (86.2%) | 0 (0.0%) |
| 60 to 64 Years | 46 (67.6%) | 0 (0.0%) |
| 65 to 74 Years | 28 (23.3%) | 1 (3.6%) |
| 75 Years and over | 4 (7.5%) | 0 (0.0%) |
| Total | 603 (69.2%) | 10 (1.7%) |
Employment Status by Educational Attainment in Birchwood Village
According to labor force statistics for Birchwood Village, 87.1% of individuals (493) out of the total population between 25 and 64 years of age (566) are in the labor force, with 0.4% or 2 of them being unemployed. The group with the highest labor force participation rate are those with the educational attainment of less than high school, with 100.0% or 10 individuals in the labor force. Within the labor force, individuals with bachelor's degree or higher education have the highest percentage of unemployment, with 0.6% or 2 of them being unemployed.
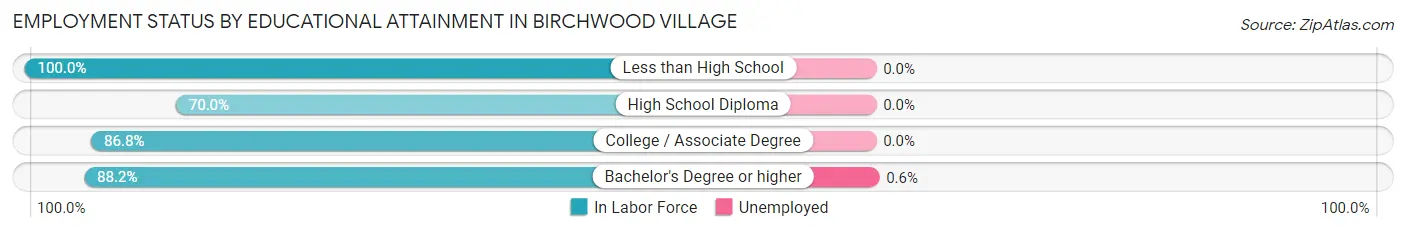
| Educational Attainment | In Labor Force | Unemployed |
| Less than High School | 10 (100.0%) | 0 (0.0%) |
| High School Diploma | 21 (70.0%) | 0 (0.0%) |
| College / Associate Degree | 132 (86.8%) | 0 (0.0%) |
| Bachelor's Degree or higher | 330 (88.2%) | 2 (0.6%) |
| Total | 493 (87.1%) | 2 (0.4%) |
Employment Occupations by Sex in Birchwood Village
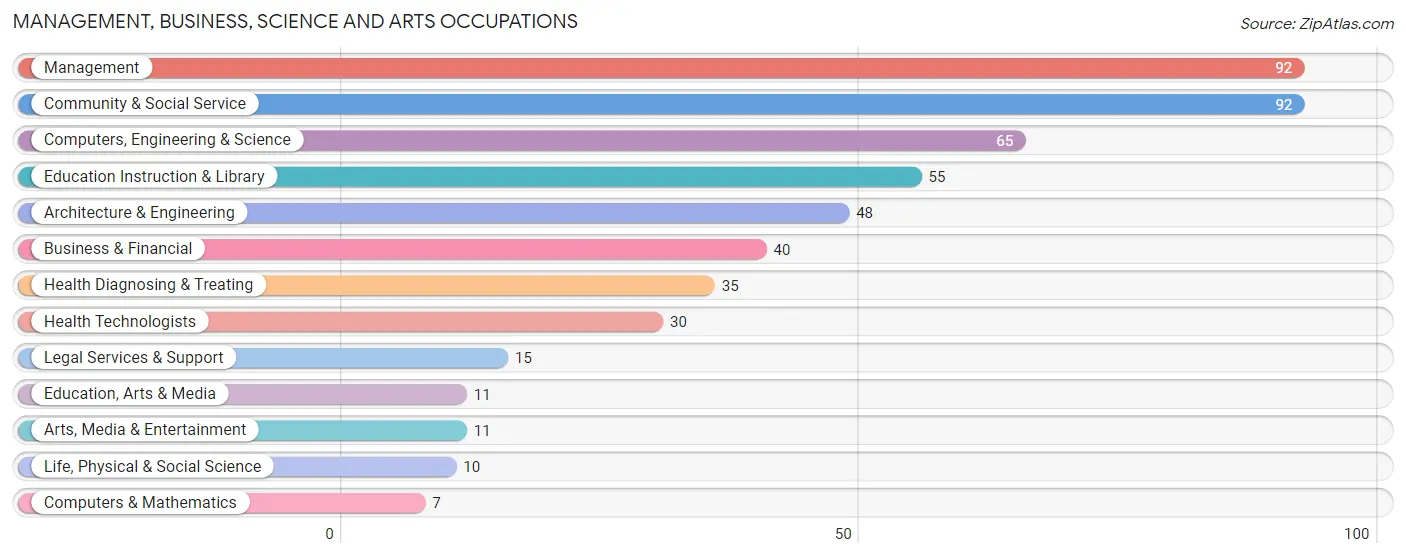
Management, Business, Science and Arts Occupations
The most common Management, Business, Science and Arts occupations in Birchwood Village are Management (92 | 15.5%), Community & Social Service (92 | 15.5%), Computers, Engineering & Science (65 | 11.0%), Education Instruction & Library (55 | 9.3%), and Architecture & Engineering (48 | 8.1%).
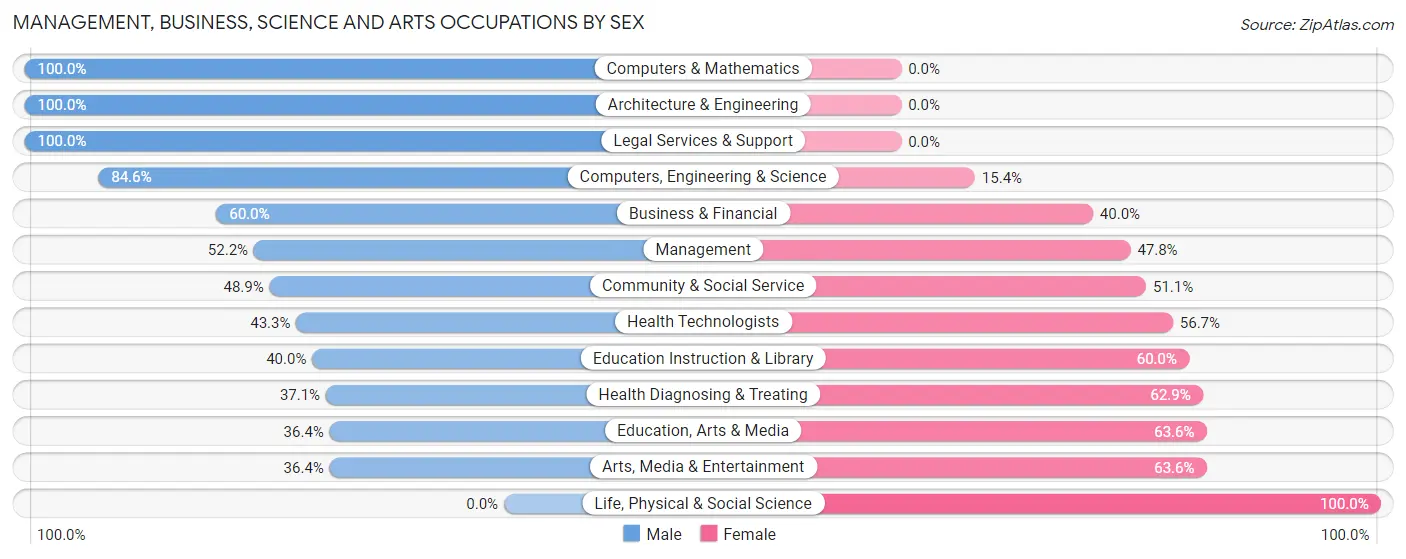
Management, Business, Science and Arts Occupations by Sex
Within the Management, Business, Science and Arts occupations in Birchwood Village, the most male-oriented occupations are Computers & Mathematics (100.0%), Architecture & Engineering (100.0%), and Legal Services & Support (100.0%), while the most female-oriented occupations are Life, Physical & Social Science (100.0%), Education, Arts & Media (63.6%), and Arts, Media & Entertainment (63.6%).
| Occupation | Male | Female |
| Management | 48 (52.2%) | 44 (47.8%) |
| Business & Financial | 24 (60.0%) | 16 (40.0%) |
| Computers, Engineering & Science | 55 (84.6%) | 10 (15.4%) |
| Computers & Mathematics | 7 (100.0%) | 0 (0.0%) |
| Architecture & Engineering | 48 (100.0%) | 0 (0.0%) |
| Life, Physical & Social Science | 0 (0.0%) | 10 (100.0%) |
| Community & Social Service | 45 (48.9%) | 47 (51.1%) |
| Education, Arts & Media | 4 (36.4%) | 7 (63.6%) |
| Legal Services & Support | 15 (100.0%) | 0 (0.0%) |
| Education Instruction & Library | 22 (40.0%) | 33 (60.0%) |
| Arts, Media & Entertainment | 4 (36.4%) | 7 (63.6%) |
| Health Diagnosing & Treating | 13 (37.1%) | 22 (62.9%) |
| Health Technologists | 13 (43.3%) | 17 (56.7%) |
| Total (Category) | 185 (57.1%) | 139 (42.9%) |
| Total (Overall) | 350 (59.0%) | 243 (41.0%) |
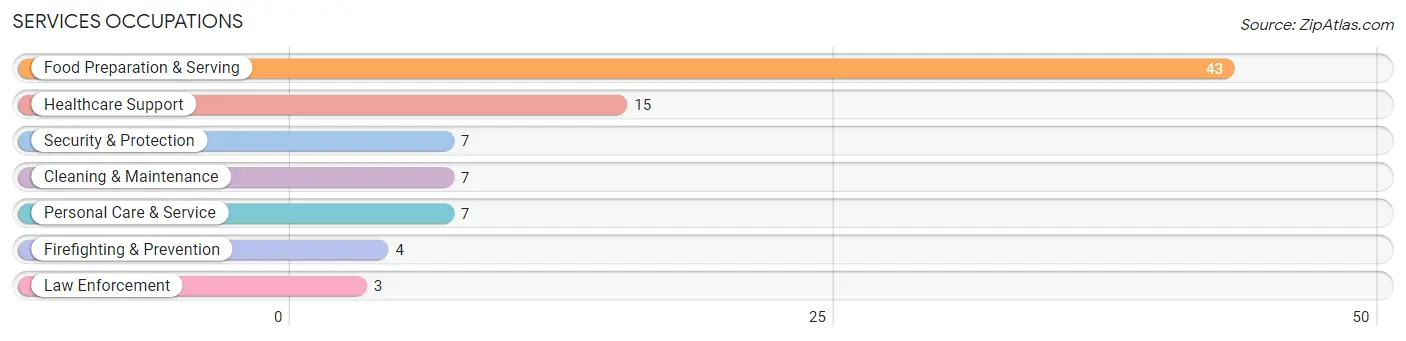
Services Occupations
The most common Services occupations in Birchwood Village are Food Preparation & Serving (43 | 7.2%), Healthcare Support (15 | 2.5%), Security & Protection (7 | 1.2%), Cleaning & Maintenance (7 | 1.2%), and Personal Care & Service (7 | 1.2%).
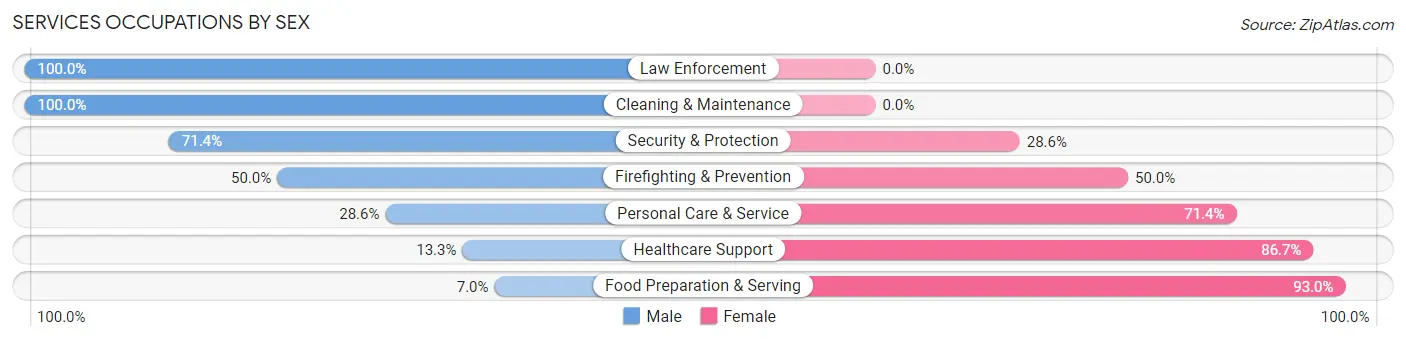
Services Occupations by Sex
Within the Services occupations in Birchwood Village, the most male-oriented occupations are Law Enforcement (100.0%), Cleaning & Maintenance (100.0%), and Security & Protection (71.4%), while the most female-oriented occupations are Food Preparation & Serving (93.0%), Healthcare Support (86.7%), and Personal Care & Service (71.4%).
| Occupation | Male | Female |
| Healthcare Support | 2 (13.3%) | 13 (86.7%) |
| Security & Protection | 5 (71.4%) | 2 (28.6%) |
| Firefighting & Prevention | 2 (50.0%) | 2 (50.0%) |
| Law Enforcement | 3 (100.0%) | 0 (0.0%) |
| Food Preparation & Serving | 3 (7.0%) | 40 (93.0%) |
| Cleaning & Maintenance | 7 (100.0%) | 0 (0.0%) |
| Personal Care & Service | 2 (28.6%) | 5 (71.4%) |
| Total (Category) | 19 (24.0%) | 60 (75.9%) |
| Total (Overall) | 350 (59.0%) | 243 (41.0%) |
Sales and Office Occupations
The most common Sales and Office occupations in Birchwood Village are Sales & Related (55 | 9.3%), and Office & Administration (20 | 3.4%).
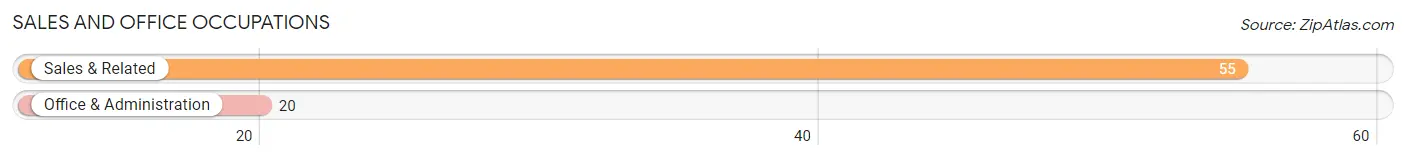
Sales and Office Occupations by Sex
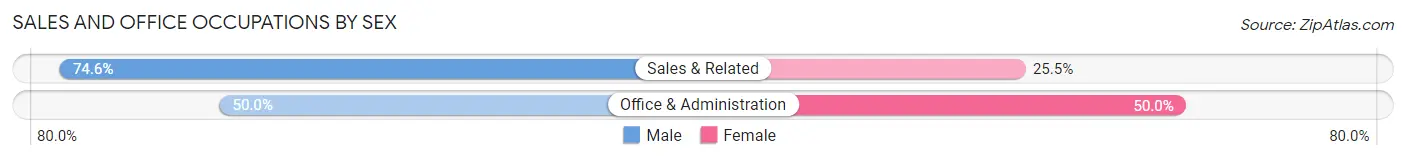
| Occupation | Male | Female |
| Sales & Related | 41 (74.6%) | 14 (25.5%) |
| Office & Administration | 10 (50.0%) | 10 (50.0%) |
| Total (Category) | 51 (68.0%) | 24 (32.0%) |
| Total (Overall) | 350 (59.0%) | 243 (41.0%) |
Natural Resources, Construction and Maintenance Occupations
The most common Natural Resources, Construction and Maintenance occupations in Birchwood Village are Construction & Extraction (21 | 3.5%), Installation, Maintenance & Repair (7 | 1.2%), and Farming, Fishing & Forestry (4 | 0.7%).

Natural Resources, Construction and Maintenance Occupations by Sex
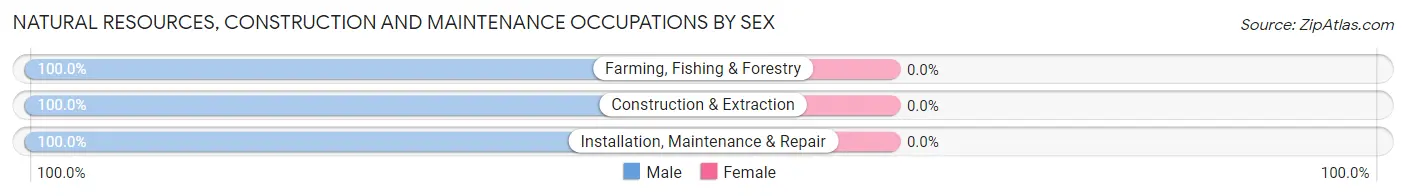
| Occupation | Male | Female |
| Farming, Fishing & Forestry | 4 (100.0%) | 0 (0.0%) |
| Construction & Extraction | 21 (100.0%) | 0 (0.0%) |
| Installation, Maintenance & Repair | 7 (100.0%) | 0 (0.0%) |
| Total (Category) | 32 (100.0%) | 0 (0.0%) |
| Total (Overall) | 350 (59.0%) | 243 (41.0%) |
Production, Transportation and Moving Occupations
The most common Production, Transportation and Moving occupations in Birchwood Village are Production (44 | 7.4%), Material Moving (35 | 5.9%), and Transportation (4 | 0.7%).
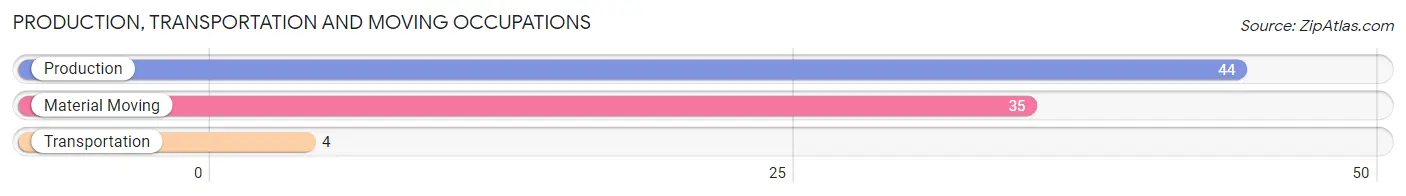
Production, Transportation and Moving Occupations by Sex
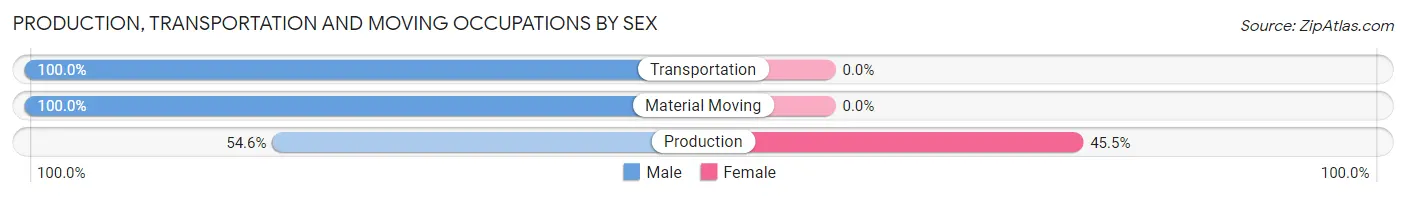
| Occupation | Male | Female |
| Production | 24 (54.5%) | 20 (45.5%) |
| Transportation | 4 (100.0%) | 0 (0.0%) |
| Material Moving | 35 (100.0%) | 0 (0.0%) |
| Total (Category) | 63 (75.9%) | 20 (24.1%) |
| Total (Overall) | 350 (59.0%) | 243 (41.0%) |
Employment Industries by Sex in Birchwood Village
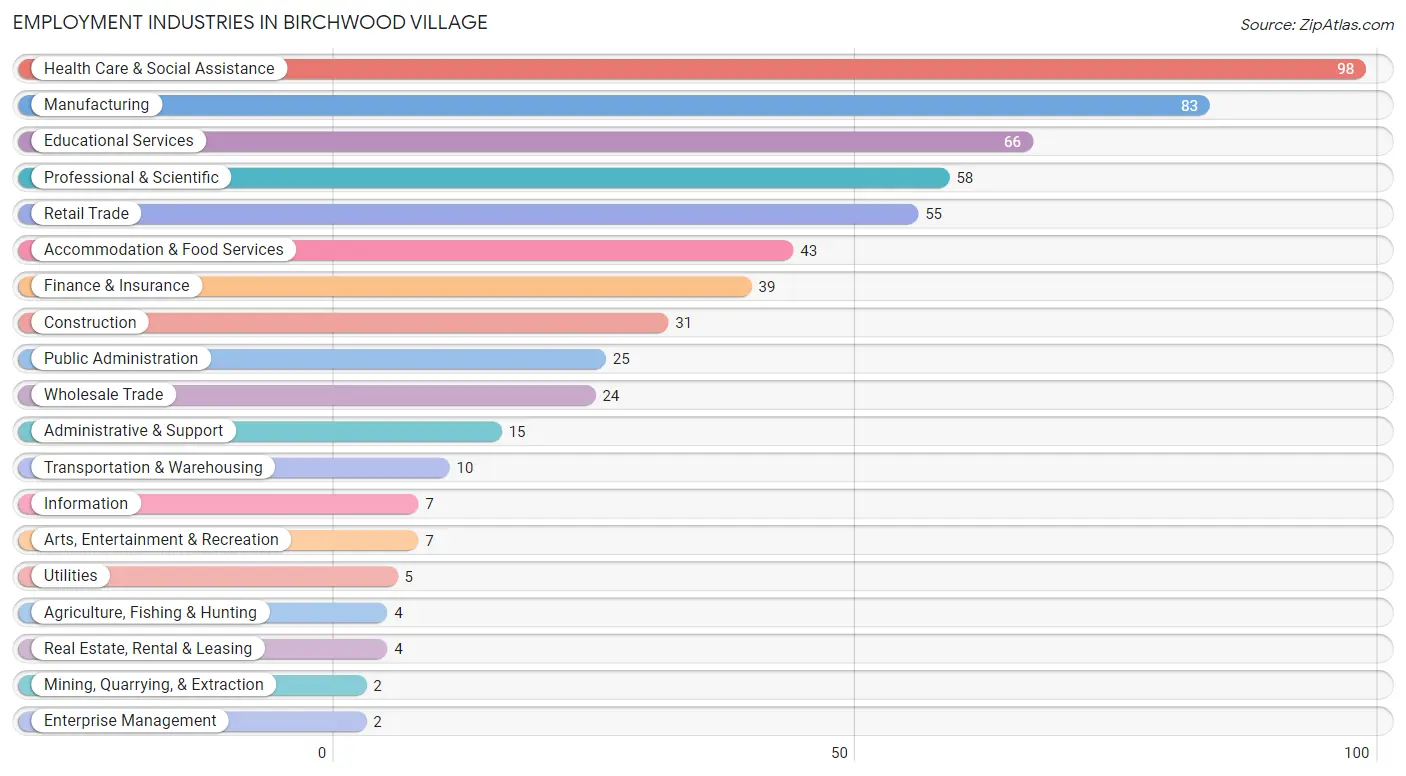
Employment Industries in Birchwood Village
The major employment industries in Birchwood Village include Health Care & Social Assistance (98 | 16.5%), Manufacturing (83 | 14.0%), Educational Services (66 | 11.1%), Professional & Scientific (58 | 9.8%), and Retail Trade (55 | 9.3%).
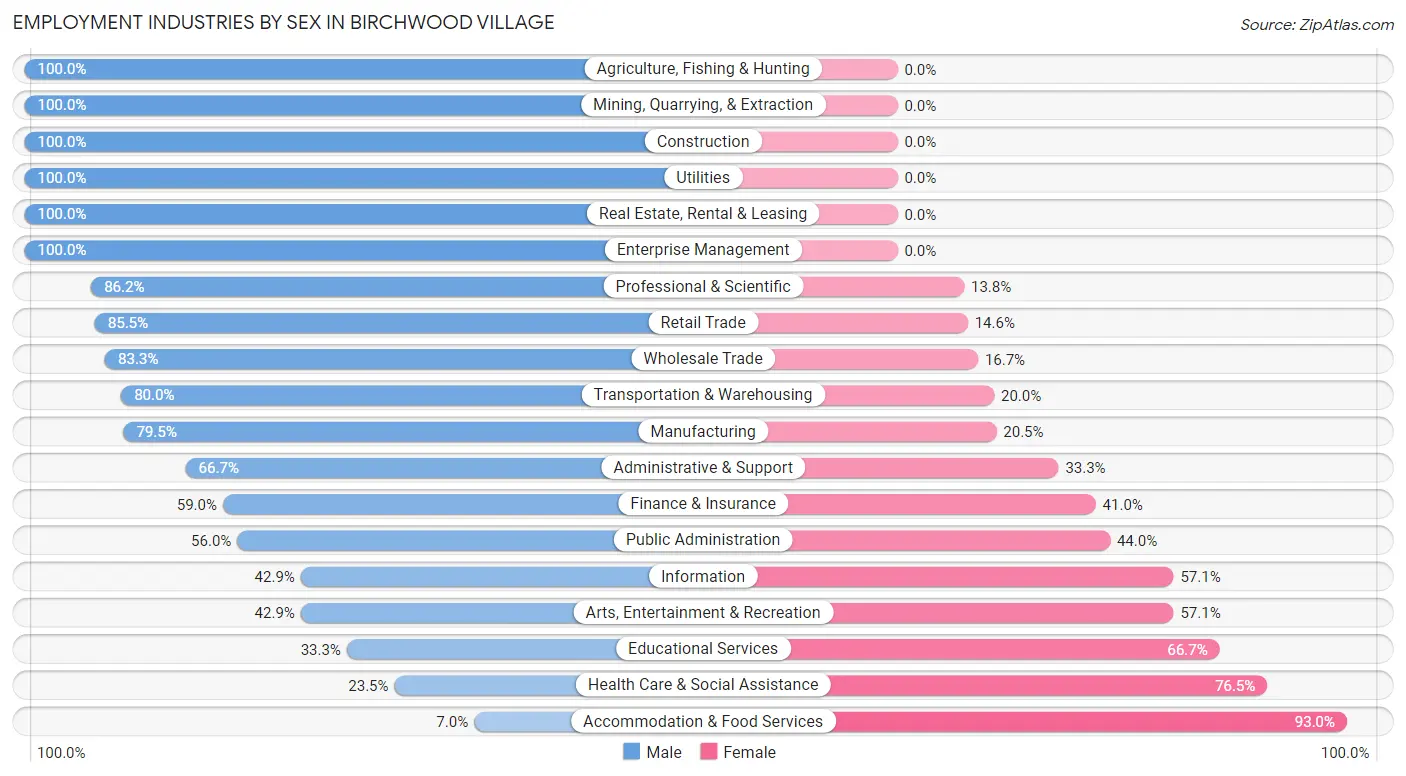
Employment Industries by Sex in Birchwood Village
The Birchwood Village industries that see more men than women are Agriculture, Fishing & Hunting (100.0%), Mining, Quarrying, & Extraction (100.0%), and Construction (100.0%), whereas the industries that tend to have a higher number of women are Accommodation & Food Services (93.0%), Health Care & Social Assistance (76.5%), and Educational Services (66.7%).
| Industry | Male | Female |
| Agriculture, Fishing & Hunting | 4 (100.0%) | 0 (0.0%) |
| Mining, Quarrying, & Extraction | 2 (100.0%) | 0 (0.0%) |
| Construction | 31 (100.0%) | 0 (0.0%) |
| Manufacturing | 66 (79.5%) | 17 (20.5%) |
| Wholesale Trade | 20 (83.3%) | 4 (16.7%) |
| Retail Trade | 47 (85.5%) | 8 (14.5%) |
| Transportation & Warehousing | 8 (80.0%) | 2 (20.0%) |
| Utilities | 5 (100.0%) | 0 (0.0%) |
| Information | 3 (42.9%) | 4 (57.1%) |
| Finance & Insurance | 23 (59.0%) | 16 (41.0%) |
| Real Estate, Rental & Leasing | 4 (100.0%) | 0 (0.0%) |
| Professional & Scientific | 50 (86.2%) | 8 (13.8%) |
| Enterprise Management | 2 (100.0%) | 0 (0.0%) |
| Administrative & Support | 10 (66.7%) | 5 (33.3%) |
| Educational Services | 22 (33.3%) | 44 (66.7%) |
| Health Care & Social Assistance | 23 (23.5%) | 75 (76.5%) |
| Arts, Entertainment & Recreation | 3 (42.9%) | 4 (57.1%) |
| Accommodation & Food Services | 3 (7.0%) | 40 (93.0%) |
| Public Administration | 14 (56.0%) | 11 (44.0%) |
| Total | 350 (59.0%) | 243 (41.0%) |
Education in Birchwood Village
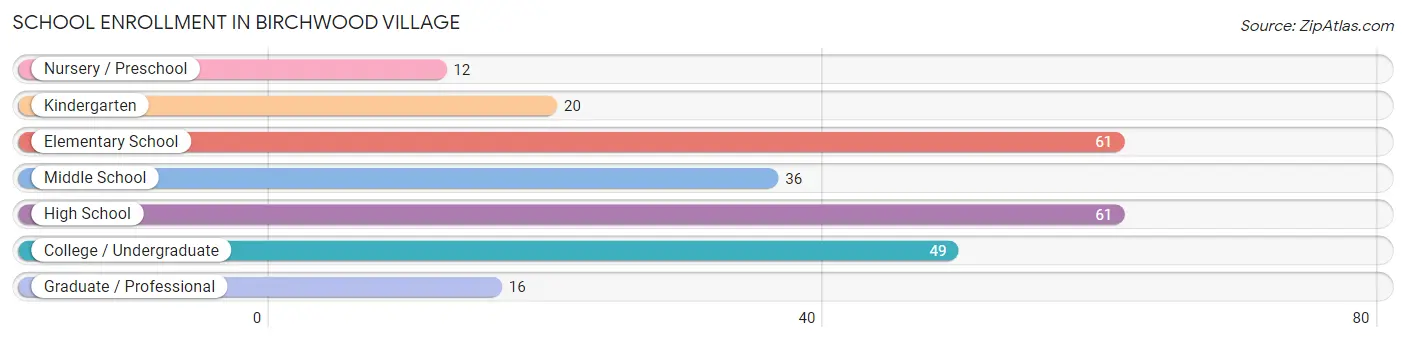
School Enrollment in Birchwood Village
The most common levels of schooling among the 255 students in Birchwood Village are elementary school (61 | 23.9%), high school (61 | 23.9%), and college / undergraduate (49 | 19.2%).
| School Level | # Students | % Students |
| Nursery / Preschool | 12 | 4.7% |
| Kindergarten | 20 | 7.8% |
| Elementary School | 61 | 23.9% |
| Middle School | 36 | 14.1% |
| High School | 61 | 23.9% |
| College / Undergraduate | 49 | 19.2% |
| Graduate / Professional | 16 | 6.3% |
| Total | 255 | 100.0% |
School Enrollment by Age by Funding Source in Birchwood Village
Out of a total of 255 students who are enrolled in schools in Birchwood Village, 28 (11.0%) attend a private institution, while the remaining 227 (89.0%) are enrolled in public schools. The age group of 25 to 34 year olds has the highest likelihood of being enrolled in private schools, with 6 (100.0% in the age bracket) enrolled. Conversely, the age group of 3 to 4 year olds has the lowest likelihood of being enrolled in a private school, with 6 (100.0% in the age bracket) attending a public institution.
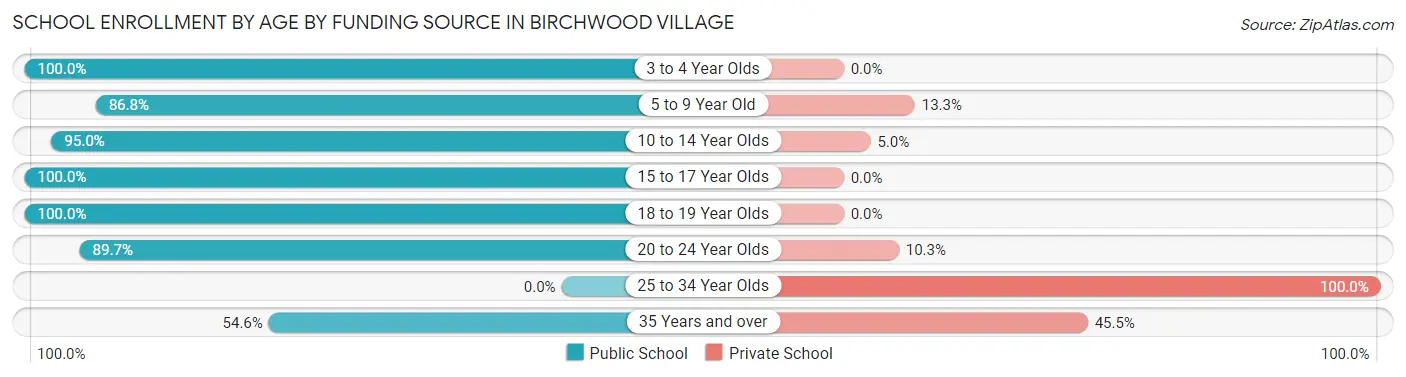
| Age Bracket | Public School | Private School |
| 3 to 4 Year Olds | 6 (100.0%) | 0 (0.0%) |
| 5 to 9 Year Old | 72 (86.8%) | 11 (13.3%) |
| 10 to 14 Year Olds | 38 (95.0%) | 2 (5.0%) |
| 15 to 17 Year Olds | 53 (100.0%) | 0 (0.0%) |
| 18 to 19 Year Olds | 17 (100.0%) | 0 (0.0%) |
| 20 to 24 Year Olds | 35 (89.7%) | 4 (10.3%) |
| 25 to 34 Year Olds | 0 (0.0%) | 6 (100.0%) |
| 35 Years and over | 6 (54.5%) | 5 (45.5%) |
| Total | 227 (89.0%) | 28 (11.0%) |
Educational Attainment by Field of Study in Birchwood Village
Business (86 | 16.5%), science & technology (60 | 11.5%), social sciences (46 | 8.8%), visual & performing arts (42 | 8.1%), and physical & health sciences (41 | 7.9%) are the most common fields of study among 520 individuals in Birchwood Village who have obtained a bachelor's degree or higher.
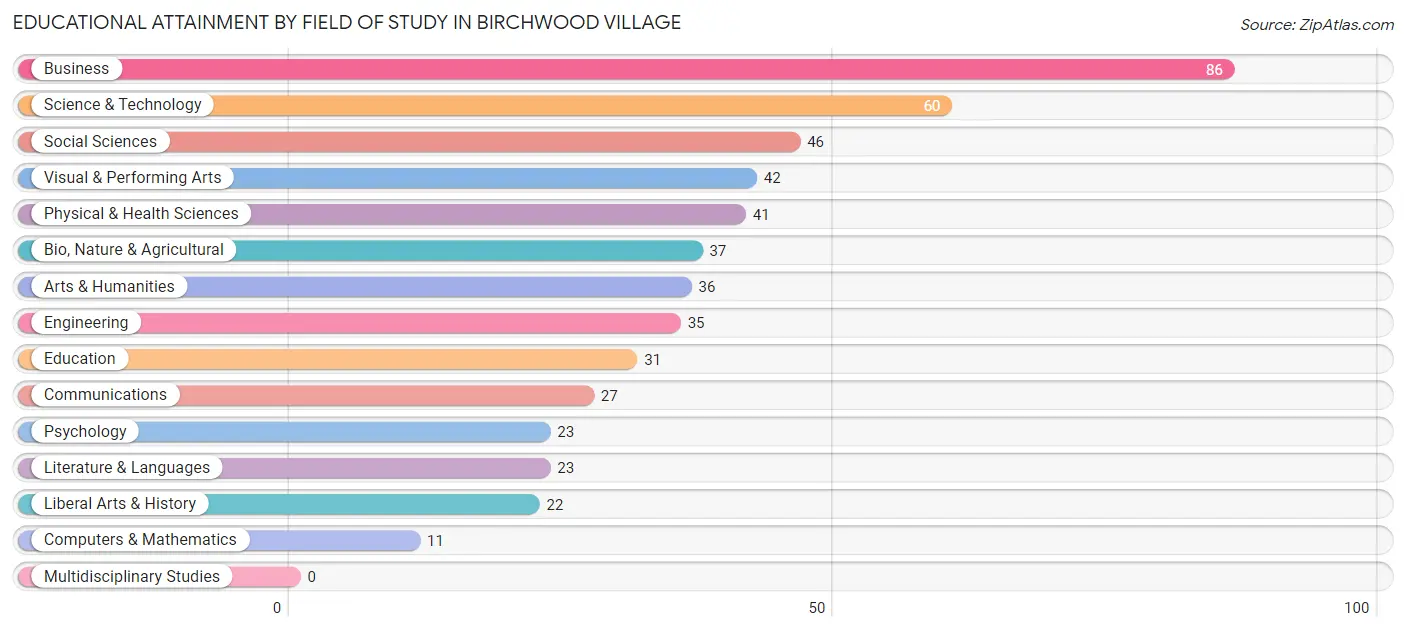
| Field of Study | # Graduates | % Graduates |
| Computers & Mathematics | 11 | 2.1% |
| Bio, Nature & Agricultural | 37 | 7.1% |
| Physical & Health Sciences | 41 | 7.9% |
| Psychology | 23 | 4.4% |
| Social Sciences | 46 | 8.8% |
| Engineering | 35 | 6.7% |
| Multidisciplinary Studies | 0 | 0.0% |
| Science & Technology | 60 | 11.5% |
| Business | 86 | 16.5% |
| Education | 31 | 6.0% |
| Literature & Languages | 23 | 4.4% |
| Liberal Arts & History | 22 | 4.2% |
| Visual & Performing Arts | 42 | 8.1% |
| Communications | 27 | 5.2% |
| Arts & Humanities | 36 | 6.9% |
| Total | 520 | 100.0% |
Transportation & Commute in Birchwood Village
Vehicle Availability by Sex in Birchwood Village
The most prevalent vehicle ownership categories in Birchwood Village are males with 2 vehicles (188, accounting for 54.0%) and females with 2 vehicles (142, making up 79.0%).
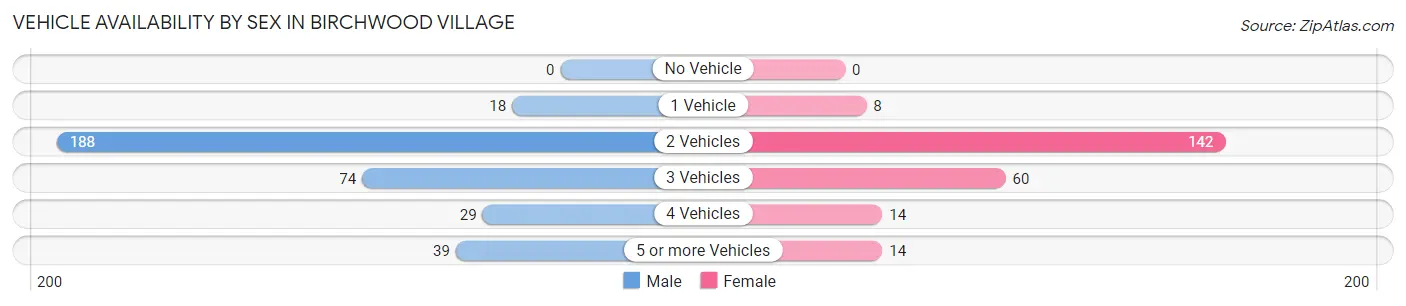
| Vehicles Available | Male | Female |
| No Vehicle | 0 (0.0%) | 0 (0.0%) |
| 1 Vehicle | 18 (5.2%) | 8 (3.4%) |
| 2 Vehicles | 188 (54.0%) | 142 (59.7%) |
| 3 Vehicles | 74 (21.3%) | 60 (25.2%) |
| 4 Vehicles | 29 (8.3%) | 14 (5.9%) |
| 5 or more Vehicles | 39 (11.2%) | 14 (5.9%) |
| Total | 348 (100.0%) | 238 (100.0%) |
Commute Time in Birchwood Village
The most frequently occuring commute durations in Birchwood Village are 20 to 24 minutes (106 commuters, 22.6%), 25 to 29 minutes (85 commuters, 18.1%), and 15 to 19 minutes (78 commuters, 16.6%).
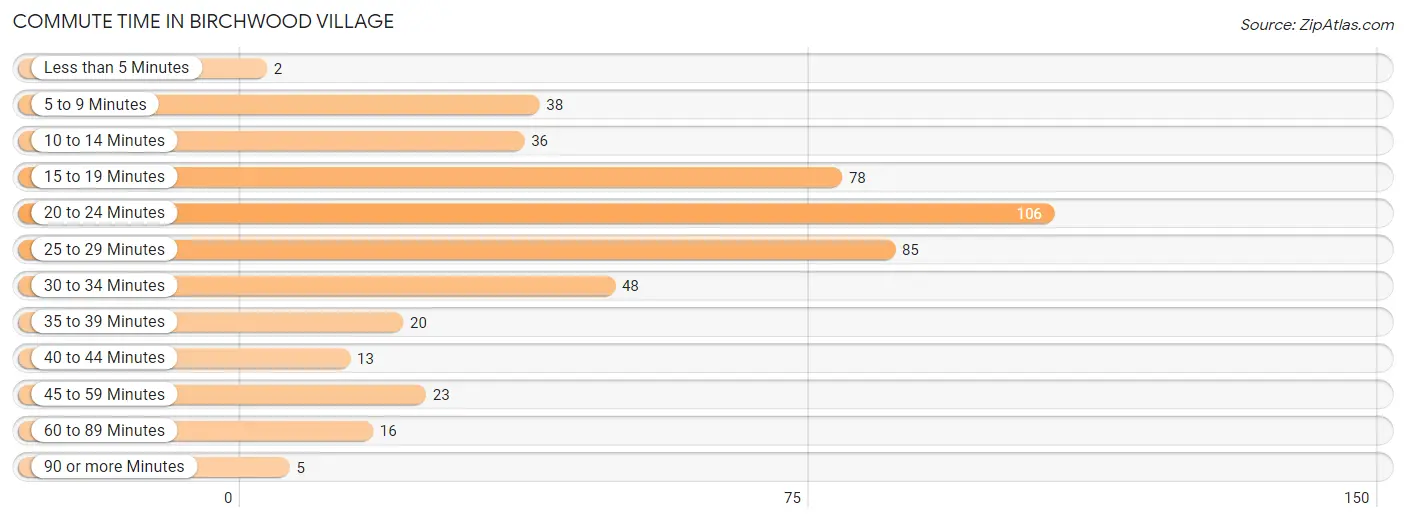
| Commute Time | # Commuters | % Commuters |
| Less than 5 Minutes | 2 | 0.4% |
| 5 to 9 Minutes | 38 | 8.1% |
| 10 to 14 Minutes | 36 | 7.7% |
| 15 to 19 Minutes | 78 | 16.6% |
| 20 to 24 Minutes | 106 | 22.6% |
| 25 to 29 Minutes | 85 | 18.1% |
| 30 to 34 Minutes | 48 | 10.2% |
| 35 to 39 Minutes | 20 | 4.3% |
| 40 to 44 Minutes | 13 | 2.8% |
| 45 to 59 Minutes | 23 | 4.9% |
| 60 to 89 Minutes | 16 | 3.4% |
| 90 or more Minutes | 5 | 1.1% |
Commute Time by Sex in Birchwood Village
The most common commute times in Birchwood Village are 20 to 24 minutes (85 commuters, 29.4%) for males and 15 to 19 minutes (53 commuters, 29.3%) for females.
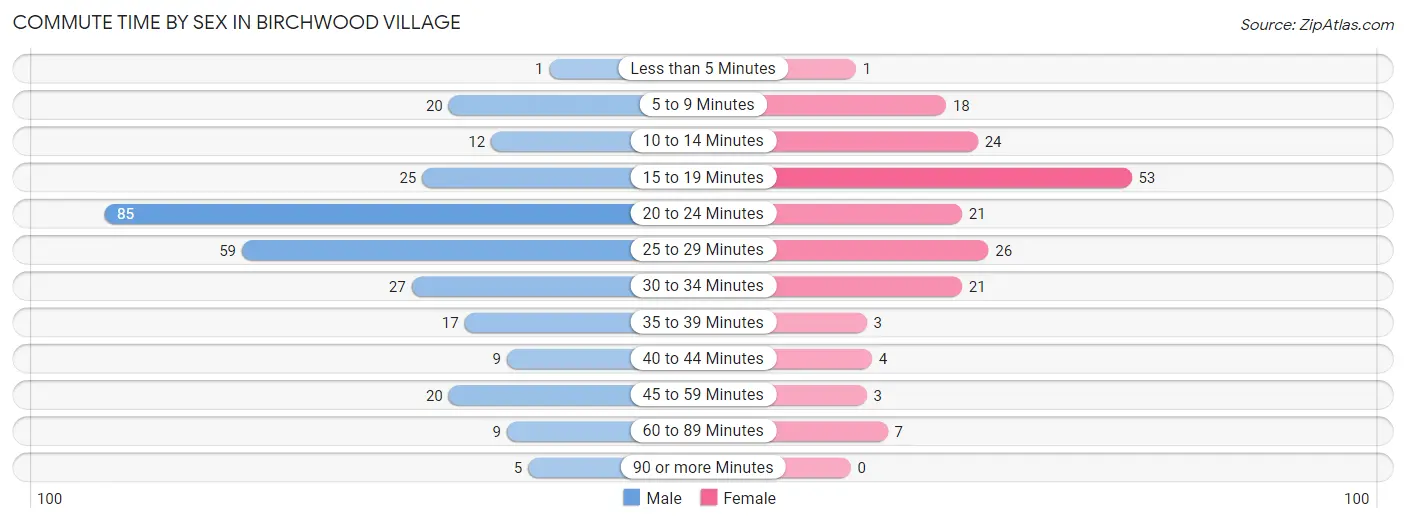
| Commute Time | Male | Female |
| Less than 5 Minutes | 1 (0.4%) | 1 (0.5%) |
| 5 to 9 Minutes | 20 (6.9%) | 18 (9.9%) |
| 10 to 14 Minutes | 12 (4.2%) | 24 (13.3%) |
| 15 to 19 Minutes | 25 (8.6%) | 53 (29.3%) |
| 20 to 24 Minutes | 85 (29.4%) | 21 (11.6%) |
| 25 to 29 Minutes | 59 (20.4%) | 26 (14.4%) |
| 30 to 34 Minutes | 27 (9.3%) | 21 (11.6%) |
| 35 to 39 Minutes | 17 (5.9%) | 3 (1.7%) |
| 40 to 44 Minutes | 9 (3.1%) | 4 (2.2%) |
| 45 to 59 Minutes | 20 (6.9%) | 3 (1.7%) |
| 60 to 89 Minutes | 9 (3.1%) | 7 (3.9%) |
| 90 or more Minutes | 5 (1.7%) | 0 (0.0%) |
Time of Departure to Work by Sex in Birchwood Village
The most frequent times of departure to work in Birchwood Village are 6:30 AM to 6:59 AM (61, 21.1%) for males and 7:00 AM to 7:29 AM (36, 19.9%) for females.
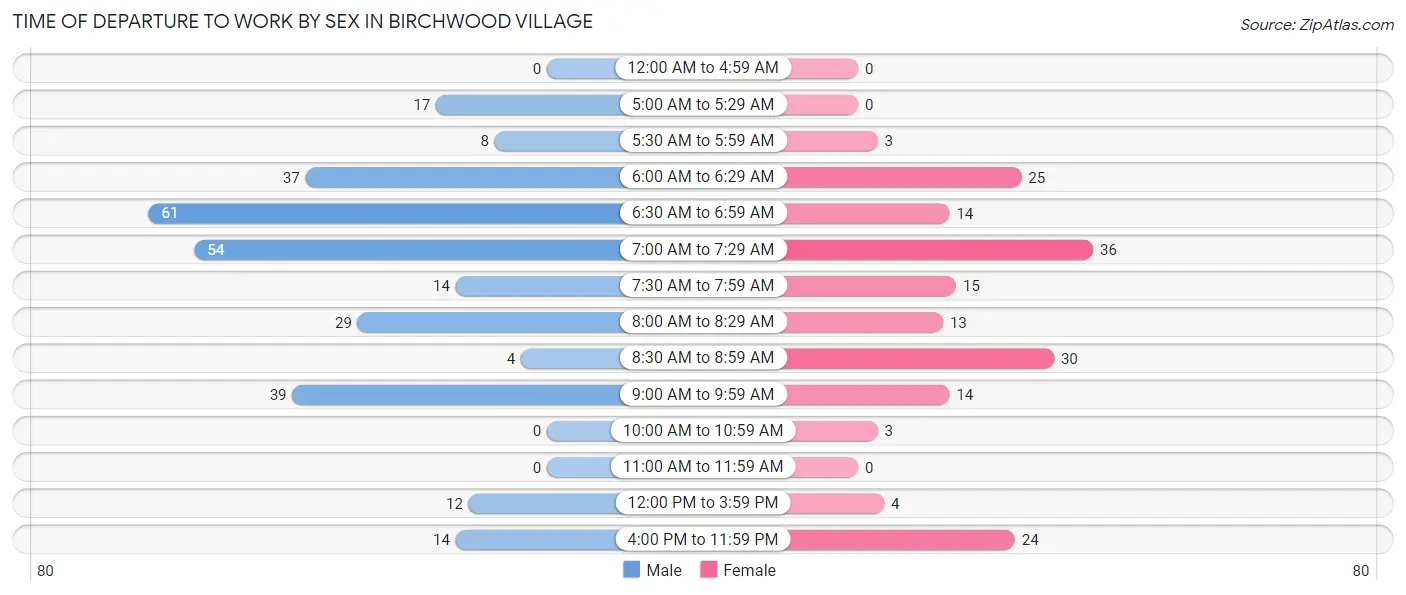
| Time of Departure | Male | Female |
| 12:00 AM to 4:59 AM | 0 (0.0%) | 0 (0.0%) |
| 5:00 AM to 5:29 AM | 17 (5.9%) | 0 (0.0%) |
| 5:30 AM to 5:59 AM | 8 (2.8%) | 3 (1.7%) |
| 6:00 AM to 6:29 AM | 37 (12.8%) | 25 (13.8%) |
| 6:30 AM to 6:59 AM | 61 (21.1%) | 14 (7.7%) |
| 7:00 AM to 7:29 AM | 54 (18.7%) | 36 (19.9%) |
| 7:30 AM to 7:59 AM | 14 (4.8%) | 15 (8.3%) |
| 8:00 AM to 8:29 AM | 29 (10.0%) | 13 (7.2%) |
| 8:30 AM to 8:59 AM | 4 (1.4%) | 30 (16.6%) |
| 9:00 AM to 9:59 AM | 39 (13.5%) | 14 (7.7%) |
| 10:00 AM to 10:59 AM | 0 (0.0%) | 3 (1.7%) |
| 11:00 AM to 11:59 AM | 0 (0.0%) | 0 (0.0%) |
| 12:00 PM to 3:59 PM | 12 (4.2%) | 4 (2.2%) |
| 4:00 PM to 11:59 PM | 14 (4.8%) | 24 (13.3%) |
| Total | 289 (100.0%) | 181 (100.0%) |
Housing Occupancy in Birchwood Village
Occupancy by Ownership in Birchwood Village
Of the total 394 dwellings in Birchwood Village, owner-occupied units account for 336 (85.3%), while renter-occupied units make up 58 (14.7%).
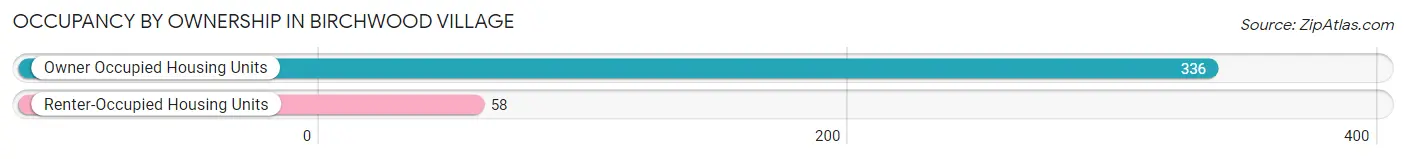
| Occupancy | # Housing Units | % Housing Units |
| Owner Occupied Housing Units | 336 | 85.3% |
| Renter-Occupied Housing Units | 58 | 14.7% |
| Total Occupied Housing Units | 394 | 100.0% |
Occupancy by Household Size in Birchwood Village
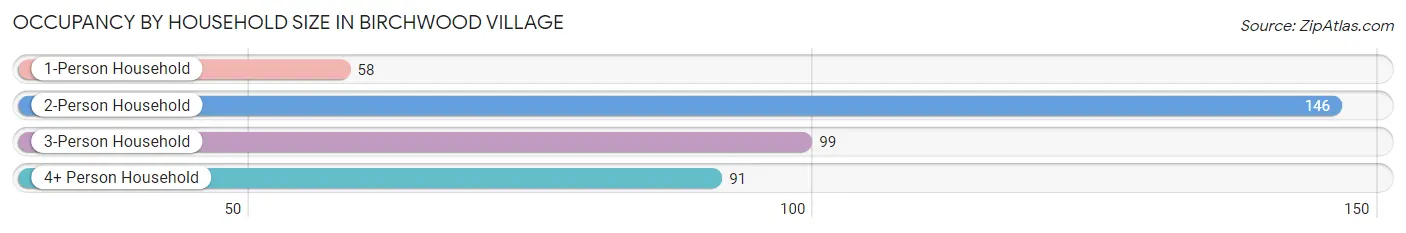
| Household Size | # Housing Units | % Housing Units |
| 1-Person Household | 58 | 14.7% |
| 2-Person Household | 146 | 37.1% |
| 3-Person Household | 99 | 25.1% |
| 4+ Person Household | 91 | 23.1% |
| Total Housing Units | 394 | 100.0% |
Occupancy by Ownership by Household Size in Birchwood Village
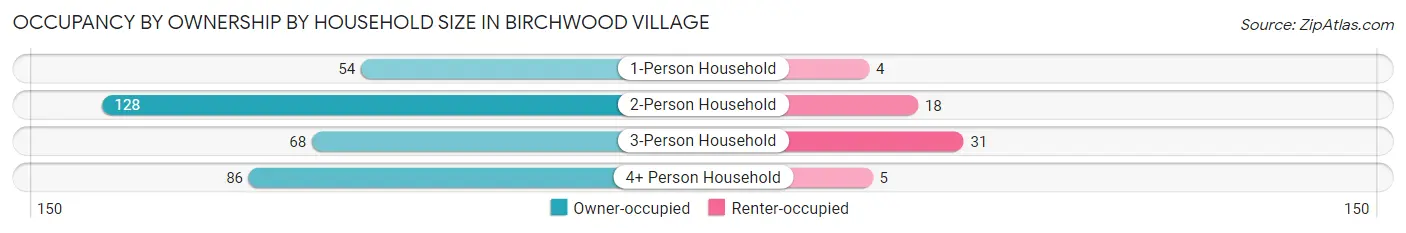
| Household Size | Owner-occupied | Renter-occupied |
| 1-Person Household | 54 (93.1%) | 4 (6.9%) |
| 2-Person Household | 128 (87.7%) | 18 (12.3%) |
| 3-Person Household | 68 (68.7%) | 31 (31.3%) |
| 4+ Person Household | 86 (94.5%) | 5 (5.5%) |
| Total Housing Units | 336 (85.3%) | 58 (14.7%) |
Occupancy by Educational Attainment in Birchwood Village
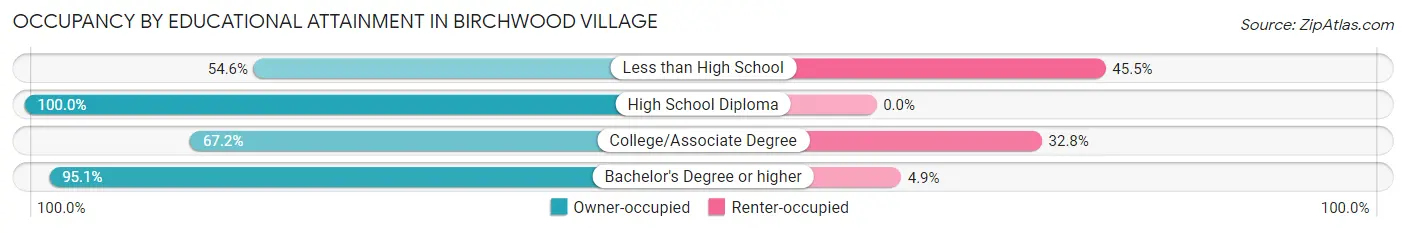
| Household Size | Owner-occupied | Renter-occupied |
| Less than High School | 6 (54.5%) | 5 (45.5%) |
| High School Diploma | 12 (100.0%) | 0 (0.0%) |
| College/Associate Degree | 84 (67.2%) | 41 (32.8%) |
| Bachelor's Degree or higher | 234 (95.1%) | 12 (4.9%) |
Occupancy by Age of Householder in Birchwood Village
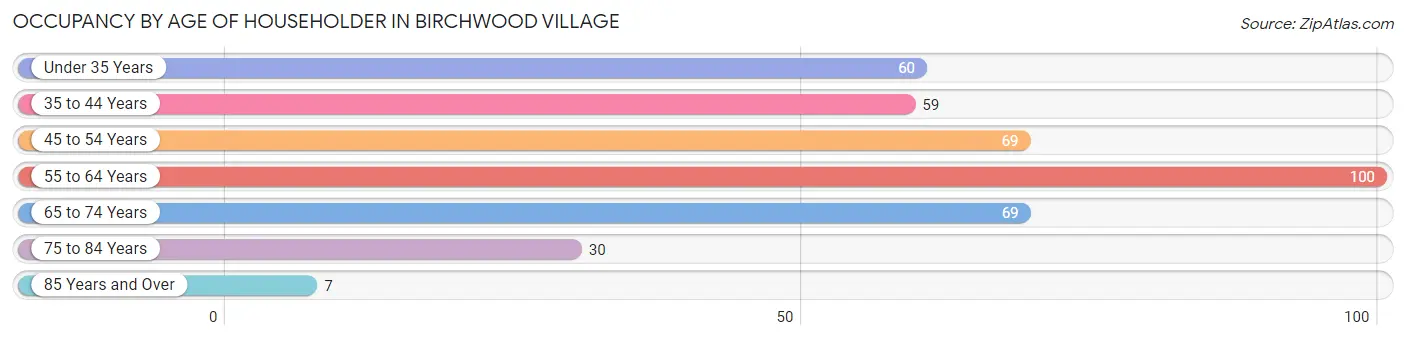
| Age Bracket | # Households | % Households |
| Under 35 Years | 60 | 15.2% |
| 35 to 44 Years | 59 | 15.0% |
| 45 to 54 Years | 69 | 17.5% |
| 55 to 64 Years | 100 | 25.4% |
| 65 to 74 Years | 69 | 17.5% |
| 75 to 84 Years | 30 | 7.6% |
| 85 Years and Over | 7 | 1.8% |
| Total | 394 | 100.0% |
Housing Finances in Birchwood Village
Median Income by Occupancy in Birchwood Village
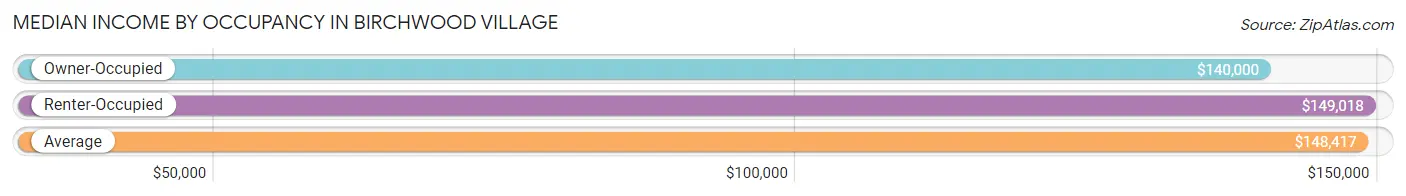
| Occupancy Type | # Households | Median Income |
| Owner-Occupied | 336 (85.3%) | $140,000 |
| Renter-Occupied | 58 (14.7%) | $149,018 |
| Average | 394 (100.0%) | $148,417 |
Occupancy by Householder Income Bracket in Birchwood Village
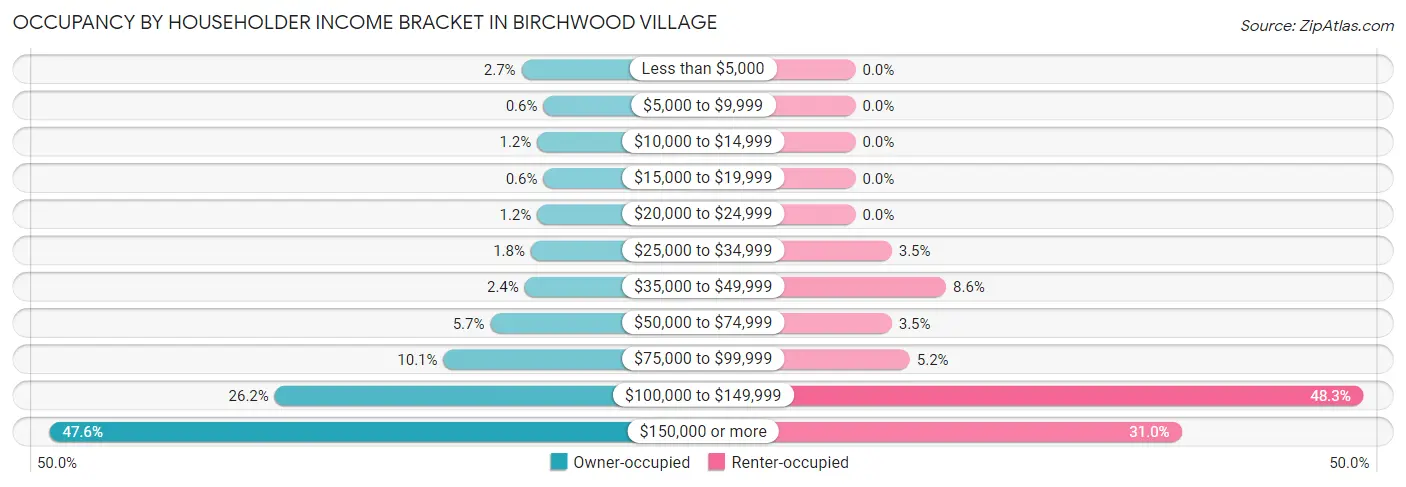
| Income Bracket | Owner-occupied | Renter-occupied |
| Less than $5,000 | 9 (2.7%) | 0 (0.0%) |
| $5,000 to $9,999 | 2 (0.6%) | 0 (0.0%) |
| $10,000 to $14,999 | 4 (1.2%) | 0 (0.0%) |
| $15,000 to $19,999 | 2 (0.6%) | 0 (0.0%) |
| $20,000 to $24,999 | 4 (1.2%) | 0 (0.0%) |
| $25,000 to $34,999 | 6 (1.8%) | 2 (3.5%) |
| $35,000 to $49,999 | 8 (2.4%) | 5 (8.6%) |
| $50,000 to $74,999 | 19 (5.7%) | 2 (3.5%) |
| $75,000 to $99,999 | 34 (10.1%) | 3 (5.2%) |
| $100,000 to $149,999 | 88 (26.2%) | 28 (48.3%) |
| $150,000 or more | 160 (47.6%) | 18 (31.0%) |
| Total | 336 (100.0%) | 58 (100.0%) |
Monthly Housing Cost Tiers in Birchwood Village
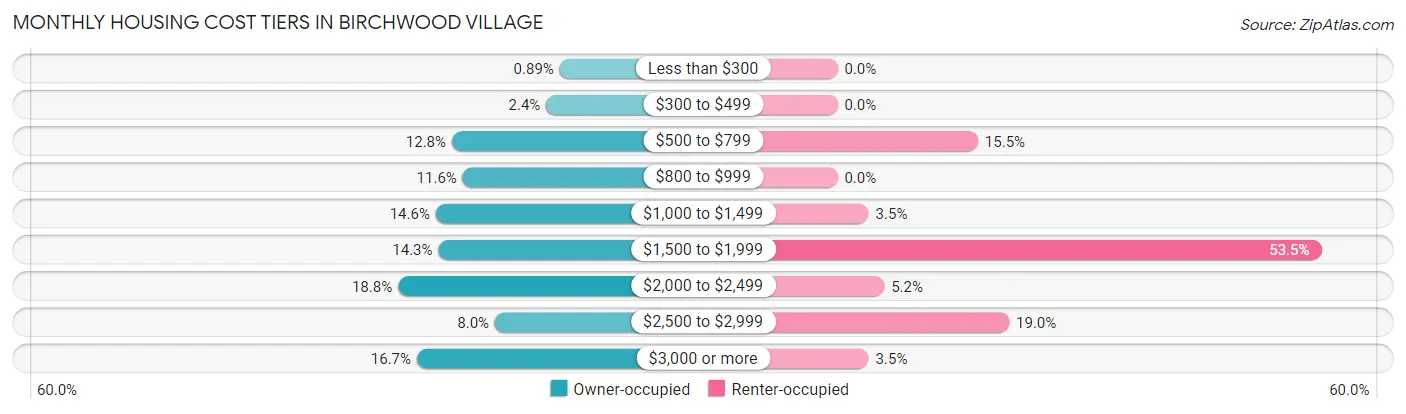
| Monthly Cost | Owner-occupied | Renter-occupied |
| Less than $300 | 3 (0.9%) | 0 (0.0%) |
| $300 to $499 | 8 (2.4%) | 0 (0.0%) |
| $500 to $799 | 43 (12.8%) | 9 (15.5%) |
| $800 to $999 | 39 (11.6%) | 0 (0.0%) |
| $1,000 to $1,499 | 49 (14.6%) | 2 (3.5%) |
| $1,500 to $1,999 | 48 (14.3%) | 31 (53.4%) |
| $2,000 to $2,499 | 63 (18.8%) | 3 (5.2%) |
| $2,500 to $2,999 | 27 (8.0%) | 11 (19.0%) |
| $3,000 or more | 56 (16.7%) | 2 (3.5%) |
| Total | 336 (100.0%) | 58 (100.0%) |
Physical Housing Characteristics in Birchwood Village
Housing Structures in Birchwood Village
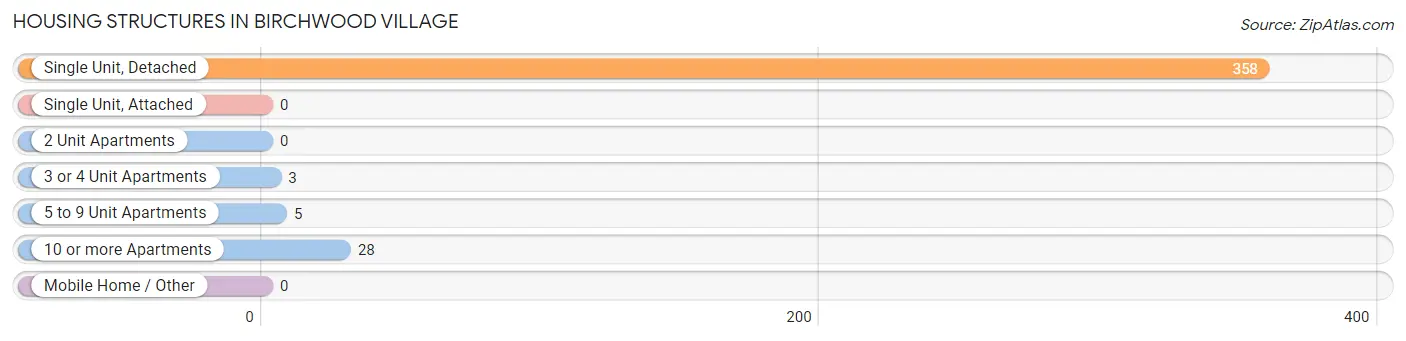
| Structure Type | # Housing Units | % Housing Units |
| Single Unit, Detached | 358 | 90.9% |
| Single Unit, Attached | 0 | 0.0% |
| 2 Unit Apartments | 0 | 0.0% |
| 3 or 4 Unit Apartments | 3 | 0.8% |
| 5 to 9 Unit Apartments | 5 | 1.3% |
| 10 or more Apartments | 28 | 7.1% |
| Mobile Home / Other | 0 | 0.0% |
| Total | 394 | 100.0% |
Housing Structures by Occupancy in Birchwood Village
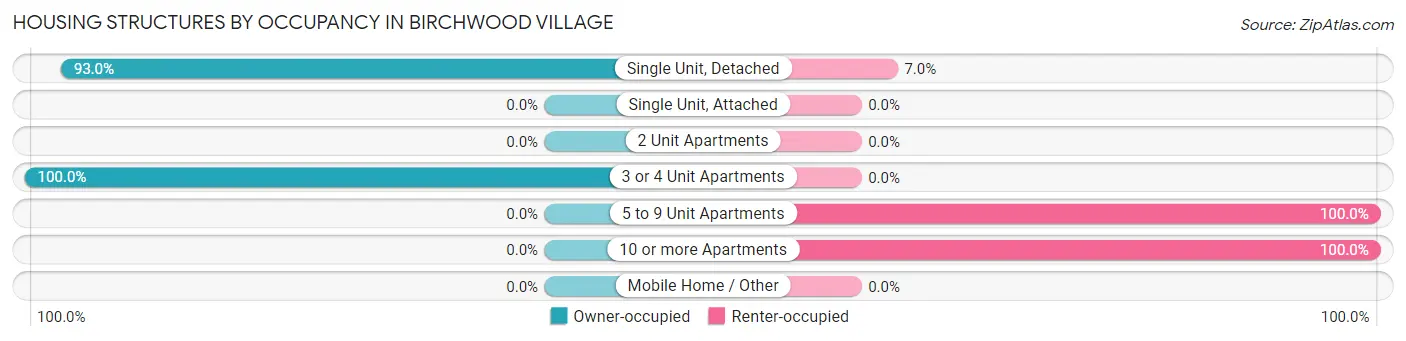
| Structure Type | Owner-occupied | Renter-occupied |
| Single Unit, Detached | 333 (93.0%) | 25 (7.0%) |
| Single Unit, Attached | 0 (0.0%) | 0 (0.0%) |
| 2 Unit Apartments | 0 (0.0%) | 0 (0.0%) |
| 3 or 4 Unit Apartments | 3 (100.0%) | 0 (0.0%) |
| 5 to 9 Unit Apartments | 0 (0.0%) | 5 (100.0%) |
| 10 or more Apartments | 0 (0.0%) | 28 (100.0%) |
| Mobile Home / Other | 0 (0.0%) | 0 (0.0%) |
| Total | 336 (85.3%) | 58 (14.7%) |
Housing Structures by Number of Rooms in Birchwood Village
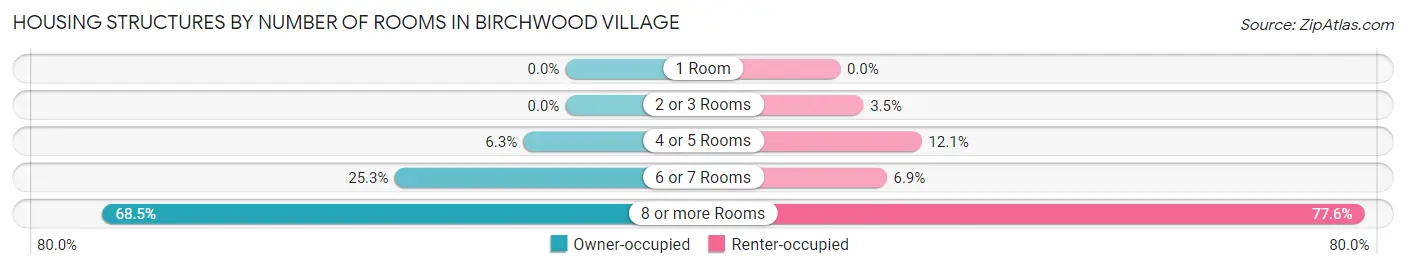
| Number of Rooms | Owner-occupied | Renter-occupied |
| 1 Room | 0 (0.0%) | 0 (0.0%) |
| 2 or 3 Rooms | 0 (0.0%) | 2 (3.5%) |
| 4 or 5 Rooms | 21 (6.2%) | 7 (12.1%) |
| 6 or 7 Rooms | 85 (25.3%) | 4 (6.9%) |
| 8 or more Rooms | 230 (68.4%) | 45 (77.6%) |
| Total | 336 (100.0%) | 58 (100.0%) |
Housing Structure by Heating Type in Birchwood Village
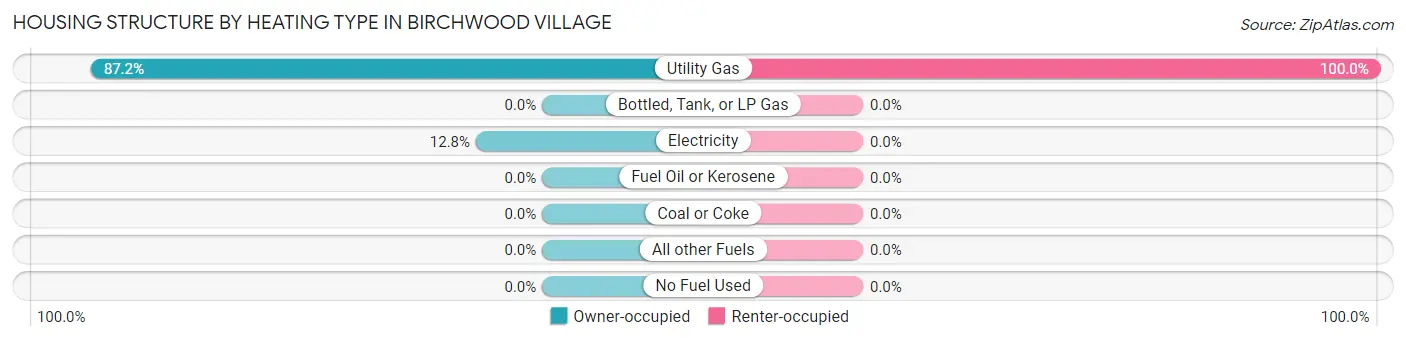
| Heating Type | Owner-occupied | Renter-occupied |
| Utility Gas | 293 (87.2%) | 58 (100.0%) |
| Bottled, Tank, or LP Gas | 0 (0.0%) | 0 (0.0%) |
| Electricity | 43 (12.8%) | 0 (0.0%) |
| Fuel Oil or Kerosene | 0 (0.0%) | 0 (0.0%) |
| Coal or Coke | 0 (0.0%) | 0 (0.0%) |
| All other Fuels | 0 (0.0%) | 0 (0.0%) |
| No Fuel Used | 0 (0.0%) | 0 (0.0%) |
| Total | 336 (100.0%) | 58 (100.0%) |
Household Vehicle Usage in Birchwood Village
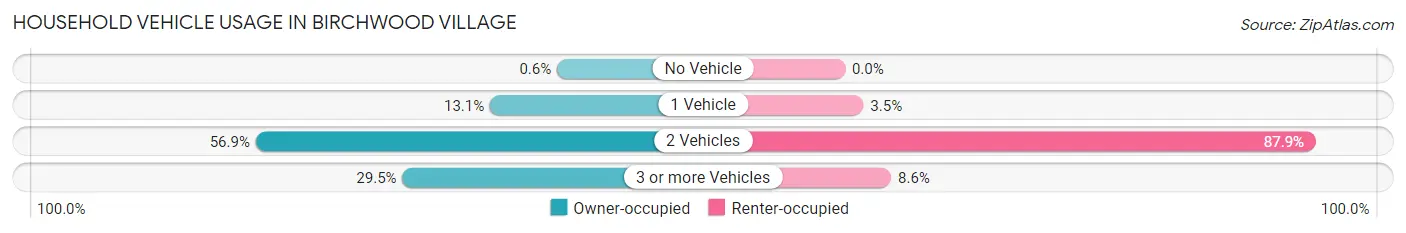
| Vehicles per Household | Owner-occupied | Renter-occupied |
| No Vehicle | 2 (0.6%) | 0 (0.0%) |
| 1 Vehicle | 44 (13.1%) | 2 (3.5%) |
| 2 Vehicles | 191 (56.9%) | 51 (87.9%) |
| 3 or more Vehicles | 99 (29.5%) | 5 (8.6%) |
| Total | 336 (100.0%) | 58 (100.0%) |
Real Estate & Mortgages in Birchwood Village
Real Estate and Mortgage Overview in Birchwood Village
| Characteristic | Without Mortgage | With Mortgage |
| Housing Units | 120 | 216 |
| Median Property Value | $412,900 | $446,600 |
| Median Household Income | $116,500 | $118 |
| Monthly Housing Costs | $850 | $51 |
| Real Estate Taxes | $4,422 | $5 |
Property Value by Mortgage Status in Birchwood Village
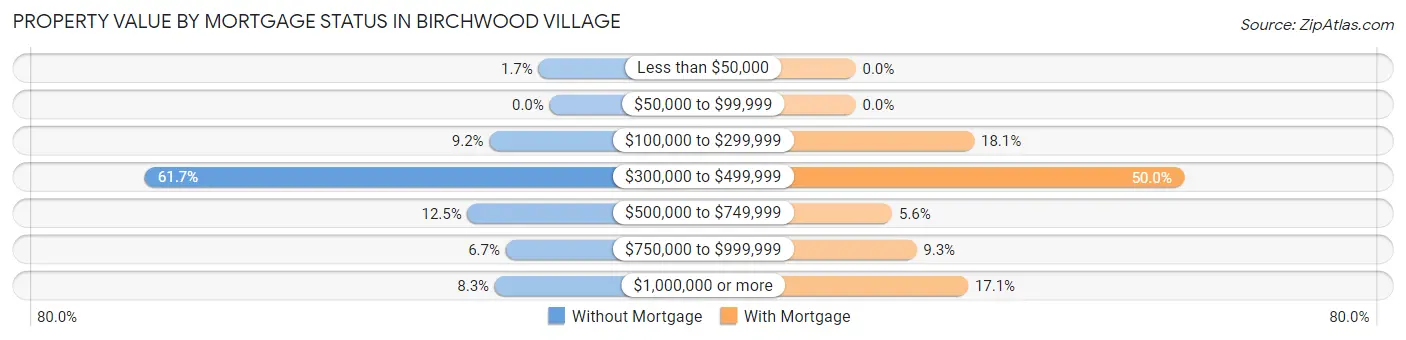
| Property Value | Without Mortgage | With Mortgage |
| Less than $50,000 | 2 (1.7%) | 0 (0.0%) |
| $50,000 to $99,999 | 0 (0.0%) | 0 (0.0%) |
| $100,000 to $299,999 | 11 (9.2%) | 39 (18.1%) |
| $300,000 to $499,999 | 74 (61.7%) | 108 (50.0%) |
| $500,000 to $749,999 | 15 (12.5%) | 12 (5.6%) |
| $750,000 to $999,999 | 8 (6.7%) | 20 (9.3%) |
| $1,000,000 or more | 10 (8.3%) | 37 (17.1%) |
| Total | 120 (100.0%) | 216 (100.0%) |
Household Income by Mortgage Status in Birchwood Village
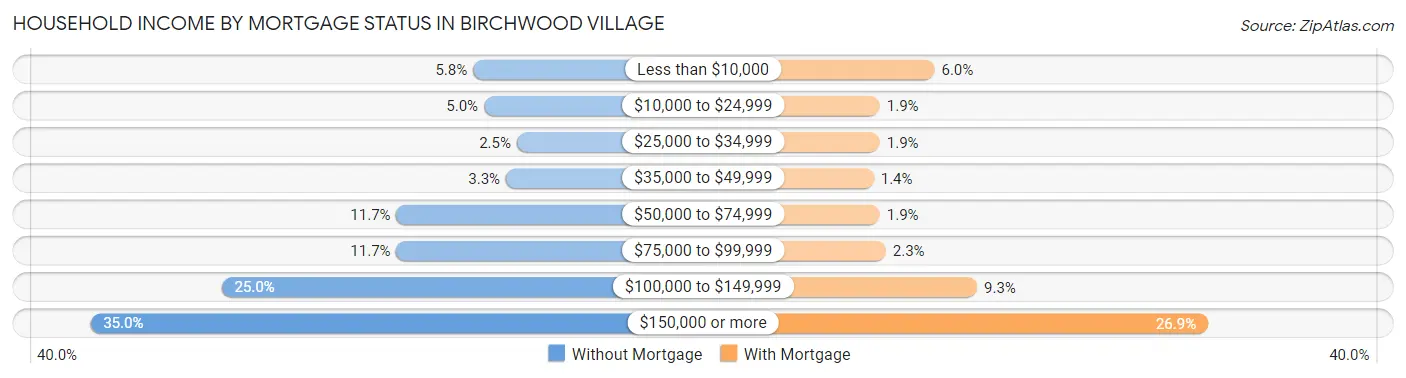
| Household Income | Without Mortgage | With Mortgage |
| Less than $10,000 | 7 (5.8%) | 13 (6.0%) |
| $10,000 to $24,999 | 6 (5.0%) | 4 (1.8%) |
| $25,000 to $34,999 | 3 (2.5%) | 4 (1.8%) |
| $35,000 to $49,999 | 4 (3.3%) | 3 (1.4%) |
| $50,000 to $74,999 | 14 (11.7%) | 4 (1.8%) |
| $75,000 to $99,999 | 14 (11.7%) | 5 (2.3%) |
| $100,000 to $149,999 | 30 (25.0%) | 20 (9.3%) |
| $150,000 or more | 42 (35.0%) | 58 (26.9%) |
| Total | 120 (100.0%) | 216 (100.0%) |
Property Value to Household Income Ratio in Birchwood Village
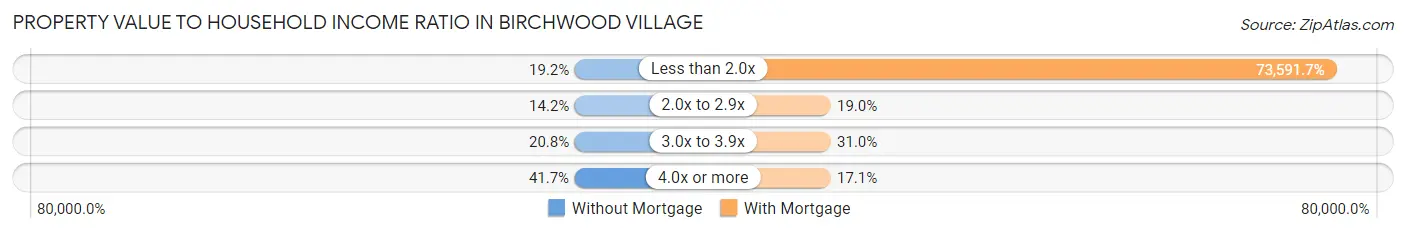
| Value-to-Income Ratio | Without Mortgage | With Mortgage |
| Less than 2.0x | 23 (19.2%) | 158,958 (73,591.7%) |
| 2.0x to 2.9x | 17 (14.2%) | 41 (19.0%) |
| 3.0x to 3.9x | 25 (20.8%) | 67 (31.0%) |
| 4.0x or more | 50 (41.7%) | 37 (17.1%) |
| Total | 120 (100.0%) | 216 (100.0%) |
Real Estate Taxes by Mortgage Status in Birchwood Village
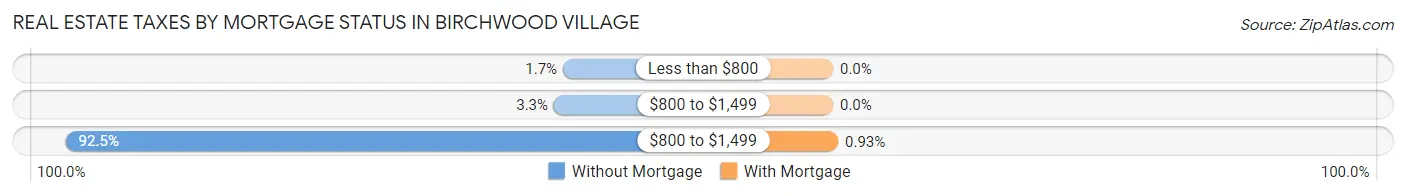
| Property Taxes | Without Mortgage | With Mortgage |
| Less than $800 | 2 (1.7%) | 0 (0.0%) |
| $800 to $1,499 | 4 (3.3%) | 0 (0.0%) |
| $800 to $1,499 | 111 (92.5%) | 2 (0.9%) |
| Total | 120 (100.0%) | 216 (100.0%) |
Health & Disability in Birchwood Village
Health Insurance Coverage by Age in Birchwood Village
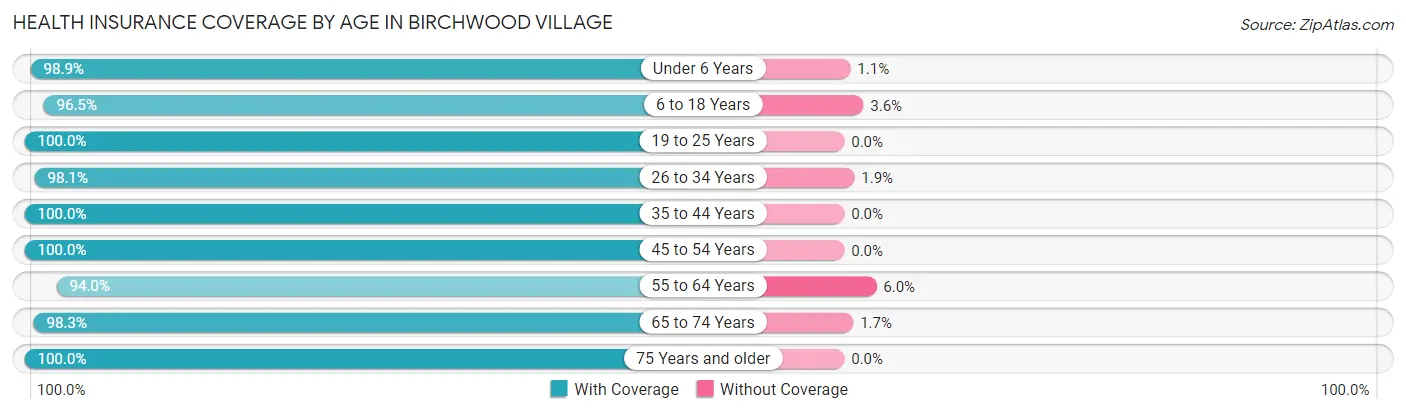
| Age Bracket | With Coverage | Without Coverage |
| Under 6 Years | 87 (98.9%) | 1 (1.1%) |
| 6 to 18 Years | 163 (96.5%) | 6 (3.5%) |
| 19 to 25 Years | 106 (100.0%) | 0 (0.0%) |
| 26 to 34 Years | 105 (98.1%) | 2 (1.9%) |
| 35 to 44 Years | 118 (100.0%) | 0 (0.0%) |
| 45 to 54 Years | 124 (100.0%) | 0 (0.0%) |
| 55 to 64 Years | 173 (94.0%) | 11 (6.0%) |
| 65 to 74 Years | 118 (98.3%) | 2 (1.7%) |
| 75 Years and older | 53 (100.0%) | 0 (0.0%) |
| Total | 1,047 (97.9%) | 22 (2.1%) |
Health Insurance Coverage by Citizenship Status in Birchwood Village
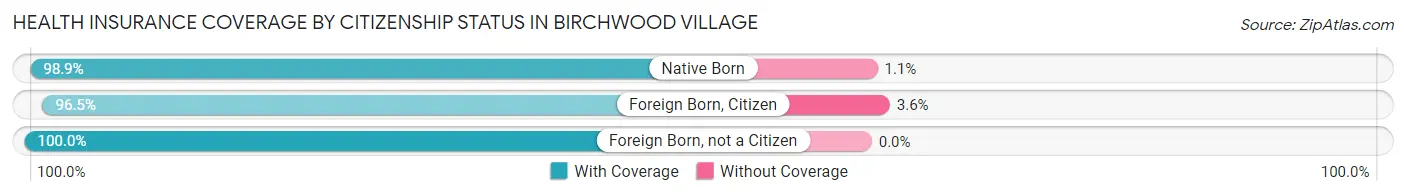
| Citizenship Status | With Coverage | Without Coverage |
| Native Born | 87 (98.9%) | 1 (1.1%) |
| Foreign Born, Citizen | 163 (96.5%) | 6 (3.5%) |
| Foreign Born, not a Citizen | 106 (100.0%) | 0 (0.0%) |
Health Insurance Coverage by Household Income in Birchwood Village
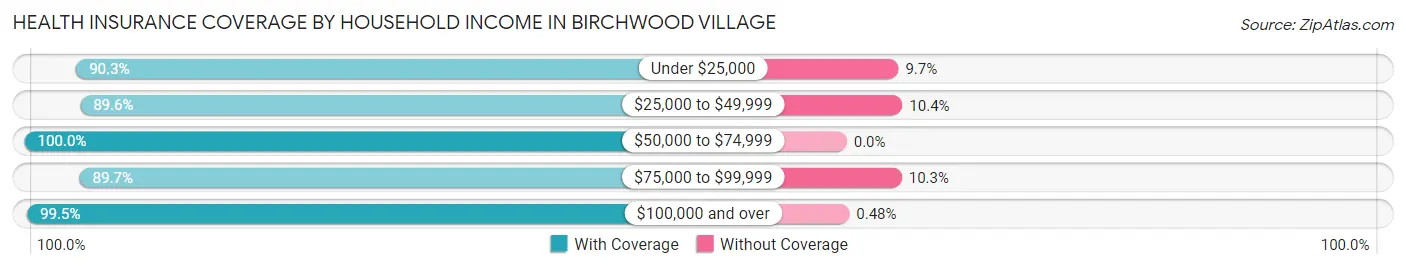
| Household Income | With Coverage | Without Coverage |
| Under $25,000 | 28 (90.3%) | 3 (9.7%) |
| $25,000 to $49,999 | 43 (89.6%) | 5 (10.4%) |
| $50,000 to $74,999 | 53 (100.0%) | 0 (0.0%) |
| $75,000 to $99,999 | 87 (89.7%) | 10 (10.3%) |
| $100,000 and over | 836 (99.5%) | 4 (0.5%) |
Public vs Private Health Insurance Coverage by Age in Birchwood Village
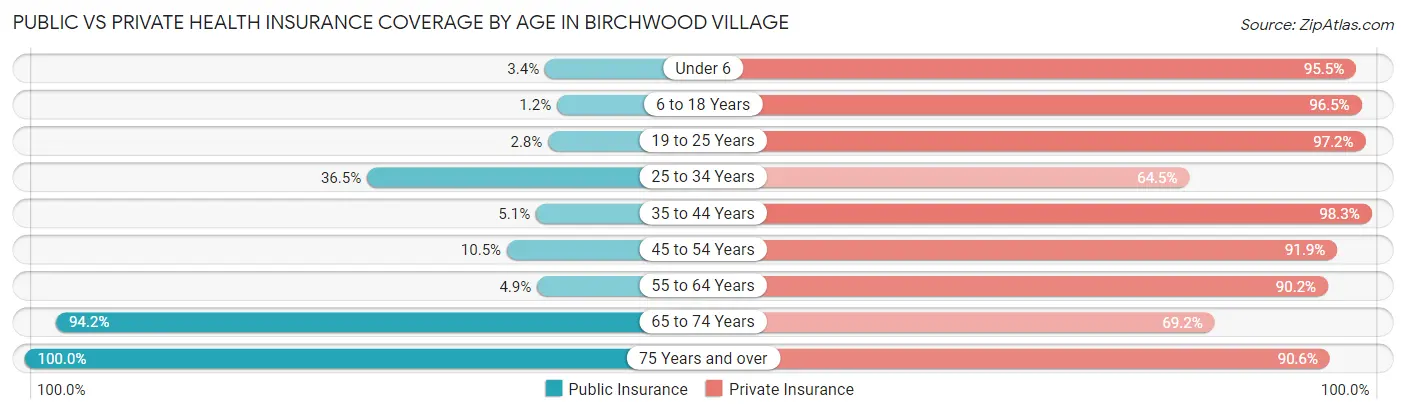
| Age Bracket | Public Insurance | Private Insurance |
| Under 6 | 3 (3.4%) | 84 (95.5%) |
| 6 to 18 Years | 2 (1.2%) | 163 (96.5%) |
| 19 to 25 Years | 3 (2.8%) | 103 (97.2%) |
| 25 to 34 Years | 39 (36.4%) | 69 (64.5%) |
| 35 to 44 Years | 6 (5.1%) | 116 (98.3%) |
| 45 to 54 Years | 13 (10.5%) | 114 (91.9%) |
| 55 to 64 Years | 9 (4.9%) | 166 (90.2%) |
| 65 to 74 Years | 113 (94.2%) | 83 (69.2%) |
| 75 Years and over | 53 (100.0%) | 48 (90.6%) |
| Total | 241 (22.5%) | 946 (88.5%) |
Disability Status by Sex by Age in Birchwood Village
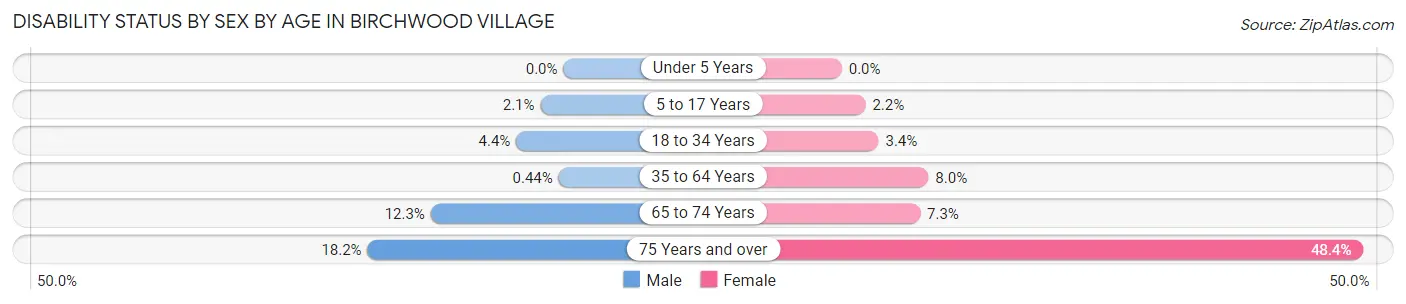
| Age Bracket | Male | Female |
| Under 5 Years | 0 (0.0%) | 0 (0.0%) |
| 5 to 17 Years | 2 (2.1%) | 2 (2.2%) |
| 18 to 34 Years | 6 (4.4%) | 3 (3.4%) |
| 35 to 64 Years | 1 (0.4%) | 16 (8.0%) |
| 65 to 74 Years | 8 (12.3%) | 4 (7.3%) |
| 75 Years and over | 4 (18.2%) | 15 (48.4%) |
Disability Class by Sex by Age in Birchwood Village
Disability Class: Hearing Difficulty
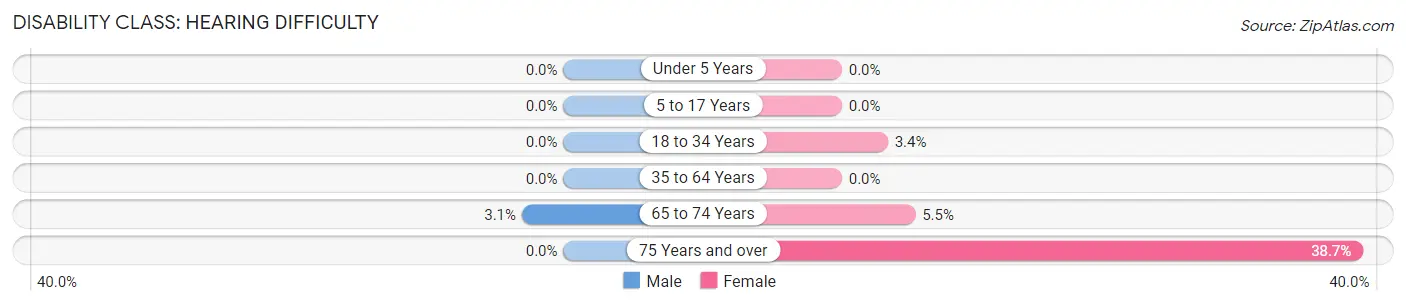
| Age Bracket | Male | Female |
| Under 5 Years | 0 (0.0%) | 0 (0.0%) |
| 5 to 17 Years | 0 (0.0%) | 0 (0.0%) |
| 18 to 34 Years | 0 (0.0%) | 3 (3.4%) |
| 35 to 64 Years | 0 (0.0%) | 0 (0.0%) |
| 65 to 74 Years | 2 (3.1%) | 3 (5.4%) |
| 75 Years and over | 0 (0.0%) | 12 (38.7%) |
Disability Class: Vision Difficulty
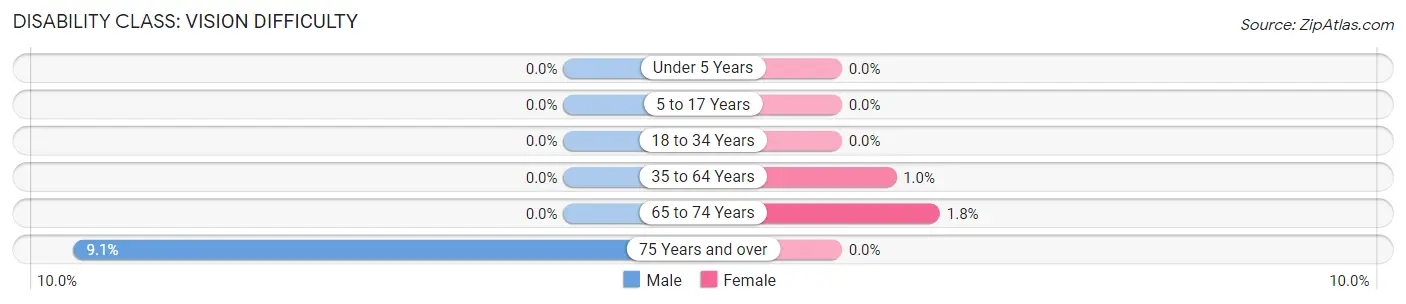
| Age Bracket | Male | Female |
| Under 5 Years | 0 (0.0%) | 0 (0.0%) |
| 5 to 17 Years | 0 (0.0%) | 0 (0.0%) |
| 18 to 34 Years | 0 (0.0%) | 0 (0.0%) |
| 35 to 64 Years | 0 (0.0%) | 2 (1.0%) |
| 65 to 74 Years | 0 (0.0%) | 1 (1.8%) |
| 75 Years and over | 2 (9.1%) | 0 (0.0%) |
Disability Class: Cognitive Difficulty
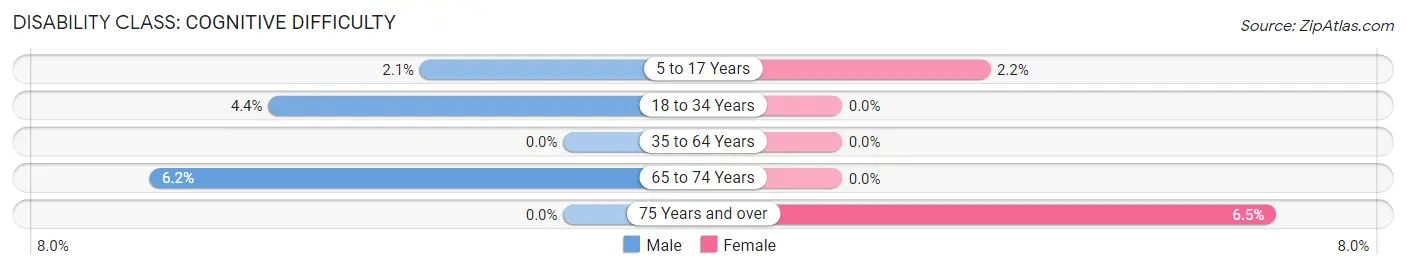
| Age Bracket | Male | Female |
| 5 to 17 Years | 2 (2.1%) | 2 (2.2%) |
| 18 to 34 Years | 6 (4.4%) | 0 (0.0%) |
| 35 to 64 Years | 0 (0.0%) | 0 (0.0%) |
| 65 to 74 Years | 4 (6.1%) | 0 (0.0%) |
| 75 Years and over | 0 (0.0%) | 2 (6.5%) |
Disability Class: Ambulatory Difficulty
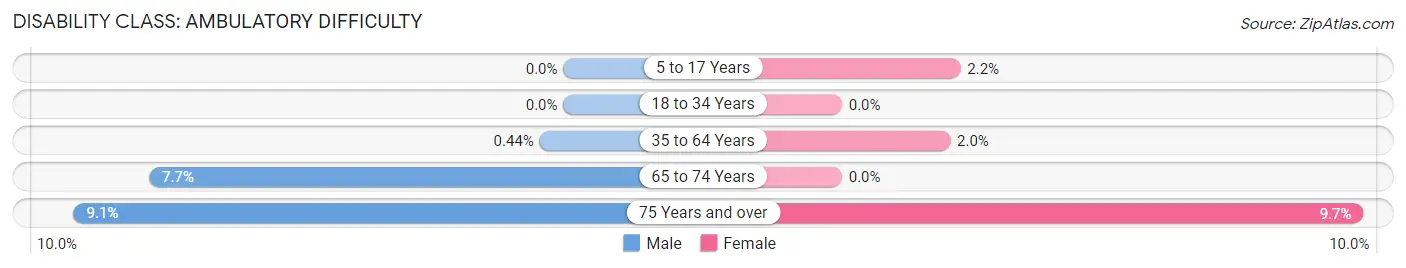
| Age Bracket | Male | Female |
| 5 to 17 Years | 0 (0.0%) | 2 (2.2%) |
| 18 to 34 Years | 0 (0.0%) | 0 (0.0%) |
| 35 to 64 Years | 1 (0.4%) | 4 (2.0%) |
| 65 to 74 Years | 5 (7.7%) | 0 (0.0%) |
| 75 Years and over | 2 (9.1%) | 3 (9.7%) |
Disability Class: Self-Care Difficulty
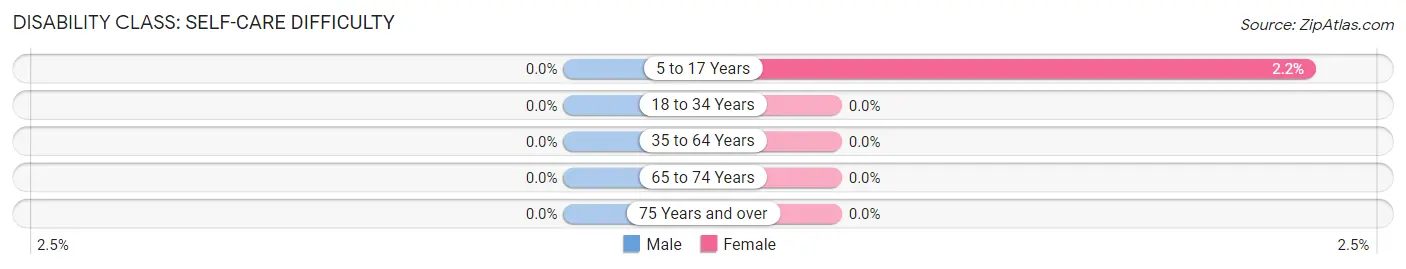
| Age Bracket | Male | Female |
| 5 to 17 Years | 0 (0.0%) | 2 (2.2%) |
| 18 to 34 Years | 0 (0.0%) | 0 (0.0%) |
| 35 to 64 Years | 0 (0.0%) | 0 (0.0%) |
| 65 to 74 Years | 0 (0.0%) | 0 (0.0%) |
| 75 Years and over | 0 (0.0%) | 0 (0.0%) |
Technology Access in Birchwood Village
Computing Device Access in Birchwood Village
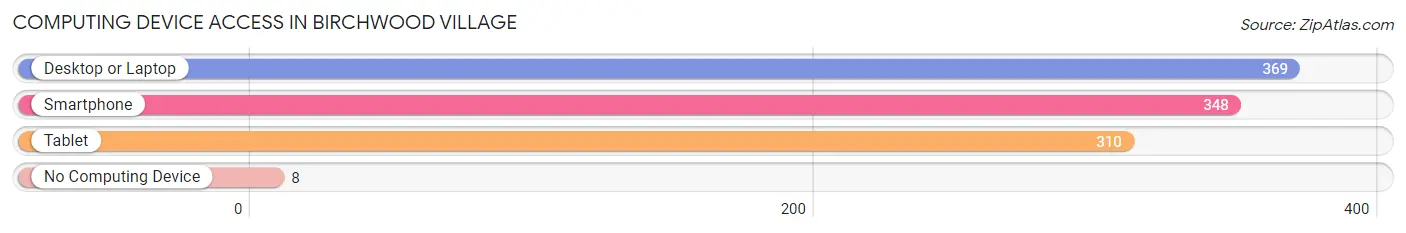
| Device Type | # Households | % Households |
| Desktop or Laptop | 369 | 93.6% |
| Smartphone | 348 | 88.3% |
| Tablet | 310 | 78.7% |
| No Computing Device | 8 | 2.0% |
| Total | 394 | 100.0% |
Internet Access in Birchwood Village
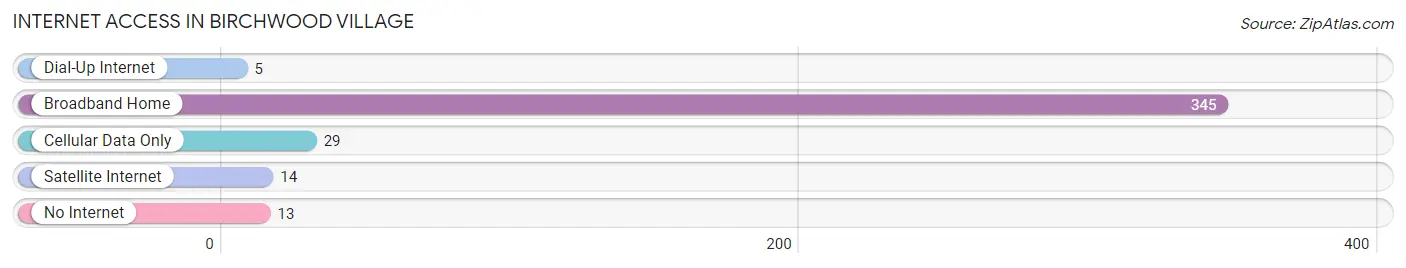
| Internet Type | # Households | % Households |
| Dial-Up Internet | 5 | 1.3% |
| Broadband Home | 345 | 87.6% |
| Cellular Data Only | 29 | 7.4% |
| Satellite Internet | 14 | 3.5% |
| No Internet | 13 | 3.3% |
| Total | 394 | 100.0% |
Birchwood Village Summary
Birchwood Village is a small city located in Washington County, Minnesota. It is situated on the banks of the St. Croix River, just north of the Twin Cities metropolitan area. The city has a population of approximately 2,500 people and covers an area of 1.2 square miles.
History
Birchwood Village was founded in the late 1800s by a group of settlers from Sweden. The settlers were attracted to the area due to its proximity to the St. Croix River, which provided a source of transportation and trade. The settlers named the area Birchwood Village after the abundance of birch trees in the area.
In the early 1900s, the city began to grow and develop. The first school was built in 1906 and the first post office was established in 1907. The city was incorporated in 1909 and the first mayor was elected in 1910.
In the 1920s, the city began to expand and develop further. The first library was built in 1923 and the first fire station was built in 1925. The city also began to attract more businesses and industries, including a sawmill, a flour mill, and a brickyard.
Geography
Birchwood Village is located in Washington County, Minnesota. It is situated on the banks of the St. Croix River, just north of the Twin Cities metropolitan area. The city has a total area of 1.2 square miles, all of which is land.
The city is located in a hilly area, with the highest point being the summit of Birchwood Hill, which is located at an elevation of 890 feet. The city is also located near several lakes, including White Bear Lake, Lake Elmo, and Lake St. Croix.
Economy
The economy of Birchwood Village is largely based on the service industry. The city is home to several businesses, including restaurants, retail stores, and professional services. The city also has a number of manufacturing and industrial businesses, including a sawmill, a flour mill, and a brickyard.
The city is also home to several educational institutions, including a public school district, a private school, and a community college.
Demographics
As of the 2010 census, the population of Birchwood Village was 2,500. The racial makeup of the city was 94.2% White, 1.2% African American, 0.8% Native American, 0.8% Asian, 0.4% from other races, and 2.4% from two or more races. Hispanic or Latino of any race were 1.2% of the population.
The median income for a household in the city was $50,000, and the median income for a family was $60,000. The per capita income for the city was $25,000. About 5.2% of families and 7.2% of the population were below the poverty line, including 8.2% of those under age 18 and 4.2% of those age 65 or over.
Common Questions
What is Per Capita Income in Birchwood Village?
Per Capita income in Birchwood Village is $67,803.
What is the Median Family Income in Birchwood Village?
Median Family Income in Birchwood Village is $130,625.
What is the Median Household income in Birchwood Village?
Median Household Income in Birchwood Village is $148,417.
What is Income or Wage Gap in Birchwood Village?
Income or Wage Gap in Birchwood Village is 39.5%.
Women in Birchwood Village earn 60.5 cents for every dollar earned by a man.
What is Inequality or Gini Index in Birchwood Village?
Inequality or Gini Index in Birchwood Village is 0.41.
What is the Total Population of Birchwood Village?
Total Population of Birchwood Village is 1,069.
What is the Total Male Population of Birchwood Village?
Total Male Population of Birchwood Village is 574.
What is the Total Female Population of Birchwood Village?
Total Female Population of Birchwood Village is 495.
What is the Ratio of Males per 100 Females in Birchwood Village?
There are 115.96 Males per 100 Females in Birchwood Village.
What is the Ratio of Females per 100 Males in Birchwood Village?
There are 86.24 Females per 100 Males in Birchwood Village.
What is the Median Population Age in Birchwood Village?
Median Population Age in Birchwood Village is 39.4 Years.
What is the Average Family Size in Birchwood Village
Average Family Size in Birchwood Village is 2.9 People.
What is the Average Household Size in Birchwood Village
Average Household Size in Birchwood Village is 2.7 People.
How Large is the Labor Force in Birchwood Village?
There are 603 People in the Labor Forcein in Birchwood Village.
What is the Percentage of People in the Labor Force in Birchwood Village?
69.2% of People are in the Labor Force in Birchwood Village.
What is the Unemployment Rate in Birchwood Village?
Unemployment Rate in Birchwood Village is 1.7%.