West St Paul, MN Map & Demographics
West St Paul Map
West St Paul Overview
$40,563
PER CAPITA INCOME
$93,947
AVG FAMILY INCOME
$68,359
AVG HOUSEHOLD INCOME
38.5%
WAGE / INCOME GAP [ % ]
61.5¢/ $1
WAGE / INCOME GAP [ $ ]
$12,917
FAMILY INCOME DEFICIT
0.44
INEQUALITY / GINI INDEX
20,820
TOTAL POPULATION
9,598
MALE POPULATION
11,222
FEMALE POPULATION
85.53
MALES / 100 FEMALES
116.92
FEMALES / 100 MALES
38.9
MEDIAN AGE
3.0
AVG FAMILY SIZE
2.2
AVG HOUSEHOLD SIZE
11,506
LABOR FORCE [ PEOPLE ]
66.5%
PERCENT IN LABOR FORCE
5.0%
UNEMPLOYMENT RATE
West St Paul Area Codes
Income in West St Paul
Income Overview in West St Paul
Per Capita Income in West St Paul is $40,563, while median incomes of families and households are $93,947 and $68,359 respectively.
| Characteristic | Number | Measure |
| Per Capita Income | 20,820 | $40,563 |
| Median Family Income | 4,907 | $93,947 |
| Mean Family Income | 4,907 | $118,048 |
| Median Household Income | 9,302 | $68,359 |
| Mean Household Income | 9,302 | $88,477 |
| Income Deficit | 4,907 | $12,917 |
| Wage / Income Gap (%) | 20,820 | 38.46% |
| Wage / Income Gap ($) | 20,820 | 61.54¢ per $1 |
| Gini / Inequality Index | 20,820 | 0.44 |
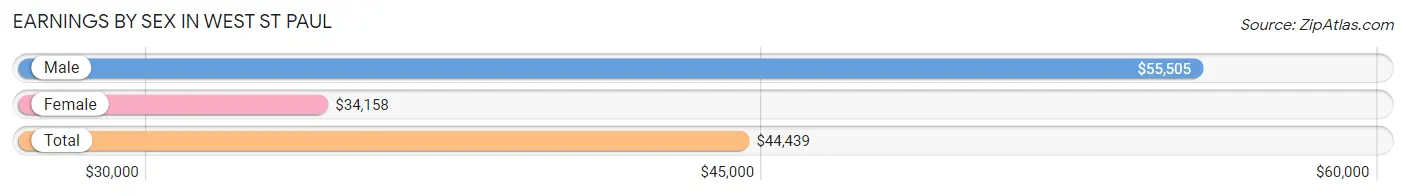
Earnings by Sex in West St Paul
Average Earnings in West St Paul are $44,439, $55,505 for men and $34,158 for women, a difference of 38.5%.
| Sex | Number | Average Earnings |
| Male | 5,910 (49.5%) | $55,505 |
| Female | 6,021 (50.5%) | $34,158 |
| Total | 11,931 (100.0%) | $44,439 |
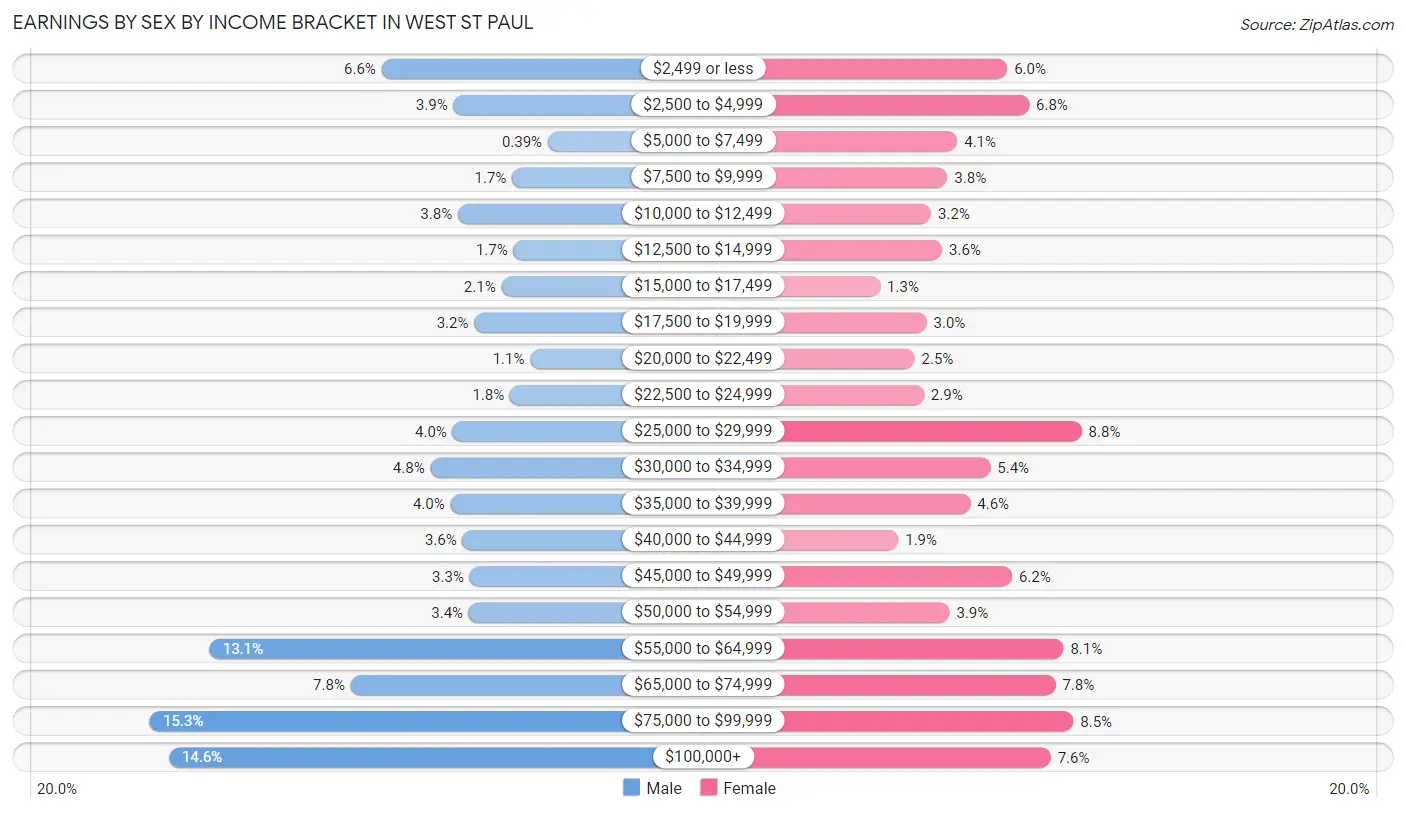
Earnings by Sex by Income Bracket in West St Paul
The most common earnings brackets in West St Paul are $75,000 to $99,999 for men (904 | 15.3%) and $25,000 to $29,999 for women (530 | 8.8%).
| Income | Male | Female |
| $2,499 or less | 391 (6.6%) | 362 (6.0%) |
| $2,500 to $4,999 | 232 (3.9%) | 411 (6.8%) |
| $5,000 to $7,499 | 23 (0.4%) | 249 (4.1%) |
| $7,500 to $9,999 | 102 (1.7%) | 227 (3.8%) |
| $10,000 to $12,499 | 222 (3.8%) | 190 (3.2%) |
| $12,500 to $14,999 | 99 (1.7%) | 215 (3.6%) |
| $15,000 to $17,499 | 126 (2.1%) | 75 (1.3%) |
| $17,500 to $19,999 | 186 (3.2%) | 180 (3.0%) |
| $20,000 to $22,499 | 62 (1.1%) | 153 (2.5%) |
| $22,500 to $24,999 | 107 (1.8%) | 174 (2.9%) |
| $25,000 to $29,999 | 234 (4.0%) | 530 (8.8%) |
| $30,000 to $34,999 | 283 (4.8%) | 324 (5.4%) |
| $35,000 to $39,999 | 239 (4.0%) | 279 (4.6%) |
| $40,000 to $44,999 | 212 (3.6%) | 116 (1.9%) |
| $45,000 to $49,999 | 196 (3.3%) | 373 (6.2%) |
| $50,000 to $54,999 | 198 (3.4%) | 232 (3.8%) |
| $55,000 to $64,999 | 772 (13.1%) | 489 (8.1%) |
| $65,000 to $74,999 | 460 (7.8%) | 471 (7.8%) |
| $75,000 to $99,999 | 904 (15.3%) | 511 (8.5%) |
| $100,000+ | 862 (14.6%) | 460 (7.6%) |
| Total | 5,910 (100.0%) | 6,021 (100.0%) |
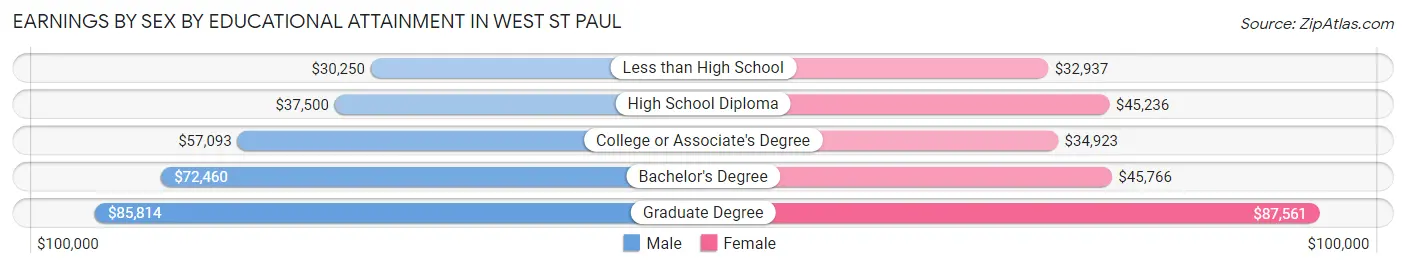
Earnings by Sex by Educational Attainment in West St Paul
Average earnings in West St Paul are $58,750 for men and $42,176 for women, a difference of 28.2%. Men with an educational attainment of graduate degree enjoy the highest average annual earnings of $85,814, while those with less than high school education earn the least with $30,250. Women with an educational attainment of graduate degree earn the most with the average annual earnings of $87,561, while those with less than high school education have the smallest earnings of $32,937.
| Educational Attainment | Male Income | Female Income |
| Less than High School | $30,250 | $32,937 |
| High School Diploma | $37,500 | $45,236 |
| College or Associate's Degree | $57,093 | $34,923 |
| Bachelor's Degree | $72,460 | $45,766 |
| Graduate Degree | $85,814 | $87,561 |
| Total | $58,750 | $42,176 |
Family Income in West St Paul
Family Income Brackets in West St Paul
According to the West St Paul family income data, there are 1,109 families falling into the $100,000 to $149,999 income range, which is the most common income bracket and makes up 22.6% of all families. Conversely, the $10,000 to $14,999 income bracket is the least frequent group with only 69 families (1.4%) belonging to this category.
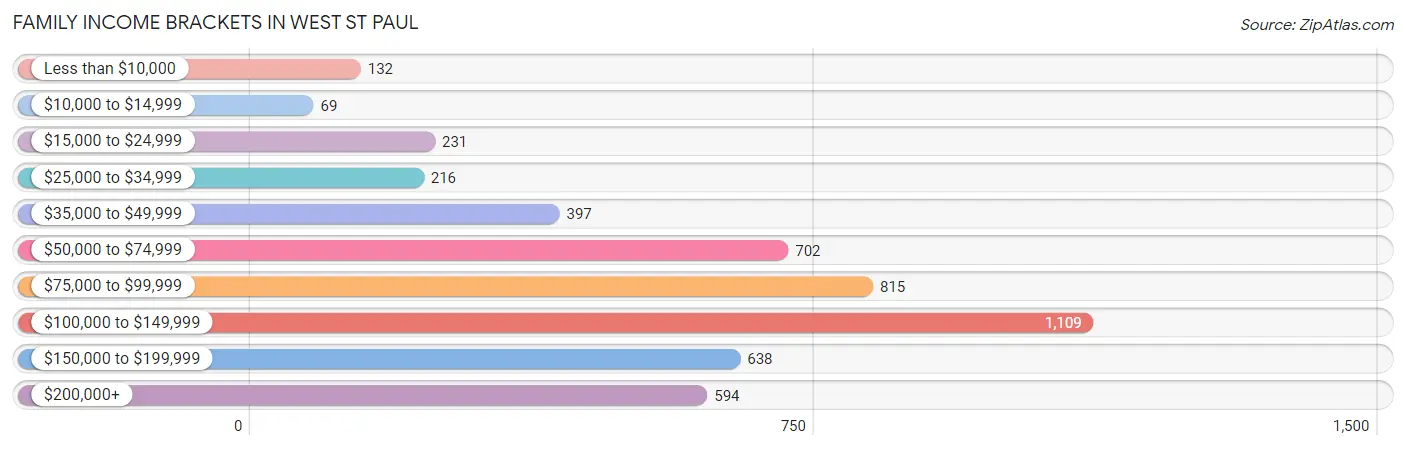
| Income Bracket | # Families | % Families |
| Less than $10,000 | 132 | 2.7% |
| $10,000 to $14,999 | 69 | 1.4% |
| $15,000 to $24,999 | 231 | 4.7% |
| $25,000 to $34,999 | 216 | 4.4% |
| $35,000 to $49,999 | 397 | 8.1% |
| $50,000 to $74,999 | 702 | 14.3% |
| $75,000 to $99,999 | 815 | 16.6% |
| $100,000 to $149,999 | 1,109 | 22.6% |
| $150,000 to $199,999 | 638 | 13.0% |
| $200,000+ | 594 | 12.1% |
Family Income by Famaliy Size in West St Paul
7+ person families (127 | 2.6%) account for the highest median family income in West St Paul with $160,208 per family, while 2-person families (2,327 | 47.4%) have the highest median income of $37,410 per family member.
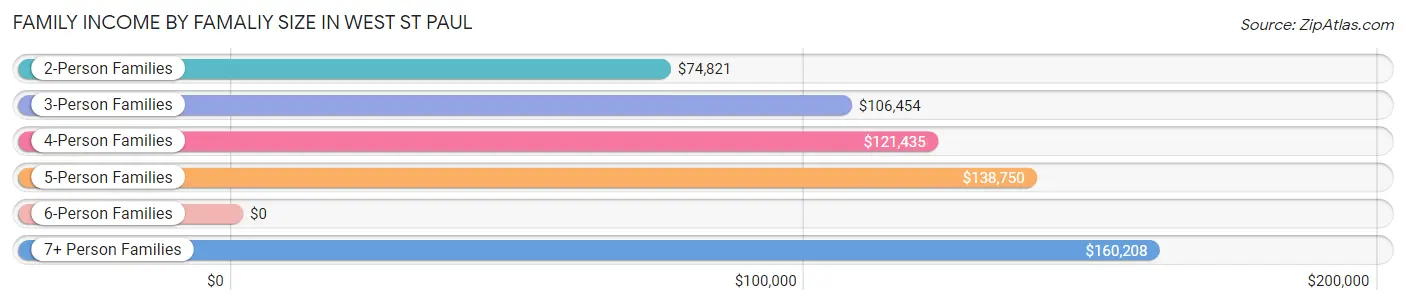
| Income Bracket | # Families | Median Income |
| 2-Person Families | 2,327 (47.4%) | $74,821 |
| 3-Person Families | 1,111 (22.6%) | $106,454 |
| 4-Person Families | 909 (18.5%) | $121,435 |
| 5-Person Families | 328 (6.7%) | $138,750 |
| 6-Person Families | 105 (2.1%) | $0 |
| 7+ Person Families | 127 (2.6%) | $160,208 |
| Total | 4,907 (100.0%) | $93,947 |
Family Income by Number of Earners in West St Paul
The median family income in West St Paul is $93,947, with families comprising 3+ earners (911) having the highest median family income of $157,697, while families with no earners (884) have the lowest median family income of $44,453, accounting for 18.6% and 18.0% of families, respectively.
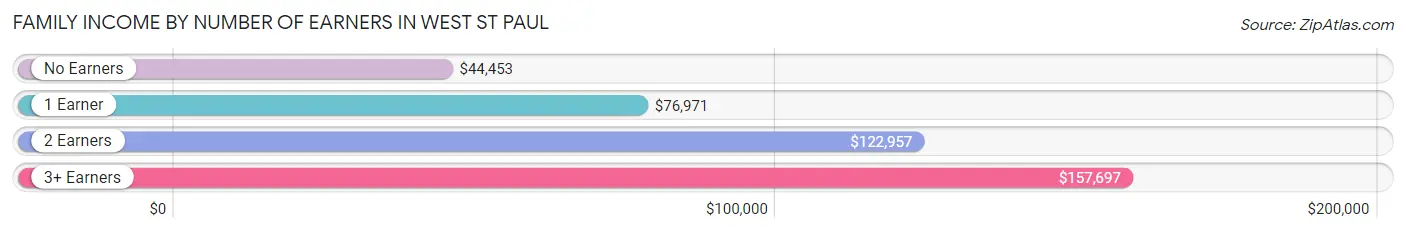
| Number of Earners | # Families | Median Income |
| No Earners | 884 (18.0%) | $44,453 |
| 1 Earner | 1,169 (23.8%) | $76,971 |
| 2 Earners | 1,943 (39.6%) | $122,957 |
| 3+ Earners | 911 (18.6%) | $157,697 |
| Total | 4,907 (100.0%) | $93,947 |
Household Income in West St Paul
Household Income Brackets in West St Paul
With 1,572 households falling in the category, the $100,000 to $149,999 income range is the most frequent in West St Paul, accounting for 16.9% of all households. In contrast, only 316 households (3.4%) fall into the $10,000 to $14,999 income bracket, making it the least populous group.
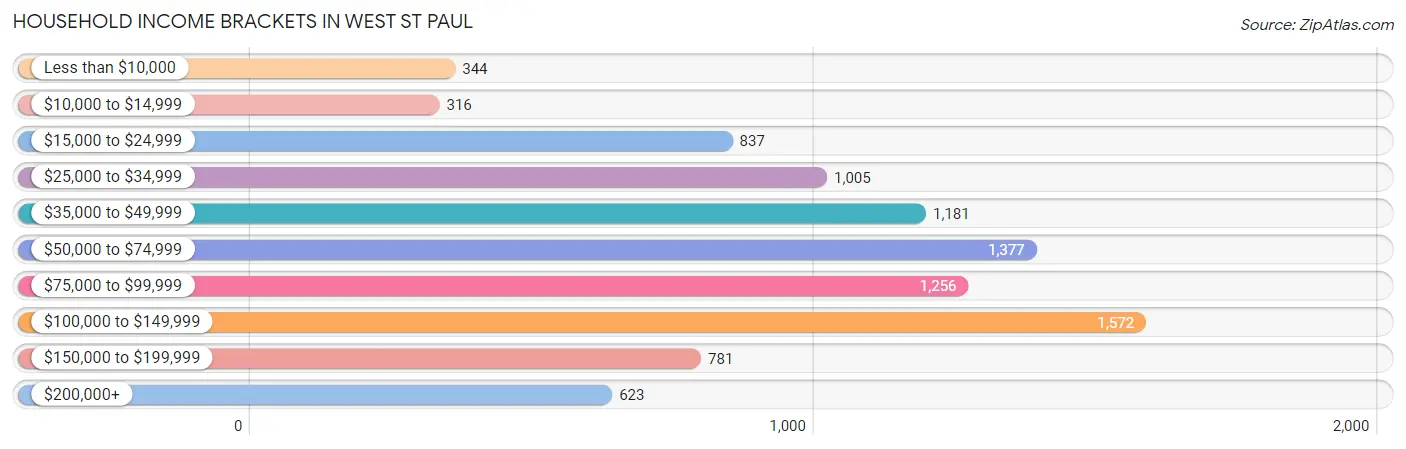
| Income Bracket | # Households | % Households |
| Less than $10,000 | 344 | 3.7% |
| $10,000 to $14,999 | 316 | 3.4% |
| $15,000 to $24,999 | 837 | 9.0% |
| $25,000 to $34,999 | 1,005 | 10.8% |
| $35,000 to $49,999 | 1,181 | 12.7% |
| $50,000 to $74,999 | 1,377 | 14.8% |
| $75,000 to $99,999 | 1,256 | 13.5% |
| $100,000 to $149,999 | 1,572 | 16.9% |
| $150,000 to $199,999 | 781 | 8.4% |
| $200,000+ | 623 | 6.7% |
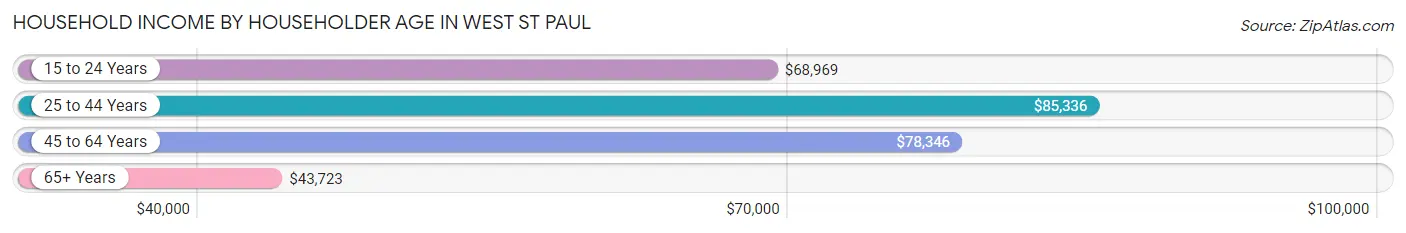
Household Income by Householder Age in West St Paul
The median household income in West St Paul is $68,359, with the highest median household income of $85,336 found in the 25 to 44 years age bracket for the primary householder. A total of 3,218 households (34.6%) fall into this category. Meanwhile, the 65+ years age bracket for the primary householder has the lowest median household income of $43,723, with 2,956 households (31.8%) in this group.
| Income Bracket | # Households | Median Income |
| 15 to 24 Years | 277 (3.0%) | $68,969 |
| 25 to 44 Years | 3,218 (34.6%) | $85,336 |
| 45 to 64 Years | 2,851 (30.6%) | $78,346 |
| 65+ Years | 2,956 (31.8%) | $43,723 |
| Total | 9,302 (100.0%) | $68,359 |
Poverty in West St Paul
Income Below Poverty by Sex and Age in West St Paul
With 7.1% poverty level for males and 11.8% for females among the residents of West St Paul, 15 year old males and 15 year old females are the most vulnerable to poverty, with 36 males (28.6%) and 48 females (32.7%) in their respective age groups living below the poverty level.
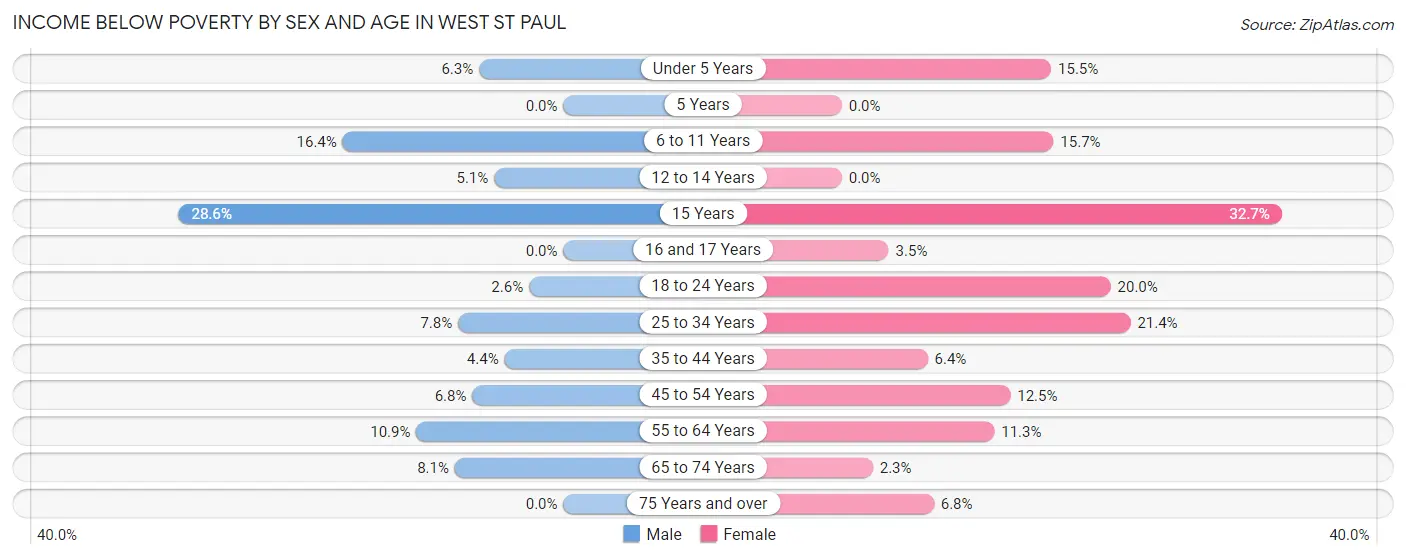
| Age Bracket | Male | Female |
| Under 5 Years | 38 (6.3%) | 99 (15.5%) |
| 5 Years | 0 (0.0%) | 0 (0.0%) |
| 6 to 11 Years | 98 (16.4%) | 93 (15.7%) |
| 12 to 14 Years | 17 (5.1%) | 0 (0.0%) |
| 15 Years | 36 (28.6%) | 48 (32.7%) |
| 16 and 17 Years | 0 (0.0%) | 7 (3.5%) |
| 18 to 24 Years | 24 (2.5%) | 186 (20.0%) |
| 25 to 34 Years | 123 (7.8%) | 368 (21.4%) |
| 35 to 44 Years | 59 (4.4%) | 92 (6.4%) |
| 45 to 54 Years | 74 (6.8%) | 167 (12.5%) |
| 55 to 64 Years | 119 (10.9%) | 131 (11.3%) |
| 65 to 74 Years | 85 (8.1%) | 31 (2.3%) |
| 75 Years and over | 0 (0.0%) | 82 (6.8%) |
| Total | 673 (7.1%) | 1,304 (11.8%) |
Income Above Poverty by Sex and Age in West St Paul
According to the poverty statistics in West St Paul, males aged 5 years and females aged 5 years are the age groups that are most secure financially, with 100.0% of males and 100.0% of females in these age groups living above the poverty line.
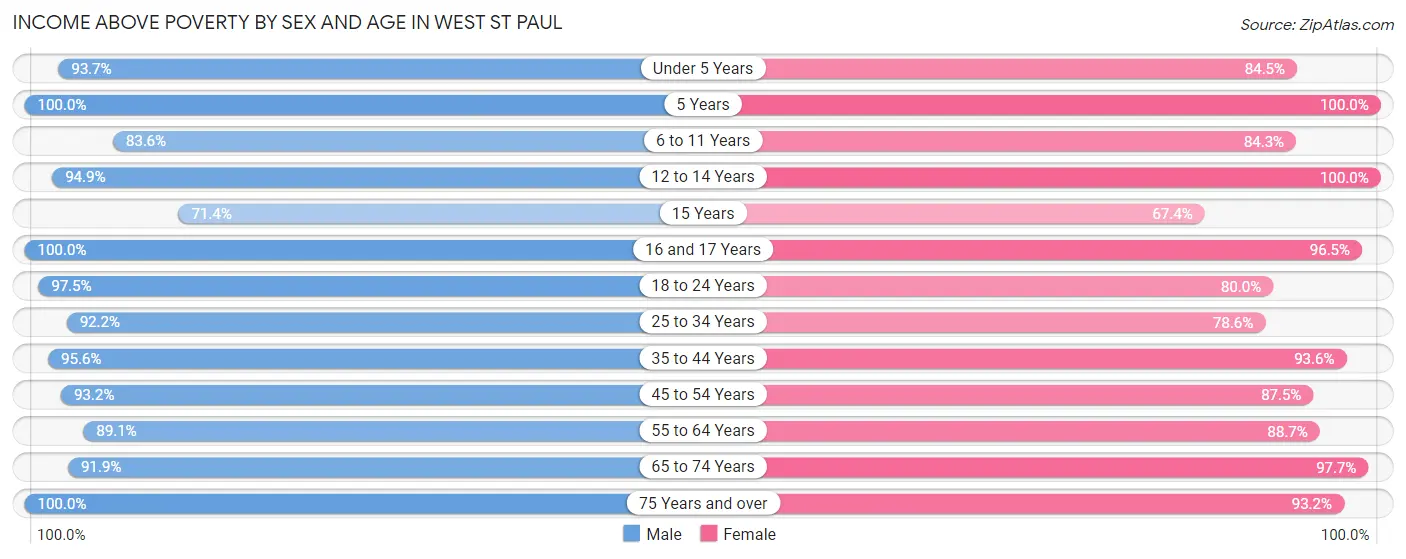
| Age Bracket | Male | Female |
| Under 5 Years | 569 (93.7%) | 538 (84.5%) |
| 5 Years | 105 (100.0%) | 51 (100.0%) |
| 6 to 11 Years | 500 (83.6%) | 499 (84.3%) |
| 12 to 14 Years | 314 (94.9%) | 304 (100.0%) |
| 15 Years | 90 (71.4%) | 99 (67.3%) |
| 16 and 17 Years | 180 (100.0%) | 194 (96.5%) |
| 18 to 24 Years | 918 (97.5%) | 746 (80.0%) |
| 25 to 34 Years | 1,450 (92.2%) | 1,349 (78.6%) |
| 35 to 44 Years | 1,292 (95.6%) | 1,353 (93.6%) |
| 45 to 54 Years | 1,021 (93.2%) | 1,168 (87.5%) |
| 55 to 64 Years | 971 (89.1%) | 1,026 (88.7%) |
| 65 to 74 Years | 969 (91.9%) | 1,318 (97.7%) |
| 75 Years and over | 438 (100.0%) | 1,118 (93.2%) |
| Total | 8,817 (92.9%) | 9,763 (88.2%) |
Income Below Poverty Among Married-Couple Families in West St Paul
The poverty statistics for married-couple families in West St Paul show that 3.2% or 107 of the total 3,370 families live below the poverty line. Families with 1 or 2 children have the highest poverty rate of 4.4%, comprising of 49 families. On the other hand, families with 3 or 4 children have the lowest poverty rate of 0.0%, which includes 0 families.
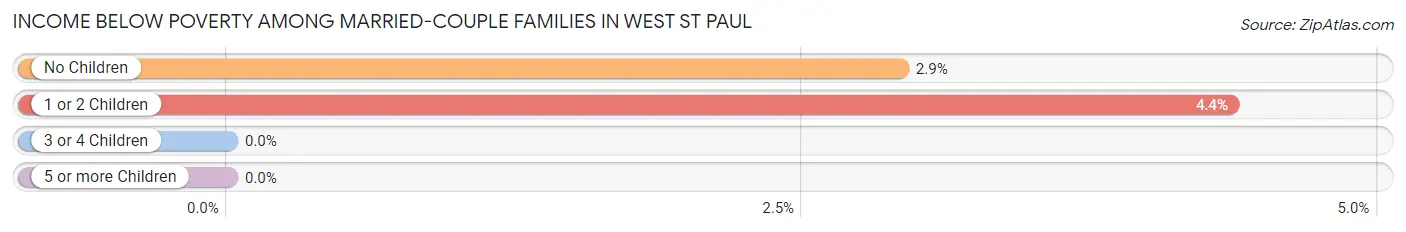
| Children | Above Poverty | Below Poverty |
| No Children | 1,929 (97.1%) | 58 (2.9%) |
| 1 or 2 Children | 1,075 (95.6%) | 49 (4.4%) |
| 3 or 4 Children | 198 (100.0%) | 0 (0.0%) |
| 5 or more Children | 61 (100.0%) | 0 (0.0%) |
| Total | 3,263 (96.8%) | 107 (3.2%) |
Income Below Poverty Among Single-Parent Households in West St Paul
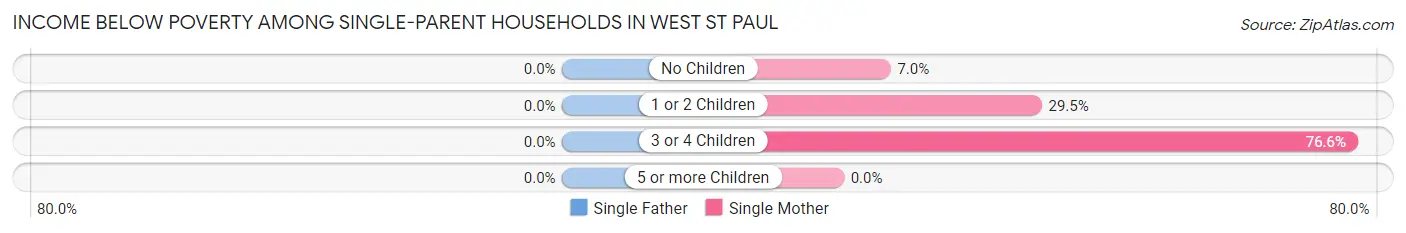
| Children | Single Father | Single Mother |
| No Children | 0 (0.0%) | 38 (7.0%) |
| 1 or 2 Children | 0 (0.0%) | 97 (29.5%) |
| 3 or 4 Children | 0 (0.0%) | 72 (76.6%) |
| 5 or more Children | 0 (0.0%) | 0 (0.0%) |
| Total | 0 (0.0%) | 207 (21.4%) |
Income Below Poverty Among Married-Couple vs Single-Parent Households in West St Paul
The poverty data for West St Paul shows that 107 of the married-couple family households (3.2%) and 207 of the single-parent households (13.5%) are living below the poverty level. Within the married-couple family households, those with 1 or 2 children have the highest poverty rate, with 49 households (4.4%) falling below the poverty line. Among the single-parent households, those with 3 or 4 children have the highest poverty rate, with 72 household (48.0%) living below poverty.
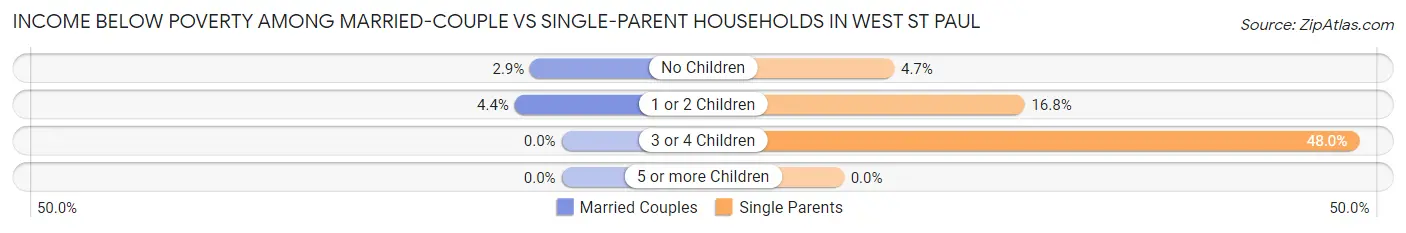
| Children | Married-Couple Families | Single-Parent Households |
| No Children | 58 (2.9%) | 38 (4.7%) |
| 1 or 2 Children | 49 (4.4%) | 97 (16.8%) |
| 3 or 4 Children | 0 (0.0%) | 72 (48.0%) |
| 5 or more Children | 0 (0.0%) | 0 (0.0%) |
| Total | 107 (3.2%) | 207 (13.5%) |
Race in West St Paul
The most populous races in West St Paul are White / Caucasian (15,513 | 74.5%), Hispanic or Latino (4,239 | 20.4%), and Some other Race (1,908 | 9.2%).
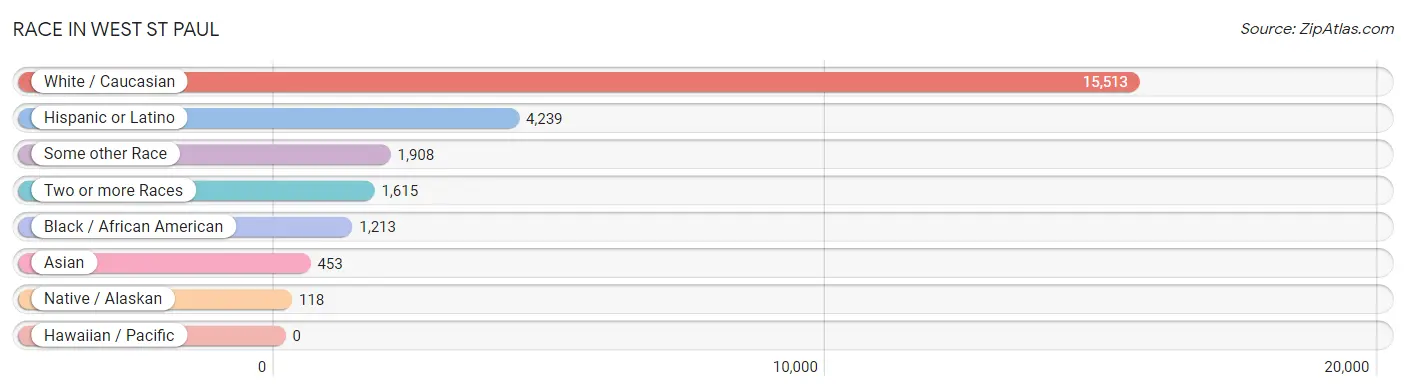
| Race | # Population | % Population |
| Asian | 453 | 2.2% |
| Black / African American | 1,213 | 5.8% |
| Hawaiian / Pacific | 0 | 0.0% |
| Hispanic or Latino | 4,239 | 20.4% |
| Native / Alaskan | 118 | 0.6% |
| White / Caucasian | 15,513 | 74.5% |
| Two or more Races | 1,615 | 7.8% |
| Some other Race | 1,908 | 9.2% |
| Total | 20,820 | 100.0% |
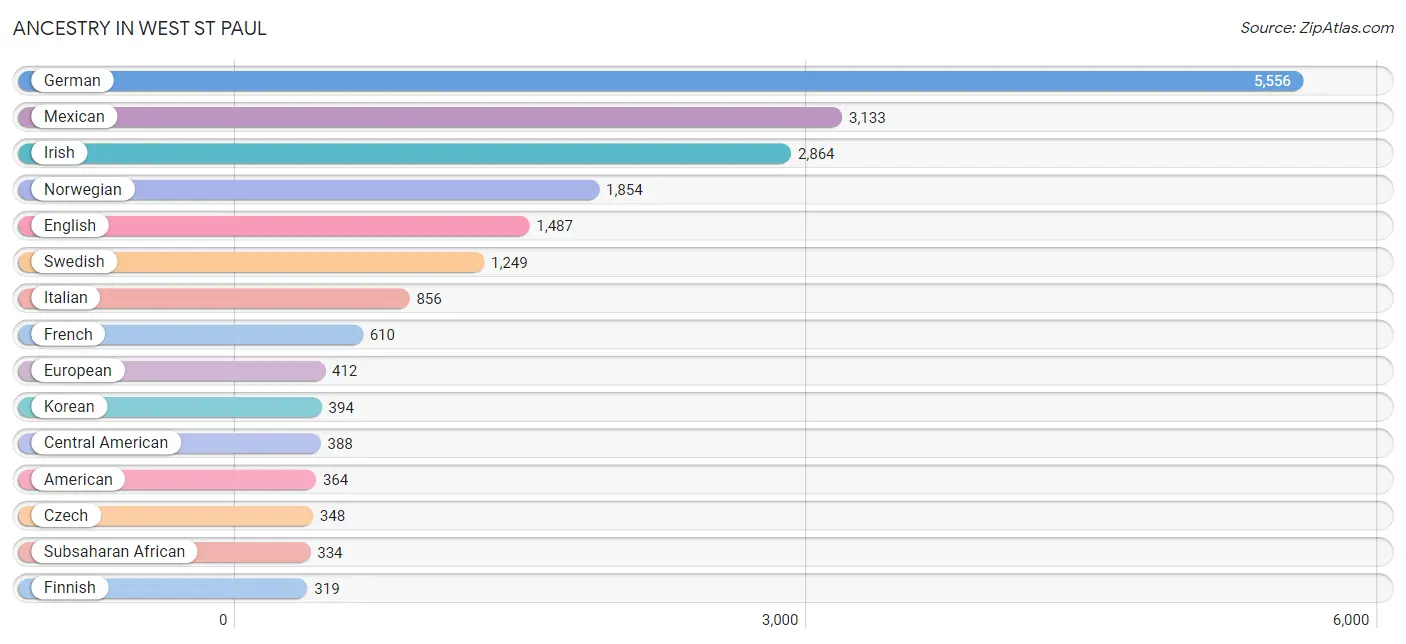
Ancestry in West St Paul
The most populous ancestries reported in West St Paul are German (5,556 | 26.7%), Mexican (3,133 | 15.0%), Irish (2,864 | 13.8%), Norwegian (1,854 | 8.9%), and English (1,487 | 7.1%), together accounting for 71.5% of all West St Paul residents.
| Ancestry | # Population | % Population |
| Afghan | 8 | 0.0% |
| African | 59 | 0.3% |
| American | 364 | 1.8% |
| Arab | 142 | 0.7% |
| Armenian | 17 | 0.1% |
| Austrian | 69 | 0.3% |
| Bangladeshi | 111 | 0.5% |
| Bhutanese | 49 | 0.2% |
| Brazilian | 7 | 0.0% |
| British | 68 | 0.3% |
| Burmese | 48 | 0.2% |
| Carpatho Rusyn | 27 | 0.1% |
| Central American | 388 | 1.9% |
| Central American Indian | 33 | 0.2% |
| Cherokee | 6 | 0.0% |
| Chickasaw | 7 | 0.0% |
| Chippewa | 105 | 0.5% |
| Colombian | 30 | 0.1% |
| Cree | 30 | 0.1% |
| Croatian | 6 | 0.0% |
| Cuban | 75 | 0.4% |
| Czech | 348 | 1.7% |
| Czechoslovakian | 13 | 0.1% |
| Danish | 214 | 1.0% |
| Dominican | 72 | 0.4% |
| Dutch | 117 | 0.6% |
| Eastern European | 80 | 0.4% |
| English | 1,487 | 7.1% |
| Ethiopian | 146 | 0.7% |
| European | 412 | 2.0% |
| Finnish | 319 | 1.5% |
| French | 610 | 2.9% |
| French Canadian | 110 | 0.5% |
| German | 5,556 | 26.7% |
| German Russian | 27 | 0.1% |
| Greek | 56 | 0.3% |
| Guatemalan | 18 | 0.1% |
| Haitian | 12 | 0.1% |
| Honduran | 190 | 0.9% |
| Hungarian | 62 | 0.3% |
| Indian (Asian) | 110 | 0.5% |
| Irish | 2,864 | 13.8% |
| Italian | 856 | 4.1% |
| Japanese | 67 | 0.3% |
| Korean | 394 | 1.9% |
| Lebanese | 142 | 0.7% |
| Liberian | 54 | 0.3% |
| Lithuanian | 8 | 0.0% |
| Luxembourger | 32 | 0.2% |
| Malaysian | 5 | 0.0% |
| Mexican | 3,133 | 15.0% |
| Mexican American Indian | 45 | 0.2% |
| Navajo | 4 | 0.0% |
| Nigerian | 58 | 0.3% |
| Northern European | 82 | 0.4% |
| Norwegian | 1,854 | 8.9% |
| Panamanian | 6 | 0.0% |
| Paraguayan | 18 | 0.1% |
| Peruvian | 56 | 0.3% |
| Polish | 290 | 1.4% |
| Portuguese | 11 | 0.1% |
| Puerto Rican | 166 | 0.8% |
| Puget Sound Salish | 218 | 1.1% |
| Romanian | 109 | 0.5% |
| Russian | 162 | 0.8% |
| Salvadoran | 174 | 0.8% |
| Scandinavian | 249 | 1.2% |
| Scotch-Irish | 50 | 0.2% |
| Scottish | 154 | 0.7% |
| Sioux | 65 | 0.3% |
| Slavic | 33 | 0.2% |
| Slovak | 8 | 0.0% |
| Slovene | 42 | 0.2% |
| South African | 17 | 0.1% |
| South American | 104 | 0.5% |
| Spaniard | 232 | 1.1% |
| Sri Lankan | 32 | 0.2% |
| Subsaharan African | 334 | 1.6% |
| Swedish | 1,249 | 6.0% |
| Swiss | 56 | 0.3% |
| Thai | 63 | 0.3% |
| Ukrainian | 54 | 0.3% |
| Welsh | 70 | 0.3% |
| Yugoslavian | 10 | 0.1% | View All 84 Rows |
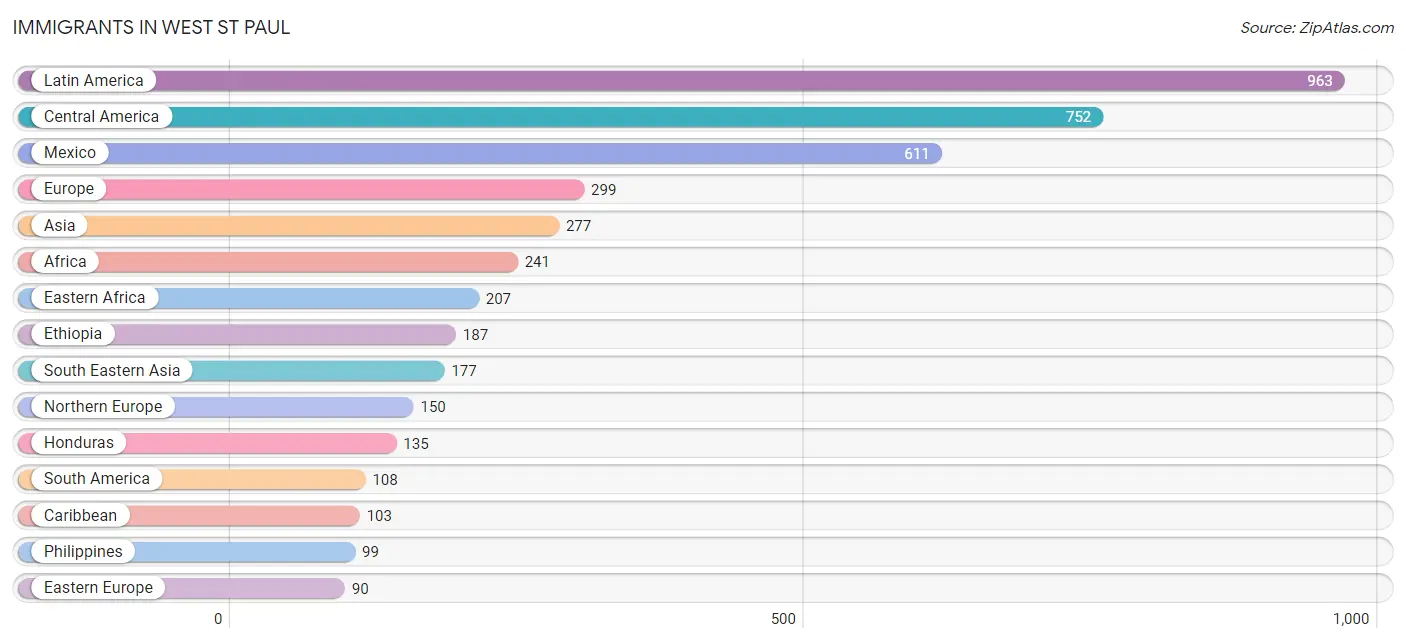
Immigrants in West St Paul
The most numerous immigrant groups reported in West St Paul came from Latin America (963 | 4.6%), Central America (752 | 3.6%), Mexico (611 | 2.9%), Europe (299 | 1.4%), and Asia (277 | 1.3%), together accounting for 13.9% of all West St Paul residents.
| Immigration Origin | # Population | % Population |
| Africa | 241 | 1.2% |
| Asia | 277 | 1.3% |
| Brazil | 22 | 0.1% |
| Cambodia | 53 | 0.3% |
| Caribbean | 103 | 0.5% |
| Central America | 752 | 3.6% |
| China | 12 | 0.1% |
| Colombia | 30 | 0.1% |
| Cuba | 75 | 0.4% |
| Dominican Republic | 28 | 0.1% |
| Eastern Africa | 207 | 1.0% |
| Eastern Asia | 43 | 0.2% |
| Eastern Europe | 90 | 0.4% |
| England | 5 | 0.0% |
| Ethiopia | 187 | 0.9% |
| Europe | 299 | 1.4% |
| France | 16 | 0.1% |
| Germany | 43 | 0.2% |
| Honduras | 135 | 0.6% |
| India | 57 | 0.3% |
| Ireland | 35 | 0.2% |
| Japan | 11 | 0.1% |
| Kenya | 20 | 0.1% |
| Korea | 20 | 0.1% |
| Laos | 5 | 0.0% |
| Latin America | 963 | 4.6% |
| Mexico | 611 | 2.9% |
| Nigeria | 17 | 0.1% |
| Northern Europe | 150 | 0.7% |
| Panama | 6 | 0.0% |
| Peru | 56 | 0.3% |
| Philippines | 99 | 0.5% |
| Romania | 33 | 0.2% |
| Russia | 57 | 0.3% |
| South Africa | 17 | 0.1% |
| South America | 108 | 0.5% |
| South Central Asia | 57 | 0.3% |
| South Eastern Asia | 177 | 0.9% |
| Vietnam | 20 | 0.1% |
| Western Africa | 17 | 0.1% |
| Western Europe | 59 | 0.3% | View All 41 Rows |
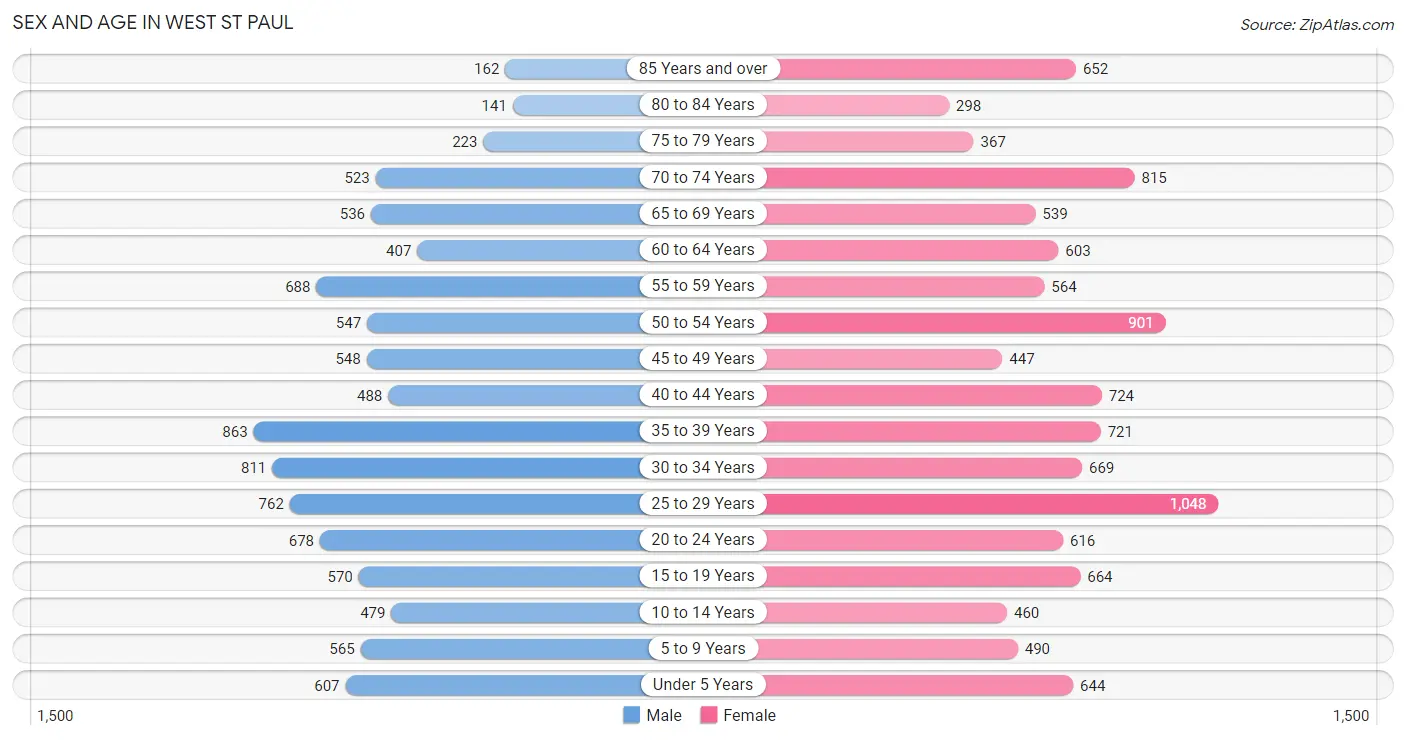
Sex and Age in West St Paul
Sex and Age in West St Paul
The most populous age groups in West St Paul are 35 to 39 Years (863 | 9.0%) for men and 25 to 29 Years (1,048 | 9.3%) for women.
| Age Bracket | Male | Female |
| Under 5 Years | 607 (6.3%) | 644 (5.7%) |
| 5 to 9 Years | 565 (5.9%) | 490 (4.4%) |
| 10 to 14 Years | 479 (5.0%) | 460 (4.1%) |
| 15 to 19 Years | 570 (5.9%) | 664 (5.9%) |
| 20 to 24 Years | 678 (7.1%) | 616 (5.5%) |
| 25 to 29 Years | 762 (7.9%) | 1,048 (9.3%) |
| 30 to 34 Years | 811 (8.5%) | 669 (6.0%) |
| 35 to 39 Years | 863 (9.0%) | 721 (6.4%) |
| 40 to 44 Years | 488 (5.1%) | 724 (6.5%) |
| 45 to 49 Years | 548 (5.7%) | 447 (4.0%) |
| 50 to 54 Years | 547 (5.7%) | 901 (8.0%) |
| 55 to 59 Years | 688 (7.2%) | 564 (5.0%) |
| 60 to 64 Years | 407 (4.2%) | 603 (5.4%) |
| 65 to 69 Years | 536 (5.6%) | 539 (4.8%) |
| 70 to 74 Years | 523 (5.4%) | 815 (7.3%) |
| 75 to 79 Years | 223 (2.3%) | 367 (3.3%) |
| 80 to 84 Years | 141 (1.5%) | 298 (2.7%) |
| 85 Years and over | 162 (1.7%) | 652 (5.8%) |
| Total | 9,598 (100.0%) | 11,222 (100.0%) |
Families and Households in West St Paul
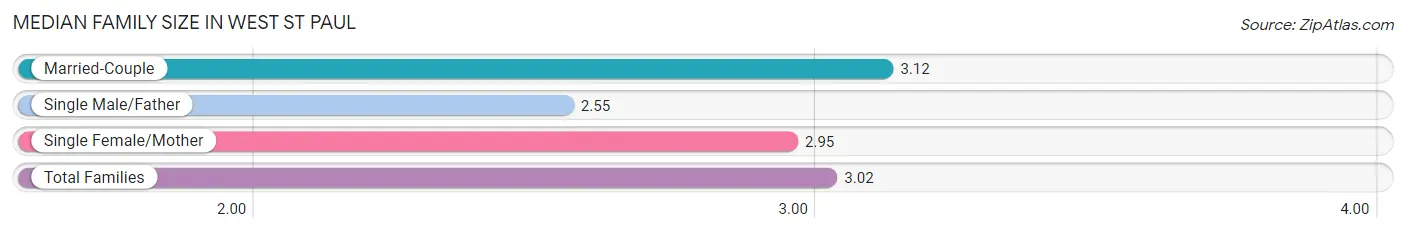
Median Family Size in West St Paul
The median family size in West St Paul is 3.02 persons per family, with married-couple families (3,370 | 68.7%) accounting for the largest median family size of 3.12 persons per family. On the other hand, single male/father families (569 | 11.6%) represent the smallest median family size with 2.55 persons per family.
| Family Type | # Families | Family Size |
| Married-Couple | 3,370 (68.7%) | 3.12 |
| Single Male/Father | 569 (11.6%) | 2.55 |
| Single Female/Mother | 968 (19.7%) | 2.95 |
| Total Families | 4,907 (100.0%) | 3.02 |
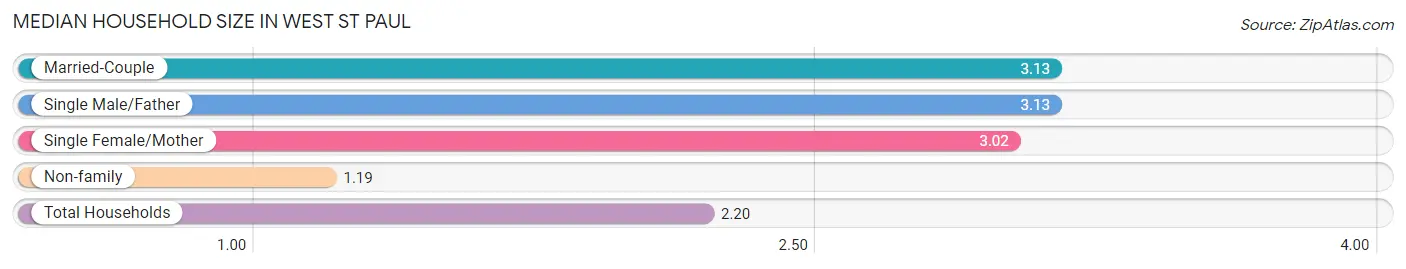
Median Household Size in West St Paul
The median household size in West St Paul is 2.20 persons per household, with married-couple households (3,370 | 36.2%) accounting for the largest median household size of 3.13 persons per household. non-family households (4,395 | 47.2%) represent the smallest median household size with 1.19 persons per household.
| Household Type | # Households | Household Size |
| Married-Couple | 3,370 (36.2%) | 3.13 |
| Single Male/Father | 569 (6.1%) | 3.13 |
| Single Female/Mother | 968 (10.4%) | 3.02 |
| Non-family | 4,395 (47.2%) | 1.19 |
| Total Households | 9,302 (100.0%) | 2.20 |
Household Size by Marriage Status in West St Paul
Out of a total of 9,302 households in West St Paul, 4,907 (52.7%) are family households, while 4,395 (47.2%) are nonfamily households. The most numerous type of family households are 2-person households, comprising 2,080, and the most common type of nonfamily households are 1-person households, comprising 3,693.
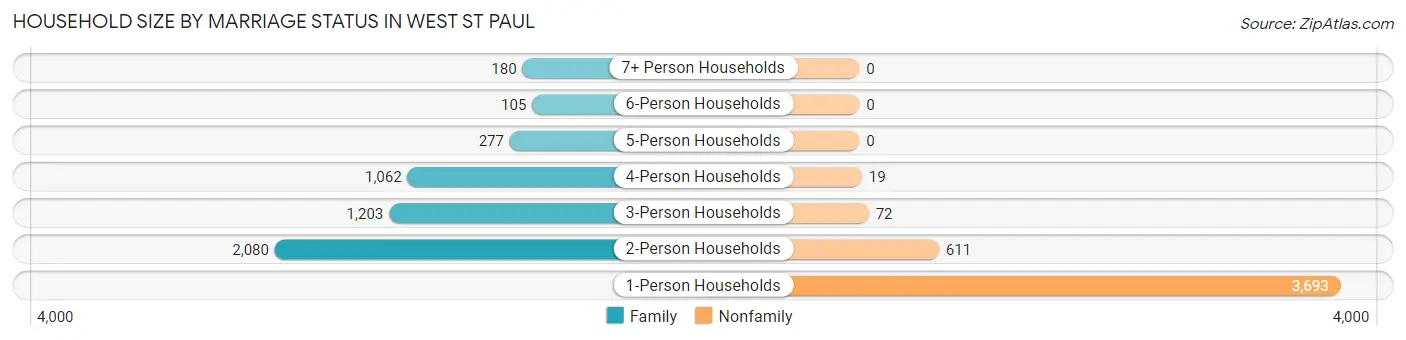
| Household Size | Family Households | Nonfamily Households |
| 1-Person Households | - | 3,693 (39.7%) |
| 2-Person Households | 2,080 (22.4%) | 611 (6.6%) |
| 3-Person Households | 1,203 (12.9%) | 72 (0.8%) |
| 4-Person Households | 1,062 (11.4%) | 19 (0.2%) |
| 5-Person Households | 277 (3.0%) | 0 (0.0%) |
| 6-Person Households | 105 (1.1%) | 0 (0.0%) |
| 7+ Person Households | 180 (1.9%) | 0 (0.0%) |
| Total | 4,907 (52.7%) | 4,395 (47.2%) |
Female Fertility in West St Paul
Fertility by Age in West St Paul
Average fertility rate in West St Paul is 32.0 births per 1,000 women. Women in the age bracket of 20 to 34 years have the highest fertility rate with 56.0 births per 1,000 women. Women in the age bracket of 20 to 34 years acount for 80.4% of all women with births.
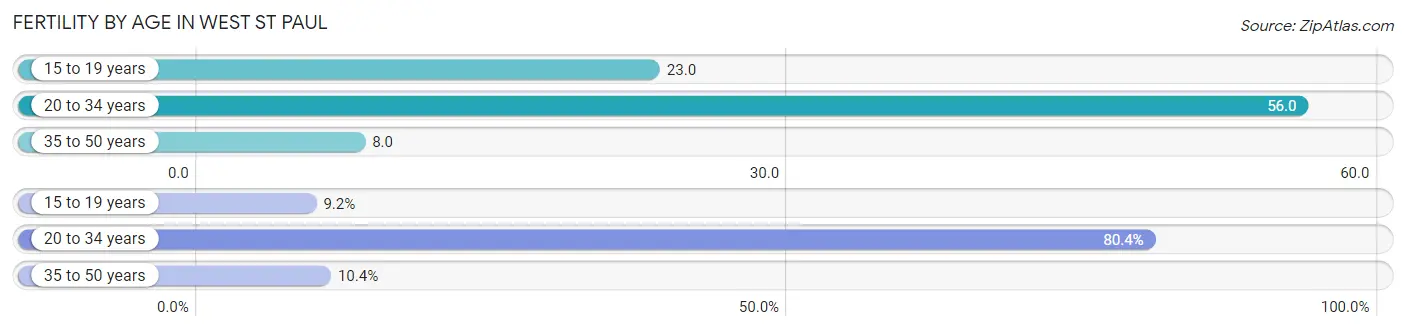
| Age Bracket | Women with Births | Births / 1,000 Women |
| 15 to 19 years | 15 (9.2%) | 23.0 |
| 20 to 34 years | 131 (80.4%) | 56.0 |
| 35 to 50 years | 17 (10.4%) | 8.0 |
| Total | 163 (100.0%) | 32.0 |
Fertility by Age by Marriage Status in West St Paul
58.9% of women with births (163) in West St Paul are married. The highest percentage of unmarried women with births falls into 15 to 19 years age bracket with 100.0% of them unmarried at the time of birth, while the lowest percentage of unmarried women with births belong to 35 to 50 years age bracket with 0.0% of them unmarried.
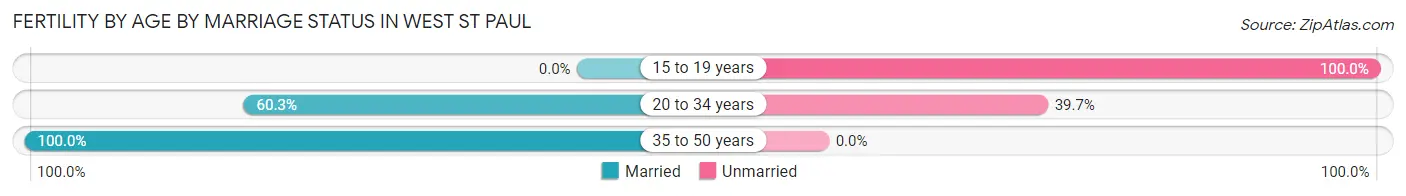
| Age Bracket | Married | Unmarried |
| 15 to 19 years | 0 (0.0%) | 15 (100.0%) |
| 20 to 34 years | 79 (60.3%) | 52 (39.7%) |
| 35 to 50 years | 17 (100.0%) | 0 (0.0%) |
| Total | 96 (58.9%) | 67 (41.1%) |
Fertility by Education in West St Paul
Average fertility rate in West St Paul is 32.0 births per 1,000 women. Women with the education attainment of college or associate's degree have the highest fertility rate of 47.0 births per 1,000 women, while women with the education attainment of high school diploma have the lowest fertility at 17.0 births per 1,000 women. Women with the education attainment of college or associate's degree represent 47.8% of all women with births.
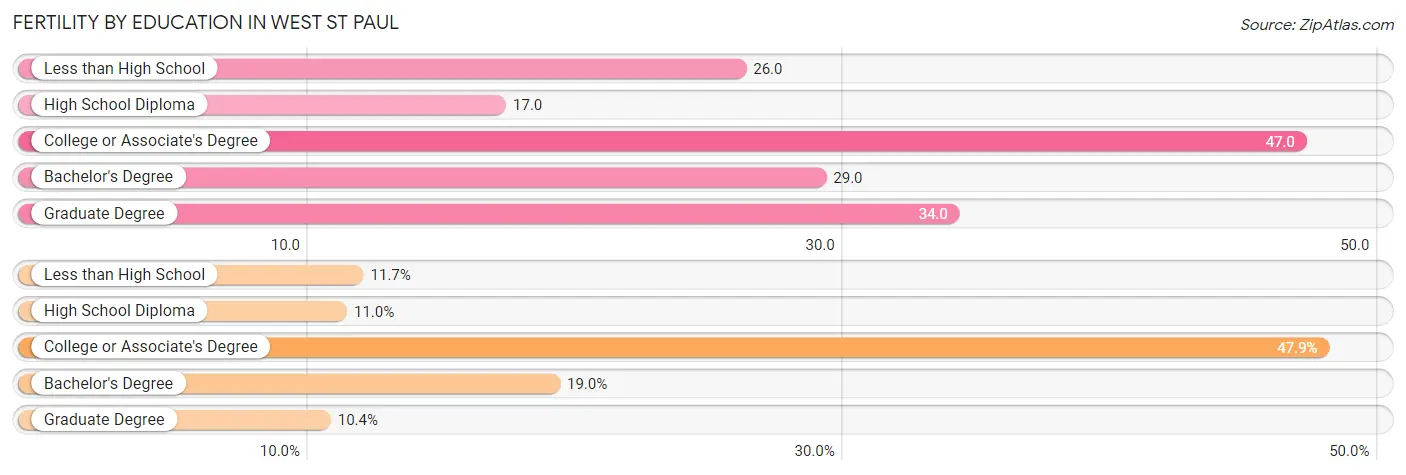
| Educational Attainment | Women with Births | Births / 1,000 Women |
| Less than High School | 19 (11.7%) | 26.0 |
| High School Diploma | 18 (11.0%) | 17.0 |
| College or Associate's Degree | 78 (47.8%) | 47.0 |
| Bachelor's Degree | 31 (19.0%) | 29.0 |
| Graduate Degree | 17 (10.4%) | 34.0 |
| Total | 163 (100.0%) | 32.0 |
Fertility by Education by Marriage Status in West St Paul
41.1% of women with births in West St Paul are unmarried. Women with the educational attainment of bachelor's degree are most likely to be married with 100.0% of them married at childbirth, while women with the educational attainment of less than high school are least likely to be married with 100.0% of them unmarried at childbirth.
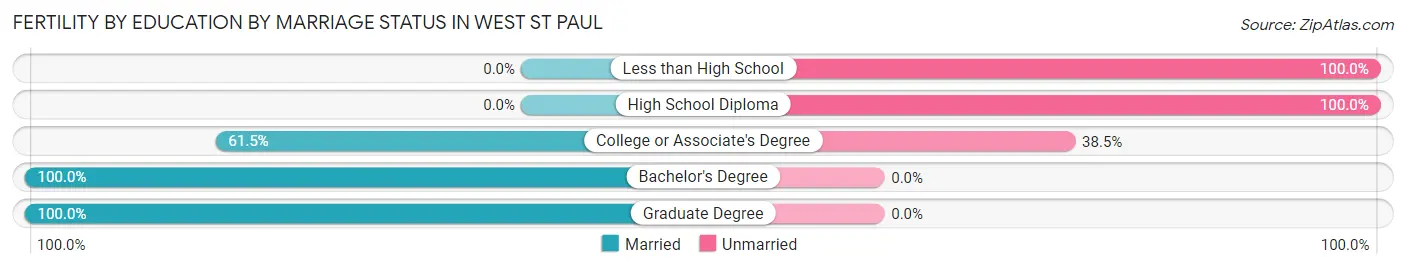
| Educational Attainment | Married | Unmarried |
| Less than High School | 0 (0.0%) | 19 (100.0%) |
| High School Diploma | 0 (0.0%) | 18 (100.0%) |
| College or Associate's Degree | 48 (61.5%) | 30 (38.5%) |
| Bachelor's Degree | 31 (100.0%) | 0 (0.0%) |
| Graduate Degree | 17 (100.0%) | 0 (0.0%) |
| Total | 96 (58.9%) | 67 (41.1%) |
Employment Characteristics in West St Paul
Employment by Class of Employer in West St Paul
Among the 10,702 employed individuals in West St Paul, private company employees (6,870 | 64.2%), not-for-profit organizations (1,577 | 14.7%), and local government employees (723 | 6.8%) make up the most common classes of employment.
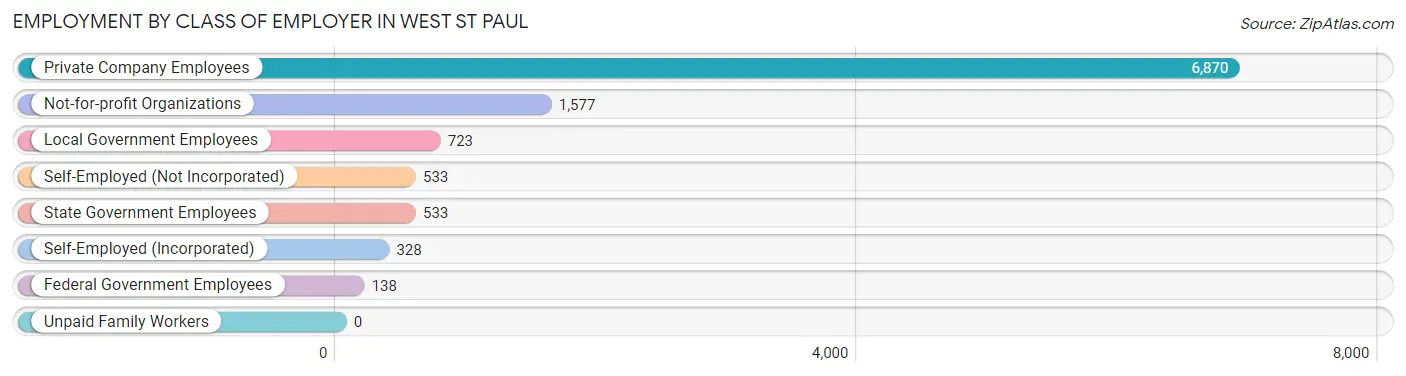
| Employer Class | # Employees | % Employees |
| Private Company Employees | 6,870 | 64.2% |
| Self-Employed (Incorporated) | 328 | 3.1% |
| Self-Employed (Not Incorporated) | 533 | 5.0% |
| Not-for-profit Organizations | 1,577 | 14.7% |
| Local Government Employees | 723 | 6.8% |
| State Government Employees | 533 | 5.0% |
| Federal Government Employees | 138 | 1.3% |
| Unpaid Family Workers | 0 | 0.0% |
| Total | 10,702 | 100.0% |
Employment Status by Age in West St Paul
According to the labor force statistics for West St Paul, out of the total population over 16 years of age (17,302), 66.5% or 11,506 individuals are in the labor force, with 5.0% or 575 of them unemployed. The age group with the highest labor force participation rate is 35 to 44 years, with 92.2% or 2,578 individuals in the labor force. Within the labor force, the 16 to 19 years age range has the highest percentage of unemployed individuals, with 26.5% or 171 of them being unemployed.
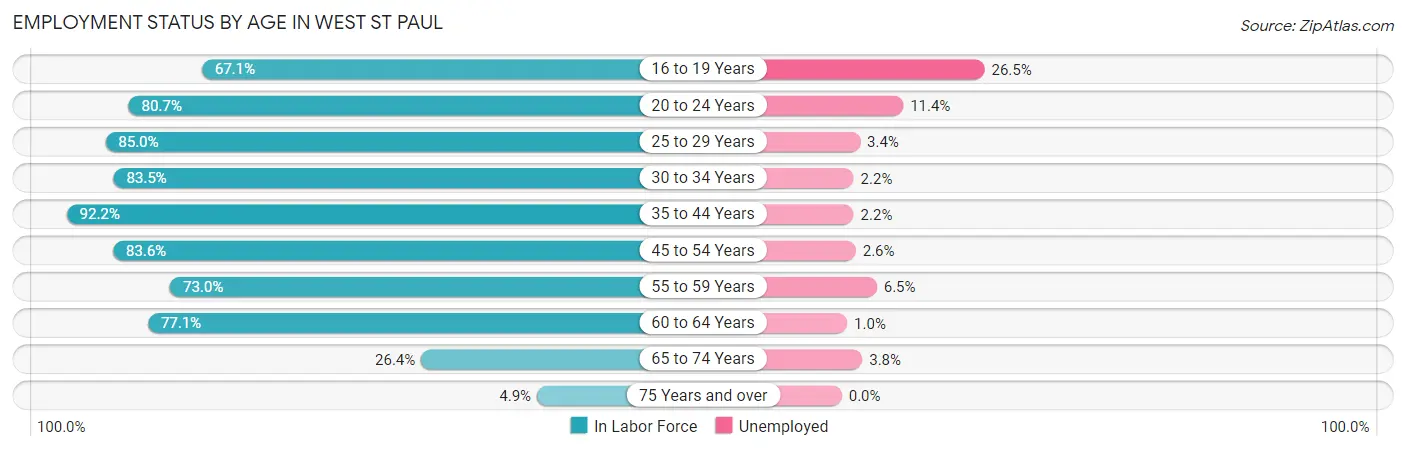
| Age Bracket | In Labor Force | Unemployed |
| 16 to 19 Years | 645 (67.1%) | 171 (26.5%) |
| 20 to 24 Years | 1,044 (80.7%) | 119 (11.4%) |
| 25 to 29 Years | 1,538 (85.0%) | 52 (3.4%) |
| 30 to 34 Years | 1,236 (83.5%) | 27 (2.2%) |
| 35 to 44 Years | 2,578 (92.2%) | 57 (2.2%) |
| 45 to 54 Years | 2,042 (83.6%) | 53 (2.6%) |
| 55 to 59 Years | 914 (73.0%) | 59 (6.5%) |
| 60 to 64 Years | 779 (77.1%) | 8 (1.0%) |
| 65 to 74 Years | 637 (26.4%) | 24 (3.8%) |
| 75 Years and over | 90 (4.9%) | 0 (0.0%) |
| Total | 11,506 (66.5%) | 575 (5.0%) |
Employment Status by Educational Attainment in West St Paul
According to labor force statistics for West St Paul, 84.2% of individuals (9,086) out of the total population between 25 and 64 years of age (10,791) are in the labor force, with 2.8% or 254 of them being unemployed. The group with the highest labor force participation rate are those with the educational attainment of bachelor's degree or higher, with 91.7% or 3,578 individuals in the labor force. Within the labor force, individuals with high school diploma education have the highest percentage of unemployment, with 4.4% or 66 of them being unemployed.
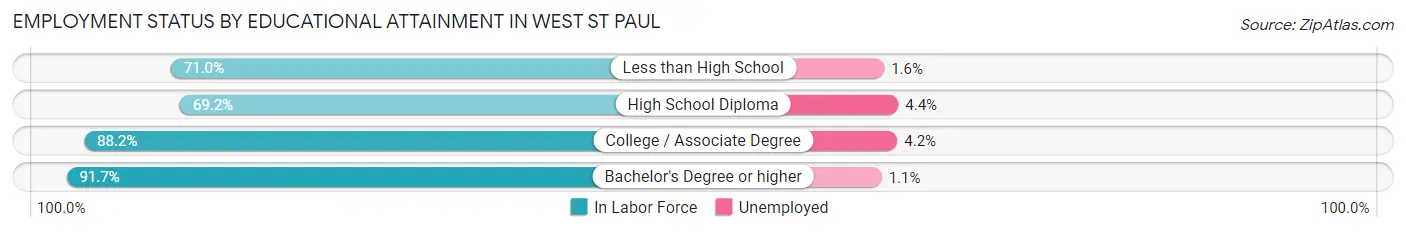
| Educational Attainment | In Labor Force | Unemployed |
| Less than High School | 641 (71.0%) | 14 (1.6%) |
| High School Diploma | 1,494 (69.2%) | 95 (4.4%) |
| College / Associate Degree | 3,375 (88.2%) | 161 (4.2%) |
| Bachelor's Degree or higher | 3,578 (91.7%) | 43 (1.1%) |
| Total | 9,086 (84.2%) | 302 (2.8%) |
Employment Occupations by Sex in West St Paul
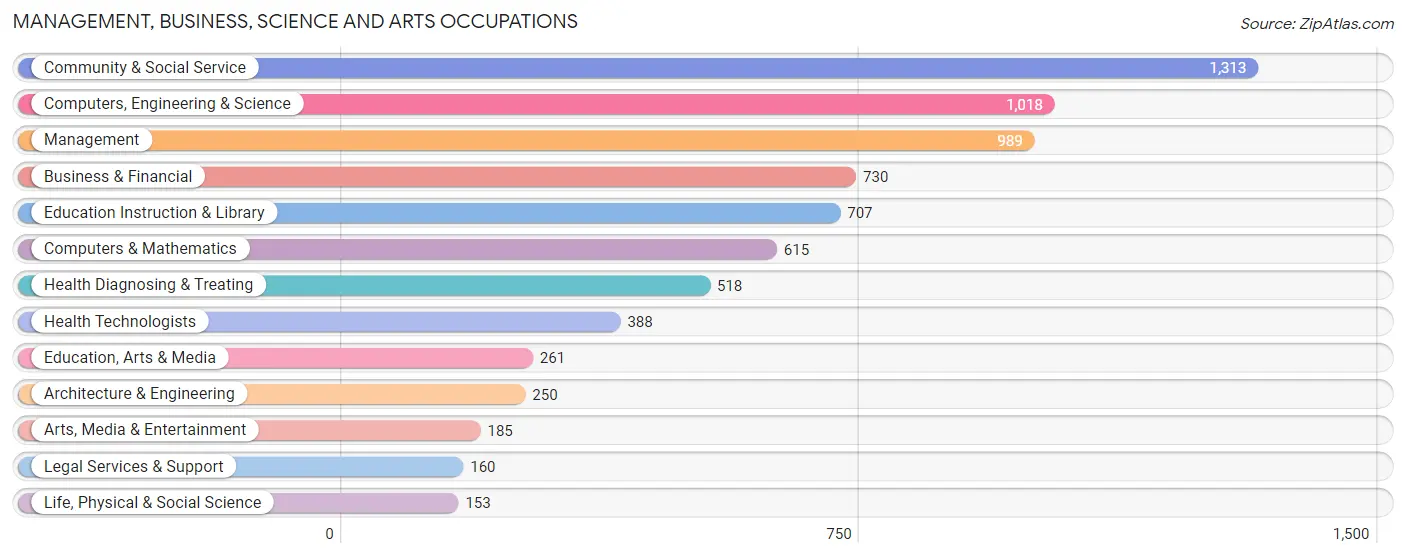
Management, Business, Science and Arts Occupations
The most common Management, Business, Science and Arts occupations in West St Paul are Community & Social Service (1,313 | 12.0%), Computers, Engineering & Science (1,018 | 9.3%), Management (989 | 9.0%), Business & Financial (730 | 6.7%), and Education Instruction & Library (707 | 6.5%).
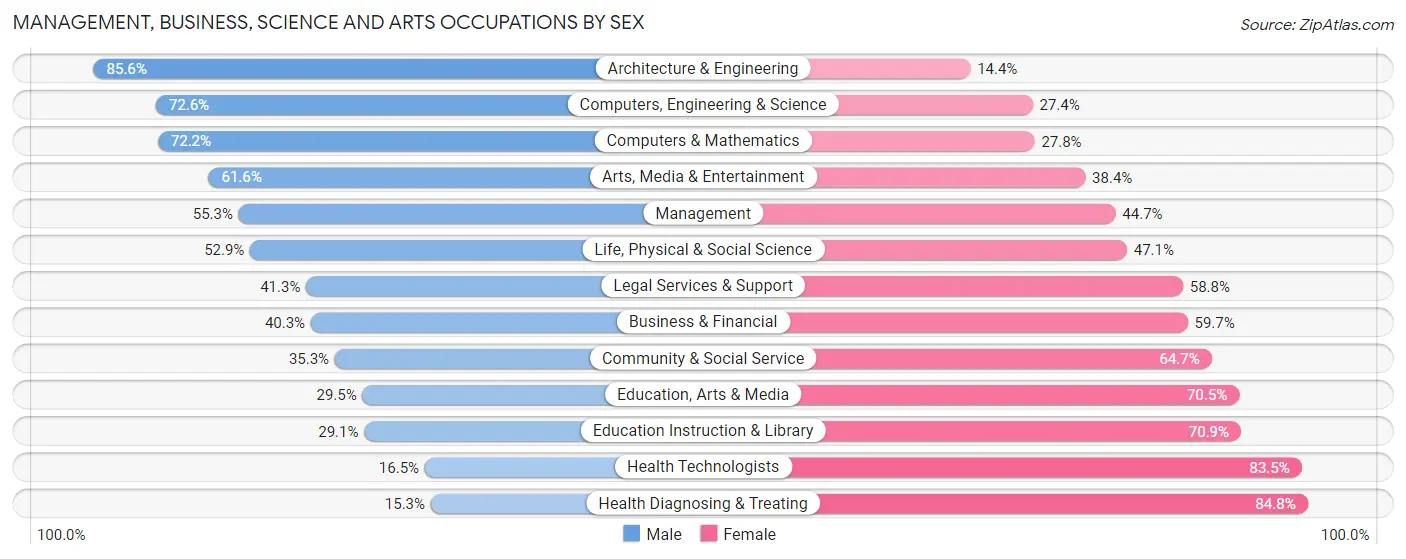
Management, Business, Science and Arts Occupations by Sex
Within the Management, Business, Science and Arts occupations in West St Paul, the most male-oriented occupations are Architecture & Engineering (85.6%), Computers, Engineering & Science (72.6%), and Computers & Mathematics (72.2%), while the most female-oriented occupations are Health Diagnosing & Treating (84.8%), Health Technologists (83.5%), and Education Instruction & Library (70.9%).
| Occupation | Male | Female |
| Management | 547 (55.3%) | 442 (44.7%) |
| Business & Financial | 294 (40.3%) | 436 (59.7%) |
| Computers, Engineering & Science | 739 (72.6%) | 279 (27.4%) |
| Computers & Mathematics | 444 (72.2%) | 171 (27.8%) |
| Architecture & Engineering | 214 (85.6%) | 36 (14.4%) |
| Life, Physical & Social Science | 81 (52.9%) | 72 (47.1%) |
| Community & Social Service | 463 (35.3%) | 850 (64.7%) |
| Education, Arts & Media | 77 (29.5%) | 184 (70.5%) |
| Legal Services & Support | 66 (41.2%) | 94 (58.8%) |
| Education Instruction & Library | 206 (29.1%) | 501 (70.9%) |
| Arts, Media & Entertainment | 114 (61.6%) | 71 (38.4%) |
| Health Diagnosing & Treating | 79 (15.2%) | 439 (84.8%) |
| Health Technologists | 64 (16.5%) | 324 (83.5%) |
| Total (Category) | 2,122 (46.5%) | 2,446 (53.5%) |
| Total (Overall) | 5,310 (48.6%) | 5,624 (51.4%) |
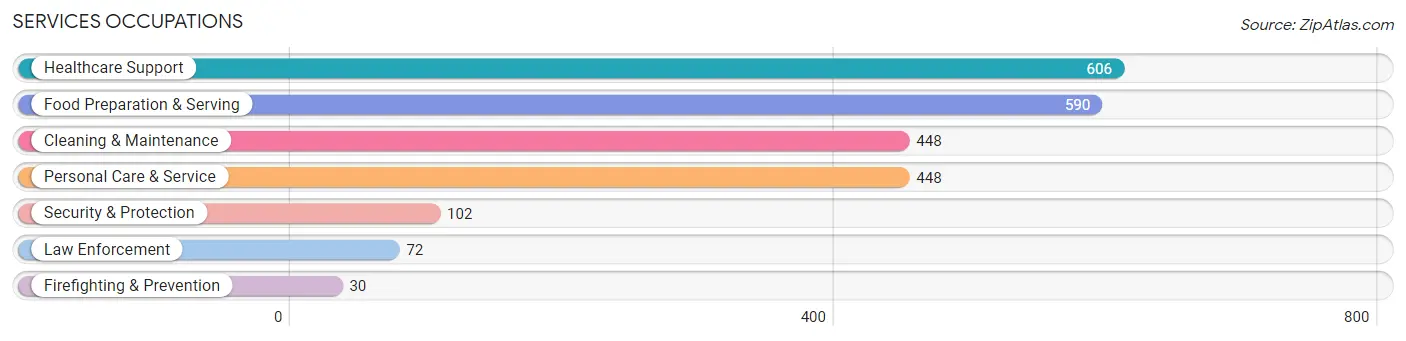
Services Occupations
The most common Services occupations in West St Paul are Healthcare Support (606 | 5.5%), Food Preparation & Serving (590 | 5.4%), Cleaning & Maintenance (448 | 4.1%), Personal Care & Service (448 | 4.1%), and Security & Protection (102 | 0.9%).
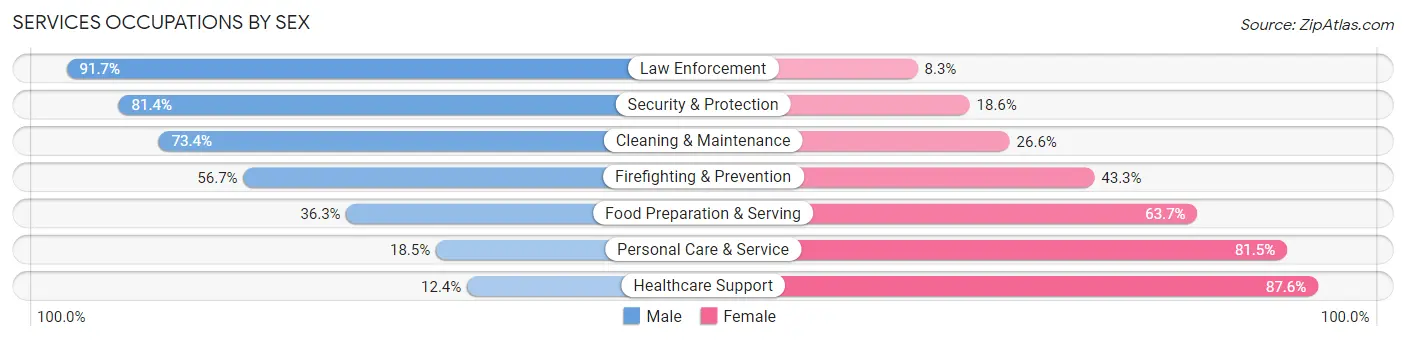
Services Occupations by Sex
Within the Services occupations in West St Paul, the most male-oriented occupations are Law Enforcement (91.7%), Security & Protection (81.4%), and Cleaning & Maintenance (73.4%), while the most female-oriented occupations are Healthcare Support (87.6%), Personal Care & Service (81.5%), and Food Preparation & Serving (63.7%).
| Occupation | Male | Female |
| Healthcare Support | 75 (12.4%) | 531 (87.6%) |
| Security & Protection | 83 (81.4%) | 19 (18.6%) |
| Firefighting & Prevention | 17 (56.7%) | 13 (43.3%) |
| Law Enforcement | 66 (91.7%) | 6 (8.3%) |
| Food Preparation & Serving | 214 (36.3%) | 376 (63.7%) |
| Cleaning & Maintenance | 329 (73.4%) | 119 (26.6%) |
| Personal Care & Service | 83 (18.5%) | 365 (81.5%) |
| Total (Category) | 784 (35.7%) | 1,410 (64.3%) |
| Total (Overall) | 5,310 (48.6%) | 5,624 (51.4%) |
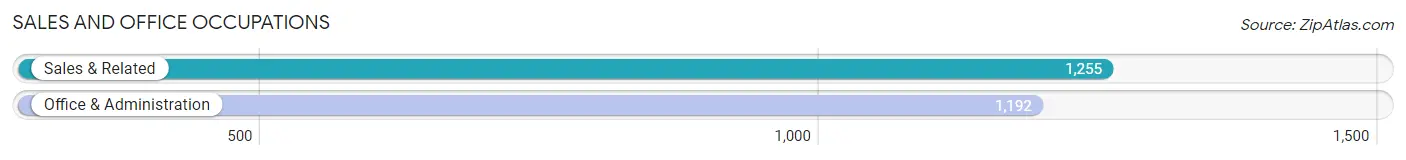
Sales and Office Occupations
The most common Sales and Office occupations in West St Paul are Sales & Related (1,255 | 11.5%), and Office & Administration (1,192 | 10.9%).
Sales and Office Occupations by Sex
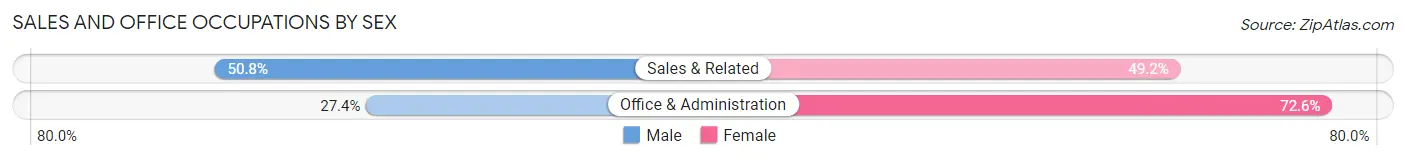
| Occupation | Male | Female |
| Sales & Related | 637 (50.8%) | 618 (49.2%) |
| Office & Administration | 327 (27.4%) | 865 (72.6%) |
| Total (Category) | 964 (39.4%) | 1,483 (60.6%) |
| Total (Overall) | 5,310 (48.6%) | 5,624 (51.4%) |
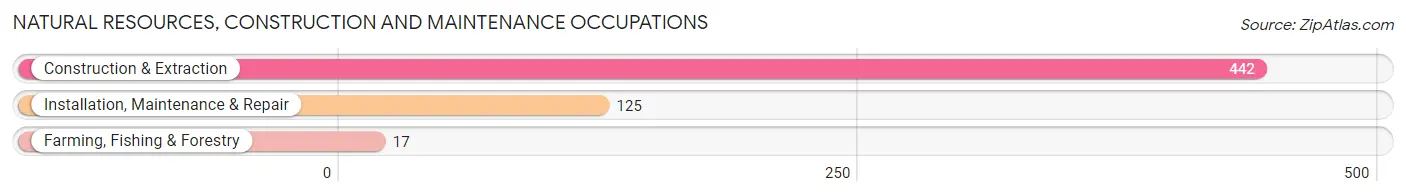
Natural Resources, Construction and Maintenance Occupations
The most common Natural Resources, Construction and Maintenance occupations in West St Paul are Construction & Extraction (442 | 4.0%), Installation, Maintenance & Repair (125 | 1.1%), and Farming, Fishing & Forestry (17 | 0.2%).
Natural Resources, Construction and Maintenance Occupations by Sex
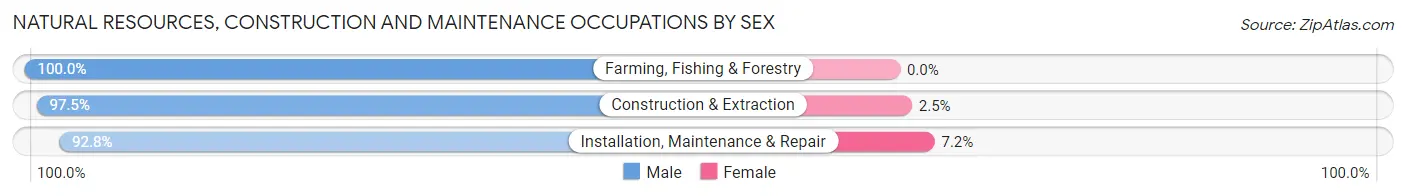
| Occupation | Male | Female |
| Farming, Fishing & Forestry | 17 (100.0%) | 0 (0.0%) |
| Construction & Extraction | 431 (97.5%) | 11 (2.5%) |
| Installation, Maintenance & Repair | 116 (92.8%) | 9 (7.2%) |
| Total (Category) | 564 (96.6%) | 20 (3.4%) |
| Total (Overall) | 5,310 (48.6%) | 5,624 (51.4%) |
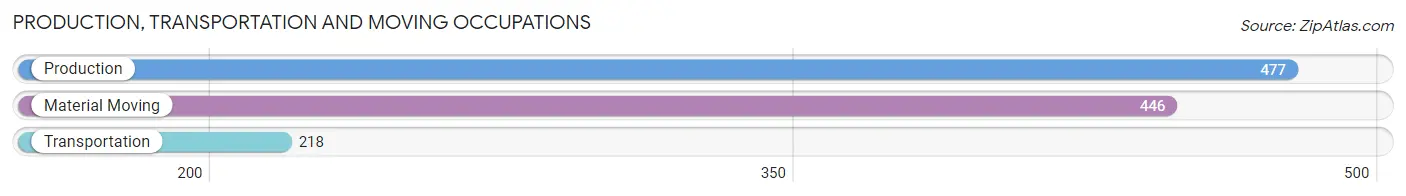
Production, Transportation and Moving Occupations
The most common Production, Transportation and Moving occupations in West St Paul are Production (477 | 4.4%), Material Moving (446 | 4.1%), and Transportation (218 | 2.0%).
Production, Transportation and Moving Occupations by Sex
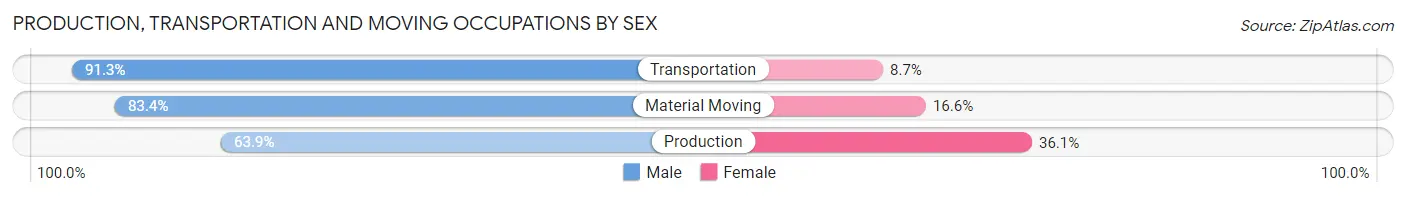
| Occupation | Male | Female |
| Production | 305 (63.9%) | 172 (36.1%) |
| Transportation | 199 (91.3%) | 19 (8.7%) |
| Material Moving | 372 (83.4%) | 74 (16.6%) |
| Total (Category) | 876 (76.8%) | 265 (23.2%) |
| Total (Overall) | 5,310 (48.6%) | 5,624 (51.4%) |
Employment Industries by Sex in West St Paul
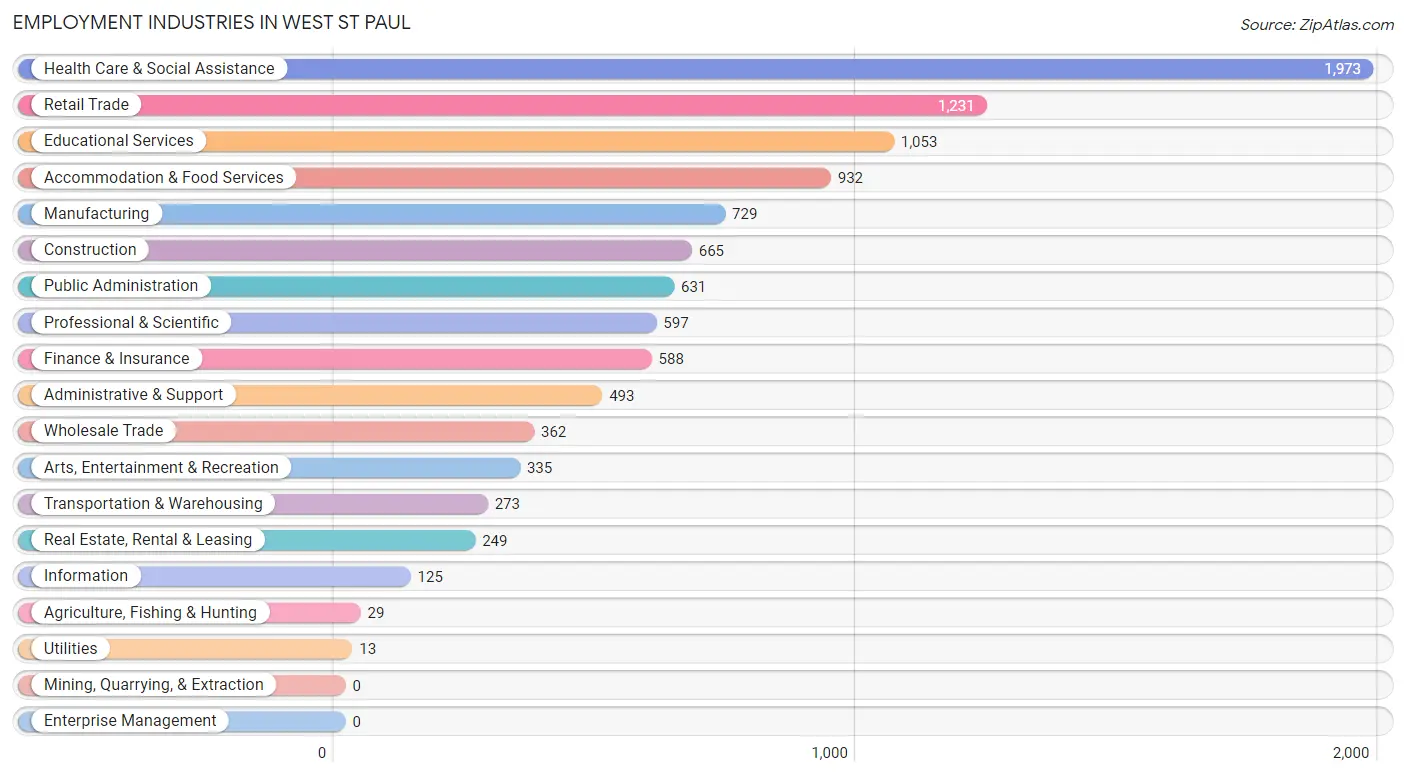
Employment Industries in West St Paul
The major employment industries in West St Paul include Health Care & Social Assistance (1,973 | 18.0%), Retail Trade (1,231 | 11.3%), Educational Services (1,053 | 9.6%), Accommodation & Food Services (932 | 8.5%), and Manufacturing (729 | 6.7%).
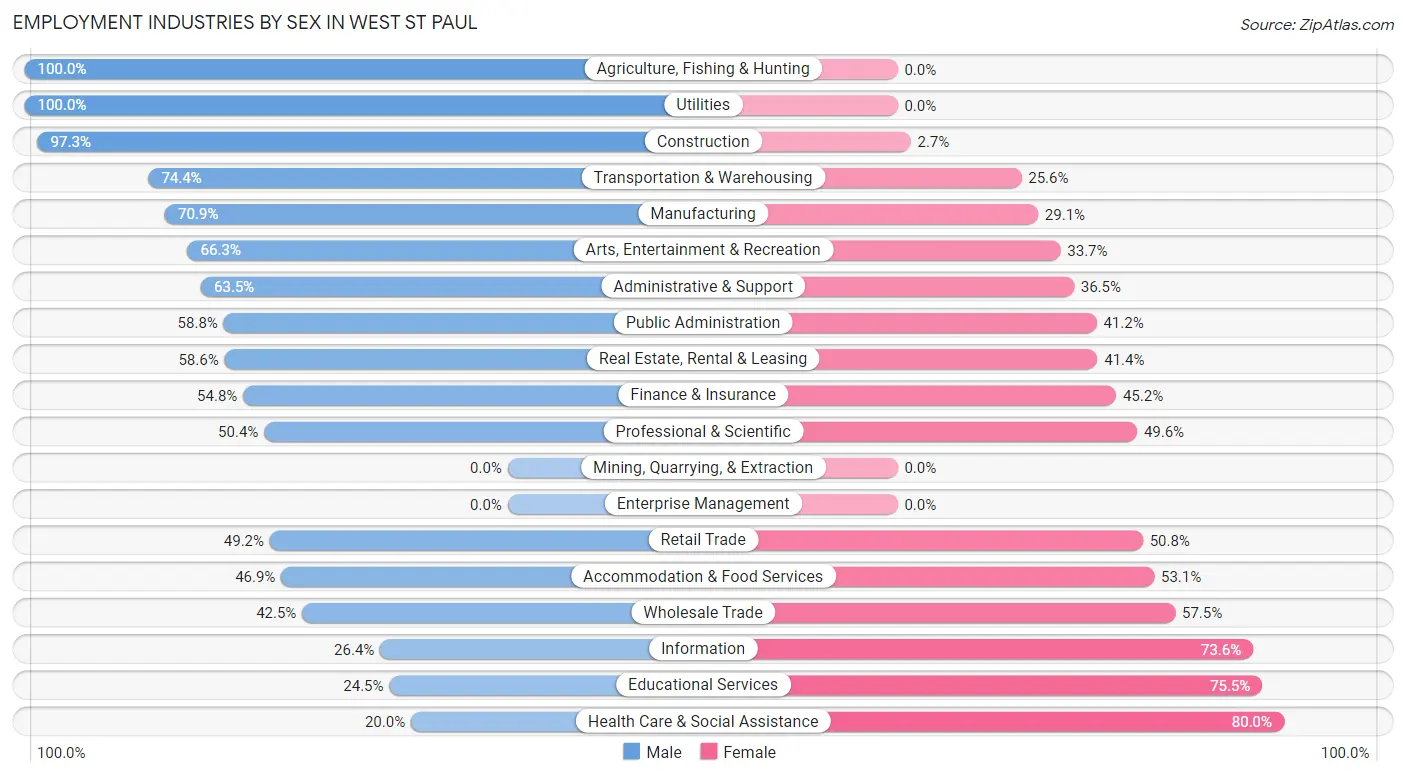
Employment Industries by Sex in West St Paul
The West St Paul industries that see more men than women are Agriculture, Fishing & Hunting (100.0%), Utilities (100.0%), and Construction (97.3%), whereas the industries that tend to have a higher number of women are Health Care & Social Assistance (80.0%), Educational Services (75.5%), and Information (73.6%).
| Industry | Male | Female |
| Agriculture, Fishing & Hunting | 29 (100.0%) | 0 (0.0%) |
| Mining, Quarrying, & Extraction | 0 (0.0%) | 0 (0.0%) |
| Construction | 647 (97.3%) | 18 (2.7%) |
| Manufacturing | 517 (70.9%) | 212 (29.1%) |
| Wholesale Trade | 154 (42.5%) | 208 (57.5%) |
| Retail Trade | 606 (49.2%) | 625 (50.8%) |
| Transportation & Warehousing | 203 (74.4%) | 70 (25.6%) |
| Utilities | 13 (100.0%) | 0 (0.0%) |
| Information | 33 (26.4%) | 92 (73.6%) |
| Finance & Insurance | 322 (54.8%) | 266 (45.2%) |
| Real Estate, Rental & Leasing | 146 (58.6%) | 103 (41.4%) |
| Professional & Scientific | 301 (50.4%) | 296 (49.6%) |
| Enterprise Management | 0 (0.0%) | 0 (0.0%) |
| Administrative & Support | 313 (63.5%) | 180 (36.5%) |
| Educational Services | 258 (24.5%) | 795 (75.5%) |
| Health Care & Social Assistance | 395 (20.0%) | 1,578 (80.0%) |
| Arts, Entertainment & Recreation | 222 (66.3%) | 113 (33.7%) |
| Accommodation & Food Services | 437 (46.9%) | 495 (53.1%) |
| Public Administration | 371 (58.8%) | 260 (41.2%) |
| Total | 5,310 (48.6%) | 5,624 (51.4%) |
Education in West St Paul
School Enrollment in West St Paul
The most common levels of schooling among the 4,270 students in West St Paul are high school (1,060 | 24.8%), college / undergraduate (837 | 19.6%), and middle school (799 | 18.7%).
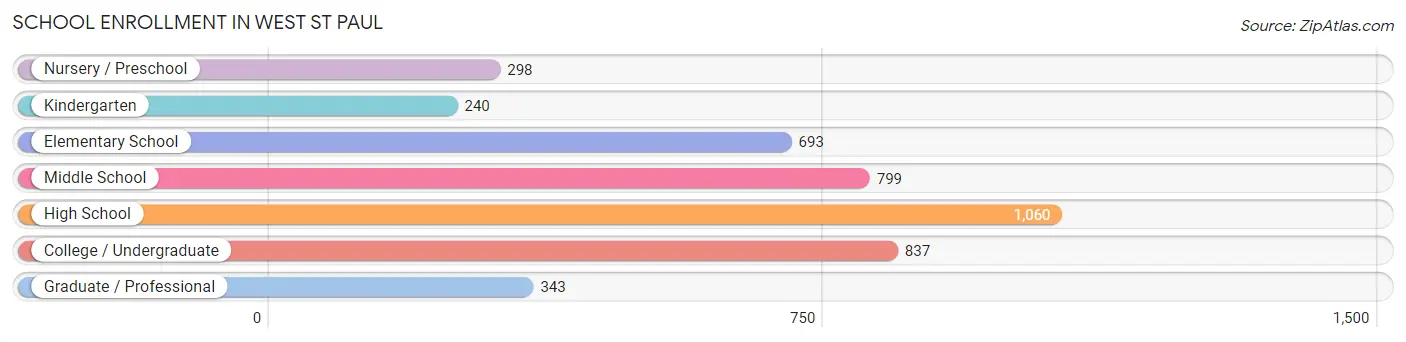
| School Level | # Students | % Students |
| Nursery / Preschool | 298 | 7.0% |
| Kindergarten | 240 | 5.6% |
| Elementary School | 693 | 16.2% |
| Middle School | 799 | 18.7% |
| High School | 1,060 | 24.8% |
| College / Undergraduate | 837 | 19.6% |
| Graduate / Professional | 343 | 8.0% |
| Total | 4,270 | 100.0% |
School Enrollment by Age by Funding Source in West St Paul
Out of a total of 4,270 students who are enrolled in schools in West St Paul, 880 (20.6%) attend a private institution, while the remaining 3,390 (79.4%) are enrolled in public schools. The age group of 20 to 24 year olds has the highest likelihood of being enrolled in private schools, with 90 (25.0% in the age bracket) enrolled. Conversely, the age group of 10 to 14 year olds has the lowest likelihood of being enrolled in a private school, with 782 (83.3% in the age bracket) attending a public institution.
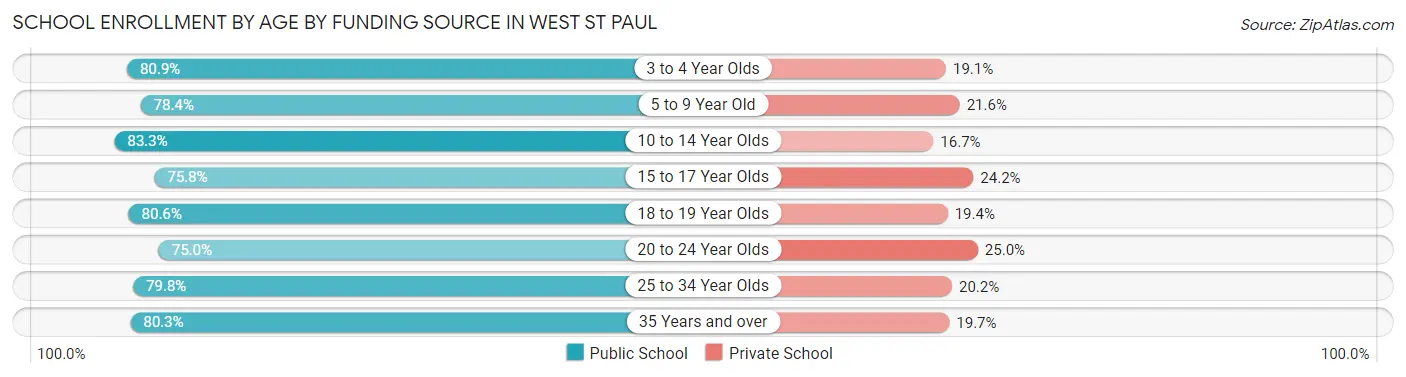
| Age Bracket | Public School | Private School |
| 3 to 4 Year Olds | 208 (80.9%) | 49 (19.1%) |
| 5 to 9 Year Old | 747 (78.4%) | 206 (21.6%) |
| 10 to 14 Year Olds | 782 (83.3%) | 157 (16.7%) |
| 15 to 17 Year Olds | 496 (75.8%) | 158 (24.2%) |
| 18 to 19 Year Olds | 287 (80.6%) | 69 (19.4%) |
| 20 to 24 Year Olds | 270 (75.0%) | 90 (25.0%) |
| 25 to 34 Year Olds | 340 (79.8%) | 86 (20.2%) |
| 35 Years and over | 261 (80.3%) | 64 (19.7%) |
| Total | 3,390 (79.4%) | 880 (20.6%) |
Educational Attainment by Field of Study in West St Paul
Business (988 | 17.1%), education (738 | 12.8%), social sciences (687 | 11.9%), liberal arts & history (588 | 10.2%), and science & technology (378 | 6.5%) are the most common fields of study among 5,790 individuals in West St Paul who have obtained a bachelor's degree or higher.
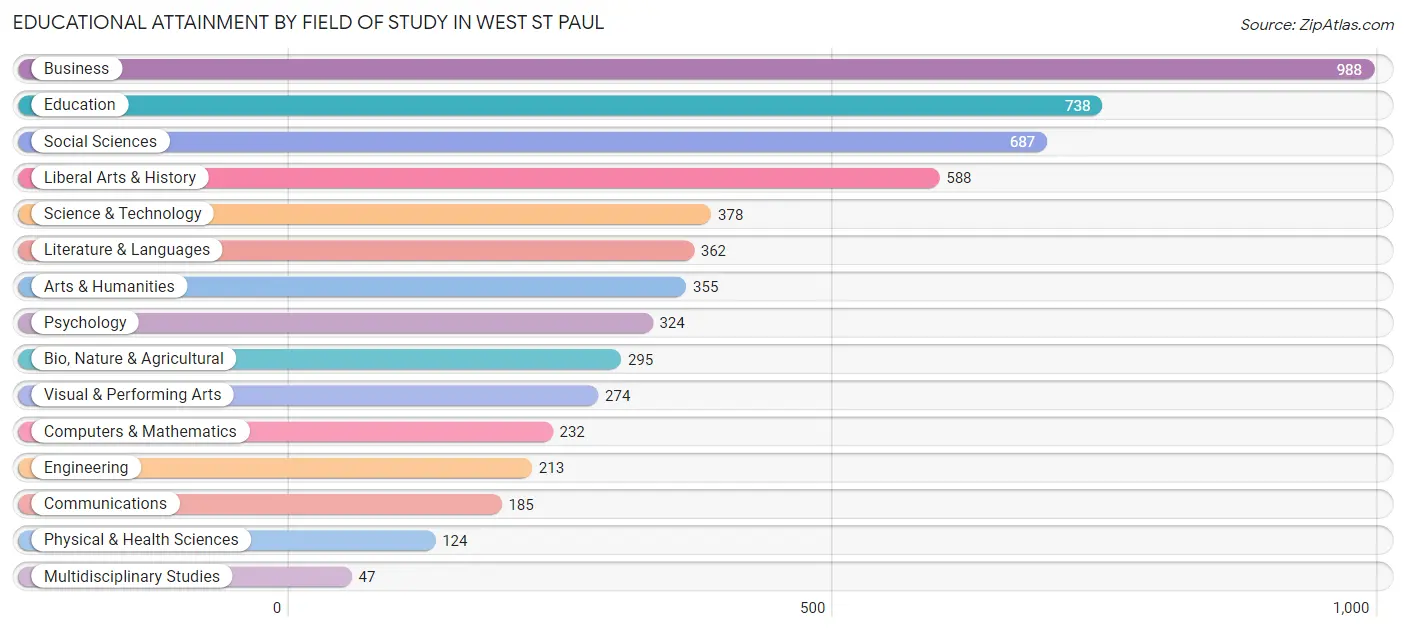
| Field of Study | # Graduates | % Graduates |
| Computers & Mathematics | 232 | 4.0% |
| Bio, Nature & Agricultural | 295 | 5.1% |
| Physical & Health Sciences | 124 | 2.1% |
| Psychology | 324 | 5.6% |
| Social Sciences | 687 | 11.9% |
| Engineering | 213 | 3.7% |
| Multidisciplinary Studies | 47 | 0.8% |
| Science & Technology | 378 | 6.5% |
| Business | 988 | 17.1% |
| Education | 738 | 12.8% |
| Literature & Languages | 362 | 6.2% |
| Liberal Arts & History | 588 | 10.2% |
| Visual & Performing Arts | 274 | 4.7% |
| Communications | 185 | 3.2% |
| Arts & Humanities | 355 | 6.1% |
| Total | 5,790 | 100.0% |
Transportation & Commute in West St Paul
Vehicle Availability by Sex in West St Paul
The most prevalent vehicle ownership categories in West St Paul are males with 2 vehicles (2,181, accounting for 41.7%) and females with 2 vehicles (2,118, making up 40.0%).
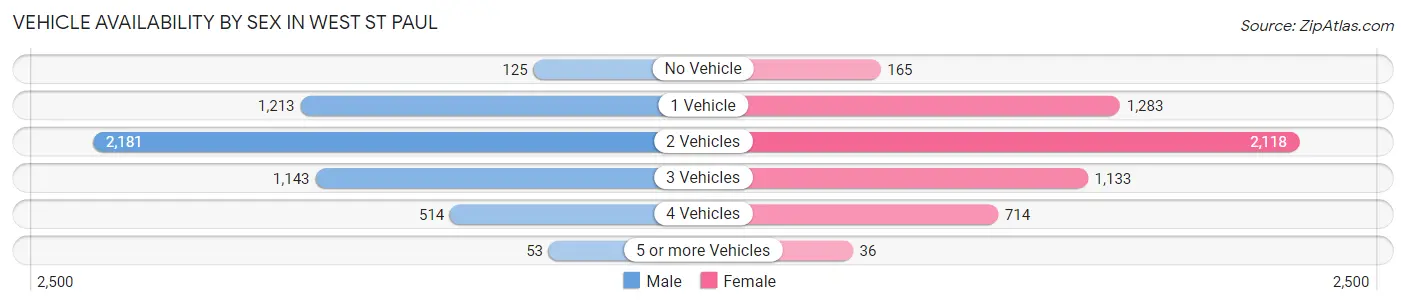
| Vehicles Available | Male | Female |
| No Vehicle | 125 (2.4%) | 165 (3.0%) |
| 1 Vehicle | 1,213 (23.2%) | 1,283 (23.5%) |
| 2 Vehicles | 2,181 (41.7%) | 2,118 (38.9%) |
| 3 Vehicles | 1,143 (21.9%) | 1,133 (20.8%) |
| 4 Vehicles | 514 (9.8%) | 714 (13.1%) |
| 5 or more Vehicles | 53 (1.0%) | 36 (0.7%) |
| Total | 5,229 (100.0%) | 5,449 (100.0%) |
Commute Time in West St Paul
The most frequently occuring commute durations in West St Paul are 15 to 19 minutes (1,836 commuters, 20.2%), 20 to 24 minutes (1,508 commuters, 16.6%), and 30 to 34 minutes (1,455 commuters, 16.0%).
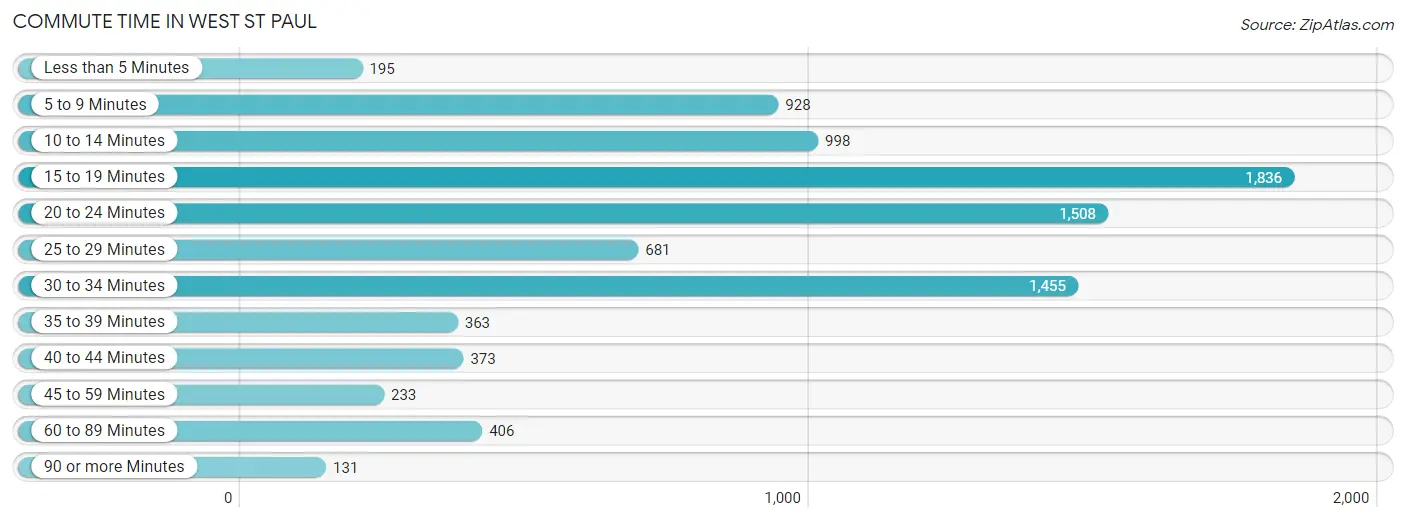
| Commute Time | # Commuters | % Commuters |
| Less than 5 Minutes | 195 | 2.1% |
| 5 to 9 Minutes | 928 | 10.2% |
| 10 to 14 Minutes | 998 | 11.0% |
| 15 to 19 Minutes | 1,836 | 20.2% |
| 20 to 24 Minutes | 1,508 | 16.6% |
| 25 to 29 Minutes | 681 | 7.5% |
| 30 to 34 Minutes | 1,455 | 16.0% |
| 35 to 39 Minutes | 363 | 4.0% |
| 40 to 44 Minutes | 373 | 4.1% |
| 45 to 59 Minutes | 233 | 2.6% |
| 60 to 89 Minutes | 406 | 4.5% |
| 90 or more Minutes | 131 | 1.4% |
Commute Time by Sex in West St Paul
The most common commute times in West St Paul are 20 to 24 minutes (890 commuters, 19.5%) for males and 15 to 19 minutes (1,057 commuters, 23.3%) for females.
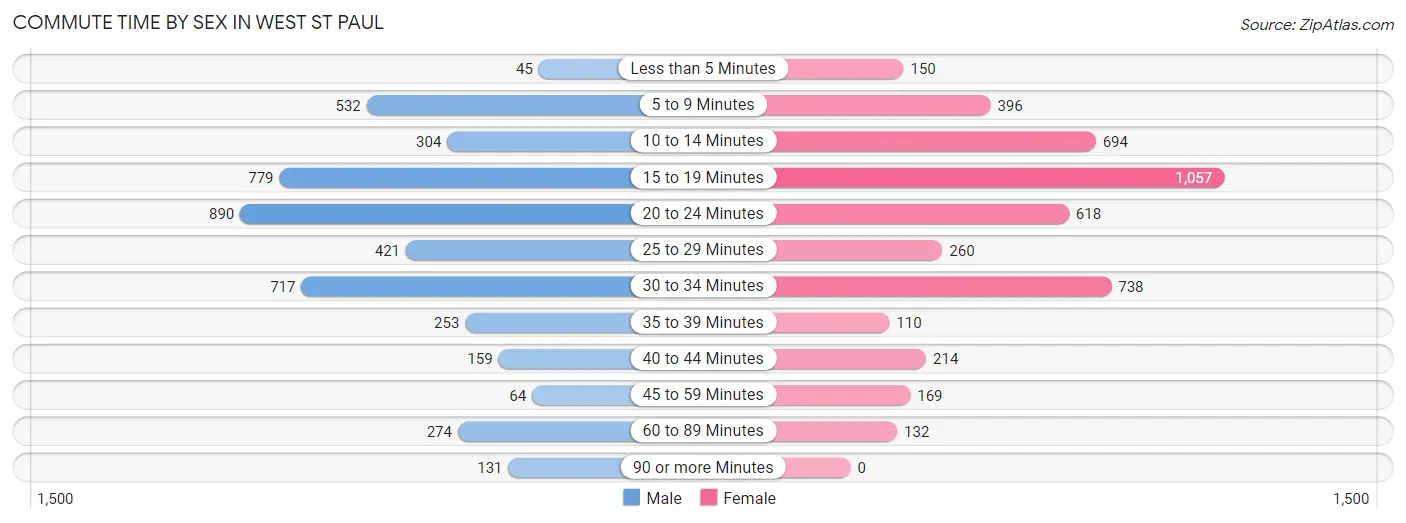
| Commute Time | Male | Female |
| Less than 5 Minutes | 45 (1.0%) | 150 (3.3%) |
| 5 to 9 Minutes | 532 (11.6%) | 396 (8.7%) |
| 10 to 14 Minutes | 304 (6.7%) | 694 (15.3%) |
| 15 to 19 Minutes | 779 (17.1%) | 1,057 (23.3%) |
| 20 to 24 Minutes | 890 (19.5%) | 618 (13.6%) |
| 25 to 29 Minutes | 421 (9.2%) | 260 (5.7%) |
| 30 to 34 Minutes | 717 (15.7%) | 738 (16.3%) |
| 35 to 39 Minutes | 253 (5.5%) | 110 (2.4%) |
| 40 to 44 Minutes | 159 (3.5%) | 214 (4.7%) |
| 45 to 59 Minutes | 64 (1.4%) | 169 (3.7%) |
| 60 to 89 Minutes | 274 (6.0%) | 132 (2.9%) |
| 90 or more Minutes | 131 (2.9%) | 0 (0.0%) |
Time of Departure to Work by Sex in West St Paul
The most frequent times of departure to work in West St Paul are 6:30 AM to 6:59 AM (661, 14.5%) for males and 7:30 AM to 7:59 AM (740, 16.3%) for females.
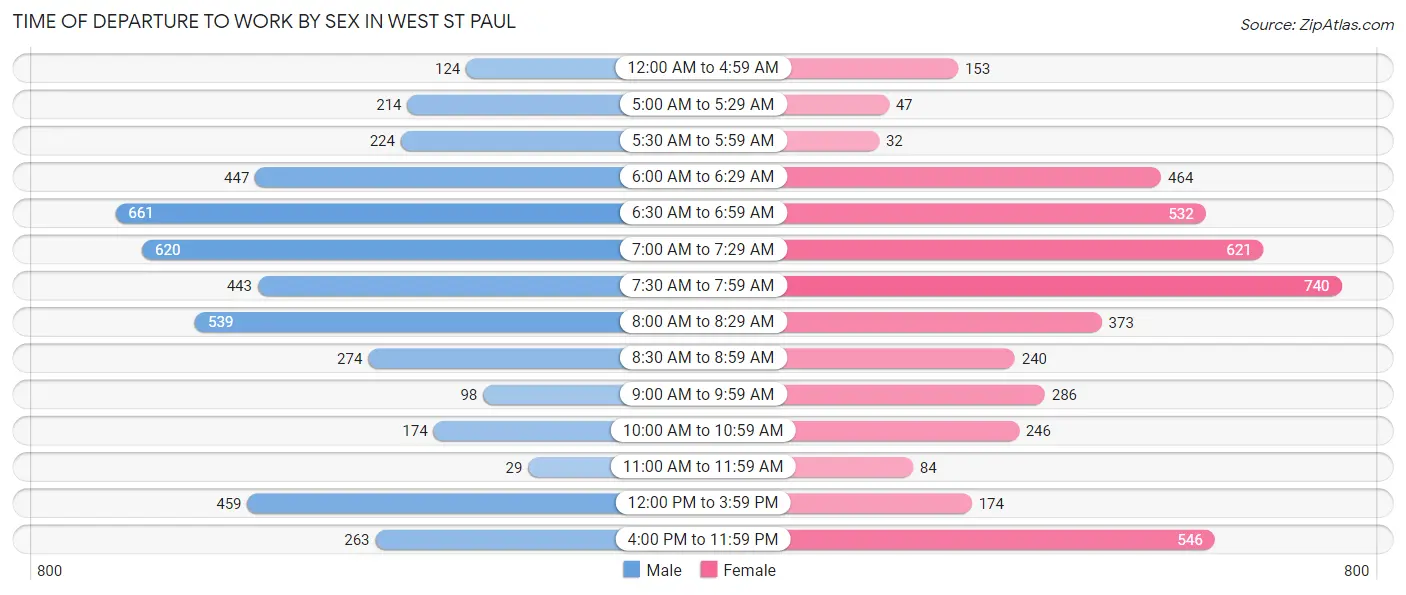
| Time of Departure | Male | Female |
| 12:00 AM to 4:59 AM | 124 (2.7%) | 153 (3.4%) |
| 5:00 AM to 5:29 AM | 214 (4.7%) | 47 (1.0%) |
| 5:30 AM to 5:59 AM | 224 (4.9%) | 32 (0.7%) |
| 6:00 AM to 6:29 AM | 447 (9.8%) | 464 (10.2%) |
| 6:30 AM to 6:59 AM | 661 (14.5%) | 532 (11.7%) |
| 7:00 AM to 7:29 AM | 620 (13.6%) | 621 (13.7%) |
| 7:30 AM to 7:59 AM | 443 (9.7%) | 740 (16.3%) |
| 8:00 AM to 8:29 AM | 539 (11.8%) | 373 (8.2%) |
| 8:30 AM to 8:59 AM | 274 (6.0%) | 240 (5.3%) |
| 9:00 AM to 9:59 AM | 98 (2.1%) | 286 (6.3%) |
| 10:00 AM to 10:59 AM | 174 (3.8%) | 246 (5.4%) |
| 11:00 AM to 11:59 AM | 29 (0.6%) | 84 (1.8%) |
| 12:00 PM to 3:59 PM | 459 (10.1%) | 174 (3.8%) |
| 4:00 PM to 11:59 PM | 263 (5.8%) | 546 (12.0%) |
| Total | 4,569 (100.0%) | 4,538 (100.0%) |
Housing Occupancy in West St Paul
Occupancy by Ownership in West St Paul
Of the total 9,302 dwellings in West St Paul, owner-occupied units account for 5,713 (61.4%), while renter-occupied units make up 3,589 (38.6%).
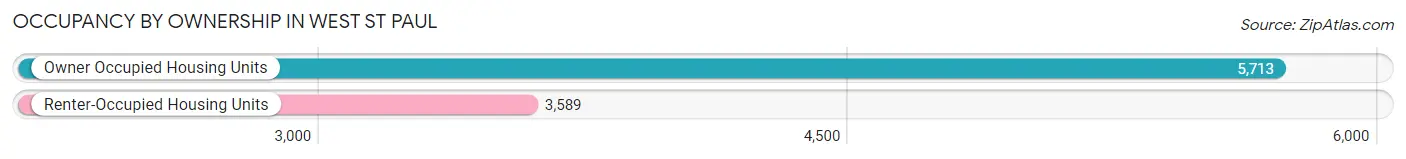
| Occupancy | # Housing Units | % Housing Units |
| Owner Occupied Housing Units | 5,713 | 61.4% |
| Renter-Occupied Housing Units | 3,589 | 38.6% |
| Total Occupied Housing Units | 9,302 | 100.0% |
Occupancy by Household Size in West St Paul
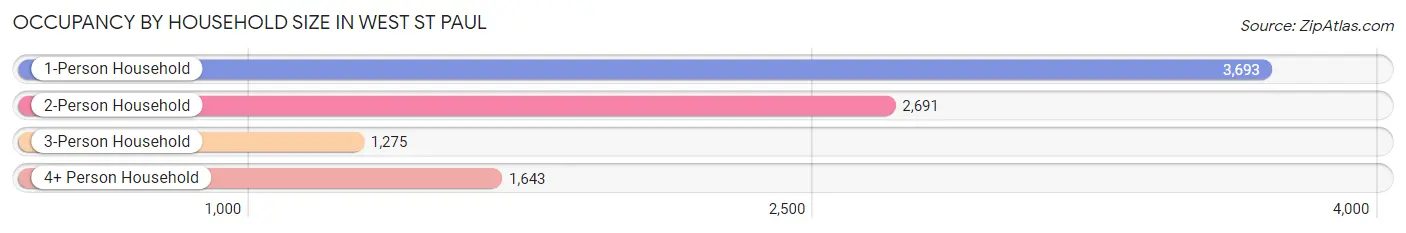
| Household Size | # Housing Units | % Housing Units |
| 1-Person Household | 3,693 | 39.7% |
| 2-Person Household | 2,691 | 28.9% |
| 3-Person Household | 1,275 | 13.7% |
| 4+ Person Household | 1,643 | 17.7% |
| Total Housing Units | 9,302 | 100.0% |
Occupancy by Ownership by Household Size in West St Paul
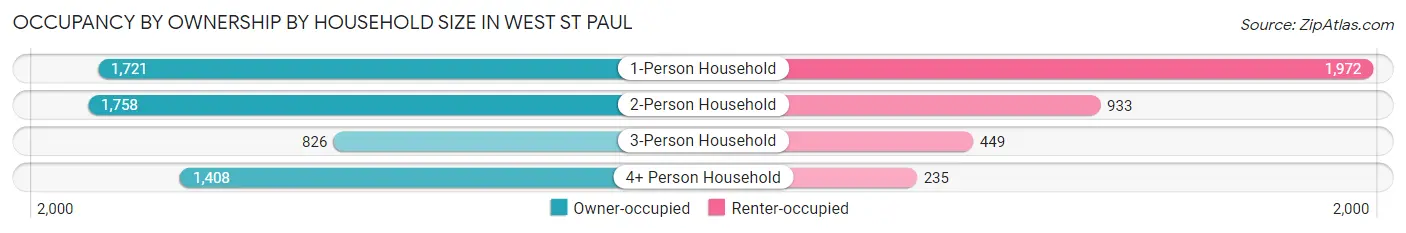
| Household Size | Owner-occupied | Renter-occupied |
| 1-Person Household | 1,721 (46.6%) | 1,972 (53.4%) |
| 2-Person Household | 1,758 (65.3%) | 933 (34.7%) |
| 3-Person Household | 826 (64.8%) | 449 (35.2%) |
| 4+ Person Household | 1,408 (85.7%) | 235 (14.3%) |
| Total Housing Units | 5,713 (61.4%) | 3,589 (38.6%) |
Occupancy by Educational Attainment in West St Paul
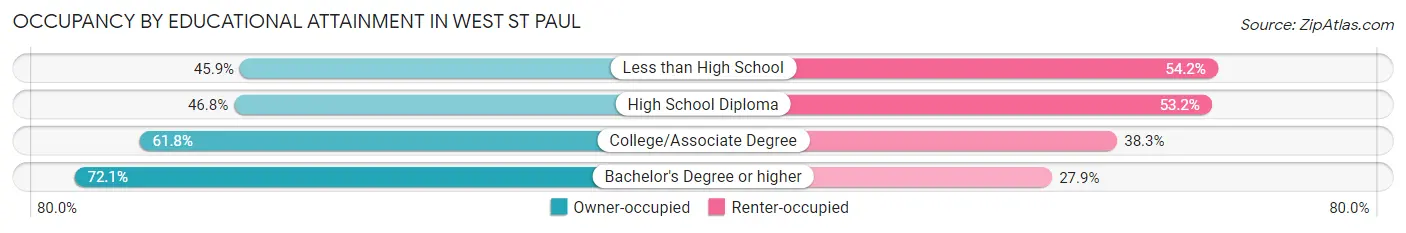
| Household Size | Owner-occupied | Renter-occupied |
| Less than High School | 243 (45.9%) | 287 (54.1%) |
| High School Diploma | 969 (46.8%) | 1,102 (53.2%) |
| College/Associate Degree | 1,965 (61.8%) | 1,217 (38.3%) |
| Bachelor's Degree or higher | 2,536 (72.1%) | 983 (27.9%) |
Occupancy by Age of Householder in West St Paul
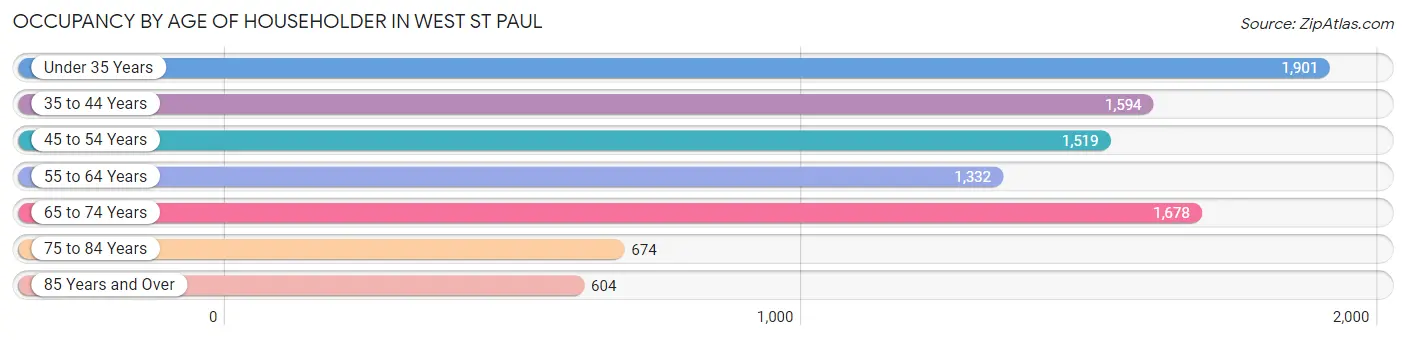
| Age Bracket | # Households | % Households |
| Under 35 Years | 1,901 | 20.4% |
| 35 to 44 Years | 1,594 | 17.1% |
| 45 to 54 Years | 1,519 | 16.3% |
| 55 to 64 Years | 1,332 | 14.3% |
| 65 to 74 Years | 1,678 | 18.0% |
| 75 to 84 Years | 674 | 7.2% |
| 85 Years and Over | 604 | 6.5% |
| Total | 9,302 | 100.0% |
Housing Finances in West St Paul
Median Income by Occupancy in West St Paul
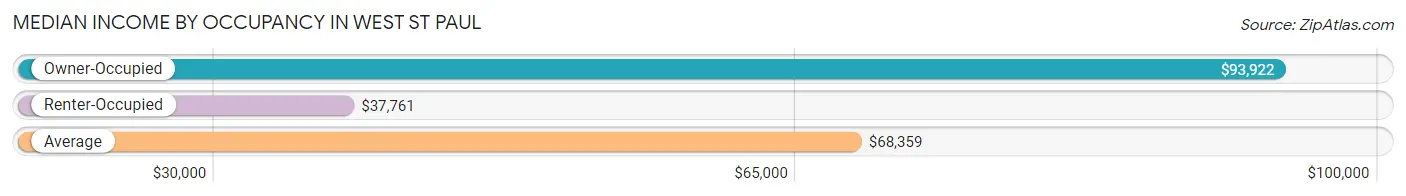
| Occupancy Type | # Households | Median Income |
| Owner-Occupied | 5,713 (61.4%) | $93,922 |
| Renter-Occupied | 3,589 (38.6%) | $37,761 |
| Average | 9,302 (100.0%) | $68,359 |
Occupancy by Householder Income Bracket in West St Paul
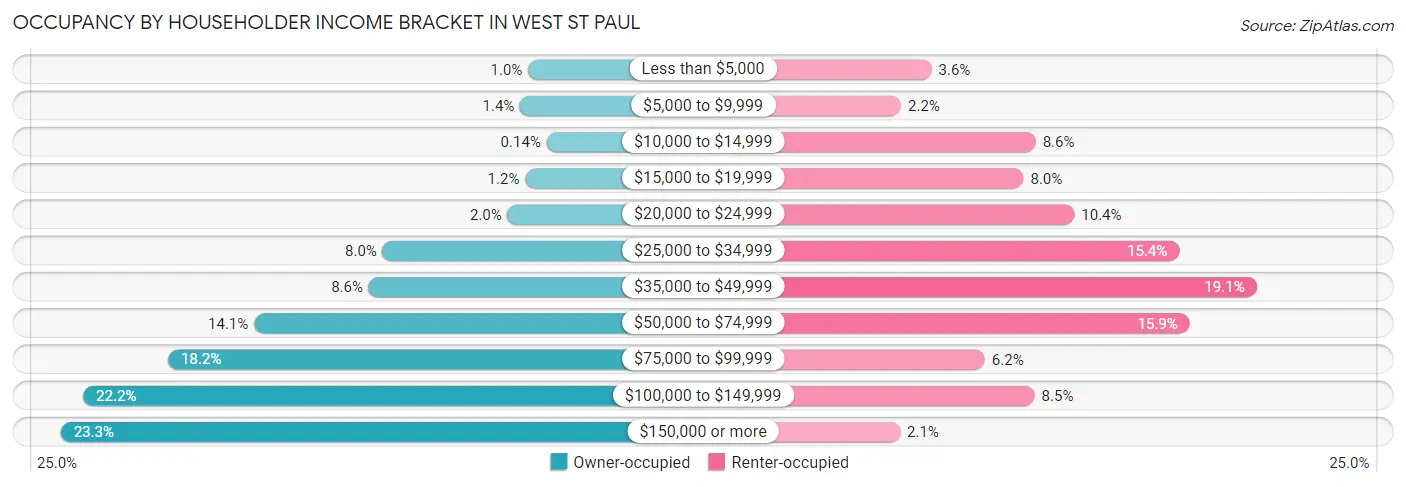
| Income Bracket | Owner-occupied | Renter-occupied |
| Less than $5,000 | 58 (1.0%) | 130 (3.6%) |
| $5,000 to $9,999 | 80 (1.4%) | 78 (2.2%) |
| $10,000 to $14,999 | 8 (0.1%) | 308 (8.6%) |
| $15,000 to $19,999 | 66 (1.2%) | 287 (8.0%) |
| $20,000 to $24,999 | 114 (2.0%) | 374 (10.4%) |
| $25,000 to $34,999 | 454 (8.0%) | 553 (15.4%) |
| $35,000 to $49,999 | 492 (8.6%) | 685 (19.1%) |
| $50,000 to $74,999 | 804 (14.1%) | 571 (15.9%) |
| $75,000 to $99,999 | 1,038 (18.2%) | 221 (6.2%) |
| $100,000 to $149,999 | 1,269 (22.2%) | 306 (8.5%) |
| $150,000 or more | 1,330 (23.3%) | 76 (2.1%) |
| Total | 5,713 (100.0%) | 3,589 (100.0%) |
Monthly Housing Cost Tiers in West St Paul
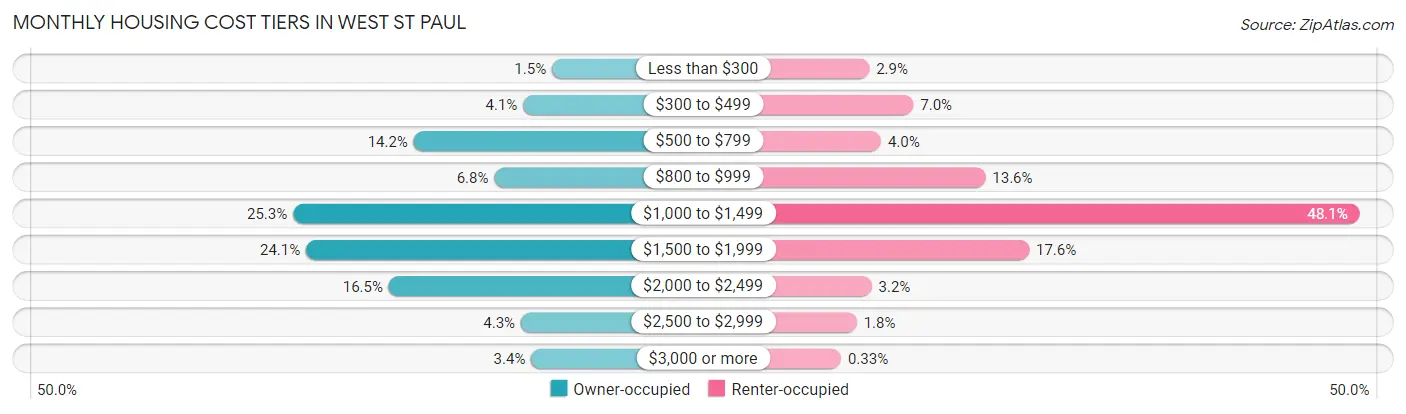
| Monthly Cost | Owner-occupied | Renter-occupied |
| Less than $300 | 83 (1.5%) | 105 (2.9%) |
| $300 to $499 | 234 (4.1%) | 251 (7.0%) |
| $500 to $799 | 810 (14.2%) | 144 (4.0%) |
| $800 to $999 | 386 (6.8%) | 489 (13.6%) |
| $1,000 to $1,499 | 1,445 (25.3%) | 1,725 (48.1%) |
| $1,500 to $1,999 | 1,376 (24.1%) | 633 (17.6%) |
| $2,000 to $2,499 | 941 (16.5%) | 113 (3.2%) |
| $2,500 to $2,999 | 246 (4.3%) | 64 (1.8%) |
| $3,000 or more | 192 (3.4%) | 12 (0.3%) |
| Total | 5,713 (100.0%) | 3,589 (100.0%) |
Physical Housing Characteristics in West St Paul
Housing Structures in West St Paul

| Structure Type | # Housing Units | % Housing Units |
| Single Unit, Detached | 4,919 | 52.9% |
| Single Unit, Attached | 586 | 6.3% |
| 2 Unit Apartments | 107 | 1.1% |
| 3 or 4 Unit Apartments | 241 | 2.6% |
| 5 to 9 Unit Apartments | 139 | 1.5% |
| 10 or more Apartments | 3,310 | 35.6% |
| Mobile Home / Other | 0 | 0.0% |
| Total | 9,302 | 100.0% |
Housing Structures by Occupancy in West St Paul
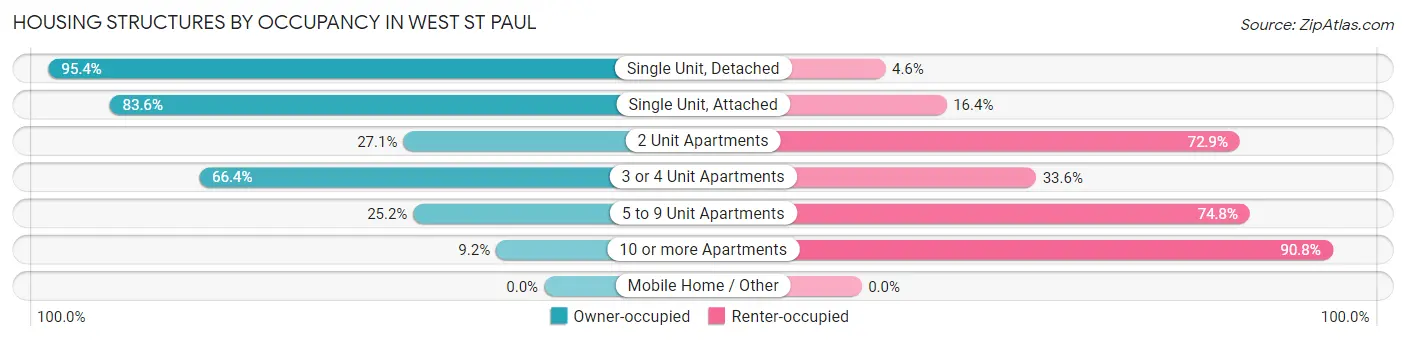
| Structure Type | Owner-occupied | Renter-occupied |
| Single Unit, Detached | 4,693 (95.4%) | 226 (4.6%) |
| Single Unit, Attached | 490 (83.6%) | 96 (16.4%) |
| 2 Unit Apartments | 29 (27.1%) | 78 (72.9%) |
| 3 or 4 Unit Apartments | 160 (66.4%) | 81 (33.6%) |
| 5 to 9 Unit Apartments | 35 (25.2%) | 104 (74.8%) |
| 10 or more Apartments | 306 (9.2%) | 3,004 (90.8%) |
| Mobile Home / Other | 0 (0.0%) | 0 (0.0%) |
| Total | 5,713 (61.4%) | 3,589 (38.6%) |
Housing Structures by Number of Rooms in West St Paul
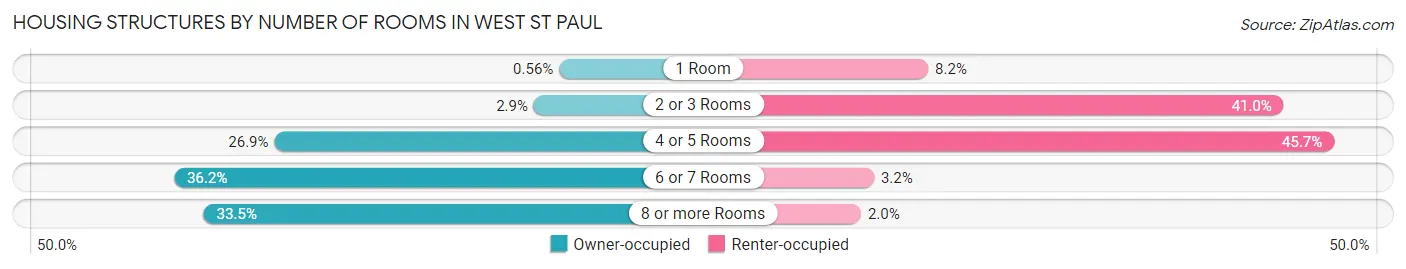
| Number of Rooms | Owner-occupied | Renter-occupied |
| 1 Room | 32 (0.6%) | 293 (8.2%) |
| 2 or 3 Rooms | 166 (2.9%) | 1,473 (41.0%) |
| 4 or 5 Rooms | 1,537 (26.9%) | 1,640 (45.7%) |
| 6 or 7 Rooms | 2,067 (36.2%) | 113 (3.2%) |
| 8 or more Rooms | 1,911 (33.5%) | 70 (1.9%) |
| Total | 5,713 (100.0%) | 3,589 (100.0%) |
Housing Structure by Heating Type in West St Paul
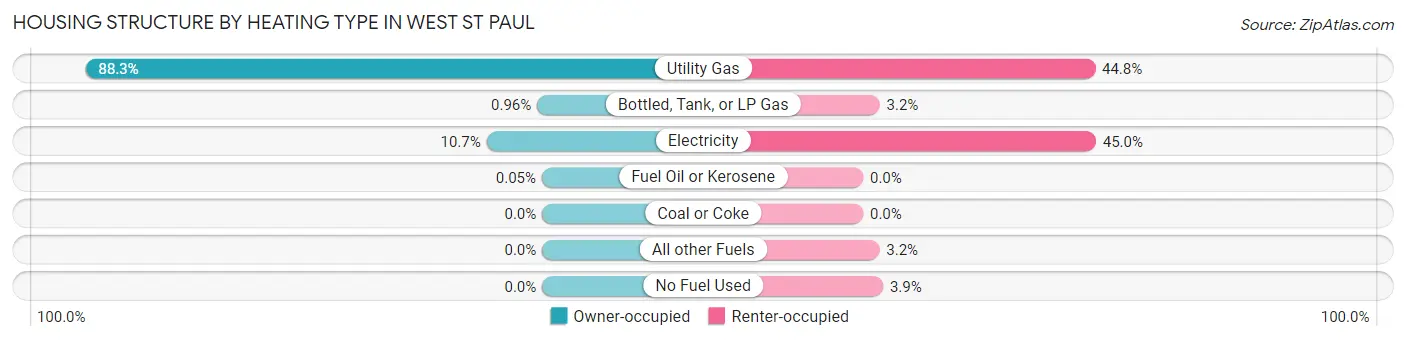
| Heating Type | Owner-occupied | Renter-occupied |
| Utility Gas | 5,042 (88.2%) | 1,609 (44.8%) |
| Bottled, Tank, or LP Gas | 55 (1.0%) | 115 (3.2%) |
| Electricity | 613 (10.7%) | 1,614 (45.0%) |
| Fuel Oil or Kerosene | 3 (0.1%) | 0 (0.0%) |
| Coal or Coke | 0 (0.0%) | 0 (0.0%) |
| All other Fuels | 0 (0.0%) | 113 (3.2%) |
| No Fuel Used | 0 (0.0%) | 138 (3.8%) |
| Total | 5,713 (100.0%) | 3,589 (100.0%) |
Household Vehicle Usage in West St Paul
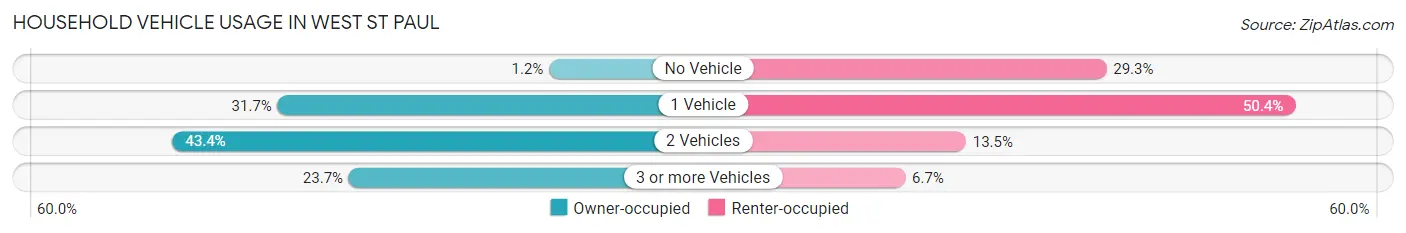
| Vehicles per Household | Owner-occupied | Renter-occupied |
| No Vehicle | 71 (1.2%) | 1,051 (29.3%) |
| 1 Vehicle | 1,808 (31.7%) | 1,810 (50.4%) |
| 2 Vehicles | 2,482 (43.4%) | 486 (13.5%) |
| 3 or more Vehicles | 1,352 (23.7%) | 242 (6.7%) |
| Total | 5,713 (100.0%) | 3,589 (100.0%) |
Real Estate & Mortgages in West St Paul
Real Estate and Mortgage Overview in West St Paul
| Characteristic | Without Mortgage | With Mortgage |
| Housing Units | 1,508 | 4,205 |
| Median Property Value | $276,300 | $267,600 |
| Median Household Income | $74,148 | $1,106 |
| Monthly Housing Costs | $651 | $192 |
| Real Estate Taxes | $3,229 | $49 |
Property Value by Mortgage Status in West St Paul
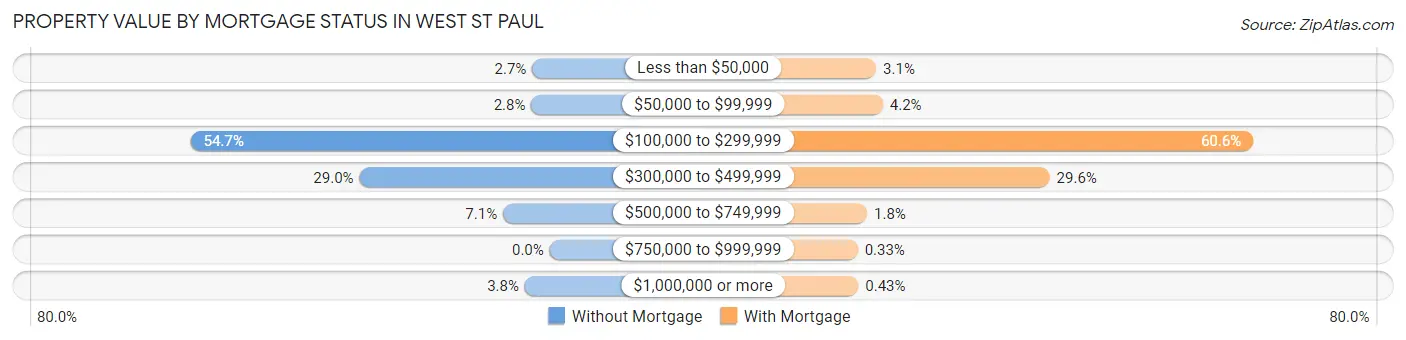
| Property Value | Without Mortgage | With Mortgage |
| Less than $50,000 | 40 (2.6%) | 132 (3.1%) |
| $50,000 to $99,999 | 42 (2.8%) | 175 (4.2%) |
| $100,000 to $299,999 | 825 (54.7%) | 2,548 (60.6%) |
| $300,000 to $499,999 | 437 (29.0%) | 1,244 (29.6%) |
| $500,000 to $749,999 | 107 (7.1%) | 74 (1.8%) |
| $750,000 to $999,999 | 0 (0.0%) | 14 (0.3%) |
| $1,000,000 or more | 57 (3.8%) | 18 (0.4%) |
| Total | 1,508 (100.0%) | 4,205 (100.0%) |
Household Income by Mortgage Status in West St Paul
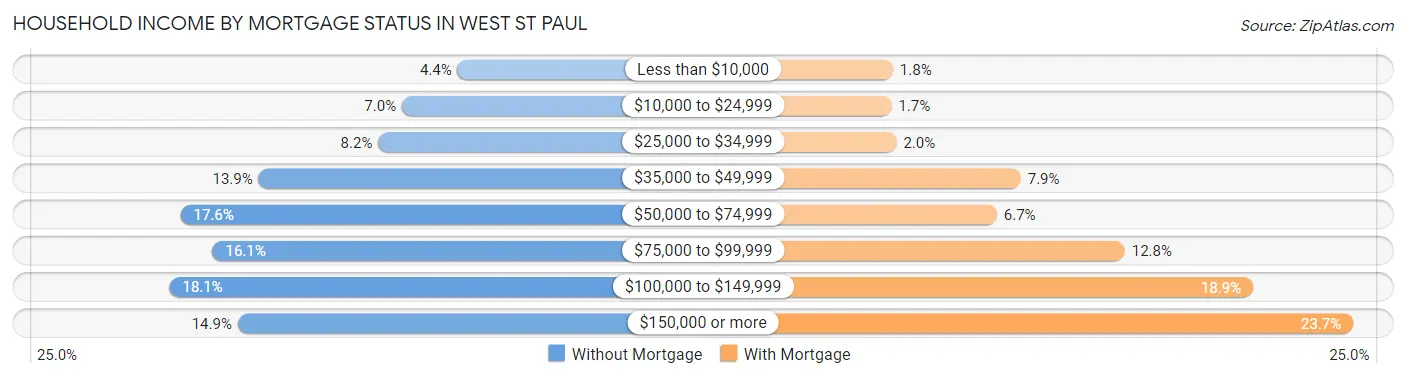
| Household Income | Without Mortgage | With Mortgage |
| Less than $10,000 | 66 (4.4%) | 75 (1.8%) |
| $10,000 to $24,999 | 106 (7.0%) | 72 (1.7%) |
| $25,000 to $34,999 | 123 (8.2%) | 82 (1.9%) |
| $35,000 to $49,999 | 209 (13.9%) | 331 (7.9%) |
| $50,000 to $74,999 | 265 (17.6%) | 283 (6.7%) |
| $75,000 to $99,999 | 242 (16.1%) | 539 (12.8%) |
| $100,000 to $149,999 | 273 (18.1%) | 796 (18.9%) |
| $150,000 or more | 224 (14.8%) | 996 (23.7%) |
| Total | 1,508 (100.0%) | 4,205 (100.0%) |
Property Value to Household Income Ratio in West St Paul
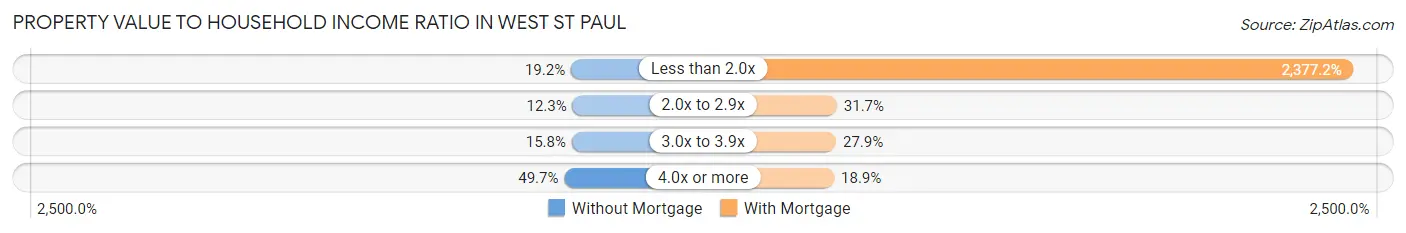
| Value-to-Income Ratio | Without Mortgage | With Mortgage |
| Less than 2.0x | 290 (19.2%) | 99,961 (2,377.2%) |
| 2.0x to 2.9x | 185 (12.3%) | 1,331 (31.7%) |
| 3.0x to 3.9x | 238 (15.8%) | 1,174 (27.9%) |
| 4.0x or more | 750 (49.7%) | 795 (18.9%) |
| Total | 1,508 (100.0%) | 4,205 (100.0%) |
Real Estate Taxes by Mortgage Status in West St Paul
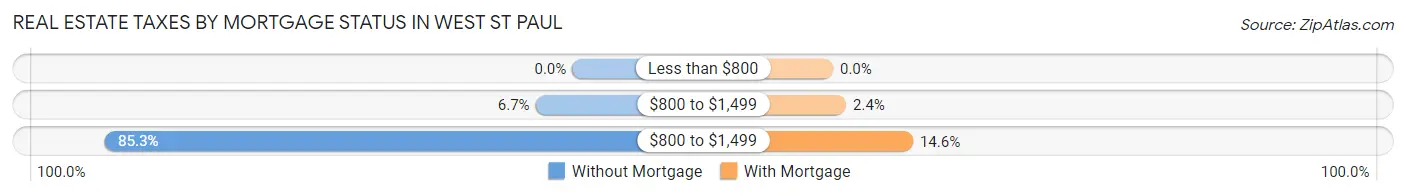
| Property Taxes | Without Mortgage | With Mortgage |
| Less than $800 | 0 (0.0%) | 0 (0.0%) |
| $800 to $1,499 | 101 (6.7%) | 100 (2.4%) |
| $800 to $1,499 | 1,286 (85.3%) | 614 (14.6%) |
| Total | 1,508 (100.0%) | 4,205 (100.0%) |
Health & Disability in West St Paul
Health Insurance Coverage by Age in West St Paul
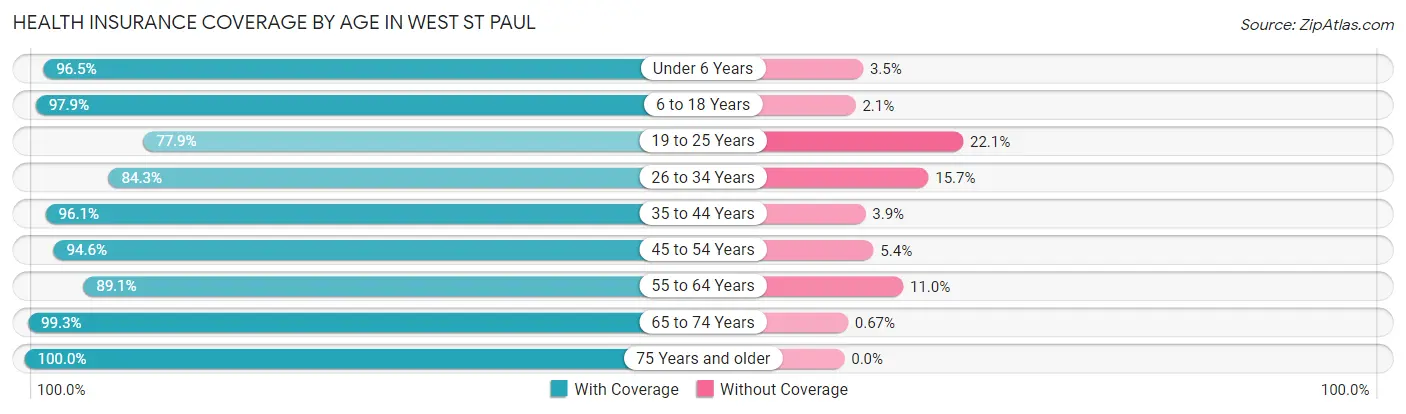
| Age Bracket | With Coverage | Without Coverage |
| Under 6 Years | 1,358 (96.5%) | 49 (3.5%) |
| 6 to 18 Years | 2,780 (97.9%) | 59 (2.1%) |
| 19 to 25 Years | 1,519 (77.9%) | 432 (22.1%) |
| 26 to 34 Years | 2,417 (84.3%) | 449 (15.7%) |
| 35 to 44 Years | 2,686 (96.1%) | 110 (3.9%) |
| 45 to 54 Years | 2,298 (94.6%) | 132 (5.4%) |
| 55 to 64 Years | 2,001 (89.0%) | 246 (11.0%) |
| 65 to 74 Years | 2,387 (99.3%) | 16 (0.7%) |
| 75 Years and older | 1,638 (100.0%) | 0 (0.0%) |
| Total | 19,084 (92.7%) | 1,493 (7.3%) |
Health Insurance Coverage by Citizenship Status in West St Paul
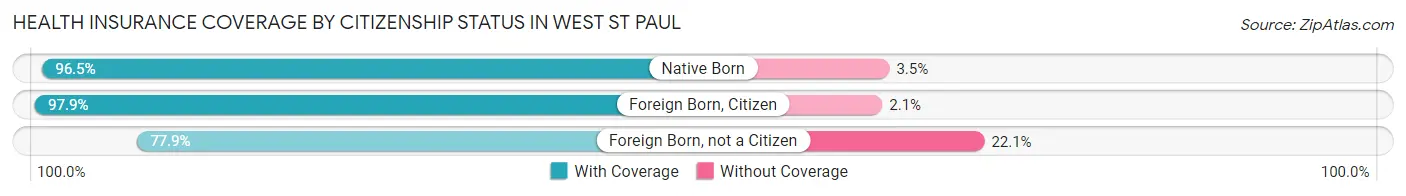
| Citizenship Status | With Coverage | Without Coverage |
| Native Born | 1,358 (96.5%) | 49 (3.5%) |
| Foreign Born, Citizen | 2,780 (97.9%) | 59 (2.1%) |
| Foreign Born, not a Citizen | 1,519 (77.9%) | 432 (22.1%) |
Health Insurance Coverage by Household Income in West St Paul
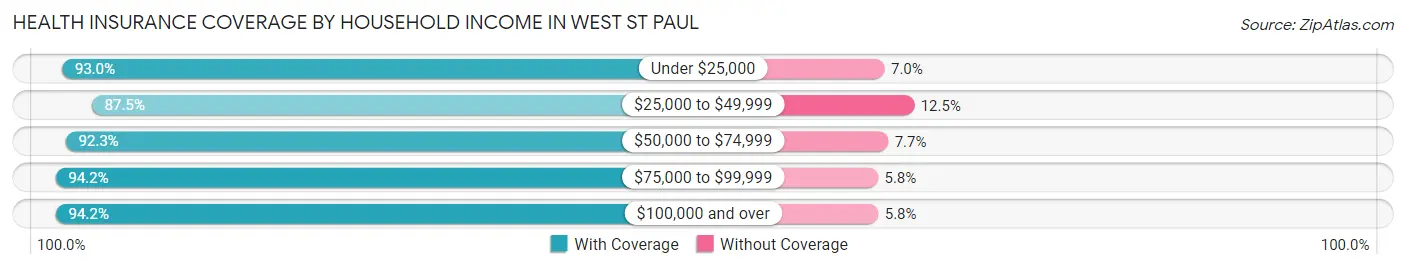
| Household Income | With Coverage | Without Coverage |
| Under $25,000 | 1,931 (93.0%) | 145 (7.0%) |
| $25,000 to $49,999 | 3,068 (87.5%) | 440 (12.5%) |
| $50,000 to $74,999 | 2,277 (92.3%) | 189 (7.7%) |
| $75,000 to $99,999 | 3,010 (94.2%) | 184 (5.8%) |
| $100,000 and over | 8,685 (94.2%) | 535 (5.8%) |
Public vs Private Health Insurance Coverage by Age in West St Paul
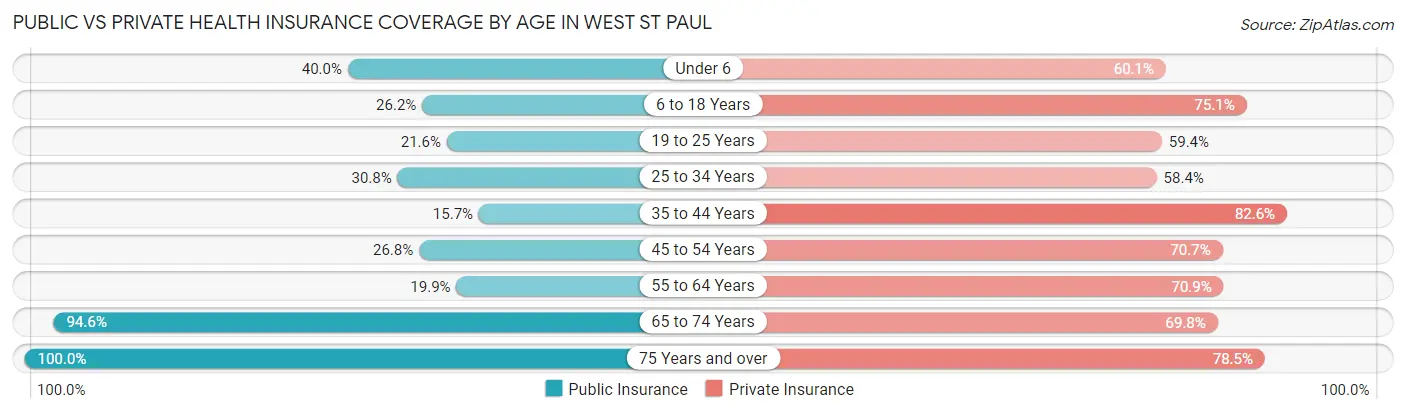
| Age Bracket | Public Insurance | Private Insurance |
| Under 6 | 563 (40.0%) | 846 (60.1%) |
| 6 to 18 Years | 744 (26.2%) | 2,133 (75.1%) |
| 19 to 25 Years | 422 (21.6%) | 1,159 (59.4%) |
| 25 to 34 Years | 882 (30.8%) | 1,675 (58.4%) |
| 35 to 44 Years | 438 (15.7%) | 2,310 (82.6%) |
| 45 to 54 Years | 651 (26.8%) | 1,717 (70.7%) |
| 55 to 64 Years | 446 (19.9%) | 1,592 (70.9%) |
| 65 to 74 Years | 2,274 (94.6%) | 1,676 (69.8%) |
| 75 Years and over | 1,638 (100.0%) | 1,286 (78.5%) |
| Total | 8,058 (39.2%) | 14,394 (70.0%) |
Disability Status by Sex by Age in West St Paul
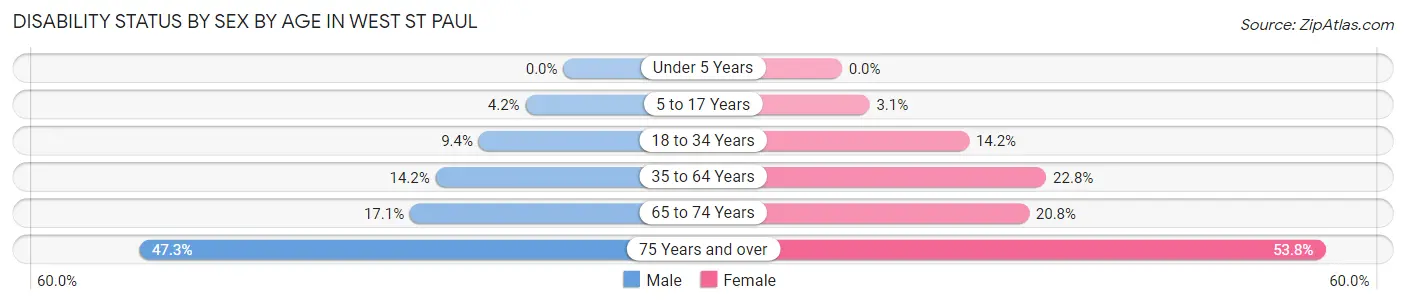
| Age Bracket | Male | Female |
| Under 5 Years | 0 (0.0%) | 0 (0.0%) |
| 5 to 17 Years | 57 (4.2%) | 40 (3.1%) |
| 18 to 34 Years | 237 (9.4%) | 375 (14.2%) |
| 35 to 64 Years | 503 (14.2%) | 896 (22.8%) |
| 65 to 74 Years | 180 (17.1%) | 281 (20.8%) |
| 75 Years and over | 207 (47.3%) | 646 (53.8%) |
Disability Class by Sex by Age in West St Paul
Disability Class: Hearing Difficulty
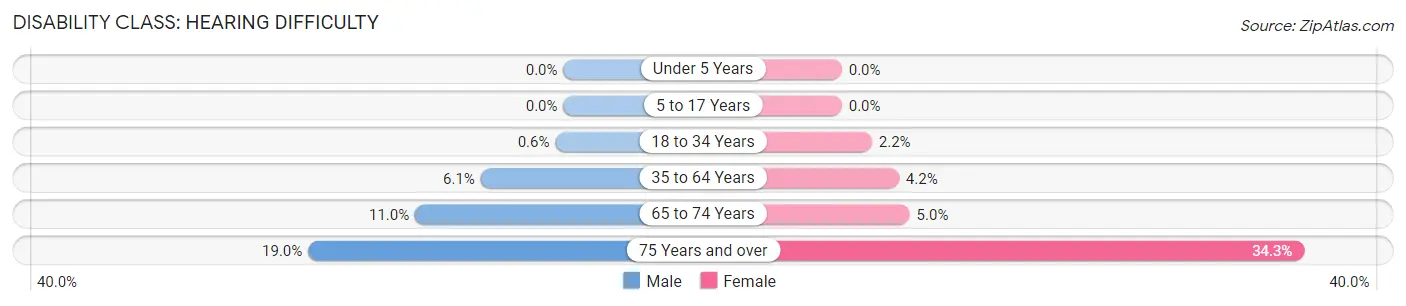
| Age Bracket | Male | Female |
| Under 5 Years | 0 (0.0%) | 0 (0.0%) |
| 5 to 17 Years | 0 (0.0%) | 0 (0.0%) |
| 18 to 34 Years | 15 (0.6%) | 59 (2.2%) |
| 35 to 64 Years | 217 (6.1%) | 167 (4.2%) |
| 65 to 74 Years | 116 (11.0%) | 68 (5.0%) |
| 75 Years and over | 83 (19.0%) | 412 (34.3%) |
Disability Class: Vision Difficulty
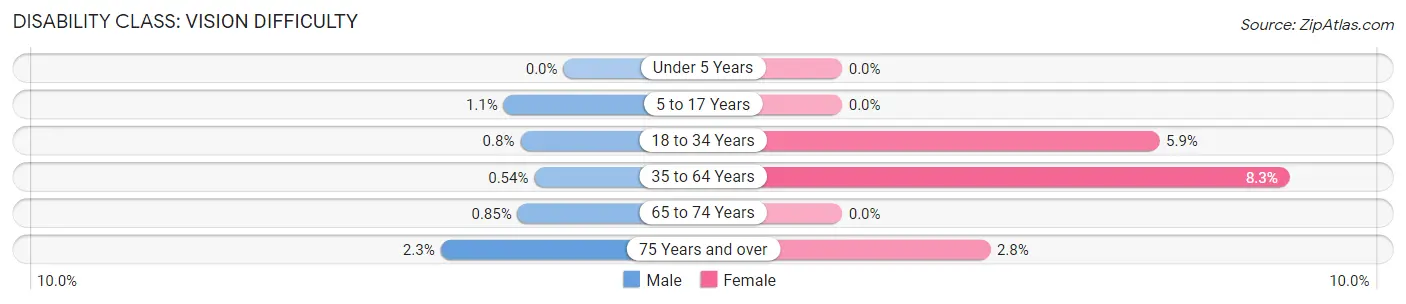
| Age Bracket | Male | Female |
| Under 5 Years | 0 (0.0%) | 0 (0.0%) |
| 5 to 17 Years | 15 (1.1%) | 0 (0.0%) |
| 18 to 34 Years | 20 (0.8%) | 156 (5.9%) |
| 35 to 64 Years | 19 (0.5%) | 327 (8.3%) |
| 65 to 74 Years | 9 (0.9%) | 0 (0.0%) |
| 75 Years and over | 10 (2.3%) | 33 (2.8%) |
Disability Class: Cognitive Difficulty
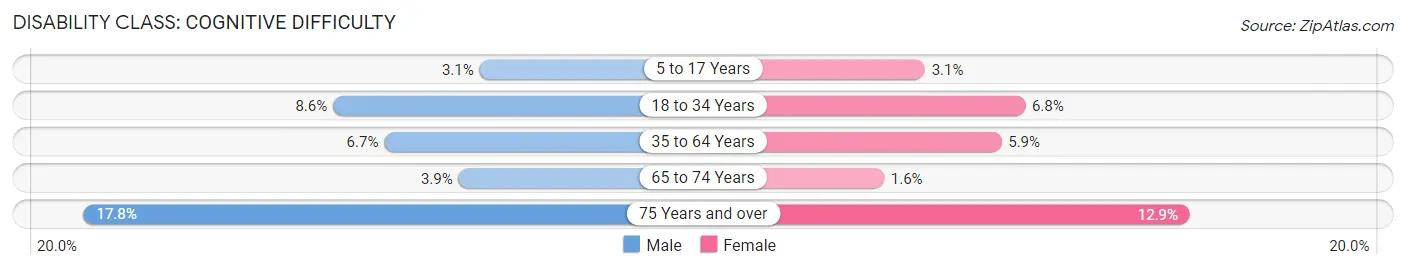
| Age Bracket | Male | Female |
| 5 to 17 Years | 42 (3.1%) | 40 (3.1%) |
| 18 to 34 Years | 215 (8.6%) | 180 (6.8%) |
| 35 to 64 Years | 235 (6.7%) | 233 (5.9%) |
| 65 to 74 Years | 41 (3.9%) | 21 (1.6%) |
| 75 Years and over | 78 (17.8%) | 155 (12.9%) |
Disability Class: Ambulatory Difficulty
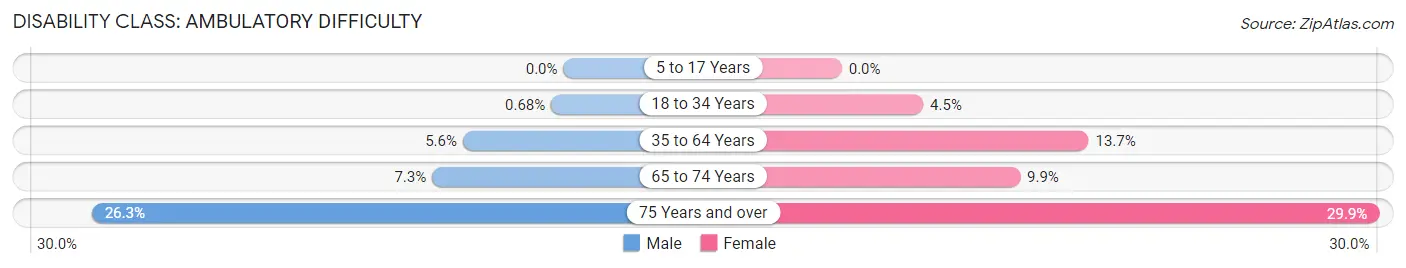
| Age Bracket | Male | Female |
| 5 to 17 Years | 0 (0.0%) | 0 (0.0%) |
| 18 to 34 Years | 17 (0.7%) | 120 (4.5%) |
| 35 to 64 Years | 198 (5.6%) | 541 (13.7%) |
| 65 to 74 Years | 77 (7.3%) | 134 (9.9%) |
| 75 Years and over | 115 (26.3%) | 359 (29.9%) |
Disability Class: Self-Care Difficulty
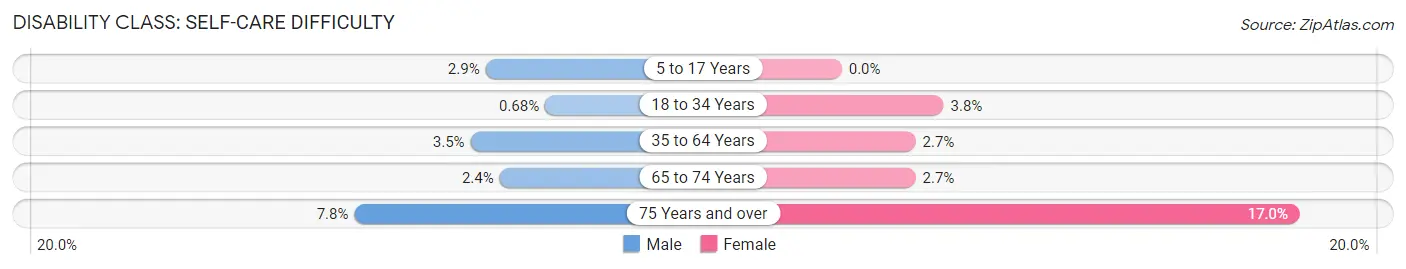
| Age Bracket | Male | Female |
| 5 to 17 Years | 39 (2.9%) | 0 (0.0%) |
| 18 to 34 Years | 17 (0.7%) | 100 (3.8%) |
| 35 to 64 Years | 122 (3.5%) | 108 (2.7%) |
| 65 to 74 Years | 25 (2.4%) | 37 (2.7%) |
| 75 Years and over | 34 (7.8%) | 204 (17.0%) |
Technology Access in West St Paul
Computing Device Access in West St Paul
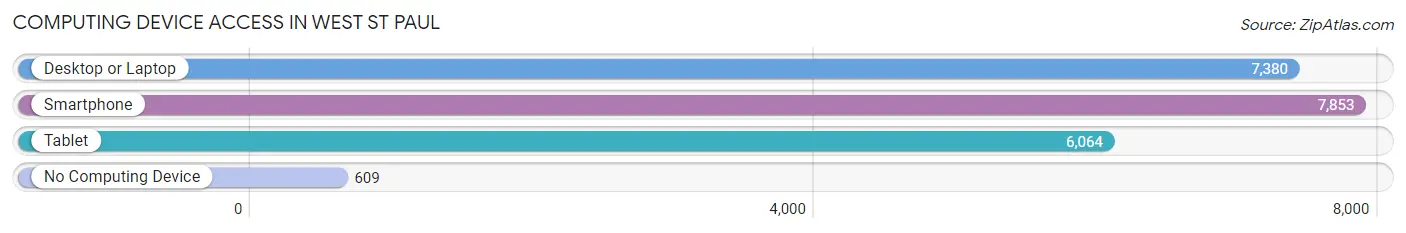
| Device Type | # Households | % Households |
| Desktop or Laptop | 7,380 | 79.3% |
| Smartphone | 7,853 | 84.4% |
| Tablet | 6,064 | 65.2% |
| No Computing Device | 609 | 6.6% |
| Total | 9,302 | 100.0% |
Internet Access in West St Paul
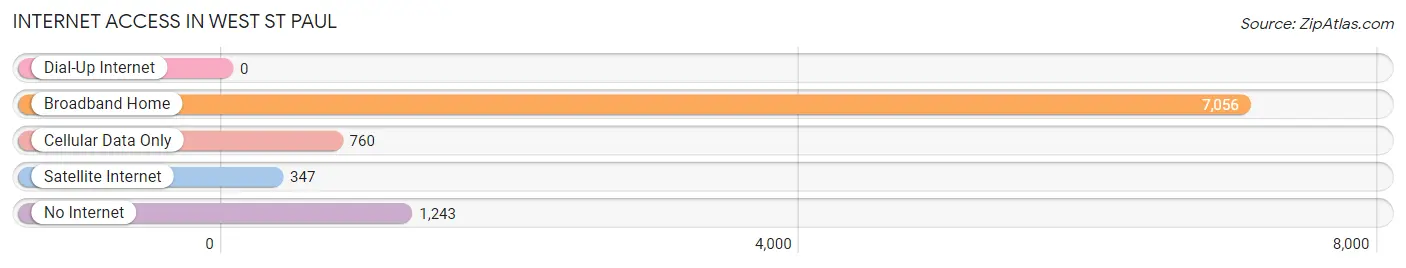
| Internet Type | # Households | % Households |
| Dial-Up Internet | 0 | 0.0% |
| Broadband Home | 7,056 | 75.8% |
| Cellular Data Only | 760 | 8.2% |
| Satellite Internet | 347 | 3.7% |
| No Internet | 1,243 | 13.4% |
| Total | 9,302 | 100.0% |
West St Paul Summary
West St Paul, Minnesota is a small city located in the Twin Cities metropolitan area of Minnesota. It is located in Dakota County and is bordered by the cities of South St Paul, Mendota Heights, and Inver Grove Heights. The city has a population of 19,540 as of the 2020 census.
History
West St Paul was first settled in 1849 by a group of settlers from St Paul. The area was originally known as the "West Side" and was part of the original St Paul Township. In 1858, the area was incorporated as the Village of West St Paul. The village was annexed by the City of St Paul in 1872, but was re-incorporated as an independent city in 1889.
The city was originally a farming community, but in the early 20th century, it began to develop into a residential suburb of St Paul. The city experienced a period of rapid growth in the 1950s and 1960s, as the population increased from 4,000 to over 20,000.
Geography
West St Paul is located in the southeastern corner of Dakota County, Minnesota. It is bordered by the cities of South St Paul, Mendota Heights, and Inver Grove Heights. The city is located on the Mississippi River, and is approximately 10 miles south of downtown St Paul.
The city has a total area of 4.2 square miles, of which 4.1 square miles is land and 0.1 square miles is water. The city is located in the St Paul-Minneapolis metropolitan area, and is part of the Twin Cities region.
Economy
West St Paul is primarily a residential community, but it does have a few businesses and industries. The city is home to several large employers, including the 3M Company, the Minnesota Department of Transportation, and the Minnesota Department of Human Services.
The city also has a number of small businesses, including restaurants, retail stores, and professional services. The city is also home to several parks and recreational facilities, including the West St Paul Sports Complex and the West St Paul Golf Course.
Demographics
As of the 2020 census, West St Paul had a population of 19,540. The racial makeup of the city was 79.2% White, 8.3% African American, 0.3% Native American, 5.2% Asian, 0.1% Pacific Islander, 4.2% from other races, and 2.9% from two or more races. Hispanic or Latino of any race were 8.7% of the population.
The median household income in West St Paul was $60,945 in 2019, and the median family income was $71,945. The per capita income for the city was $30,945. About 8.2% of the population was below the poverty line.
West St Paul is served by the West St Paul-Mendota Heights-Eagan School District. The city is also home to several private schools, including St. Thomas Academy and St. Croix Lutheran High School.
Common Questions
What is Per Capita Income in West St Paul?
Per Capita income in West St Paul is $40,563.
What is the Median Family Income in West St Paul?
Median Family Income in West St Paul is $93,947.
What is the Median Household income in West St Paul?
Median Household Income in West St Paul is $68,359.
What is Income or Wage Gap in West St Paul?
Income or Wage Gap in West St Paul is 38.5%.
Women in West St Paul earn 61.5 cents for every dollar earned by a man.
What is Family Income Deficit in West St Paul?
Family Income Deficit in West St Paul is $12,917.
Families that are below poverty line in West St Paul earn $12,917 less on average than the poverty threshold level.
What is Inequality or Gini Index in West St Paul?
Inequality or Gini Index in West St Paul is 0.44.
What is the Total Population of West St Paul?
Total Population of West St Paul is 20,820.
What is the Total Male Population of West St Paul?
Total Male Population of West St Paul is 9,598.
What is the Total Female Population of West St Paul?
Total Female Population of West St Paul is 11,222.
What is the Ratio of Males per 100 Females in West St Paul?
There are 85.53 Males per 100 Females in West St Paul.
What is the Ratio of Females per 100 Males in West St Paul?
There are 116.92 Females per 100 Males in West St Paul.
What is the Median Population Age in West St Paul?
Median Population Age in West St Paul is 38.9 Years.
What is the Average Family Size in West St Paul
Average Family Size in West St Paul is 3.0 People.
What is the Average Household Size in West St Paul
Average Household Size in West St Paul is 2.2 People.
How Large is the Labor Force in West St Paul?
There are 11,506 People in the Labor Forcein in West St Paul.
What is the Percentage of People in the Labor Force in West St Paul?
66.5% of People are in the Labor Force in West St Paul.
What is the Unemployment Rate in West St Paul?
Unemployment Rate in West St Paul is 5.0%.