Golden Valley, MN Map & Demographics
Golden Valley Map
Golden Valley Overview
$62,819
PER CAPITA INCOME
$145,617
AVG FAMILY INCOME
$110,026
AVG HOUSEHOLD INCOME
26.9%
WAGE / INCOME GAP [ % ]
73.1¢/ $1
WAGE / INCOME GAP [ $ ]
0.45
INEQUALITY / GINI INDEX
22,142
TOTAL POPULATION
10,615
MALE POPULATION
11,527
FEMALE POPULATION
92.09
MALES / 100 FEMALES
108.59
FEMALES / 100 MALES
45.8
MEDIAN AGE
2.8
AVG FAMILY SIZE
2.2
AVG HOUSEHOLD SIZE
12,376
LABOR FORCE [ PEOPLE ]
65.9%
PERCENT IN LABOR FORCE
3.2%
UNEMPLOYMENT RATE
Income in Golden Valley
Income Overview in Golden Valley
Per Capita Income in Golden Valley is $62,819, while median incomes of families and households are $145,617 and $110,026 respectively.
| Characteristic | Number | Measure |
| Per Capita Income | 22,142 | $62,819 |
| Median Family Income | 5,928 | $145,617 |
| Mean Family Income | 5,928 | $177,529 |
| Median Household Income | 9,778 | $110,026 |
| Mean Household Income | 9,778 | $141,436 |
| Income Deficit | 5,928 | $0 |
| Wage / Income Gap (%) | 22,142 | 26.88% |
| Wage / Income Gap ($) | 22,142 | 73.12¢ per $1 |
| Gini / Inequality Index | 22,142 | 0.45 |
Earnings by Sex in Golden Valley
Average Earnings in Golden Valley are $65,595, $74,588 for men and $54,539 for women, a difference of 26.9%.
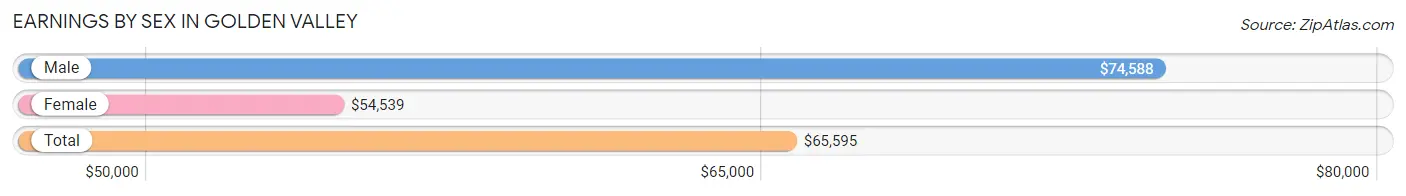
| Sex | Number | Average Earnings |
| Male | 6,298 (48.5%) | $74,588 |
| Female | 6,695 (51.5%) | $54,539 |
| Total | 12,993 (100.0%) | $65,595 |
Earnings by Sex by Income Bracket in Golden Valley
The most common earnings brackets in Golden Valley are $100,000+ for men (2,194 | 34.8%) and $100,000+ for women (1,462 | 21.8%).
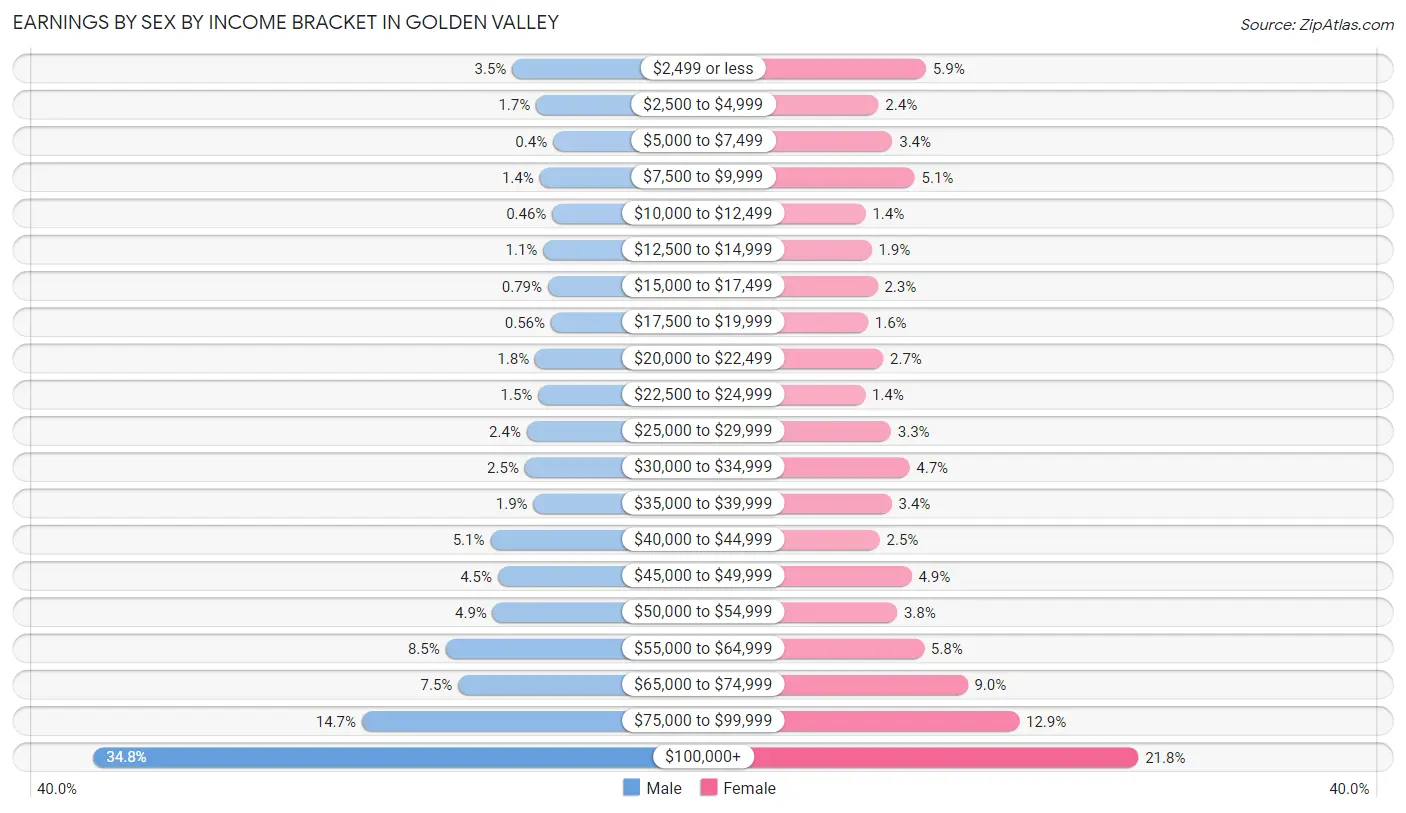
| Income | Male | Female |
| $2,499 or less | 218 (3.5%) | 397 (5.9%) |
| $2,500 to $4,999 | 105 (1.7%) | 159 (2.4%) |
| $5,000 to $7,499 | 25 (0.4%) | 228 (3.4%) |
| $7,500 to $9,999 | 89 (1.4%) | 340 (5.1%) |
| $10,000 to $12,499 | 29 (0.5%) | 94 (1.4%) |
| $12,500 to $14,999 | 72 (1.1%) | 124 (1.8%) |
| $15,000 to $17,499 | 50 (0.8%) | 154 (2.3%) |
| $17,500 to $19,999 | 35 (0.6%) | 106 (1.6%) |
| $20,000 to $22,499 | 110 (1.8%) | 182 (2.7%) |
| $22,500 to $24,999 | 95 (1.5%) | 91 (1.4%) |
| $25,000 to $29,999 | 149 (2.4%) | 221 (3.3%) |
| $30,000 to $34,999 | 159 (2.5%) | 314 (4.7%) |
| $35,000 to $39,999 | 118 (1.9%) | 225 (3.4%) |
| $40,000 to $44,999 | 321 (5.1%) | 165 (2.5%) |
| $45,000 to $49,999 | 286 (4.5%) | 325 (4.9%) |
| $50,000 to $54,999 | 310 (4.9%) | 252 (3.8%) |
| $55,000 to $64,999 | 532 (8.5%) | 387 (5.8%) |
| $65,000 to $74,999 | 473 (7.5%) | 605 (9.0%) |
| $75,000 to $99,999 | 928 (14.7%) | 864 (12.9%) |
| $100,000+ | 2,194 (34.8%) | 1,462 (21.8%) |
| Total | 6,298 (100.0%) | 6,695 (100.0%) |
Earnings by Sex by Educational Attainment in Golden Valley
Average earnings in Golden Valley are $78,413 for men and $64,336 for women, a difference of 17.9%. Men with an educational attainment of graduate degree enjoy the highest average annual earnings of $117,000, while those with high school diploma education earn the least with $44,668. Women with an educational attainment of graduate degree earn the most with the average annual earnings of $90,378, while those with high school diploma education have the smallest earnings of $26,512.
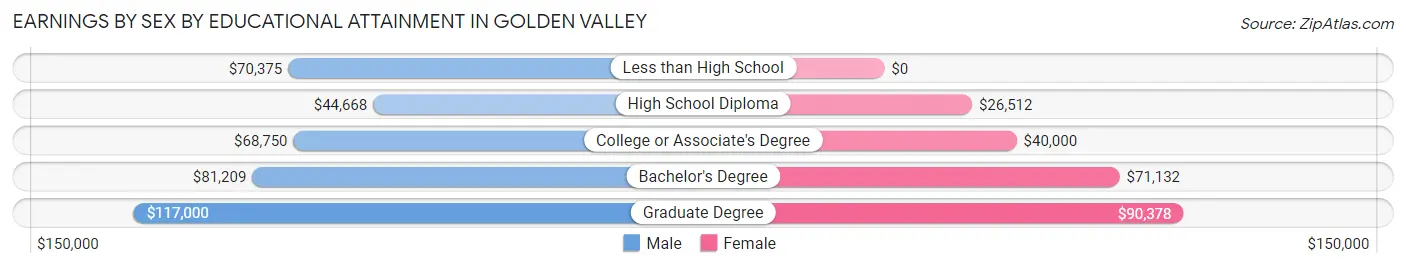
| Educational Attainment | Male Income | Female Income |
| Less than High School | $70,375 | $0 |
| High School Diploma | $44,668 | $26,512 |
| College or Associate's Degree | $68,750 | $40,000 |
| Bachelor's Degree | $81,209 | $71,132 |
| Graduate Degree | $117,000 | $90,378 |
| Total | $78,413 | $64,336 |
Family Income in Golden Valley
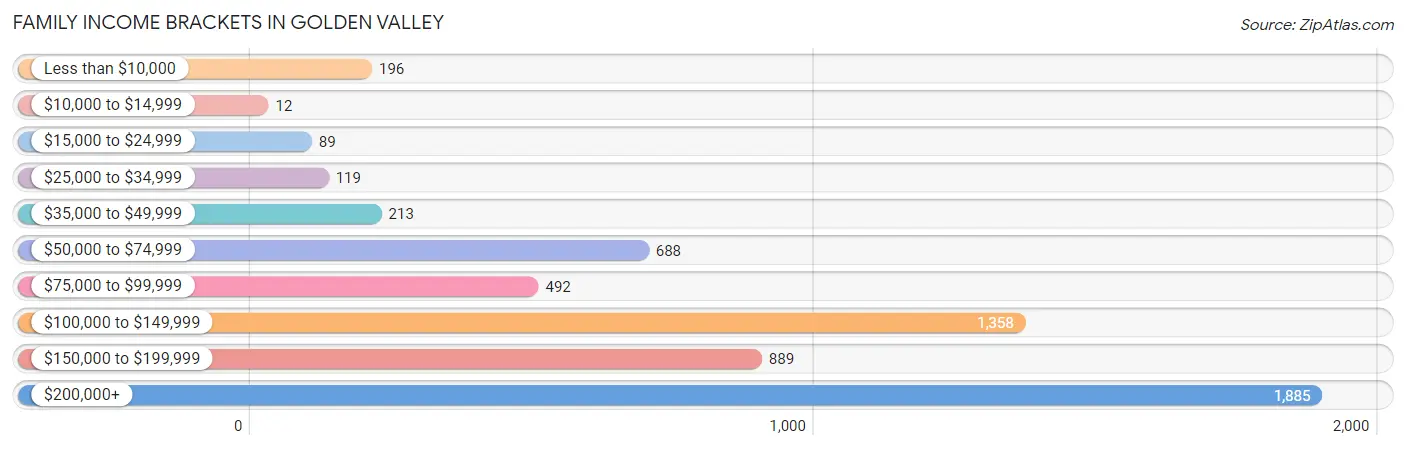
Family Income Brackets in Golden Valley
According to the Golden Valley family income data, there are 1,885 families falling into the $200,000+ income range, which is the most common income bracket and makes up 31.8% of all families. Conversely, the $10,000 to $14,999 income bracket is the least frequent group with only 12 families (0.2%) belonging to this category.
| Income Bracket | # Families | % Families |
| Less than $10,000 | 196 | 3.3% |
| $10,000 to $14,999 | 12 | 0.2% |
| $15,000 to $24,999 | 89 | 1.5% |
| $25,000 to $34,999 | 119 | 2.0% |
| $35,000 to $49,999 | 213 | 3.6% |
| $50,000 to $74,999 | 688 | 11.6% |
| $75,000 to $99,999 | 492 | 8.3% |
| $100,000 to $149,999 | 1,358 | 22.9% |
| $150,000 to $199,999 | 889 | 15.0% |
| $200,000+ | 1,885 | 31.8% |
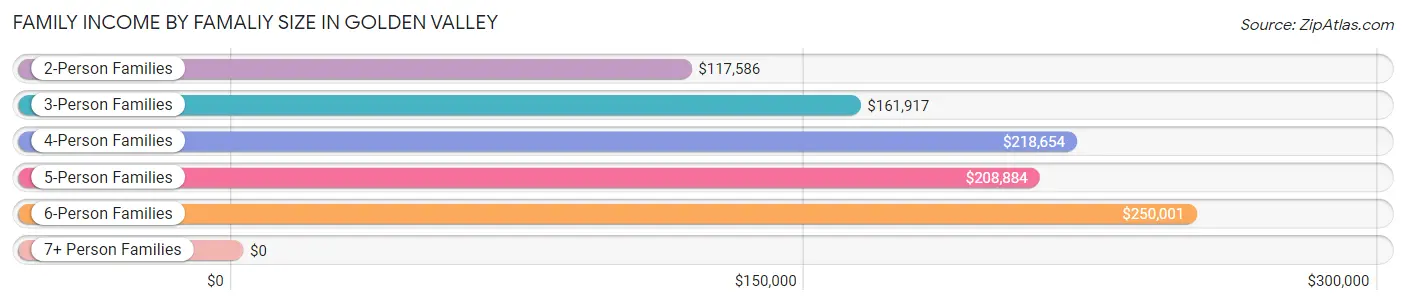
Family Income by Famaliy Size in Golden Valley
6-person families (34 | 0.6%) account for the highest median family income in Golden Valley with $250,001 per family, while 2-person families (3,126 | 52.7%) have the highest median income of $58,793 per family member.
| Income Bracket | # Families | Median Income |
| 2-Person Families | 3,126 (52.7%) | $117,586 |
| 3-Person Families | 1,600 (27.0%) | $161,917 |
| 4-Person Families | 806 (13.6%) | $218,654 |
| 5-Person Families | 285 (4.8%) | $208,884 |
| 6-Person Families | 34 (0.6%) | $250,001 |
| 7+ Person Families | 77 (1.3%) | $0 |
| Total | 5,928 (100.0%) | $145,617 |
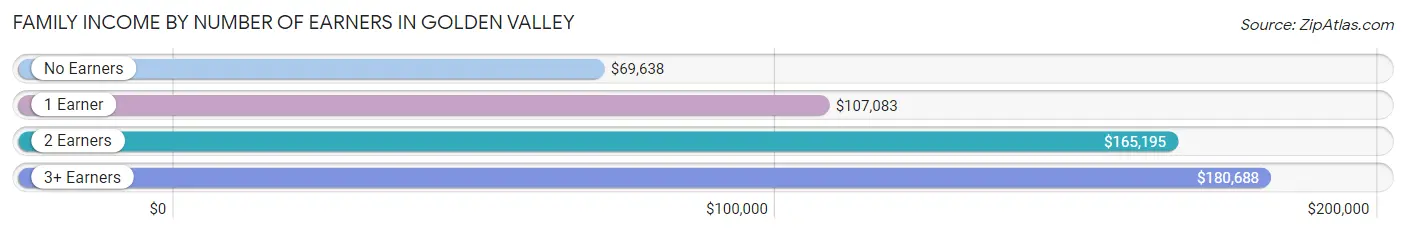
Family Income by Number of Earners in Golden Valley
The median family income in Golden Valley is $145,617, with families comprising 3+ earners (683) having the highest median family income of $180,688, while families with no earners (1,007) have the lowest median family income of $69,638, accounting for 11.5% and 17.0% of families, respectively.
| Number of Earners | # Families | Median Income |
| No Earners | 1,007 (17.0%) | $69,638 |
| 1 Earner | 1,154 (19.5%) | $107,083 |
| 2 Earners | 3,084 (52.0%) | $165,195 |
| 3+ Earners | 683 (11.5%) | $180,688 |
| Total | 5,928 (100.0%) | $145,617 |
Household Income in Golden Valley
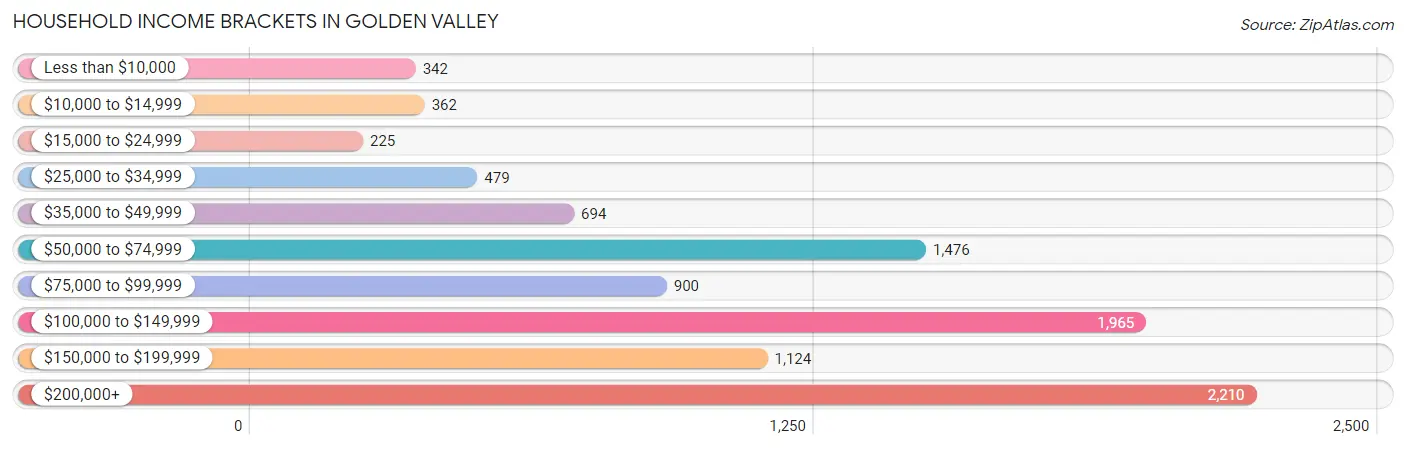
Household Income Brackets in Golden Valley
With 2,210 households falling in the category, the $200,000+ income range is the most frequent in Golden Valley, accounting for 22.6% of all households. In contrast, only 225 households (2.3%) fall into the $15,000 to $24,999 income bracket, making it the least populous group.
| Income Bracket | # Households | % Households |
| Less than $10,000 | 342 | 3.5% |
| $10,000 to $14,999 | 362 | 3.7% |
| $15,000 to $24,999 | 225 | 2.3% |
| $25,000 to $34,999 | 479 | 4.9% |
| $35,000 to $49,999 | 694 | 7.1% |
| $50,000 to $74,999 | 1,476 | 15.1% |
| $75,000 to $99,999 | 900 | 9.2% |
| $100,000 to $149,999 | 1,965 | 20.1% |
| $150,000 to $199,999 | 1,124 | 11.5% |
| $200,000+ | 2,210 | 22.6% |
Household Income by Householder Age in Golden Valley
The median household income in Golden Valley is $110,026, with the highest median household income of $146,641 found in the 25 to 44 years age bracket for the primary householder. A total of 2,937 households (30.0%) fall into this category. Meanwhile, the 65+ years age bracket for the primary householder has the lowest median household income of $65,443, with 2,990 households (30.6%) in this group.
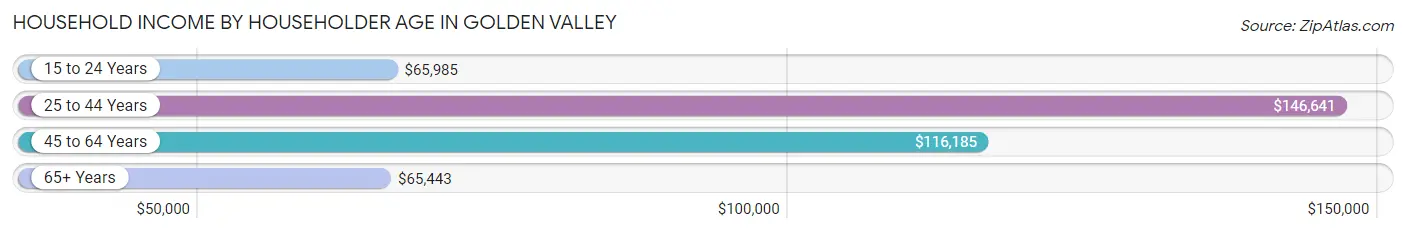
| Income Bracket | # Households | Median Income |
| 15 to 24 Years | 272 (2.8%) | $65,985 |
| 25 to 44 Years | 2,937 (30.0%) | $146,641 |
| 45 to 64 Years | 3,579 (36.6%) | $116,185 |
| 65+ Years | 2,990 (30.6%) | $65,443 |
| Total | 9,778 (100.0%) | $110,026 |
Poverty in Golden Valley
Income Below Poverty by Sex and Age in Golden Valley
With 8.2% poverty level for males and 9.0% for females among the residents of Golden Valley, 5 year old males and 5 year old females are the most vulnerable to poverty, with 108 males (56.8%) and 59 females (72.0%) in their respective age groups living below the poverty level.
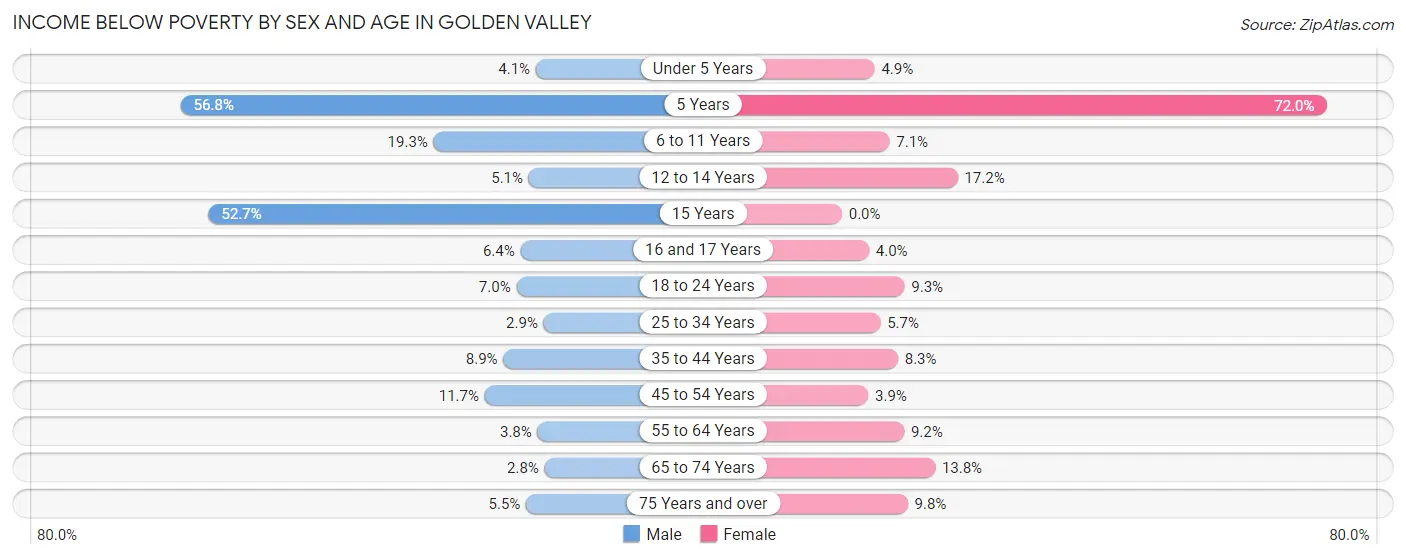
| Age Bracket | Male | Female |
| Under 5 Years | 20 (4.1%) | 24 (4.9%) |
| 5 Years | 108 (56.8%) | 59 (72.0%) |
| 6 to 11 Years | 115 (19.3%) | 36 (7.1%) |
| 12 to 14 Years | 17 (5.1%) | 67 (17.2%) |
| 15 Years | 68 (52.7%) | 0 (0.0%) |
| 16 and 17 Years | 18 (6.4%) | 9 (4.0%) |
| 18 to 24 Years | 30 (7.0%) | 65 (9.3%) |
| 25 to 34 Years | 46 (2.9%) | 74 (5.7%) |
| 35 to 44 Years | 134 (8.9%) | 127 (8.3%) |
| 45 to 54 Years | 152 (11.7%) | 48 (3.9%) |
| 55 to 64 Years | 62 (3.8%) | 194 (9.2%) |
| 65 to 74 Years | 28 (2.8%) | 198 (13.8%) |
| 75 Years and over | 54 (5.5%) | 125 (9.8%) |
| Total | 852 (8.2%) | 1,026 (9.0%) |
Income Above Poverty by Sex and Age in Golden Valley
According to the poverty statistics in Golden Valley, males aged 65 to 74 years and females aged 15 years are the age groups that are most secure financially, with 97.2% of males and 100.0% of females in these age groups living above the poverty line.
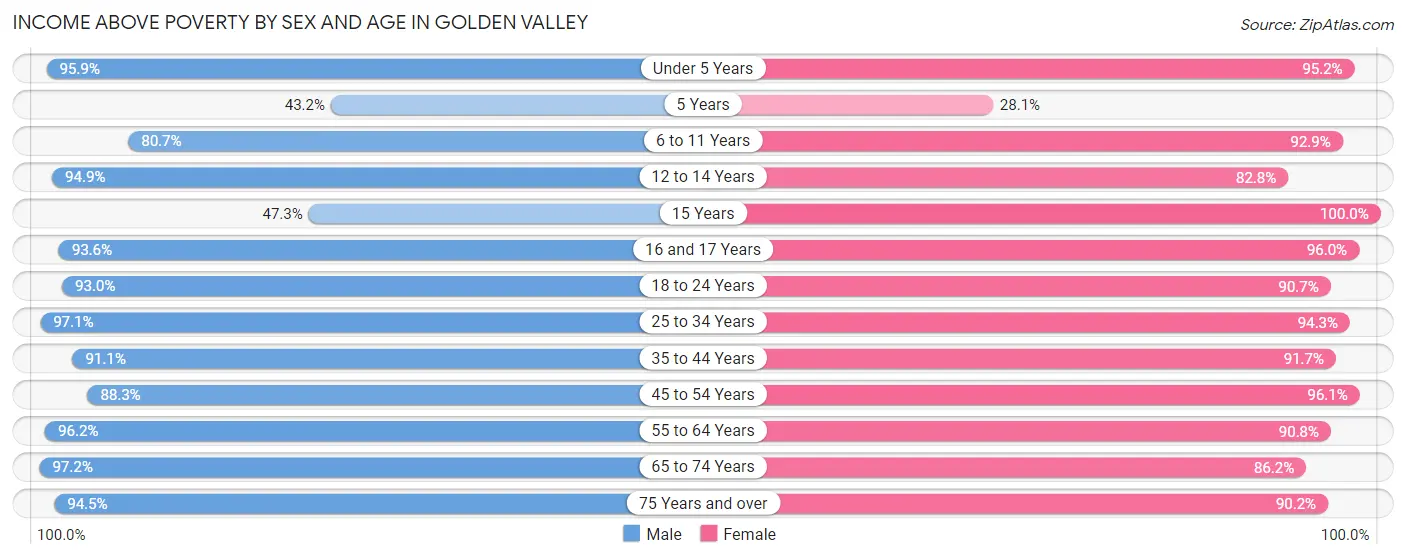
| Age Bracket | Male | Female |
| Under 5 Years | 471 (95.9%) | 471 (95.2%) |
| 5 Years | 82 (43.2%) | 23 (28.1%) |
| 6 to 11 Years | 482 (80.7%) | 474 (92.9%) |
| 12 to 14 Years | 315 (94.9%) | 323 (82.8%) |
| 15 Years | 61 (47.3%) | 92 (100.0%) |
| 16 and 17 Years | 265 (93.6%) | 215 (96.0%) |
| 18 to 24 Years | 401 (93.0%) | 635 (90.7%) |
| 25 to 34 Years | 1,536 (97.1%) | 1,225 (94.3%) |
| 35 to 44 Years | 1,372 (91.1%) | 1,401 (91.7%) |
| 45 to 54 Years | 1,150 (88.3%) | 1,179 (96.1%) |
| 55 to 64 Years | 1,562 (96.2%) | 1,907 (90.8%) |
| 65 to 74 Years | 984 (97.2%) | 1,234 (86.2%) |
| 75 Years and over | 924 (94.5%) | 1,155 (90.2%) |
| Total | 9,605 (91.8%) | 10,334 (91.0%) |
Income Below Poverty Among Married-Couple Families in Golden Valley
The poverty statistics for married-couple families in Golden Valley show that 2.0% or 101 of the total 5,135 families live below the poverty line. Families with 5 or more children have the highest poverty rate of 93.5%, comprising of 72 families. On the other hand, families with 1 or 2 children have the lowest poverty rate of 0.0%, which includes 0 families.
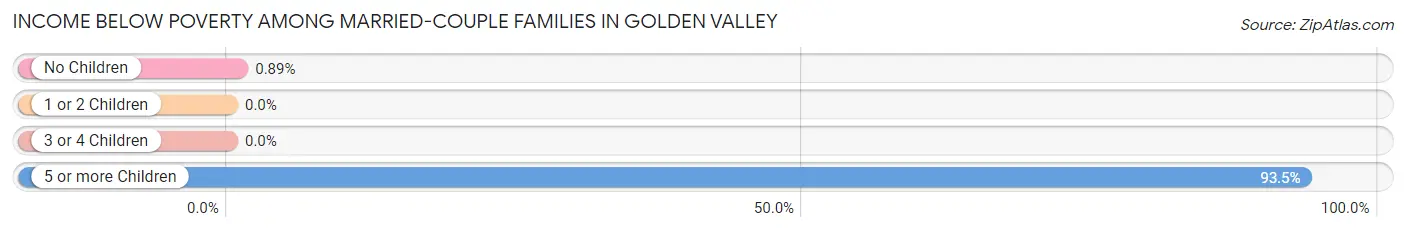
| Children | Above Poverty | Below Poverty |
| No Children | 3,220 (99.1%) | 29 (0.9%) |
| 1 or 2 Children | 1,645 (100.0%) | 0 (0.0%) |
| 3 or 4 Children | 164 (100.0%) | 0 (0.0%) |
| 5 or more Children | 5 (6.5%) | 72 (93.5%) |
| Total | 5,034 (98.0%) | 101 (2.0%) |
Income Below Poverty Among Single-Parent Households in Golden Valley
According to the poverty data in Golden Valley, 31.2% or 39 single-father households and 13.9% or 93 single-mother households are living below the poverty line. Among single-father households, those with no children have the highest poverty rate, with 17 households (47.2%) experiencing poverty. Likewise, among single-mother households, those with 3 or 4 children have the highest poverty rate, with 17 households (37.0%) falling below the poverty line.
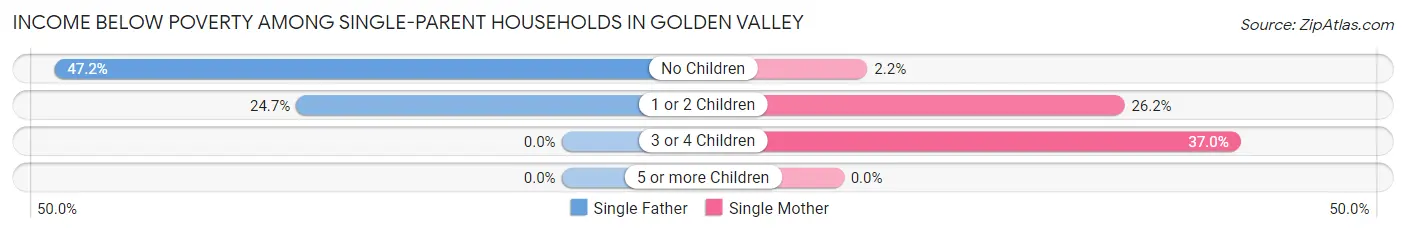
| Children | Single Father | Single Mother |
| No Children | 17 (47.2%) | 8 (2.2%) |
| 1 or 2 Children | 22 (24.7%) | 68 (26.2%) |
| 3 or 4 Children | 0 (0.0%) | 17 (37.0%) |
| 5 or more Children | 0 (0.0%) | 0 (0.0%) |
| Total | 39 (31.2%) | 93 (13.9%) |
Income Below Poverty Among Married-Couple vs Single-Parent Households in Golden Valley
The poverty data for Golden Valley shows that 101 of the married-couple family households (2.0%) and 132 of the single-parent households (16.7%) are living below the poverty level. Within the married-couple family households, those with 5 or more children have the highest poverty rate, with 72 households (93.5%) falling below the poverty line. Among the single-parent households, those with 3 or 4 children have the highest poverty rate, with 17 household (37.0%) living below poverty.
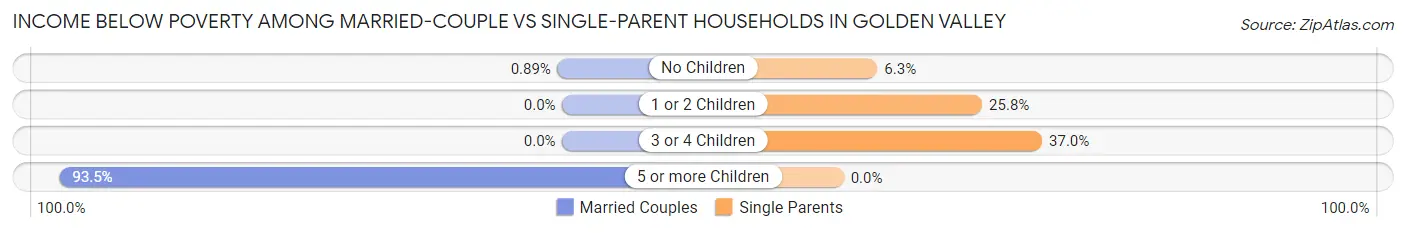
| Children | Married-Couple Families | Single-Parent Households |
| No Children | 29 (0.9%) | 25 (6.3%) |
| 1 or 2 Children | 0 (0.0%) | 90 (25.8%) |
| 3 or 4 Children | 0 (0.0%) | 17 (37.0%) |
| 5 or more Children | 72 (93.5%) | 0 (0.0%) |
| Total | 101 (2.0%) | 132 (16.7%) |
Race in Golden Valley
The most populous races in Golden Valley are White / Caucasian (18,317 | 82.7%), Two or more Races (1,783 | 8.1%), and Black / African American (1,255 | 5.7%).
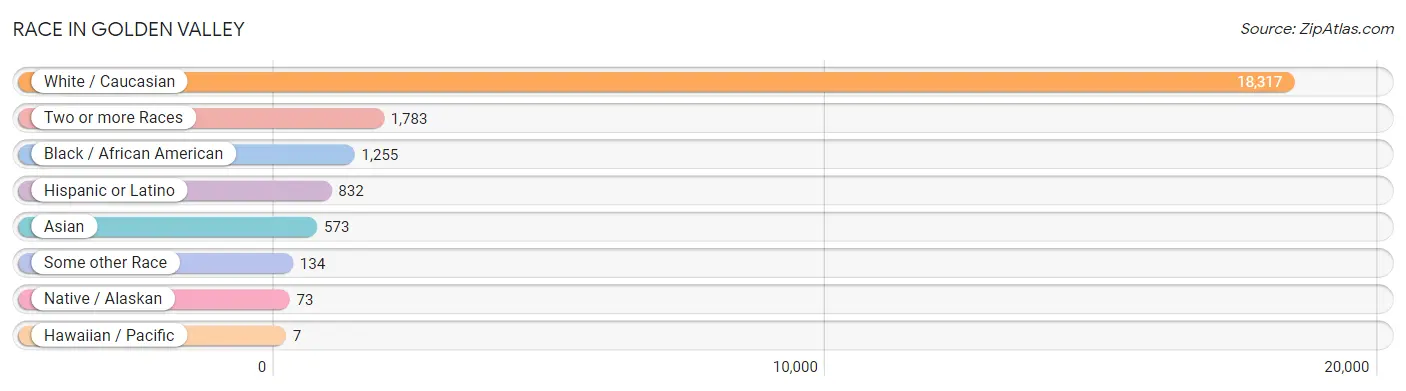
| Race | # Population | % Population |
| Asian | 573 | 2.6% |
| Black / African American | 1,255 | 5.7% |
| Hawaiian / Pacific | 7 | 0.0% |
| Hispanic or Latino | 832 | 3.8% |
| Native / Alaskan | 73 | 0.3% |
| White / Caucasian | 18,317 | 82.7% |
| Two or more Races | 1,783 | 8.1% |
| Some other Race | 134 | 0.6% |
| Total | 22,142 | 100.0% |
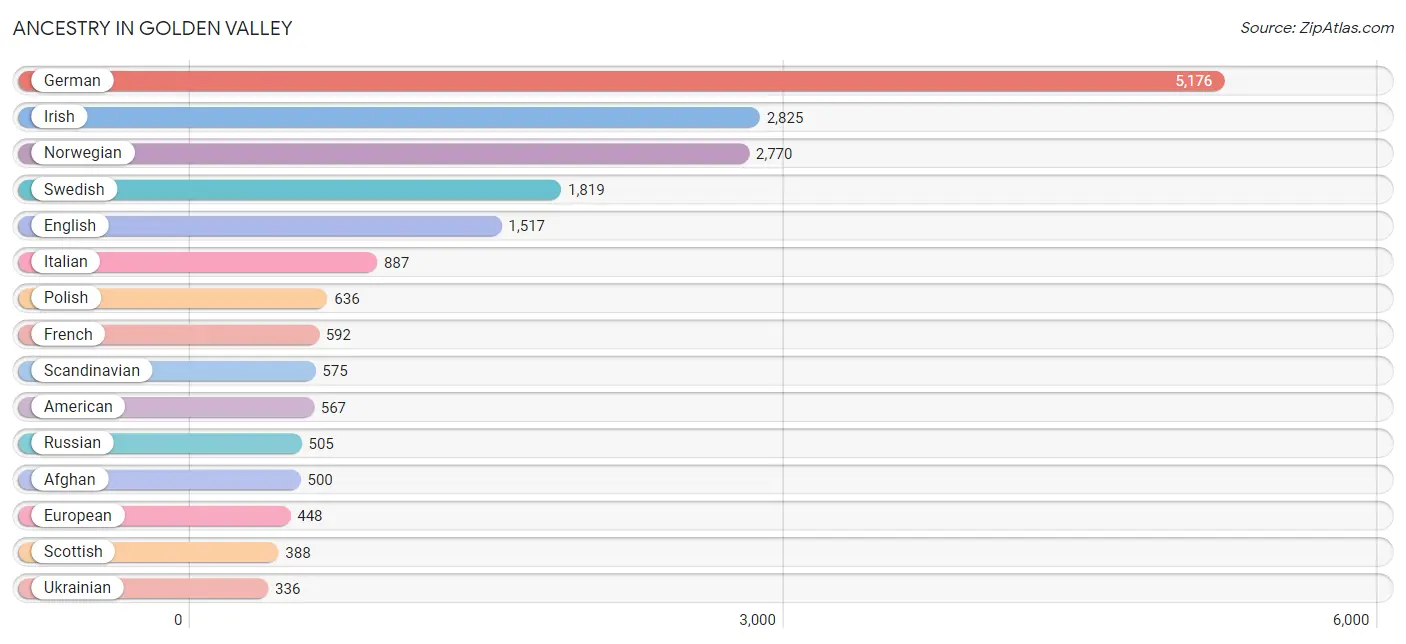
Ancestry in Golden Valley
The most populous ancestries reported in Golden Valley are German (5,176 | 23.4%), Irish (2,825 | 12.8%), Norwegian (2,770 | 12.5%), Swedish (1,819 | 8.2%), and English (1,517 | 6.9%), together accounting for 63.7% of all Golden Valley residents.
| Ancestry | # Population | % Population |
| Afghan | 500 | 2.3% |
| African | 6 | 0.0% |
| Albanian | 119 | 0.5% |
| Alsatian | 16 | 0.1% |
| American | 567 | 2.6% |
| Arab | 84 | 0.4% |
| Argentinean | 59 | 0.3% |
| Austrian | 205 | 0.9% |
| Belgian | 35 | 0.2% |
| Bhutanese | 59 | 0.3% |
| Brazilian | 16 | 0.1% |
| British | 254 | 1.1% |
| Burmese | 34 | 0.2% |
| Canadian | 33 | 0.2% |
| Central American | 59 | 0.3% |
| Cherokee | 52 | 0.2% |
| Chilean | 12 | 0.1% |
| Chippewa | 34 | 0.2% |
| Colombian | 79 | 0.4% |
| Croatian | 133 | 0.6% |
| Czech | 249 | 1.1% |
| Czechoslovakian | 39 | 0.2% |
| Danish | 259 | 1.2% |
| Dutch | 232 | 1.1% |
| Eastern European | 222 | 1.0% |
| Ecuadorian | 11 | 0.1% |
| English | 1,517 | 6.9% |
| Ethiopian | 80 | 0.4% |
| European | 448 | 2.0% |
| Filipino | 14 | 0.1% |
| Finnish | 290 | 1.3% |
| French | 592 | 2.7% |
| French American Indian | 1 | 0.0% |
| French Canadian | 131 | 0.6% |
| German | 5,176 | 23.4% |
| Ghanaian | 19 | 0.1% |
| Greek | 18 | 0.1% |
| Guatemalan | 43 | 0.2% |
| Guyanese | 9 | 0.0% |
| Hungarian | 122 | 0.5% |
| Icelander | 11 | 0.1% |
| Indian (Asian) | 182 | 0.8% |
| Iranian | 38 | 0.2% |
| Irish | 2,825 | 12.8% |
| Iroquois | 15 | 0.1% |
| Italian | 887 | 4.0% |
| Japanese | 5 | 0.0% |
| Korean | 100 | 0.4% |
| Latvian | 8 | 0.0% |
| Lebanese | 45 | 0.2% |
| Liberian | 3 | 0.0% |
| Lithuanian | 24 | 0.1% |
| Luxembourger | 13 | 0.1% |
| Malaysian | 23 | 0.1% |
| Mexican | 312 | 1.4% |
| Mexican American Indian | 56 | 0.3% |
| Mongolian | 8 | 0.0% |
| Nigerian | 38 | 0.2% |
| Northern European | 62 | 0.3% |
| Norwegian | 2,770 | 12.5% |
| Palestinian | 8 | 0.0% |
| Paraguayan | 53 | 0.2% |
| Pennsylvania German | 12 | 0.1% |
| Polish | 636 | 2.9% |
| Portuguese | 15 | 0.1% |
| Puerto Rican | 71 | 0.3% |
| Romanian | 132 | 0.6% |
| Russian | 505 | 2.3% |
| Salvadoran | 16 | 0.1% |
| Scandinavian | 575 | 2.6% |
| Scotch-Irish | 190 | 0.9% |
| Scottish | 388 | 1.8% |
| Sioux | 30 | 0.1% |
| Slavic | 85 | 0.4% |
| Slovak | 26 | 0.1% |
| Slovene | 26 | 0.1% |
| South African | 56 | 0.3% |
| South American | 220 | 1.0% |
| Spaniard | 33 | 0.2% |
| Spanish | 30 | 0.1% |
| Sri Lankan | 110 | 0.5% |
| Subsaharan African | 286 | 1.3% |
| Swedish | 1,819 | 8.2% |
| Swiss | 187 | 0.8% |
| Syrian | 18 | 0.1% |
| Thai | 183 | 0.8% |
| Trinidadian and Tobagonian | 23 | 0.1% |
| Turkish | 34 | 0.2% |
| Ukrainian | 336 | 1.5% |
| Venezuelan | 6 | 0.0% |
| Welsh | 109 | 0.5% |
| West Indian | 103 | 0.5% |
| Yugoslavian | 89 | 0.4% | View All 93 Rows |
Immigrants in Golden Valley
The most numerous immigrant groups reported in Golden Valley came from Asia (1,122 | 5.1%), Europe (886 | 4.0%), South Central Asia (743 | 3.4%), Eastern Europe (649 | 2.9%), and Afghanistan (500 | 2.3%), together accounting for 17.6% of all Golden Valley residents.
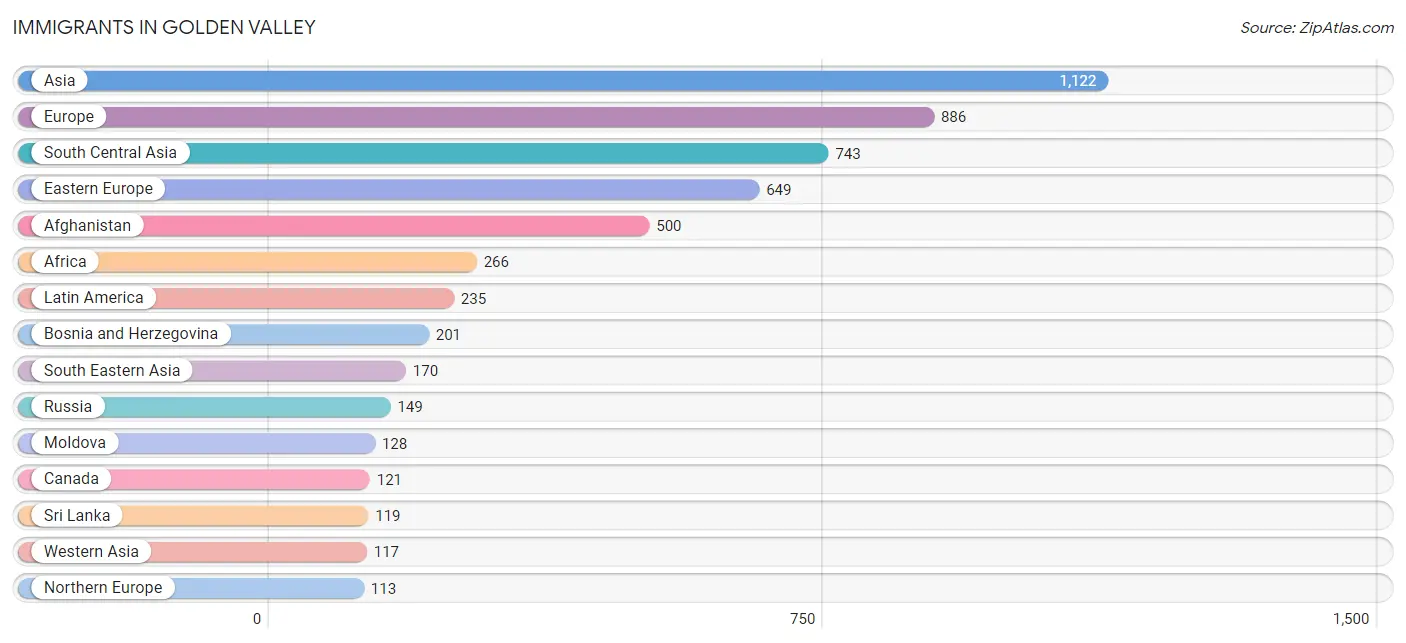
| Immigration Origin | # Population | % Population |
| Afghanistan | 500 | 2.3% |
| Africa | 266 | 1.2% |
| Argentina | 59 | 0.3% |
| Asia | 1,122 | 5.1% |
| Belarus | 25 | 0.1% |
| Bosnia and Herzegovina | 201 | 0.9% |
| Brazil | 16 | 0.1% |
| Cambodia | 5 | 0.0% |
| Cameroon | 30 | 0.1% |
| Canada | 121 | 0.5% |
| Caribbean | 31 | 0.1% |
| Central America | 97 | 0.4% |
| China | 72 | 0.3% |
| Eastern Africa | 80 | 0.4% |
| Eastern Asia | 92 | 0.4% |
| Eastern Europe | 649 | 2.9% |
| Ecuador | 11 | 0.1% |
| Ethiopia | 80 | 0.4% |
| Europe | 886 | 4.0% |
| France | 8 | 0.0% |
| Germany | 54 | 0.2% |
| Guatemala | 43 | 0.2% |
| Guyana | 21 | 0.1% |
| Hong Kong | 18 | 0.1% |
| India | 14 | 0.1% |
| Iran | 25 | 0.1% |
| Ireland | 25 | 0.1% |
| Israel | 8 | 0.0% |
| Italy | 27 | 0.1% |
| Japan | 12 | 0.1% |
| Korea | 8 | 0.0% |
| Laos | 23 | 0.1% |
| Latin America | 235 | 1.1% |
| Lebanon | 29 | 0.1% |
| Liberia | 53 | 0.2% |
| Malaysia | 8 | 0.0% |
| Mexico | 54 | 0.2% |
| Micronesia | 7 | 0.0% |
| Middle Africa | 30 | 0.1% |
| Moldova | 128 | 0.6% |
| Nigeria | 38 | 0.2% |
| Northern Europe | 113 | 0.5% |
| Norway | 22 | 0.1% |
| Oceania | 7 | 0.0% |
| Philippines | 64 | 0.3% |
| Poland | 5 | 0.0% |
| Romania | 16 | 0.1% |
| Russia | 149 | 0.7% |
| Scotland | 45 | 0.2% |
| South Africa | 65 | 0.3% |
| South America | 107 | 0.5% |
| South Central Asia | 743 | 3.4% |
| South Eastern Asia | 170 | 0.8% |
| Southern Europe | 62 | 0.3% |
| Spain | 35 | 0.2% |
| Sri Lanka | 119 | 0.5% |
| Sweden | 21 | 0.1% |
| Taiwan | 14 | 0.1% |
| Thailand | 11 | 0.1% |
| Trinidad and Tobago | 31 | 0.1% |
| Turkey | 34 | 0.2% |
| Ukraine | 82 | 0.4% |
| Vietnam | 59 | 0.3% |
| Western Africa | 91 | 0.4% |
| Western Asia | 117 | 0.5% |
| Western Europe | 62 | 0.3% | View All 66 Rows |
Sex and Age in Golden Valley
Sex and Age in Golden Valley
The most populous age groups in Golden Valley are 60 to 64 Years (935 | 8.8%) for men and 60 to 64 Years (1,260 | 10.9%) for women.
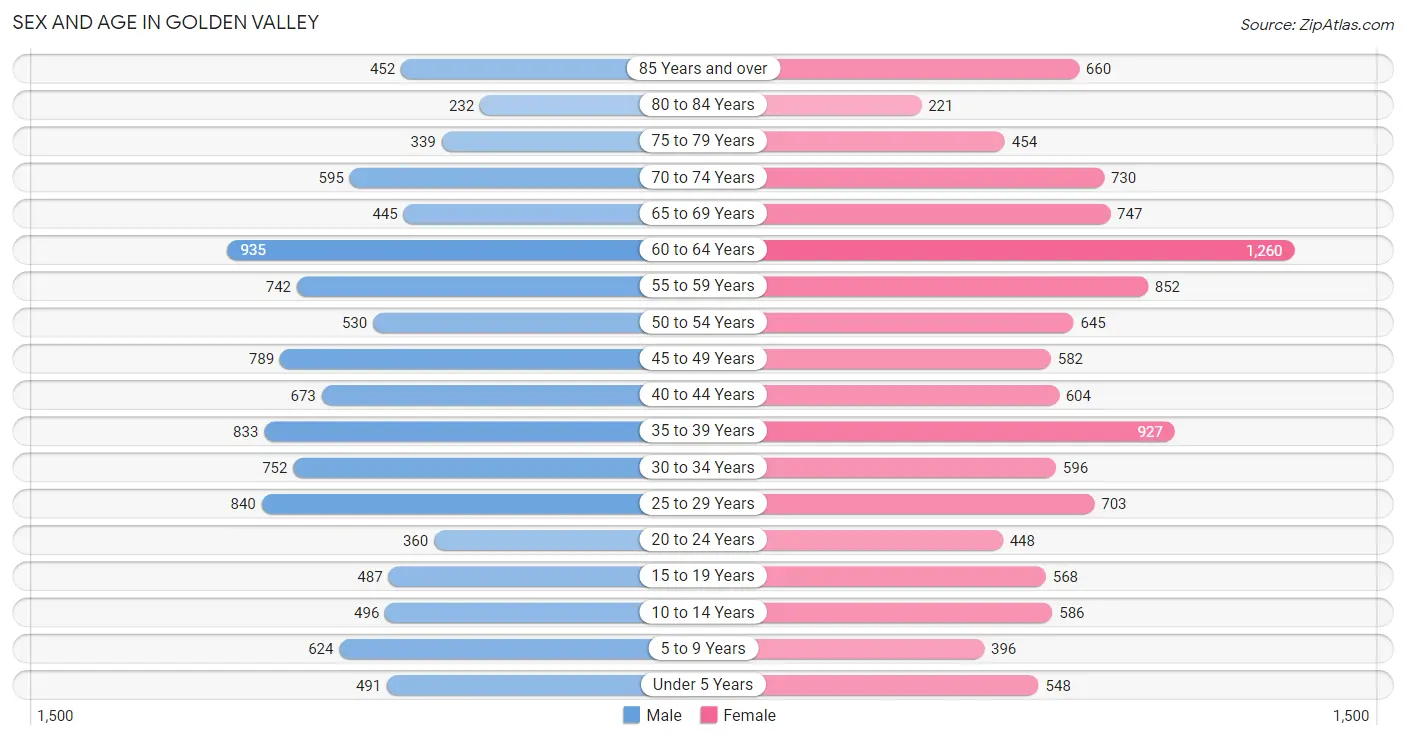
| Age Bracket | Male | Female |
| Under 5 Years | 491 (4.6%) | 548 (4.8%) |
| 5 to 9 Years | 624 (5.9%) | 396 (3.4%) |
| 10 to 14 Years | 496 (4.7%) | 586 (5.1%) |
| 15 to 19 Years | 487 (4.6%) | 568 (4.9%) |
| 20 to 24 Years | 360 (3.4%) | 448 (3.9%) |
| 25 to 29 Years | 840 (7.9%) | 703 (6.1%) |
| 30 to 34 Years | 752 (7.1%) | 596 (5.2%) |
| 35 to 39 Years | 833 (7.9%) | 927 (8.0%) |
| 40 to 44 Years | 673 (6.3%) | 604 (5.2%) |
| 45 to 49 Years | 789 (7.4%) | 582 (5.1%) |
| 50 to 54 Years | 530 (5.0%) | 645 (5.6%) |
| 55 to 59 Years | 742 (7.0%) | 852 (7.4%) |
| 60 to 64 Years | 935 (8.8%) | 1,260 (10.9%) |
| 65 to 69 Years | 445 (4.2%) | 747 (6.5%) |
| 70 to 74 Years | 595 (5.6%) | 730 (6.3%) |
| 75 to 79 Years | 339 (3.2%) | 454 (3.9%) |
| 80 to 84 Years | 232 (2.2%) | 221 (1.9%) |
| 85 Years and over | 452 (4.3%) | 660 (5.7%) |
| Total | 10,615 (100.0%) | 11,527 (100.0%) |
Families and Households in Golden Valley
Median Family Size in Golden Valley
The median family size in Golden Valley is 2.79 persons per family, with single female/mother families (668 | 11.3%) accounting for the largest median family size of 2.96 persons per family. On the other hand, single male/father families (125 | 2.1%) represent the smallest median family size with 2.46 persons per family.
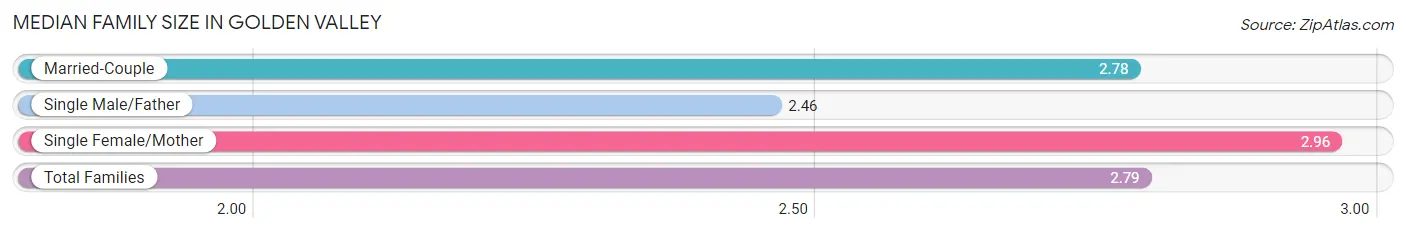
| Family Type | # Families | Family Size |
| Married-Couple | 5,135 (86.6%) | 2.78 |
| Single Male/Father | 125 (2.1%) | 2.46 |
| Single Female/Mother | 668 (11.3%) | 2.96 |
| Total Families | 5,928 (100.0%) | 2.79 |
Median Household Size in Golden Valley
The median household size in Golden Valley is 2.22 persons per household, with single female/mother households (668 | 6.8%) accounting for the largest median household size of 3 persons per household. non-family households (3,850 | 39.4%) represent the smallest median household size with 1.28 persons per household.
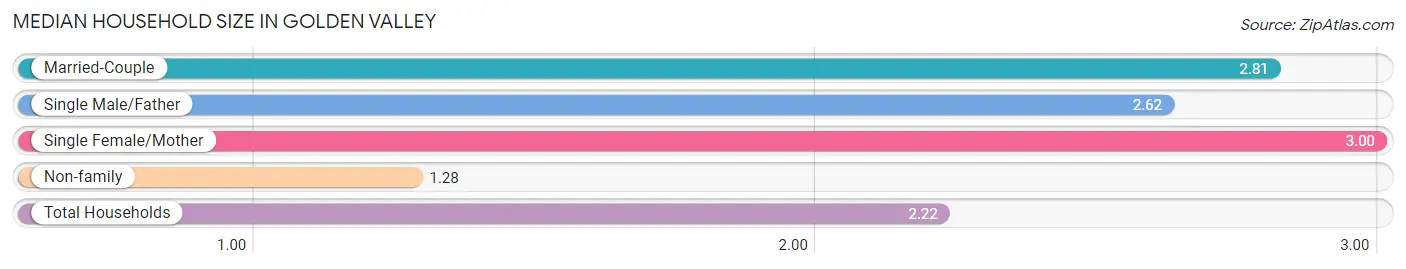
| Household Type | # Households | Household Size |
| Married-Couple | 5,135 (52.5%) | 2.81 |
| Single Male/Father | 125 (1.3%) | 2.62 |
| Single Female/Mother | 668 (6.8%) | 3.00 |
| Non-family | 3,850 (39.4%) | 1.28 |
| Total Households | 9,778 (100.0%) | 2.22 |
Household Size by Marriage Status in Golden Valley
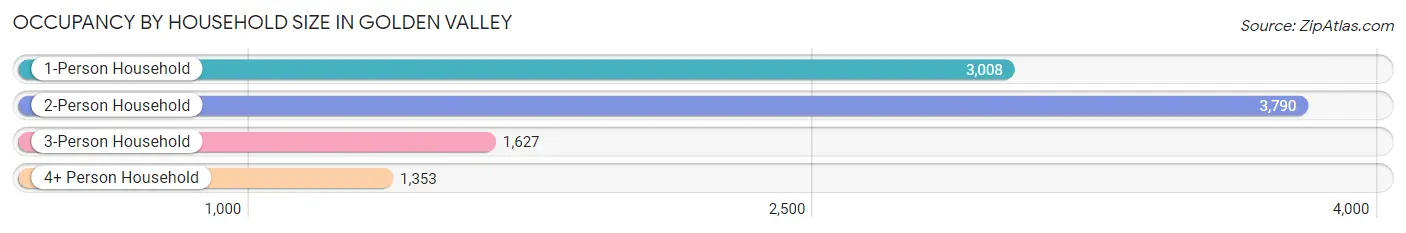
Out of a total of 9,778 households in Golden Valley, 5,928 (60.6%) are family households, while 3,850 (39.4%) are nonfamily households. The most numerous type of family households are 2-person households, comprising 3,096, and the most common type of nonfamily households are 1-person households, comprising 3,008.
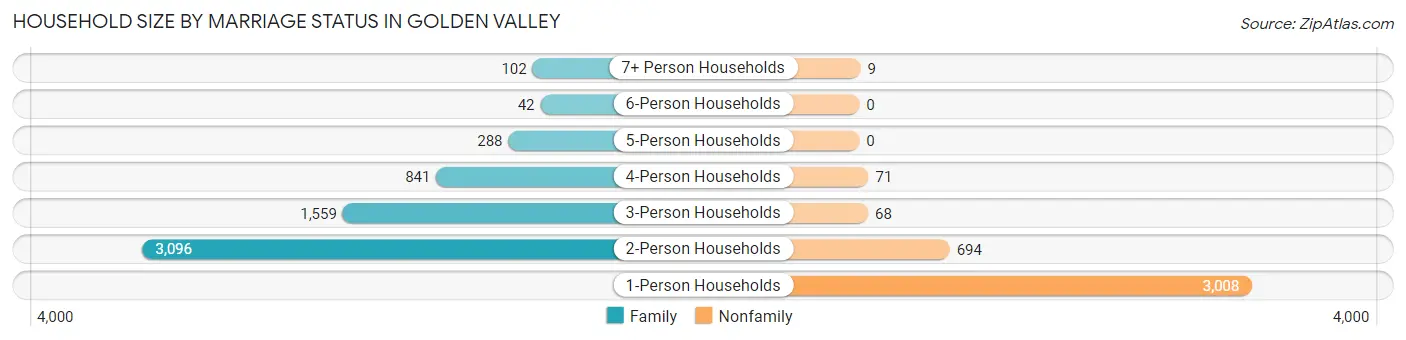
| Household Size | Family Households | Nonfamily Households |
| 1-Person Households | - | 3,008 (30.8%) |
| 2-Person Households | 3,096 (31.7%) | 694 (7.1%) |
| 3-Person Households | 1,559 (15.9%) | 68 (0.7%) |
| 4-Person Households | 841 (8.6%) | 71 (0.7%) |
| 5-Person Households | 288 (2.9%) | 0 (0.0%) |
| 6-Person Households | 42 (0.4%) | 0 (0.0%) |
| 7+ Person Households | 102 (1.0%) | 9 (0.1%) |
| Total | 5,928 (60.6%) | 3,850 (39.4%) |
Female Fertility in Golden Valley
Fertility by Age in Golden Valley
Average fertility rate in Golden Valley is 51.0 births per 1,000 women. Women in the age bracket of 20 to 34 years have the highest fertility rate with 66.0 births per 1,000 women. Women in the age bracket of 35 to 50 years acount for 51.5% of all women with births.
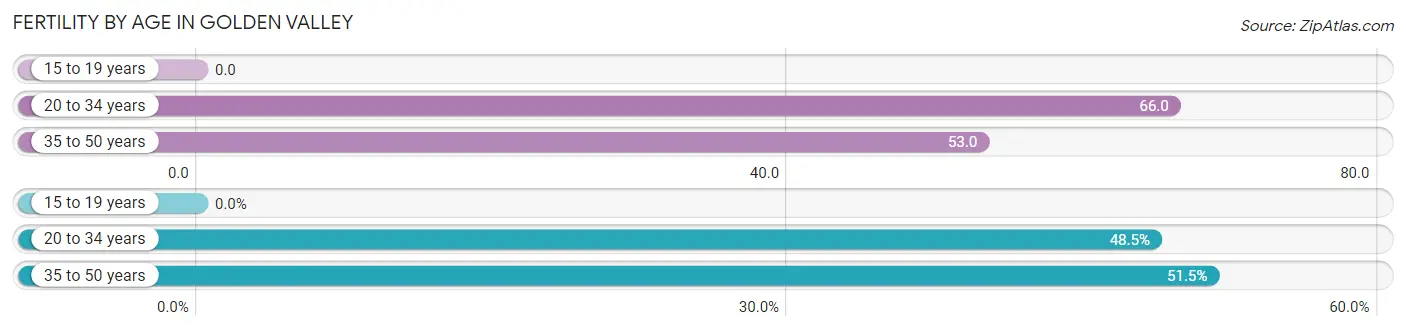
| Age Bracket | Women with Births | Births / 1,000 Women |
| 15 to 19 years | 0 (0.0%) | 0.0 |
| 20 to 34 years | 116 (48.5%) | 66.0 |
| 35 to 50 years | 123 (51.5%) | 53.0 |
| Total | 239 (100.0%) | 51.0 |
Fertility by Age by Marriage Status in Golden Valley
95.4% of women with births (239) in Golden Valley are married. The highest percentage of unmarried women with births falls into 35 to 50 years age bracket with 8.9% of them unmarried at the time of birth, while the lowest percentage of unmarried women with births belong to 20 to 34 years age bracket with 0.0% of them unmarried.
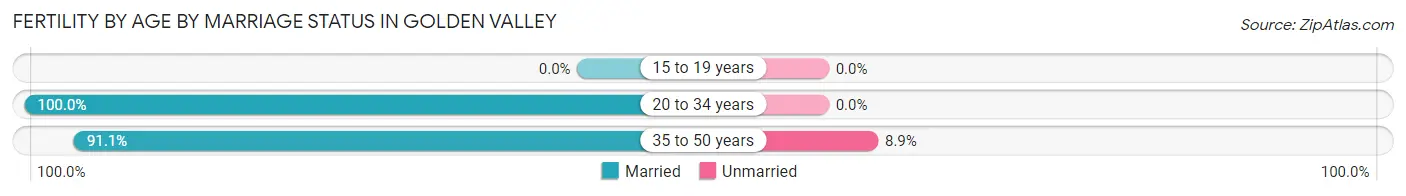
| Age Bracket | Married | Unmarried |
| 15 to 19 years | 0 (0.0%) | 0 (0.0%) |
| 20 to 34 years | 116 (100.0%) | 0 (0.0%) |
| 35 to 50 years | 112 (91.1%) | 11 (8.9%) |
| Total | 228 (95.4%) | 11 (4.6%) |
Fertility by Education in Golden Valley
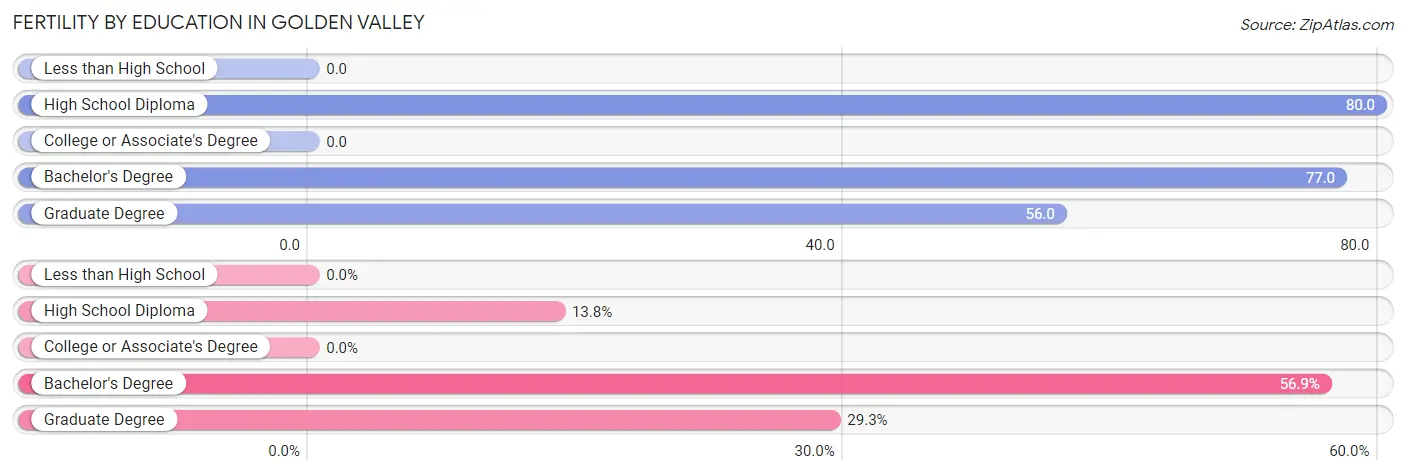
| Educational Attainment | Women with Births | Births / 1,000 Women |
| Less than High School | 0 (0.0%) | 0.0 |
| High School Diploma | 33 (13.8%) | 80.0 |
| College or Associate's Degree | 0 (0.0%) | 0.0 |
| Bachelor's Degree | 136 (56.9%) | 77.0 |
| Graduate Degree | 70 (29.3%) | 56.0 |
| Total | 239 (100.0%) | 51.0 |
Fertility by Education by Marriage Status in Golden Valley
4.6% of women with births in Golden Valley are unmarried. Women with the educational attainment of high school diploma are most likely to be married with 100.0% of them married at childbirth, while women with the educational attainment of graduate degree are least likely to be married with 15.7% of them unmarried at childbirth.
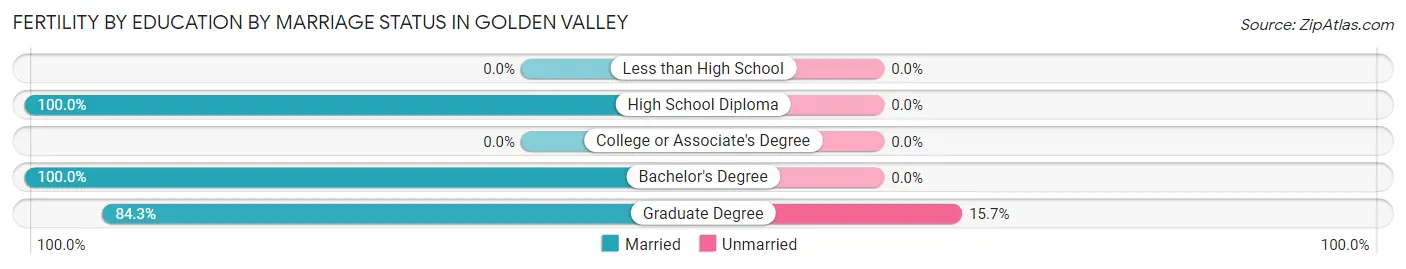
| Educational Attainment | Married | Unmarried |
| Less than High School | 0 (0.0%) | 0 (0.0%) |
| High School Diploma | 33 (100.0%) | 0 (0.0%) |
| College or Associate's Degree | 0 (0.0%) | 0 (0.0%) |
| Bachelor's Degree | 136 (100.0%) | 0 (0.0%) |
| Graduate Degree | 59 (84.3%) | 11 (15.7%) |
| Total | 228 (95.4%) | 11 (4.6%) |
Employment Characteristics in Golden Valley
Employment by Class of Employer in Golden Valley
Among the 11,778 employed individuals in Golden Valley, private company employees (7,838 | 66.5%), not-for-profit organizations (1,637 | 13.9%), and self-employed (not incorporated) (758 | 6.4%) make up the most common classes of employment.
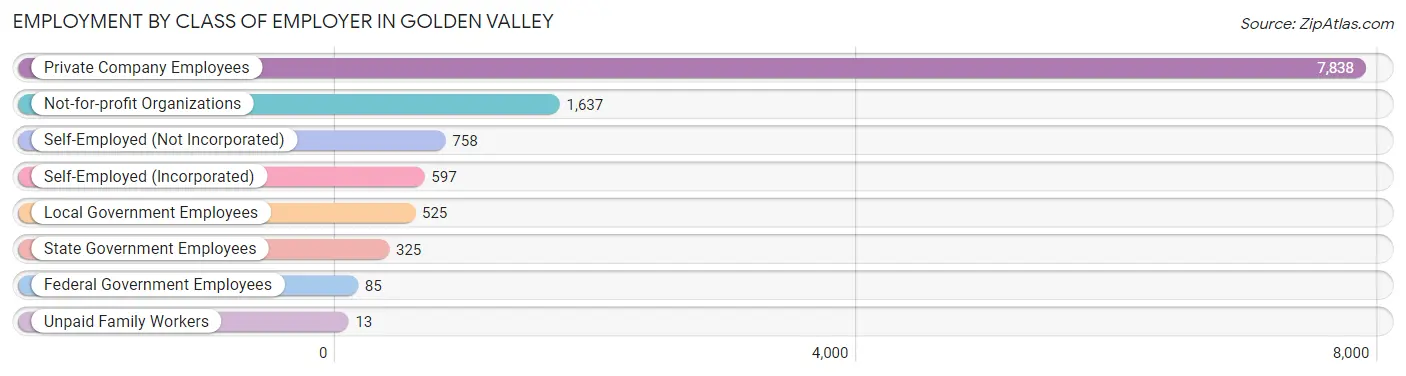
| Employer Class | # Employees | % Employees |
| Private Company Employees | 7,838 | 66.5% |
| Self-Employed (Incorporated) | 597 | 5.1% |
| Self-Employed (Not Incorporated) | 758 | 6.4% |
| Not-for-profit Organizations | 1,637 | 13.9% |
| Local Government Employees | 525 | 4.5% |
| State Government Employees | 325 | 2.8% |
| Federal Government Employees | 85 | 0.7% |
| Unpaid Family Workers | 13 | 0.1% |
| Total | 11,778 | 100.0% |
Employment Status by Age in Golden Valley
According to the labor force statistics for Golden Valley, out of the total population over 16 years of age (18,780), 65.9% or 12,376 individuals are in the labor force, with 3.2% or 396 of them unemployed. The age group with the highest labor force participation rate is 30 to 34 years, with 96.6% or 1,302 individuals in the labor force. Within the labor force, the 16 to 19 years age range has the highest percentage of unemployed individuals, with 14.9% or 67 of them being unemployed.
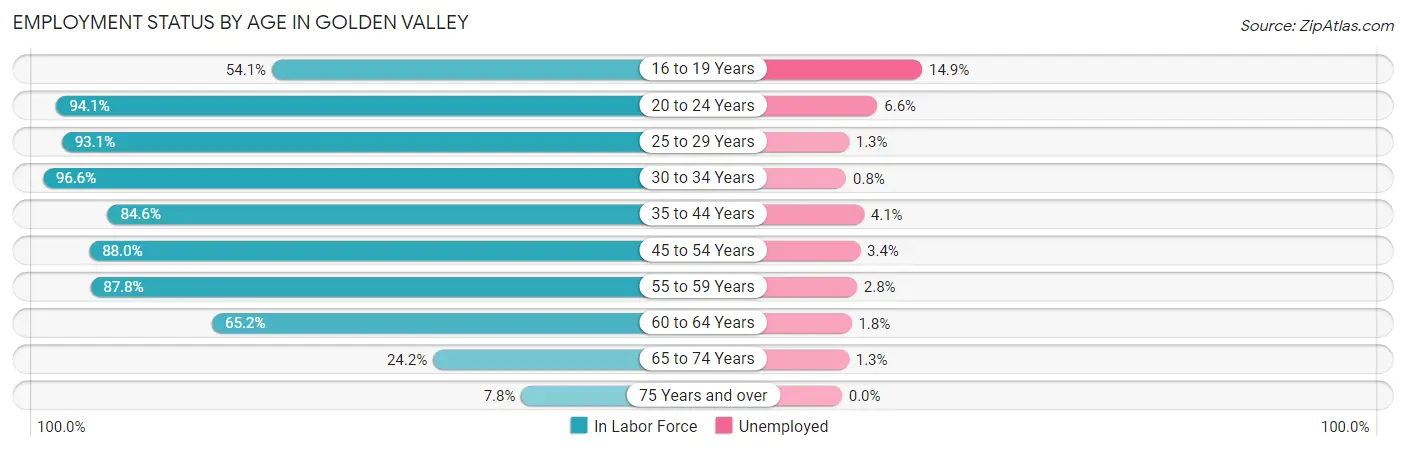
| Age Bracket | In Labor Force | Unemployed |
| 16 to 19 Years | 451 (54.1%) | 67 (14.9%) |
| 20 to 24 Years | 760 (94.1%) | 50 (6.6%) |
| 25 to 29 Years | 1,437 (93.1%) | 19 (1.3%) |
| 30 to 34 Years | 1,302 (96.6%) | 10 (0.8%) |
| 35 to 44 Years | 2,569 (84.6%) | 105 (4.1%) |
| 45 to 54 Years | 2,240 (88.0%) | 76 (3.4%) |
| 55 to 59 Years | 1,400 (87.8%) | 39 (2.8%) |
| 60 to 64 Years | 1,431 (65.2%) | 26 (1.8%) |
| 65 to 74 Years | 609 (24.2%) | 8 (1.3%) |
| 75 Years and over | 184 (7.8%) | 0 (0.0%) |
| Total | 12,376 (65.9%) | 396 (3.2%) |
Employment Status by Educational Attainment in Golden Valley
According to labor force statistics for Golden Valley, 84.7% of individuals (10,387) out of the total population between 25 and 64 years of age (12,263) are in the labor force, with 2.6% or 270 of them being unemployed. The group with the highest labor force participation rate are those with the educational attainment of bachelor's degree or higher, with 91.0% or 7,196 individuals in the labor force. Within the labor force, individuals with less than high school education have the highest percentage of unemployment, with 8.6% or 14 of them being unemployed.
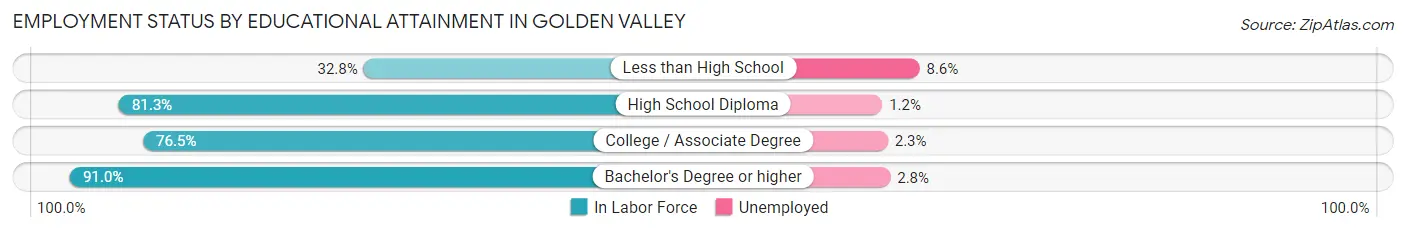
| Educational Attainment | In Labor Force | Unemployed |
| Less than High School | 163 (32.8%) | 43 (8.6%) |
| High School Diploma | 1,224 (81.3%) | 18 (1.2%) |
| College / Associate Degree | 1,799 (76.5%) | 54 (2.3%) |
| Bachelor's Degree or higher | 7,196 (91.0%) | 221 (2.8%) |
| Total | 10,387 (84.7%) | 319 (2.6%) |
Employment Occupations by Sex in Golden Valley
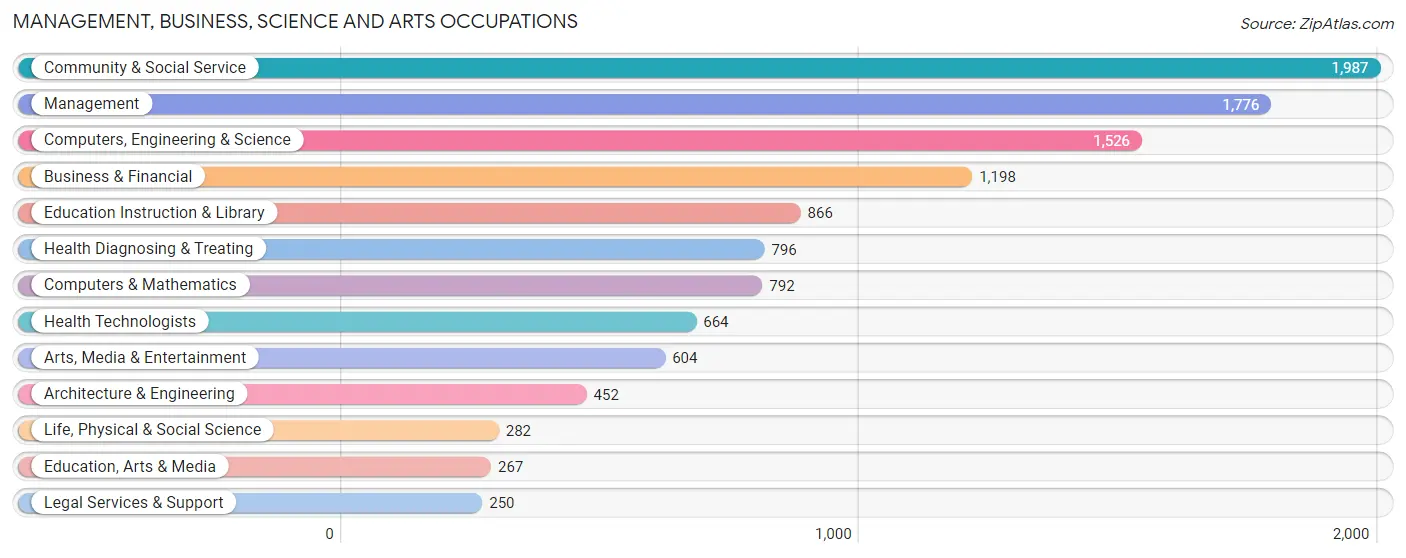
Management, Business, Science and Arts Occupations
The most common Management, Business, Science and Arts occupations in Golden Valley are Community & Social Service (1,987 | 16.6%), Management (1,776 | 14.8%), Computers, Engineering & Science (1,526 | 12.7%), Business & Financial (1,198 | 10.0%), and Education Instruction & Library (866 | 7.2%).
Management, Business, Science and Arts Occupations by Sex
Within the Management, Business, Science and Arts occupations in Golden Valley, the most male-oriented occupations are Architecture & Engineering (89.8%), Computers, Engineering & Science (76.4%), and Computers & Mathematics (76.0%), while the most female-oriented occupations are Education, Arts & Media (86.5%), Health Technologists (80.9%), and Health Diagnosing & Treating (79.1%).
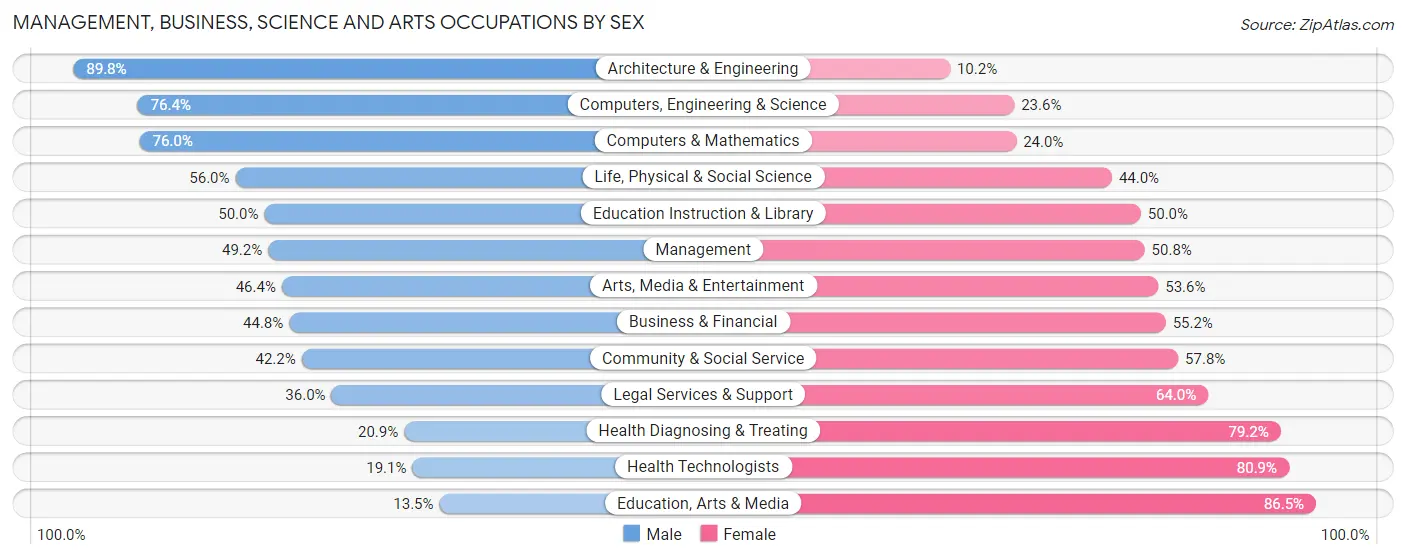
| Occupation | Male | Female |
| Management | 874 (49.2%) | 902 (50.8%) |
| Business & Financial | 537 (44.8%) | 661 (55.2%) |
| Computers, Engineering & Science | 1,166 (76.4%) | 360 (23.6%) |
| Computers & Mathematics | 602 (76.0%) | 190 (24.0%) |
| Architecture & Engineering | 406 (89.8%) | 46 (10.2%) |
| Life, Physical & Social Science | 158 (56.0%) | 124 (44.0%) |
| Community & Social Service | 839 (42.2%) | 1,148 (57.8%) |
| Education, Arts & Media | 36 (13.5%) | 231 (86.5%) |
| Legal Services & Support | 90 (36.0%) | 160 (64.0%) |
| Education Instruction & Library | 433 (50.0%) | 433 (50.0%) |
| Arts, Media & Entertainment | 280 (46.4%) | 324 (53.6%) |
| Health Diagnosing & Treating | 166 (20.8%) | 630 (79.1%) |
| Health Technologists | 127 (19.1%) | 537 (80.9%) |
| Total (Category) | 3,582 (49.2%) | 3,701 (50.8%) |
| Total (Overall) | 6,020 (50.2%) | 5,964 (49.8%) |
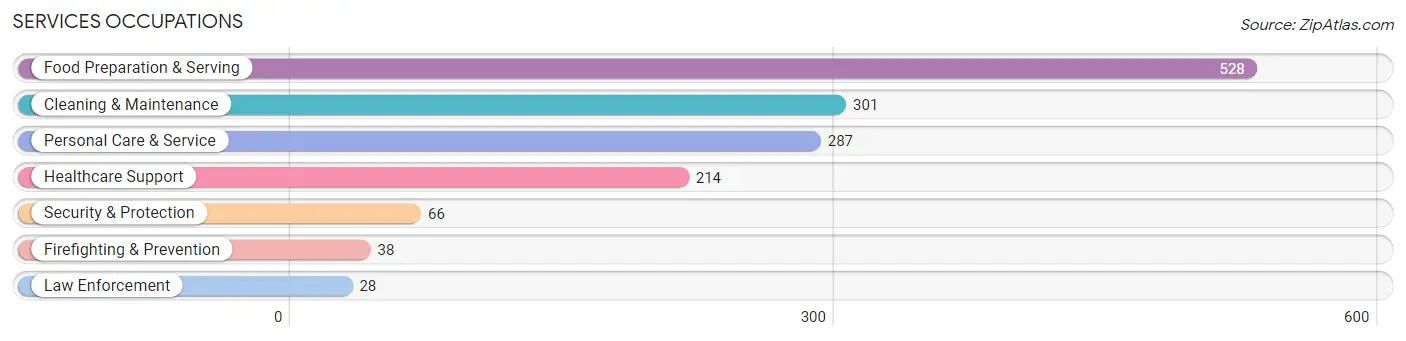
Services Occupations
The most common Services occupations in Golden Valley are Food Preparation & Serving (528 | 4.4%), Cleaning & Maintenance (301 | 2.5%), Personal Care & Service (287 | 2.4%), Healthcare Support (214 | 1.8%), and Security & Protection (66 | 0.5%).
Services Occupations by Sex
Within the Services occupations in Golden Valley, the most male-oriented occupations are Law Enforcement (100.0%), Security & Protection (89.4%), and Firefighting & Prevention (81.6%), while the most female-oriented occupations are Personal Care & Service (85.7%), Healthcare Support (72.9%), and Cleaning & Maintenance (55.1%).
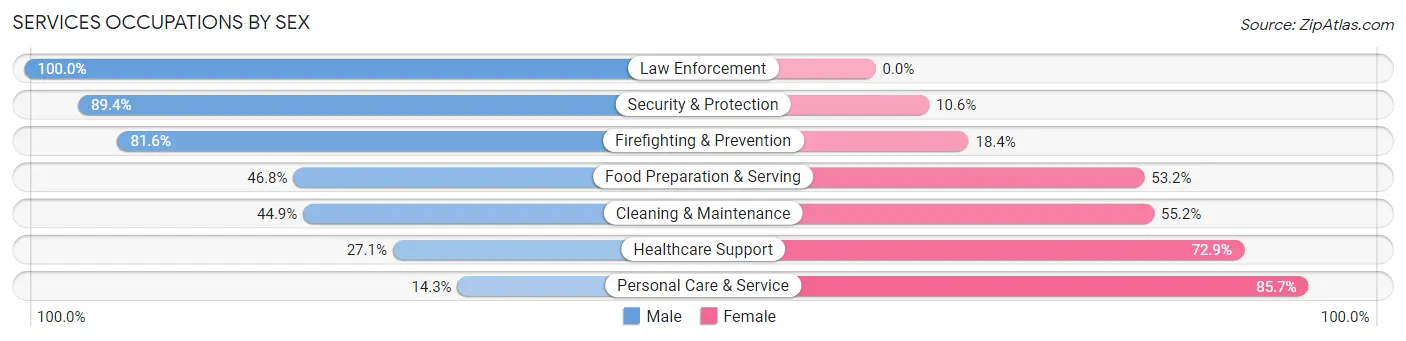
| Occupation | Male | Female |
| Healthcare Support | 58 (27.1%) | 156 (72.9%) |
| Security & Protection | 59 (89.4%) | 7 (10.6%) |
| Firefighting & Prevention | 31 (81.6%) | 7 (18.4%) |
| Law Enforcement | 28 (100.0%) | 0 (0.0%) |
| Food Preparation & Serving | 247 (46.8%) | 281 (53.2%) |
| Cleaning & Maintenance | 135 (44.9%) | 166 (55.1%) |
| Personal Care & Service | 41 (14.3%) | 246 (85.7%) |
| Total (Category) | 540 (38.7%) | 856 (61.3%) |
| Total (Overall) | 6,020 (50.2%) | 5,964 (49.8%) |
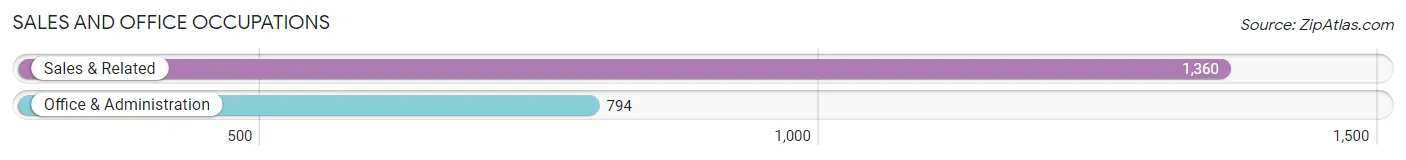
Sales and Office Occupations
The most common Sales and Office occupations in Golden Valley are Sales & Related (1,360 | 11.4%), and Office & Administration (794 | 6.6%).
Sales and Office Occupations by Sex
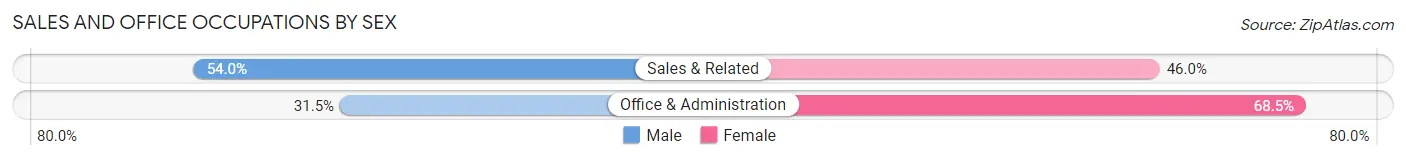
| Occupation | Male | Female |
| Sales & Related | 734 (54.0%) | 626 (46.0%) |
| Office & Administration | 250 (31.5%) | 544 (68.5%) |
| Total (Category) | 984 (45.7%) | 1,170 (54.3%) |
| Total (Overall) | 6,020 (50.2%) | 5,964 (49.8%) |
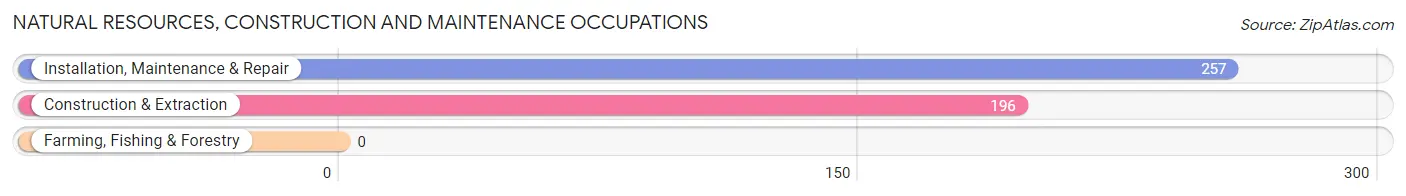
Natural Resources, Construction and Maintenance Occupations
The most common Natural Resources, Construction and Maintenance occupations in Golden Valley are Installation, Maintenance & Repair (257 | 2.1%), and Construction & Extraction (196 | 1.6%).
Natural Resources, Construction and Maintenance Occupations by Sex
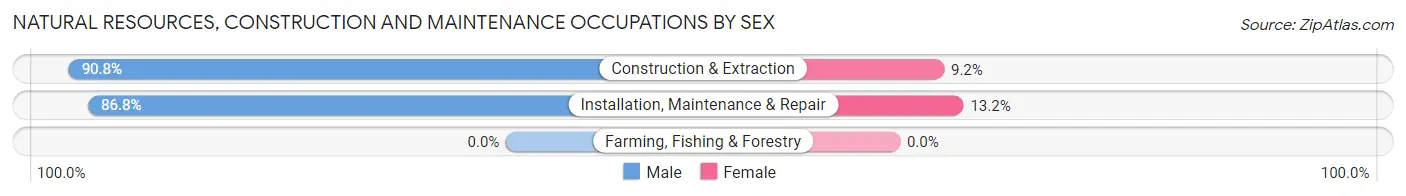
| Occupation | Male | Female |
| Farming, Fishing & Forestry | 0 (0.0%) | 0 (0.0%) |
| Construction & Extraction | 178 (90.8%) | 18 (9.2%) |
| Installation, Maintenance & Repair | 223 (86.8%) | 34 (13.2%) |
| Total (Category) | 401 (88.5%) | 52 (11.5%) |
| Total (Overall) | 6,020 (50.2%) | 5,964 (49.8%) |
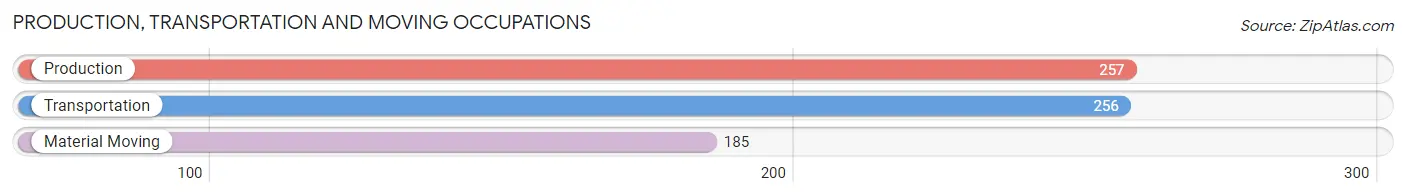
Production, Transportation and Moving Occupations
The most common Production, Transportation and Moving occupations in Golden Valley are Production (257 | 2.1%), Transportation (256 | 2.1%), and Material Moving (185 | 1.5%).
Production, Transportation and Moving Occupations by Sex
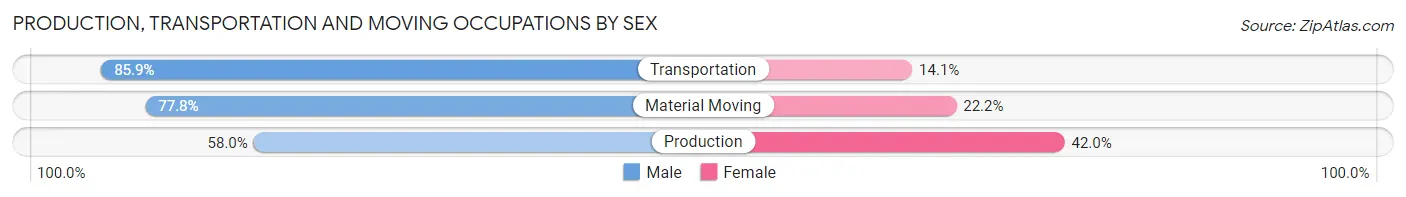
| Occupation | Male | Female |
| Production | 149 (58.0%) | 108 (42.0%) |
| Transportation | 220 (85.9%) | 36 (14.1%) |
| Material Moving | 144 (77.8%) | 41 (22.2%) |
| Total (Category) | 513 (73.5%) | 185 (26.5%) |
| Total (Overall) | 6,020 (50.2%) | 5,964 (49.8%) |
Employment Industries by Sex in Golden Valley
Employment Industries in Golden Valley
The major employment industries in Golden Valley include Professional & Scientific (1,777 | 14.8%), Health Care & Social Assistance (1,768 | 14.7%), Manufacturing (1,332 | 11.1%), Finance & Insurance (1,243 | 10.4%), and Retail Trade (1,198 | 10.0%).
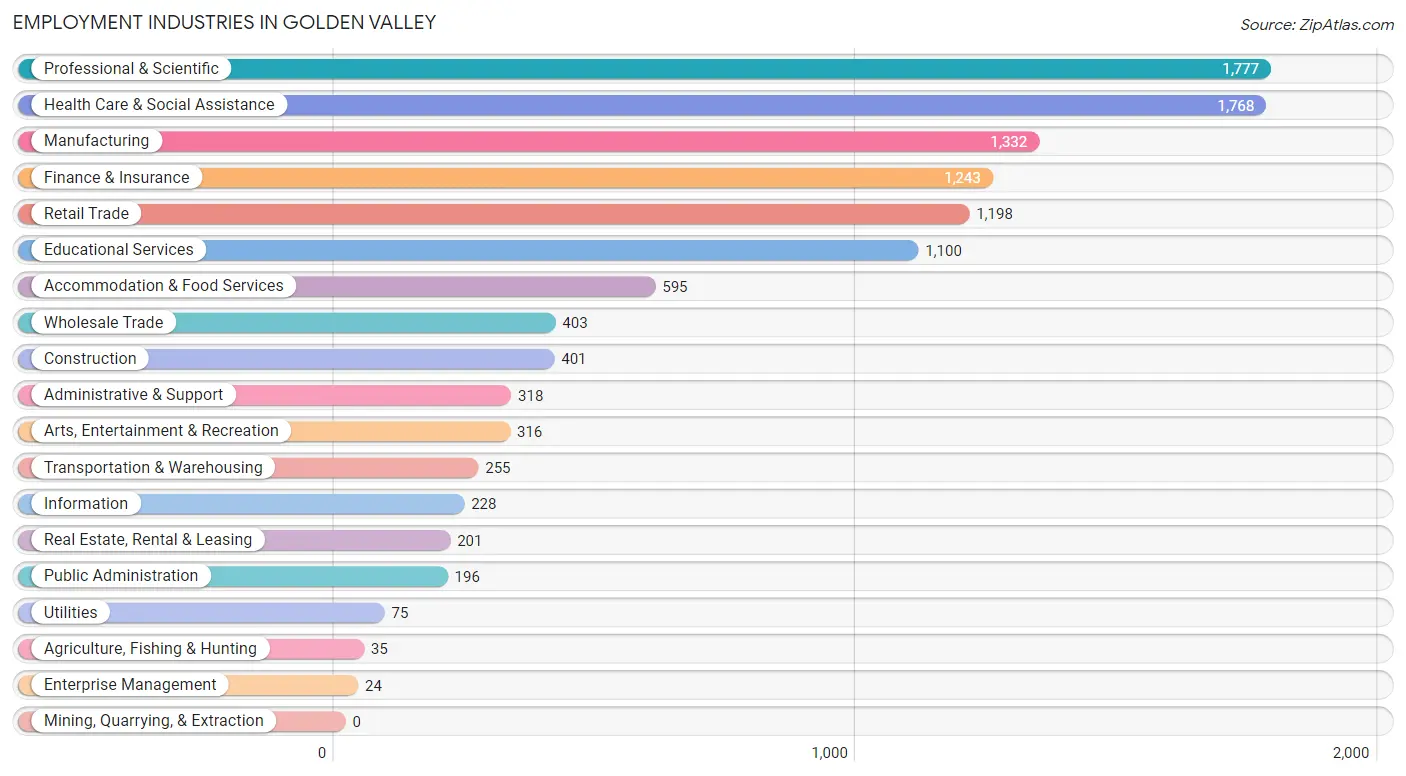
Employment Industries by Sex in Golden Valley
The Golden Valley industries that see more men than women are Utilities (100.0%), Construction (89.8%), and Agriculture, Fishing & Hunting (88.6%), whereas the industries that tend to have a higher number of women are Health Care & Social Assistance (74.4%), Enterprise Management (66.7%), and Accommodation & Food Services (55.0%).
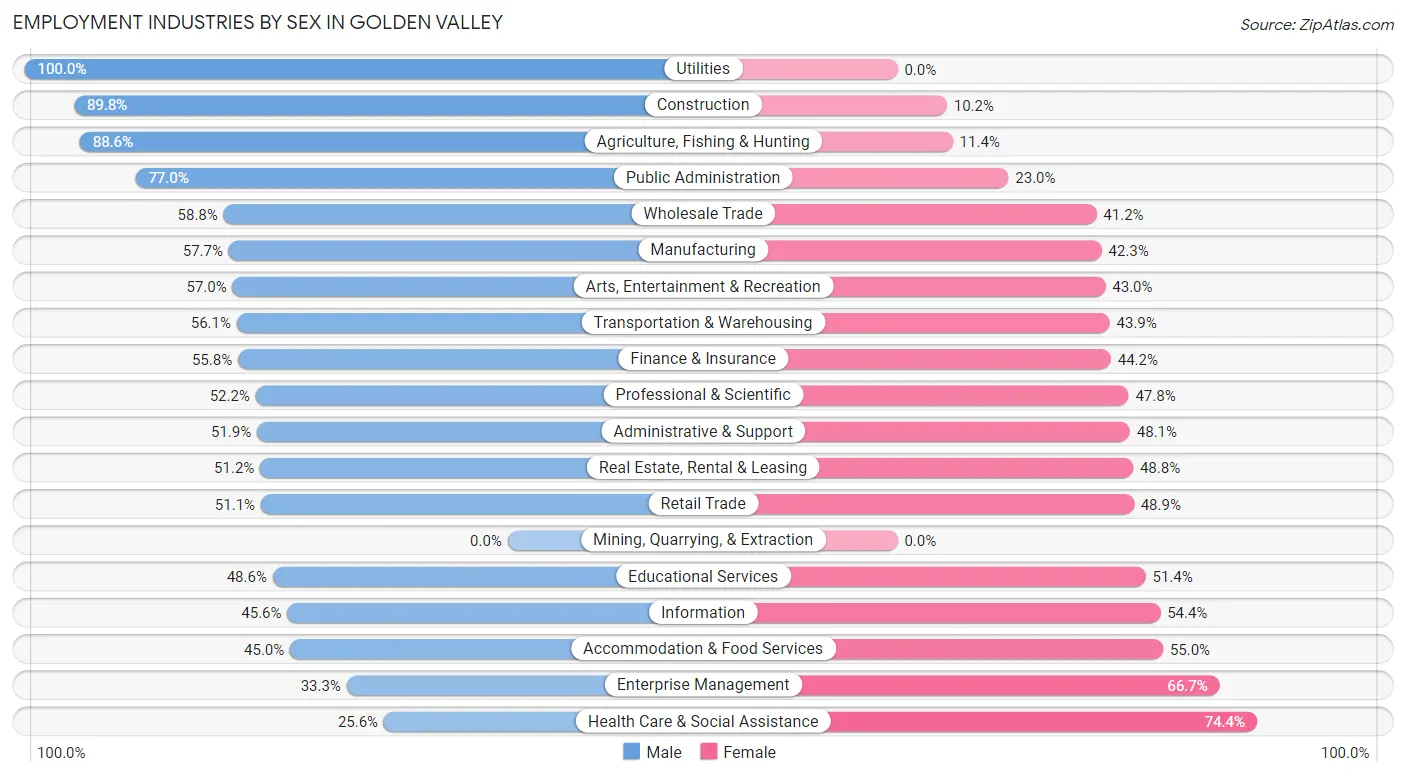
| Industry | Male | Female |
| Agriculture, Fishing & Hunting | 31 (88.6%) | 4 (11.4%) |
| Mining, Quarrying, & Extraction | 0 (0.0%) | 0 (0.0%) |
| Construction | 360 (89.8%) | 41 (10.2%) |
| Manufacturing | 769 (57.7%) | 563 (42.3%) |
| Wholesale Trade | 237 (58.8%) | 166 (41.2%) |
| Retail Trade | 612 (51.1%) | 586 (48.9%) |
| Transportation & Warehousing | 143 (56.1%) | 112 (43.9%) |
| Utilities | 75 (100.0%) | 0 (0.0%) |
| Information | 104 (45.6%) | 124 (54.4%) |
| Finance & Insurance | 694 (55.8%) | 549 (44.2%) |
| Real Estate, Rental & Leasing | 103 (51.2%) | 98 (48.8%) |
| Professional & Scientific | 927 (52.2%) | 850 (47.8%) |
| Enterprise Management | 8 (33.3%) | 16 (66.7%) |
| Administrative & Support | 165 (51.9%) | 153 (48.1%) |
| Educational Services | 535 (48.6%) | 565 (51.4%) |
| Health Care & Social Assistance | 453 (25.6%) | 1,315 (74.4%) |
| Arts, Entertainment & Recreation | 180 (57.0%) | 136 (43.0%) |
| Accommodation & Food Services | 268 (45.0%) | 327 (55.0%) |
| Public Administration | 151 (77.0%) | 45 (23.0%) |
| Total | 6,020 (50.2%) | 5,964 (49.8%) |
Education in Golden Valley
School Enrollment in Golden Valley
The most common levels of schooling among the 3,723 students in Golden Valley are high school (937 | 25.2%), middle school (818 | 22.0%), and elementary school (663 | 17.8%).
| School Level | # Students | % Students |
| Nursery / Preschool | 313 | 8.4% |
| Kindergarten | 126 | 3.4% |
| Elementary School | 663 | 17.8% |
| Middle School | 818 | 22.0% |
| High School | 937 | 25.2% |
| College / Undergraduate | 642 | 17.2% |
| Graduate / Professional | 224 | 6.0% |
| Total | 3,723 | 100.0% |
School Enrollment by Age by Funding Source in Golden Valley
Out of a total of 3,723 students who are enrolled in schools in Golden Valley, 1,325 (35.6%) attend a private institution, while the remaining 2,398 (64.4%) are enrolled in public schools. The age group of 3 to 4 year olds has the highest likelihood of being enrolled in private schools, with 134 (58.0% in the age bracket) enrolled. Conversely, the age group of 5 to 9 year old has the lowest likelihood of being enrolled in a private school, with 570 (72.2% in the age bracket) attending a public institution.
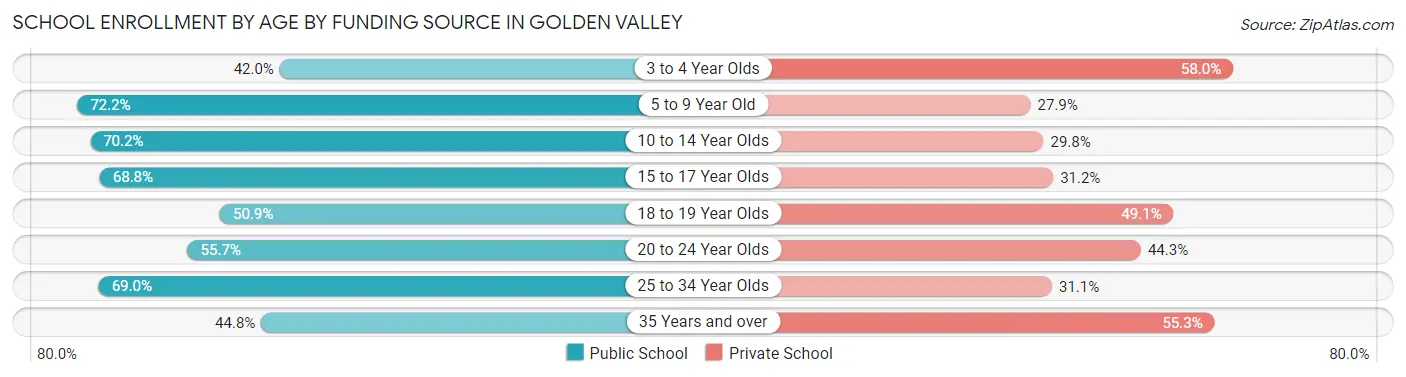
| Age Bracket | Public School | Private School |
| 3 to 4 Year Olds | 97 (42.0%) | 134 (58.0%) |
| 5 to 9 Year Old | 570 (72.2%) | 220 (27.9%) |
| 10 to 14 Year Olds | 705 (70.2%) | 299 (29.8%) |
| 15 to 17 Year Olds | 456 (68.8%) | 207 (31.2%) |
| 18 to 19 Year Olds | 118 (50.9%) | 114 (49.1%) |
| 20 to 24 Year Olds | 166 (55.7%) | 132 (44.3%) |
| 25 to 34 Year Olds | 171 (69.0%) | 77 (31.0%) |
| 35 Years and over | 115 (44.8%) | 142 (55.2%) |
| Total | 2,398 (64.4%) | 1,325 (35.6%) |
Educational Attainment by Field of Study in Golden Valley
Business (2,223 | 19.4%), social sciences (1,249 | 10.9%), visual & performing arts (892 | 7.8%), education (856 | 7.5%), and bio, nature & agricultural (846 | 7.4%) are the most common fields of study among 11,442 individuals in Golden Valley who have obtained a bachelor's degree or higher.
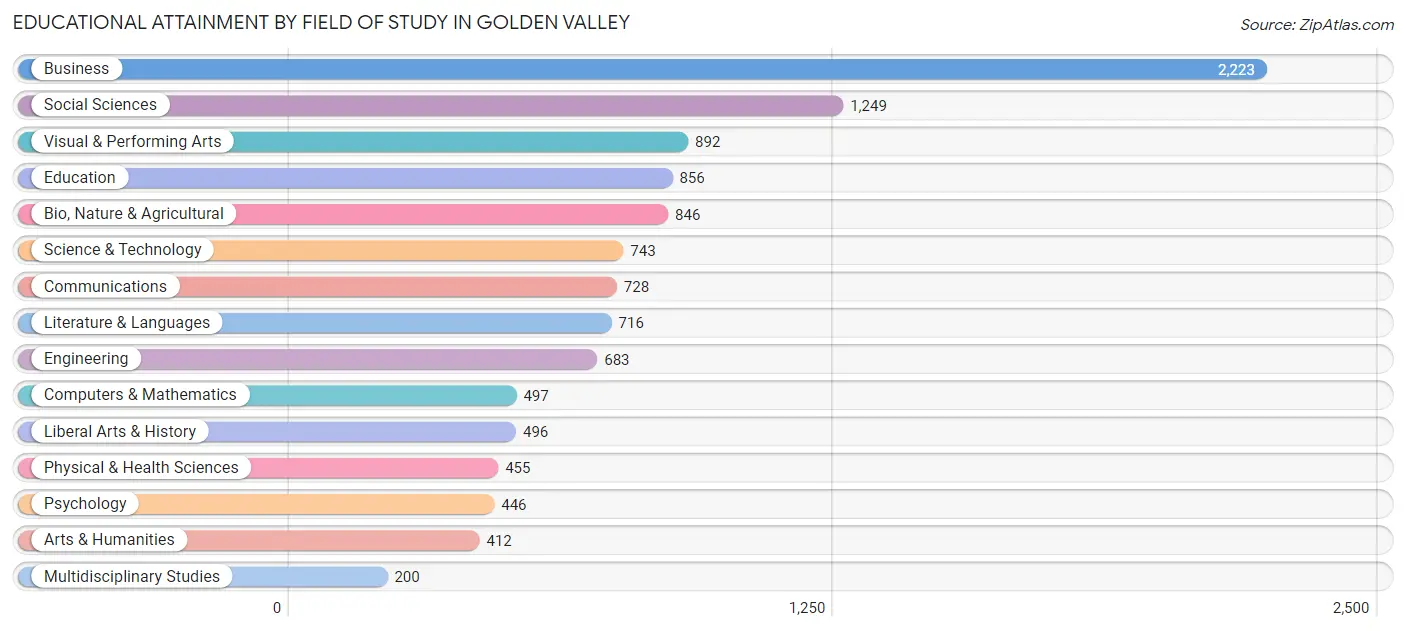
| Field of Study | # Graduates | % Graduates |
| Computers & Mathematics | 497 | 4.3% |
| Bio, Nature & Agricultural | 846 | 7.4% |
| Physical & Health Sciences | 455 | 4.0% |
| Psychology | 446 | 3.9% |
| Social Sciences | 1,249 | 10.9% |
| Engineering | 683 | 6.0% |
| Multidisciplinary Studies | 200 | 1.8% |
| Science & Technology | 743 | 6.5% |
| Business | 2,223 | 19.4% |
| Education | 856 | 7.5% |
| Literature & Languages | 716 | 6.3% |
| Liberal Arts & History | 496 | 4.3% |
| Visual & Performing Arts | 892 | 7.8% |
| Communications | 728 | 6.4% |
| Arts & Humanities | 412 | 3.6% |
| Total | 11,442 | 100.0% |
Transportation & Commute in Golden Valley
Vehicle Availability by Sex in Golden Valley
The most prevalent vehicle ownership categories in Golden Valley are males with 2 vehicles (3,365, accounting for 56.8%) and females with 2 vehicles (3,228, making up 57.7%).
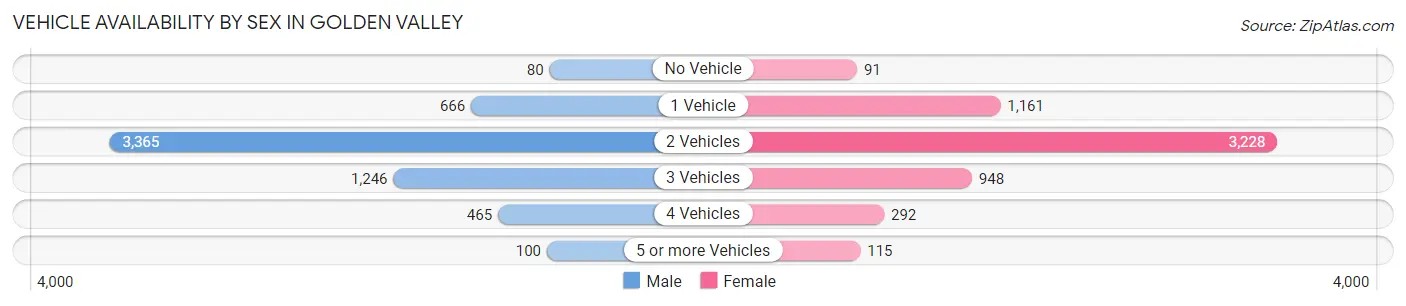
| Vehicles Available | Male | Female |
| No Vehicle | 80 (1.3%) | 91 (1.6%) |
| 1 Vehicle | 666 (11.3%) | 1,161 (19.9%) |
| 2 Vehicles | 3,365 (56.8%) | 3,228 (55.3%) |
| 3 Vehicles | 1,246 (21.0%) | 948 (16.3%) |
| 4 Vehicles | 465 (7.9%) | 292 (5.0%) |
| 5 or more Vehicles | 100 (1.7%) | 115 (2.0%) |
| Total | 5,922 (100.0%) | 5,835 (100.0%) |
Commute Time in Golden Valley
The most frequently occuring commute durations in Golden Valley are 20 to 24 minutes (2,287 commuters, 24.7%), 15 to 19 minutes (2,036 commuters, 22.0%), and 10 to 14 minutes (1,311 commuters, 14.2%).
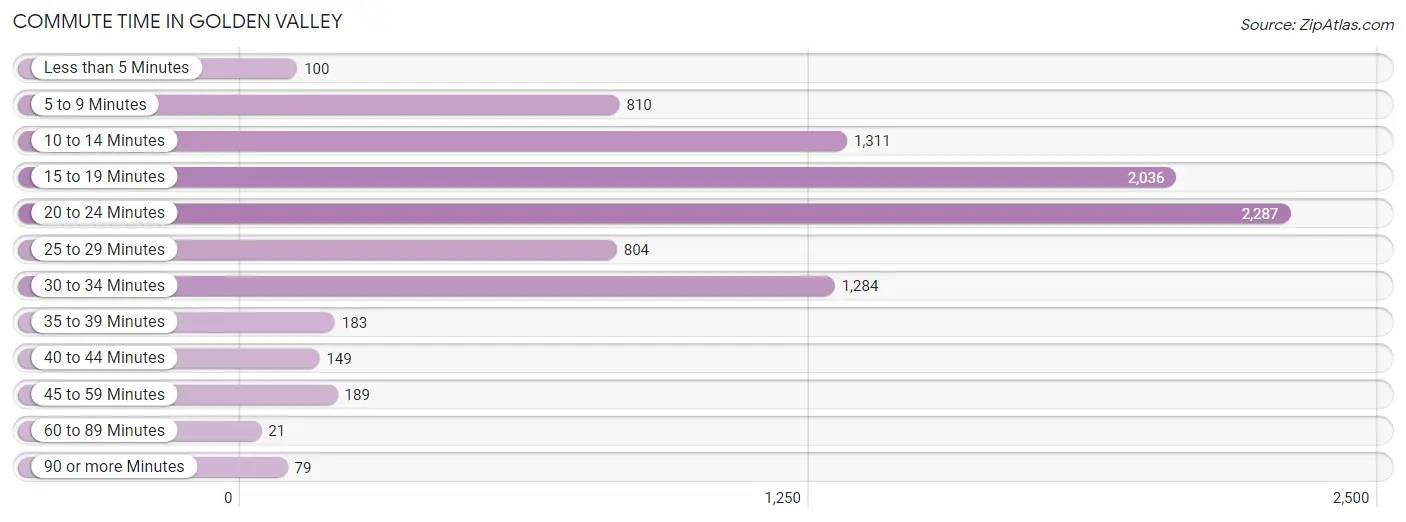
| Commute Time | # Commuters | % Commuters |
| Less than 5 Minutes | 100 | 1.1% |
| 5 to 9 Minutes | 810 | 8.7% |
| 10 to 14 Minutes | 1,311 | 14.2% |
| 15 to 19 Minutes | 2,036 | 22.0% |
| 20 to 24 Minutes | 2,287 | 24.7% |
| 25 to 29 Minutes | 804 | 8.7% |
| 30 to 34 Minutes | 1,284 | 13.9% |
| 35 to 39 Minutes | 183 | 2.0% |
| 40 to 44 Minutes | 149 | 1.6% |
| 45 to 59 Minutes | 189 | 2.0% |
| 60 to 89 Minutes | 21 | 0.2% |
| 90 or more Minutes | 79 | 0.9% |
Commute Time by Sex in Golden Valley
The most common commute times in Golden Valley are 20 to 24 minutes (1,203 commuters, 25.0%) for males and 15 to 19 minutes (1,178 commuters, 26.6%) for females.
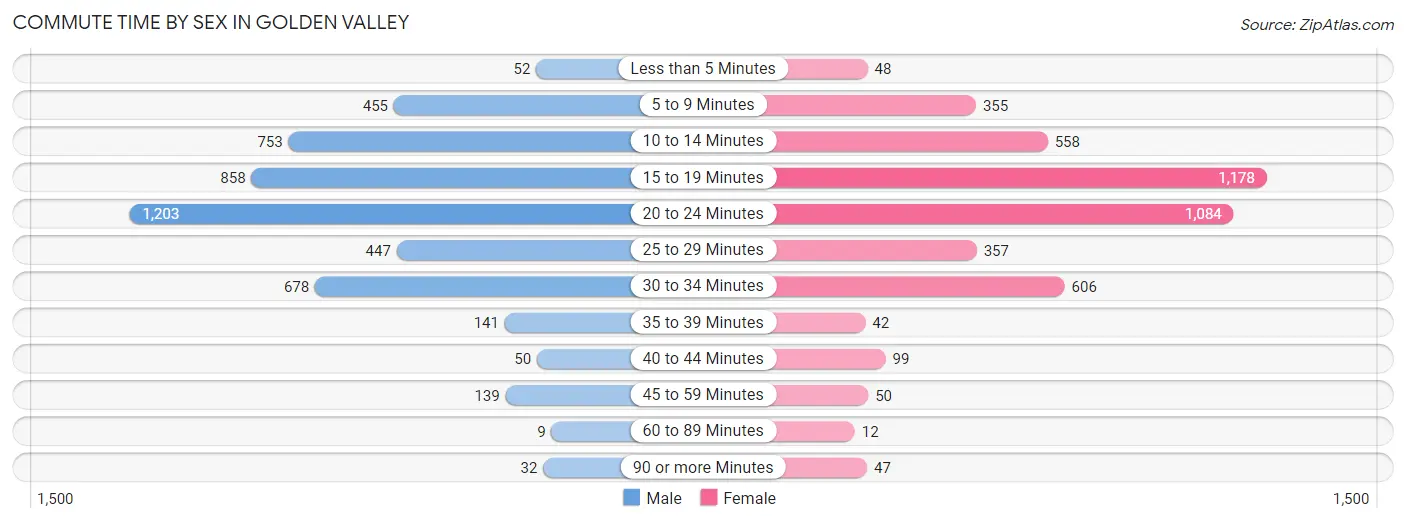
| Commute Time | Male | Female |
| Less than 5 Minutes | 52 (1.1%) | 48 (1.1%) |
| 5 to 9 Minutes | 455 (9.5%) | 355 (8.0%) |
| 10 to 14 Minutes | 753 (15.6%) | 558 (12.6%) |
| 15 to 19 Minutes | 858 (17.8%) | 1,178 (26.6%) |
| 20 to 24 Minutes | 1,203 (25.0%) | 1,084 (24.4%) |
| 25 to 29 Minutes | 447 (9.3%) | 357 (8.1%) |
| 30 to 34 Minutes | 678 (14.1%) | 606 (13.7%) |
| 35 to 39 Minutes | 141 (2.9%) | 42 (0.9%) |
| 40 to 44 Minutes | 50 (1.0%) | 99 (2.2%) |
| 45 to 59 Minutes | 139 (2.9%) | 50 (1.1%) |
| 60 to 89 Minutes | 9 (0.2%) | 12 (0.3%) |
| 90 or more Minutes | 32 (0.7%) | 47 (1.1%) |
Time of Departure to Work by Sex in Golden Valley
The most frequent times of departure to work in Golden Valley are 7:30 AM to 7:59 AM (1,000, 20.8%) for males and 7:30 AM to 7:59 AM (802, 18.1%) for females.
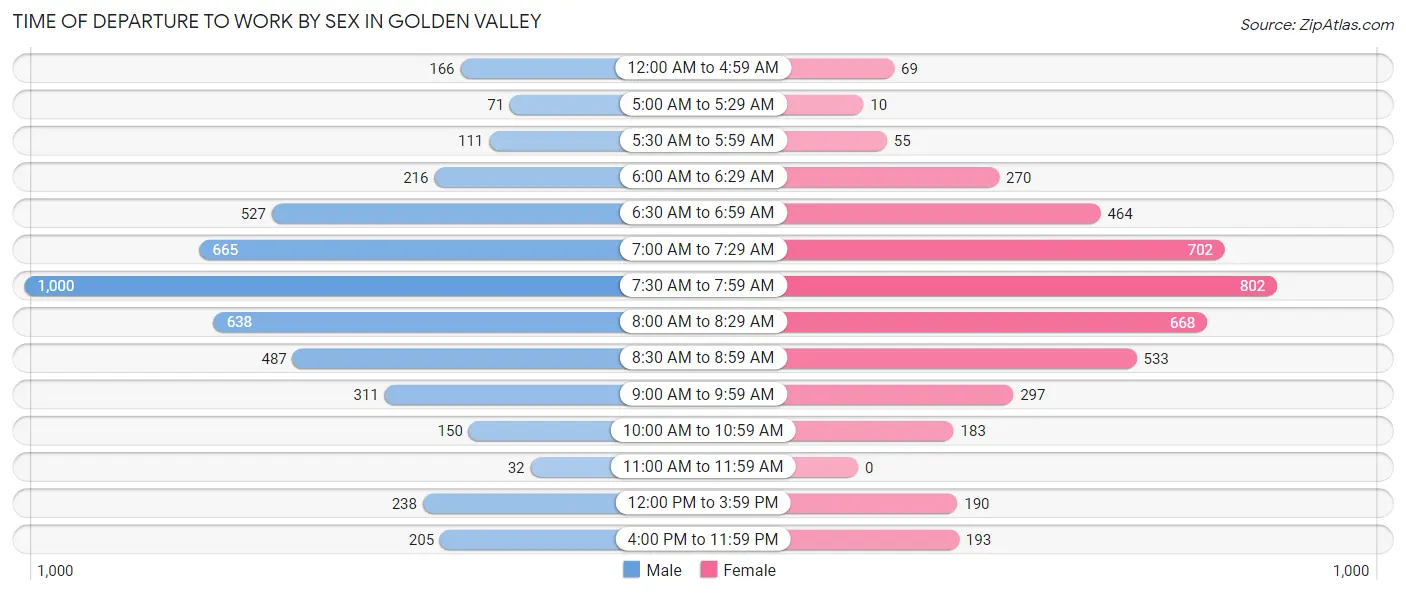
| Time of Departure | Male | Female |
| 12:00 AM to 4:59 AM | 166 (3.5%) | 69 (1.6%) |
| 5:00 AM to 5:29 AM | 71 (1.5%) | 10 (0.2%) |
| 5:30 AM to 5:59 AM | 111 (2.3%) | 55 (1.2%) |
| 6:00 AM to 6:29 AM | 216 (4.5%) | 270 (6.1%) |
| 6:30 AM to 6:59 AM | 527 (10.9%) | 464 (10.5%) |
| 7:00 AM to 7:29 AM | 665 (13.8%) | 702 (15.8%) |
| 7:30 AM to 7:59 AM | 1,000 (20.8%) | 802 (18.1%) |
| 8:00 AM to 8:29 AM | 638 (13.2%) | 668 (15.1%) |
| 8:30 AM to 8:59 AM | 487 (10.1%) | 533 (12.0%) |
| 9:00 AM to 9:59 AM | 311 (6.5%) | 297 (6.7%) |
| 10:00 AM to 10:59 AM | 150 (3.1%) | 183 (4.1%) |
| 11:00 AM to 11:59 AM | 32 (0.7%) | 0 (0.0%) |
| 12:00 PM to 3:59 PM | 238 (4.9%) | 190 (4.3%) |
| 4:00 PM to 11:59 PM | 205 (4.3%) | 193 (4.3%) |
| Total | 4,817 (100.0%) | 4,436 (100.0%) |
Housing Occupancy in Golden Valley
Occupancy by Ownership in Golden Valley
Of the total 9,778 dwellings in Golden Valley, owner-occupied units account for 6,988 (71.5%), while renter-occupied units make up 2,790 (28.5%).
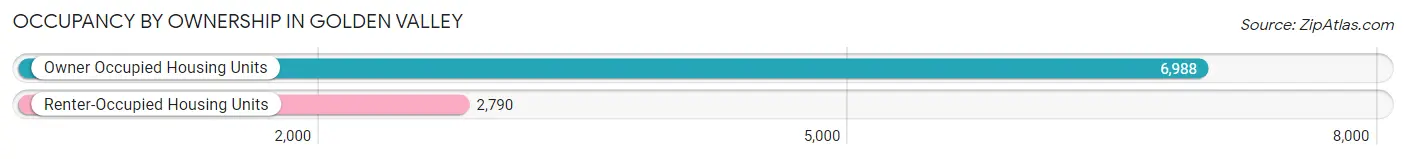
| Occupancy | # Housing Units | % Housing Units |
| Owner Occupied Housing Units | 6,988 | 71.5% |
| Renter-Occupied Housing Units | 2,790 | 28.5% |
| Total Occupied Housing Units | 9,778 | 100.0% |
Occupancy by Household Size in Golden Valley
| Household Size | # Housing Units | % Housing Units |
| 1-Person Household | 3,008 | 30.8% |
| 2-Person Household | 3,790 | 38.8% |
| 3-Person Household | 1,627 | 16.6% |
| 4+ Person Household | 1,353 | 13.8% |
| Total Housing Units | 9,778 | 100.0% |
Occupancy by Ownership by Household Size in Golden Valley
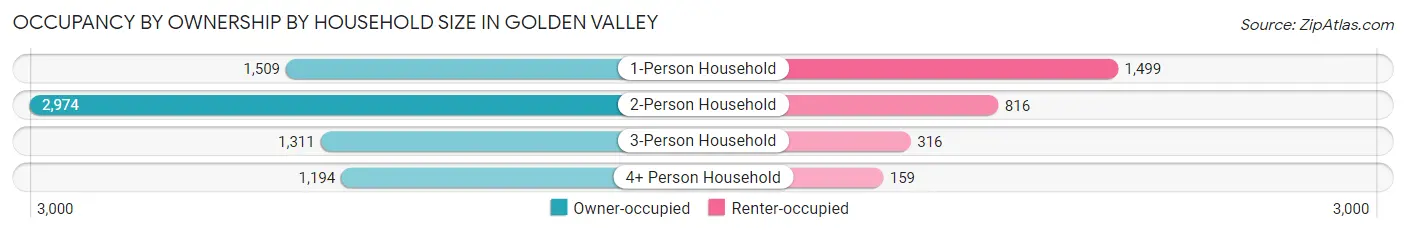
| Household Size | Owner-occupied | Renter-occupied |
| 1-Person Household | 1,509 (50.2%) | 1,499 (49.8%) |
| 2-Person Household | 2,974 (78.5%) | 816 (21.5%) |
| 3-Person Household | 1,311 (80.6%) | 316 (19.4%) |
| 4+ Person Household | 1,194 (88.2%) | 159 (11.7%) |
| Total Housing Units | 6,988 (71.5%) | 2,790 (28.5%) |
Occupancy by Educational Attainment in Golden Valley
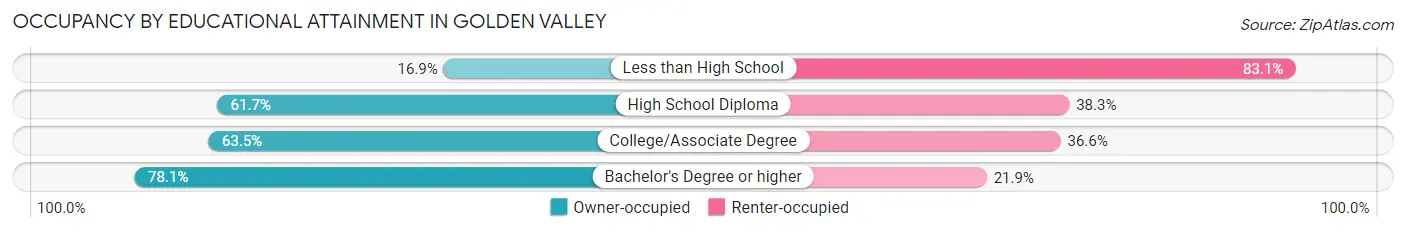
| Household Size | Owner-occupied | Renter-occupied |
| Less than High School | 41 (16.9%) | 201 (83.1%) |
| High School Diploma | 748 (61.7%) | 464 (38.3%) |
| College/Associate Degree | 1,304 (63.4%) | 751 (36.5%) |
| Bachelor's Degree or higher | 4,895 (78.1%) | 1,374 (21.9%) |
Occupancy by Age of Householder in Golden Valley
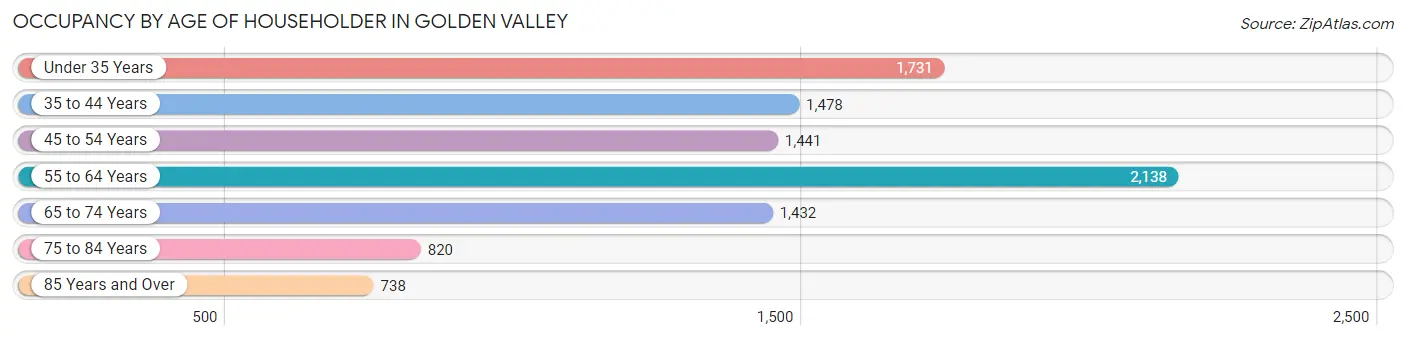
| Age Bracket | # Households | % Households |
| Under 35 Years | 1,731 | 17.7% |
| 35 to 44 Years | 1,478 | 15.1% |
| 45 to 54 Years | 1,441 | 14.7% |
| 55 to 64 Years | 2,138 | 21.9% |
| 65 to 74 Years | 1,432 | 14.6% |
| 75 to 84 Years | 820 | 8.4% |
| 85 Years and Over | 738 | 7.5% |
| Total | 9,778 | 100.0% |
Housing Finances in Golden Valley
Median Income by Occupancy in Golden Valley
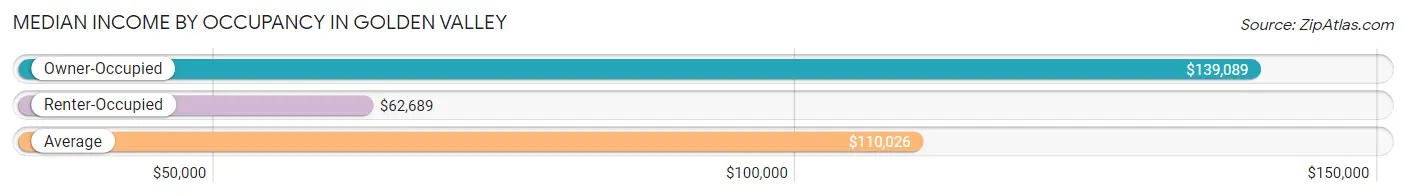
| Occupancy Type | # Households | Median Income |
| Owner-Occupied | 6,988 (71.5%) | $139,089 |
| Renter-Occupied | 2,790 (28.5%) | $62,689 |
| Average | 9,778 (100.0%) | $110,026 |
Occupancy by Householder Income Bracket in Golden Valley
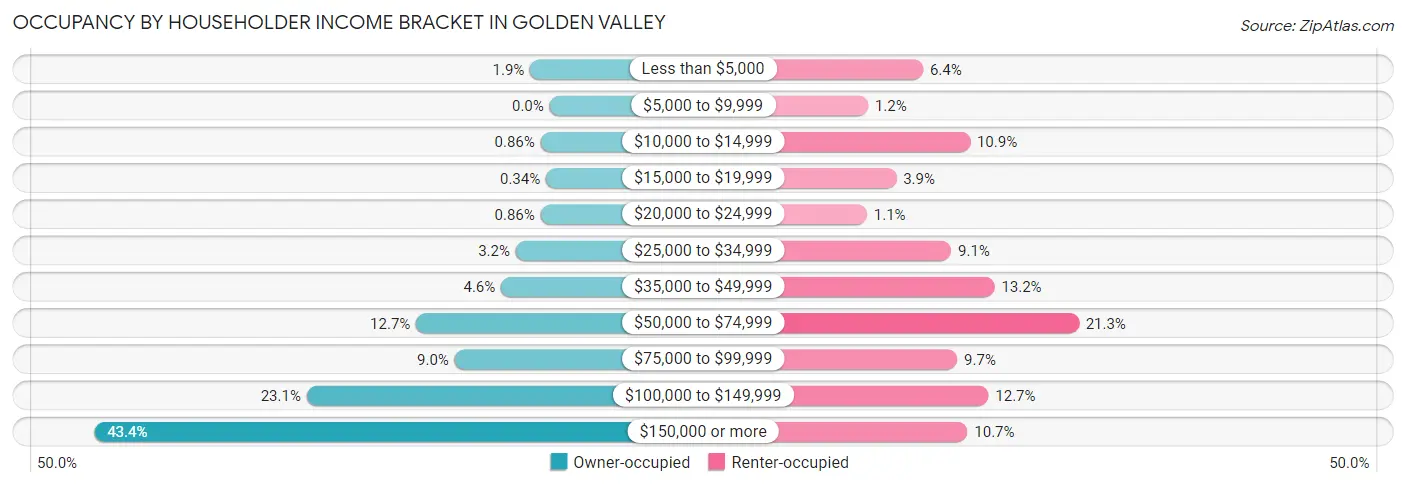
| Income Bracket | Owner-occupied | Renter-occupied |
| Less than $5,000 | 129 (1.8%) | 179 (6.4%) |
| $5,000 to $9,999 | 0 (0.0%) | 33 (1.2%) |
| $10,000 to $14,999 | 60 (0.9%) | 304 (10.9%) |
| $15,000 to $19,999 | 24 (0.3%) | 108 (3.9%) |
| $20,000 to $24,999 | 60 (0.9%) | 30 (1.1%) |
| $25,000 to $34,999 | 225 (3.2%) | 254 (9.1%) |
| $35,000 to $49,999 | 323 (4.6%) | 369 (13.2%) |
| $50,000 to $74,999 | 888 (12.7%) | 593 (21.2%) |
| $75,000 to $99,999 | 632 (9.0%) | 270 (9.7%) |
| $100,000 to $149,999 | 1,616 (23.1%) | 353 (12.7%) |
| $150,000 or more | 3,031 (43.4%) | 297 (10.6%) |
| Total | 6,988 (100.0%) | 2,790 (100.0%) |
Monthly Housing Cost Tiers in Golden Valley
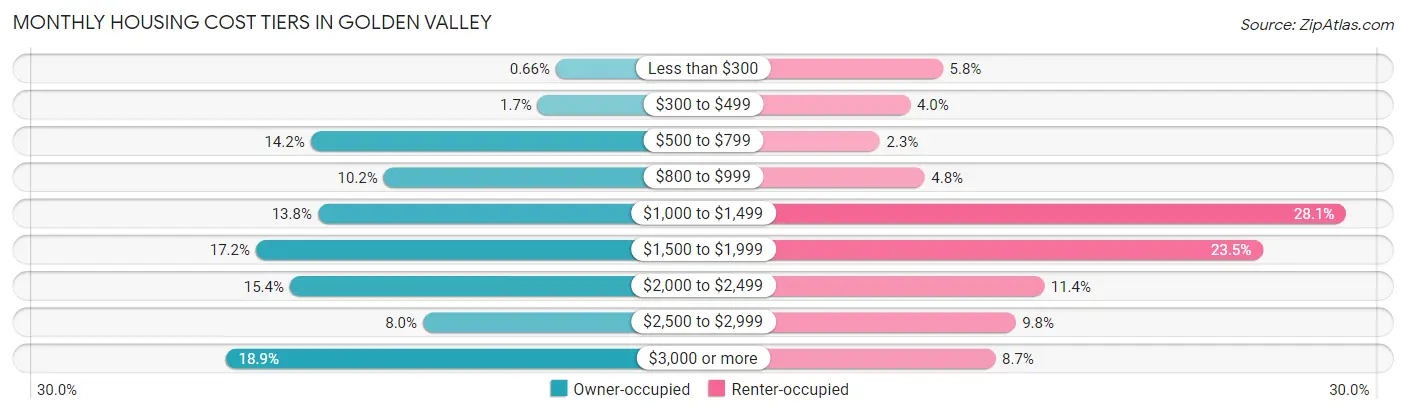
| Monthly Cost | Owner-occupied | Renter-occupied |
| Less than $300 | 46 (0.7%) | 162 (5.8%) |
| $300 to $499 | 116 (1.7%) | 112 (4.0%) |
| $500 to $799 | 993 (14.2%) | 65 (2.3%) |
| $800 to $999 | 711 (10.2%) | 134 (4.8%) |
| $1,000 to $1,499 | 965 (13.8%) | 784 (28.1%) |
| $1,500 to $1,999 | 1,204 (17.2%) | 656 (23.5%) |
| $2,000 to $2,499 | 1,073 (15.3%) | 318 (11.4%) |
| $2,500 to $2,999 | 559 (8.0%) | 274 (9.8%) |
| $3,000 or more | 1,321 (18.9%) | 243 (8.7%) |
| Total | 6,988 (100.0%) | 2,790 (100.0%) |
Physical Housing Characteristics in Golden Valley
Housing Structures in Golden Valley
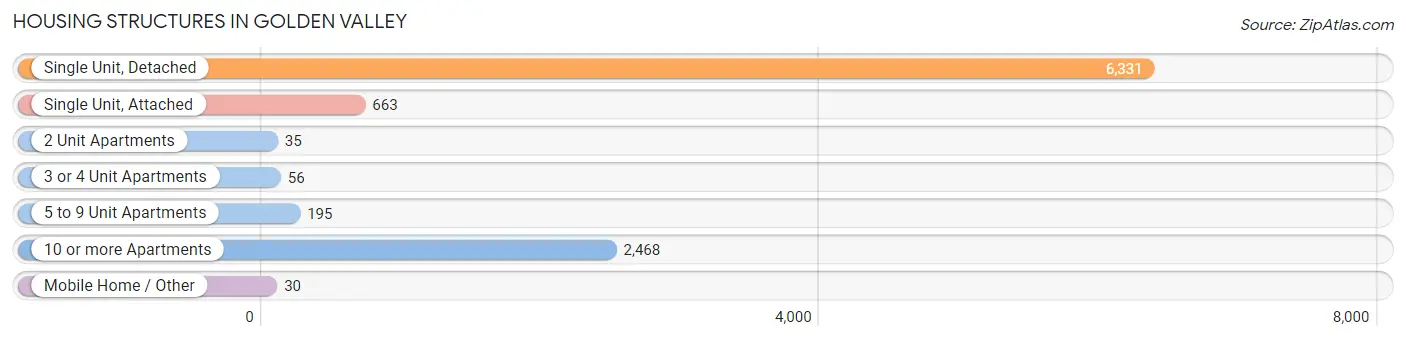
| Structure Type | # Housing Units | % Housing Units |
| Single Unit, Detached | 6,331 | 64.7% |
| Single Unit, Attached | 663 | 6.8% |
| 2 Unit Apartments | 35 | 0.4% |
| 3 or 4 Unit Apartments | 56 | 0.6% |
| 5 to 9 Unit Apartments | 195 | 2.0% |
| 10 or more Apartments | 2,468 | 25.2% |
| Mobile Home / Other | 30 | 0.3% |
| Total | 9,778 | 100.0% |
Housing Structures by Occupancy in Golden Valley
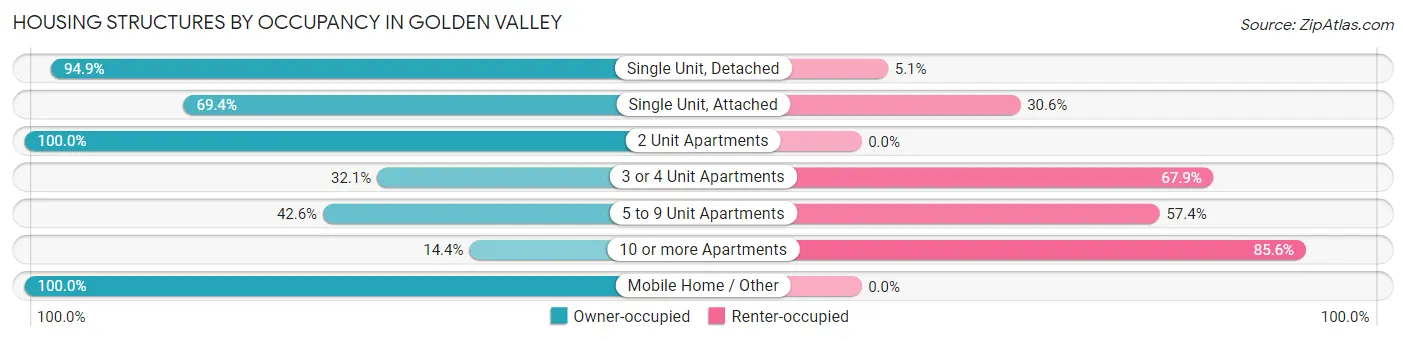
| Structure Type | Owner-occupied | Renter-occupied |
| Single Unit, Detached | 6,007 (94.9%) | 324 (5.1%) |
| Single Unit, Attached | 460 (69.4%) | 203 (30.6%) |
| 2 Unit Apartments | 35 (100.0%) | 0 (0.0%) |
| 3 or 4 Unit Apartments | 18 (32.1%) | 38 (67.9%) |
| 5 to 9 Unit Apartments | 83 (42.6%) | 112 (57.4%) |
| 10 or more Apartments | 355 (14.4%) | 2,113 (85.6%) |
| Mobile Home / Other | 30 (100.0%) | 0 (0.0%) |
| Total | 6,988 (71.5%) | 2,790 (28.5%) |
Housing Structures by Number of Rooms in Golden Valley
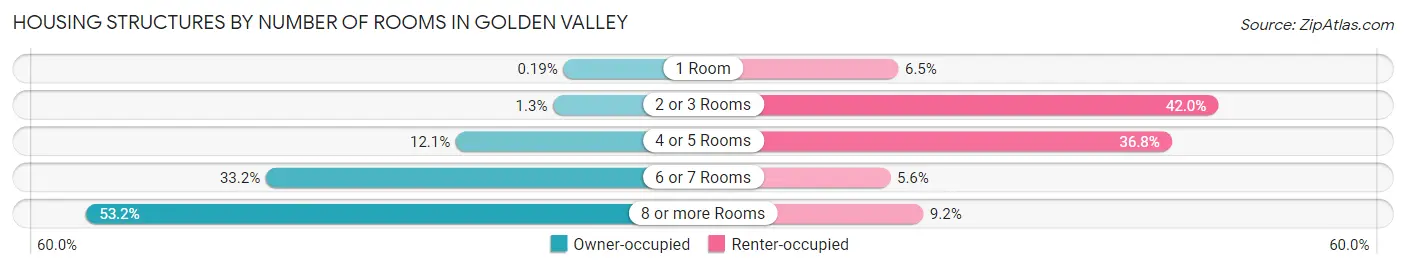
| Number of Rooms | Owner-occupied | Renter-occupied |
| 1 Room | 13 (0.2%) | 180 (6.5%) |
| 2 or 3 Rooms | 93 (1.3%) | 1,171 (42.0%) |
| 4 or 5 Rooms | 847 (12.1%) | 1,027 (36.8%) |
| 6 or 7 Rooms | 2,321 (33.2%) | 155 (5.6%) |
| 8 or more Rooms | 3,714 (53.1%) | 257 (9.2%) |
| Total | 6,988 (100.0%) | 2,790 (100.0%) |
Housing Structure by Heating Type in Golden Valley
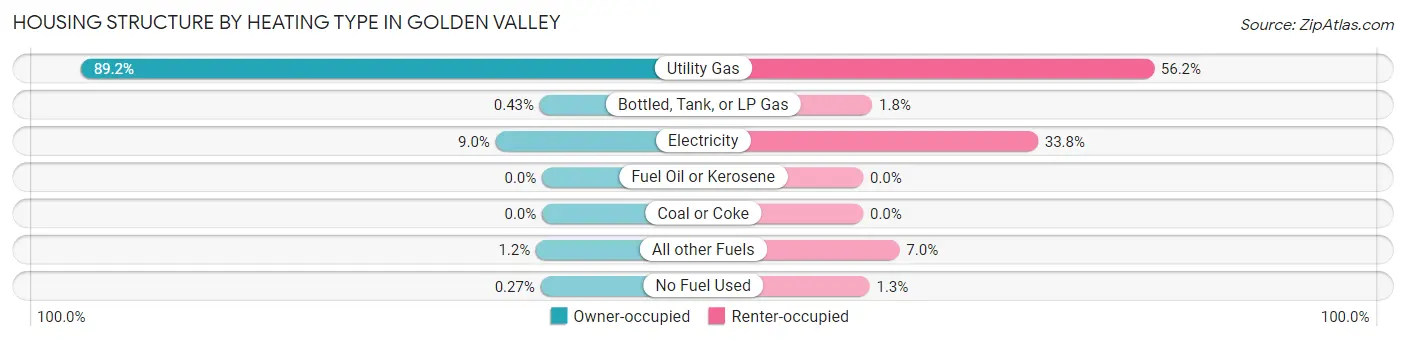
| Heating Type | Owner-occupied | Renter-occupied |
| Utility Gas | 6,230 (89.1%) | 1,568 (56.2%) |
| Bottled, Tank, or LP Gas | 30 (0.4%) | 49 (1.8%) |
| Electricity | 627 (9.0%) | 942 (33.8%) |
| Fuel Oil or Kerosene | 0 (0.0%) | 0 (0.0%) |
| Coal or Coke | 0 (0.0%) | 0 (0.0%) |
| All other Fuels | 82 (1.2%) | 196 (7.0%) |
| No Fuel Used | 19 (0.3%) | 35 (1.3%) |
| Total | 6,988 (100.0%) | 2,790 (100.0%) |
Household Vehicle Usage in Golden Valley
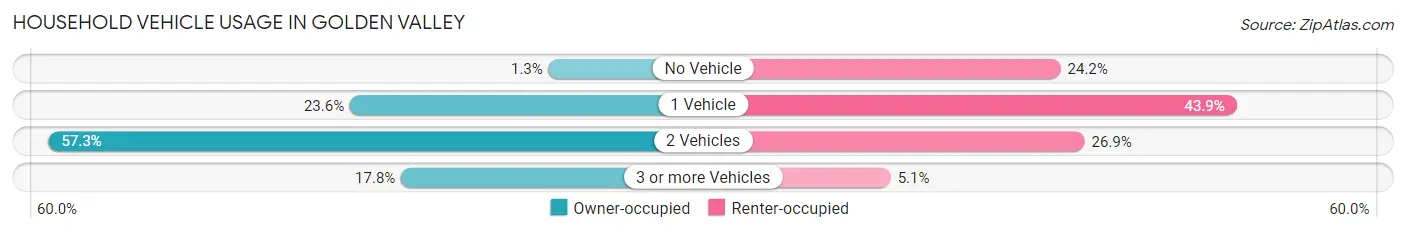
| Vehicles per Household | Owner-occupied | Renter-occupied |
| No Vehicle | 91 (1.3%) | 674 (24.2%) |
| 1 Vehicle | 1,646 (23.5%) | 1,224 (43.9%) |
| 2 Vehicles | 4,006 (57.3%) | 749 (26.9%) |
| 3 or more Vehicles | 1,245 (17.8%) | 143 (5.1%) |
| Total | 6,988 (100.0%) | 2,790 (100.0%) |
Real Estate & Mortgages in Golden Valley
Real Estate and Mortgage Overview in Golden Valley
| Characteristic | Without Mortgage | With Mortgage |
| Housing Units | 2,397 | 4,591 |
| Median Property Value | $351,000 | $402,000 |
| Median Household Income | $113,268 | $2,355 |
| Monthly Housing Costs | $827 | $1,274 |
| Real Estate Taxes | $4,488 | $13 |
Property Value by Mortgage Status in Golden Valley
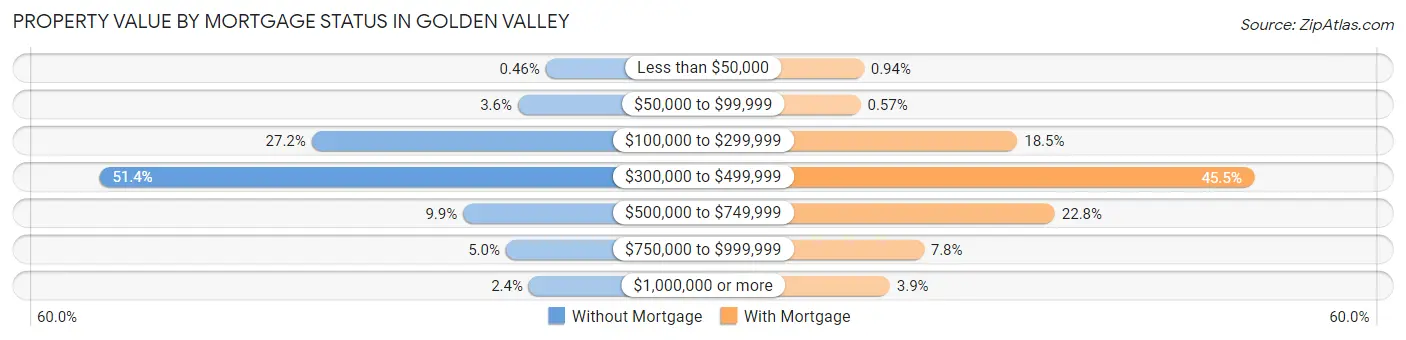
| Property Value | Without Mortgage | With Mortgage |
| Less than $50,000 | 11 (0.5%) | 43 (0.9%) |
| $50,000 to $99,999 | 87 (3.6%) | 26 (0.6%) |
| $100,000 to $299,999 | 652 (27.2%) | 849 (18.5%) |
| $300,000 to $499,999 | 1,233 (51.4%) | 2,089 (45.5%) |
| $500,000 to $749,999 | 237 (9.9%) | 1,046 (22.8%) |
| $750,000 to $999,999 | 120 (5.0%) | 358 (7.8%) |
| $1,000,000 or more | 57 (2.4%) | 180 (3.9%) |
| Total | 2,397 (100.0%) | 4,591 (100.0%) |
Household Income by Mortgage Status in Golden Valley
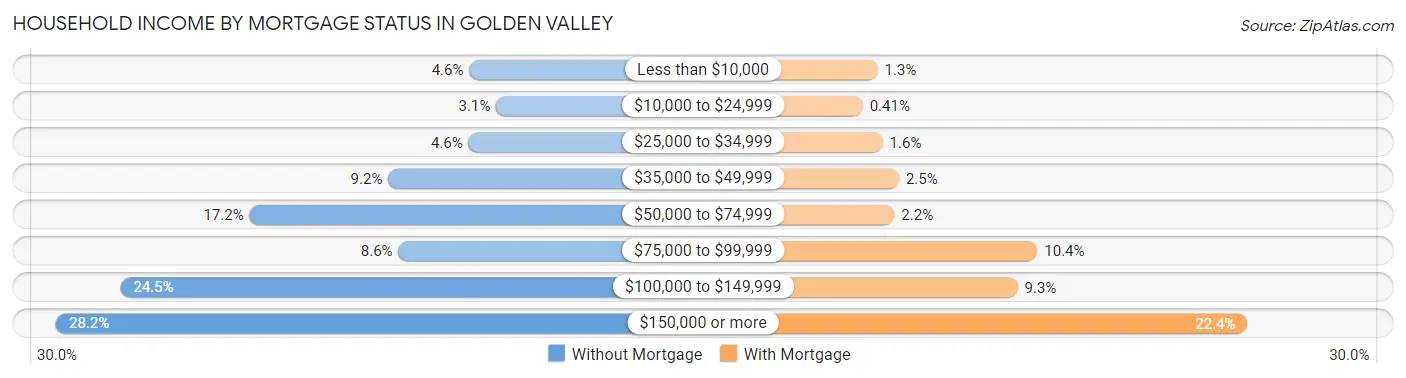
| Household Income | Without Mortgage | With Mortgage |
| Less than $10,000 | 110 (4.6%) | 58 (1.3%) |
| $10,000 to $24,999 | 73 (3.0%) | 19 (0.4%) |
| $25,000 to $34,999 | 111 (4.6%) | 71 (1.5%) |
| $35,000 to $49,999 | 221 (9.2%) | 114 (2.5%) |
| $50,000 to $74,999 | 411 (17.2%) | 102 (2.2%) |
| $75,000 to $99,999 | 207 (8.6%) | 477 (10.4%) |
| $100,000 to $149,999 | 588 (24.5%) | 425 (9.3%) |
| $150,000 or more | 676 (28.2%) | 1,028 (22.4%) |
| Total | 2,397 (100.0%) | 4,591 (100.0%) |
Property Value to Household Income Ratio in Golden Valley
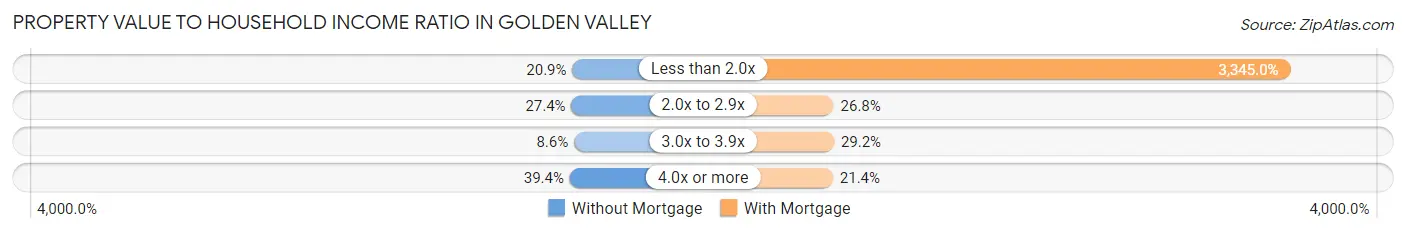
| Value-to-Income Ratio | Without Mortgage | With Mortgage |
| Less than 2.0x | 502 (20.9%) | 153,569 (3,345.0%) |
| 2.0x to 2.9x | 657 (27.4%) | 1,229 (26.8%) |
| 3.0x to 3.9x | 206 (8.6%) | 1,341 (29.2%) |
| 4.0x or more | 944 (39.4%) | 983 (21.4%) |
| Total | 2,397 (100.0%) | 4,591 (100.0%) |
Real Estate Taxes by Mortgage Status in Golden Valley
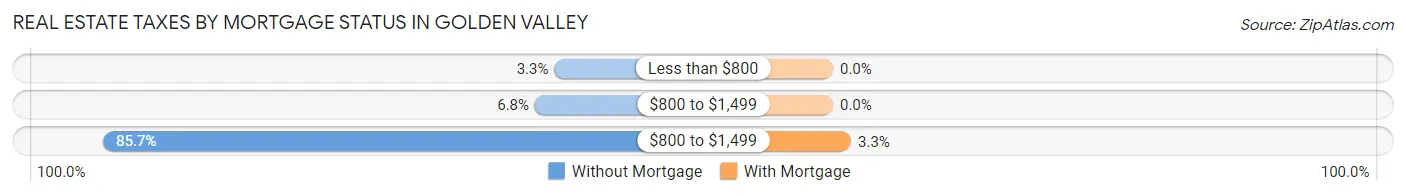
| Property Taxes | Without Mortgage | With Mortgage |
| Less than $800 | 78 (3.3%) | 0 (0.0%) |
| $800 to $1,499 | 163 (6.8%) | 0 (0.0%) |
| $800 to $1,499 | 2,053 (85.7%) | 151 (3.3%) |
| Total | 2,397 (100.0%) | 4,591 (100.0%) |
Health & Disability in Golden Valley
Health Insurance Coverage by Age in Golden Valley
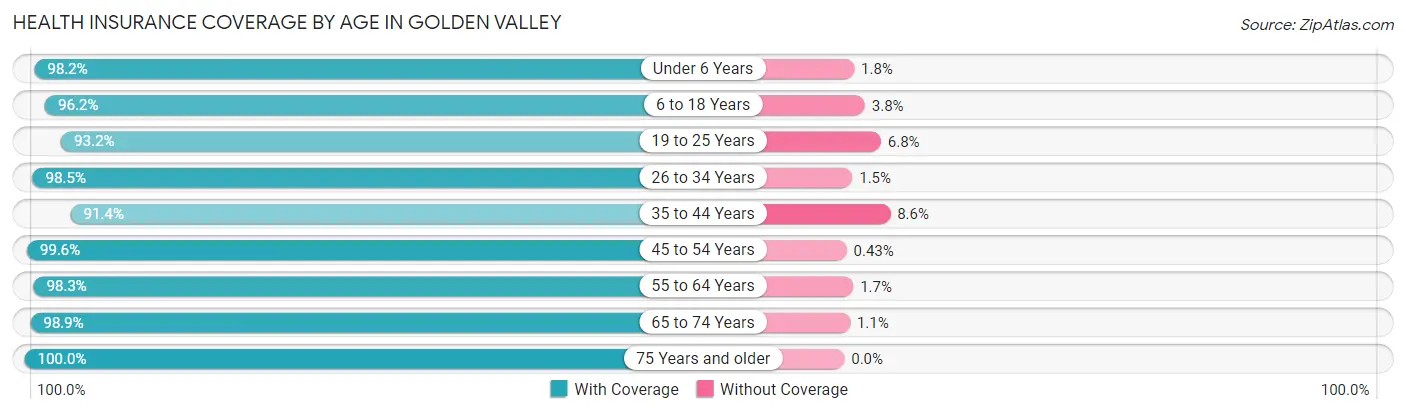
| Age Bracket | With Coverage | Without Coverage |
| Under 6 Years | 1,287 (98.2%) | 24 (1.8%) |
| 6 to 18 Years | 2,612 (96.2%) | 104 (3.8%) |
| 19 to 25 Years | 1,271 (93.2%) | 93 (6.8%) |
| 26 to 34 Years | 2,452 (98.5%) | 37 (1.5%) |
| 35 to 44 Years | 2,774 (91.4%) | 260 (8.6%) |
| 45 to 54 Years | 2,518 (99.6%) | 11 (0.4%) |
| 55 to 64 Years | 3,663 (98.3%) | 62 (1.7%) |
| 65 to 74 Years | 2,418 (98.9%) | 26 (1.1%) |
| 75 Years and older | 2,258 (100.0%) | 0 (0.0%) |
| Total | 21,253 (97.2%) | 617 (2.8%) |
Health Insurance Coverage by Citizenship Status in Golden Valley
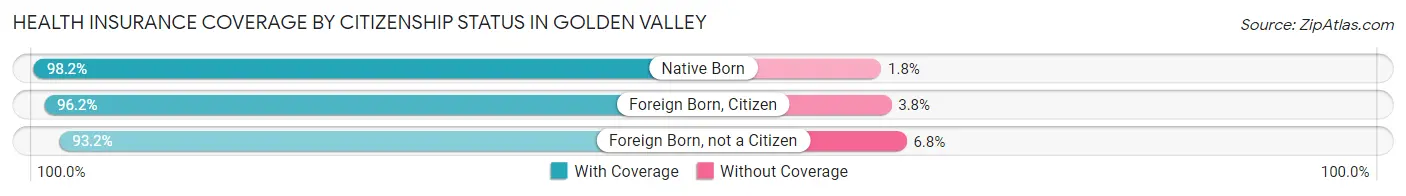
| Citizenship Status | With Coverage | Without Coverage |
| Native Born | 1,287 (98.2%) | 24 (1.8%) |
| Foreign Born, Citizen | 2,612 (96.2%) | 104 (3.8%) |
| Foreign Born, not a Citizen | 1,271 (93.2%) | 93 (6.8%) |
Health Insurance Coverage by Household Income in Golden Valley
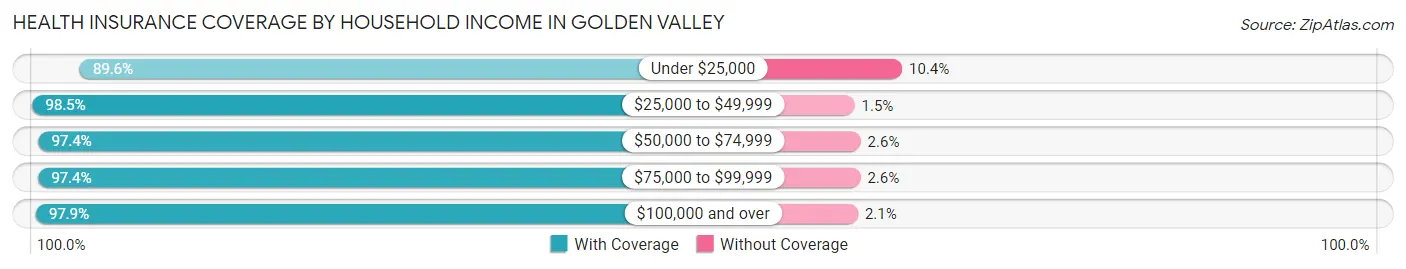
| Household Income | With Coverage | Without Coverage |
| Under $25,000 | 1,635 (89.6%) | 189 (10.4%) |
| $25,000 to $49,999 | 1,554 (98.5%) | 23 (1.5%) |
| $50,000 to $74,999 | 2,361 (97.4%) | 63 (2.6%) |
| $75,000 to $99,999 | 1,863 (97.4%) | 49 (2.6%) |
| $100,000 and over | 13,666 (97.9%) | 293 (2.1%) |
Public vs Private Health Insurance Coverage by Age in Golden Valley
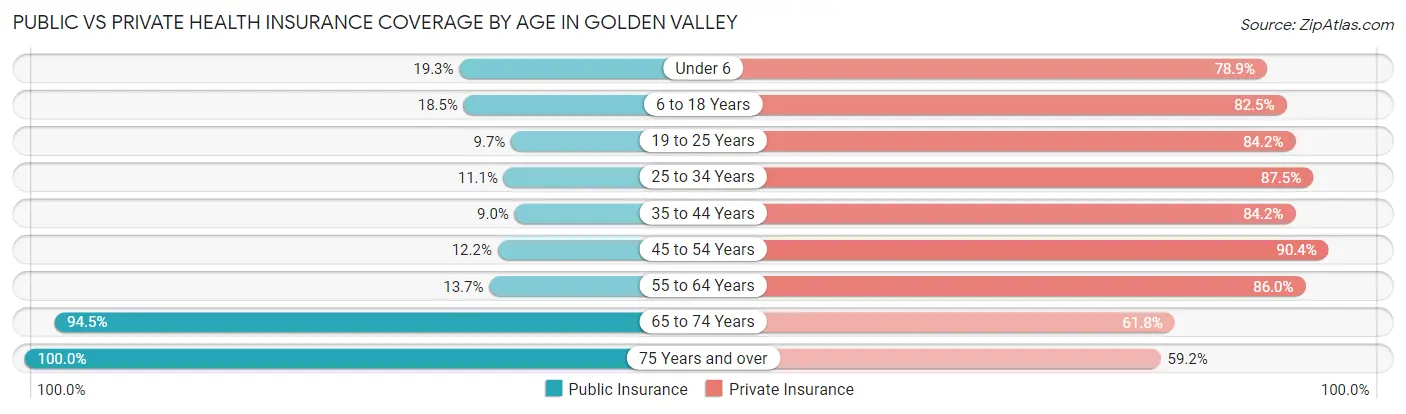
| Age Bracket | Public Insurance | Private Insurance |
| Under 6 | 253 (19.3%) | 1,034 (78.9%) |
| 6 to 18 Years | 502 (18.5%) | 2,241 (82.5%) |
| 19 to 25 Years | 132 (9.7%) | 1,148 (84.2%) |
| 25 to 34 Years | 275 (11.1%) | 2,177 (87.5%) |
| 35 to 44 Years | 274 (9.0%) | 2,553 (84.2%) |
| 45 to 54 Years | 308 (12.2%) | 2,285 (90.3%) |
| 55 to 64 Years | 512 (13.7%) | 3,205 (86.0%) |
| 65 to 74 Years | 2,310 (94.5%) | 1,510 (61.8%) |
| 75 Years and over | 2,258 (100.0%) | 1,336 (59.2%) |
| Total | 6,824 (31.2%) | 17,489 (80.0%) |
Disability Status by Sex by Age in Golden Valley
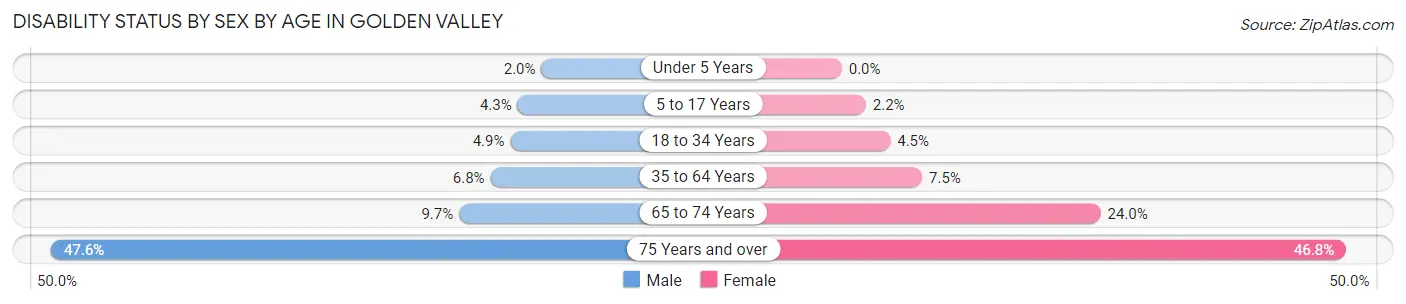
| Age Bracket | Male | Female |
| Under 5 Years | 10 (2.0%) | 0 (0.0%) |
| 5 to 17 Years | 65 (4.3%) | 29 (2.2%) |
| 18 to 34 Years | 99 (4.9%) | 90 (4.5%) |
| 35 to 64 Years | 300 (6.8%) | 362 (7.4%) |
| 65 to 74 Years | 98 (9.7%) | 344 (24.0%) |
| 75 Years and over | 465 (47.5%) | 599 (46.8%) |
Disability Class by Sex by Age in Golden Valley
Disability Class: Hearing Difficulty
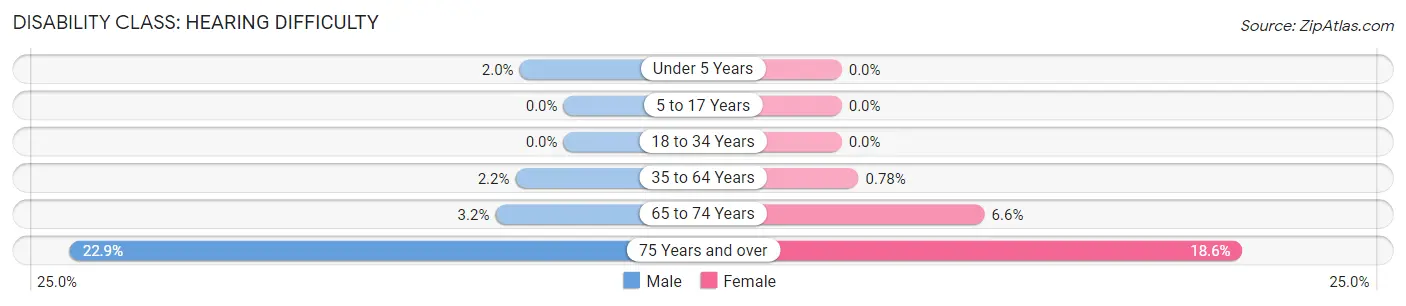
| Age Bracket | Male | Female |
| Under 5 Years | 10 (2.0%) | 0 (0.0%) |
| 5 to 17 Years | 0 (0.0%) | 0 (0.0%) |
| 18 to 34 Years | 0 (0.0%) | 0 (0.0%) |
| 35 to 64 Years | 99 (2.2%) | 38 (0.8%) |
| 65 to 74 Years | 32 (3.2%) | 95 (6.6%) |
| 75 Years and over | 224 (22.9%) | 238 (18.6%) |
Disability Class: Vision Difficulty
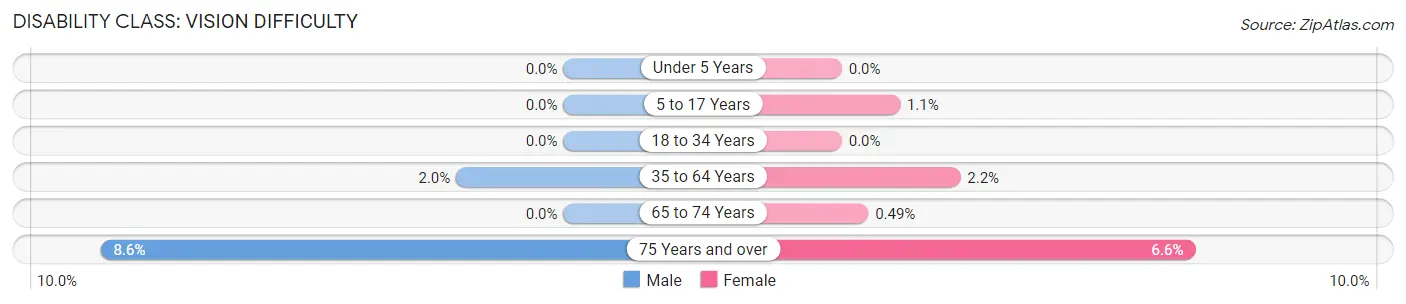
| Age Bracket | Male | Female |
| Under 5 Years | 0 (0.0%) | 0 (0.0%) |
| 5 to 17 Years | 0 (0.0%) | 14 (1.1%) |
| 18 to 34 Years | 0 (0.0%) | 0 (0.0%) |
| 35 to 64 Years | 88 (2.0%) | 107 (2.2%) |
| 65 to 74 Years | 0 (0.0%) | 7 (0.5%) |
| 75 Years and over | 84 (8.6%) | 84 (6.6%) |
Disability Class: Cognitive Difficulty
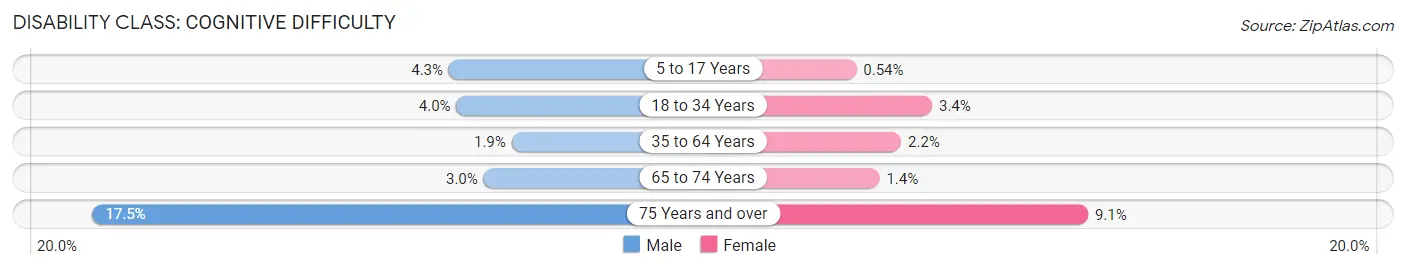
| Age Bracket | Male | Female |
| 5 to 17 Years | 65 (4.3%) | 7 (0.5%) |
| 18 to 34 Years | 80 (4.0%) | 67 (3.4%) |
| 35 to 64 Years | 85 (1.9%) | 107 (2.2%) |
| 65 to 74 Years | 30 (3.0%) | 20 (1.4%) |
| 75 Years and over | 171 (17.5%) | 117 (9.1%) |
Disability Class: Ambulatory Difficulty
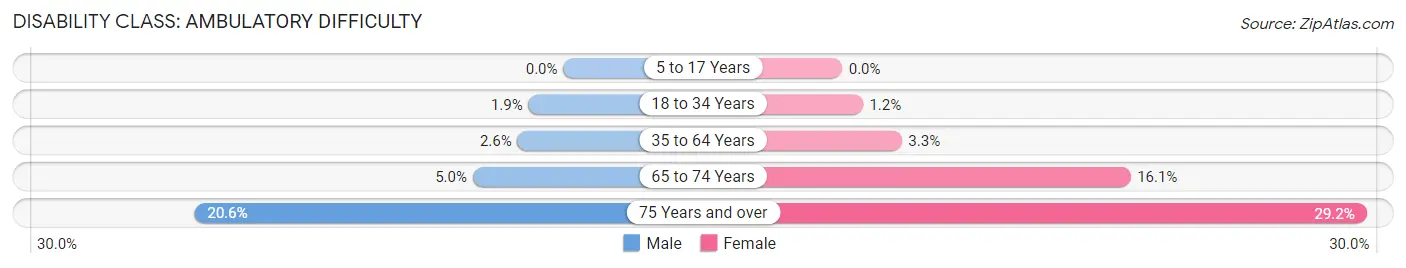
| Age Bracket | Male | Female |
| 5 to 17 Years | 0 (0.0%) | 0 (0.0%) |
| 18 to 34 Years | 39 (1.9%) | 23 (1.1%) |
| 35 to 64 Years | 113 (2.5%) | 161 (3.3%) |
| 65 to 74 Years | 51 (5.0%) | 230 (16.1%) |
| 75 Years and over | 201 (20.5%) | 374 (29.2%) |
Disability Class: Self-Care Difficulty
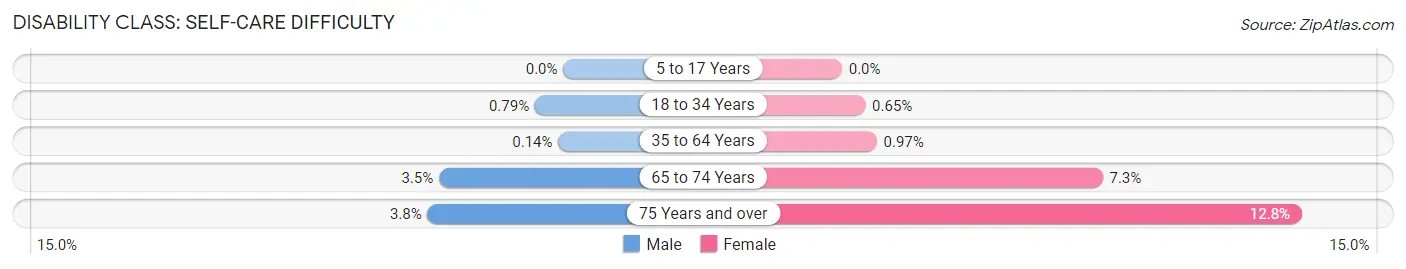
| Age Bracket | Male | Female |
| 5 to 17 Years | 0 (0.0%) | 0 (0.0%) |
| 18 to 34 Years | 16 (0.8%) | 13 (0.6%) |
| 35 to 64 Years | 6 (0.1%) | 47 (1.0%) |
| 65 to 74 Years | 35 (3.5%) | 104 (7.3%) |
| 75 Years and over | 37 (3.8%) | 164 (12.8%) |
Technology Access in Golden Valley
Computing Device Access in Golden Valley
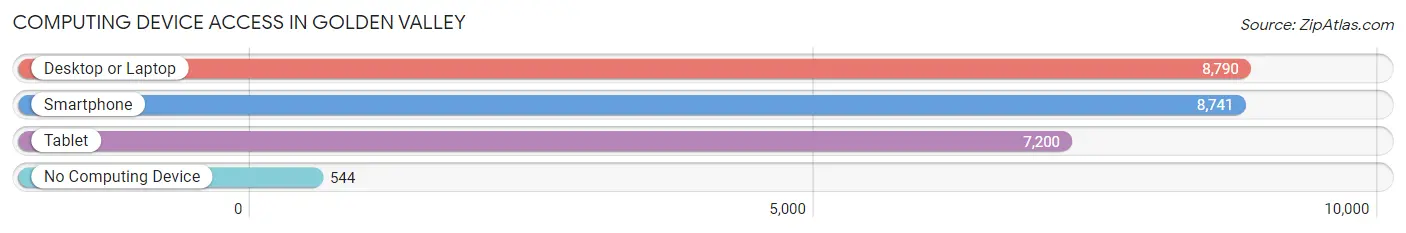
| Device Type | # Households | % Households |
| Desktop or Laptop | 8,790 | 89.9% |
| Smartphone | 8,741 | 89.4% |
| Tablet | 7,200 | 73.6% |
| No Computing Device | 544 | 5.6% |
| Total | 9,778 | 100.0% |
Internet Access in Golden Valley
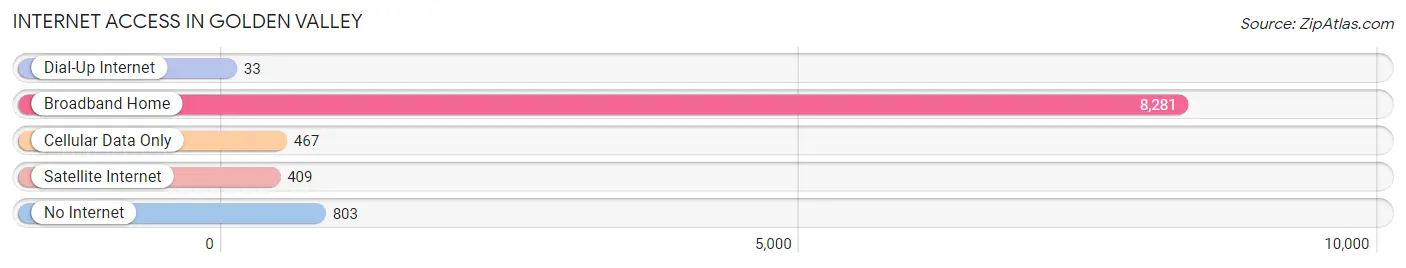
| Internet Type | # Households | % Households |
| Dial-Up Internet | 33 | 0.3% |
| Broadband Home | 8,281 | 84.7% |
| Cellular Data Only | 467 | 4.8% |
| Satellite Internet | 409 | 4.2% |
| No Internet | 803 | 8.2% |
| Total | 9,778 | 100.0% |
Golden Valley Summary
Geography
Golden Valley is a city located in Hennepin County, Minnesota, United States. It is a western suburb of Minneapolis and is part of the Twin Cities metropolitan area. The city is located on the west bank of the Mississippi River, just north of Minneapolis. The city has a total area of 8.2 square miles, of which 8.1 square miles is land and 0.1 square miles is water.
History
The area that is now Golden Valley was originally inhabited by the Dakota Sioux. The first European settlers arrived in the area in the mid-1800s. The area was originally known as "Bassett's Creek," named after the creek that runs through the city. In 1877, the area was renamed "Golden Valley" after the golden hue of the surrounding hills.
In the late 1800s, the area began to develop as a residential suburb of Minneapolis. The first post office was established in 1887 and the first school was built in 1889. The city was officially incorporated in 1886.
In the early 1900s, the city began to grow rapidly. The population increased from 1,000 in 1900 to over 10,000 by 1950. The city continued to grow throughout the 20th century and by 2000, the population had reached 20,371.
Economy
Golden Valley is home to a variety of businesses and industries. The city is home to several large corporations, including General Mills, Honeywell, and Pentair. The city is also home to several smaller businesses, including restaurants, retail stores, and professional services.
The city is also home to several educational institutions, including the University of Minnesota, Augsburg University, and the Minneapolis College of Art and Design.
Demographics
As of the 2010 census, the population of Golden Valley was 20,371. The racial makeup of the city was 87.3% White, 5.2% African American, 0.5% Native American, 3.2% Asian, 0.1% Pacific Islander, 1.7% from other races, and 2.1% from two or more races. Hispanic or Latino of any race were 4.2% of the population.
The median household income in Golden Valley was $76,845 in 2017. The median home value was $310,000 in 2017. The median age of the city was 43.7 years.
Conclusion
Golden Valley is a city located in Hennepin County, Minnesota, United States. It is a western suburb of Minneapolis and is part of the Twin Cities metropolitan area. The city has a long history, dating back to the 1800s when it was first settled by European settlers. The city has grown rapidly over the years and is now home to a variety of businesses and industries. The population of Golden Valley is 20,371, with a median household income of $76,845 and a median home value of $310,000.
Common Questions
What is Per Capita Income in Golden Valley?
Per Capita income in Golden Valley is $62,819.
What is the Median Family Income in Golden Valley?
Median Family Income in Golden Valley is $145,617.
What is the Median Household income in Golden Valley?
Median Household Income in Golden Valley is $110,026.
What is Income or Wage Gap in Golden Valley?
Income or Wage Gap in Golden Valley is 26.9%.
Women in Golden Valley earn 73.1 cents for every dollar earned by a man.
What is Inequality or Gini Index in Golden Valley?
Inequality or Gini Index in Golden Valley is 0.45.
What is the Total Population of Golden Valley?
Total Population of Golden Valley is 22,142.
What is the Total Male Population of Golden Valley?
Total Male Population of Golden Valley is 10,615.
What is the Total Female Population of Golden Valley?
Total Female Population of Golden Valley is 11,527.
What is the Ratio of Males per 100 Females in Golden Valley?
There are 92.09 Males per 100 Females in Golden Valley.
What is the Ratio of Females per 100 Males in Golden Valley?
There are 108.59 Females per 100 Males in Golden Valley.
What is the Median Population Age in Golden Valley?
Median Population Age in Golden Valley is 45.8 Years.
What is the Average Family Size in Golden Valley
Average Family Size in Golden Valley is 2.8 People.
What is the Average Household Size in Golden Valley
Average Household Size in Golden Valley is 2.2 People.
How Large is the Labor Force in Golden Valley?
There are 12,376 People in the Labor Forcein in Golden Valley.
What is the Percentage of People in the Labor Force in Golden Valley?
65.9% of People are in the Labor Force in Golden Valley.
What is the Unemployment Rate in Golden Valley?
Unemployment Rate in Golden Valley is 3.2%.