Kerrick, MN Map & Demographics
Kerrick Map
Kerrick Overview
$28,317
PER CAPITA INCOME
$58,750
AVG FAMILY INCOME
$42,500
AVG HOUSEHOLD INCOME
0.24
INEQUALITY / GINI INDEX
24
TOTAL POPULATION
15
MALE POPULATION
9
FEMALE POPULATION
166.67
MALES / 100 FEMALES
60.00
FEMALES / 100 MALES
37.5
MEDIAN AGE
2.8
AVG FAMILY SIZE
2.0
AVG HOUSEHOLD SIZE
18
LABOR FORCE [ PEOPLE ]
90.0%
PERCENT IN LABOR FORCE
55.6%
UNEMPLOYMENT RATE
Kerrick Zip Codes
Kerrick Area Codes
Income in Kerrick
Income Overview in Kerrick
Per Capita Income in Kerrick is $28,317, while median incomes of families and households are $58,750 and $42,500 respectively.
| Characteristic | Number | Measure |
| Per Capita Income | 24 | $28,317 |
| Median Family Income | 4 | $58,750 |
| Mean Family Income | 4 | $67,125 |
| Median Household Income | 12 | $42,500 |
| Mean Household Income | 12 | $57,575 |
| Income Deficit | 4 | $0 |
| Wage / Income Gap (%) | 24 | 0.00% |
| Wage / Income Gap ($) | 24 | 100.00¢ per $1 |
| Gini / Inequality Index | 24 | 0.24 |
Earnings by Sex in Kerrick
| Sex | Number | Average Earnings |
| Male | 11 (61.1%) | $0 |
| Female | 7 (38.9%) | $0 |
| Total | 18 (100.0%) | $0 |
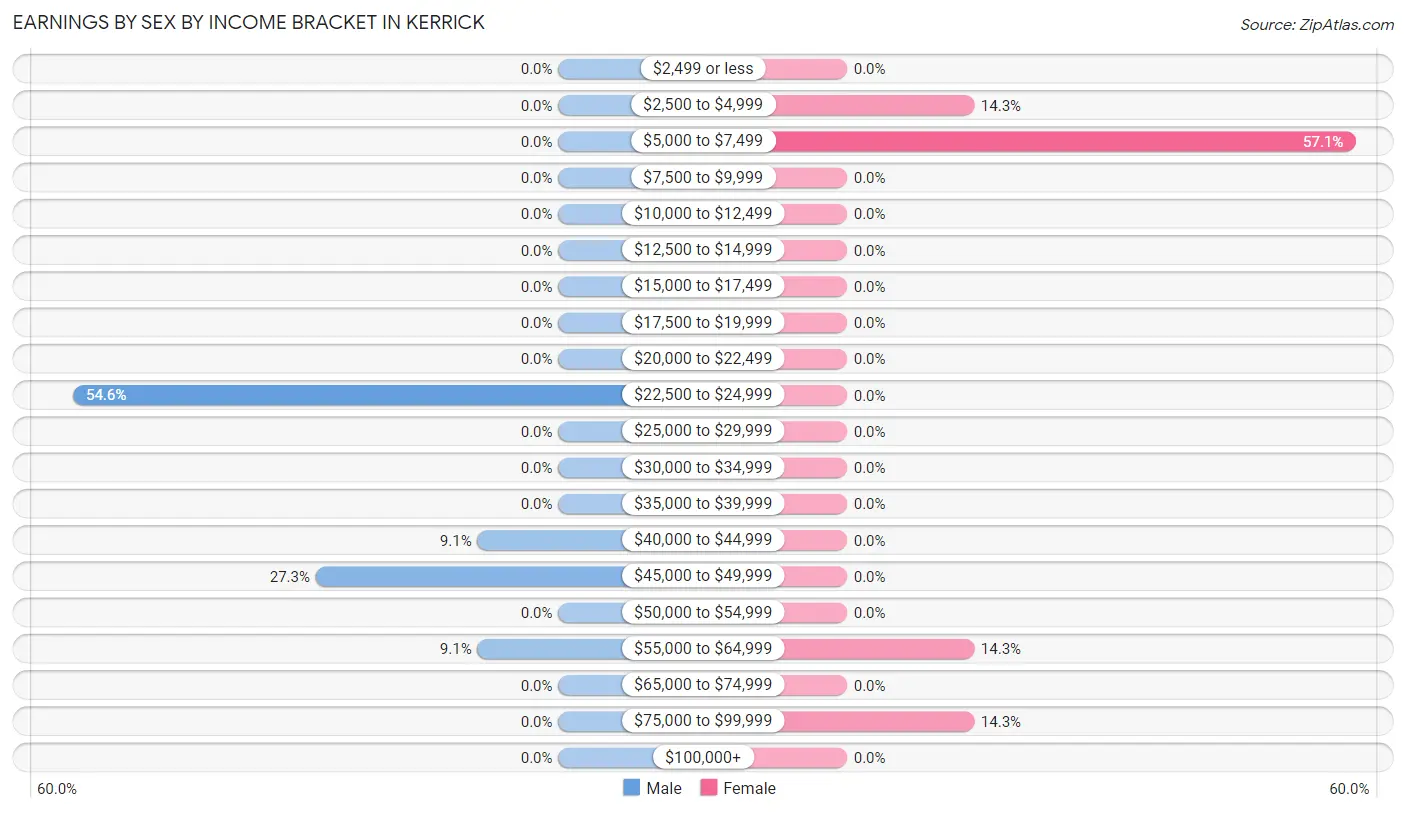
Earnings by Sex by Income Bracket in Kerrick
The most common earnings brackets in Kerrick are $22,500 to $24,999 for men (6 | 54.5%) and $5,000 to $7,499 for women (4 | 57.1%).
| Income | Male | Female |
| $2,499 or less | 0 (0.0%) | 0 (0.0%) |
| $2,500 to $4,999 | 0 (0.0%) | 1 (14.3%) |
| $5,000 to $7,499 | 0 (0.0%) | 4 (57.1%) |
| $7,500 to $9,999 | 0 (0.0%) | 0 (0.0%) |
| $10,000 to $12,499 | 0 (0.0%) | 0 (0.0%) |
| $12,500 to $14,999 | 0 (0.0%) | 0 (0.0%) |
| $15,000 to $17,499 | 0 (0.0%) | 0 (0.0%) |
| $17,500 to $19,999 | 0 (0.0%) | 0 (0.0%) |
| $20,000 to $22,499 | 0 (0.0%) | 0 (0.0%) |
| $22,500 to $24,999 | 6 (54.5%) | 0 (0.0%) |
| $25,000 to $29,999 | 0 (0.0%) | 0 (0.0%) |
| $30,000 to $34,999 | 0 (0.0%) | 0 (0.0%) |
| $35,000 to $39,999 | 0 (0.0%) | 0 (0.0%) |
| $40,000 to $44,999 | 1 (9.1%) | 0 (0.0%) |
| $45,000 to $49,999 | 3 (27.3%) | 0 (0.0%) |
| $50,000 to $54,999 | 0 (0.0%) | 0 (0.0%) |
| $55,000 to $64,999 | 1 (9.1%) | 1 (14.3%) |
| $65,000 to $74,999 | 0 (0.0%) | 0 (0.0%) |
| $75,000 to $99,999 | 0 (0.0%) | 1 (14.3%) |
| $100,000+ | 0 (0.0%) | 0 (0.0%) |
| Total | 11 (100.0%) | 7 (100.0%) |
Earnings by Sex by Educational Attainment in Kerrick
| Educational Attainment | Male Income | Female Income |
| Less than High School | - | - |
| High School Diploma | - | - |
| College or Associate's Degree | - | - |
| Bachelor's Degree | - | - |
| Graduate Degree | - | - |
| Total | - | - |
Family Income in Kerrick
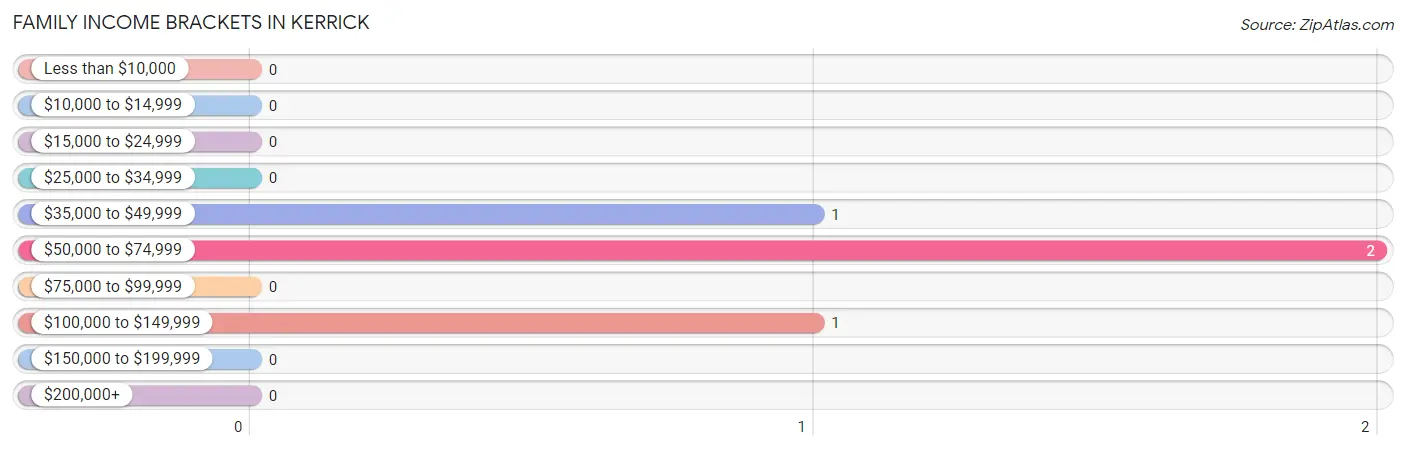
Family Income Brackets in Kerrick
According to the Kerrick family income data, there are 2 families falling into the $50,000 to $74,999 income range, which is the most common income bracket and makes up 50.0% of all families.
| Income Bracket | # Families | % Families |
| Less than $10,000 | 0 | 0.0% |
| $10,000 to $14,999 | 0 | 0.0% |
| $15,000 to $24,999 | 0 | 0.0% |
| $25,000 to $34,999 | 0 | 0.0% |
| $35,000 to $49,999 | 1 | 25.0% |
| $50,000 to $74,999 | 2 | 50.0% |
| $75,000 to $99,999 | 0 | 0.0% |
| $100,000 to $149,999 | 1 | 25.0% |
| $150,000 to $199,999 | 0 | 0.0% |
| $200,000+ | 0 | 0.0% |
Family Income by Famaliy Size in Kerrick
| Income Bracket | # Families | Median Income |
| 2-Person Families | 2 (50.0%) | $0 |
| 3-Person Families | 1 (25.0%) | $0 |
| 4-Person Families | 1 (25.0%) | $0 |
| 5-Person Families | 0 (0.0%) | $0 |
| 6-Person Families | 0 (0.0%) | $0 |
| 7+ Person Families | 0 (0.0%) | $0 |
| Total | 4 (100.0%) | $58,750 |
Family Income by Number of Earners in Kerrick
| Number of Earners | # Families | Median Income |
| No Earners | 1 (25.0%) | $0 |
| 1 Earner | 1 (25.0%) | $0 |
| 2 Earners | 2 (50.0%) | $0 |
| 3+ Earners | 0 (0.0%) | $0 |
| Total | 4 (100.0%) | $58,750 |
Household Income in Kerrick
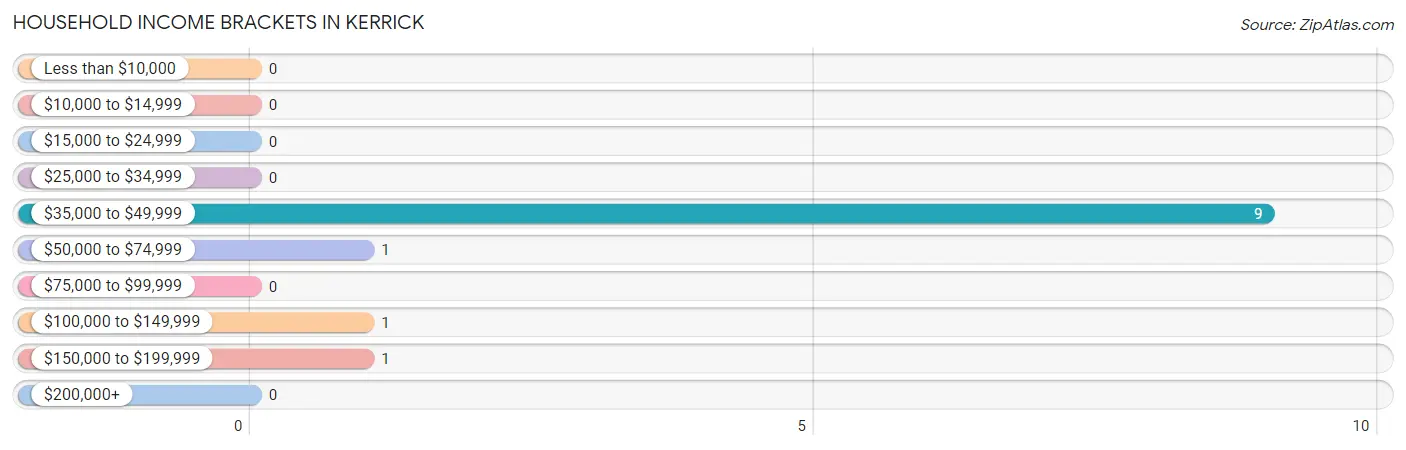
Household Income Brackets in Kerrick
With 9 households falling in the category, the $35,000 to $49,999 income range is the most frequent in Kerrick, accounting for 75.0% of all households.
| Income Bracket | # Households | % Households |
| Less than $10,000 | 0 | 0.0% |
| $10,000 to $14,999 | 0 | 0.0% |
| $15,000 to $24,999 | 0 | 0.0% |
| $25,000 to $34,999 | 0 | 0.0% |
| $35,000 to $49,999 | 9 | 75.0% |
| $50,000 to $74,999 | 1 | 8.3% |
| $75,000 to $99,999 | 0 | 0.0% |
| $100,000 to $149,999 | 1 | 8.3% |
| $150,000 to $199,999 | 1 | 8.3% |
| $200,000+ | 0 | 0.0% |
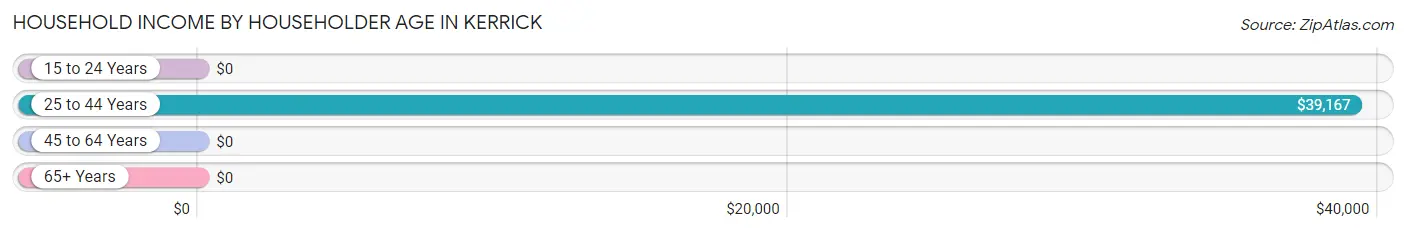
Household Income by Householder Age in Kerrick
The median household income in Kerrick is $42,500, with the highest median household income of $39,167 found in the 25 to 44 years age bracket for the primary householder. A total of 8 households (66.7%) fall into this category.
| Income Bracket | # Households | Median Income |
| 15 to 24 Years | 0 (0.0%) | $0 |
| 25 to 44 Years | 8 (66.7%) | $39,167 |
| 45 to 64 Years | 4 (33.3%) | $0 |
| 65+ Years | 0 (0.0%) | $0 |
| Total | 12 (100.0%) | $42,500 |
Poverty in Kerrick
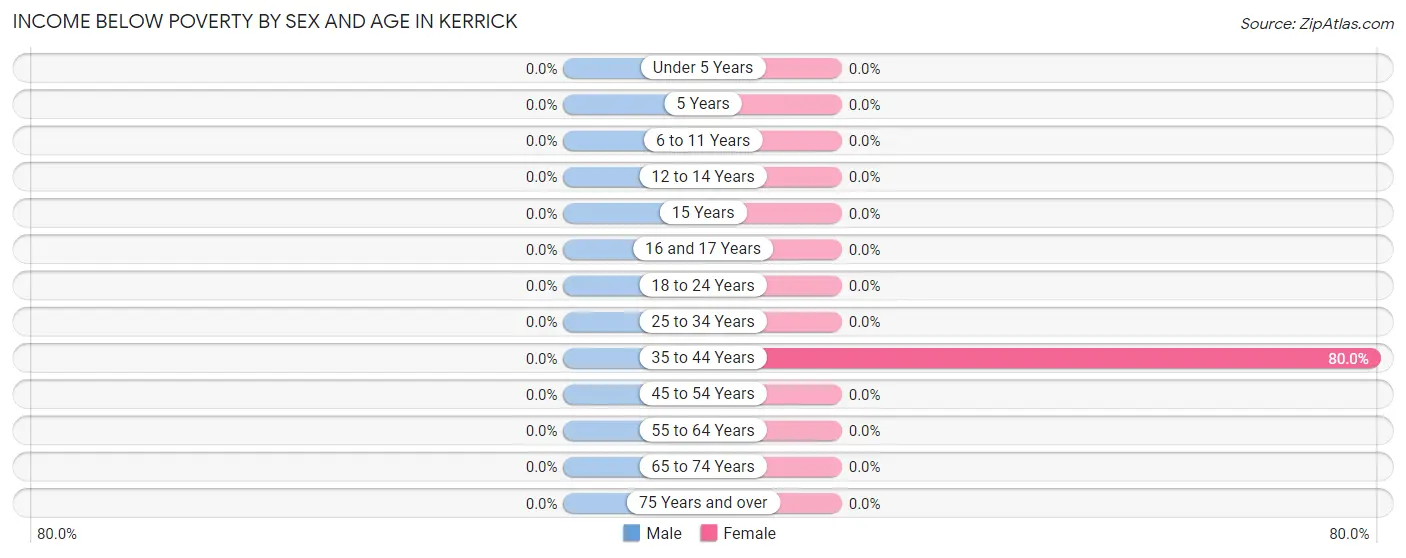
Income Below Poverty by Sex and Age in Kerrick
| Age Bracket | Male | Female |
| Under 5 Years | 0 (0.0%) | 0 (0.0%) |
| 5 Years | 0 (0.0%) | 0 (0.0%) |
| 6 to 11 Years | 0 (0.0%) | 0 (0.0%) |
| 12 to 14 Years | 0 (0.0%) | 0 (0.0%) |
| 15 Years | 0 (0.0%) | 0 (0.0%) |
| 16 and 17 Years | 0 (0.0%) | 0 (0.0%) |
| 18 to 24 Years | 0 (0.0%) | 0 (0.0%) |
| 25 to 34 Years | 0 (0.0%) | 0 (0.0%) |
| 35 to 44 Years | 0 (0.0%) | 4 (80.0%) |
| 45 to 54 Years | 0 (0.0%) | 0 (0.0%) |
| 55 to 64 Years | 0 (0.0%) | 0 (0.0%) |
| 65 to 74 Years | 0 (0.0%) | 0 (0.0%) |
| 75 Years and over | 0 (0.0%) | 0 (0.0%) |
| Total | 0 (0.0%) | 4 (44.4%) |
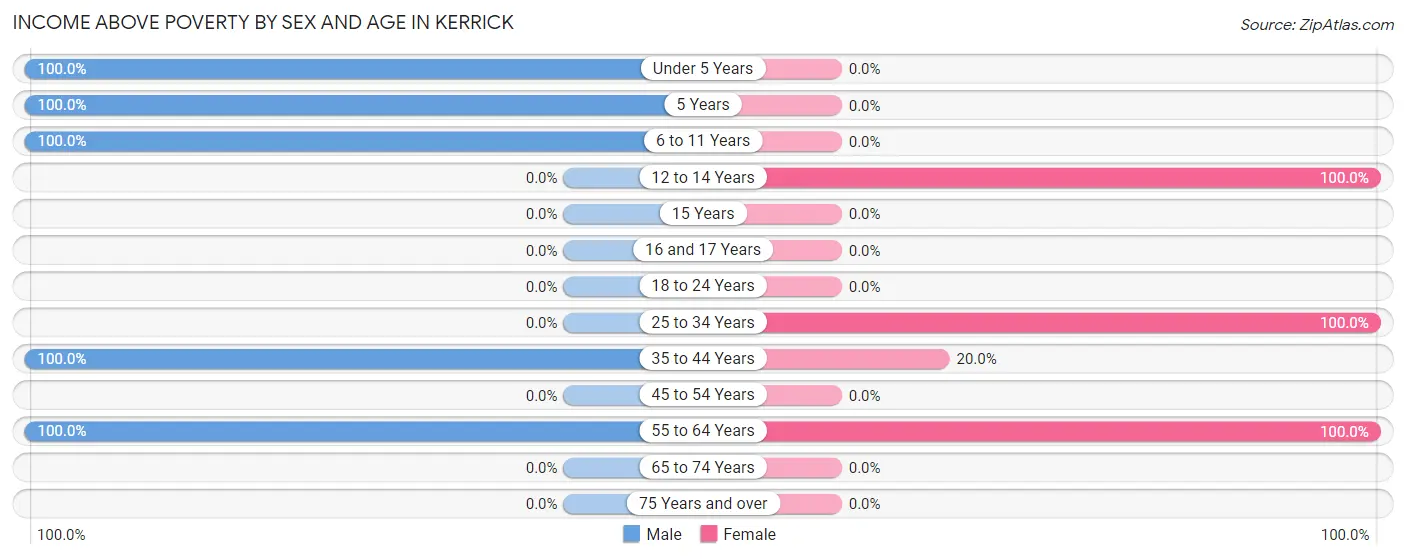
Income Above Poverty by Sex and Age in Kerrick
According to the poverty statistics in Kerrick, males aged under 5 years and females aged 12 to 14 years are the age groups that are most secure financially, with 100.0% of males and 100.0% of females in these age groups living above the poverty line.
| Age Bracket | Male | Female |
| Under 5 Years | 1 (100.0%) | 0 (0.0%) |
| 5 Years | 1 (100.0%) | 0 (0.0%) |
| 6 to 11 Years | 1 (100.0%) | 0 (0.0%) |
| 12 to 14 Years | 0 (0.0%) | 1 (100.0%) |
| 15 Years | 0 (0.0%) | 0 (0.0%) |
| 16 and 17 Years | 0 (0.0%) | 0 (0.0%) |
| 18 to 24 Years | 0 (0.0%) | 0 (0.0%) |
| 25 to 34 Years | 0 (0.0%) | 1 (100.0%) |
| 35 to 44 Years | 8 (100.0%) | 1 (20.0%) |
| 45 to 54 Years | 0 (0.0%) | 0 (0.0%) |
| 55 to 64 Years | 4 (100.0%) | 2 (100.0%) |
| 65 to 74 Years | 0 (0.0%) | 0 (0.0%) |
| 75 Years and over | 0 (0.0%) | 0 (0.0%) |
| Total | 15 (100.0%) | 5 (55.6%) |
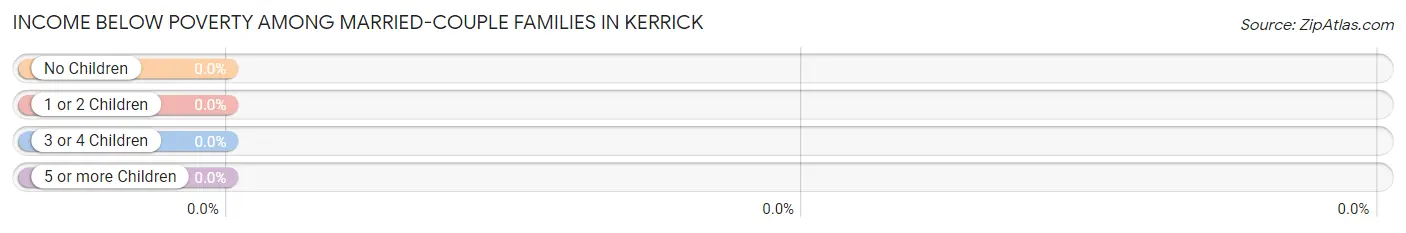
Income Below Poverty Among Married-Couple Families in Kerrick
| Children | Above Poverty | Below Poverty |
| No Children | 2 (100.0%) | 0 (0.0%) |
| 1 or 2 Children | 1 (100.0%) | 0 (0.0%) |
| 3 or 4 Children | 0 (0.0%) | 0 (0.0%) |
| 5 or more Children | 0 (0.0%) | 0 (0.0%) |
| Total | 3 (100.0%) | 0 (0.0%) |
Income Below Poverty Among Single-Parent Households in Kerrick
| Children | Single Father | Single Mother |
| No Children | 0 (0.0%) | 0 (0.0%) |
| 1 or 2 Children | 0 (0.0%) | 0 (0.0%) |
| 3 or 4 Children | 0 (0.0%) | 0 (0.0%) |
| 5 or more Children | 0 (0.0%) | 0 (0.0%) |
| Total | 0 (0.0%) | 0 (0.0%) |
Income Below Poverty Among Married-Couple vs Single-Parent Households in Kerrick
| Children | Married-Couple Families | Single-Parent Households |
| No Children | 0 (0.0%) | 0 (0.0%) |
| 1 or 2 Children | 0 (0.0%) | 0 (0.0%) |
| 3 or 4 Children | 0 (0.0%) | 0 (0.0%) |
| 5 or more Children | 0 (0.0%) | 0 (0.0%) |
| Total | 0 (0.0%) | 0 (0.0%) |
Race in Kerrick
The most populous races in Kerrick are , and White / Caucasian (24 | 100.0%).
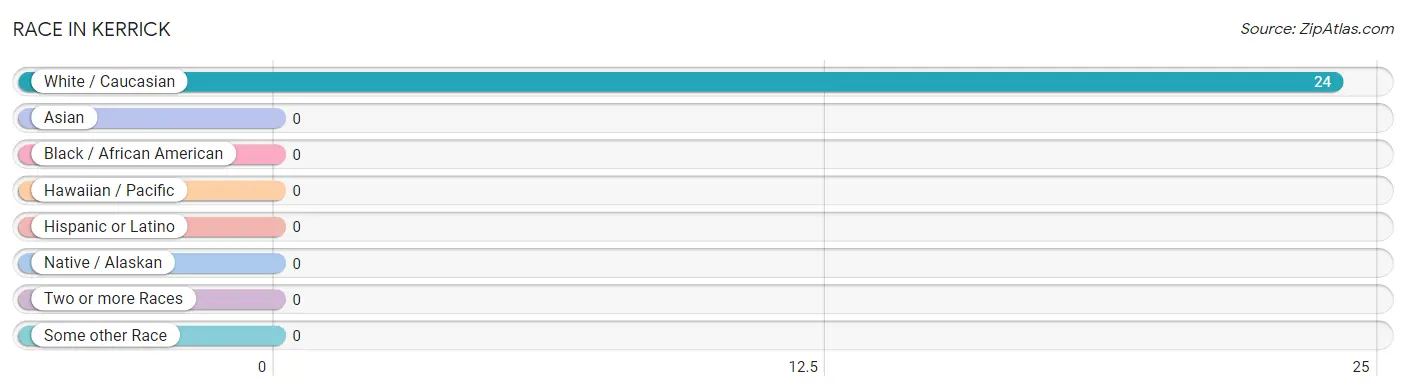
| Race | # Population | % Population |
| Asian | 0 | 0.0% |
| Black / African American | 0 | 0.0% |
| Hawaiian / Pacific | 0 | 0.0% |
| Hispanic or Latino | 0 | 0.0% |
| Native / Alaskan | 0 | 0.0% |
| White / Caucasian | 24 | 100.0% |
| Two or more Races | 0 | 0.0% |
| Some other Race | 0 | 0.0% |
| Total | 24 | 100.0% |
Ancestry in Kerrick
The most populous ancestries reported in Kerrick are Norwegian (8 | 33.3%), German (6 | 25.0%), Polish (2 | 8.3%), Scandinavian (2 | 8.3%), and Swedish (2 | 8.3%), together accounting for 83.3% of all Kerrick residents.
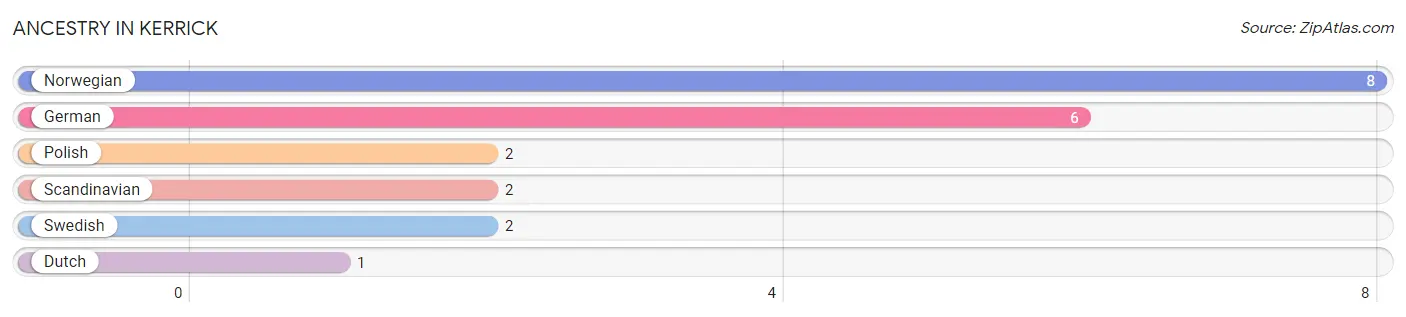
| Ancestry | # Population | % Population |
| Dutch | 1 | 4.2% |
| German | 6 | 25.0% |
| Norwegian | 8 | 33.3% |
| Polish | 2 | 8.3% |
| Scandinavian | 2 | 8.3% |
| Swedish | 2 | 8.3% | View All 6 Rows |
Immigrants in Kerrick

| Immigration Origin | # Population | % Population | View All 0 Rows |
Sex and Age in Kerrick
Sex and Age in Kerrick
The most populous age groups in Kerrick are 35 to 39 Years (8 | 53.3%) for men and 40 to 44 Years (4 | 44.4%) for women.
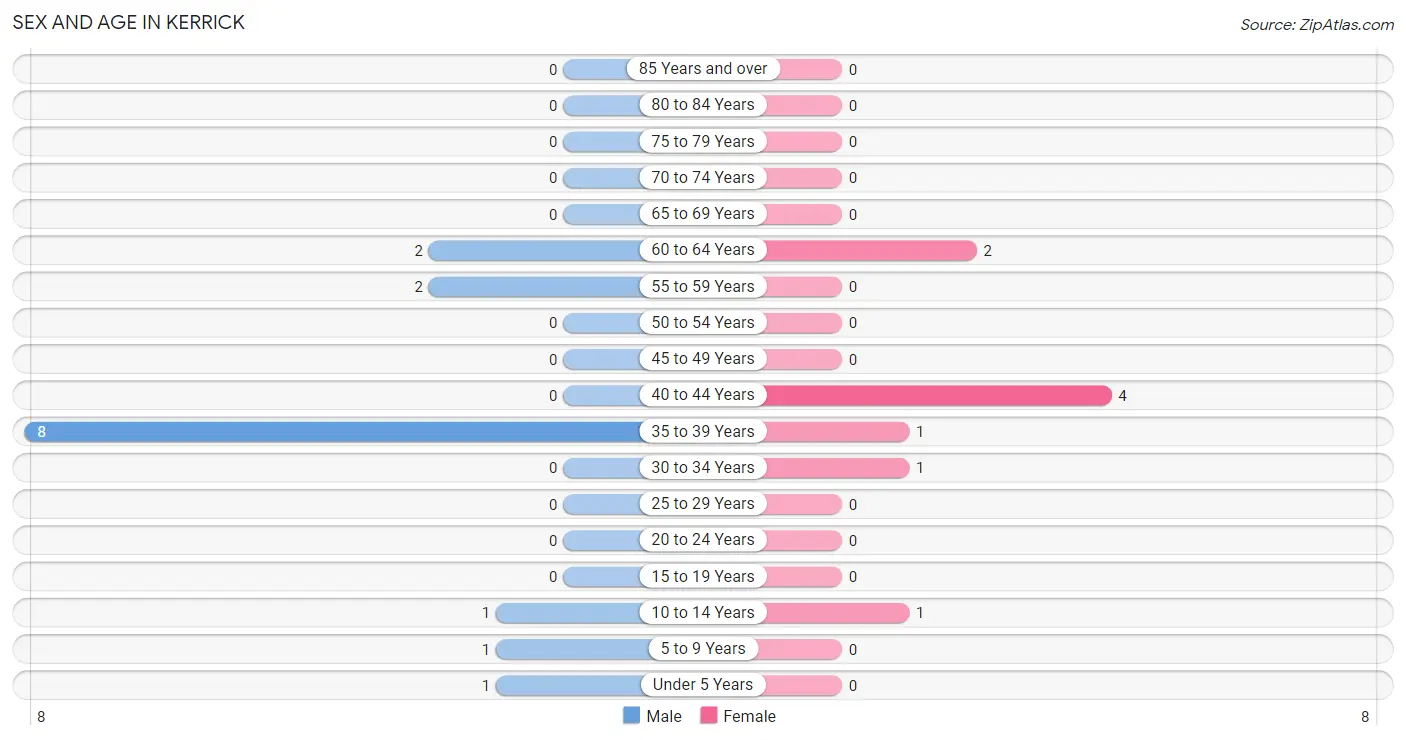
| Age Bracket | Male | Female |
| Under 5 Years | 1 (6.7%) | 0 (0.0%) |
| 5 to 9 Years | 1 (6.7%) | 0 (0.0%) |
| 10 to 14 Years | 1 (6.7%) | 1 (11.1%) |
| 15 to 19 Years | 0 (0.0%) | 0 (0.0%) |
| 20 to 24 Years | 0 (0.0%) | 0 (0.0%) |
| 25 to 29 Years | 0 (0.0%) | 0 (0.0%) |
| 30 to 34 Years | 0 (0.0%) | 1 (11.1%) |
| 35 to 39 Years | 8 (53.3%) | 1 (11.1%) |
| 40 to 44 Years | 0 (0.0%) | 4 (44.4%) |
| 45 to 49 Years | 0 (0.0%) | 0 (0.0%) |
| 50 to 54 Years | 0 (0.0%) | 0 (0.0%) |
| 55 to 59 Years | 2 (13.3%) | 0 (0.0%) |
| 60 to 64 Years | 2 (13.3%) | 2 (22.2%) |
| 65 to 69 Years | 0 (0.0%) | 0 (0.0%) |
| 70 to 74 Years | 0 (0.0%) | 0 (0.0%) |
| 75 to 79 Years | 0 (0.0%) | 0 (0.0%) |
| 80 to 84 Years | 0 (0.0%) | 0 (0.0%) |
| 85 Years and over | 0 (0.0%) | 0 (0.0%) |
| Total | 15 (100.0%) | 9 (100.0%) |
Families and Households in Kerrick
Median Family Size in Kerrick
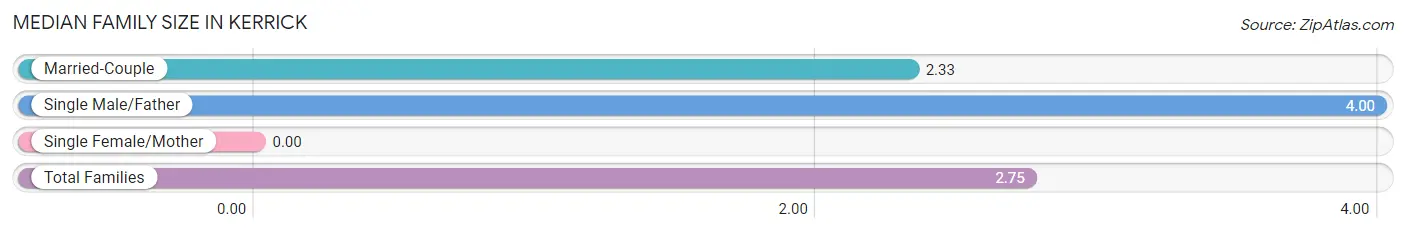
| Family Type | # Families | Family Size |
| Married-Couple | 3 (75.0%) | 2.33 |
| Single Male/Father | 1 (25.0%) | 4.00 |
| Single Female/Mother | 0 (0.0%) | - |
| Total Families | 4 (100.0%) | 2.75 |
Median Household Size in Kerrick
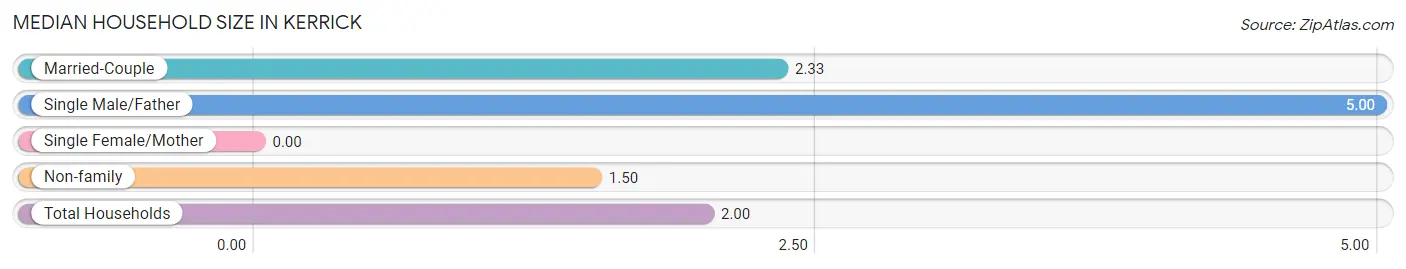
| Household Type | # Households | Household Size |
| Married-Couple | 3 (25.0%) | 2.33 |
| Single Male/Father | 1 (8.3%) | 5.00 |
| Single Female/Mother | 0 (0.0%) | - |
| Non-family | 8 (66.7%) | 1.50 |
| Total Households | 12 (100.0%) | 2.00 |
Household Size by Marriage Status in Kerrick
Out of a total of 12 households in Kerrick, 4 (33.3%) are family households, while 8 (66.7%) are nonfamily households. The most numerous type of family households are 2-person households, comprising 2, and the most common type of nonfamily households are 2-person households, comprising 6.
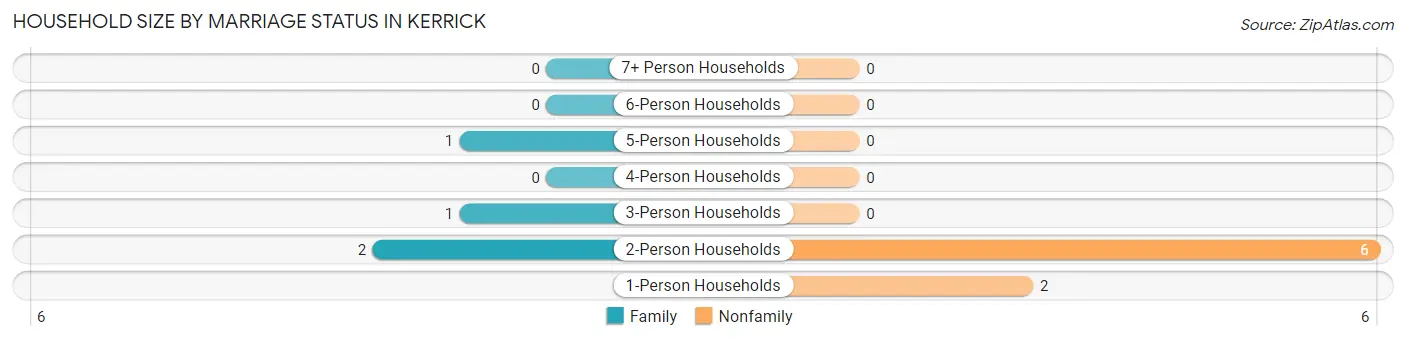
| Household Size | Family Households | Nonfamily Households |
| 1-Person Households | - | 2 (16.7%) |
| 2-Person Households | 2 (16.7%) | 6 (50.0%) |
| 3-Person Households | 1 (8.3%) | 0 (0.0%) |
| 4-Person Households | 0 (0.0%) | 0 (0.0%) |
| 5-Person Households | 1 (8.3%) | 0 (0.0%) |
| 6-Person Households | 0 (0.0%) | 0 (0.0%) |
| 7+ Person Households | 0 (0.0%) | 0 (0.0%) |
| Total | 4 (33.3%) | 8 (66.7%) |
Female Fertility in Kerrick
Fertility by Age in Kerrick
| Age Bracket | Women with Births | Births / 1,000 Women |
| 15 to 19 years | 0 (0.0%) | 0.0 |
| 20 to 34 years | 0 (0.0%) | 0.0 |
| 35 to 50 years | 0 (0.0%) | 0.0 |
| Total | 0 (0.0%) | 0.0 |
Fertility by Age by Marriage Status in Kerrick
| Age Bracket | Married | Unmarried |
| 15 to 19 years | 0 (0.0%) | 0 (0.0%) |
| 20 to 34 years | 0 (0.0%) | 0 (0.0%) |
| 35 to 50 years | 0 (0.0%) | 0 (0.0%) |
| Total | 0 (0.0%) | 0 (0.0%) |
Fertility by Education in Kerrick
| Educational Attainment | Women with Births | Births / 1,000 Women |
| Less than High School | 0 (0.0%) | 0.0 |
| High School Diploma | 0 (0.0%) | 0.0 |
| College or Associate's Degree | 0 (0.0%) | 0.0 |
| Bachelor's Degree | 0 (0.0%) | 0.0 |
| Graduate Degree | 0 (0.0%) | 0.0 |
| Total | 0 (0.0%) | 0.0 |
Fertility by Education by Marriage Status in Kerrick
| Educational Attainment | Married | Unmarried |
| Less than High School | 0 (0.0%) | 0 (0.0%) |
| High School Diploma | 0 (0.0%) | 0 (0.0%) |
| College or Associate's Degree | 0 (0.0%) | 0 (0.0%) |
| Bachelor's Degree | 0 (0.0%) | 0 (0.0%) |
| Graduate Degree | 0 (0.0%) | 0 (0.0%) |
| Total | 0 (0.0%) | 0 (0.0%) |
Employment Characteristics in Kerrick
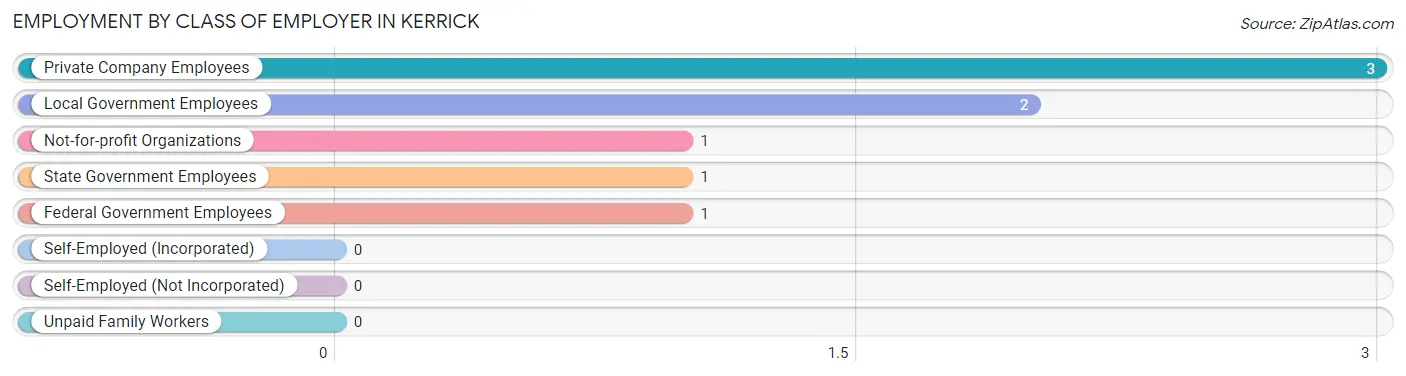
Employment by Class of Employer in Kerrick
Among the 8 employed individuals in Kerrick, private company employees (3 | 37.5%), local government employees (2 | 25.0%), and not-for-profit organizations (1 | 12.5%) make up the most common classes of employment.
| Employer Class | # Employees | % Employees |
| Private Company Employees | 3 | 37.5% |
| Self-Employed (Incorporated) | 0 | 0.0% |
| Self-Employed (Not Incorporated) | 0 | 0.0% |
| Not-for-profit Organizations | 1 | 12.5% |
| Local Government Employees | 2 | 25.0% |
| State Government Employees | 1 | 12.5% |
| Federal Government Employees | 1 | 12.5% |
| Unpaid Family Workers | 0 | 0.0% |
| Total | 8 | 100.0% |
Employment Status by Age in Kerrick
According to the labor force statistics for Kerrick, out of the total population over 16 years of age (20), 90.0% or 18 individuals are in the labor force, with 55.6% or 10 of them unemployed. The age group with the highest labor force participation rate is 30 to 34 years, with 100.0% or 1 individuals in the labor force. Within the labor force, the 35 to 44 years age range has the highest percentage of unemployed individuals, with 76.9% or 10 of them being unemployed.
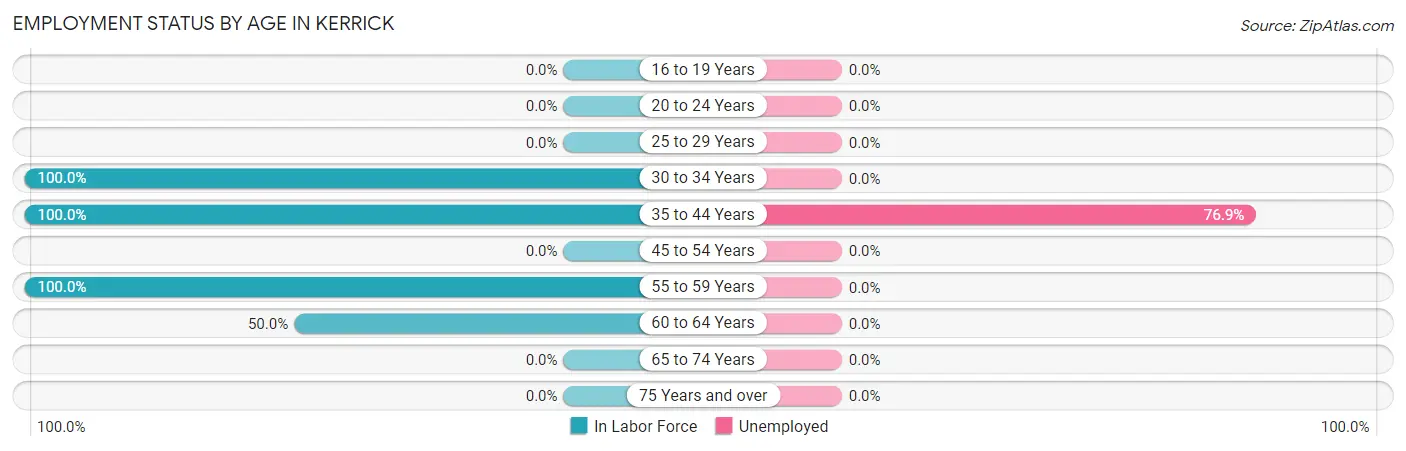
| Age Bracket | In Labor Force | Unemployed |
| 16 to 19 Years | 0 (0.0%) | 0 (0.0%) |
| 20 to 24 Years | 0 (0.0%) | 0 (0.0%) |
| 25 to 29 Years | 0 (0.0%) | 0 (0.0%) |
| 30 to 34 Years | 1 (100.0%) | 0 (0.0%) |
| 35 to 44 Years | 13 (100.0%) | 10 (76.9%) |
| 45 to 54 Years | 0 (0.0%) | 0 (0.0%) |
| 55 to 59 Years | 2 (100.0%) | 0 (0.0%) |
| 60 to 64 Years | 2 (50.0%) | 0 (0.0%) |
| 65 to 74 Years | 0 (0.0%) | 0 (0.0%) |
| 75 Years and over | 0 (0.0%) | 0 (0.0%) |
| Total | 18 (90.0%) | 10 (55.6%) |
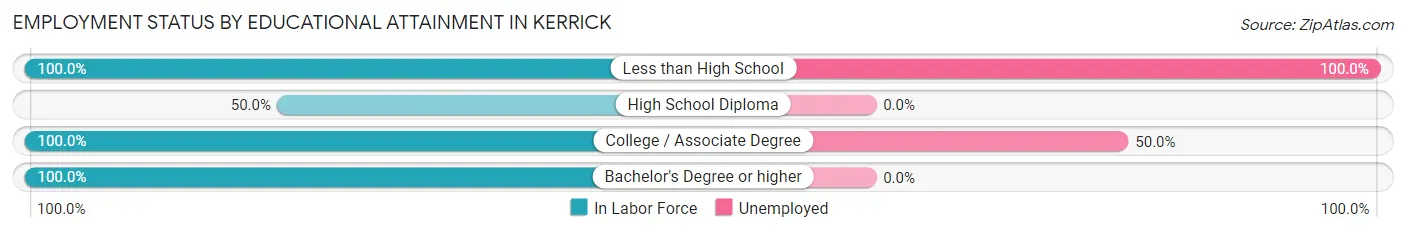
Employment Status by Educational Attainment in Kerrick
According to labor force statistics for Kerrick, 90.0% of individuals (18) out of the total population between 25 and 64 years of age (20) are in the labor force, with 55.6% or 10 of them being unemployed. The group with the highest labor force participation rate are those with the educational attainment of less than high school, with 100.0% or 6 individuals in the labor force. Within the labor force, individuals with less than high school education have the highest percentage of unemployment, with 100.0% or 6 of them being unemployed.
| Educational Attainment | In Labor Force | Unemployed |
| Less than High School | 6 (100.0%) | 6 (100.0%) |
| High School Diploma | 2 (50.0%) | 0 (0.0%) |
| College / Associate Degree | 8 (100.0%) | 4 (50.0%) |
| Bachelor's Degree or higher | 2 (100.0%) | 0 (0.0%) |
| Total | 18 (90.0%) | 11 (55.6%) |
Employment Occupations by Sex in Kerrick
Management, Business, Science and Arts Occupations
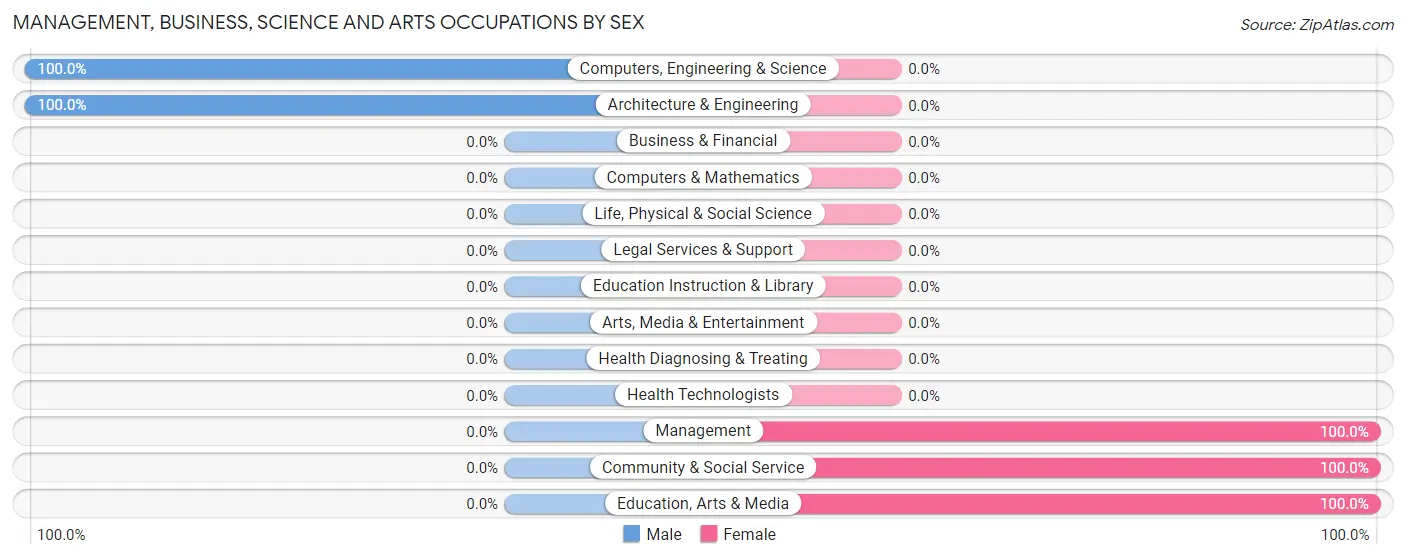
The most common Management, Business, Science and Arts occupations in Kerrick are Management (1 | 12.5%), Computers, Engineering & Science (1 | 12.5%), Architecture & Engineering (1 | 12.5%), Community & Social Service (1 | 12.5%), and Education, Arts & Media (1 | 12.5%).
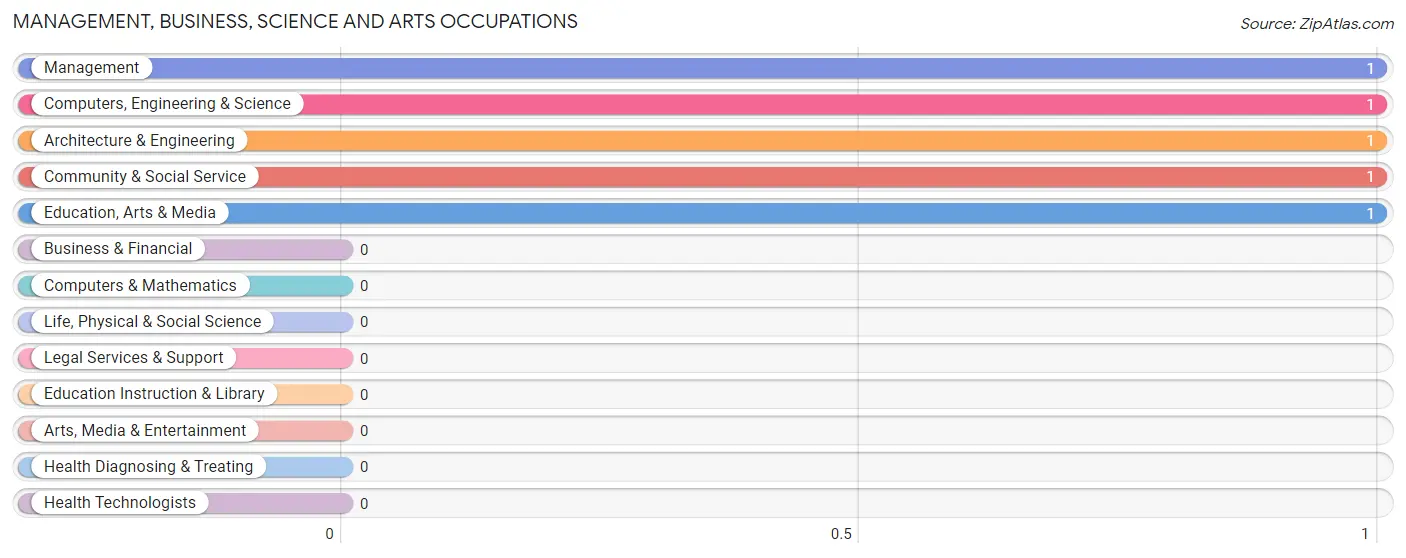
Management, Business, Science and Arts Occupations by Sex
Within the Management, Business, Science and Arts occupations in Kerrick, the most male-oriented occupations are Computers, Engineering & Science (100.0%), and Architecture & Engineering (100.0%), while the most female-oriented occupations are Management (100.0%), Community & Social Service (100.0%), and Education, Arts & Media (100.0%).
| Occupation | Male | Female |
| Management | 0 (0.0%) | 1 (100.0%) |
| Business & Financial | 0 (0.0%) | 0 (0.0%) |
| Computers, Engineering & Science | 1 (100.0%) | 0 (0.0%) |
| Computers & Mathematics | 0 (0.0%) | 0 (0.0%) |
| Architecture & Engineering | 1 (100.0%) | 0 (0.0%) |
| Life, Physical & Social Science | 0 (0.0%) | 0 (0.0%) |
| Community & Social Service | 0 (0.0%) | 1 (100.0%) |
| Education, Arts & Media | 0 (0.0%) | 1 (100.0%) |
| Legal Services & Support | 0 (0.0%) | 0 (0.0%) |
| Education Instruction & Library | 0 (0.0%) | 0 (0.0%) |
| Arts, Media & Entertainment | 0 (0.0%) | 0 (0.0%) |
| Health Diagnosing & Treating | 0 (0.0%) | 0 (0.0%) |
| Health Technologists | 0 (0.0%) | 0 (0.0%) |
| Total (Category) | 1 (33.3%) | 2 (66.7%) |
| Total (Overall) | 5 (62.5%) | 3 (37.5%) |
Services Occupations
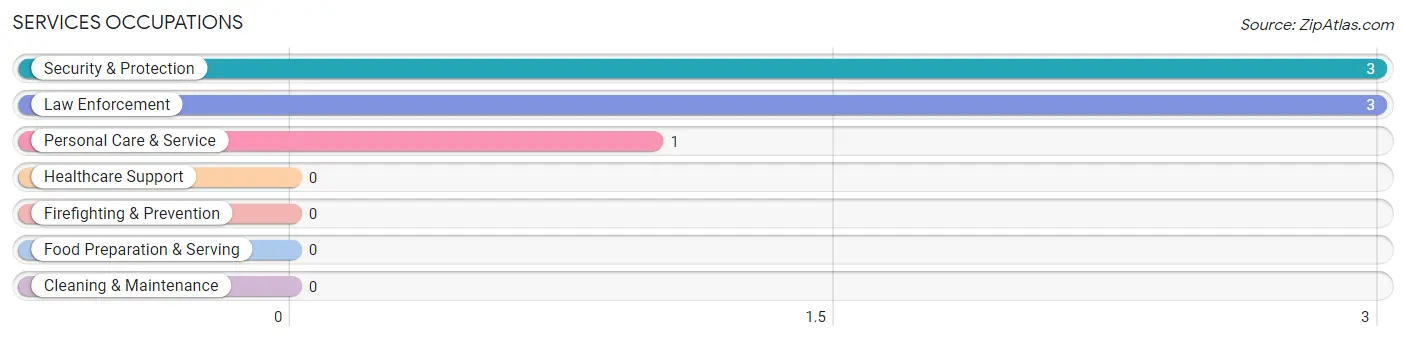
The most common Services occupations in Kerrick are Security & Protection (3 | 37.5%), Law Enforcement (3 | 37.5%), and Personal Care & Service (1 | 12.5%).
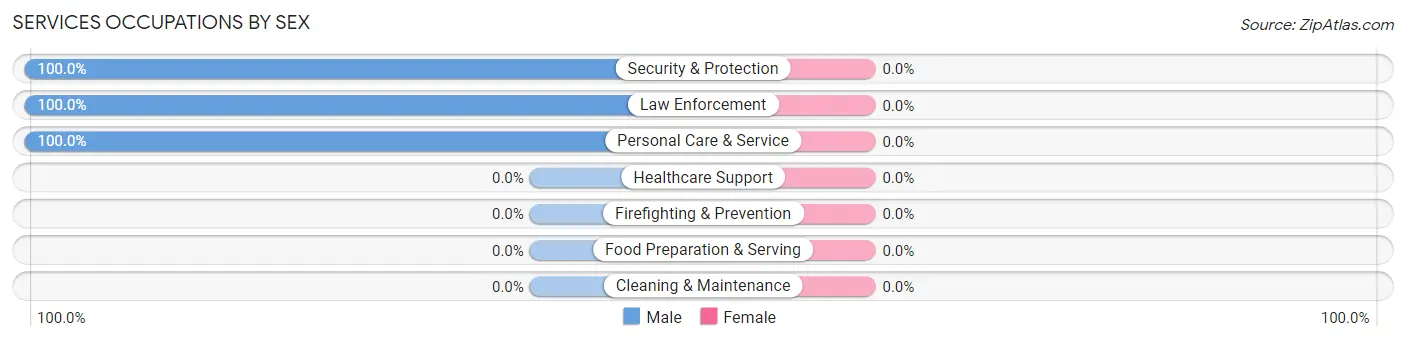
Services Occupations by Sex
| Occupation | Male | Female |
| Healthcare Support | 0 (0.0%) | 0 (0.0%) |
| Security & Protection | 3 (100.0%) | 0 (0.0%) |
| Firefighting & Prevention | 0 (0.0%) | 0 (0.0%) |
| Law Enforcement | 3 (100.0%) | 0 (0.0%) |
| Food Preparation & Serving | 0 (0.0%) | 0 (0.0%) |
| Cleaning & Maintenance | 0 (0.0%) | 0 (0.0%) |
| Personal Care & Service | 1 (100.0%) | 0 (0.0%) |
| Total (Category) | 4 (100.0%) | 0 (0.0%) |
| Total (Overall) | 5 (62.5%) | 3 (37.5%) |
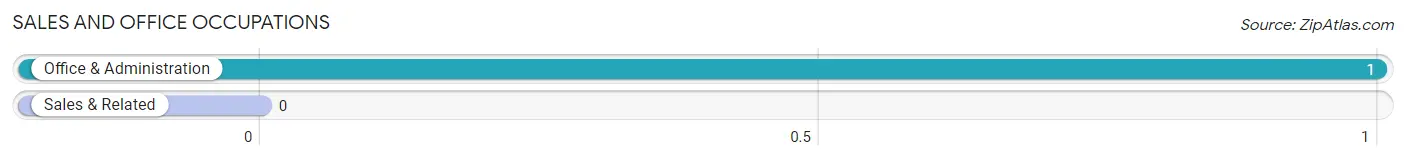
Sales and Office Occupations
The most common Sales and Office occupations in Kerrick are , and Office & Administration (1 | 12.5%).
Sales and Office Occupations by Sex
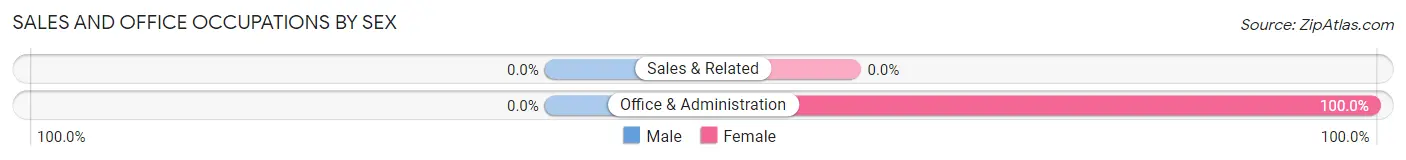
| Occupation | Male | Female |
| Sales & Related | 0 (0.0%) | 0 (0.0%) |
| Office & Administration | 0 (0.0%) | 1 (100.0%) |
| Total (Category) | 0 (0.0%) | 1 (100.0%) |
| Total (Overall) | 5 (62.5%) | 3 (37.5%) |
Natural Resources, Construction and Maintenance Occupations
Natural Resources, Construction and Maintenance Occupations by Sex
| Occupation | Male | Female |
| Farming, Fishing & Forestry | 0 (0.0%) | 0 (0.0%) |
| Construction & Extraction | 0 (0.0%) | 0 (0.0%) |
| Installation, Maintenance & Repair | 0 (0.0%) | 0 (0.0%) |
| Total (Category) | 0 (0.0%) | 0 (0.0%) |
| Total (Overall) | 5 (62.5%) | 3 (37.5%) |
Production, Transportation and Moving Occupations

Production, Transportation and Moving Occupations by Sex
| Occupation | Male | Female |
| Production | 0 (0.0%) | 0 (0.0%) |
| Transportation | 0 (0.0%) | 0 (0.0%) |
| Material Moving | 0 (0.0%) | 0 (0.0%) |
| Total (Category) | 0 (0.0%) | 0 (0.0%) |
| Total (Overall) | 5 (62.5%) | 3 (37.5%) |
Employment Industries by Sex in Kerrick
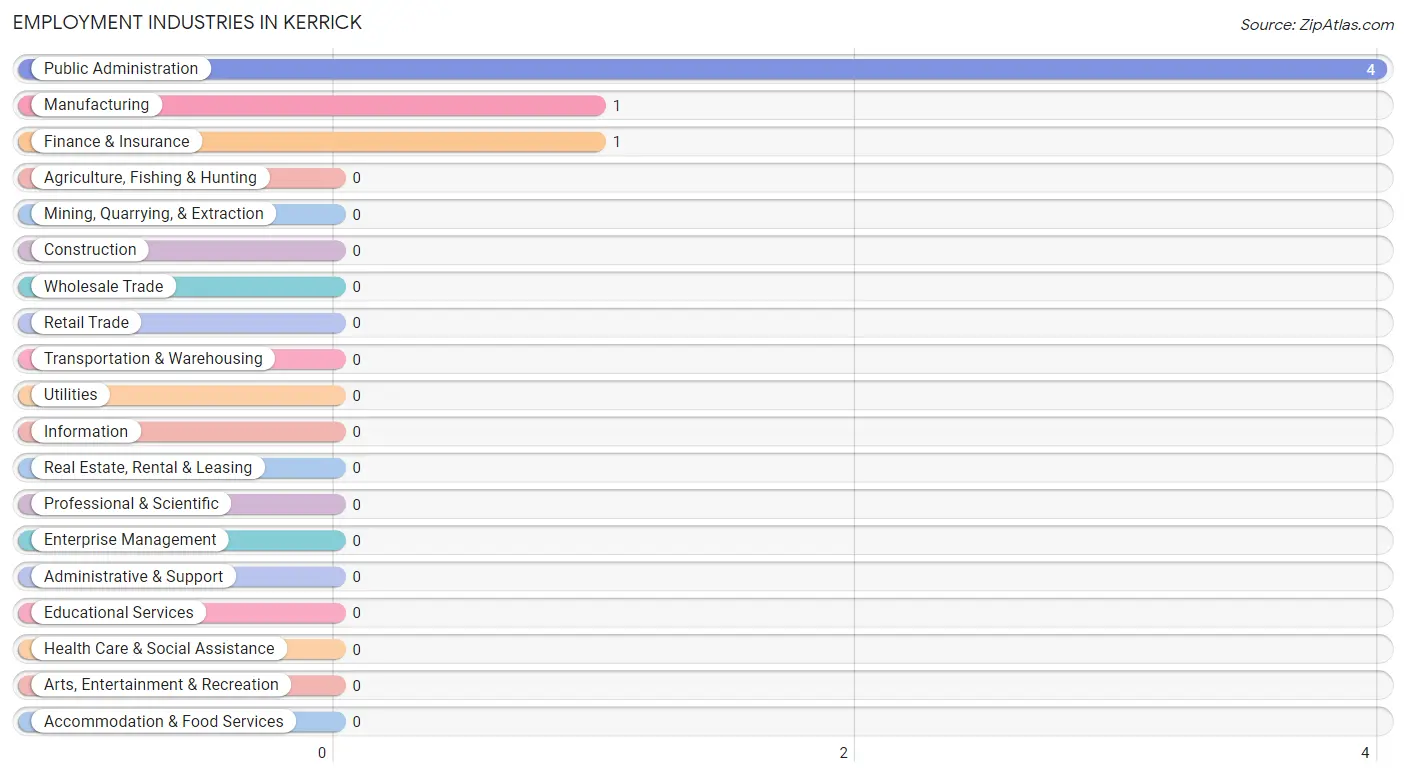
Employment Industries in Kerrick
The major employment industries in Kerrick include Public Administration (4 | 50.0%), Manufacturing (1 | 12.5%), and Finance & Insurance (1 | 12.5%).
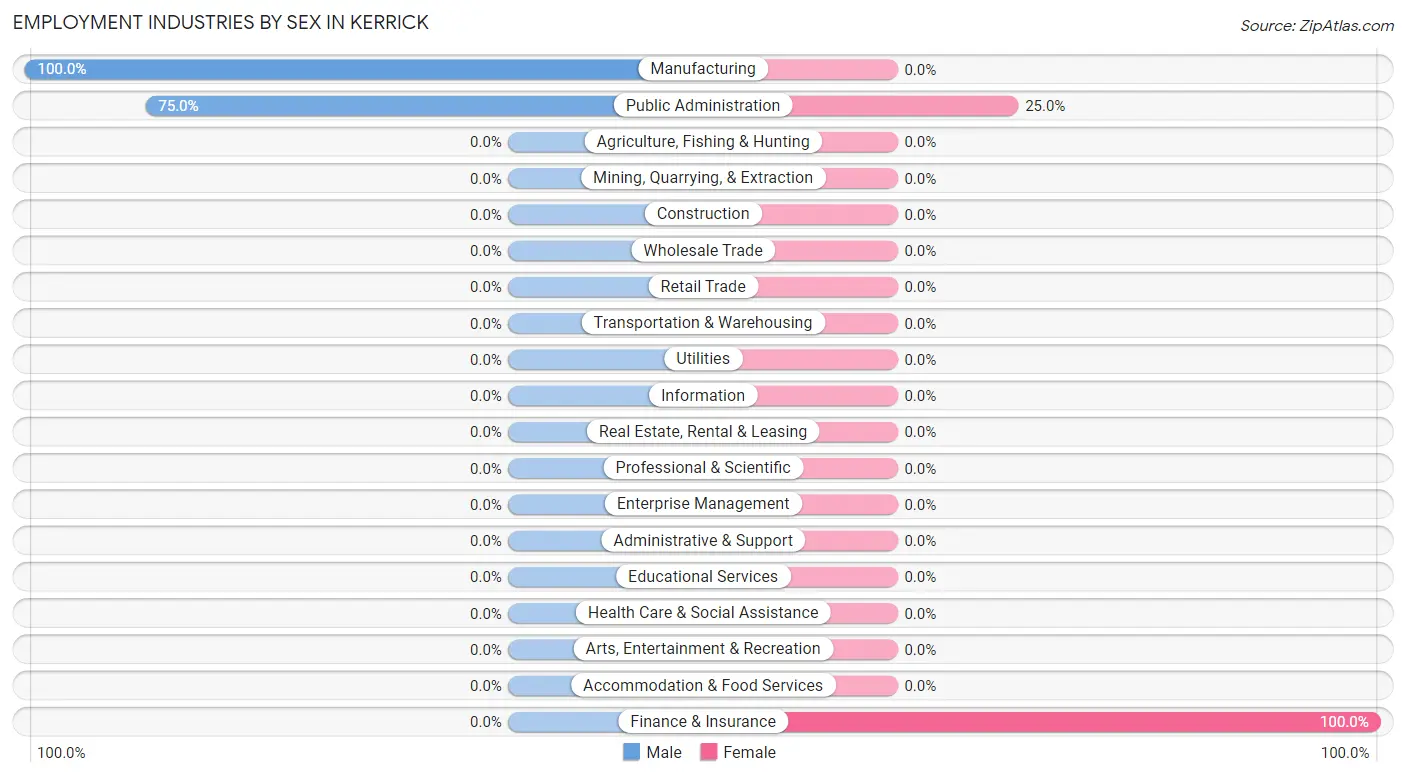
Employment Industries by Sex in Kerrick
The Kerrick industries that see more men than women are Manufacturing (100.0%), and Public Administration (75.0%), whereas the industries that tend to have a higher number of women are Finance & Insurance (100.0%), and Public Administration (25.0%).
| Industry | Male | Female |
| Agriculture, Fishing & Hunting | 0 (0.0%) | 0 (0.0%) |
| Mining, Quarrying, & Extraction | 0 (0.0%) | 0 (0.0%) |
| Construction | 0 (0.0%) | 0 (0.0%) |
| Manufacturing | 1 (100.0%) | 0 (0.0%) |
| Wholesale Trade | 0 (0.0%) | 0 (0.0%) |
| Retail Trade | 0 (0.0%) | 0 (0.0%) |
| Transportation & Warehousing | 0 (0.0%) | 0 (0.0%) |
| Utilities | 0 (0.0%) | 0 (0.0%) |
| Information | 0 (0.0%) | 0 (0.0%) |
| Finance & Insurance | 0 (0.0%) | 1 (100.0%) |
| Real Estate, Rental & Leasing | 0 (0.0%) | 0 (0.0%) |
| Professional & Scientific | 0 (0.0%) | 0 (0.0%) |
| Enterprise Management | 0 (0.0%) | 0 (0.0%) |
| Administrative & Support | 0 (0.0%) | 0 (0.0%) |
| Educational Services | 0 (0.0%) | 0 (0.0%) |
| Health Care & Social Assistance | 0 (0.0%) | 0 (0.0%) |
| Arts, Entertainment & Recreation | 0 (0.0%) | 0 (0.0%) |
| Accommodation & Food Services | 0 (0.0%) | 0 (0.0%) |
| Public Administration | 3 (75.0%) | 1 (25.0%) |
| Total | 5 (62.5%) | 3 (37.5%) |
Education in Kerrick
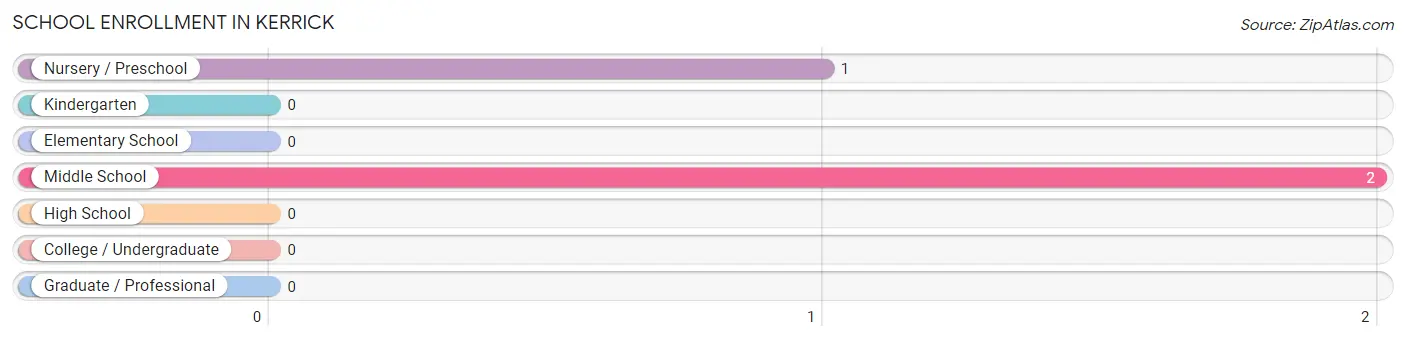
School Enrollment in Kerrick
The most common levels of schooling among the 3 students in Kerrick are middle school (2 | 66.7%), and nursery / preschool (1 | 33.3%).
| School Level | # Students | % Students |
| Nursery / Preschool | 1 | 33.3% |
| Kindergarten | 0 | 0.0% |
| Elementary School | 0 | 0.0% |
| Middle School | 2 | 66.7% |
| High School | 0 | 0.0% |
| College / Undergraduate | 0 | 0.0% |
| Graduate / Professional | 0 | 0.0% |
| Total | 3 | 100.0% |
School Enrollment by Age by Funding Source in Kerrick
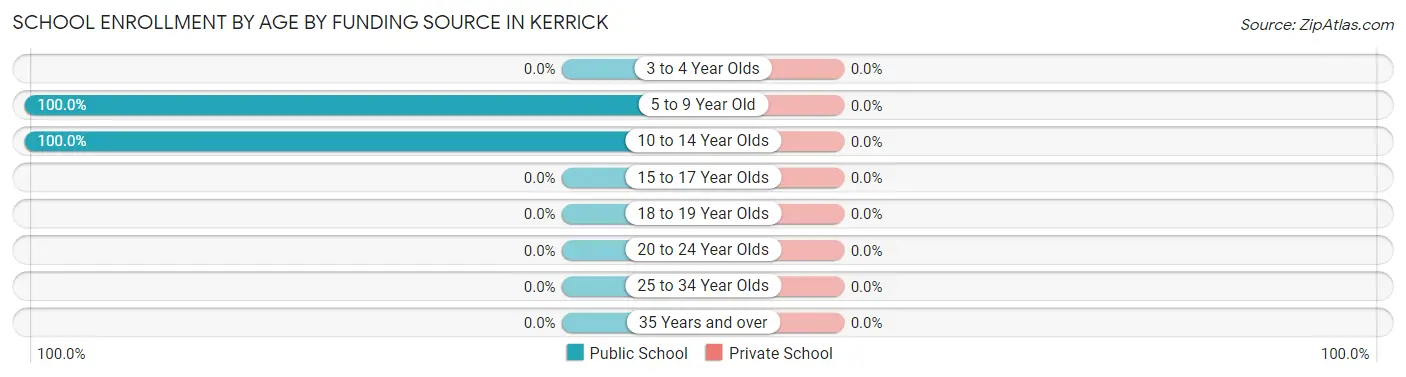
| Age Bracket | Public School | Private School |
| 3 to 4 Year Olds | 0 (0.0%) | 0 (0.0%) |
| 5 to 9 Year Old | 1 (100.0%) | 0 (0.0%) |
| 10 to 14 Year Olds | 2 (100.0%) | 0 (0.0%) |
| 15 to 17 Year Olds | 0 (0.0%) | 0 (0.0%) |
| 18 to 19 Year Olds | 0 (0.0%) | 0 (0.0%) |
| 20 to 24 Year Olds | 0 (0.0%) | 0 (0.0%) |
| 25 to 34 Year Olds | 0 (0.0%) | 0 (0.0%) |
| 35 Years and over | 0 (0.0%) | 0 (0.0%) |
| Total | 3 (100.0%) | 0 (0.0%) |
Educational Attainment by Field of Study in Kerrick
, and bio, nature & agricultural (2 | 100.0%) are the most common fields of study among 2 individuals in Kerrick who have obtained a bachelor's degree or higher.
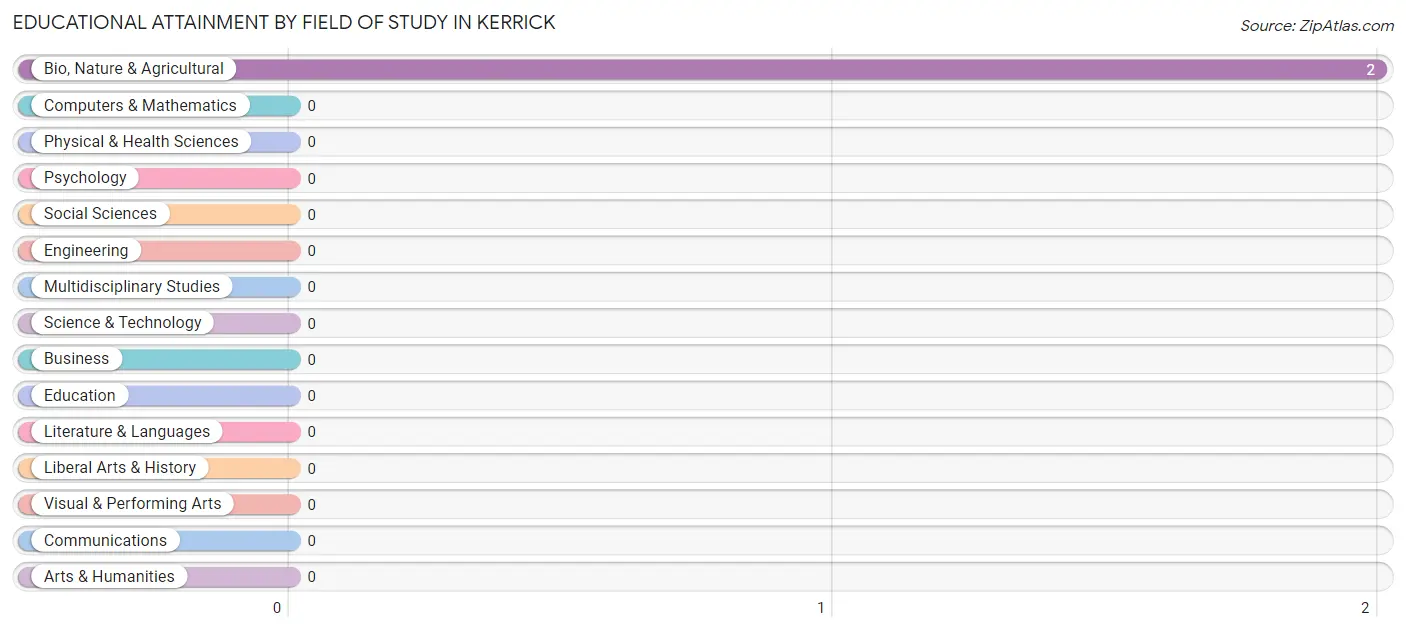
| Field of Study | # Graduates | % Graduates |
| Computers & Mathematics | 0 | 0.0% |
| Bio, Nature & Agricultural | 2 | 100.0% |
| Physical & Health Sciences | 0 | 0.0% |
| Psychology | 0 | 0.0% |
| Social Sciences | 0 | 0.0% |
| Engineering | 0 | 0.0% |
| Multidisciplinary Studies | 0 | 0.0% |
| Science & Technology | 0 | 0.0% |
| Business | 0 | 0.0% |
| Education | 0 | 0.0% |
| Literature & Languages | 0 | 0.0% |
| Liberal Arts & History | 0 | 0.0% |
| Visual & Performing Arts | 0 | 0.0% |
| Communications | 0 | 0.0% |
| Arts & Humanities | 0 | 0.0% |
| Total | 2 | 100.0% |
Transportation & Commute in Kerrick
Vehicle Availability by Sex in Kerrick
The most prevalent vehicle ownership categories in Kerrick are males with 2 vehicles (3, accounting for 60.0%) and females with 2 vehicles (1, making up 100.0%).
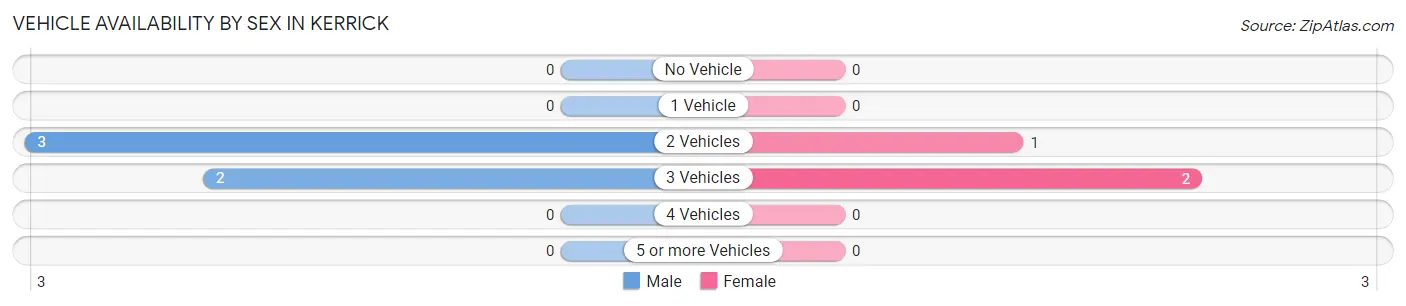
| Vehicles Available | Male | Female |
| No Vehicle | 0 (0.0%) | 0 (0.0%) |
| 1 Vehicle | 0 (0.0%) | 0 (0.0%) |
| 2 Vehicles | 3 (60.0%) | 1 (33.3%) |
| 3 Vehicles | 2 (40.0%) | 2 (66.7%) |
| 4 Vehicles | 0 (0.0%) | 0 (0.0%) |
| 5 or more Vehicles | 0 (0.0%) | 0 (0.0%) |
| Total | 5 (100.0%) | 3 (100.0%) |
Commute Time in Kerrick
The most frequently occuring commute durations in Kerrick are 5 to 9 minutes (3 commuters, 37.5%), 30 to 34 minutes (2 commuters, 25.0%), and 35 to 39 minutes (1 commuters, 12.5%).
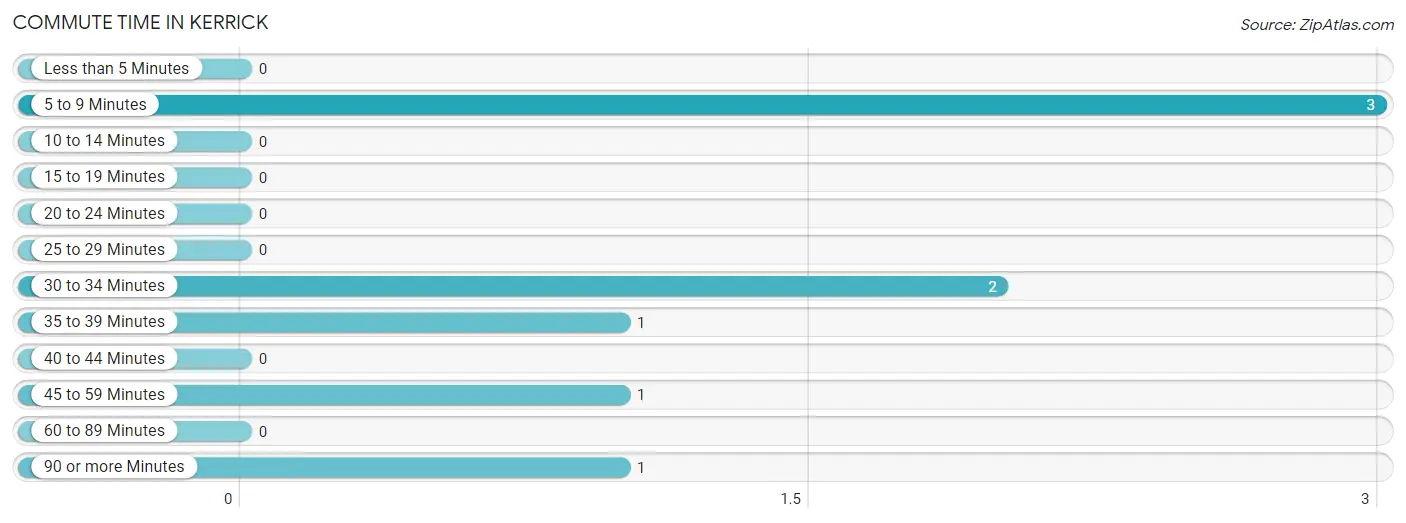
| Commute Time | # Commuters | % Commuters |
| Less than 5 Minutes | 0 | 0.0% |
| 5 to 9 Minutes | 3 | 37.5% |
| 10 to 14 Minutes | 0 | 0.0% |
| 15 to 19 Minutes | 0 | 0.0% |
| 20 to 24 Minutes | 0 | 0.0% |
| 25 to 29 Minutes | 0 | 0.0% |
| 30 to 34 Minutes | 2 | 25.0% |
| 35 to 39 Minutes | 1 | 12.5% |
| 40 to 44 Minutes | 0 | 0.0% |
| 45 to 59 Minutes | 1 | 12.5% |
| 60 to 89 Minutes | 0 | 0.0% |
| 90 or more Minutes | 1 | 12.5% |
Commute Time by Sex in Kerrick
The most common commute times in Kerrick are 5 to 9 minutes (2 commuters, 40.0%) for males and 5 to 9 minutes (1 commuters, 33.3%) for females.
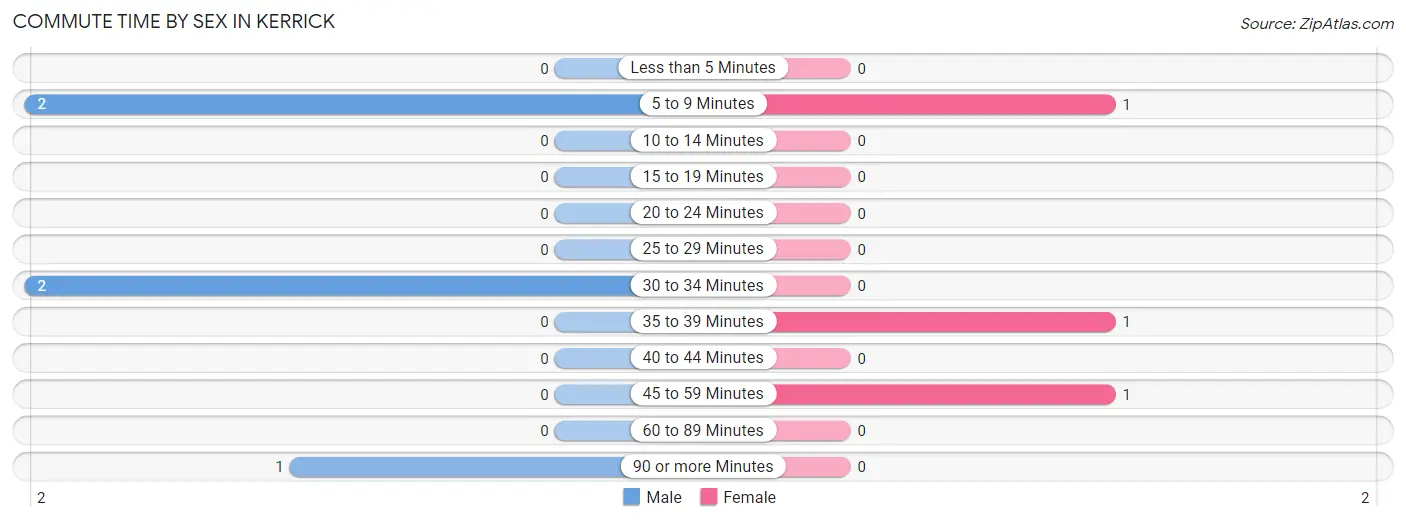
| Commute Time | Male | Female |
| Less than 5 Minutes | 0 (0.0%) | 0 (0.0%) |
| 5 to 9 Minutes | 2 (40.0%) | 1 (33.3%) |
| 10 to 14 Minutes | 0 (0.0%) | 0 (0.0%) |
| 15 to 19 Minutes | 0 (0.0%) | 0 (0.0%) |
| 20 to 24 Minutes | 0 (0.0%) | 0 (0.0%) |
| 25 to 29 Minutes | 0 (0.0%) | 0 (0.0%) |
| 30 to 34 Minutes | 2 (40.0%) | 0 (0.0%) |
| 35 to 39 Minutes | 0 (0.0%) | 1 (33.3%) |
| 40 to 44 Minutes | 0 (0.0%) | 0 (0.0%) |
| 45 to 59 Minutes | 0 (0.0%) | 1 (33.3%) |
| 60 to 89 Minutes | 0 (0.0%) | 0 (0.0%) |
| 90 or more Minutes | 1 (20.0%) | 0 (0.0%) |
Time of Departure to Work by Sex in Kerrick
The most frequent times of departure to work in Kerrick are 12:00 PM to 3:59 PM (2, 40.0%) for males and 7:00 AM to 7:29 AM (1, 33.3%) for females.
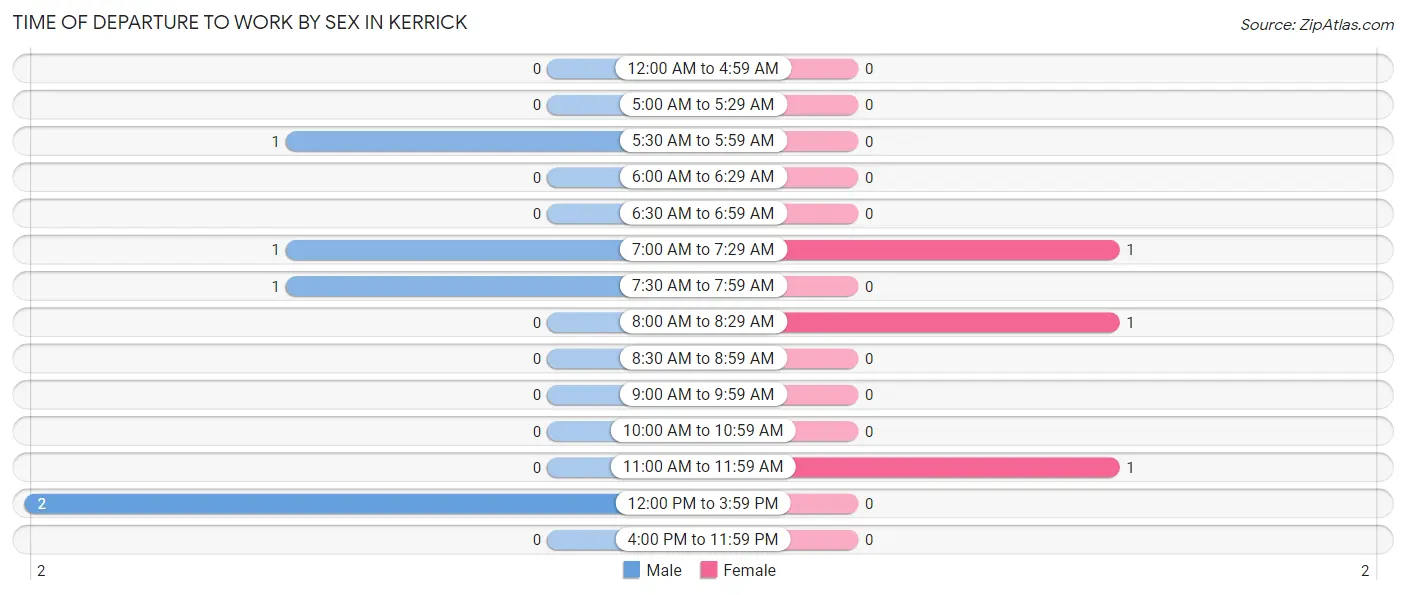
| Time of Departure | Male | Female |
| 12:00 AM to 4:59 AM | 0 (0.0%) | 0 (0.0%) |
| 5:00 AM to 5:29 AM | 0 (0.0%) | 0 (0.0%) |
| 5:30 AM to 5:59 AM | 1 (20.0%) | 0 (0.0%) |
| 6:00 AM to 6:29 AM | 0 (0.0%) | 0 (0.0%) |
| 6:30 AM to 6:59 AM | 0 (0.0%) | 0 (0.0%) |
| 7:00 AM to 7:29 AM | 1 (20.0%) | 1 (33.3%) |
| 7:30 AM to 7:59 AM | 1 (20.0%) | 0 (0.0%) |
| 8:00 AM to 8:29 AM | 0 (0.0%) | 1 (33.3%) |
| 8:30 AM to 8:59 AM | 0 (0.0%) | 0 (0.0%) |
| 9:00 AM to 9:59 AM | 0 (0.0%) | 0 (0.0%) |
| 10:00 AM to 10:59 AM | 0 (0.0%) | 0 (0.0%) |
| 11:00 AM to 11:59 AM | 0 (0.0%) | 1 (33.3%) |
| 12:00 PM to 3:59 PM | 2 (40.0%) | 0 (0.0%) |
| 4:00 PM to 11:59 PM | 0 (0.0%) | 0 (0.0%) |
| Total | 5 (100.0%) | 3 (100.0%) |
Housing Occupancy in Kerrick
Occupancy by Ownership in Kerrick
Of the total 12 dwellings in Kerrick, owner-occupied units account for 12 (100.0%), while renter-occupied units make up 0 (0.0%).
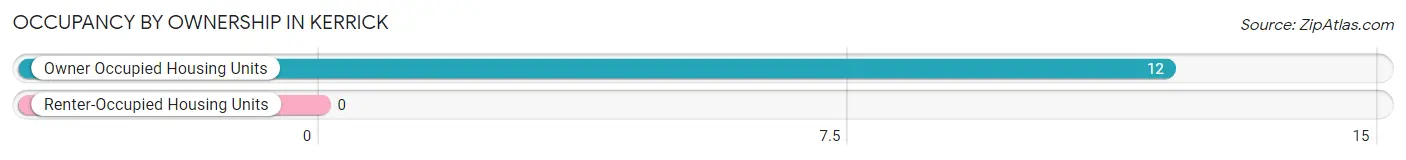
| Occupancy | # Housing Units | % Housing Units |
| Owner Occupied Housing Units | 12 | 100.0% |
| Renter-Occupied Housing Units | 0 | 0.0% |
| Total Occupied Housing Units | 12 | 100.0% |
Occupancy by Household Size in Kerrick
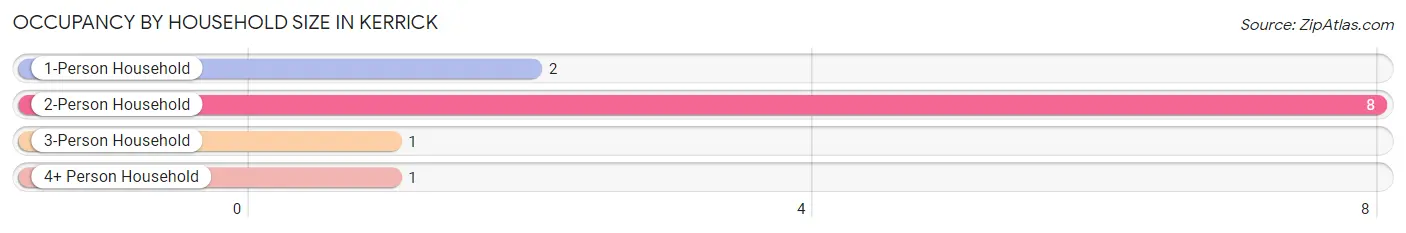
| Household Size | # Housing Units | % Housing Units |
| 1-Person Household | 2 | 16.7% |
| 2-Person Household | 8 | 66.7% |
| 3-Person Household | 1 | 8.3% |
| 4+ Person Household | 1 | 8.3% |
| Total Housing Units | 12 | 100.0% |
Occupancy by Ownership by Household Size in Kerrick
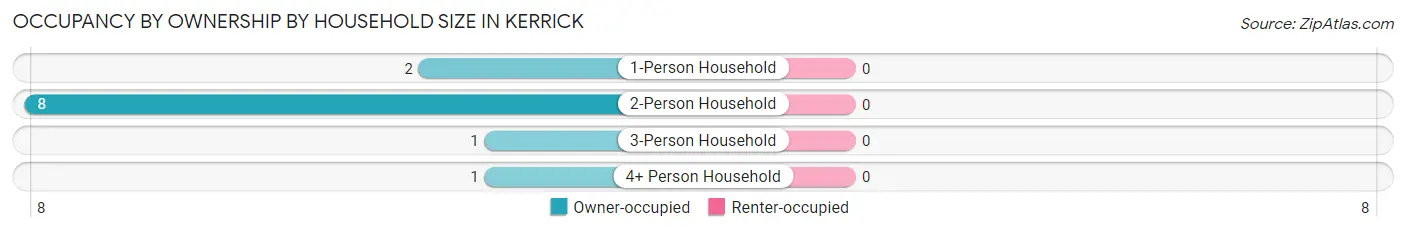
| Household Size | Owner-occupied | Renter-occupied |
| 1-Person Household | 2 (100.0%) | 0 (0.0%) |
| 2-Person Household | 8 (100.0%) | 0 (0.0%) |
| 3-Person Household | 1 (100.0%) | 0 (0.0%) |
| 4+ Person Household | 1 (100.0%) | 0 (0.0%) |
| Total Housing Units | 12 (100.0%) | 0 (0.0%) |
Occupancy by Educational Attainment in Kerrick
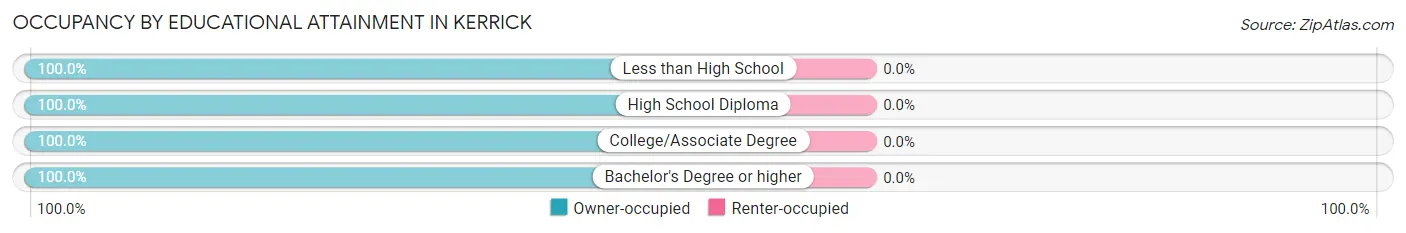
| Household Size | Owner-occupied | Renter-occupied |
| Less than High School | 6 (100.0%) | 0 (0.0%) |
| High School Diploma | 2 (100.0%) | 0 (0.0%) |
| College/Associate Degree | 2 (100.0%) | 0 (0.0%) |
| Bachelor's Degree or higher | 2 (100.0%) | 0 (0.0%) |
Occupancy by Age of Householder in Kerrick
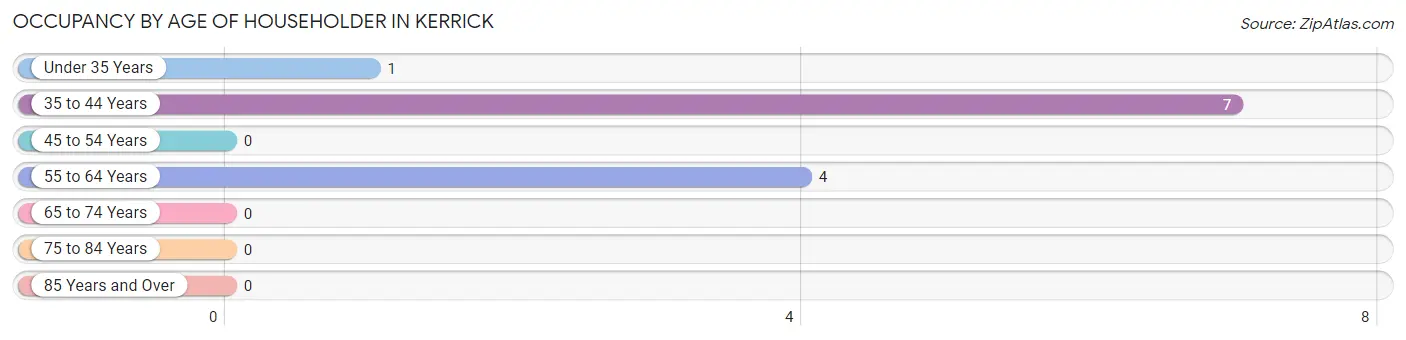
| Age Bracket | # Households | % Households |
| Under 35 Years | 1 | 8.3% |
| 35 to 44 Years | 7 | 58.3% |
| 45 to 54 Years | 0 | 0.0% |
| 55 to 64 Years | 4 | 33.3% |
| 65 to 74 Years | 0 | 0.0% |
| 75 to 84 Years | 0 | 0.0% |
| 85 Years and Over | 0 | 0.0% |
| Total | 12 | 100.0% |
Housing Finances in Kerrick
Median Income by Occupancy in Kerrick
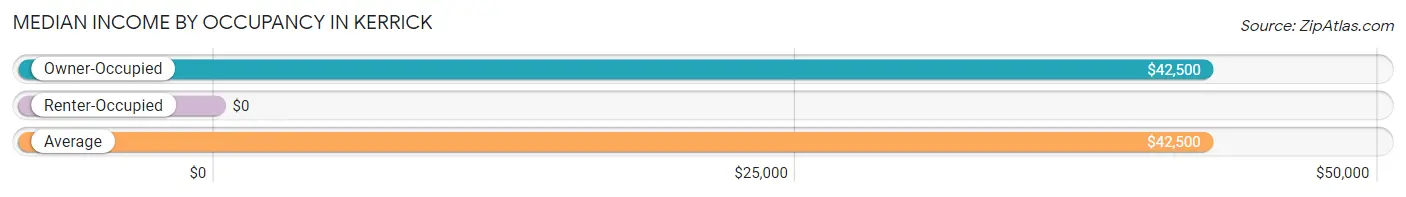
| Occupancy Type | # Households | Median Income |
| Owner-Occupied | 12 (100.0%) | $42,500 |
| Renter-Occupied | 0 (0.0%) | $0 |
| Average | 12 (100.0%) | $42,500 |
Occupancy by Householder Income Bracket in Kerrick
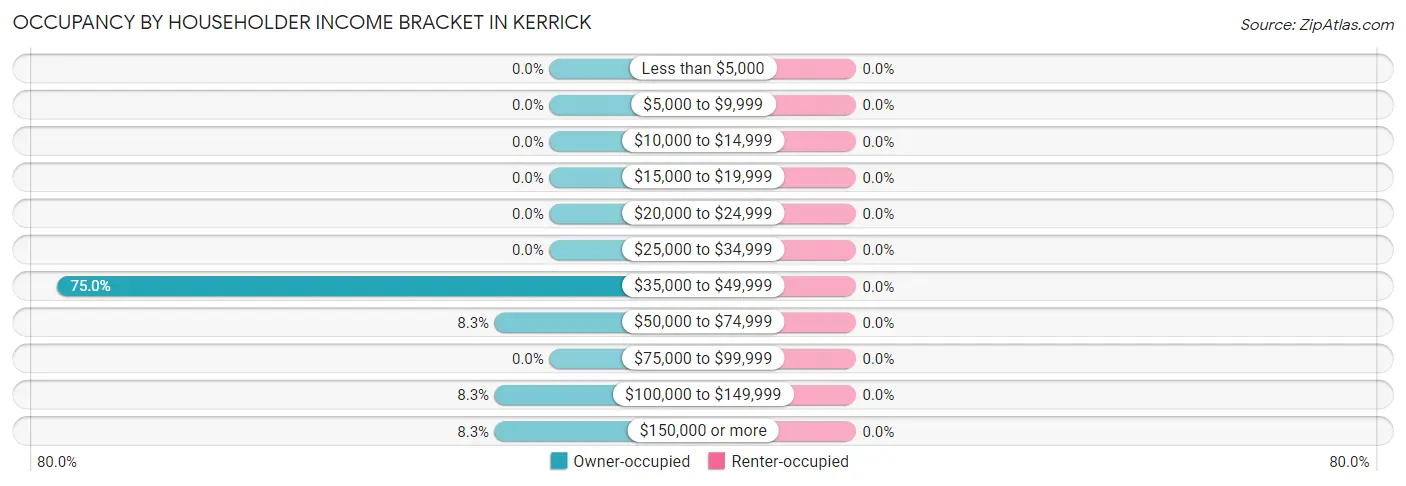
| Income Bracket | Owner-occupied | Renter-occupied |
| Less than $5,000 | 0 (0.0%) | 0 (0.0%) |
| $5,000 to $9,999 | 0 (0.0%) | 0 (0.0%) |
| $10,000 to $14,999 | 0 (0.0%) | 0 (0.0%) |
| $15,000 to $19,999 | 0 (0.0%) | 0 (0.0%) |
| $20,000 to $24,999 | 0 (0.0%) | 0 (0.0%) |
| $25,000 to $34,999 | 0 (0.0%) | 0 (0.0%) |
| $35,000 to $49,999 | 9 (75.0%) | 0 (0.0%) |
| $50,000 to $74,999 | 1 (8.3%) | 0 (0.0%) |
| $75,000 to $99,999 | 0 (0.0%) | 0 (0.0%) |
| $100,000 to $149,999 | 1 (8.3%) | 0 (0.0%) |
| $150,000 or more | 1 (8.3%) | 0 (0.0%) |
| Total | 12 (100.0%) | 0 (0.0%) |
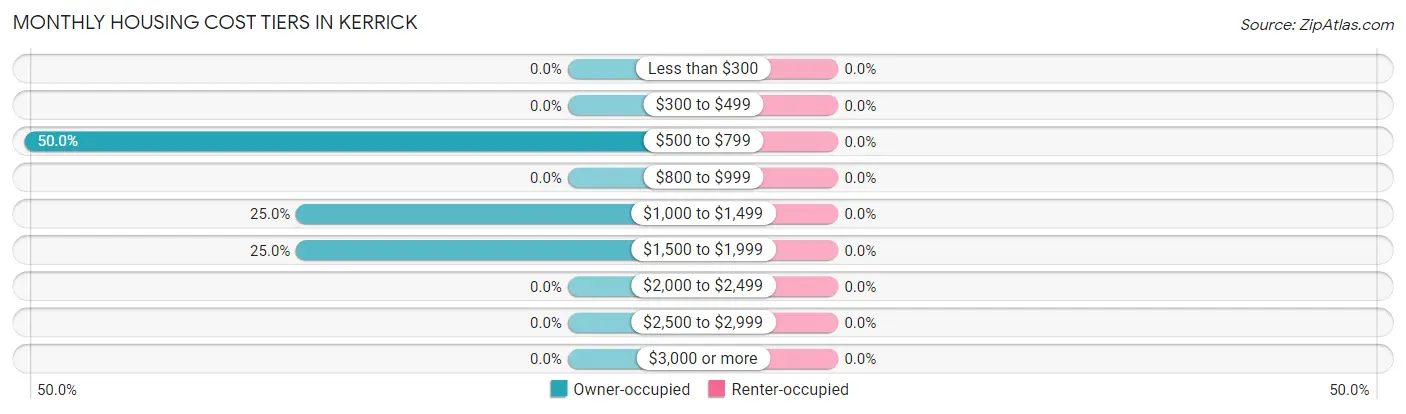
Monthly Housing Cost Tiers in Kerrick
| Monthly Cost | Owner-occupied | Renter-occupied |
| Less than $300 | 0 (0.0%) | 0 (0.0%) |
| $300 to $499 | 0 (0.0%) | 0 (0.0%) |
| $500 to $799 | 6 (50.0%) | 0 (0.0%) |
| $800 to $999 | 0 (0.0%) | 0 (0.0%) |
| $1,000 to $1,499 | 3 (25.0%) | 0 (0.0%) |
| $1,500 to $1,999 | 3 (25.0%) | 0 (0.0%) |
| $2,000 to $2,499 | 0 (0.0%) | 0 (0.0%) |
| $2,500 to $2,999 | 0 (0.0%) | 0 (0.0%) |
| $3,000 or more | 0 (0.0%) | 0 (0.0%) |
| Total | 12 (100.0%) | 0 (0.0%) |
Physical Housing Characteristics in Kerrick
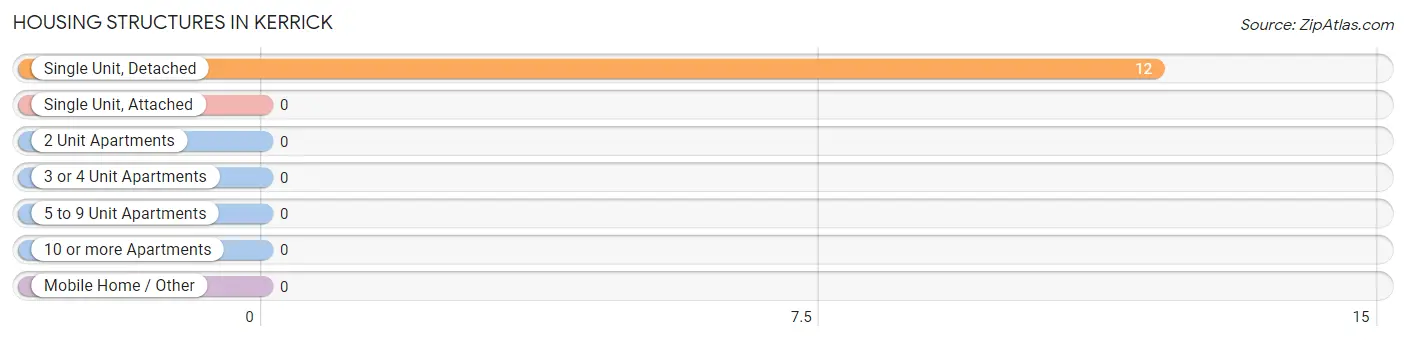
Housing Structures in Kerrick
| Structure Type | # Housing Units | % Housing Units |
| Single Unit, Detached | 12 | 100.0% |
| Single Unit, Attached | 0 | 0.0% |
| 2 Unit Apartments | 0 | 0.0% |
| 3 or 4 Unit Apartments | 0 | 0.0% |
| 5 to 9 Unit Apartments | 0 | 0.0% |
| 10 or more Apartments | 0 | 0.0% |
| Mobile Home / Other | 0 | 0.0% |
| Total | 12 | 100.0% |
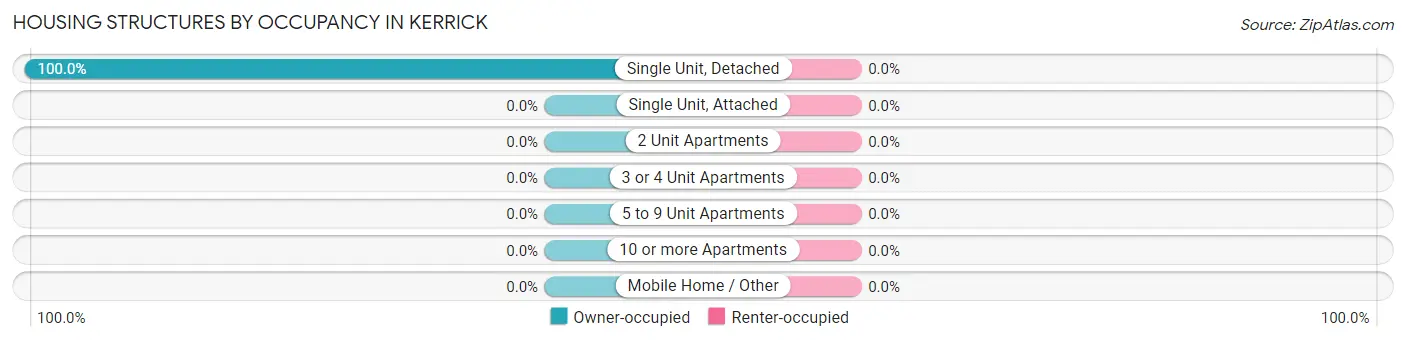
Housing Structures by Occupancy in Kerrick
| Structure Type | Owner-occupied | Renter-occupied |
| Single Unit, Detached | 12 (100.0%) | 0 (0.0%) |
| Single Unit, Attached | 0 (0.0%) | 0 (0.0%) |
| 2 Unit Apartments | 0 (0.0%) | 0 (0.0%) |
| 3 or 4 Unit Apartments | 0 (0.0%) | 0 (0.0%) |
| 5 to 9 Unit Apartments | 0 (0.0%) | 0 (0.0%) |
| 10 or more Apartments | 0 (0.0%) | 0 (0.0%) |
| Mobile Home / Other | 0 (0.0%) | 0 (0.0%) |
| Total | 12 (100.0%) | 0 (0.0%) |
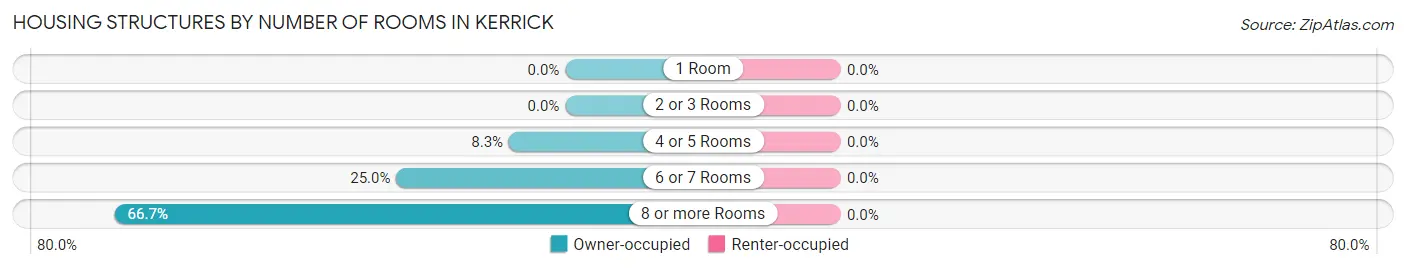
Housing Structures by Number of Rooms in Kerrick
| Number of Rooms | Owner-occupied | Renter-occupied |
| 1 Room | 0 (0.0%) | 0 (0.0%) |
| 2 or 3 Rooms | 0 (0.0%) | 0 (0.0%) |
| 4 or 5 Rooms | 1 (8.3%) | 0 (0.0%) |
| 6 or 7 Rooms | 3 (25.0%) | 0 (0.0%) |
| 8 or more Rooms | 8 (66.7%) | 0 (0.0%) |
| Total | 12 (100.0%) | 0 (0.0%) |
Housing Structure by Heating Type in Kerrick
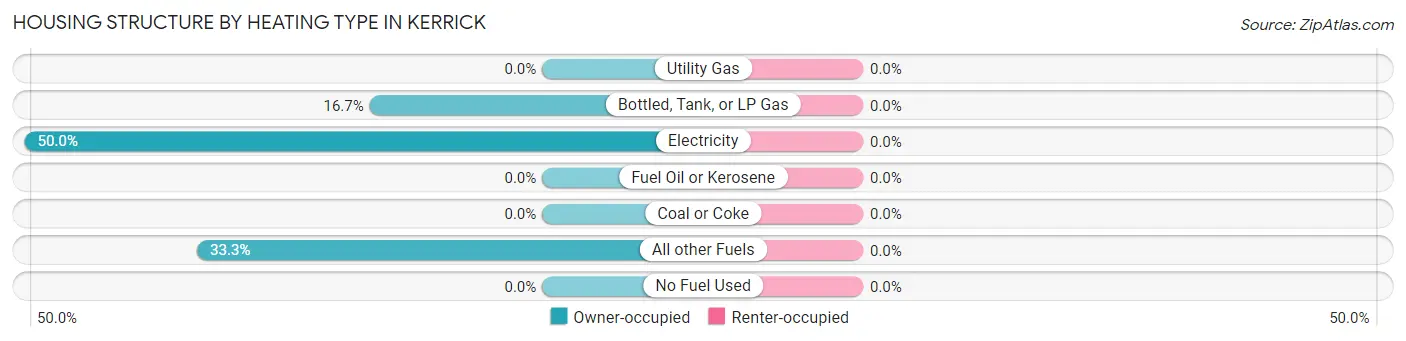
| Heating Type | Owner-occupied | Renter-occupied |
| Utility Gas | 0 (0.0%) | 0 (0.0%) |
| Bottled, Tank, or LP Gas | 2 (16.7%) | 0 (0.0%) |
| Electricity | 6 (50.0%) | 0 (0.0%) |
| Fuel Oil or Kerosene | 0 (0.0%) | 0 (0.0%) |
| Coal or Coke | 0 (0.0%) | 0 (0.0%) |
| All other Fuels | 4 (33.3%) | 0 (0.0%) |
| No Fuel Used | 0 (0.0%) | 0 (0.0%) |
| Total | 12 (100.0%) | 0 (0.0%) |
Household Vehicle Usage in Kerrick
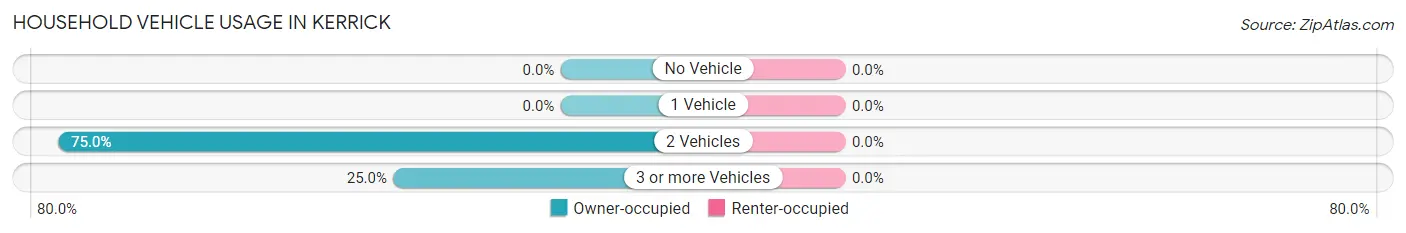
| Vehicles per Household | Owner-occupied | Renter-occupied |
| No Vehicle | 0 (0.0%) | 0 (0.0%) |
| 1 Vehicle | 0 (0.0%) | 0 (0.0%) |
| 2 Vehicles | 9 (75.0%) | 0 (0.0%) |
| 3 or more Vehicles | 3 (25.0%) | 0 (0.0%) |
| Total | 12 (100.0%) | 0 (0.0%) |
Real Estate & Mortgages in Kerrick
Real Estate and Mortgage Overview in Kerrick
| Characteristic | Without Mortgage | With Mortgage |
| Housing Units | 6 | 6 |
| Median Property Value | - | - |
| Median Household Income | - | - |
| Monthly Housing Costs | - | - |
| Real Estate Taxes | - | - |
Property Value by Mortgage Status in Kerrick
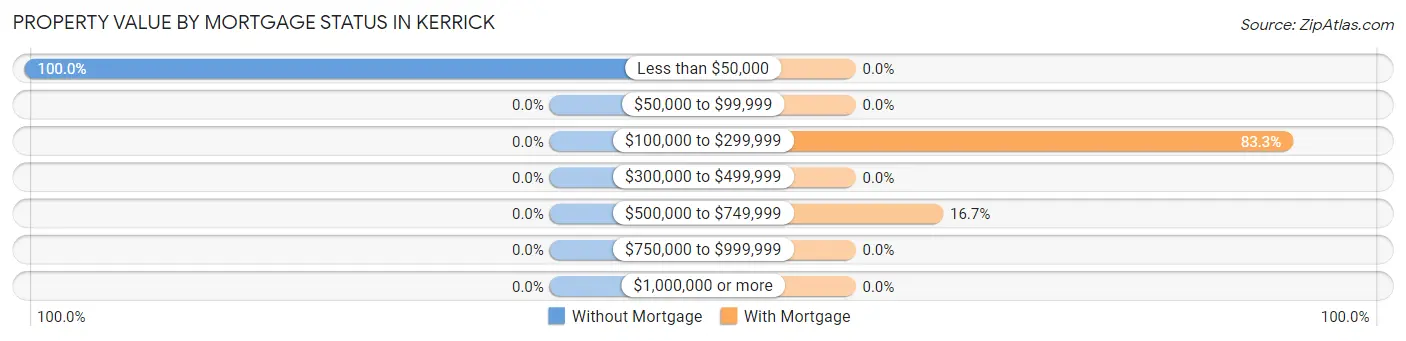
| Property Value | Without Mortgage | With Mortgage |
| Less than $50,000 | 6 (100.0%) | 0 (0.0%) |
| $50,000 to $99,999 | 0 (0.0%) | 0 (0.0%) |
| $100,000 to $299,999 | 0 (0.0%) | 5 (83.3%) |
| $300,000 to $499,999 | 0 (0.0%) | 0 (0.0%) |
| $500,000 to $749,999 | 0 (0.0%) | 1 (16.7%) |
| $750,000 to $999,999 | 0 (0.0%) | 0 (0.0%) |
| $1,000,000 or more | 0 (0.0%) | 0 (0.0%) |
| Total | 6 (100.0%) | 6 (100.0%) |
Household Income by Mortgage Status in Kerrick
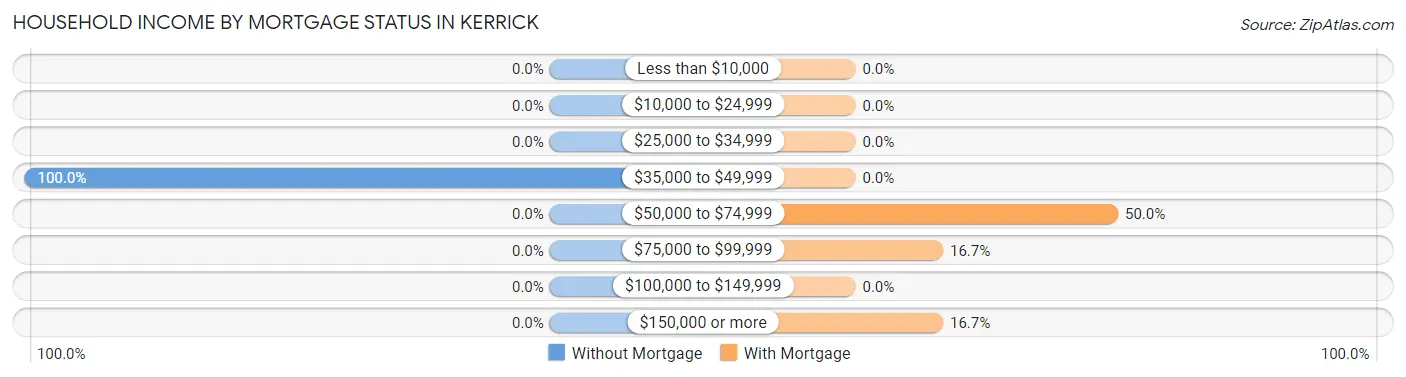
| Household Income | Without Mortgage | With Mortgage |
| Less than $10,000 | 0 (0.0%) | 0 (0.0%) |
| $10,000 to $24,999 | 0 (0.0%) | 0 (0.0%) |
| $25,000 to $34,999 | 0 (0.0%) | 0 (0.0%) |
| $35,000 to $49,999 | 6 (100.0%) | 0 (0.0%) |
| $50,000 to $74,999 | 0 (0.0%) | 3 (50.0%) |
| $75,000 to $99,999 | 0 (0.0%) | 1 (16.7%) |
| $100,000 to $149,999 | 0 (0.0%) | 0 (0.0%) |
| $150,000 or more | 0 (0.0%) | 1 (16.7%) |
| Total | 6 (100.0%) | 6 (100.0%) |
Property Value to Household Income Ratio in Kerrick
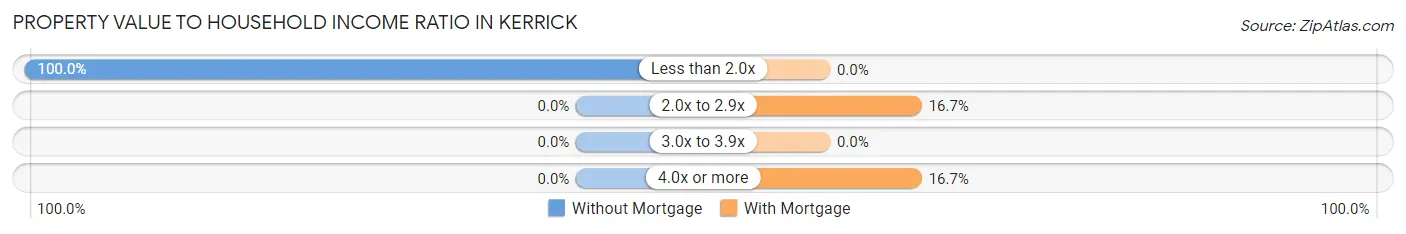
| Value-to-Income Ratio | Without Mortgage | With Mortgage |
| Less than 2.0x | 6 (100.0%) | 0 (0.0%) |
| 2.0x to 2.9x | 0 (0.0%) | 1 (16.7%) |
| 3.0x to 3.9x | 0 (0.0%) | 0 (0.0%) |
| 4.0x or more | 0 (0.0%) | 1 (16.7%) |
| Total | 6 (100.0%) | 6 (100.0%) |
Real Estate Taxes by Mortgage Status in Kerrick
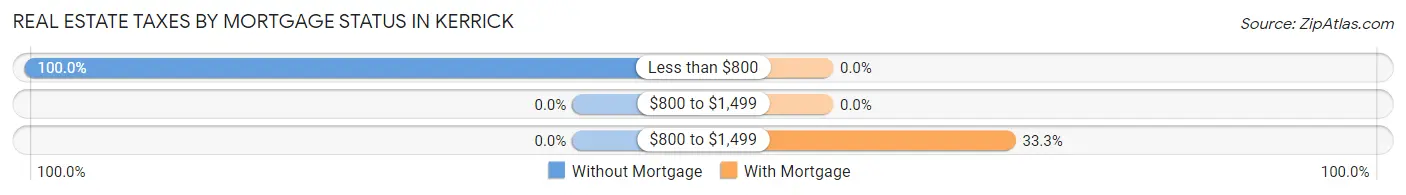
| Property Taxes | Without Mortgage | With Mortgage |
| Less than $800 | 6 (100.0%) | 0 (0.0%) |
| $800 to $1,499 | 0 (0.0%) | 0 (0.0%) |
| $800 to $1,499 | 0 (0.0%) | 2 (33.3%) |
| Total | 6 (100.0%) | 6 (100.0%) |
Health & Disability in Kerrick
Health Insurance Coverage by Age in Kerrick
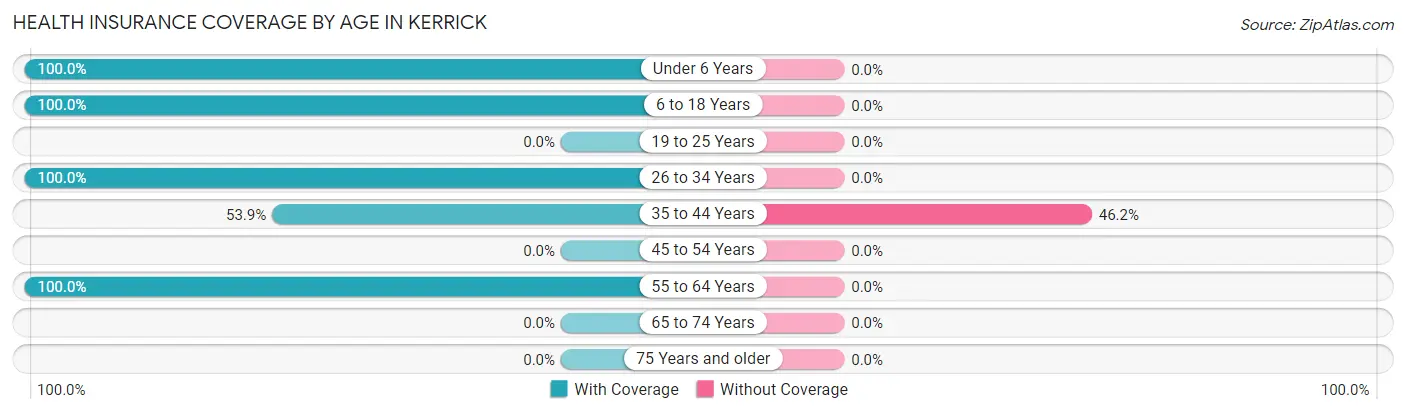
| Age Bracket | With Coverage | Without Coverage |
| Under 6 Years | 2 (100.0%) | 0 (0.0%) |
| 6 to 18 Years | 2 (100.0%) | 0 (0.0%) |
| 19 to 25 Years | 0 (0.0%) | 0 (0.0%) |
| 26 to 34 Years | 1 (100.0%) | 0 (0.0%) |
| 35 to 44 Years | 7 (53.8%) | 6 (46.2%) |
| 45 to 54 Years | 0 (0.0%) | 0 (0.0%) |
| 55 to 64 Years | 6 (100.0%) | 0 (0.0%) |
| 65 to 74 Years | 0 (0.0%) | 0 (0.0%) |
| 75 Years and older | 0 (0.0%) | 0 (0.0%) |
| Total | 18 (75.0%) | 6 (25.0%) |
Health Insurance Coverage by Citizenship Status in Kerrick
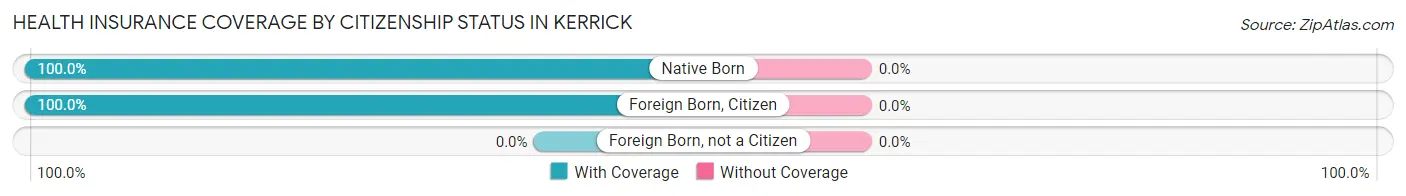
| Citizenship Status | With Coverage | Without Coverage |
| Native Born | 2 (100.0%) | 0 (0.0%) |
| Foreign Born, Citizen | 2 (100.0%) | 0 (0.0%) |
| Foreign Born, not a Citizen | 0 (0.0%) | 0 (0.0%) |
Health Insurance Coverage by Household Income in Kerrick
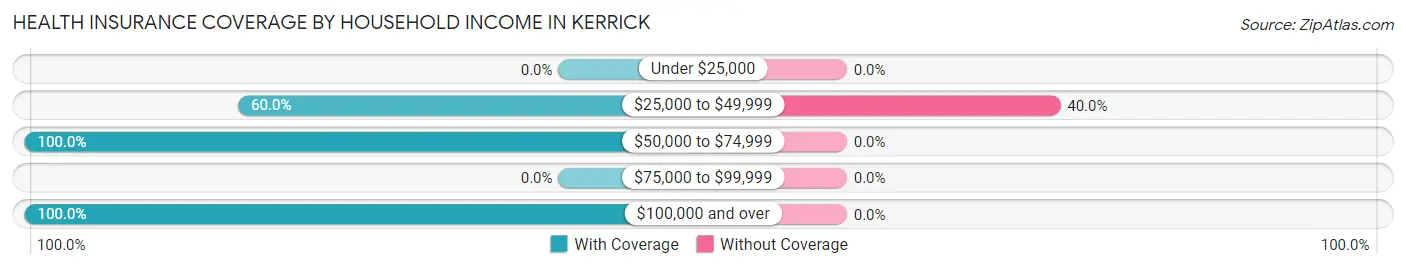
| Household Income | With Coverage | Without Coverage |
| Under $25,000 | 0 (0.0%) | 0 (0.0%) |
| $25,000 to $49,999 | 9 (60.0%) | 6 (40.0%) |
| $50,000 to $74,999 | 2 (100.0%) | 0 (0.0%) |
| $75,000 to $99,999 | 0 (0.0%) | 0 (0.0%) |
| $100,000 and over | 7 (100.0%) | 0 (0.0%) |
Public vs Private Health Insurance Coverage by Age in Kerrick
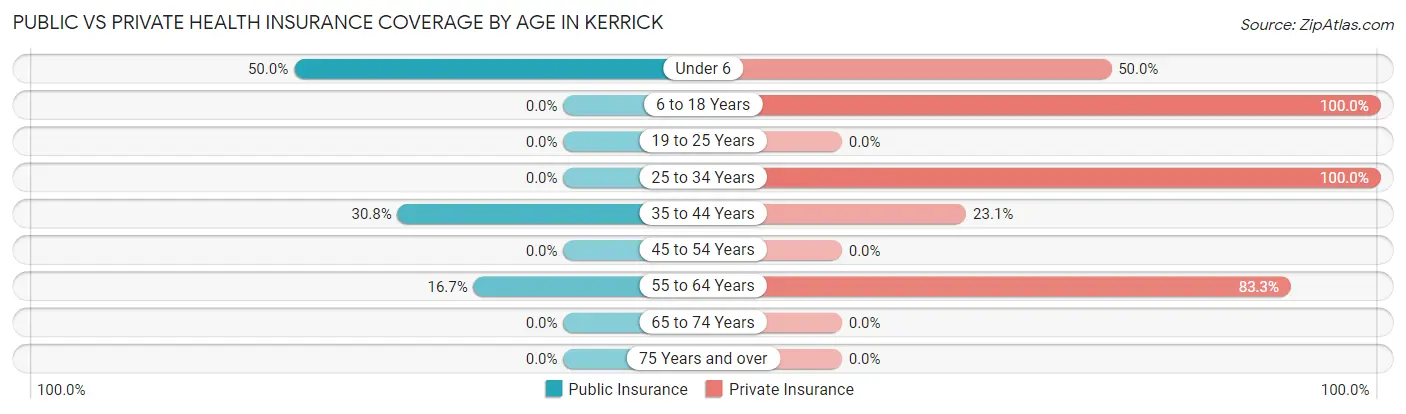
| Age Bracket | Public Insurance | Private Insurance |
| Under 6 | 1 (50.0%) | 1 (50.0%) |
| 6 to 18 Years | 0 (0.0%) | 2 (100.0%) |
| 19 to 25 Years | 0 (0.0%) | 0 (0.0%) |
| 25 to 34 Years | 0 (0.0%) | 1 (100.0%) |
| 35 to 44 Years | 4 (30.8%) | 3 (23.1%) |
| 45 to 54 Years | 0 (0.0%) | 0 (0.0%) |
| 55 to 64 Years | 1 (16.7%) | 5 (83.3%) |
| 65 to 74 Years | 0 (0.0%) | 0 (0.0%) |
| 75 Years and over | 0 (0.0%) | 0 (0.0%) |
| Total | 6 (25.0%) | 12 (50.0%) |
Disability Status by Sex by Age in Kerrick
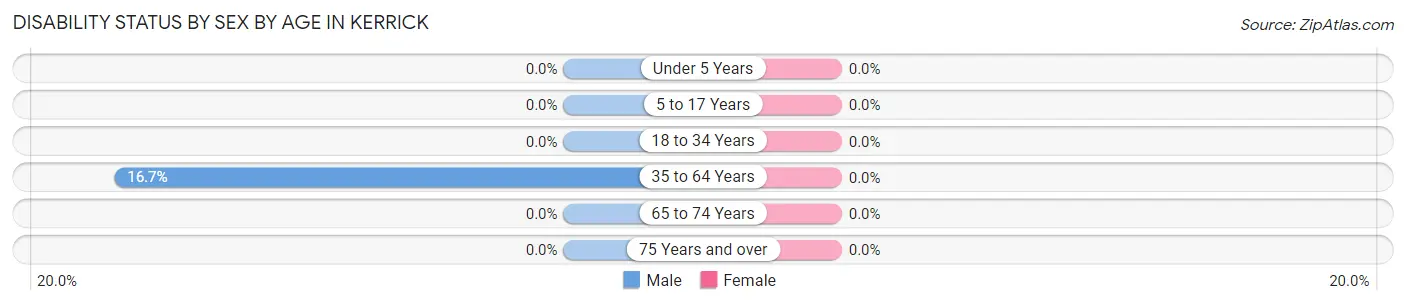
| Age Bracket | Male | Female |
| Under 5 Years | 0 (0.0%) | 0 (0.0%) |
| 5 to 17 Years | 0 (0.0%) | 0 (0.0%) |
| 18 to 34 Years | 0 (0.0%) | 0 (0.0%) |
| 35 to 64 Years | 2 (16.7%) | 0 (0.0%) |
| 65 to 74 Years | 0 (0.0%) | 0 (0.0%) |
| 75 Years and over | 0 (0.0%) | 0 (0.0%) |
Disability Class by Sex by Age in Kerrick
Disability Class: Hearing Difficulty
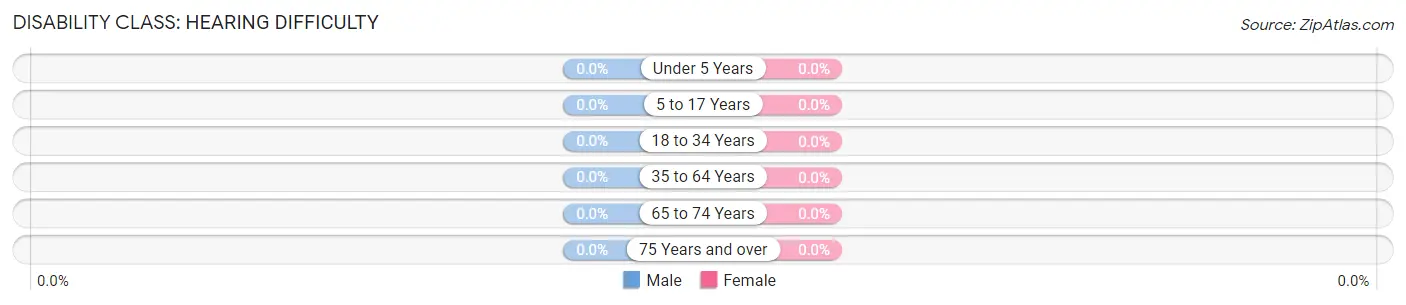
| Age Bracket | Male | Female |
| Under 5 Years | 0 (0.0%) | 0 (0.0%) |
| 5 to 17 Years | 0 (0.0%) | 0 (0.0%) |
| 18 to 34 Years | 0 (0.0%) | 0 (0.0%) |
| 35 to 64 Years | 0 (0.0%) | 0 (0.0%) |
| 65 to 74 Years | 0 (0.0%) | 0 (0.0%) |
| 75 Years and over | 0 (0.0%) | 0 (0.0%) |
Disability Class: Vision Difficulty
| Age Bracket | Male | Female |
| Under 5 Years | 0 (0.0%) | 0 (0.0%) |
| 5 to 17 Years | 0 (0.0%) | 0 (0.0%) |
| 18 to 34 Years | 0 (0.0%) | 0 (0.0%) |
| 35 to 64 Years | 0 (0.0%) | 0 (0.0%) |
| 65 to 74 Years | 0 (0.0%) | 0 (0.0%) |
| 75 Years and over | 0 (0.0%) | 0 (0.0%) |
Disability Class: Cognitive Difficulty
| Age Bracket | Male | Female |
| 5 to 17 Years | 0 (0.0%) | 0 (0.0%) |
| 18 to 34 Years | 0 (0.0%) | 0 (0.0%) |
| 35 to 64 Years | 0 (0.0%) | 0 (0.0%) |
| 65 to 74 Years | 0 (0.0%) | 0 (0.0%) |
| 75 Years and over | 0 (0.0%) | 0 (0.0%) |
Disability Class: Ambulatory Difficulty
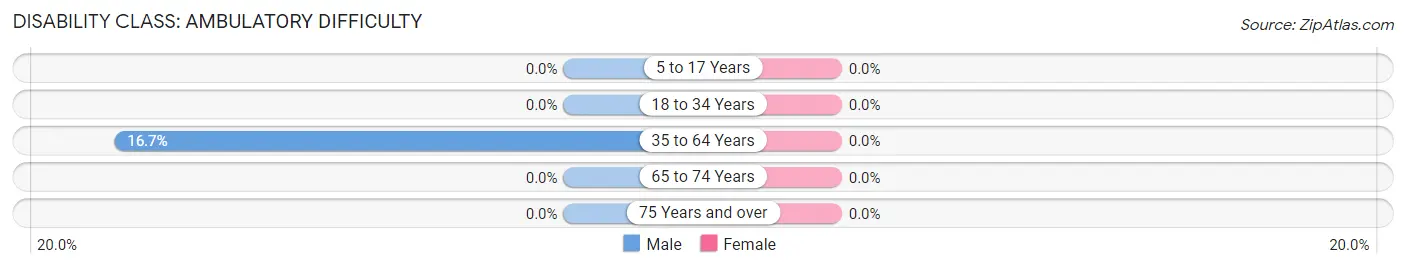
| Age Bracket | Male | Female |
| 5 to 17 Years | 0 (0.0%) | 0 (0.0%) |
| 18 to 34 Years | 0 (0.0%) | 0 (0.0%) |
| 35 to 64 Years | 2 (16.7%) | 0 (0.0%) |
| 65 to 74 Years | 0 (0.0%) | 0 (0.0%) |
| 75 Years and over | 0 (0.0%) | 0 (0.0%) |
Disability Class: Self-Care Difficulty

| Age Bracket | Male | Female |
| 5 to 17 Years | 0 (0.0%) | 0 (0.0%) |
| 18 to 34 Years | 0 (0.0%) | 0 (0.0%) |
| 35 to 64 Years | 0 (0.0%) | 0 (0.0%) |
| 65 to 74 Years | 0 (0.0%) | 0 (0.0%) |
| 75 Years and over | 0 (0.0%) | 0 (0.0%) |
Technology Access in Kerrick
Computing Device Access in Kerrick
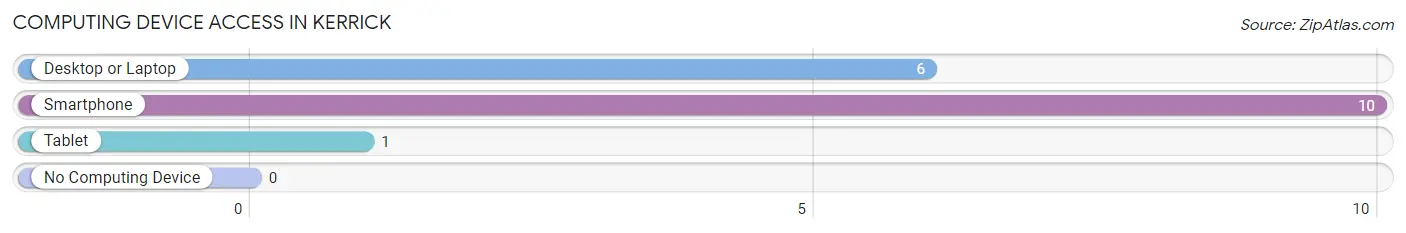
| Device Type | # Households | % Households |
| Desktop or Laptop | 6 | 50.0% |
| Smartphone | 10 | 83.3% |
| Tablet | 1 | 8.3% |
| No Computing Device | 0 | 0.0% |
| Total | 12 | 100.0% |
Internet Access in Kerrick
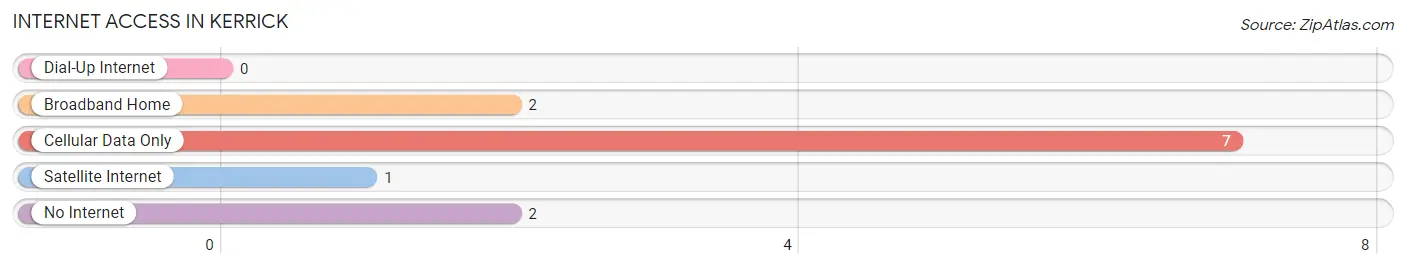
| Internet Type | # Households | % Households |
| Dial-Up Internet | 0 | 0.0% |
| Broadband Home | 2 | 16.7% |
| Cellular Data Only | 7 | 58.3% |
| Satellite Internet | 1 | 8.3% |
| No Internet | 2 | 16.7% |
| Total | 12 | 100.0% |
Kerrick Summary
Kerrick is a small city located in Pine County, Minnesota. It is situated on the banks of the Snake River, about 30 miles north of Duluth. The city has a population of about 500 people and is part of the larger Pine County area.
History
Kerrick was founded in 1887 by a group of settlers from Wisconsin. The city was named after a local Native American chief, Chief Kerrick. The settlers were attracted to the area due to its abundance of natural resources, including timber and iron ore. The city quickly grew and by the early 1900s, it had become a bustling community with a population of over 1,000 people.
The city was home to a number of businesses, including a sawmill, a flour mill, a blacksmith shop, and a general store. The city also had a school, a post office, and a hotel. The city was also home to a number of churches, including the First Baptist Church, the Methodist Episcopal Church, and the Congregational Church.
In the early 1900s, the city was home to a number of immigrants, including Swedes, Norwegians, and Finns. These immigrants brought with them their own culture and traditions, which still influence the city today.
Geography
Kerrick is located in the northern part of Pine County, Minnesota. It is situated on the banks of the Snake River, about 30 miles north of Duluth. The city is surrounded by forests and lakes, making it a popular destination for outdoor activities such as fishing, hunting, and camping.
The city has a total area of 0.7 square miles, all of which is land. The city has a humid continental climate, with cold winters and warm summers. The average annual temperature is around 40 degrees Fahrenheit.
Economy
Kerrick’s economy is largely based on tourism and outdoor recreation. The city is home to a number of resorts and campgrounds, as well as a number of restaurants and bars. The city is also home to a number of small businesses, including a grocery store, a hardware store, and a gas station.
The city is also home to a number of manufacturing companies, including a paper mill and a wood products plant. The city is also home to a number of logging companies, which provide employment for many of the city’s residents.
Demographics
As of the 2010 census, the population of Kerrick was 498 people. The racial makeup of the city was 97.2% White, 0.2% African American, 0.2% Native American, 0.2% Asian, 0.2% from other races, and 1.8% from two or more races. Hispanic or Latino of any race were 0.8% of the population.
The median income for a household in the city was $37,500, and the median income for a family was $41,250. The per capita income for the city was $17,845. About 11.2% of families and 13.2% of the population were below the poverty line, including 16.7% of those under age 18 and none of those age 65 or over.
Kerrick is a small city with a rich history and a vibrant economy. The city is home to a number of businesses and outdoor activities, making it a popular destination for tourists and locals alike. The city is also home to a diverse population, with a mix of cultures and traditions.
Common Questions
What is Per Capita Income in Kerrick?
Per Capita income in Kerrick is $28,317.
What is the Median Family Income in Kerrick?
Median Family Income in Kerrick is $58,750.
What is the Median Household income in Kerrick?
Median Household Income in Kerrick is $42,500.
What is Inequality or Gini Index in Kerrick?
Inequality or Gini Index in Kerrick is 0.24.
What is the Total Population of Kerrick?
Total Population of Kerrick is 24.
What is the Total Male Population of Kerrick?
Total Male Population of Kerrick is 15.
What is the Total Female Population of Kerrick?
Total Female Population of Kerrick is 9.
What is the Ratio of Males per 100 Females in Kerrick?
There are 166.67 Males per 100 Females in Kerrick.
What is the Ratio of Females per 100 Males in Kerrick?
There are 60.00 Females per 100 Males in Kerrick.
What is the Median Population Age in Kerrick?
Median Population Age in Kerrick is 37.5 Years.
What is the Average Family Size in Kerrick
Average Family Size in Kerrick is 2.8 People.
What is the Average Household Size in Kerrick
Average Household Size in Kerrick is 2.0 People.
How Large is the Labor Force in Kerrick?
There are 18 People in the Labor Forcein in Kerrick.
What is the Percentage of People in the Labor Force in Kerrick?
90.0% of People are in the Labor Force in Kerrick.
What is the Unemployment Rate in Kerrick?
Unemployment Rate in Kerrick is 55.6%.