St Bonifacius, MN Map & Demographics
St Bonifacius Map
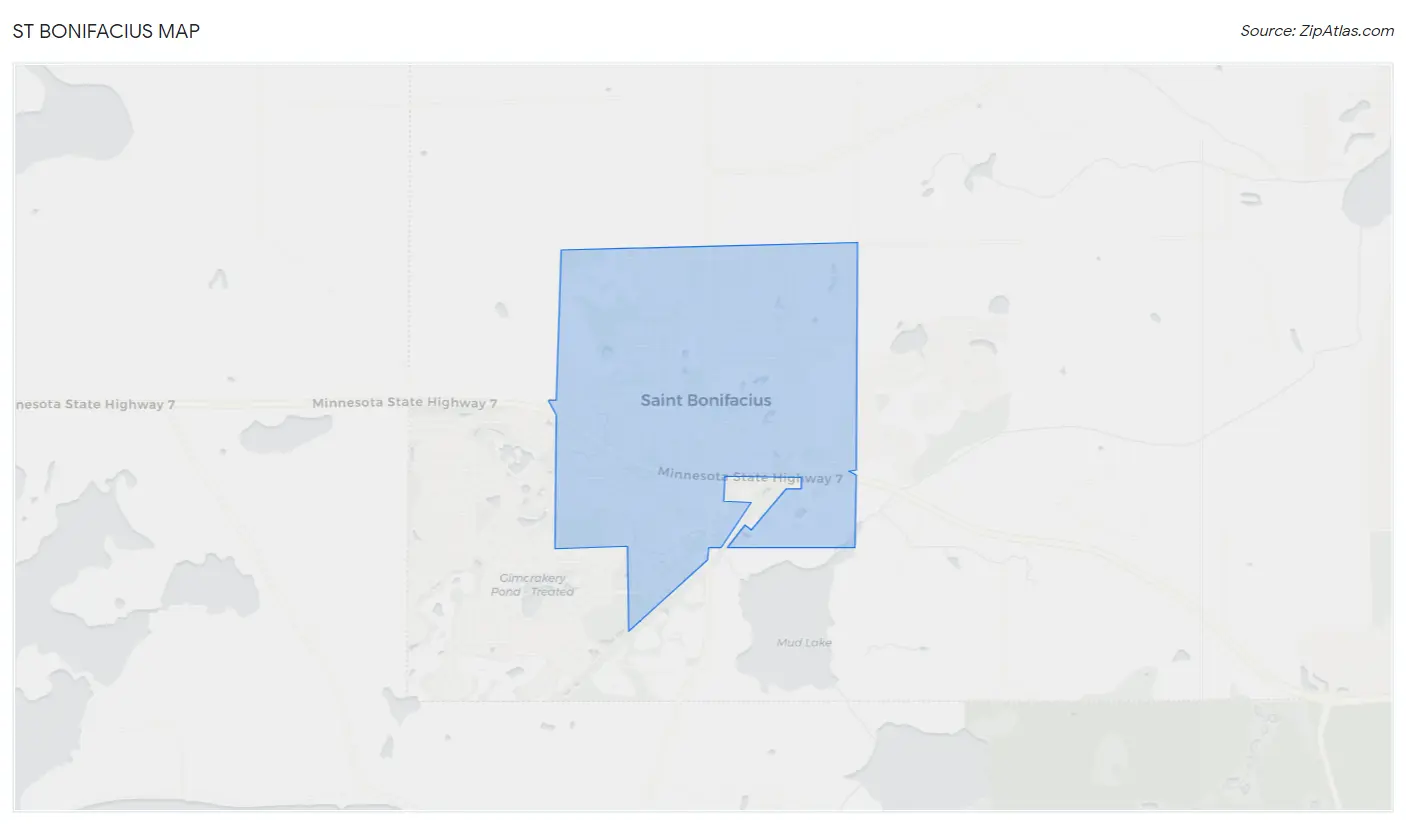
St Bonifacius Overview
$49,457
PER CAPITA INCOME
$129,135
AVG FAMILY INCOME
$101,319
AVG HOUSEHOLD INCOME
2.5%
WAGE / INCOME GAP [ % ]
97.5¢/ $1
WAGE / INCOME GAP [ $ ]
0.33
INEQUALITY / GINI INDEX
1,956
TOTAL POPULATION
1,073
MALE POPULATION
883
FEMALE POPULATION
121.52
MALES / 100 FEMALES
82.29
FEMALES / 100 MALES
41.1
MEDIAN AGE
3.0
AVG FAMILY SIZE
2.4
AVG HOUSEHOLD SIZE
1,171
LABOR FORCE [ PEOPLE ]
76.8%
PERCENT IN LABOR FORCE
3.3%
UNEMPLOYMENT RATE
Income in St Bonifacius
Income Overview in St Bonifacius
Per Capita Income in St Bonifacius is $49,457, while median incomes of families and households are $129,135 and $101,319 respectively.
| Characteristic | Number | Measure |
| Per Capita Income | 1,956 | $49,457 |
| Median Family Income | 569 | $129,135 |
| Mean Family Income | 569 | $133,503 |
| Median Household Income | 801 | $101,319 |
| Mean Household Income | 801 | $120,570 |
| Income Deficit | 569 | $0 |
| Wage / Income Gap (%) | 1,956 | 2.50% |
| Wage / Income Gap ($) | 1,956 | 97.50¢ per $1 |
| Gini / Inequality Index | 1,956 | 0.33 |
Earnings by Sex in St Bonifacius
Average Earnings in St Bonifacius are $66,765, $67,841 for men and $66,146 for women, a difference of 2.5%.
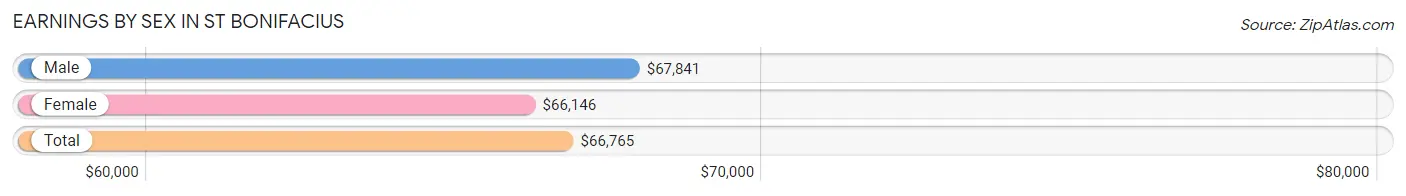
| Sex | Number | Average Earnings |
| Male | 655 (53.1%) | $67,841 |
| Female | 579 (46.9%) | $66,146 |
| Total | 1,234 (100.0%) | $66,765 |
Earnings by Sex by Income Bracket in St Bonifacius
The most common earnings brackets in St Bonifacius are $75,000 to $99,999 for men (176 | 26.9%) and $65,000 to $74,999 for women (119 | 20.5%).
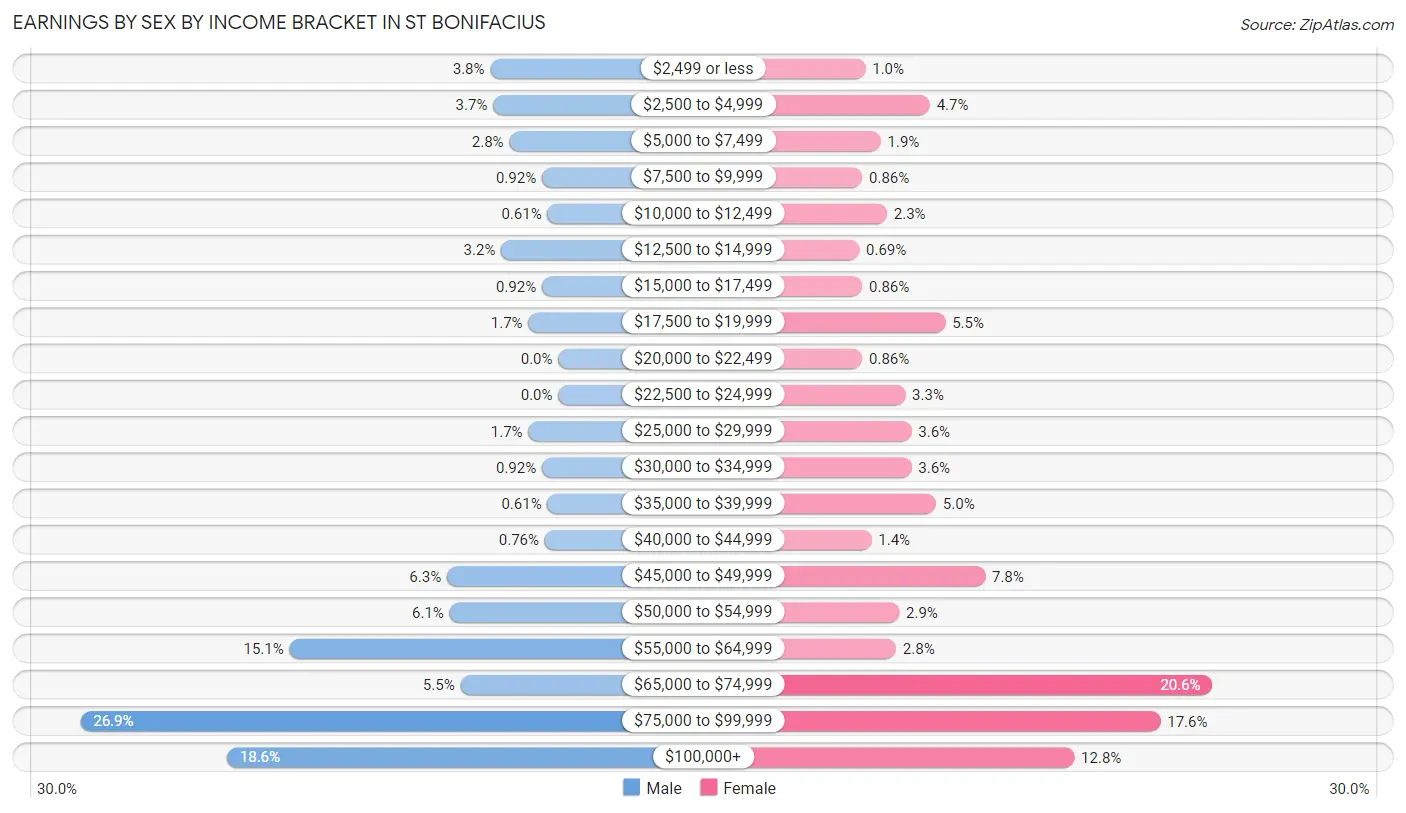
| Income | Male | Female |
| $2,499 or less | 25 (3.8%) | 6 (1.0%) |
| $2,500 to $4,999 | 24 (3.7%) | 27 (4.7%) |
| $5,000 to $7,499 | 18 (2.8%) | 11 (1.9%) |
| $7,500 to $9,999 | 6 (0.9%) | 5 (0.9%) |
| $10,000 to $12,499 | 4 (0.6%) | 13 (2.2%) |
| $12,500 to $14,999 | 21 (3.2%) | 4 (0.7%) |
| $15,000 to $17,499 | 6 (0.9%) | 5 (0.9%) |
| $17,500 to $19,999 | 11 (1.7%) | 32 (5.5%) |
| $20,000 to $22,499 | 0 (0.0%) | 5 (0.9%) |
| $22,500 to $24,999 | 0 (0.0%) | 19 (3.3%) |
| $25,000 to $29,999 | 11 (1.7%) | 21 (3.6%) |
| $30,000 to $34,999 | 6 (0.9%) | 21 (3.6%) |
| $35,000 to $39,999 | 4 (0.6%) | 29 (5.0%) |
| $40,000 to $44,999 | 5 (0.8%) | 8 (1.4%) |
| $45,000 to $49,999 | 41 (6.3%) | 45 (7.8%) |
| $50,000 to $54,999 | 40 (6.1%) | 17 (2.9%) |
| $55,000 to $64,999 | 99 (15.1%) | 16 (2.8%) |
| $65,000 to $74,999 | 36 (5.5%) | 119 (20.5%) |
| $75,000 to $99,999 | 176 (26.9%) | 102 (17.6%) |
| $100,000+ | 122 (18.6%) | 74 (12.8%) |
| Total | 655 (100.0%) | 579 (100.0%) |
Earnings by Sex by Educational Attainment in St Bonifacius
Average earnings in St Bonifacius are $74,250 for men and $68,380 for women, a difference of 7.9%. Men with an educational attainment of graduate degree enjoy the highest average annual earnings of $100,000, while those with high school diploma education earn the least with $57,917. Women with an educational attainment of graduate degree earn the most with the average annual earnings of $109,063, while those with high school diploma education have the smallest earnings of $45,820.
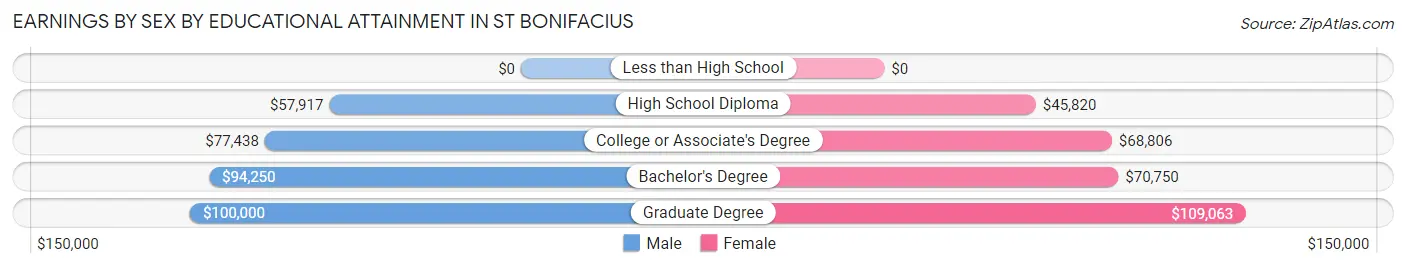
| Educational Attainment | Male Income | Female Income |
| Less than High School | - | - |
| High School Diploma | $57,917 | $45,820 |
| College or Associate's Degree | $77,438 | $68,806 |
| Bachelor's Degree | $94,250 | $70,750 |
| Graduate Degree | $100,000 | $109,063 |
| Total | $74,250 | $68,380 |
Family Income in St Bonifacius
Family Income Brackets in St Bonifacius
According to the St Bonifacius family income data, there are 179 families falling into the $150,000 to $199,999 income range, which is the most common income bracket and makes up 31.5% of all families.
| Income Bracket | # Families | % Families |
| Less than $10,000 | 0 | 0.0% |
| $10,000 to $14,999 | 0 | 0.0% |
| $15,000 to $24,999 | 0 | 0.0% |
| $25,000 to $34,999 | 21 | 3.7% |
| $35,000 to $49,999 | 10 | 1.8% |
| $50,000 to $74,999 | 32 | 5.6% |
| $75,000 to $99,999 | 131 | 23.0% |
| $100,000 to $149,999 | 136 | 23.9% |
| $150,000 to $199,999 | 179 | 31.5% |
| $200,000+ | 60 | 10.5% |
Family Income by Famaliy Size in St Bonifacius
4-person families (68 | 11.9%) account for the highest median family income in St Bonifacius with $162,083 per family, while 2-person families (258 | 45.3%) have the highest median income of $51,750 per family member.
| Income Bracket | # Families | Median Income |
| 2-Person Families | 258 (45.3%) | $103,500 |
| 3-Person Families | 166 (29.2%) | $153,208 |
| 4-Person Families | 68 (11.9%) | $162,083 |
| 5-Person Families | 60 (10.5%) | $0 |
| 6-Person Families | 5 (0.9%) | $0 |
| 7+ Person Families | 12 (2.1%) | $0 |
| Total | 569 (100.0%) | $129,135 |
Family Income by Number of Earners in St Bonifacius
The median family income in St Bonifacius is $129,135, with families comprising 3+ earners (70) having the highest median family income of $189,615, while families with no earners (37) have the lowest median family income of $78,173, accounting for 12.3% and 6.5% of families, respectively.
| Number of Earners | # Families | Median Income |
| No Earners | 37 (6.5%) | $78,173 |
| 1 Earner | 123 (21.6%) | $97,188 |
| 2 Earners | 339 (59.6%) | $141,250 |
| 3+ Earners | 70 (12.3%) | $189,615 |
| Total | 569 (100.0%) | $129,135 |
Household Income in St Bonifacius
Household Income Brackets in St Bonifacius
With 189 households falling in the category, the $150,000 to $199,999 income range is the most frequent in St Bonifacius, accounting for 23.6% of all households.
| Income Bracket | # Households | % Households |
| Less than $10,000 | 0 | 0.0% |
| $10,000 to $14,999 | 16 | 2.0% |
| $15,000 to $24,999 | 18 | 2.2% |
| $25,000 to $34,999 | 33 | 4.1% |
| $35,000 to $49,999 | 50 | 6.2% |
| $50,000 to $74,999 | 92 | 11.5% |
| $75,000 to $99,999 | 182 | 22.7% |
| $100,000 to $149,999 | 146 | 18.2% |
| $150,000 to $199,999 | 189 | 23.6% |
| $200,000+ | 75 | 9.4% |
Household Income by Householder Age in St Bonifacius
The median household income in St Bonifacius is $101,319, with the highest median household income of $144,000 found in the 25 to 44 years age bracket for the primary householder. A total of 280 households (35.0%) fall into this category. Meanwhile, the 15 to 24 years age bracket for the primary householder has the lowest median household income of $0, with 5 households (0.6%) in this group.
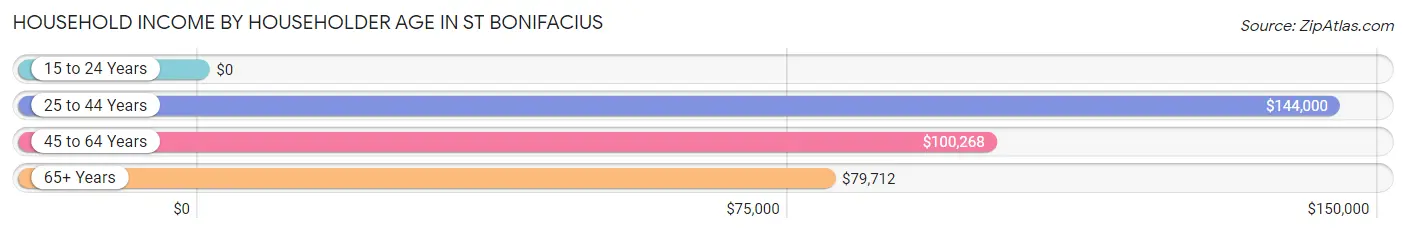
| Income Bracket | # Households | Median Income |
| 15 to 24 Years | 5 (0.6%) | $0 |
| 25 to 44 Years | 280 (35.0%) | $144,000 |
| 45 to 64 Years | 383 (47.8%) | $100,268 |
| 65+ Years | 133 (16.6%) | $79,712 |
| Total | 801 (100.0%) | $101,319 |
Poverty in St Bonifacius
Income Below Poverty by Sex and Age in St Bonifacius
With 1.5% poverty level for males and 1.0% for females among the residents of St Bonifacius, 45 to 54 year old males and 65 to 74 year old females are the most vulnerable to poverty, with 16 males (11.6%) and 5 females (7.0%) in their respective age groups living below the poverty level.
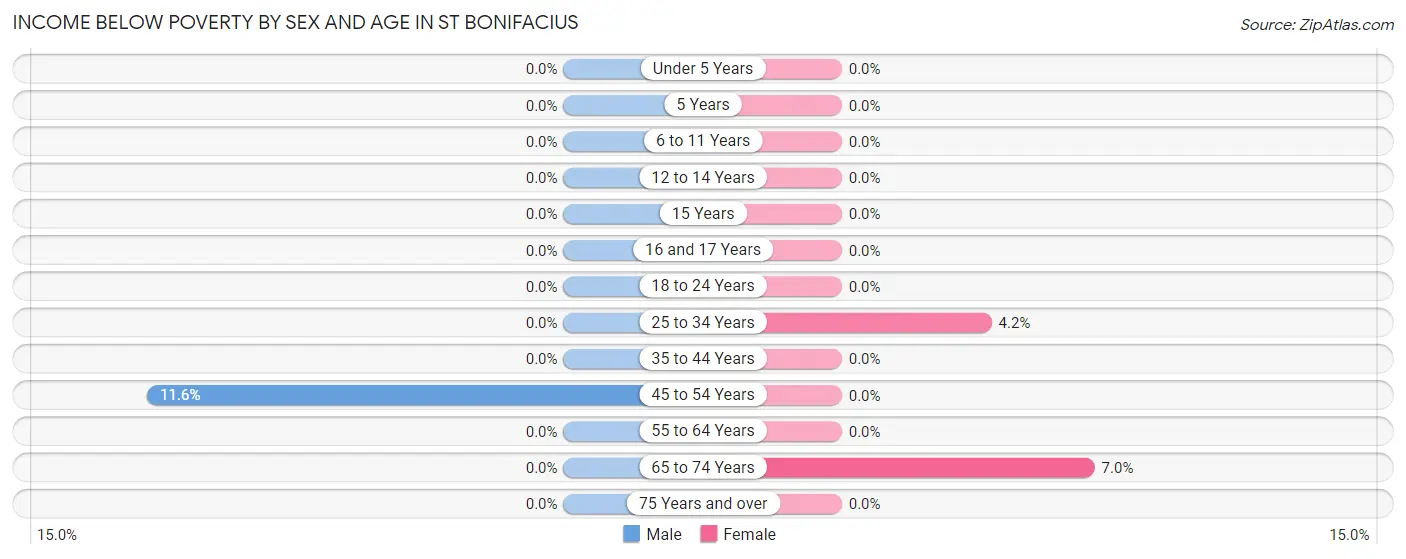
| Age Bracket | Male | Female |
| Under 5 Years | 0 (0.0%) | 0 (0.0%) |
| 5 Years | 0 (0.0%) | 0 (0.0%) |
| 6 to 11 Years | 0 (0.0%) | 0 (0.0%) |
| 12 to 14 Years | 0 (0.0%) | 0 (0.0%) |
| 15 Years | 0 (0.0%) | 0 (0.0%) |
| 16 and 17 Years | 0 (0.0%) | 0 (0.0%) |
| 18 to 24 Years | 0 (0.0%) | 0 (0.0%) |
| 25 to 34 Years | 0 (0.0%) | 4 (4.2%) |
| 35 to 44 Years | 0 (0.0%) | 0 (0.0%) |
| 45 to 54 Years | 16 (11.6%) | 0 (0.0%) |
| 55 to 64 Years | 0 (0.0%) | 0 (0.0%) |
| 65 to 74 Years | 0 (0.0%) | 5 (7.0%) |
| 75 Years and over | 0 (0.0%) | 0 (0.0%) |
| Total | 16 (1.5%) | 9 (1.0%) |
Income Above Poverty by Sex and Age in St Bonifacius
According to the poverty statistics in St Bonifacius, males aged under 5 years and females aged under 5 years are the age groups that are most secure financially, with 100.0% of males and 100.0% of females in these age groups living above the poverty line.
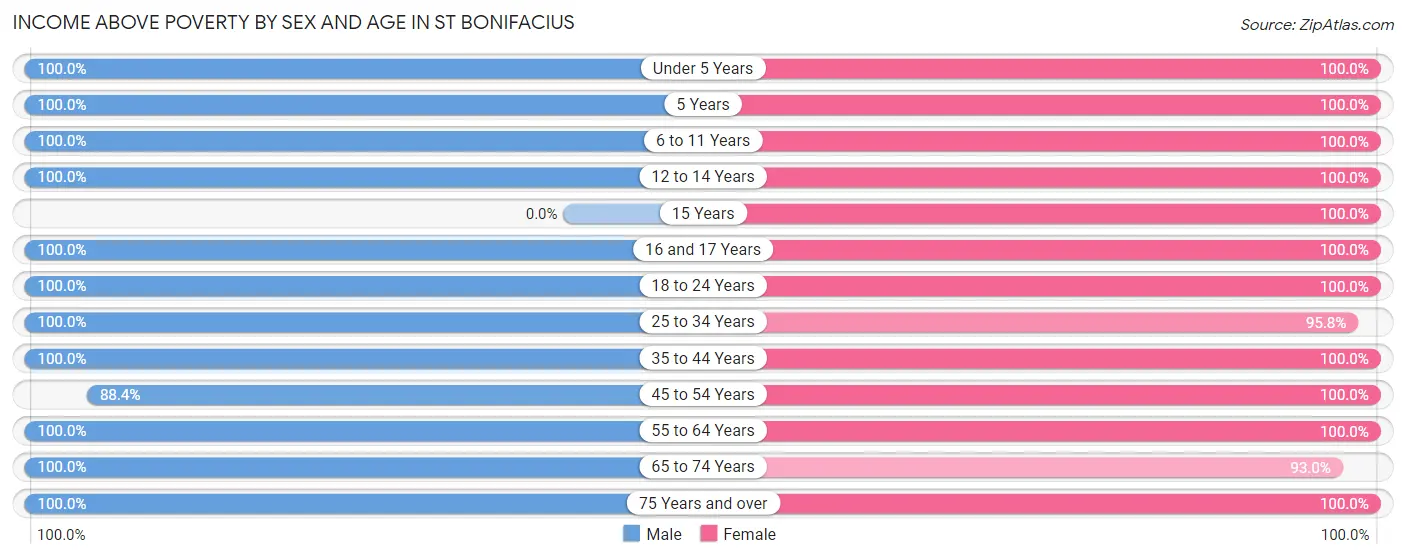
| Age Bracket | Male | Female |
| Under 5 Years | 77 (100.0%) | 48 (100.0%) |
| 5 Years | 5 (100.0%) | 4 (100.0%) |
| 6 to 11 Years | 106 (100.0%) | 50 (100.0%) |
| 12 to 14 Years | 107 (100.0%) | 18 (100.0%) |
| 15 Years | 0 (0.0%) | 16 (100.0%) |
| 16 and 17 Years | 43 (100.0%) | 21 (100.0%) |
| 18 to 24 Years | 30 (100.0%) | 42 (100.0%) |
| 25 to 34 Years | 106 (100.0%) | 92 (95.8%) |
| 35 to 44 Years | 158 (100.0%) | 183 (100.0%) |
| 45 to 54 Years | 122 (88.4%) | 138 (100.0%) |
| 55 to 64 Years | 199 (100.0%) | 164 (100.0%) |
| 65 to 74 Years | 81 (100.0%) | 66 (93.0%) |
| 75 Years and over | 23 (100.0%) | 32 (100.0%) |
| Total | 1,057 (98.5%) | 874 (99.0%) |
Income Below Poverty Among Married-Couple Families in St Bonifacius
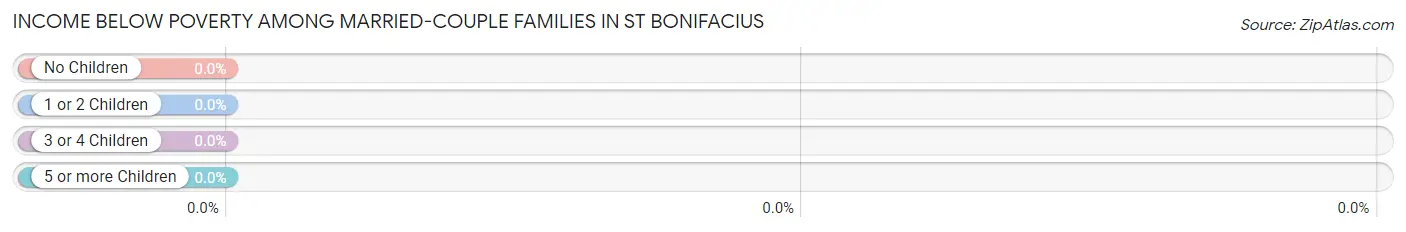
| Children | Above Poverty | Below Poverty |
| No Children | 250 (100.0%) | 0 (0.0%) |
| 1 or 2 Children | 189 (100.0%) | 0 (0.0%) |
| 3 or 4 Children | 50 (100.0%) | 0 (0.0%) |
| 5 or more Children | 12 (100.0%) | 0 (0.0%) |
| Total | 501 (100.0%) | 0 (0.0%) |
Income Below Poverty Among Single-Parent Households in St Bonifacius
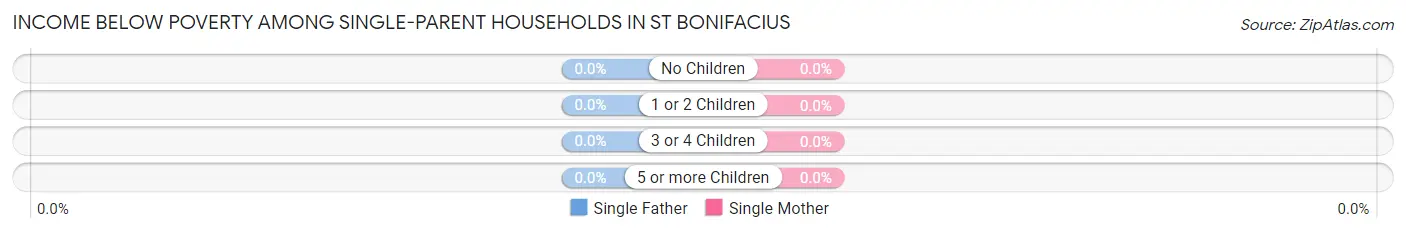
| Children | Single Father | Single Mother |
| No Children | 0 (0.0%) | 0 (0.0%) |
| 1 or 2 Children | 0 (0.0%) | 0 (0.0%) |
| 3 or 4 Children | 0 (0.0%) | 0 (0.0%) |
| 5 or more Children | 0 (0.0%) | 0 (0.0%) |
| Total | 0 (0.0%) | 0 (0.0%) |
Income Below Poverty Among Married-Couple vs Single-Parent Households in St Bonifacius
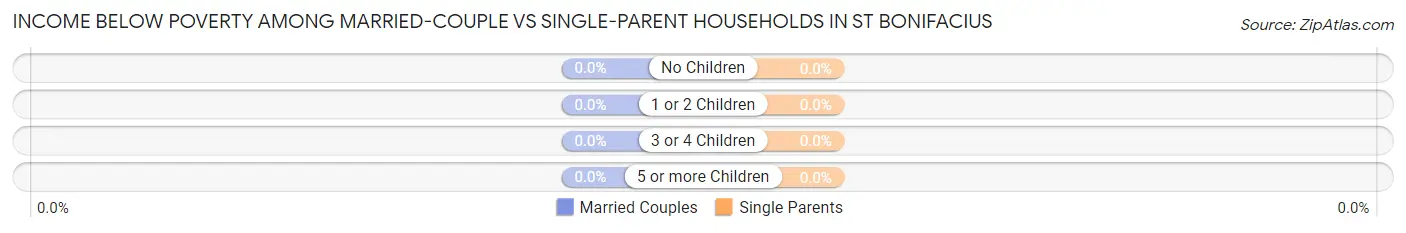
| Children | Married-Couple Families | Single-Parent Households |
| No Children | 0 (0.0%) | 0 (0.0%) |
| 1 or 2 Children | 0 (0.0%) | 0 (0.0%) |
| 3 or 4 Children | 0 (0.0%) | 0 (0.0%) |
| 5 or more Children | 0 (0.0%) | 0 (0.0%) |
| Total | 0 (0.0%) | 0 (0.0%) |
Race in St Bonifacius
The most populous races in St Bonifacius are White / Caucasian (1,777 | 90.8%), Hispanic or Latino (135 | 6.9%), and Two or more Races (74 | 3.8%).
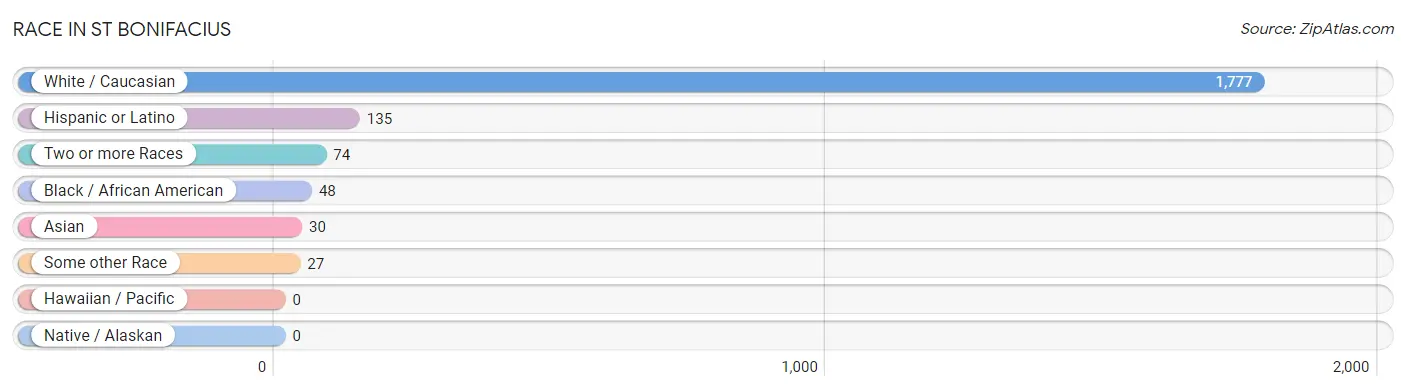
| Race | # Population | % Population |
| Asian | 30 | 1.5% |
| Black / African American | 48 | 2.5% |
| Hawaiian / Pacific | 0 | 0.0% |
| Hispanic or Latino | 135 | 6.9% |
| Native / Alaskan | 0 | 0.0% |
| White / Caucasian | 1,777 | 90.8% |
| Two or more Races | 74 | 3.8% |
| Some other Race | 27 | 1.4% |
| Total | 1,956 | 100.0% |
Ancestry in St Bonifacius
The most populous ancestries reported in St Bonifacius are German (737 | 37.7%), Norwegian (212 | 10.8%), Irish (181 | 9.2%), English (179 | 9.1%), and American (163 | 8.3%), together accounting for 75.3% of all St Bonifacius residents.
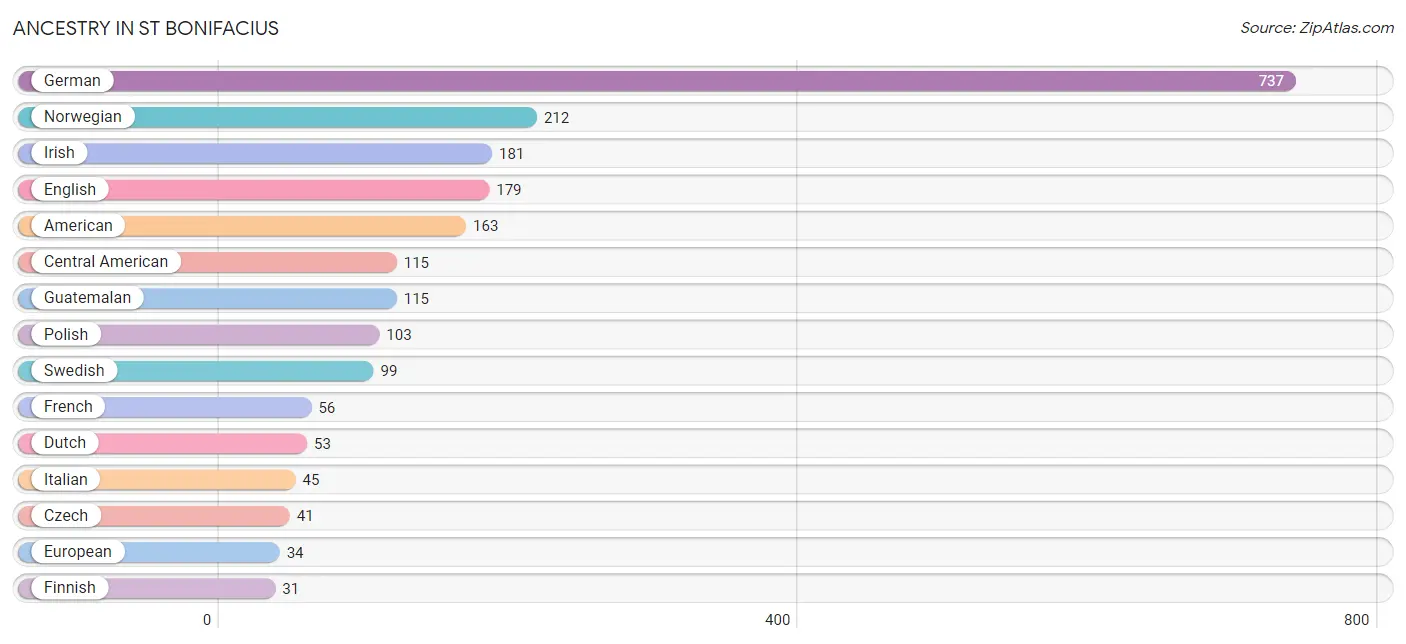
| Ancestry | # Population | % Population |
| American | 163 | 8.3% |
| British | 13 | 0.7% |
| Cajun | 2 | 0.1% |
| Central American | 115 | 5.9% |
| Czech | 41 | 2.1% |
| Czechoslovakian | 5 | 0.3% |
| Danish | 13 | 0.7% |
| Dutch | 53 | 2.7% |
| English | 179 | 9.1% |
| European | 34 | 1.7% |
| Finnish | 31 | 1.6% |
| French | 56 | 2.9% |
| French Canadian | 4 | 0.2% |
| German | 737 | 37.7% |
| Greek | 15 | 0.8% |
| Guatemalan | 115 | 5.9% |
| Irish | 181 | 9.2% |
| Italian | 45 | 2.3% |
| Jamaican | 15 | 0.8% |
| Luxembourger | 5 | 0.3% |
| Malaysian | 17 | 0.9% |
| Mexican | 13 | 0.7% |
| Norwegian | 212 | 10.8% |
| Polish | 103 | 5.3% |
| Portuguese | 4 | 0.2% |
| Puerto Rican | 7 | 0.4% |
| Russian | 13 | 0.7% |
| Scandinavian | 29 | 1.5% |
| Scottish | 17 | 0.9% |
| Serbian | 4 | 0.2% |
| Slovene | 5 | 0.3% |
| Swedish | 99 | 5.1% |
| Thai | 13 | 0.7% |
| Ukrainian | 6 | 0.3% |
| Welsh | 9 | 0.5% | View All 35 Rows |
Immigrants in St Bonifacius
The most numerous immigrant groups reported in St Bonifacius came from Central America (27 | 1.4%), Guatemala (27 | 1.4%), Latin America (27 | 1.4%), Asia (24 | 1.2%), and Europe (15 | 0.8%), together accounting for 6.1% of all St Bonifacius residents.
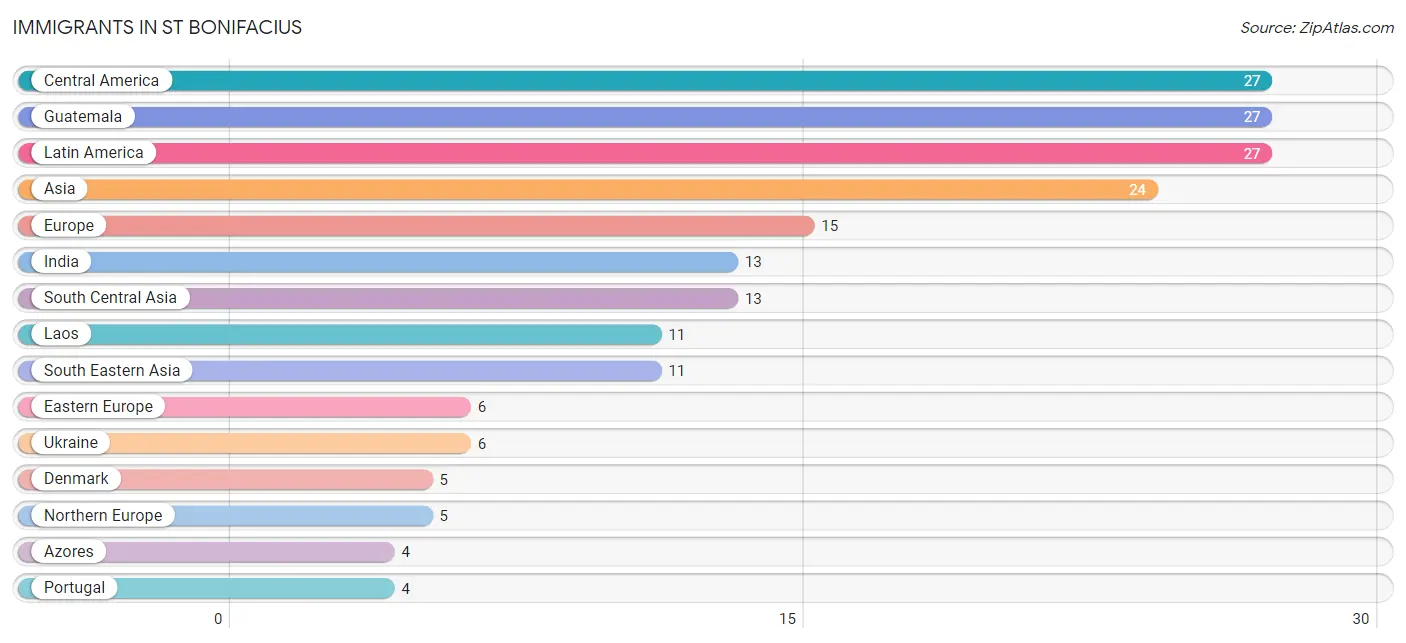
| Immigration Origin | # Population | % Population |
| Asia | 24 | 1.2% |
| Azores | 4 | 0.2% |
| Central America | 27 | 1.4% |
| Denmark | 5 | 0.3% |
| Eastern Europe | 6 | 0.3% |
| Europe | 15 | 0.8% |
| Guatemala | 27 | 1.4% |
| India | 13 | 0.7% |
| Laos | 11 | 0.6% |
| Latin America | 27 | 1.4% |
| Northern Europe | 5 | 0.3% |
| Portugal | 4 | 0.2% |
| South Central Asia | 13 | 0.7% |
| South Eastern Asia | 11 | 0.6% |
| Southern Europe | 4 | 0.2% |
| Ukraine | 6 | 0.3% | View All 16 Rows |
Sex and Age in St Bonifacius
Sex and Age in St Bonifacius
The most populous age groups in St Bonifacius are 10 to 14 Years (131 | 12.2%) for men and 35 to 39 Years (129 | 14.6%) for women.
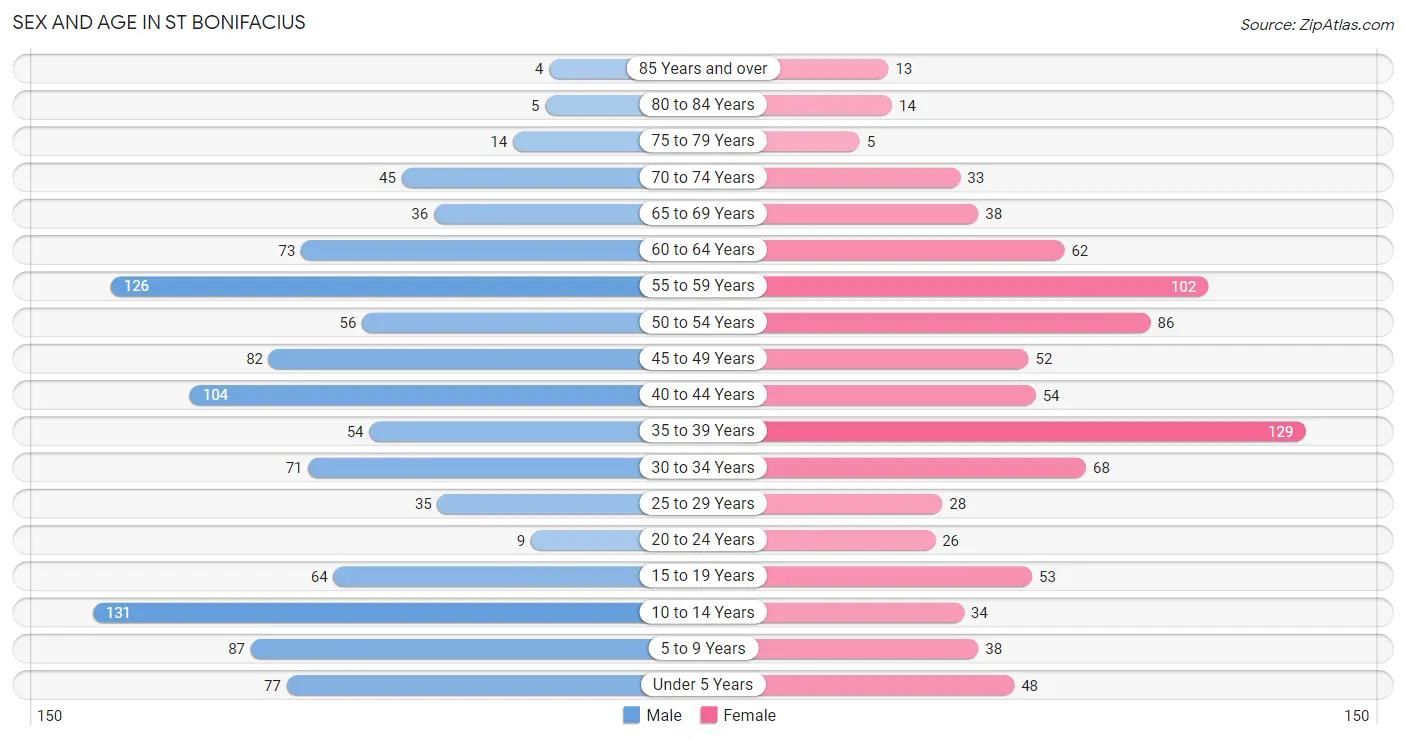
| Age Bracket | Male | Female |
| Under 5 Years | 77 (7.2%) | 48 (5.4%) |
| 5 to 9 Years | 87 (8.1%) | 38 (4.3%) |
| 10 to 14 Years | 131 (12.2%) | 34 (3.8%) |
| 15 to 19 Years | 64 (6.0%) | 53 (6.0%) |
| 20 to 24 Years | 9 (0.8%) | 26 (2.9%) |
| 25 to 29 Years | 35 (3.3%) | 28 (3.2%) |
| 30 to 34 Years | 71 (6.6%) | 68 (7.7%) |
| 35 to 39 Years | 54 (5.0%) | 129 (14.6%) |
| 40 to 44 Years | 104 (9.7%) | 54 (6.1%) |
| 45 to 49 Years | 82 (7.6%) | 52 (5.9%) |
| 50 to 54 Years | 56 (5.2%) | 86 (9.7%) |
| 55 to 59 Years | 126 (11.7%) | 102 (11.6%) |
| 60 to 64 Years | 73 (6.8%) | 62 (7.0%) |
| 65 to 69 Years | 36 (3.4%) | 38 (4.3%) |
| 70 to 74 Years | 45 (4.2%) | 33 (3.7%) |
| 75 to 79 Years | 14 (1.3%) | 5 (0.6%) |
| 80 to 84 Years | 5 (0.5%) | 14 (1.6%) |
| 85 Years and over | 4 (0.4%) | 13 (1.5%) |
| Total | 1,073 (100.0%) | 883 (100.0%) |
Families and Households in St Bonifacius
Median Family Size in St Bonifacius
The median family size in St Bonifacius is 2.96 persons per family, with married-couple families (501 | 88.0%) accounting for the largest median family size of 3.1 persons per family. On the other hand, single female/mother families (19 | 3.3%) represent the smallest median family size with 1.95 persons per family.
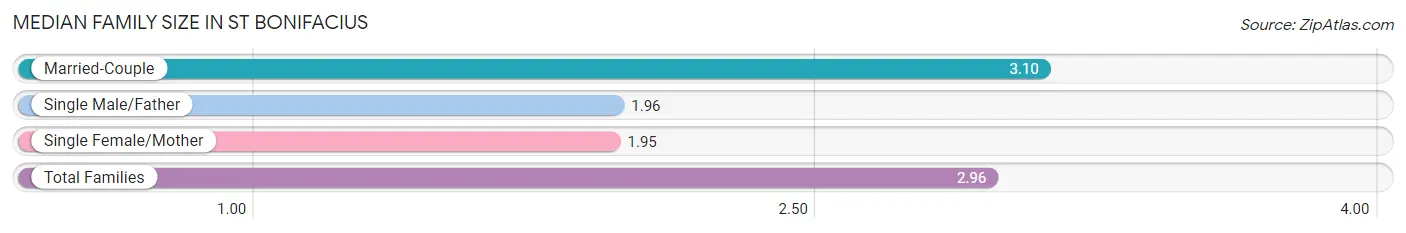
| Family Type | # Families | Family Size |
| Married-Couple | 501 (88.0%) | 3.10 |
| Single Male/Father | 49 (8.6%) | 1.96 |
| Single Female/Mother | 19 (3.3%) | 1.95 |
| Total Families | 569 (100.0%) | 2.96 |
Median Household Size in St Bonifacius
The median household size in St Bonifacius is 2.44 persons per household, with married-couple households (501 | 62.5%) accounting for the largest median household size of 3.1 persons per household. non-family households (232 | 29.0%) represent the smallest median household size with 1.12 persons per household.
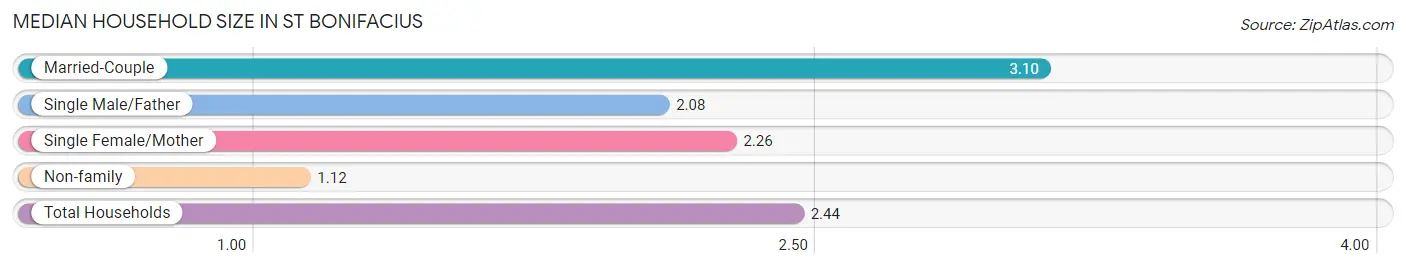
| Household Type | # Households | Household Size |
| Married-Couple | 501 (62.5%) | 3.10 |
| Single Male/Father | 49 (6.1%) | 2.08 |
| Single Female/Mother | 19 (2.4%) | 2.26 |
| Non-family | 232 (29.0%) | 1.12 |
| Total Households | 801 (100.0%) | 2.44 |
Household Size by Marriage Status in St Bonifacius
Out of a total of 801 households in St Bonifacius, 569 (71.0%) are family households, while 232 (29.0%) are nonfamily households. The most numerous type of family households are 2-person households, comprising 246, and the most common type of nonfamily households are 1-person households, comprising 205.
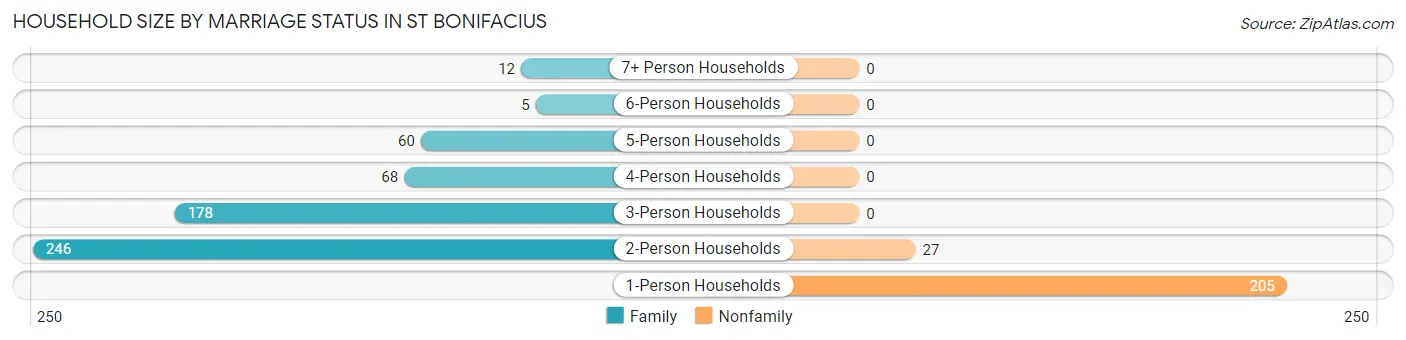
| Household Size | Family Households | Nonfamily Households |
| 1-Person Households | - | 205 (25.6%) |
| 2-Person Households | 246 (30.7%) | 27 (3.4%) |
| 3-Person Households | 178 (22.2%) | 0 (0.0%) |
| 4-Person Households | 68 (8.5%) | 0 (0.0%) |
| 5-Person Households | 60 (7.5%) | 0 (0.0%) |
| 6-Person Households | 5 (0.6%) | 0 (0.0%) |
| 7+ Person Households | 12 (1.5%) | 0 (0.0%) |
| Total | 569 (71.0%) | 232 (29.0%) |
Female Fertility in St Bonifacius
Fertility by Age in St Bonifacius
Average fertility rate in St Bonifacius is 44.0 births per 1,000 women. Women in the age bracket of 20 to 34 years have the highest fertility rate with 115.0 births per 1,000 women. Women in the age bracket of 20 to 34 years acount for 73.7% of all women with births.
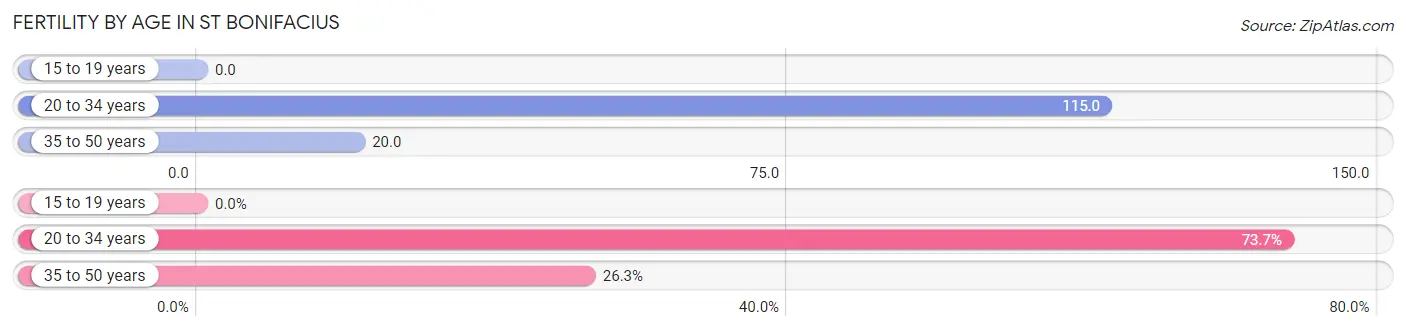
| Age Bracket | Women with Births | Births / 1,000 Women |
| 15 to 19 years | 0 (0.0%) | 0.0 |
| 20 to 34 years | 14 (73.7%) | 115.0 |
| 35 to 50 years | 5 (26.3%) | 20.0 |
| Total | 19 (100.0%) | 44.0 |
Fertility by Age by Marriage Status in St Bonifacius
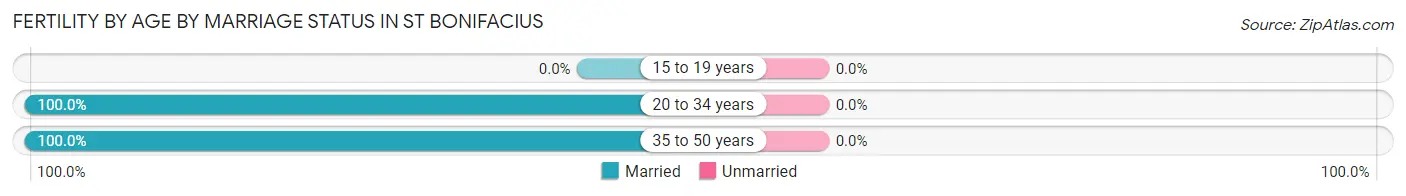
| Age Bracket | Married | Unmarried |
| 15 to 19 years | 0 (0.0%) | 0 (0.0%) |
| 20 to 34 years | 14 (100.0%) | 0 (0.0%) |
| 35 to 50 years | 5 (100.0%) | 0 (0.0%) |
| Total | 19 (100.0%) | 0 (0.0%) |
Fertility by Education in St Bonifacius
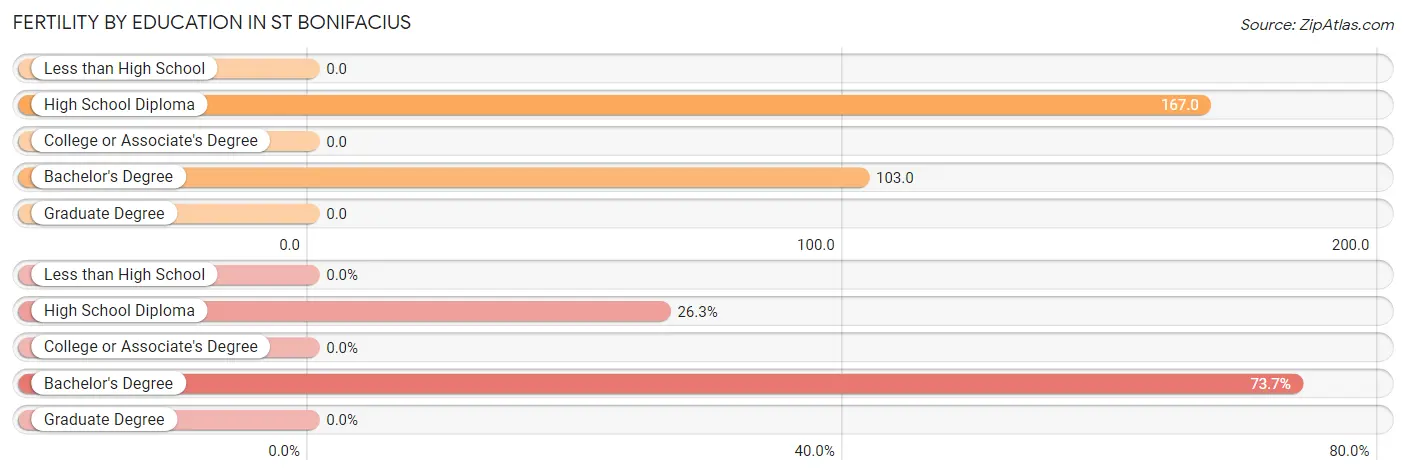
| Educational Attainment | Women with Births | Births / 1,000 Women |
| Less than High School | 0 (0.0%) | 0.0 |
| High School Diploma | 5 (26.3%) | 167.0 |
| College or Associate's Degree | 0 (0.0%) | 0.0 |
| Bachelor's Degree | 14 (73.7%) | 103.0 |
| Graduate Degree | 0 (0.0%) | 0.0 |
| Total | 19 (100.0%) | 44.0 |
Fertility by Education by Marriage Status in St Bonifacius
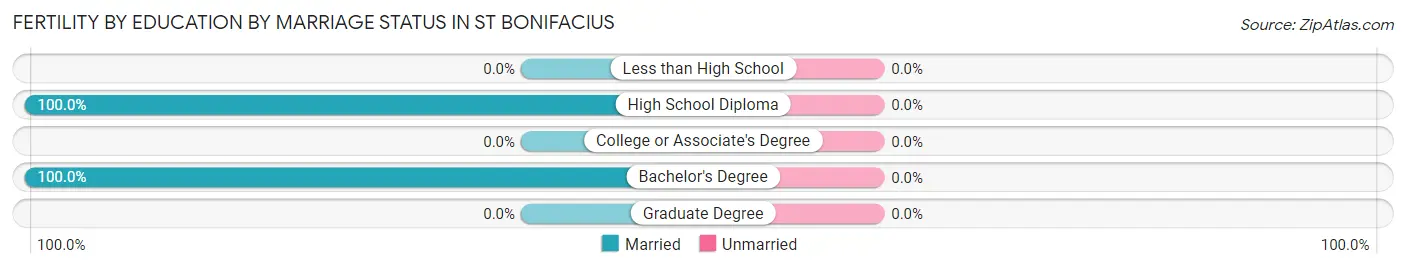
| Educational Attainment | Married | Unmarried |
| Less than High School | 0 (0.0%) | 0 (0.0%) |
| High School Diploma | 5 (100.0%) | 0 (0.0%) |
| College or Associate's Degree | 0 (0.0%) | 0 (0.0%) |
| Bachelor's Degree | 14 (100.0%) | 0 (0.0%) |
| Graduate Degree | 0 (0.0%) | 0 (0.0%) |
| Total | 19 (100.0%) | 0 (0.0%) |
Employment Characteristics in St Bonifacius
Employment by Class of Employer in St Bonifacius
Among the 1,129 employed individuals in St Bonifacius, private company employees (808 | 71.6%), self-employed (not incorporated) (112 | 9.9%), and local government employees (93 | 8.2%) make up the most common classes of employment.
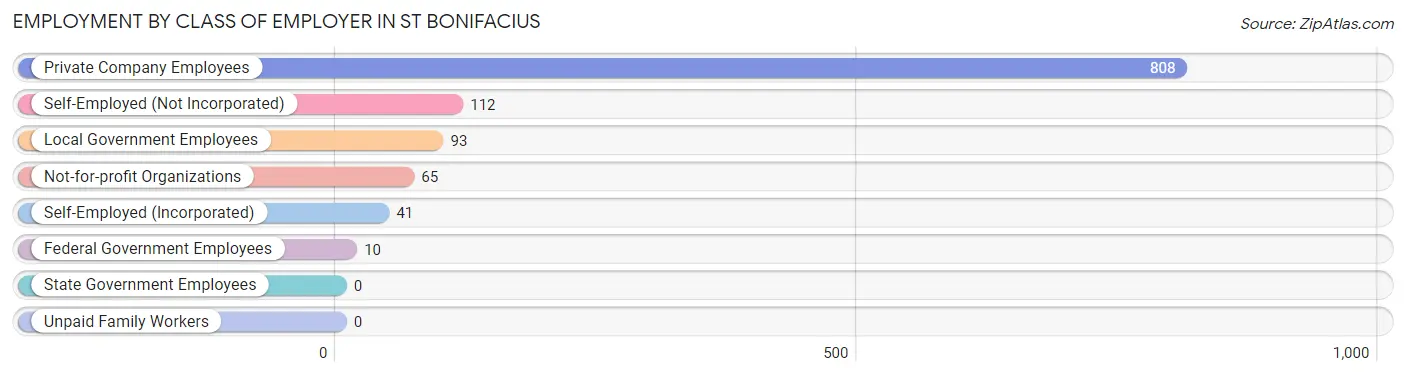
| Employer Class | # Employees | % Employees |
| Private Company Employees | 808 | 71.6% |
| Self-Employed (Incorporated) | 41 | 3.6% |
| Self-Employed (Not Incorporated) | 112 | 9.9% |
| Not-for-profit Organizations | 65 | 5.8% |
| Local Government Employees | 93 | 8.2% |
| State Government Employees | 0 | 0.0% |
| Federal Government Employees | 10 | 0.9% |
| Unpaid Family Workers | 0 | 0.0% |
| Total | 1,129 | 100.0% |
Employment Status by Age in St Bonifacius
According to the labor force statistics for St Bonifacius, out of the total population over 16 years of age (1,525), 76.8% or 1,171 individuals are in the labor force, with 3.3% or 39 of them unemployed. The age group with the highest labor force participation rate is 20 to 24 years, with 100.0% or 35 individuals in the labor force. Within the labor force, the 55 to 59 years age range has the highest percentage of unemployed individuals, with 9.0% or 17 of them being unemployed.
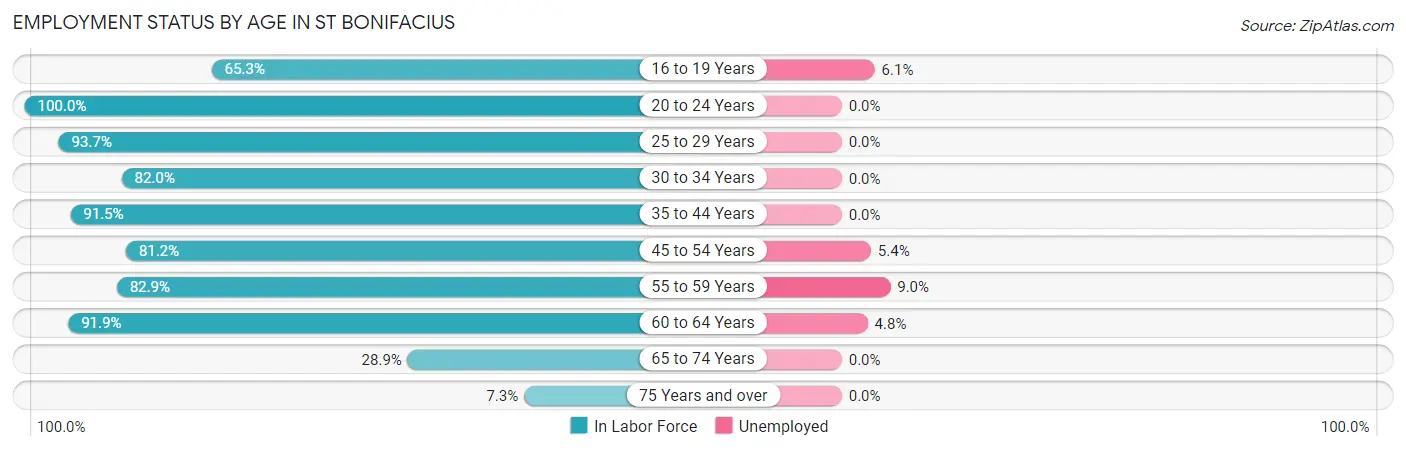
| Age Bracket | In Labor Force | Unemployed |
| 16 to 19 Years | 66 (65.3%) | 4 (6.1%) |
| 20 to 24 Years | 35 (100.0%) | 0 (0.0%) |
| 25 to 29 Years | 59 (93.7%) | 0 (0.0%) |
| 30 to 34 Years | 114 (82.0%) | 0 (0.0%) |
| 35 to 44 Years | 312 (91.5%) | 0 (0.0%) |
| 45 to 54 Years | 224 (81.2%) | 12 (5.4%) |
| 55 to 59 Years | 189 (82.9%) | 17 (9.0%) |
| 60 to 64 Years | 124 (91.9%) | 6 (4.8%) |
| 65 to 74 Years | 44 (28.9%) | 0 (0.0%) |
| 75 Years and over | 4 (7.3%) | 0 (0.0%) |
| Total | 1,171 (76.8%) | 39 (3.3%) |
Employment Status by Educational Attainment in St Bonifacius
According to labor force statistics for St Bonifacius, 86.5% of individuals (1,022) out of the total population between 25 and 64 years of age (1,182) are in the labor force, with 3.4% or 35 of them being unemployed. The group with the highest labor force participation rate are those with the educational attainment of less than high school, with 100.0% or 34 individuals in the labor force. Within the labor force, individuals with less than high school education have the highest percentage of unemployment, with 50.0% or 17 of them being unemployed.
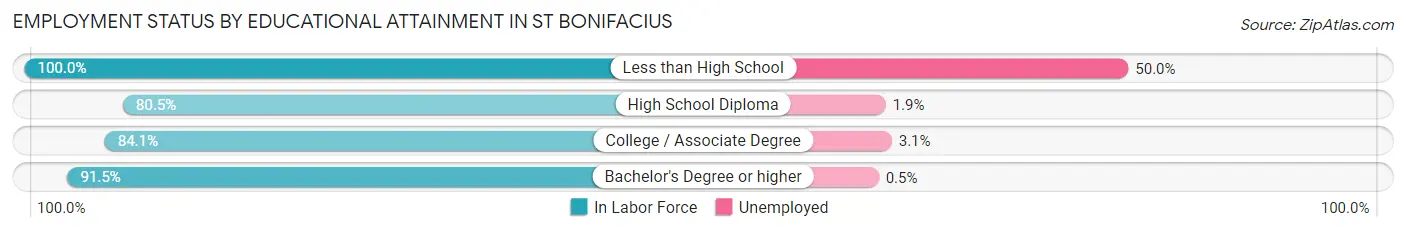
| Educational Attainment | In Labor Force | Unemployed |
| Less than High School | 34 (100.0%) | 17 (50.0%) |
| High School Diploma | 206 (80.5%) | 5 (1.9%) |
| College / Associate Degree | 392 (84.1%) | 14 (3.1%) |
| Bachelor's Degree or higher | 390 (91.5%) | 2 (0.5%) |
| Total | 1,022 (86.5%) | 40 (3.4%) |
Employment Occupations by Sex in St Bonifacius
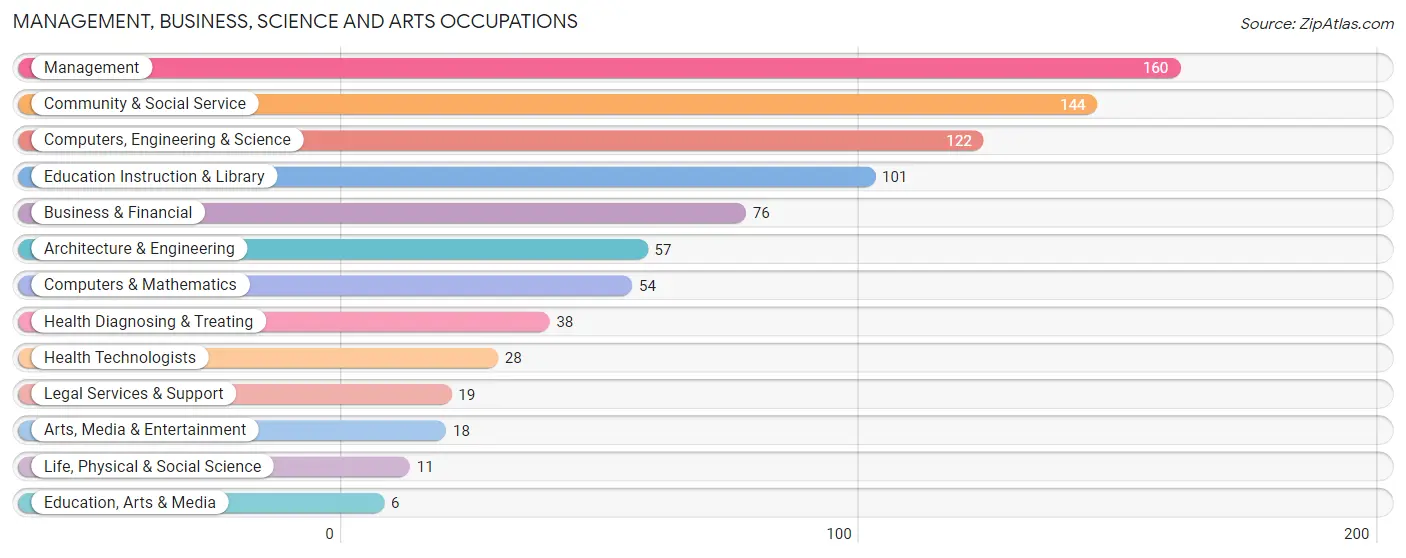
Management, Business, Science and Arts Occupations
The most common Management, Business, Science and Arts occupations in St Bonifacius are Management (160 | 14.1%), Community & Social Service (144 | 12.7%), Computers, Engineering & Science (122 | 10.8%), Education Instruction & Library (101 | 8.9%), and Business & Financial (76 | 6.7%).
Management, Business, Science and Arts Occupations by Sex
Within the Management, Business, Science and Arts occupations in St Bonifacius, the most male-oriented occupations are Life, Physical & Social Science (100.0%), Legal Services & Support (100.0%), and Computers, Engineering & Science (82.8%), while the most female-oriented occupations are Education, Arts & Media (100.0%), Education Instruction & Library (100.0%), and Health Technologists (100.0%).
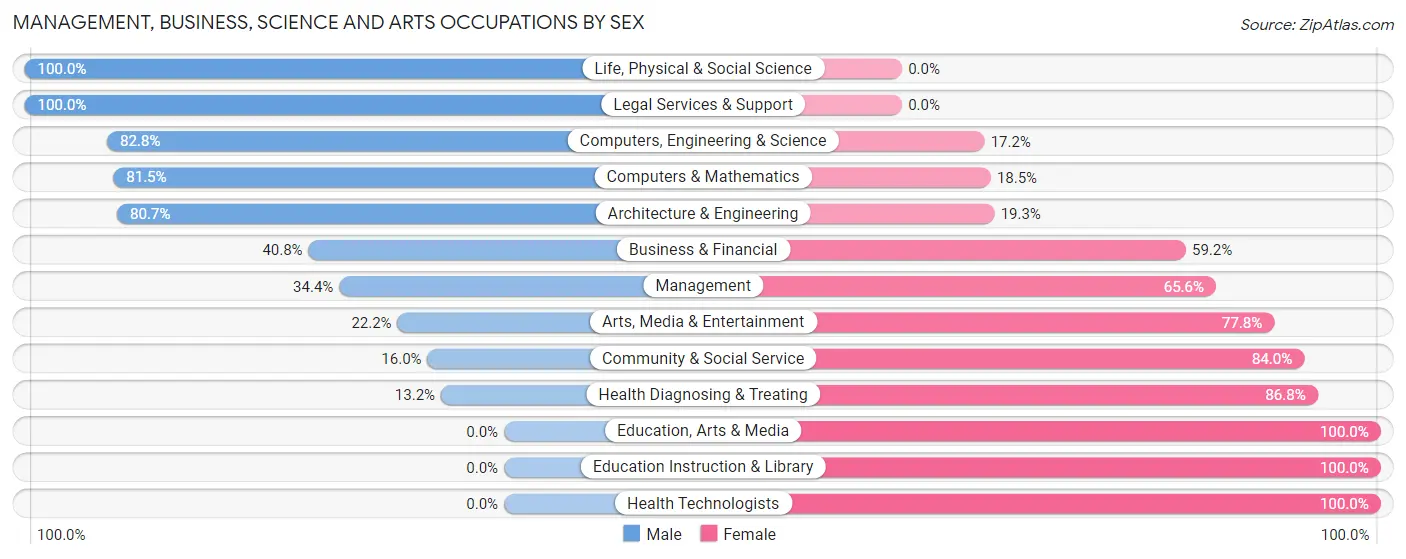
| Occupation | Male | Female |
| Management | 55 (34.4%) | 105 (65.6%) |
| Business & Financial | 31 (40.8%) | 45 (59.2%) |
| Computers, Engineering & Science | 101 (82.8%) | 21 (17.2%) |
| Computers & Mathematics | 44 (81.5%) | 10 (18.5%) |
| Architecture & Engineering | 46 (80.7%) | 11 (19.3%) |
| Life, Physical & Social Science | 11 (100.0%) | 0 (0.0%) |
| Community & Social Service | 23 (16.0%) | 121 (84.0%) |
| Education, Arts & Media | 0 (0.0%) | 6 (100.0%) |
| Legal Services & Support | 19 (100.0%) | 0 (0.0%) |
| Education Instruction & Library | 0 (0.0%) | 101 (100.0%) |
| Arts, Media & Entertainment | 4 (22.2%) | 14 (77.8%) |
| Health Diagnosing & Treating | 5 (13.2%) | 33 (86.8%) |
| Health Technologists | 0 (0.0%) | 28 (100.0%) |
| Total (Category) | 215 (39.8%) | 325 (60.2%) |
| Total (Overall) | 604 (53.4%) | 528 (46.6%) |
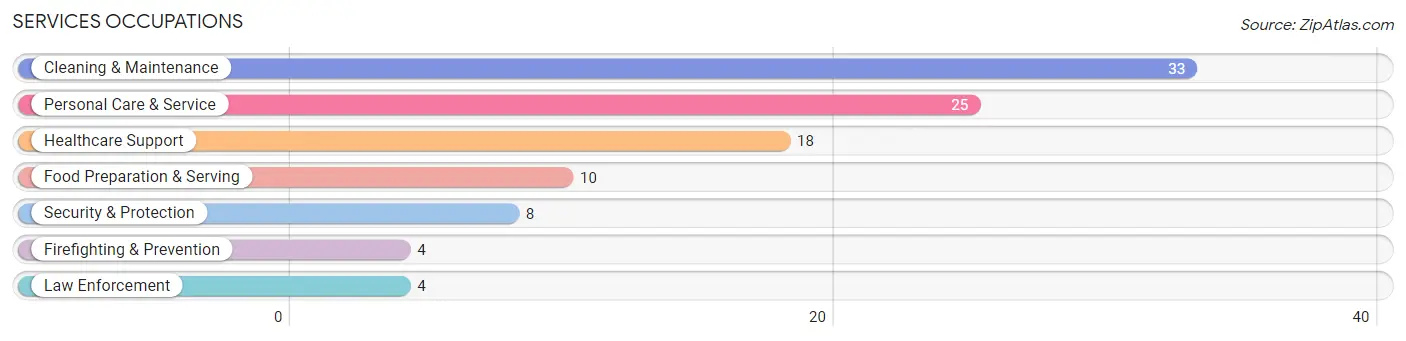
Services Occupations
The most common Services occupations in St Bonifacius are Cleaning & Maintenance (33 | 2.9%), Personal Care & Service (25 | 2.2%), Healthcare Support (18 | 1.6%), Food Preparation & Serving (10 | 0.9%), and Security & Protection (8 | 0.7%).
Services Occupations by Sex
Within the Services occupations in St Bonifacius, the most male-oriented occupations are Law Enforcement (100.0%), Cleaning & Maintenance (100.0%), and Security & Protection (50.0%), while the most female-oriented occupations are Healthcare Support (100.0%), Firefighting & Prevention (100.0%), and Personal Care & Service (100.0%).
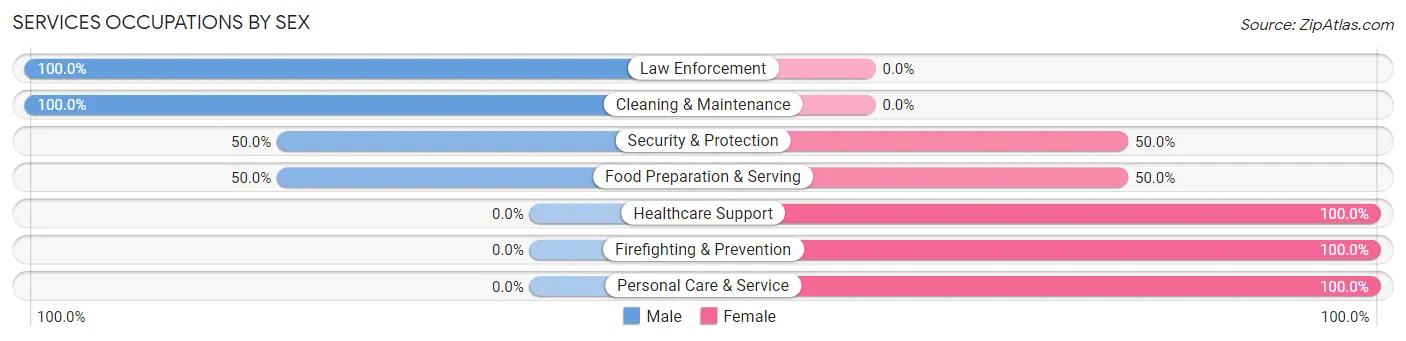
| Occupation | Male | Female |
| Healthcare Support | 0 (0.0%) | 18 (100.0%) |
| Security & Protection | 4 (50.0%) | 4 (50.0%) |
| Firefighting & Prevention | 0 (0.0%) | 4 (100.0%) |
| Law Enforcement | 4 (100.0%) | 0 (0.0%) |
| Food Preparation & Serving | 5 (50.0%) | 5 (50.0%) |
| Cleaning & Maintenance | 33 (100.0%) | 0 (0.0%) |
| Personal Care & Service | 0 (0.0%) | 25 (100.0%) |
| Total (Category) | 42 (44.7%) | 52 (55.3%) |
| Total (Overall) | 604 (53.4%) | 528 (46.6%) |
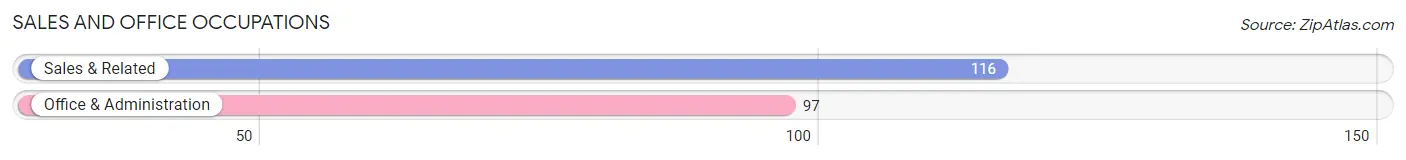
Sales and Office Occupations
The most common Sales and Office occupations in St Bonifacius are Sales & Related (116 | 10.2%), and Office & Administration (97 | 8.6%).
Sales and Office Occupations by Sex
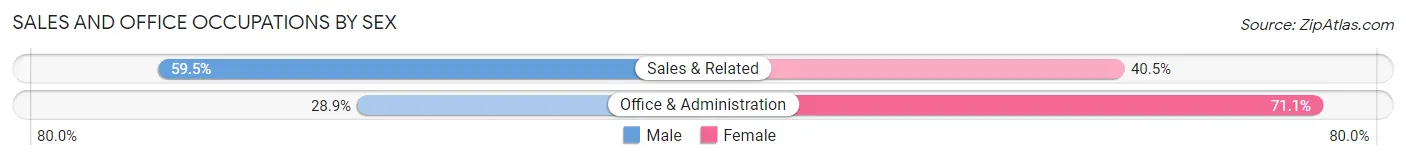
| Occupation | Male | Female |
| Sales & Related | 69 (59.5%) | 47 (40.5%) |
| Office & Administration | 28 (28.9%) | 69 (71.1%) |
| Total (Category) | 97 (45.5%) | 116 (54.5%) |
| Total (Overall) | 604 (53.4%) | 528 (46.6%) |
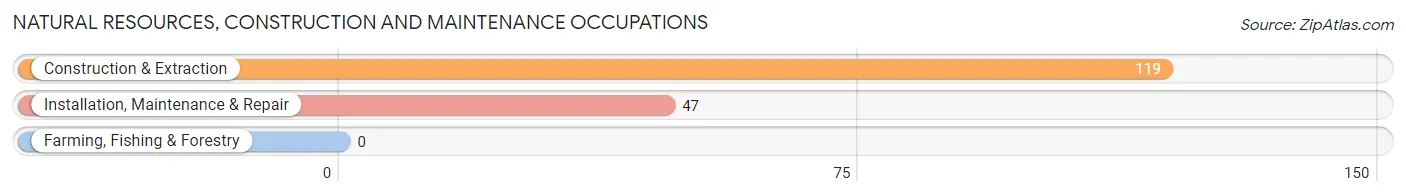
Natural Resources, Construction and Maintenance Occupations
The most common Natural Resources, Construction and Maintenance occupations in St Bonifacius are Construction & Extraction (119 | 10.5%), and Installation, Maintenance & Repair (47 | 4.2%).
Natural Resources, Construction and Maintenance Occupations by Sex
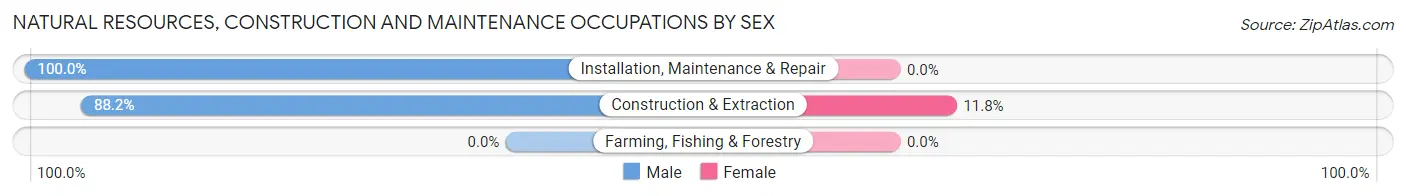
| Occupation | Male | Female |
| Farming, Fishing & Forestry | 0 (0.0%) | 0 (0.0%) |
| Construction & Extraction | 105 (88.2%) | 14 (11.8%) |
| Installation, Maintenance & Repair | 47 (100.0%) | 0 (0.0%) |
| Total (Category) | 152 (91.6%) | 14 (8.4%) |
| Total (Overall) | 604 (53.4%) | 528 (46.6%) |
Production, Transportation and Moving Occupations
The most common Production, Transportation and Moving occupations in St Bonifacius are Production (58 | 5.1%), Material Moving (39 | 3.5%), and Transportation (22 | 1.9%).
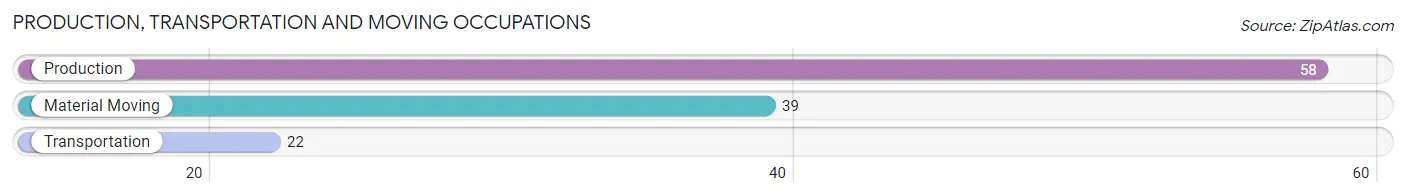
Production, Transportation and Moving Occupations by Sex
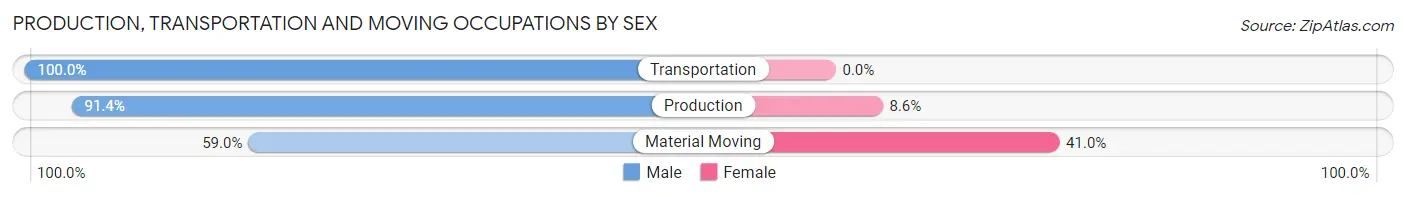
| Occupation | Male | Female |
| Production | 53 (91.4%) | 5 (8.6%) |
| Transportation | 22 (100.0%) | 0 (0.0%) |
| Material Moving | 23 (59.0%) | 16 (41.0%) |
| Total (Category) | 98 (82.4%) | 21 (17.6%) |
| Total (Overall) | 604 (53.4%) | 528 (46.6%) |
Employment Industries by Sex in St Bonifacius
Employment Industries in St Bonifacius
The major employment industries in St Bonifacius include Manufacturing (221 | 19.5%), Finance & Insurance (126 | 11.1%), Health Care & Social Assistance (98 | 8.7%), Construction (94 | 8.3%), and Professional & Scientific (87 | 7.7%).
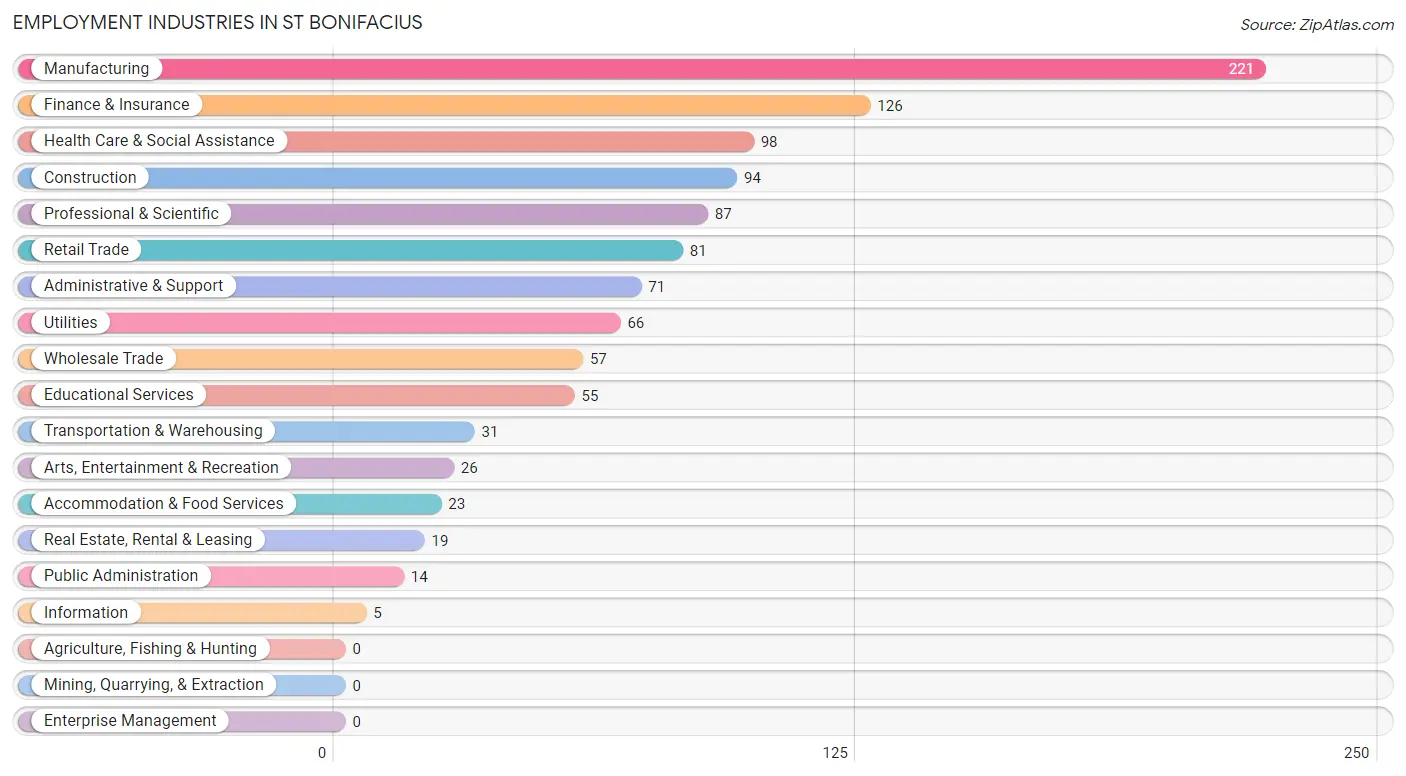
Employment Industries by Sex in St Bonifacius
The St Bonifacius industries that see more men than women are Utilities (100.0%), Professional & Scientific (85.1%), and Accommodation & Food Services (78.3%), whereas the industries that tend to have a higher number of women are Information (100.0%), Educational Services (89.1%), and Health Care & Social Assistance (88.8%).
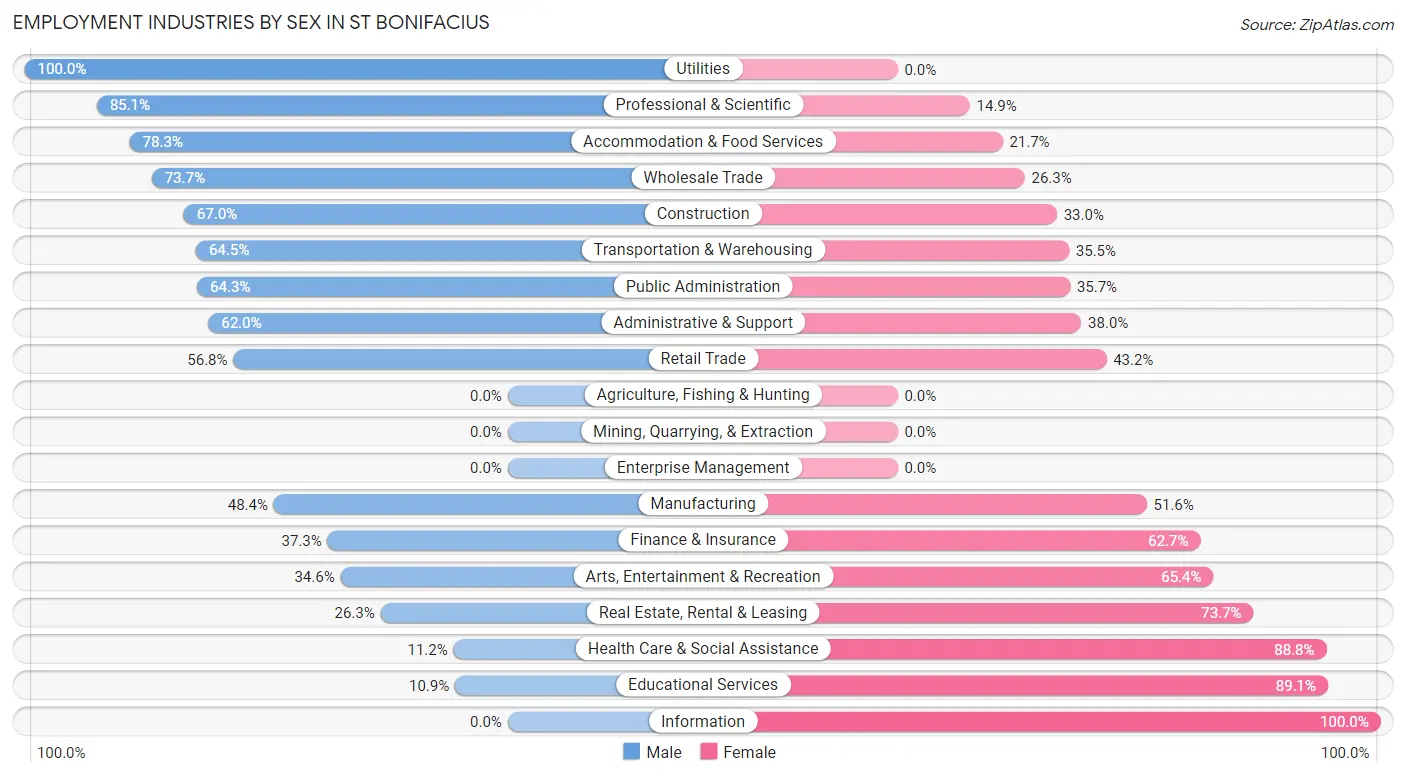
| Industry | Male | Female |
| Agriculture, Fishing & Hunting | 0 (0.0%) | 0 (0.0%) |
| Mining, Quarrying, & Extraction | 0 (0.0%) | 0 (0.0%) |
| Construction | 63 (67.0%) | 31 (33.0%) |
| Manufacturing | 107 (48.4%) | 114 (51.6%) |
| Wholesale Trade | 42 (73.7%) | 15 (26.3%) |
| Retail Trade | 46 (56.8%) | 35 (43.2%) |
| Transportation & Warehousing | 20 (64.5%) | 11 (35.5%) |
| Utilities | 66 (100.0%) | 0 (0.0%) |
| Information | 0 (0.0%) | 5 (100.0%) |
| Finance & Insurance | 47 (37.3%) | 79 (62.7%) |
| Real Estate, Rental & Leasing | 5 (26.3%) | 14 (73.7%) |
| Professional & Scientific | 74 (85.1%) | 13 (14.9%) |
| Enterprise Management | 0 (0.0%) | 0 (0.0%) |
| Administrative & Support | 44 (62.0%) | 27 (38.0%) |
| Educational Services | 6 (10.9%) | 49 (89.1%) |
| Health Care & Social Assistance | 11 (11.2%) | 87 (88.8%) |
| Arts, Entertainment & Recreation | 9 (34.6%) | 17 (65.4%) |
| Accommodation & Food Services | 18 (78.3%) | 5 (21.7%) |
| Public Administration | 9 (64.3%) | 5 (35.7%) |
| Total | 604 (53.4%) | 528 (46.6%) |
Education in St Bonifacius
School Enrollment in St Bonifacius
The most common levels of schooling among the 507 students in St Bonifacius are middle school (137 | 27.0%), college / undergraduate (107 | 21.1%), and elementary school (102 | 20.1%).
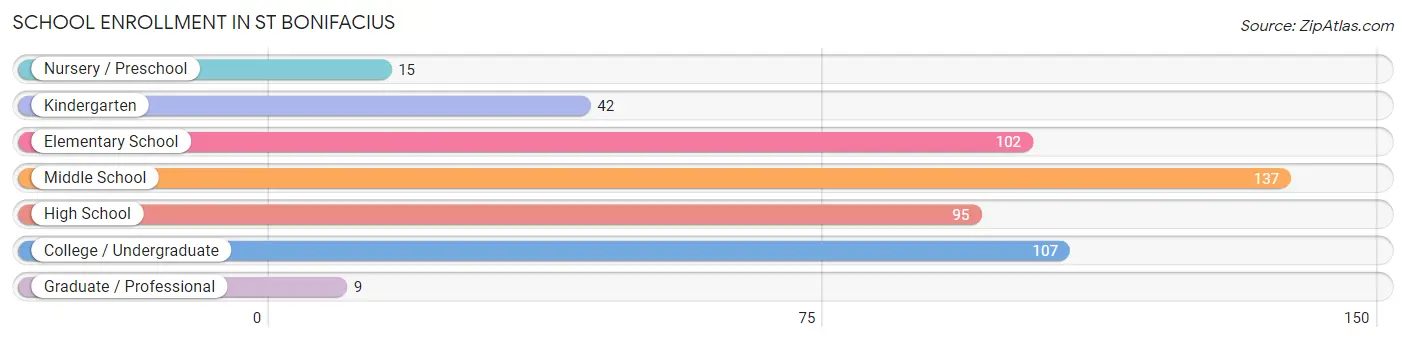
| School Level | # Students | % Students |
| Nursery / Preschool | 15 | 3.0% |
| Kindergarten | 42 | 8.3% |
| Elementary School | 102 | 20.1% |
| Middle School | 137 | 27.0% |
| High School | 95 | 18.7% |
| College / Undergraduate | 107 | 21.1% |
| Graduate / Professional | 9 | 1.8% |
| Total | 507 | 100.0% |
School Enrollment by Age by Funding Source in St Bonifacius
Out of a total of 507 students who are enrolled in schools in St Bonifacius, 96 (18.9%) attend a private institution, while the remaining 411 (81.1%) are enrolled in public schools. The age group of 5 to 9 year old has the highest likelihood of being enrolled in private schools, with 92 (73.6% in the age bracket) enrolled. Conversely, the age group of 3 to 4 year olds has the lowest likelihood of being enrolled in a private school, with 10 (100.0% in the age bracket) attending a public institution.
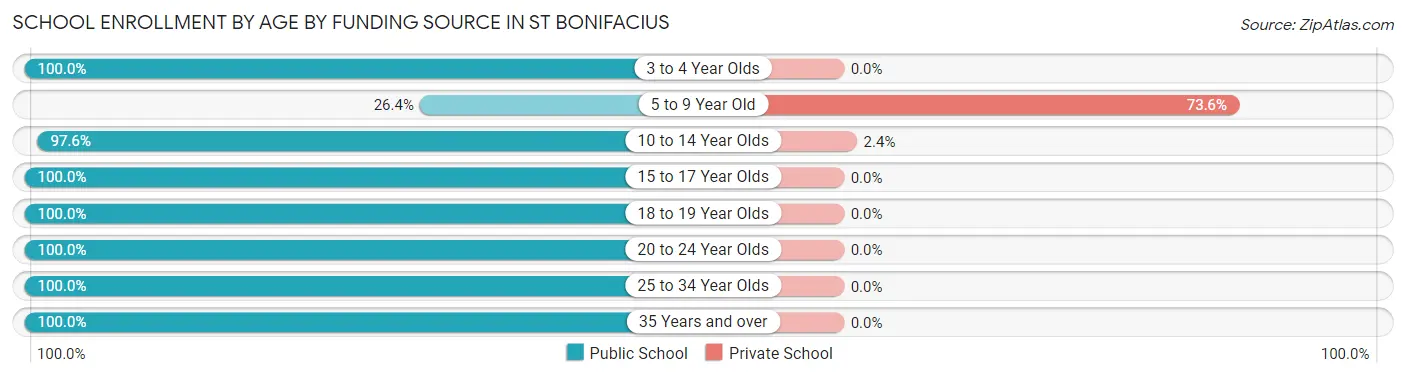
| Age Bracket | Public School | Private School |
| 3 to 4 Year Olds | 10 (100.0%) | 0 (0.0%) |
| 5 to 9 Year Old | 33 (26.4%) | 92 (73.6%) |
| 10 to 14 Year Olds | 161 (97.6%) | 4 (2.4%) |
| 15 to 17 Year Olds | 80 (100.0%) | 0 (0.0%) |
| 18 to 19 Year Olds | 21 (100.0%) | 0 (0.0%) |
| 20 to 24 Year Olds | 18 (100.0%) | 0 (0.0%) |
| 25 to 34 Year Olds | 13 (100.0%) | 0 (0.0%) |
| 35 Years and over | 75 (100.0%) | 0 (0.0%) |
| Total | 411 (81.1%) | 96 (18.9%) |
Educational Attainment by Field of Study in St Bonifacius
Business (122 | 22.1%), bio, nature & agricultural (68 | 12.3%), education (60 | 10.9%), arts & humanities (54 | 9.8%), and science & technology (53 | 9.6%) are the most common fields of study among 552 individuals in St Bonifacius who have obtained a bachelor's degree or higher.
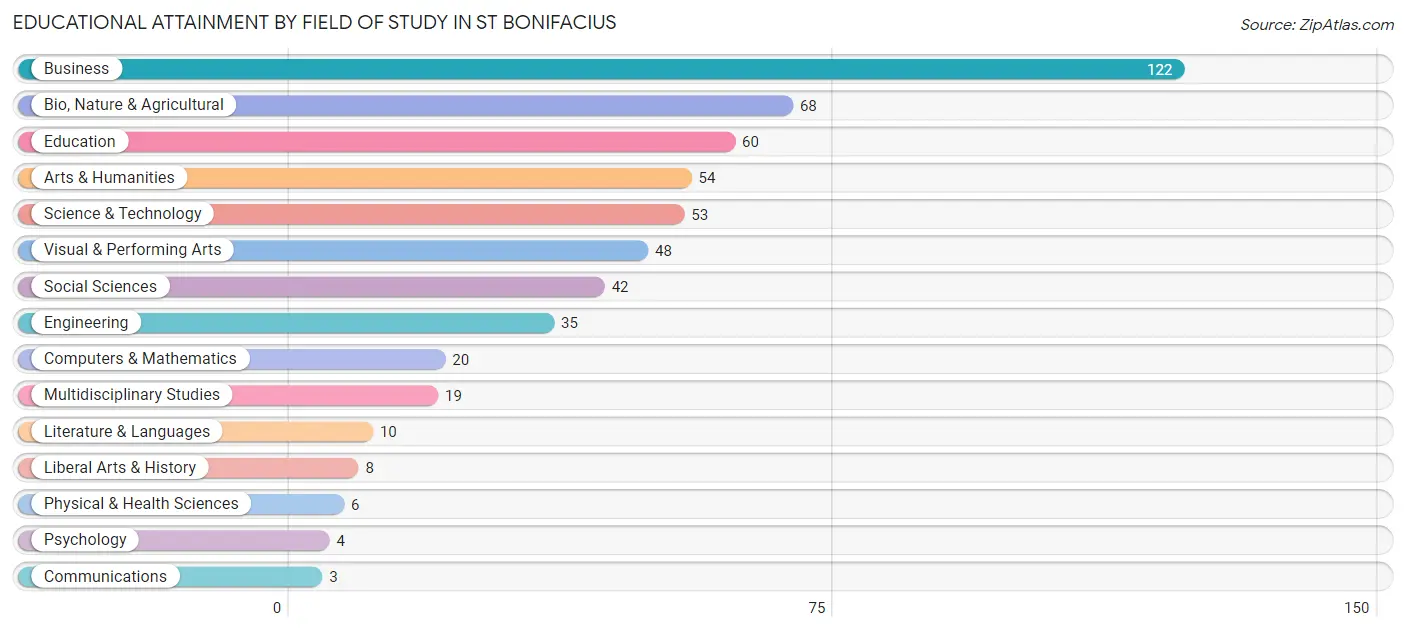
| Field of Study | # Graduates | % Graduates |
| Computers & Mathematics | 20 | 3.6% |
| Bio, Nature & Agricultural | 68 | 12.3% |
| Physical & Health Sciences | 6 | 1.1% |
| Psychology | 4 | 0.7% |
| Social Sciences | 42 | 7.6% |
| Engineering | 35 | 6.3% |
| Multidisciplinary Studies | 19 | 3.4% |
| Science & Technology | 53 | 9.6% |
| Business | 122 | 22.1% |
| Education | 60 | 10.9% |
| Literature & Languages | 10 | 1.8% |
| Liberal Arts & History | 8 | 1.5% |
| Visual & Performing Arts | 48 | 8.7% |
| Communications | 3 | 0.5% |
| Arts & Humanities | 54 | 9.8% |
| Total | 552 | 100.0% |
Transportation & Commute in St Bonifacius
Vehicle Availability by Sex in St Bonifacius
The most prevalent vehicle ownership categories in St Bonifacius are males with 2 vehicles (294, accounting for 48.9%) and females with 2 vehicles (298, making up 55.7%).
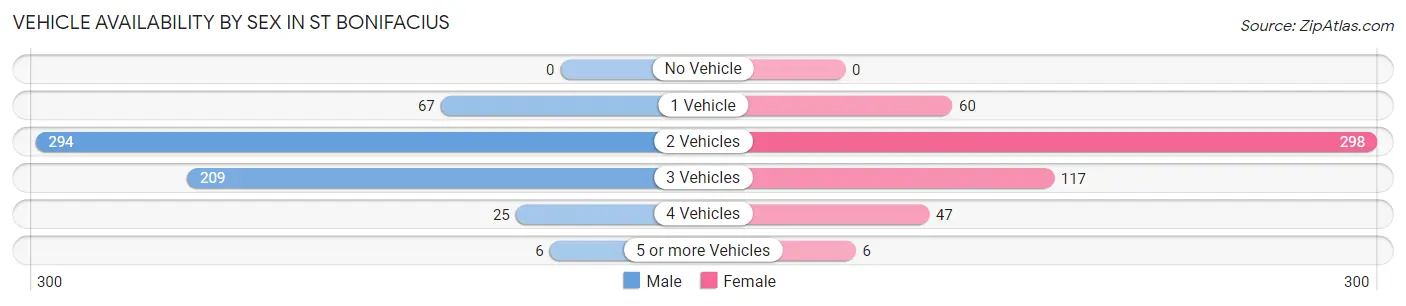
| Vehicles Available | Male | Female |
| No Vehicle | 0 (0.0%) | 0 (0.0%) |
| 1 Vehicle | 67 (11.2%) | 60 (11.4%) |
| 2 Vehicles | 294 (48.9%) | 298 (56.4%) |
| 3 Vehicles | 209 (34.8%) | 117 (22.2%) |
| 4 Vehicles | 25 (4.2%) | 47 (8.9%) |
| 5 or more Vehicles | 6 (1.0%) | 6 (1.1%) |
| Total | 601 (100.0%) | 528 (100.0%) |
Commute Time in St Bonifacius
The most frequently occuring commute durations in St Bonifacius are 30 to 34 minutes (190 commuters, 19.9%), 15 to 19 minutes (144 commuters, 15.0%), and 45 to 59 minutes (119 commuters, 12.4%).
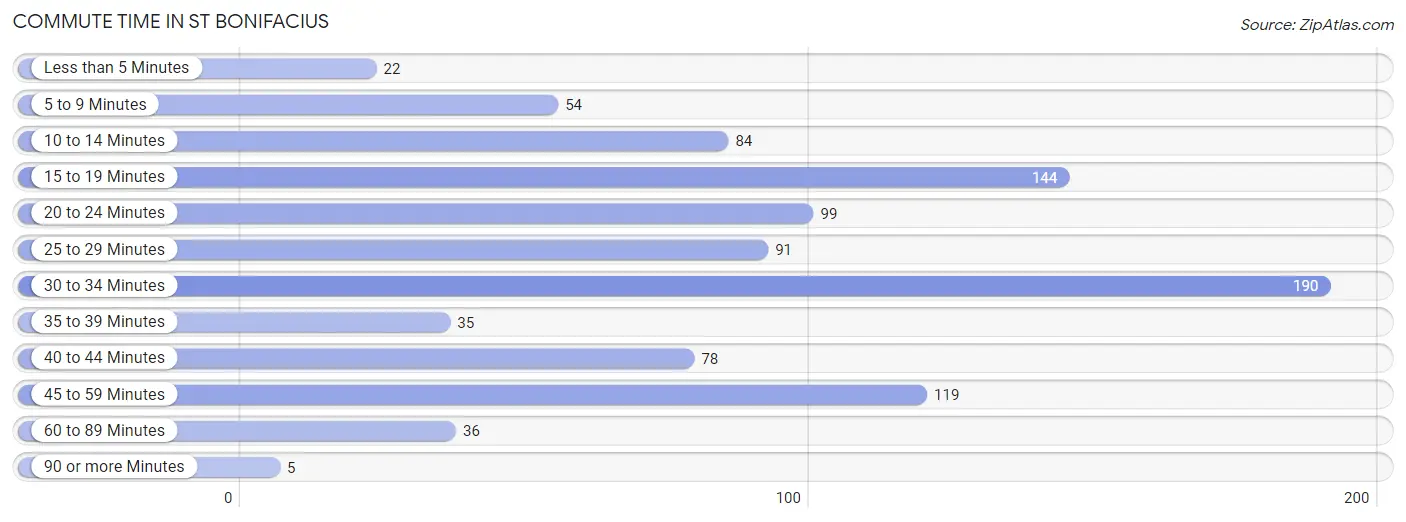
| Commute Time | # Commuters | % Commuters |
| Less than 5 Minutes | 22 | 2.3% |
| 5 to 9 Minutes | 54 | 5.6% |
| 10 to 14 Minutes | 84 | 8.8% |
| 15 to 19 Minutes | 144 | 15.0% |
| 20 to 24 Minutes | 99 | 10.3% |
| 25 to 29 Minutes | 91 | 9.5% |
| 30 to 34 Minutes | 190 | 19.9% |
| 35 to 39 Minutes | 35 | 3.7% |
| 40 to 44 Minutes | 78 | 8.2% |
| 45 to 59 Minutes | 119 | 12.4% |
| 60 to 89 Minutes | 36 | 3.8% |
| 90 or more Minutes | 5 | 0.5% |
Commute Time by Sex in St Bonifacius
The most common commute times in St Bonifacius are 30 to 34 minutes (113 commuters, 21.0%) for males and 30 to 34 minutes (77 commuters, 18.4%) for females.
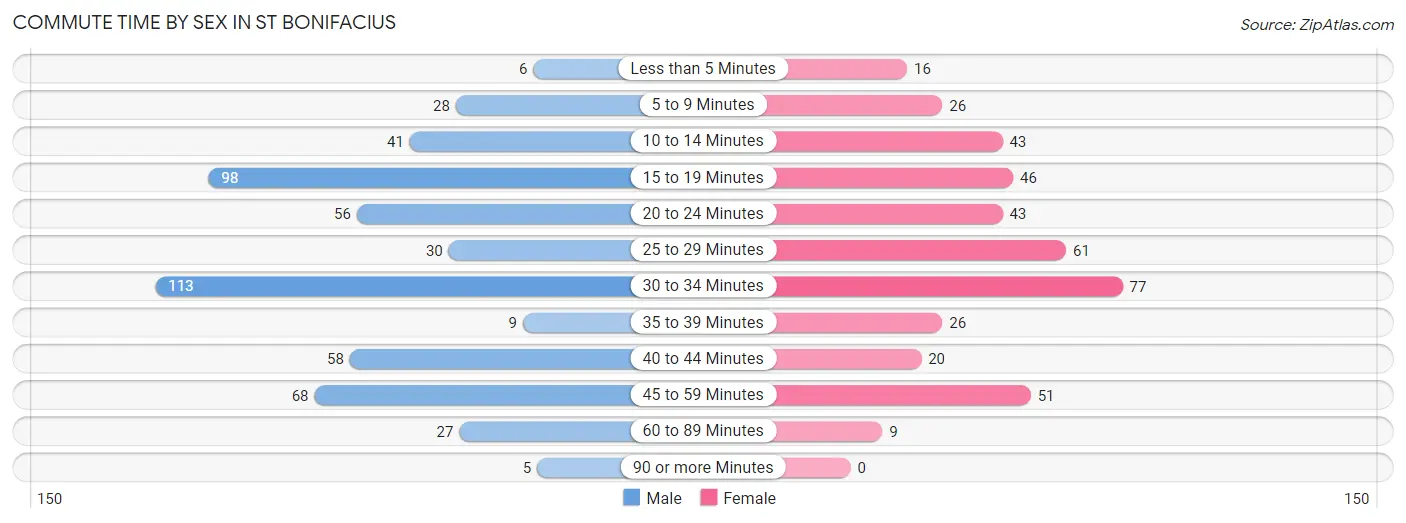
| Commute Time | Male | Female |
| Less than 5 Minutes | 6 (1.1%) | 16 (3.8%) |
| 5 to 9 Minutes | 28 (5.2%) | 26 (6.2%) |
| 10 to 14 Minutes | 41 (7.6%) | 43 (10.3%) |
| 15 to 19 Minutes | 98 (18.2%) | 46 (11.0%) |
| 20 to 24 Minutes | 56 (10.4%) | 43 (10.3%) |
| 25 to 29 Minutes | 30 (5.6%) | 61 (14.6%) |
| 30 to 34 Minutes | 113 (21.0%) | 77 (18.4%) |
| 35 to 39 Minutes | 9 (1.7%) | 26 (6.2%) |
| 40 to 44 Minutes | 58 (10.8%) | 20 (4.8%) |
| 45 to 59 Minutes | 68 (12.6%) | 51 (12.2%) |
| 60 to 89 Minutes | 27 (5.0%) | 9 (2.1%) |
| 90 or more Minutes | 5 (0.9%) | 0 (0.0%) |
Time of Departure to Work by Sex in St Bonifacius
The most frequent times of departure to work in St Bonifacius are 5:30 AM to 5:59 AM (100, 18.5%) for males and 6:30 AM to 6:59 AM (82, 19.6%) for females.
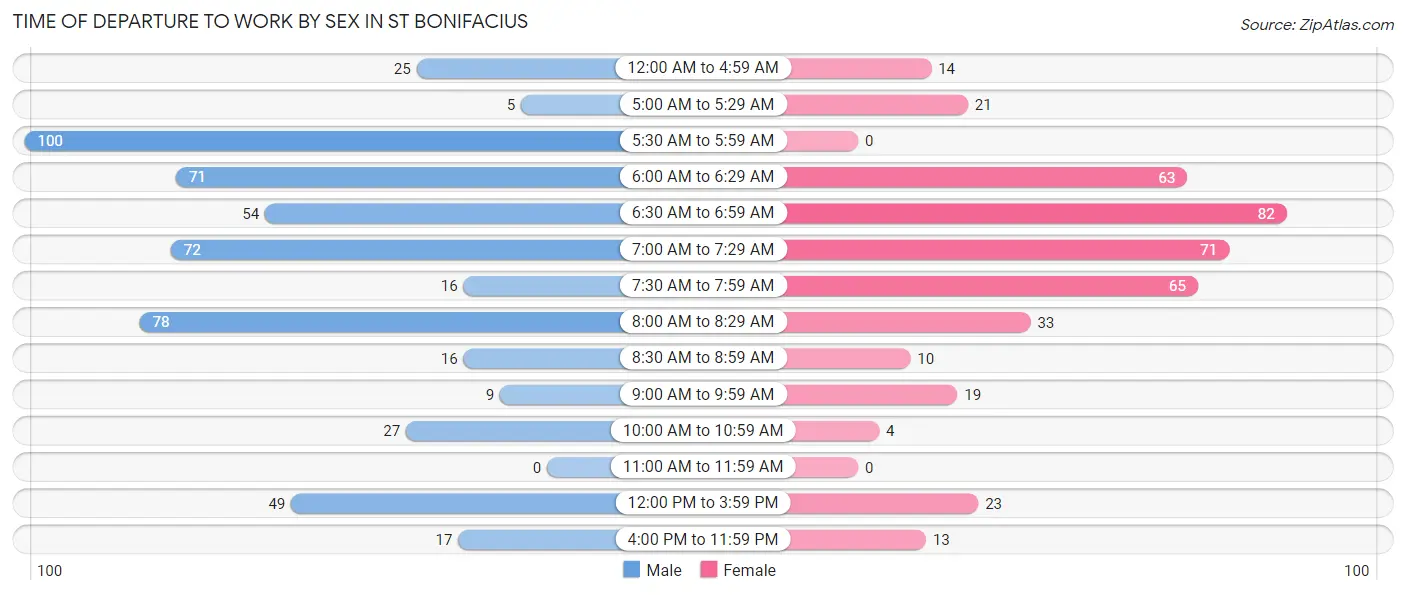
| Time of Departure | Male | Female |
| 12:00 AM to 4:59 AM | 25 (4.6%) | 14 (3.4%) |
| 5:00 AM to 5:29 AM | 5 (0.9%) | 21 (5.0%) |
| 5:30 AM to 5:59 AM | 100 (18.5%) | 0 (0.0%) |
| 6:00 AM to 6:29 AM | 71 (13.2%) | 63 (15.1%) |
| 6:30 AM to 6:59 AM | 54 (10.0%) | 82 (19.6%) |
| 7:00 AM to 7:29 AM | 72 (13.4%) | 71 (17.0%) |
| 7:30 AM to 7:59 AM | 16 (3.0%) | 65 (15.5%) |
| 8:00 AM to 8:29 AM | 78 (14.5%) | 33 (7.9%) |
| 8:30 AM to 8:59 AM | 16 (3.0%) | 10 (2.4%) |
| 9:00 AM to 9:59 AM | 9 (1.7%) | 19 (4.5%) |
| 10:00 AM to 10:59 AM | 27 (5.0%) | 4 (1.0%) |
| 11:00 AM to 11:59 AM | 0 (0.0%) | 0 (0.0%) |
| 12:00 PM to 3:59 PM | 49 (9.1%) | 23 (5.5%) |
| 4:00 PM to 11:59 PM | 17 (3.2%) | 13 (3.1%) |
| Total | 539 (100.0%) | 418 (100.0%) |
Housing Occupancy in St Bonifacius
Occupancy by Ownership in St Bonifacius
Of the total 801 dwellings in St Bonifacius, owner-occupied units account for 768 (95.9%), while renter-occupied units make up 33 (4.1%).
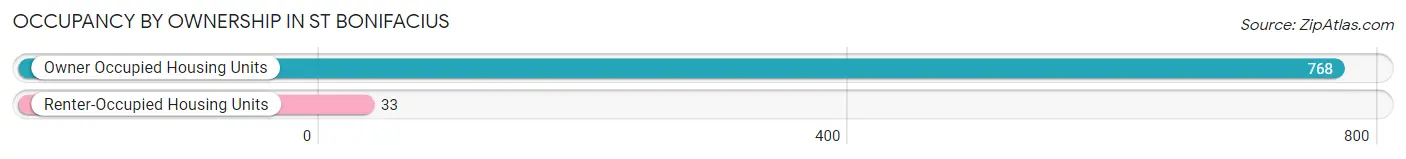
| Occupancy | # Housing Units | % Housing Units |
| Owner Occupied Housing Units | 768 | 95.9% |
| Renter-Occupied Housing Units | 33 | 4.1% |
| Total Occupied Housing Units | 801 | 100.0% |
Occupancy by Household Size in St Bonifacius
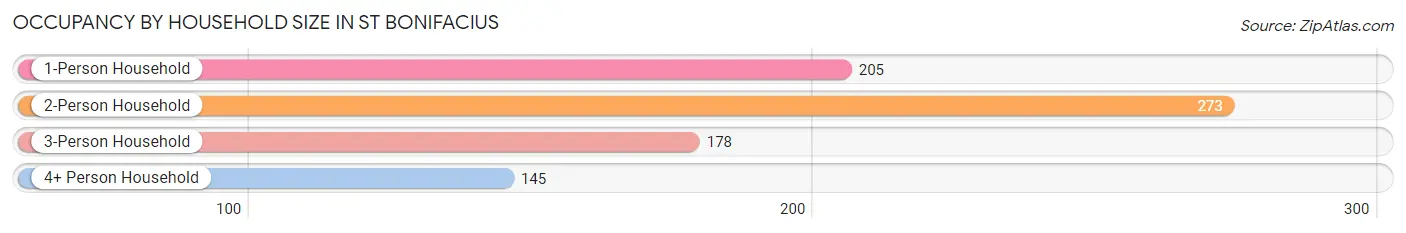
| Household Size | # Housing Units | % Housing Units |
| 1-Person Household | 205 | 25.6% |
| 2-Person Household | 273 | 34.1% |
| 3-Person Household | 178 | 22.2% |
| 4+ Person Household | 145 | 18.1% |
| Total Housing Units | 801 | 100.0% |
Occupancy by Ownership by Household Size in St Bonifacius
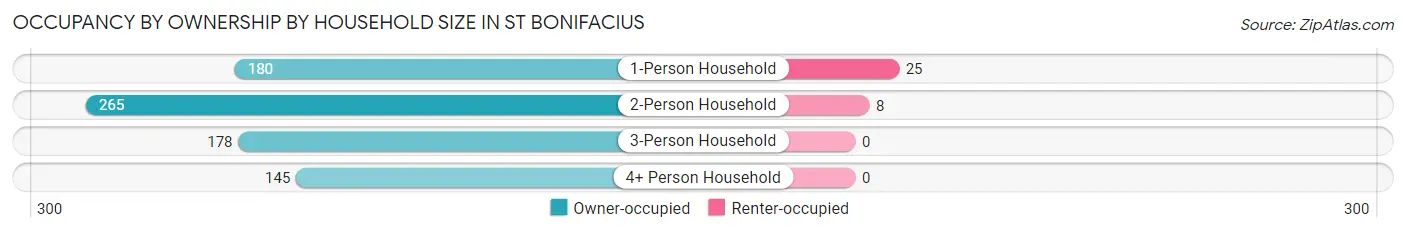
| Household Size | Owner-occupied | Renter-occupied |
| 1-Person Household | 180 (87.8%) | 25 (12.2%) |
| 2-Person Household | 265 (97.1%) | 8 (2.9%) |
| 3-Person Household | 178 (100.0%) | 0 (0.0%) |
| 4+ Person Household | 145 (100.0%) | 0 (0.0%) |
| Total Housing Units | 768 (95.9%) | 33 (4.1%) |
Occupancy by Educational Attainment in St Bonifacius
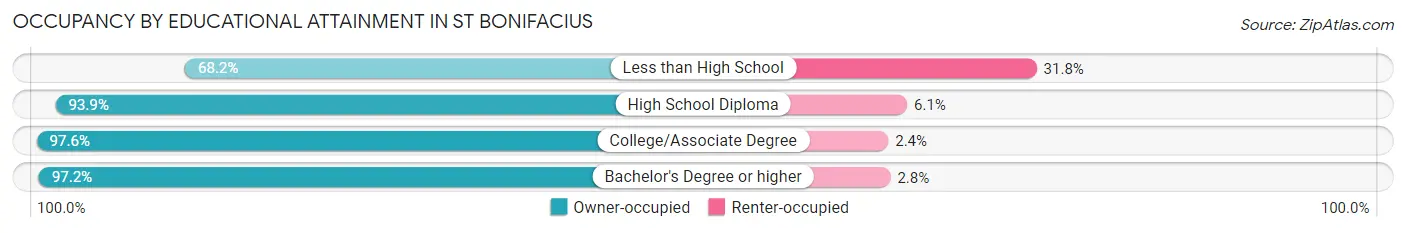
| Household Size | Owner-occupied | Renter-occupied |
| Less than High School | 15 (68.2%) | 7 (31.8%) |
| High School Diploma | 153 (93.9%) | 10 (6.1%) |
| College/Associate Degree | 326 (97.6%) | 8 (2.4%) |
| Bachelor's Degree or higher | 274 (97.2%) | 8 (2.8%) |
Occupancy by Age of Householder in St Bonifacius
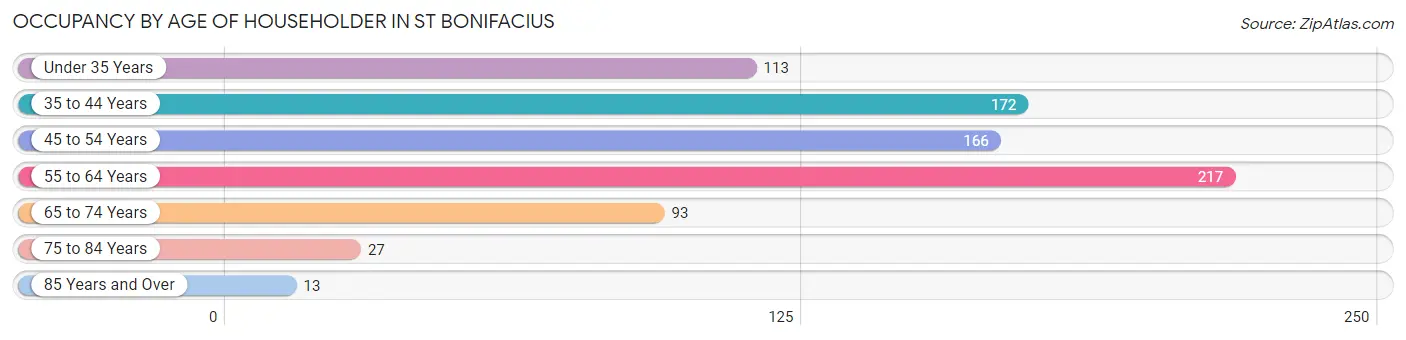
| Age Bracket | # Households | % Households |
| Under 35 Years | 113 | 14.1% |
| 35 to 44 Years | 172 | 21.5% |
| 45 to 54 Years | 166 | 20.7% |
| 55 to 64 Years | 217 | 27.1% |
| 65 to 74 Years | 93 | 11.6% |
| 75 to 84 Years | 27 | 3.4% |
| 85 Years and Over | 13 | 1.6% |
| Total | 801 | 100.0% |
Housing Finances in St Bonifacius
Median Income by Occupancy in St Bonifacius
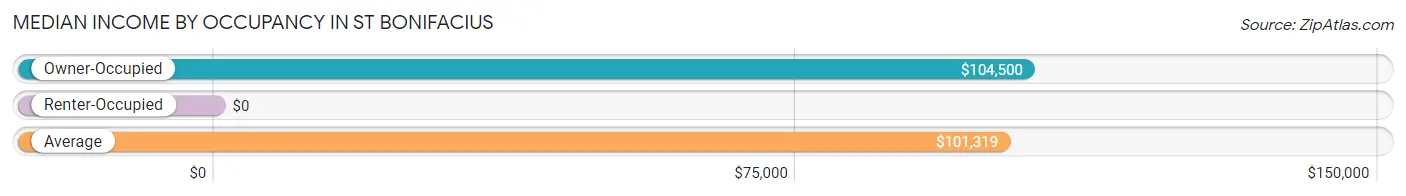
| Occupancy Type | # Households | Median Income |
| Owner-Occupied | 768 (95.9%) | $104,500 |
| Renter-Occupied | 33 (4.1%) | $0 |
| Average | 801 (100.0%) | $101,319 |
Occupancy by Householder Income Bracket in St Bonifacius
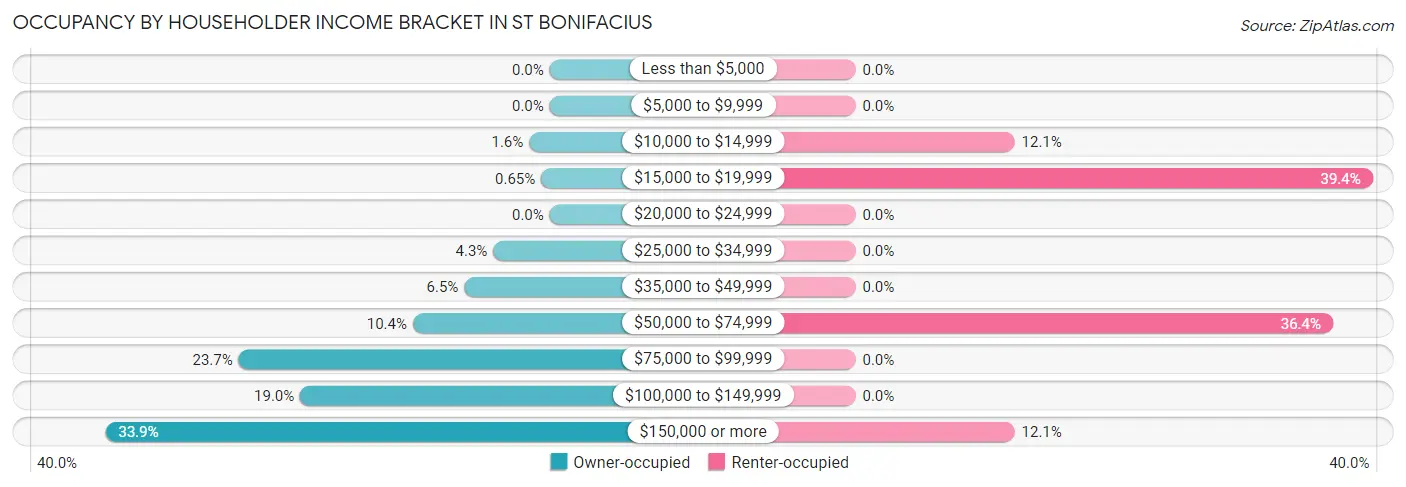
| Income Bracket | Owner-occupied | Renter-occupied |
| Less than $5,000 | 0 (0.0%) | 0 (0.0%) |
| $5,000 to $9,999 | 0 (0.0%) | 0 (0.0%) |
| $10,000 to $14,999 | 12 (1.6%) | 4 (12.1%) |
| $15,000 to $19,999 | 5 (0.6%) | 13 (39.4%) |
| $20,000 to $24,999 | 0 (0.0%) | 0 (0.0%) |
| $25,000 to $34,999 | 33 (4.3%) | 0 (0.0%) |
| $35,000 to $49,999 | 50 (6.5%) | 0 (0.0%) |
| $50,000 to $74,999 | 80 (10.4%) | 12 (36.4%) |
| $75,000 to $99,999 | 182 (23.7%) | 0 (0.0%) |
| $100,000 to $149,999 | 146 (19.0%) | 0 (0.0%) |
| $150,000 or more | 260 (33.9%) | 4 (12.1%) |
| Total | 768 (100.0%) | 33 (100.0%) |
Monthly Housing Cost Tiers in St Bonifacius
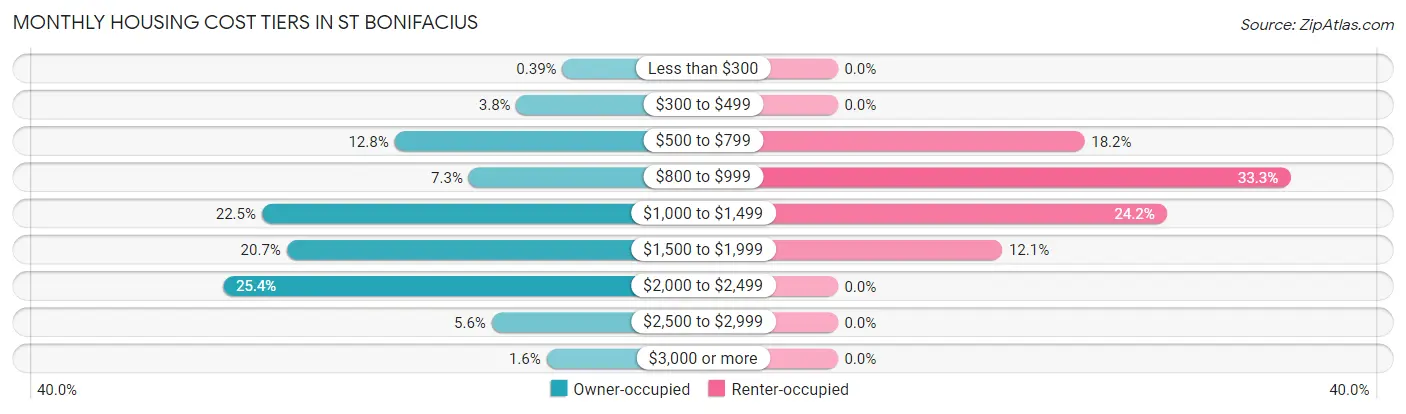
| Monthly Cost | Owner-occupied | Renter-occupied |
| Less than $300 | 3 (0.4%) | 0 (0.0%) |
| $300 to $499 | 29 (3.8%) | 0 (0.0%) |
| $500 to $799 | 98 (12.8%) | 6 (18.2%) |
| $800 to $999 | 56 (7.3%) | 11 (33.3%) |
| $1,000 to $1,499 | 173 (22.5%) | 8 (24.2%) |
| $1,500 to $1,999 | 159 (20.7%) | 4 (12.1%) |
| $2,000 to $2,499 | 195 (25.4%) | 0 (0.0%) |
| $2,500 to $2,999 | 43 (5.6%) | 0 (0.0%) |
| $3,000 or more | 12 (1.6%) | 0 (0.0%) |
| Total | 768 (100.0%) | 33 (100.0%) |
Physical Housing Characteristics in St Bonifacius
Housing Structures in St Bonifacius
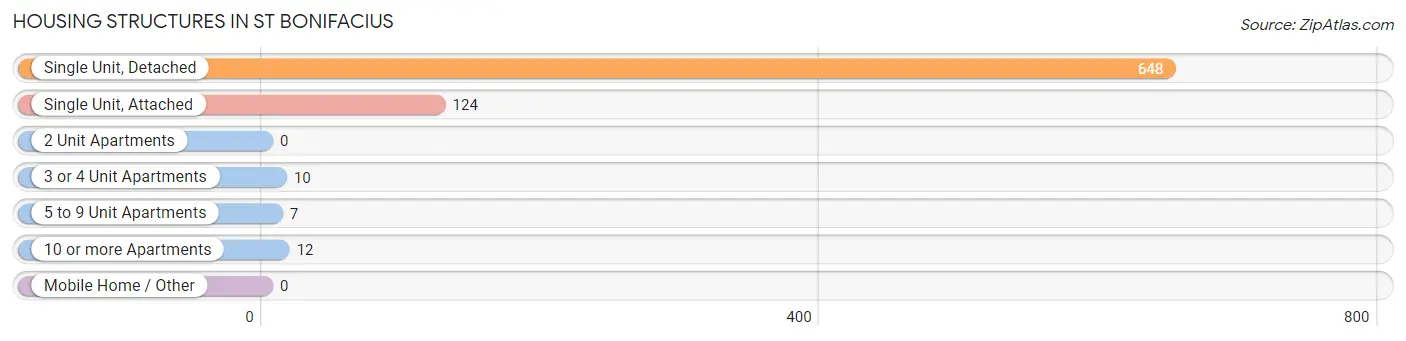
| Structure Type | # Housing Units | % Housing Units |
| Single Unit, Detached | 648 | 80.9% |
| Single Unit, Attached | 124 | 15.5% |
| 2 Unit Apartments | 0 | 0.0% |
| 3 or 4 Unit Apartments | 10 | 1.3% |
| 5 to 9 Unit Apartments | 7 | 0.9% |
| 10 or more Apartments | 12 | 1.5% |
| Mobile Home / Other | 0 | 0.0% |
| Total | 801 | 100.0% |
Housing Structures by Occupancy in St Bonifacius
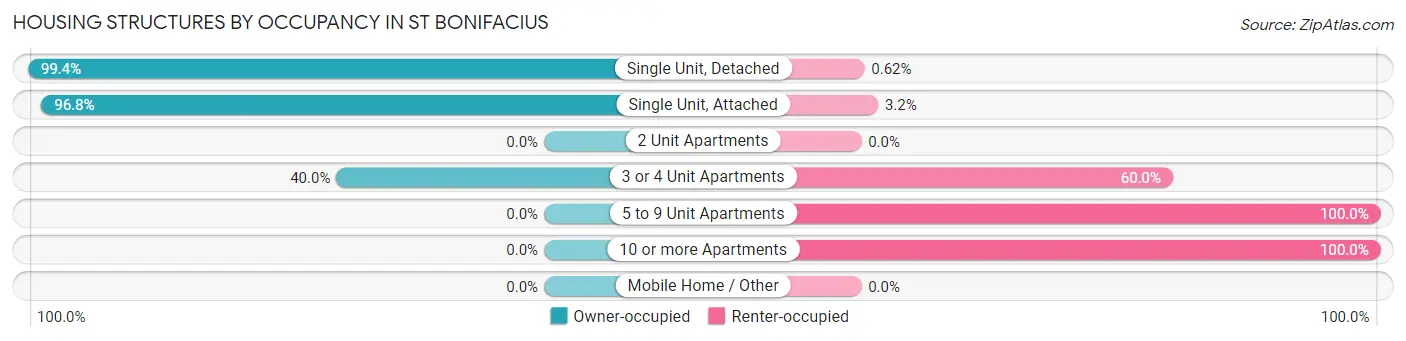
| Structure Type | Owner-occupied | Renter-occupied |
| Single Unit, Detached | 644 (99.4%) | 4 (0.6%) |
| Single Unit, Attached | 120 (96.8%) | 4 (3.2%) |
| 2 Unit Apartments | 0 (0.0%) | 0 (0.0%) |
| 3 or 4 Unit Apartments | 4 (40.0%) | 6 (60.0%) |
| 5 to 9 Unit Apartments | 0 (0.0%) | 7 (100.0%) |
| 10 or more Apartments | 0 (0.0%) | 12 (100.0%) |
| Mobile Home / Other | 0 (0.0%) | 0 (0.0%) |
| Total | 768 (95.9%) | 33 (4.1%) |
Housing Structures by Number of Rooms in St Bonifacius
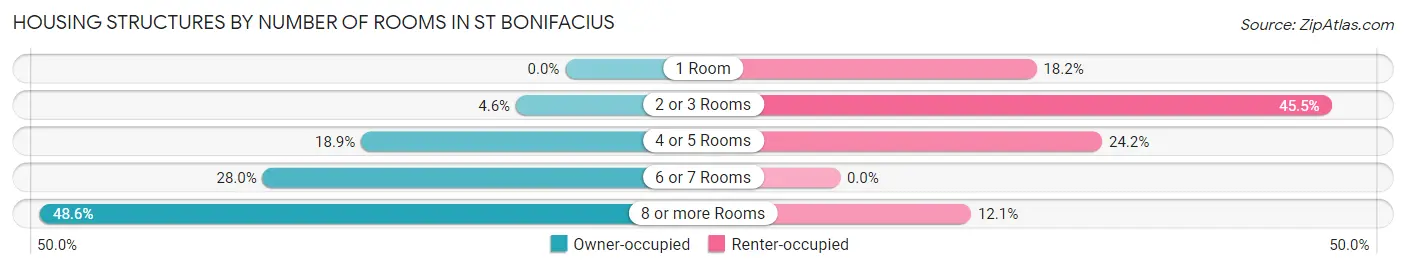
| Number of Rooms | Owner-occupied | Renter-occupied |
| 1 Room | 0 (0.0%) | 6 (18.2%) |
| 2 or 3 Rooms | 35 (4.6%) | 15 (45.5%) |
| 4 or 5 Rooms | 145 (18.9%) | 8 (24.2%) |
| 6 or 7 Rooms | 215 (28.0%) | 0 (0.0%) |
| 8 or more Rooms | 373 (48.6%) | 4 (12.1%) |
| Total | 768 (100.0%) | 33 (100.0%) |
Housing Structure by Heating Type in St Bonifacius
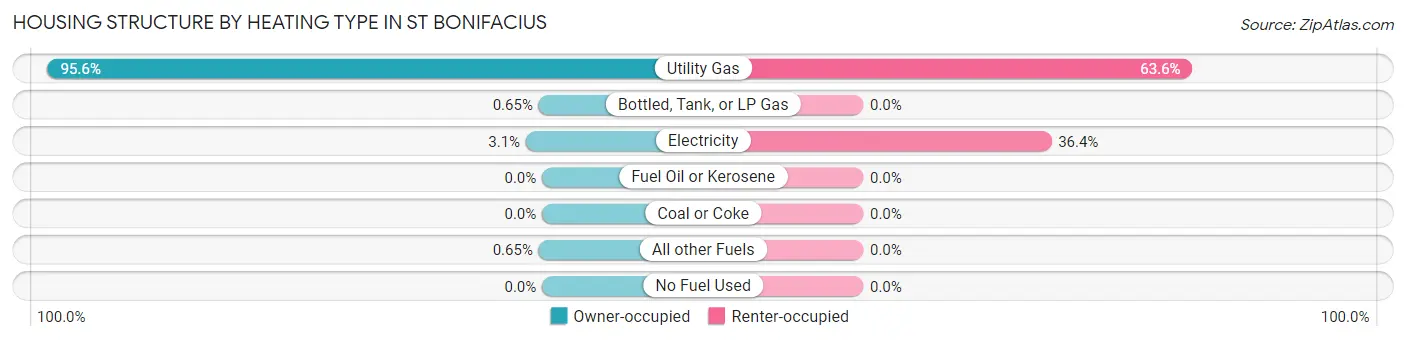
| Heating Type | Owner-occupied | Renter-occupied |
| Utility Gas | 734 (95.6%) | 21 (63.6%) |
| Bottled, Tank, or LP Gas | 5 (0.6%) | 0 (0.0%) |
| Electricity | 24 (3.1%) | 12 (36.4%) |
| Fuel Oil or Kerosene | 0 (0.0%) | 0 (0.0%) |
| Coal or Coke | 0 (0.0%) | 0 (0.0%) |
| All other Fuels | 5 (0.6%) | 0 (0.0%) |
| No Fuel Used | 0 (0.0%) | 0 (0.0%) |
| Total | 768 (100.0%) | 33 (100.0%) |
Household Vehicle Usage in St Bonifacius
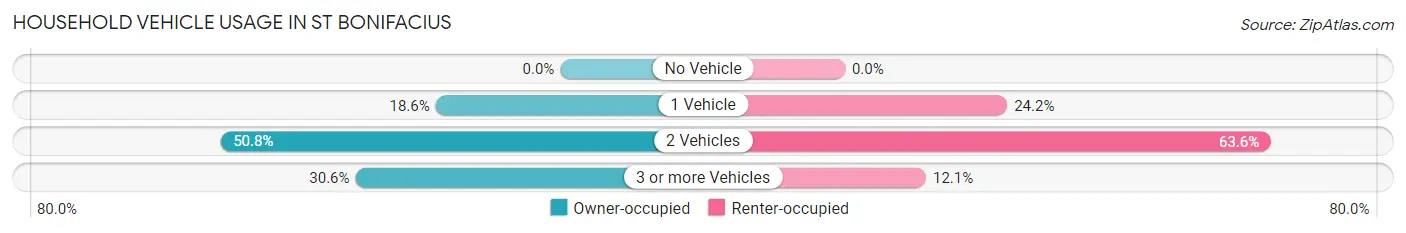
| Vehicles per Household | Owner-occupied | Renter-occupied |
| No Vehicle | 0 (0.0%) | 0 (0.0%) |
| 1 Vehicle | 143 (18.6%) | 8 (24.2%) |
| 2 Vehicles | 390 (50.8%) | 21 (63.6%) |
| 3 or more Vehicles | 235 (30.6%) | 4 (12.1%) |
| Total | 768 (100.0%) | 33 (100.0%) |
Real Estate & Mortgages in St Bonifacius
Real Estate and Mortgage Overview in St Bonifacius
| Characteristic | Without Mortgage | With Mortgage |
| Housing Units | 172 | 596 |
| Median Property Value | $339,600 | $322,000 |
| Median Household Income | $97,083 | $207 |
| Monthly Housing Costs | $649 | $12 |
| Real Estate Taxes | $3,572 | $0 |
Property Value by Mortgage Status in St Bonifacius
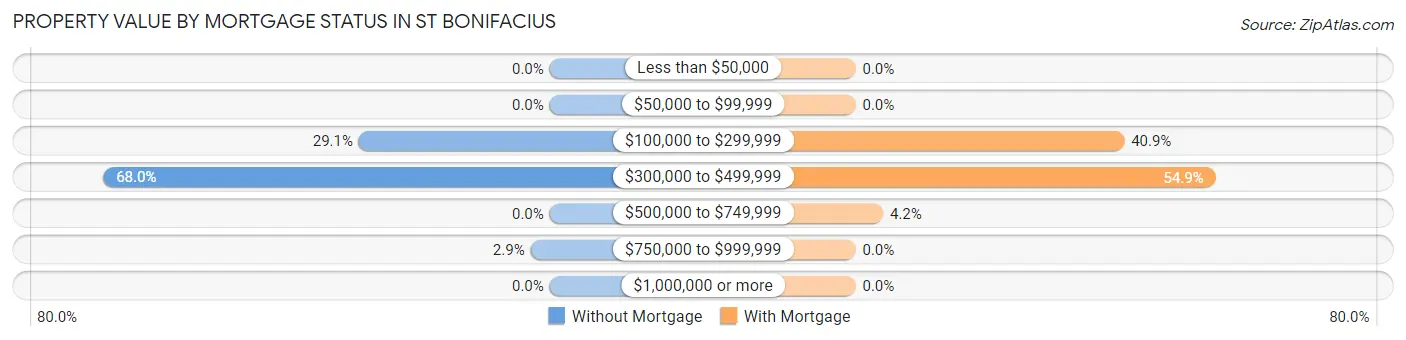
| Property Value | Without Mortgage | With Mortgage |
| Less than $50,000 | 0 (0.0%) | 0 (0.0%) |
| $50,000 to $99,999 | 0 (0.0%) | 0 (0.0%) |
| $100,000 to $299,999 | 50 (29.1%) | 244 (40.9%) |
| $300,000 to $499,999 | 117 (68.0%) | 327 (54.9%) |
| $500,000 to $749,999 | 0 (0.0%) | 25 (4.2%) |
| $750,000 to $999,999 | 5 (2.9%) | 0 (0.0%) |
| $1,000,000 or more | 0 (0.0%) | 0 (0.0%) |
| Total | 172 (100.0%) | 596 (100.0%) |
Household Income by Mortgage Status in St Bonifacius
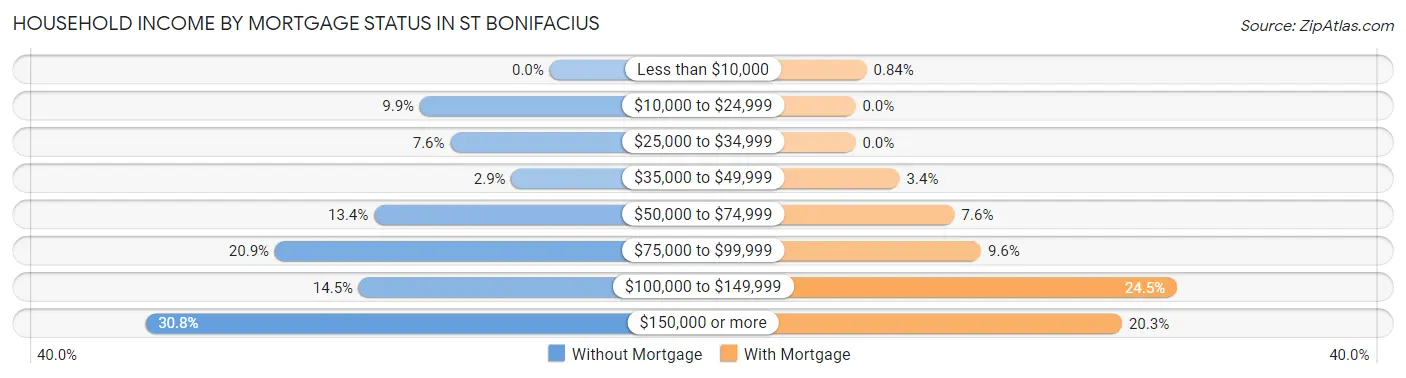
| Household Income | Without Mortgage | With Mortgage |
| Less than $10,000 | 0 (0.0%) | 5 (0.8%) |
| $10,000 to $24,999 | 17 (9.9%) | 0 (0.0%) |
| $25,000 to $34,999 | 13 (7.6%) | 0 (0.0%) |
| $35,000 to $49,999 | 5 (2.9%) | 20 (3.4%) |
| $50,000 to $74,999 | 23 (13.4%) | 45 (7.5%) |
| $75,000 to $99,999 | 36 (20.9%) | 57 (9.6%) |
| $100,000 to $149,999 | 25 (14.5%) | 146 (24.5%) |
| $150,000 or more | 53 (30.8%) | 121 (20.3%) |
| Total | 172 (100.0%) | 596 (100.0%) |
Property Value to Household Income Ratio in St Bonifacius
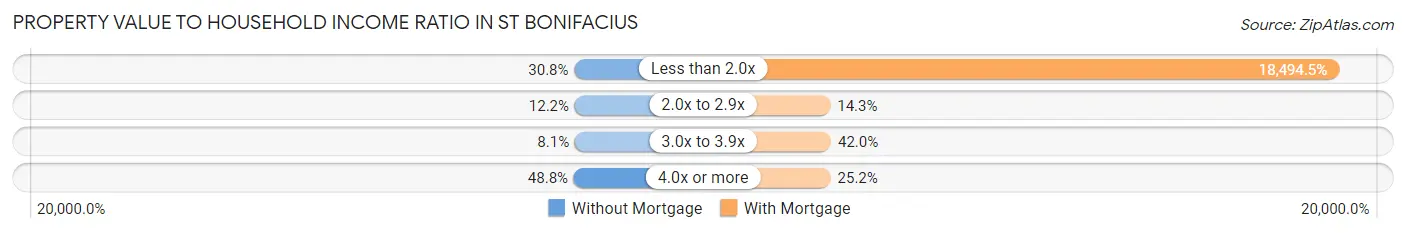
| Value-to-Income Ratio | Without Mortgage | With Mortgage |
| Less than 2.0x | 53 (30.8%) | 110,227 (18,494.5%) |
| 2.0x to 2.9x | 21 (12.2%) | 85 (14.3%) |
| 3.0x to 3.9x | 14 (8.1%) | 250 (41.9%) |
| 4.0x or more | 84 (48.8%) | 150 (25.2%) |
| Total | 172 (100.0%) | 596 (100.0%) |
Real Estate Taxes by Mortgage Status in St Bonifacius
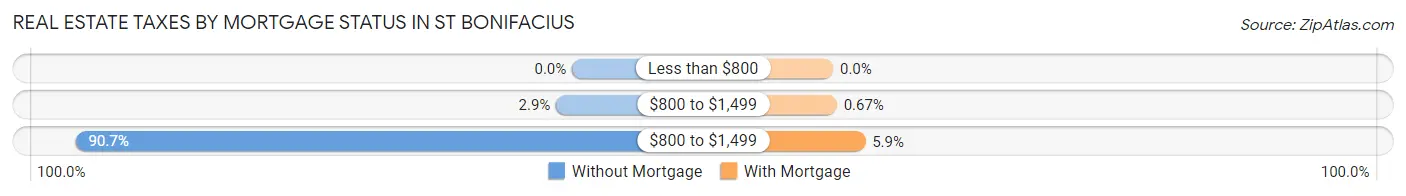
| Property Taxes | Without Mortgage | With Mortgage |
| Less than $800 | 0 (0.0%) | 0 (0.0%) |
| $800 to $1,499 | 5 (2.9%) | 4 (0.7%) |
| $800 to $1,499 | 156 (90.7%) | 35 (5.9%) |
| Total | 172 (100.0%) | 596 (100.0%) |
Health & Disability in St Bonifacius
Health Insurance Coverage by Age in St Bonifacius
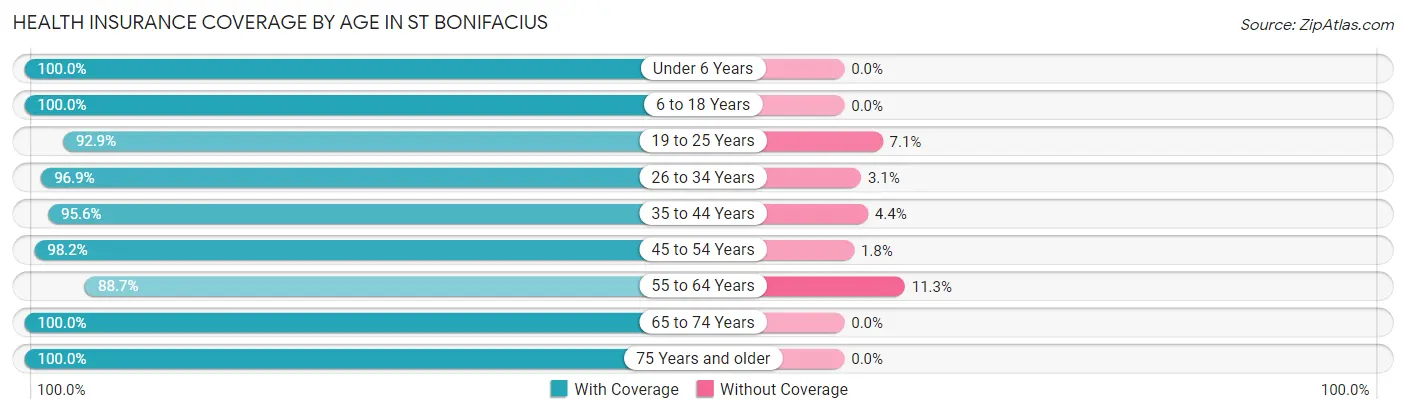
| Age Bracket | With Coverage | Without Coverage |
| Under 6 Years | 134 (100.0%) | 0 (0.0%) |
| 6 to 18 Years | 372 (100.0%) | 0 (0.0%) |
| 19 to 25 Years | 65 (92.9%) | 5 (7.1%) |
| 26 to 34 Years | 187 (96.9%) | 6 (3.1%) |
| 35 to 44 Years | 326 (95.6%) | 15 (4.4%) |
| 45 to 54 Years | 271 (98.2%) | 5 (1.8%) |
| 55 to 64 Years | 322 (88.7%) | 41 (11.3%) |
| 65 to 74 Years | 152 (100.0%) | 0 (0.0%) |
| 75 Years and older | 55 (100.0%) | 0 (0.0%) |
| Total | 1,884 (96.3%) | 72 (3.7%) |
Health Insurance Coverage by Citizenship Status in St Bonifacius
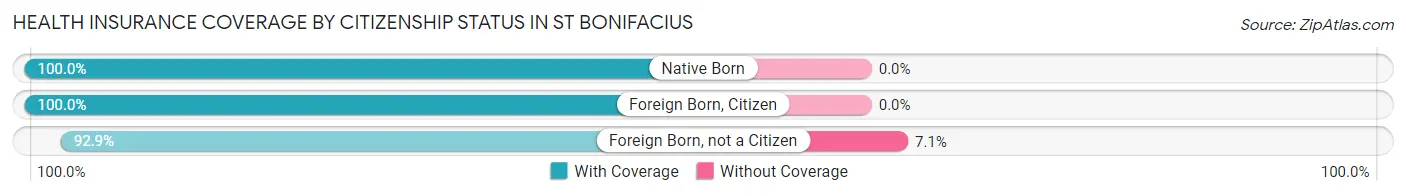
| Citizenship Status | With Coverage | Without Coverage |
| Native Born | 134 (100.0%) | 0 (0.0%) |
| Foreign Born, Citizen | 372 (100.0%) | 0 (0.0%) |
| Foreign Born, not a Citizen | 65 (92.9%) | 5 (7.1%) |
Health Insurance Coverage by Household Income in St Bonifacius
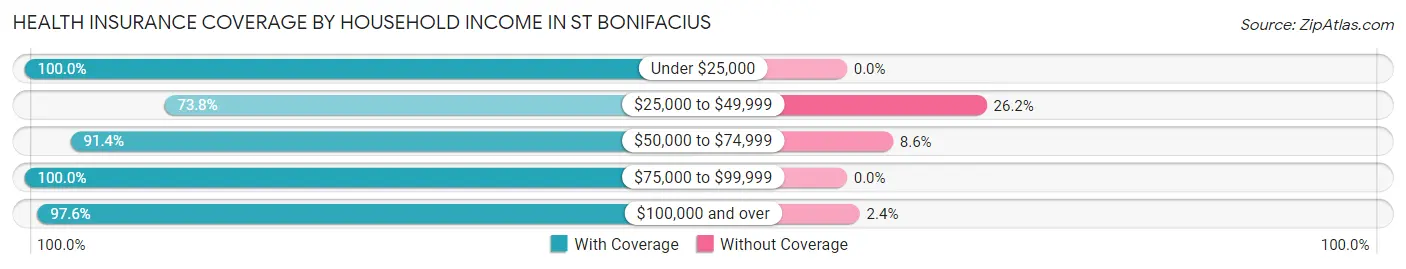
| Household Income | With Coverage | Without Coverage |
| Under $25,000 | 34 (100.0%) | 0 (0.0%) |
| $25,000 to $49,999 | 93 (73.8%) | 33 (26.2%) |
| $50,000 to $74,999 | 127 (91.4%) | 12 (8.6%) |
| $75,000 to $99,999 | 535 (100.0%) | 0 (0.0%) |
| $100,000 and over | 1,095 (97.6%) | 27 (2.4%) |
Public vs Private Health Insurance Coverage by Age in St Bonifacius
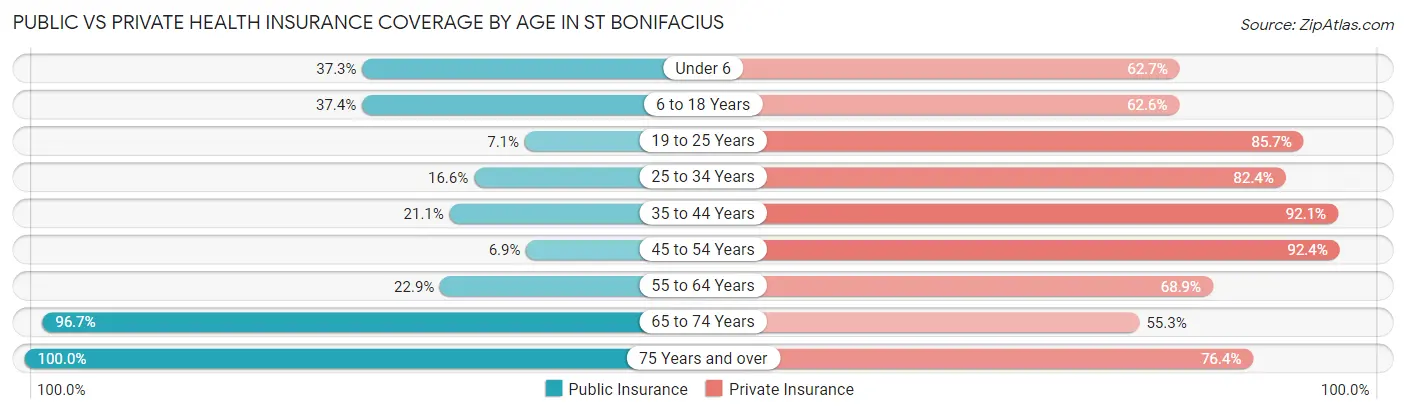
| Age Bracket | Public Insurance | Private Insurance |
| Under 6 | 50 (37.3%) | 84 (62.7%) |
| 6 to 18 Years | 139 (37.4%) | 233 (62.6%) |
| 19 to 25 Years | 5 (7.1%) | 60 (85.7%) |
| 25 to 34 Years | 32 (16.6%) | 159 (82.4%) |
| 35 to 44 Years | 72 (21.1%) | 314 (92.1%) |
| 45 to 54 Years | 19 (6.9%) | 255 (92.4%) |
| 55 to 64 Years | 83 (22.9%) | 250 (68.9%) |
| 65 to 74 Years | 147 (96.7%) | 84 (55.3%) |
| 75 Years and over | 55 (100.0%) | 42 (76.4%) |
| Total | 602 (30.8%) | 1,481 (75.7%) |
Disability Status by Sex by Age in St Bonifacius
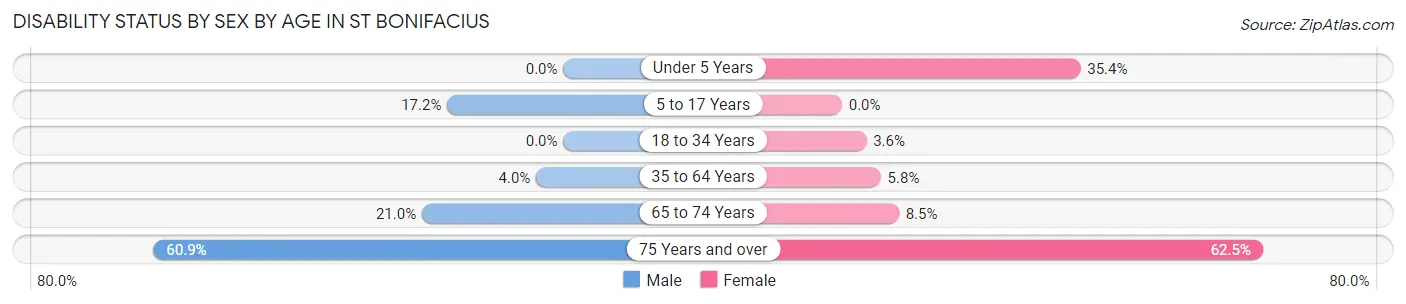
| Age Bracket | Male | Female |
| Under 5 Years | 0 (0.0%) | 17 (35.4%) |
| 5 to 17 Years | 45 (17.2%) | 0 (0.0%) |
| 18 to 34 Years | 0 (0.0%) | 5 (3.6%) |
| 35 to 64 Years | 20 (4.0%) | 28 (5.8%) |
| 65 to 74 Years | 17 (21.0%) | 6 (8.5%) |
| 75 Years and over | 14 (60.9%) | 20 (62.5%) |
Disability Class by Sex by Age in St Bonifacius
Disability Class: Hearing Difficulty
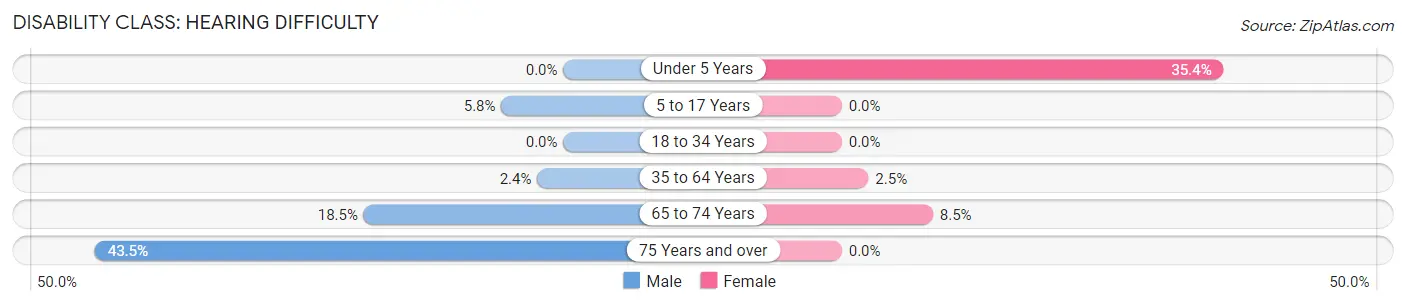
| Age Bracket | Male | Female |
| Under 5 Years | 0 (0.0%) | 17 (35.4%) |
| 5 to 17 Years | 15 (5.8%) | 0 (0.0%) |
| 18 to 34 Years | 0 (0.0%) | 0 (0.0%) |
| 35 to 64 Years | 12 (2.4%) | 12 (2.5%) |
| 65 to 74 Years | 15 (18.5%) | 6 (8.5%) |
| 75 Years and over | 10 (43.5%) | 0 (0.0%) |
Disability Class: Vision Difficulty
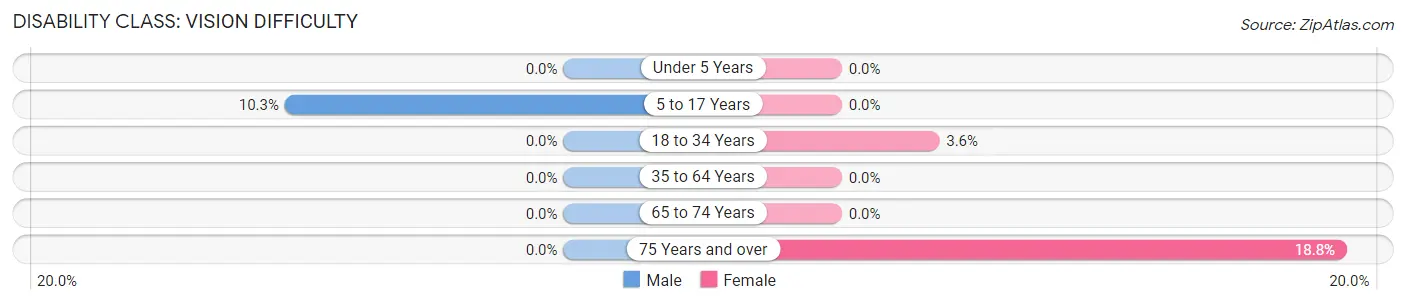
| Age Bracket | Male | Female |
| Under 5 Years | 0 (0.0%) | 0 (0.0%) |
| 5 to 17 Years | 27 (10.3%) | 0 (0.0%) |
| 18 to 34 Years | 0 (0.0%) | 5 (3.6%) |
| 35 to 64 Years | 0 (0.0%) | 0 (0.0%) |
| 65 to 74 Years | 0 (0.0%) | 0 (0.0%) |
| 75 Years and over | 0 (0.0%) | 6 (18.8%) |
Disability Class: Cognitive Difficulty
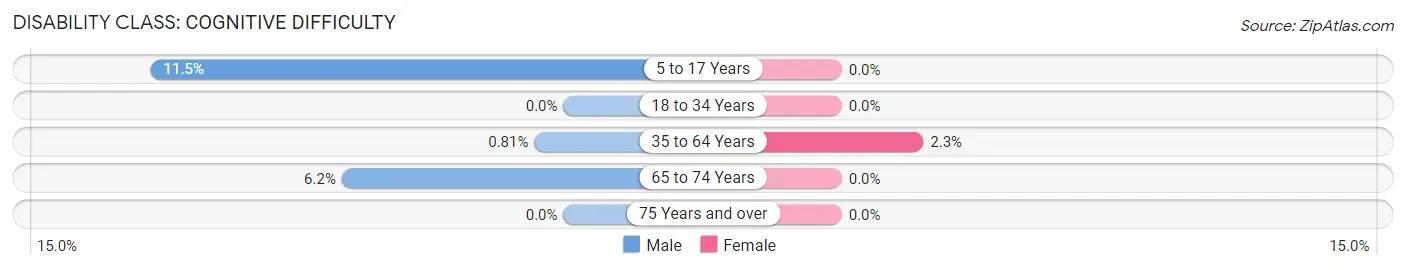
| Age Bracket | Male | Female |
| 5 to 17 Years | 30 (11.5%) | 0 (0.0%) |
| 18 to 34 Years | 0 (0.0%) | 0 (0.0%) |
| 35 to 64 Years | 4 (0.8%) | 11 (2.3%) |
| 65 to 74 Years | 5 (6.2%) | 0 (0.0%) |
| 75 Years and over | 0 (0.0%) | 0 (0.0%) |
Disability Class: Ambulatory Difficulty
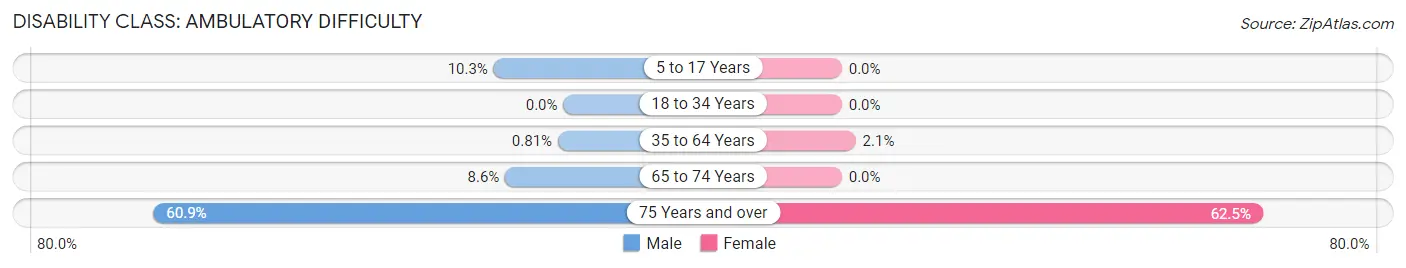
| Age Bracket | Male | Female |
| 5 to 17 Years | 27 (10.3%) | 0 (0.0%) |
| 18 to 34 Years | 0 (0.0%) | 0 (0.0%) |
| 35 to 64 Years | 4 (0.8%) | 10 (2.1%) |
| 65 to 74 Years | 7 (8.6%) | 0 (0.0%) |
| 75 Years and over | 14 (60.9%) | 20 (62.5%) |
Disability Class: Self-Care Difficulty
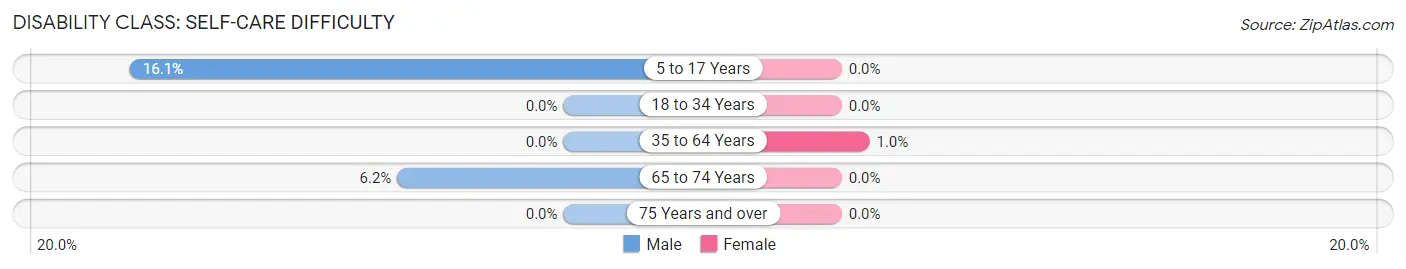
| Age Bracket | Male | Female |
| 5 to 17 Years | 42 (16.1%) | 0 (0.0%) |
| 18 to 34 Years | 0 (0.0%) | 0 (0.0%) |
| 35 to 64 Years | 0 (0.0%) | 5 (1.0%) |
| 65 to 74 Years | 5 (6.2%) | 0 (0.0%) |
| 75 Years and over | 0 (0.0%) | 0 (0.0%) |
Technology Access in St Bonifacius
Computing Device Access in St Bonifacius
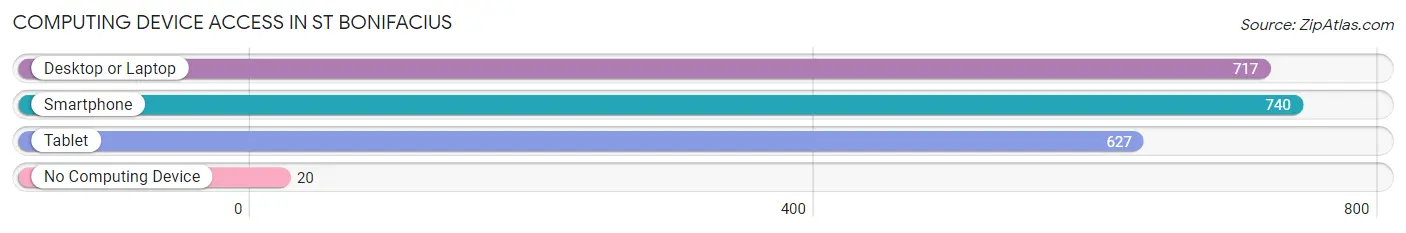
| Device Type | # Households | % Households |
| Desktop or Laptop | 717 | 89.5% |
| Smartphone | 740 | 92.4% |
| Tablet | 627 | 78.3% |
| No Computing Device | 20 | 2.5% |
| Total | 801 | 100.0% |
Internet Access in St Bonifacius
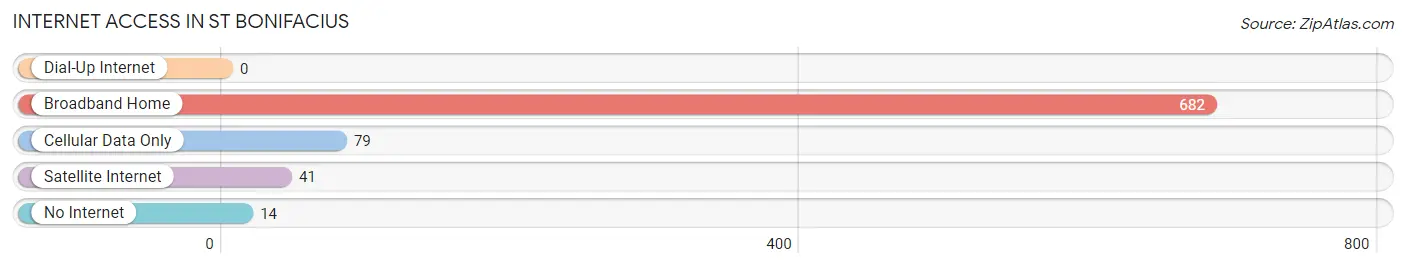
| Internet Type | # Households | % Households |
| Dial-Up Internet | 0 | 0.0% |
| Broadband Home | 682 | 85.1% |
| Cellular Data Only | 79 | 9.9% |
| Satellite Internet | 41 | 5.1% |
| No Internet | 14 | 1.8% |
| Total | 801 | 100.0% |
St Bonifacius Summary
St Bonifacius is a small city located in Hennepin County, Minnesota. It is situated in the western part of the Twin Cities metropolitan area, approximately 25 miles west of Minneapolis. The city was founded in 1856 and is named after the patron saint of Germany, St Boniface. As of the 2010 census, the population of St Boniface was 2,521.
History
St Bonifacius was founded in 1856 by German immigrants who had come to the area in search of religious freedom. The city was named after the patron saint of Germany, St Boniface. The city was originally a farming community, but it soon developed into a small industrial center. In the late 19th century, the city was home to a number of small businesses, including a brewery, a sawmill, and a brickyard.
In the early 20th century, St Bonifacius experienced a period of growth and development. The city was incorporated in 1908 and the first mayor was elected in 1909. During this time, the city was home to a number of businesses, including a flour mill, a creamery, and a canning factory.
In the 1950s, St Bonifacius began to experience a period of decline. Many of the businesses that had been located in the city closed or moved away. The population of the city decreased from a peak of 2,845 in 1950 to 2,521 in 2010.
Geography
St Bonifacius is located in Hennepin County, Minnesota. It is situated in the western part of the Twin Cities metropolitan area, approximately 25 miles west of Minneapolis. The city is located on the banks of the Crow River and is surrounded by rolling hills and farmland.
The city has a total area of 2.2 square miles, all of which is land. The elevation of the city is 890 feet above sea level.
Economy
St Bonifacius is a small city with a limited economy. The city is home to a number of small businesses, including a grocery store, a hardware store, and a few restaurants. The city is also home to a number of manufacturing companies, including a plastics manufacturer and a metal fabrication company.
The city is also home to a number of small technology companies, including a software development company and a web design firm. The city is also home to a number of medical and health care providers, including a hospital and a number of clinics.
Demographics
As of the 2010 census, the population of St Bonifacius was 2,521. The racial makeup of the city was 95.2% White, 0.9% African American, 0.3% Native American, 0.7% Asian, 0.1% Pacific Islander, 1.2% from other races, and 1.6% from two or more races. Hispanic or Latino of any race were 3.2% of the population.
The median income for a household in the city was $50,938, and the median income for a family was $60,938. The per capita income for the city was $25,938. About 4.2% of families and 5.7% of the population were below the poverty line, including 6.3% of those under age 18 and 4.2% of those age 65 or over.
Common Questions
What is Per Capita Income in St Bonifacius?
Per Capita income in St Bonifacius is $49,457.
What is the Median Family Income in St Bonifacius?
Median Family Income in St Bonifacius is $129,135.
What is the Median Household income in St Bonifacius?
Median Household Income in St Bonifacius is $101,319.
What is Income or Wage Gap in St Bonifacius?
Income or Wage Gap in St Bonifacius is 2.5%.
Women in St Bonifacius earn 97.5 cents for every dollar earned by a man.
What is Inequality or Gini Index in St Bonifacius?
Inequality or Gini Index in St Bonifacius is 0.33.
What is the Total Population of St Bonifacius?
Total Population of St Bonifacius is 1,956.
What is the Total Male Population of St Bonifacius?
Total Male Population of St Bonifacius is 1,073.
What is the Total Female Population of St Bonifacius?
Total Female Population of St Bonifacius is 883.
What is the Ratio of Males per 100 Females in St Bonifacius?
There are 121.52 Males per 100 Females in St Bonifacius.
What is the Ratio of Females per 100 Males in St Bonifacius?
There are 82.29 Females per 100 Males in St Bonifacius.
What is the Median Population Age in St Bonifacius?
Median Population Age in St Bonifacius is 41.1 Years.
What is the Average Family Size in St Bonifacius
Average Family Size in St Bonifacius is 3.0 People.
What is the Average Household Size in St Bonifacius
Average Household Size in St Bonifacius is 2.4 People.
How Large is the Labor Force in St Bonifacius?
There are 1,171 People in the Labor Forcein in St Bonifacius.
What is the Percentage of People in the Labor Force in St Bonifacius?
76.8% of People are in the Labor Force in St Bonifacius.
What is the Unemployment Rate in St Bonifacius?
Unemployment Rate in St Bonifacius is 3.3%.