Kilkenny, MN Map & Demographics
Kilkenny Map
Kilkenny Overview
$28,368
PER CAPITA INCOME
0.44
INEQUALITY / GINI INDEX
76
TOTAL POPULATION
35
MALE POPULATION
41
FEMALE POPULATION
85.37
MALES / 100 FEMALES
117.14
FEMALES / 100 MALES
53.7
MEDIAN AGE
2.4
AVG FAMILY SIZE
1.9
AVG HOUSEHOLD SIZE
32
LABOR FORCE [ PEOPLE ]
53.3%
PERCENT IN LABOR FORCE
3.1%
UNEMPLOYMENT RATE
Kilkenny Zip Codes
Kilkenny Area Codes
Income in Kilkenny
Income Overview in Kilkenny
| Characteristic | Number | Measure |
| Per Capita Income | 76 | $28,368 |
| Median Family Income | 23 | $0 |
| Mean Family Income | 23 | $70,813 |
| Median Household Income | 41 | $0 |
| Mean Household Income | 41 | $56,110 |
| Income Deficit | 23 | $0 |
| Wage / Income Gap (%) | 76 | 0.00% |
| Wage / Income Gap ($) | 76 | 100.00¢ per $1 |
| Gini / Inequality Index | 76 | 0.44 |
Earnings by Sex in Kilkenny
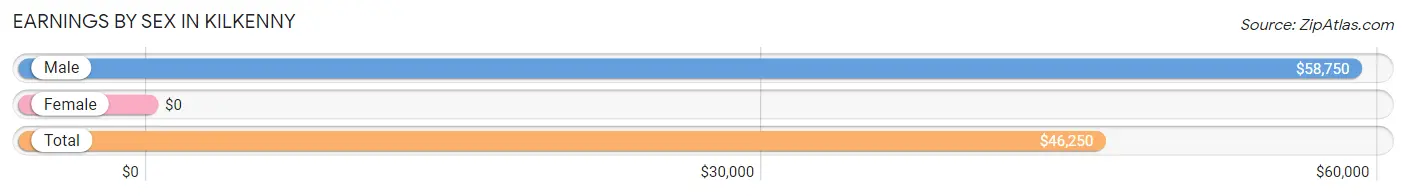
| Sex | Number | Average Earnings |
| Male | 19 (57.6%) | $58,750 |
| Female | 14 (42.4%) | $0 |
| Total | 33 (100.0%) | $46,250 |
Earnings by Sex by Income Bracket in Kilkenny
The most common earnings brackets in Kilkenny are $75,000 to $99,999 for men (6 | 31.6%) and $2,500 to $4,999 for women (2 | 14.3%).
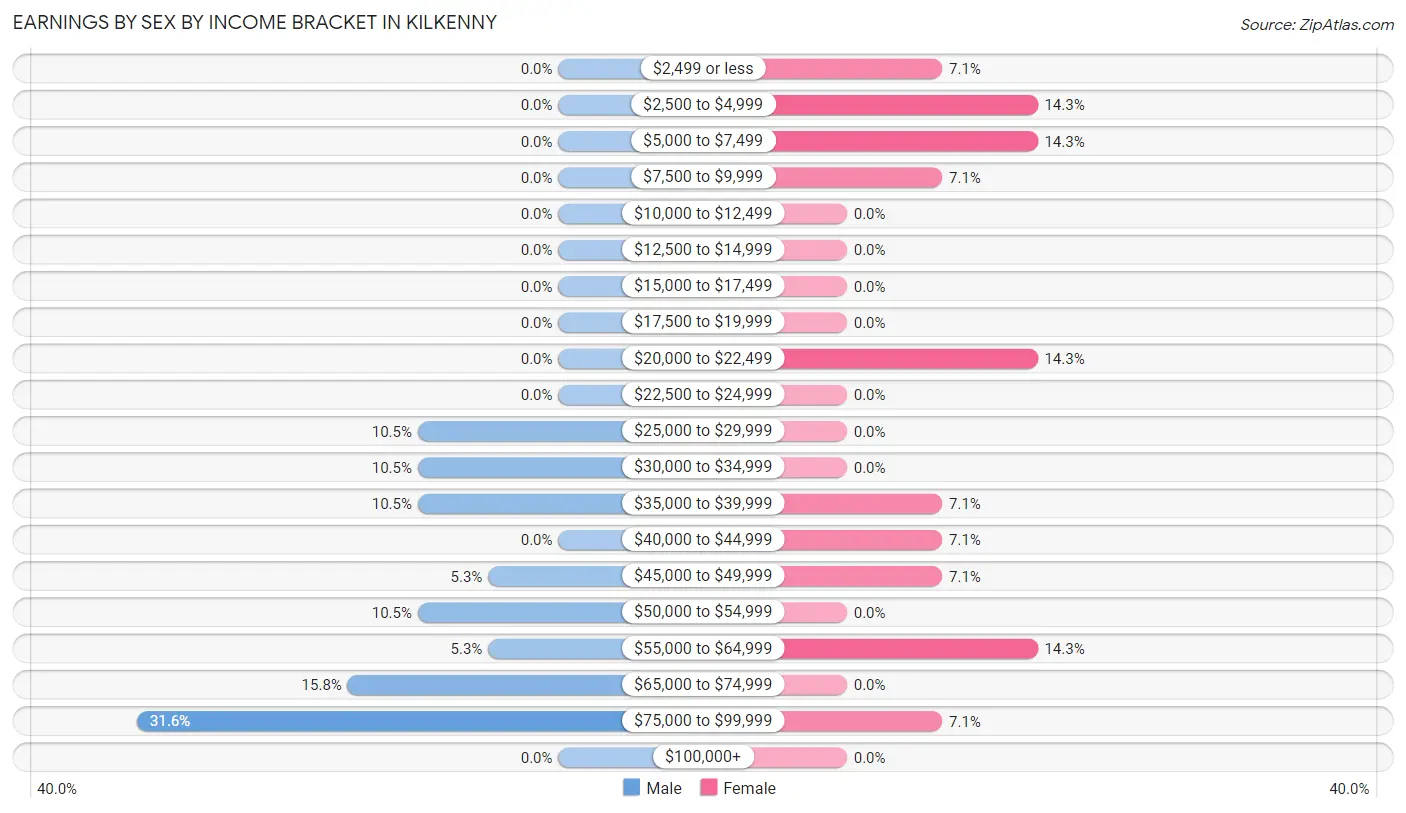
| Income | Male | Female |
| $2,499 or less | 0 (0.0%) | 1 (7.1%) |
| $2,500 to $4,999 | 0 (0.0%) | 2 (14.3%) |
| $5,000 to $7,499 | 0 (0.0%) | 2 (14.3%) |
| $7,500 to $9,999 | 0 (0.0%) | 1 (7.1%) |
| $10,000 to $12,499 | 0 (0.0%) | 0 (0.0%) |
| $12,500 to $14,999 | 0 (0.0%) | 0 (0.0%) |
| $15,000 to $17,499 | 0 (0.0%) | 0 (0.0%) |
| $17,500 to $19,999 | 0 (0.0%) | 0 (0.0%) |
| $20,000 to $22,499 | 0 (0.0%) | 2 (14.3%) |
| $22,500 to $24,999 | 0 (0.0%) | 0 (0.0%) |
| $25,000 to $29,999 | 2 (10.5%) | 0 (0.0%) |
| $30,000 to $34,999 | 2 (10.5%) | 0 (0.0%) |
| $35,000 to $39,999 | 2 (10.5%) | 1 (7.1%) |
| $40,000 to $44,999 | 0 (0.0%) | 1 (7.1%) |
| $45,000 to $49,999 | 1 (5.3%) | 1 (7.1%) |
| $50,000 to $54,999 | 2 (10.5%) | 0 (0.0%) |
| $55,000 to $64,999 | 1 (5.3%) | 2 (14.3%) |
| $65,000 to $74,999 | 3 (15.8%) | 0 (0.0%) |
| $75,000 to $99,999 | 6 (31.6%) | 1 (7.1%) |
| $100,000+ | 0 (0.0%) | 0 (0.0%) |
| Total | 19 (100.0%) | 14 (100.0%) |
Earnings by Sex by Educational Attainment in Kilkenny
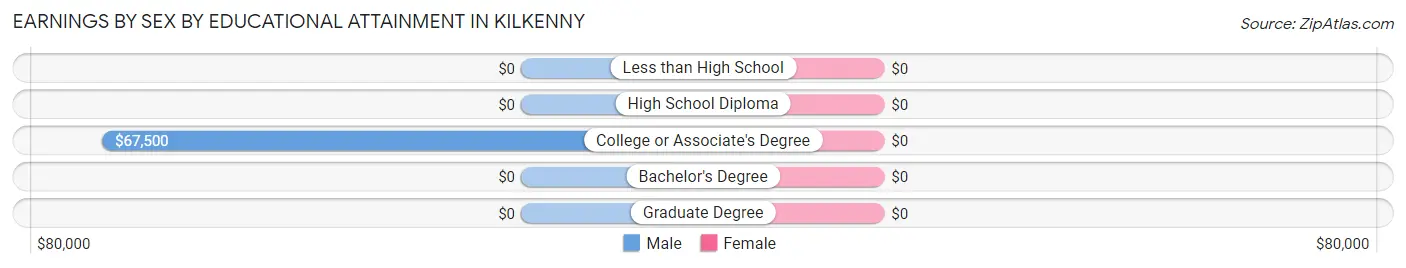
| Educational Attainment | Male Income | Female Income |
| Less than High School | - | - |
| High School Diploma | - | - |
| College or Associate's Degree | $67,500 | $0 |
| Bachelor's Degree | - | - |
| Graduate Degree | - | - |
| Total | $65,625 | $0 |
Family Income in Kilkenny
Family Income Brackets in Kilkenny
According to the Kilkenny family income data, there are 11 families falling into the $25,000 to $34,999 income range, which is the most common income bracket and makes up 47.8% of all families.
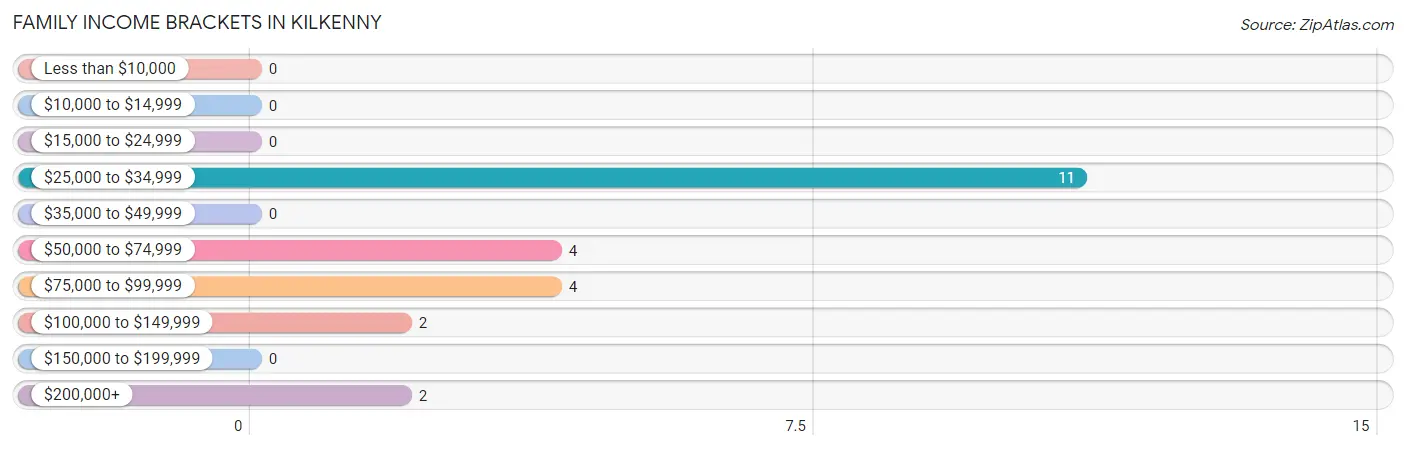
| Income Bracket | # Families | % Families |
| Less than $10,000 | 0 | 0.0% |
| $10,000 to $14,999 | 0 | 0.0% |
| $15,000 to $24,999 | 0 | 0.0% |
| $25,000 to $34,999 | 11 | 47.8% |
| $35,000 to $49,999 | 0 | 0.0% |
| $50,000 to $74,999 | 4 | 17.4% |
| $75,000 to $99,999 | 4 | 17.4% |
| $100,000 to $149,999 | 2 | 8.7% |
| $150,000 to $199,999 | 0 | 0.0% |
| $200,000+ | 2 | 8.7% |
Family Income by Famaliy Size in Kilkenny
2-person families (10 | 43.5%) account for the highest median family income in Kilkenny with $64,167 per family, while 2-person families (10 | 43.5%) have the highest median income of $32,084 per family member.
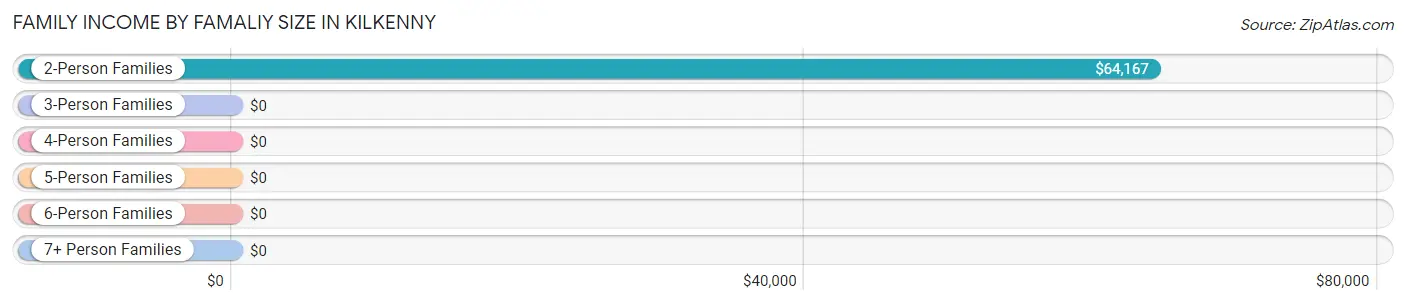
| Income Bracket | # Families | Median Income |
| 2-Person Families | 10 (43.5%) | $64,167 |
| 3-Person Families | 10 (43.5%) | $0 |
| 4-Person Families | 2 (8.7%) | $0 |
| 5-Person Families | 0 (0.0%) | $0 |
| 6-Person Families | 1 (4.3%) | $0 |
| 7+ Person Families | 0 (0.0%) | $0 |
| Total | 23 (100.0%) | $0 |
Family Income by Number of Earners in Kilkenny
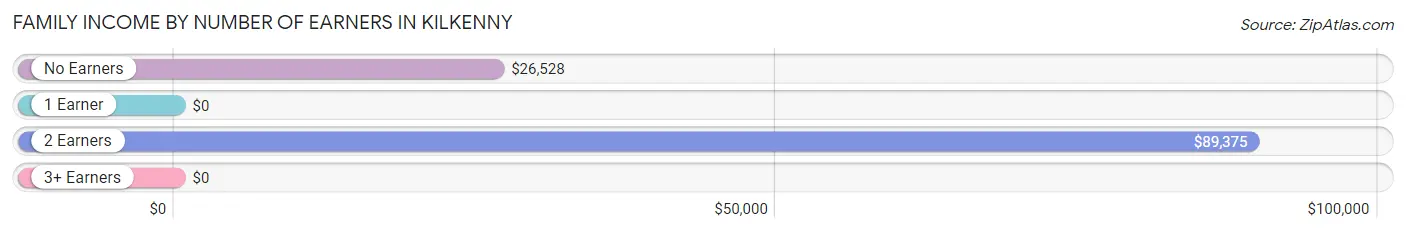
| Number of Earners | # Families | Median Income |
| No Earners | 11 (47.8%) | $26,528 |
| 1 Earner | 2 (8.7%) | $0 |
| 2 Earners | 7 (30.4%) | $89,375 |
| 3+ Earners | 3 (13.0%) | $0 |
| Total | 23 (100.0%) | $0 |
Household Income in Kilkenny
Household Income Brackets in Kilkenny
With 12 households falling in the category, the $25,000 to $34,999 income range is the most frequent in Kilkenny, accounting for 29.3% of all households.
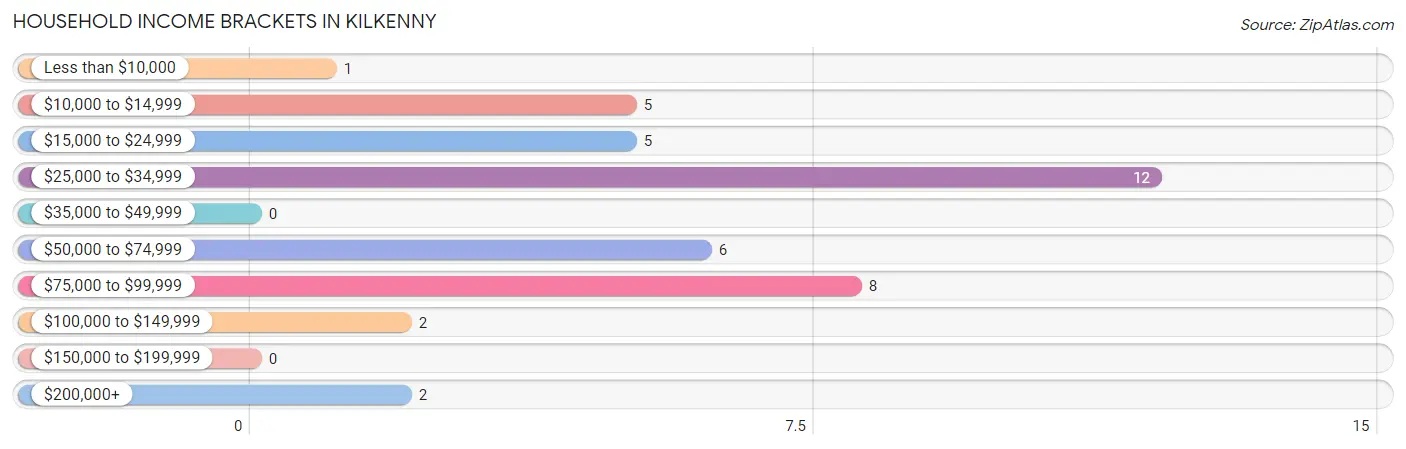
| Income Bracket | # Households | % Households |
| Less than $10,000 | 1 | 2.4% |
| $10,000 to $14,999 | 5 | 12.2% |
| $15,000 to $24,999 | 5 | 12.2% |
| $25,000 to $34,999 | 12 | 29.3% |
| $35,000 to $49,999 | 0 | 0.0% |
| $50,000 to $74,999 | 6 | 14.6% |
| $75,000 to $99,999 | 8 | 19.5% |
| $100,000 to $149,999 | 2 | 4.9% |
| $150,000 to $199,999 | 0 | 0.0% |
| $200,000+ | 2 | 4.9% |
Household Income by Householder Age in Kilkenny
The median household income in Kilkenny is $0, with the highest median household income of $91,250 found in the 25 to 44 years age bracket for the primary householder. A total of 4 households (9.8%) fall into this category. Meanwhile, the 15 to 24 years age bracket for the primary householder has the lowest median household income of $0, with 2 households (4.9%) in this group.
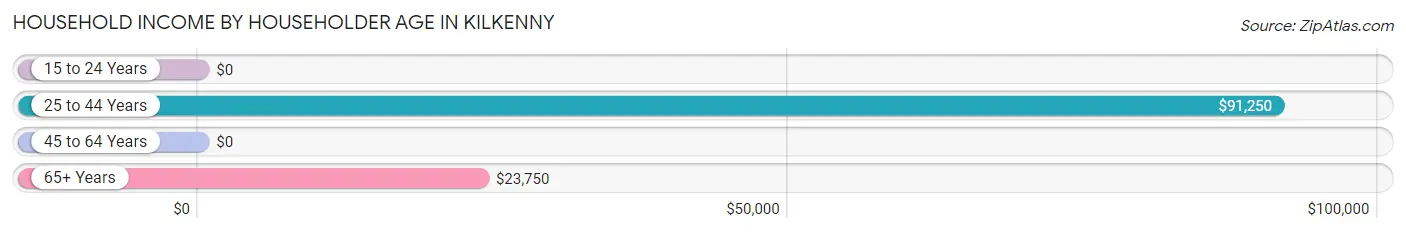
| Income Bracket | # Households | Median Income |
| 15 to 24 Years | 2 (4.9%) | $0 |
| 25 to 44 Years | 4 (9.8%) | $91,250 |
| 45 to 64 Years | 23 (56.1%) | $0 |
| 65+ Years | 12 (29.3%) | $23,750 |
| Total | 41 (100.0%) | $0 |
Poverty in Kilkenny
Income Below Poverty by Sex and Age in Kilkenny
With 5.7% poverty level for males and 14.6% for females among the residents of Kilkenny, 55 to 64 year old males and 18 to 24 year old females are the most vulnerable to poverty, with 2 males (33.3%) and 2 females (100.0%) in their respective age groups living below the poverty level.
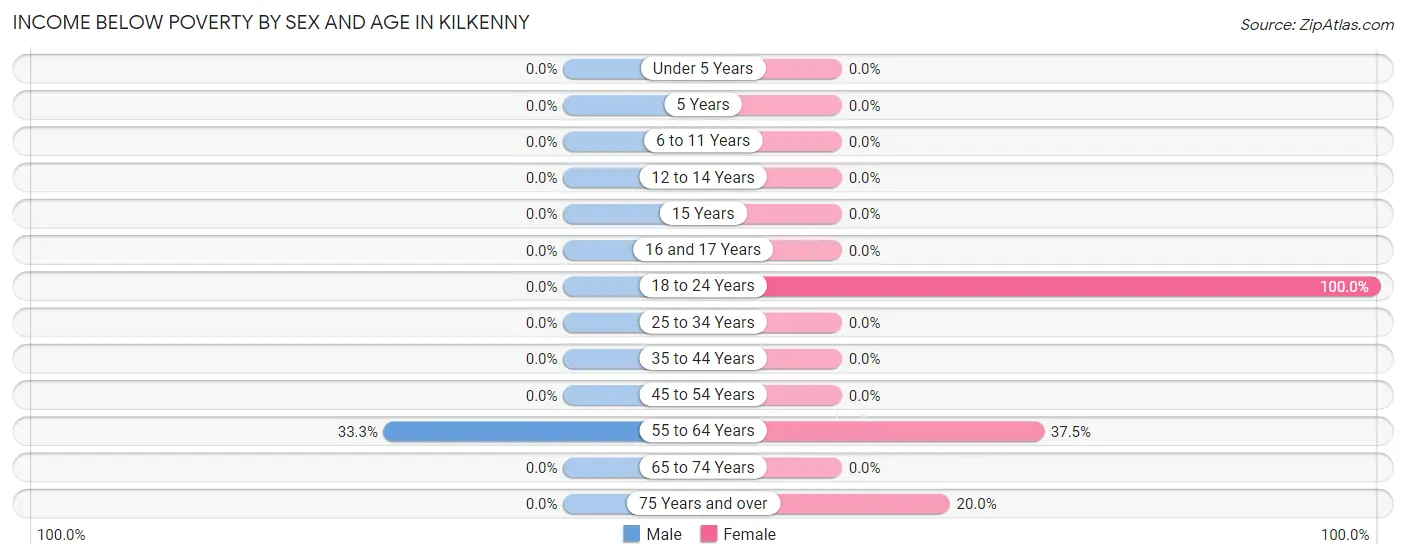
| Age Bracket | Male | Female |
| Under 5 Years | 0 (0.0%) | 0 (0.0%) |
| 5 Years | 0 (0.0%) | 0 (0.0%) |
| 6 to 11 Years | 0 (0.0%) | 0 (0.0%) |
| 12 to 14 Years | 0 (0.0%) | 0 (0.0%) |
| 15 Years | 0 (0.0%) | 0 (0.0%) |
| 16 and 17 Years | 0 (0.0%) | 0 (0.0%) |
| 18 to 24 Years | 0 (0.0%) | 2 (100.0%) |
| 25 to 34 Years | 0 (0.0%) | 0 (0.0%) |
| 35 to 44 Years | 0 (0.0%) | 0 (0.0%) |
| 45 to 54 Years | 0 (0.0%) | 0 (0.0%) |
| 55 to 64 Years | 2 (33.3%) | 3 (37.5%) |
| 65 to 74 Years | 0 (0.0%) | 0 (0.0%) |
| 75 Years and over | 0 (0.0%) | 1 (20.0%) |
| Total | 2 (5.7%) | 6 (14.6%) |
Income Above Poverty by Sex and Age in Kilkenny
According to the poverty statistics in Kilkenny, males aged under 5 years and females aged under 5 years are the age groups that are most secure financially, with 100.0% of males and 100.0% of females in these age groups living above the poverty line.
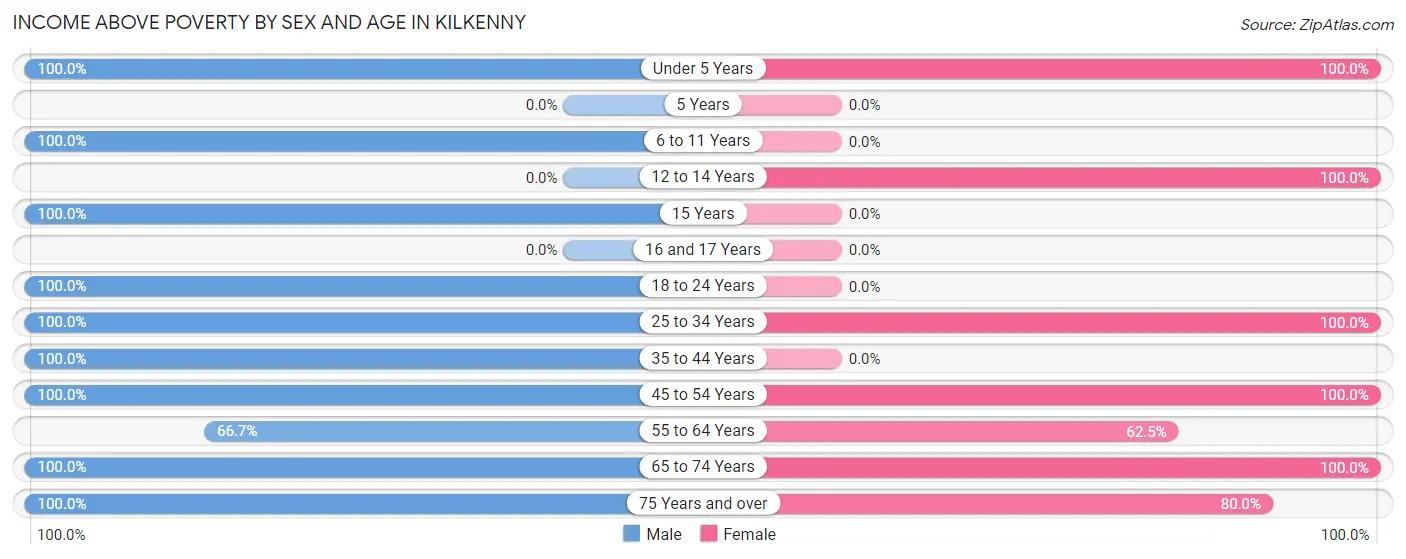
| Age Bracket | Male | Female |
| Under 5 Years | 2 (100.0%) | 4 (100.0%) |
| 5 Years | 0 (0.0%) | 0 (0.0%) |
| 6 to 11 Years | 2 (100.0%) | 0 (0.0%) |
| 12 to 14 Years | 0 (0.0%) | 2 (100.0%) |
| 15 Years | 6 (100.0%) | 0 (0.0%) |
| 16 and 17 Years | 0 (0.0%) | 0 (0.0%) |
| 18 to 24 Years | 2 (100.0%) | 0 (0.0%) |
| 25 to 34 Years | 6 (100.0%) | 4 (100.0%) |
| 35 to 44 Years | 2 (100.0%) | 0 (0.0%) |
| 45 to 54 Years | 4 (100.0%) | 11 (100.0%) |
| 55 to 64 Years | 4 (66.7%) | 5 (62.5%) |
| 65 to 74 Years | 4 (100.0%) | 5 (100.0%) |
| 75 Years and over | 1 (100.0%) | 4 (80.0%) |
| Total | 33 (94.3%) | 35 (85.4%) |
Income Below Poverty Among Married-Couple Families in Kilkenny
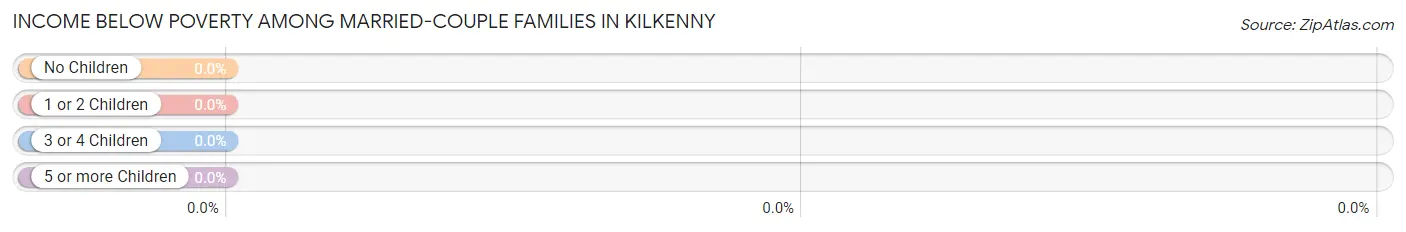
| Children | Above Poverty | Below Poverty |
| No Children | 12 (100.0%) | 0 (0.0%) |
| 1 or 2 Children | 3 (100.0%) | 0 (0.0%) |
| 3 or 4 Children | 0 (0.0%) | 0 (0.0%) |
| 5 or more Children | 0 (0.0%) | 0 (0.0%) |
| Total | 15 (100.0%) | 0 (0.0%) |
Income Below Poverty Among Single-Parent Households in Kilkenny
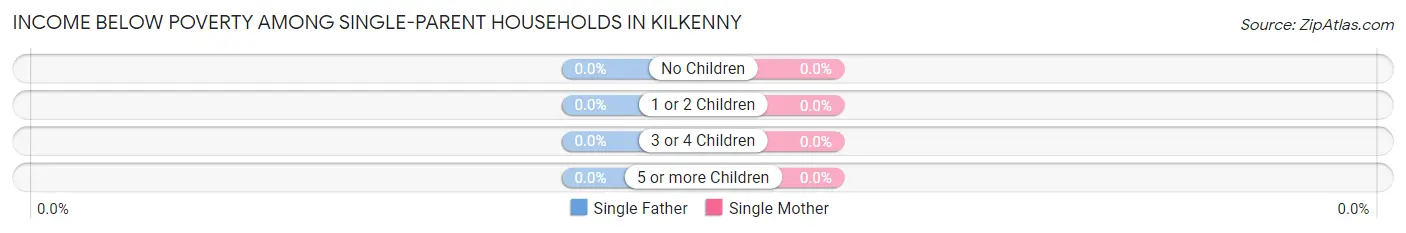
| Children | Single Father | Single Mother |
| No Children | 0 (0.0%) | 0 (0.0%) |
| 1 or 2 Children | 0 (0.0%) | 0 (0.0%) |
| 3 or 4 Children | 0 (0.0%) | 0 (0.0%) |
| 5 or more Children | 0 (0.0%) | 0 (0.0%) |
| Total | 0 (0.0%) | 0 (0.0%) |
Income Below Poverty Among Married-Couple vs Single-Parent Households in Kilkenny
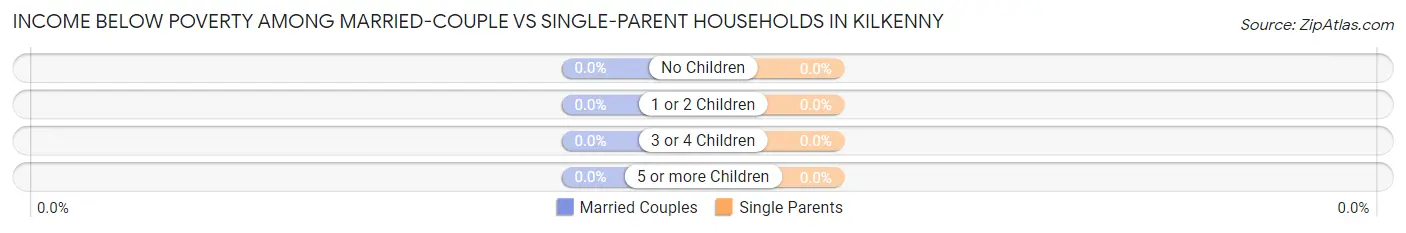
| Children | Married-Couple Families | Single-Parent Households |
| No Children | 0 (0.0%) | 0 (0.0%) |
| 1 or 2 Children | 0 (0.0%) | 0 (0.0%) |
| 3 or 4 Children | 0 (0.0%) | 0 (0.0%) |
| 5 or more Children | 0 (0.0%) | 0 (0.0%) |
| Total | 0 (0.0%) | 0 (0.0%) |
Race in Kilkenny
The most populous races in Kilkenny are White / Caucasian (75 | 98.7%), Hispanic or Latino (2 | 2.6%), and Two or more Races (1 | 1.3%).
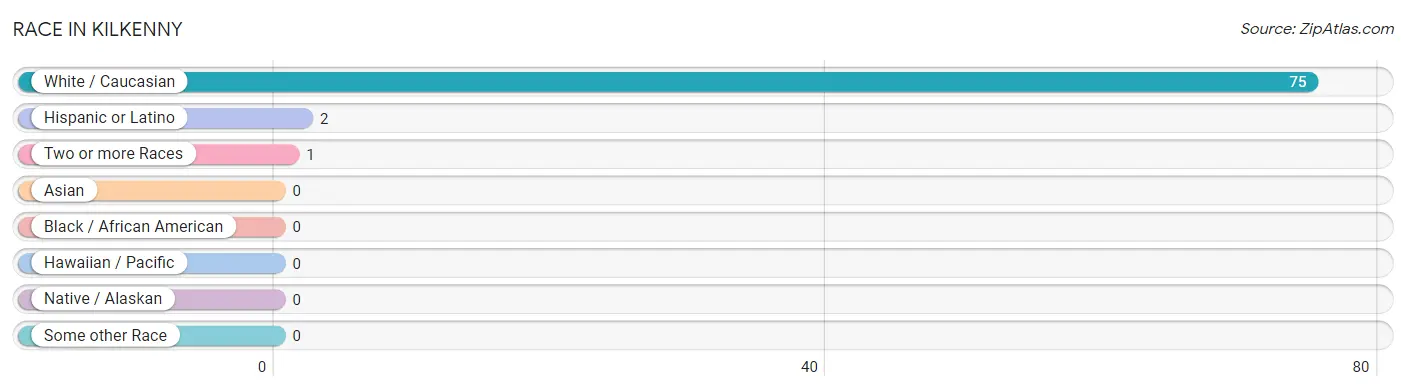
| Race | # Population | % Population |
| Asian | 0 | 0.0% |
| Black / African American | 0 | 0.0% |
| Hawaiian / Pacific | 0 | 0.0% |
| Hispanic or Latino | 2 | 2.6% |
| Native / Alaskan | 0 | 0.0% |
| White / Caucasian | 75 | 98.7% |
| Two or more Races | 1 | 1.3% |
| Some other Race | 0 | 0.0% |
| Total | 76 | 100.0% |
Ancestry in Kilkenny
The most populous ancestries reported in Kilkenny are German (48 | 63.2%), Irish (24 | 31.6%), Norwegian (7 | 9.2%), Scottish (7 | 9.2%), and Czech (6 | 7.9%), together accounting for 121.1% of all Kilkenny residents.
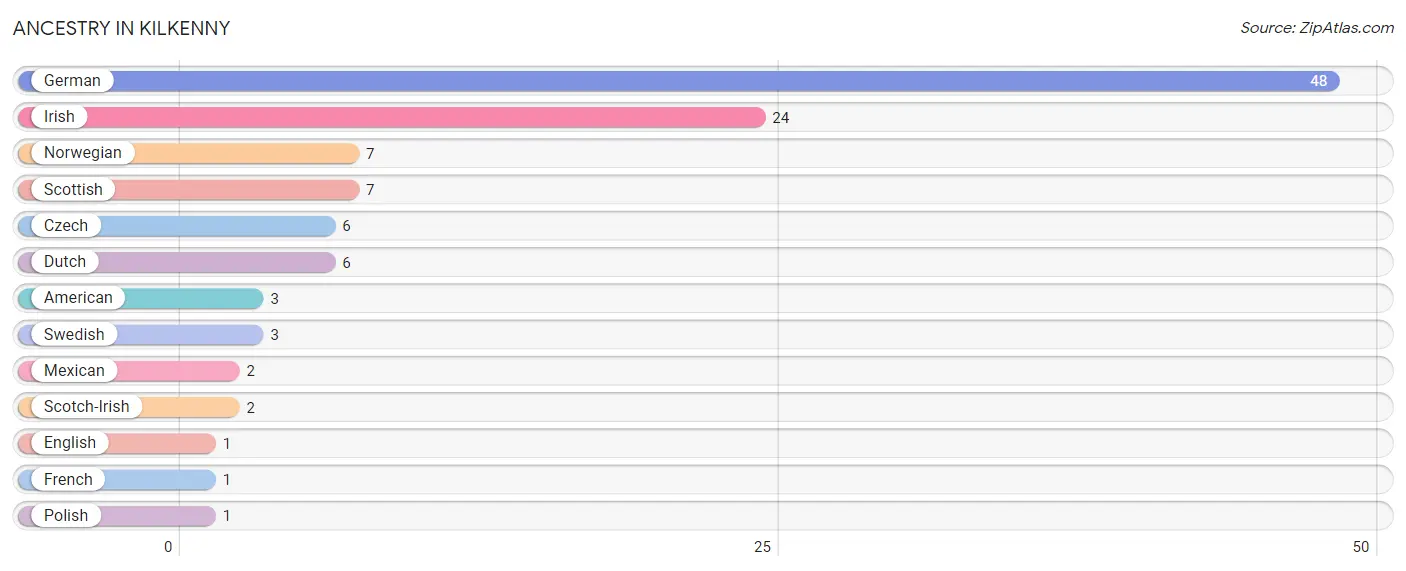
| Ancestry | # Population | % Population |
| American | 3 | 4.0% |
| Czech | 6 | 7.9% |
| Dutch | 6 | 7.9% |
| English | 1 | 1.3% |
| French | 1 | 1.3% |
| German | 48 | 63.2% |
| Irish | 24 | 31.6% |
| Mexican | 2 | 2.6% |
| Norwegian | 7 | 9.2% |
| Polish | 1 | 1.3% |
| Scotch-Irish | 2 | 2.6% |
| Scottish | 7 | 9.2% |
| Swedish | 3 | 4.0% | View All 13 Rows |
Immigrants in Kilkenny

| Immigration Origin | # Population | % Population | View All 0 Rows |
Sex and Age in Kilkenny
Sex and Age in Kilkenny
The most populous age groups in Kilkenny are 15 to 19 Years (6 | 17.1%) for men and 50 to 54 Years (9 | 22.0%) for women.
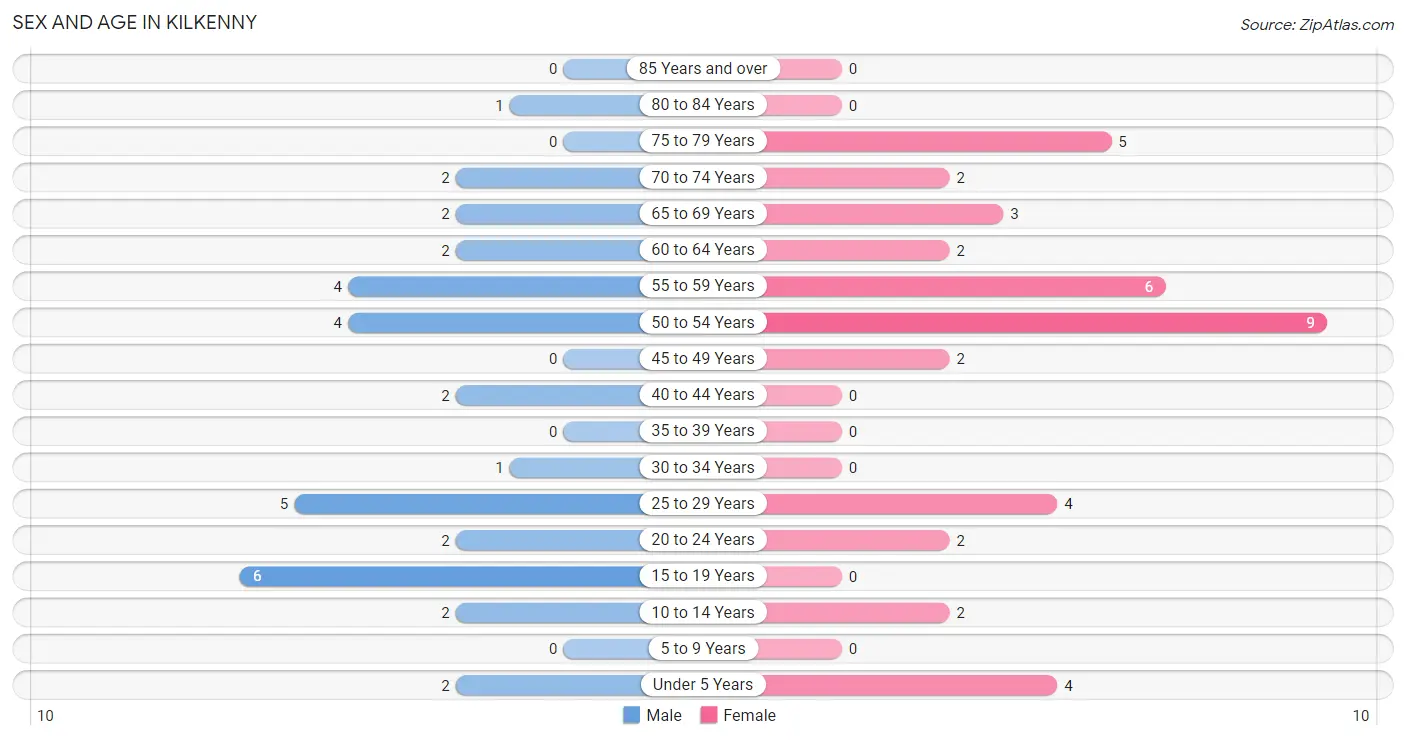
| Age Bracket | Male | Female |
| Under 5 Years | 2 (5.7%) | 4 (9.8%) |
| 5 to 9 Years | 0 (0.0%) | 0 (0.0%) |
| 10 to 14 Years | 2 (5.7%) | 2 (4.9%) |
| 15 to 19 Years | 6 (17.1%) | 0 (0.0%) |
| 20 to 24 Years | 2 (5.7%) | 2 (4.9%) |
| 25 to 29 Years | 5 (14.3%) | 4 (9.8%) |
| 30 to 34 Years | 1 (2.9%) | 0 (0.0%) |
| 35 to 39 Years | 0 (0.0%) | 0 (0.0%) |
| 40 to 44 Years | 2 (5.7%) | 0 (0.0%) |
| 45 to 49 Years | 0 (0.0%) | 2 (4.9%) |
| 50 to 54 Years | 4 (11.4%) | 9 (22.0%) |
| 55 to 59 Years | 4 (11.4%) | 6 (14.6%) |
| 60 to 64 Years | 2 (5.7%) | 2 (4.9%) |
| 65 to 69 Years | 2 (5.7%) | 3 (7.3%) |
| 70 to 74 Years | 2 (5.7%) | 2 (4.9%) |
| 75 to 79 Years | 0 (0.0%) | 5 (12.2%) |
| 80 to 84 Years | 1 (2.9%) | 0 (0.0%) |
| 85 Years and over | 0 (0.0%) | 0 (0.0%) |
| Total | 35 (100.0%) | 41 (100.0%) |
Families and Households in Kilkenny
Median Family Size in Kilkenny
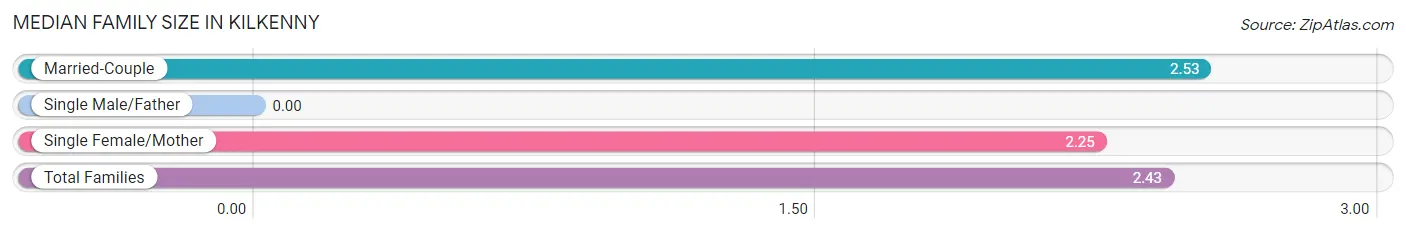
| Family Type | # Families | Family Size |
| Married-Couple | 15 (65.2%) | 2.53 |
| Single Male/Father | 0 (0.0%) | - |
| Single Female/Mother | 8 (34.8%) | 2.25 |
| Total Families | 23 (100.0%) | 2.43 |
Median Household Size in Kilkenny
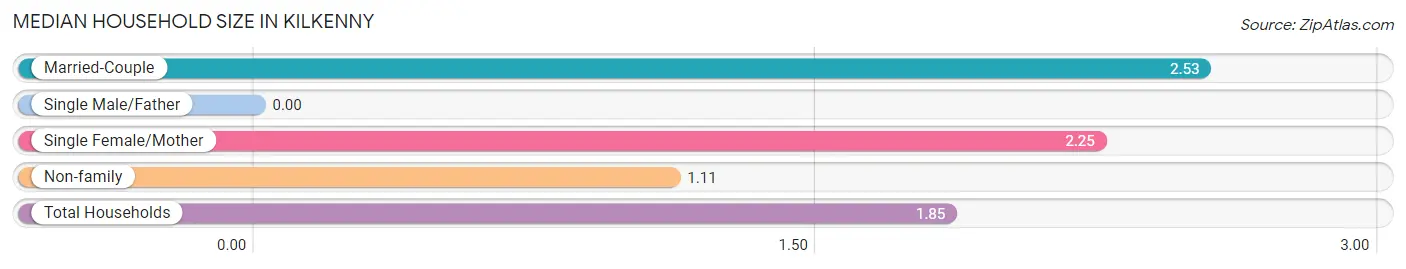
| Household Type | # Households | Household Size |
| Married-Couple | 15 (36.6%) | 2.53 |
| Single Male/Father | 0 (0.0%) | - |
| Single Female/Mother | 8 (19.5%) | 2.25 |
| Non-family | 18 (43.9%) | 1.11 |
| Total Households | 41 (100.0%) | 1.85 |
Household Size by Marriage Status in Kilkenny
Out of a total of 41 households in Kilkenny, 23 (56.1%) are family households, while 18 (43.9%) are nonfamily households. The most numerous type of family households are 2-person households, comprising 10, and the most common type of nonfamily households are 1-person households, comprising 16.
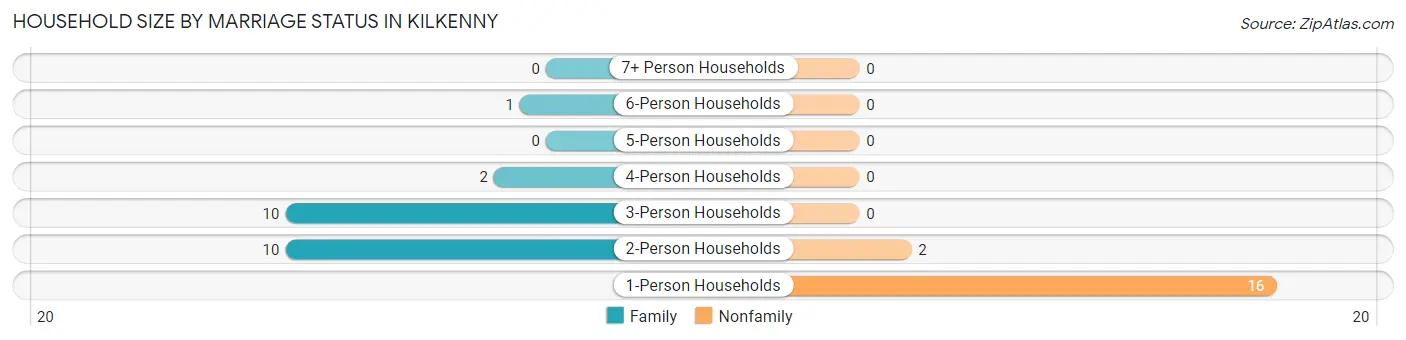
| Household Size | Family Households | Nonfamily Households |
| 1-Person Households | - | 16 (39.0%) |
| 2-Person Households | 10 (24.4%) | 2 (4.9%) |
| 3-Person Households | 10 (24.4%) | 0 (0.0%) |
| 4-Person Households | 2 (4.9%) | 0 (0.0%) |
| 5-Person Households | 0 (0.0%) | 0 (0.0%) |
| 6-Person Households | 1 (2.4%) | 0 (0.0%) |
| 7+ Person Households | 0 (0.0%) | 0 (0.0%) |
| Total | 23 (56.1%) | 18 (43.9%) |
Female Fertility in Kilkenny
Fertility by Age in Kilkenny
Average fertility rate in Kilkenny is 250.0 births per 1,000 women. Women in the age bracket of 20 to 34 years have the highest fertility rate with 333.0 births per 1,000 women. Women in the age bracket of 20 to 34 years acount for 100.0% of all women with births.
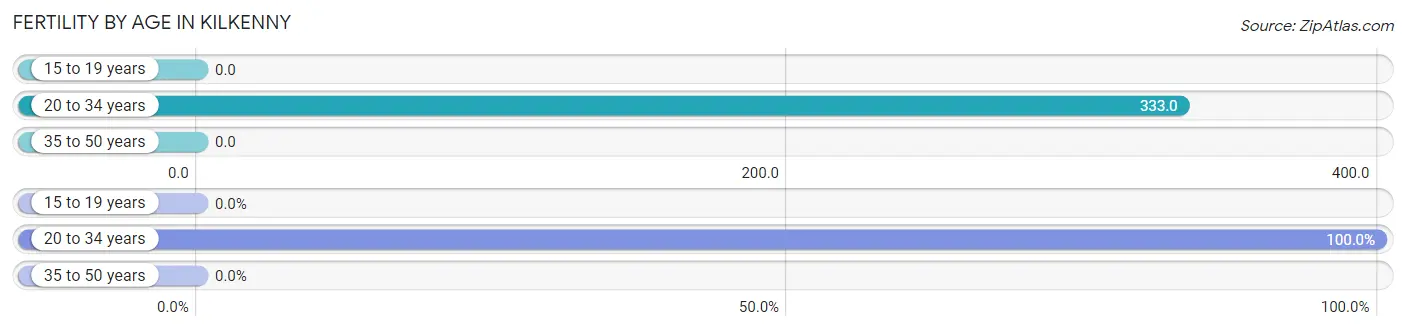
| Age Bracket | Women with Births | Births / 1,000 Women |
| 15 to 19 years | 0 (0.0%) | 0.0 |
| 20 to 34 years | 2 (100.0%) | 333.0 |
| 35 to 50 years | 0 (0.0%) | 0.0 |
| Total | 2 (100.0%) | 250.0 |
Fertility by Age by Marriage Status in Kilkenny
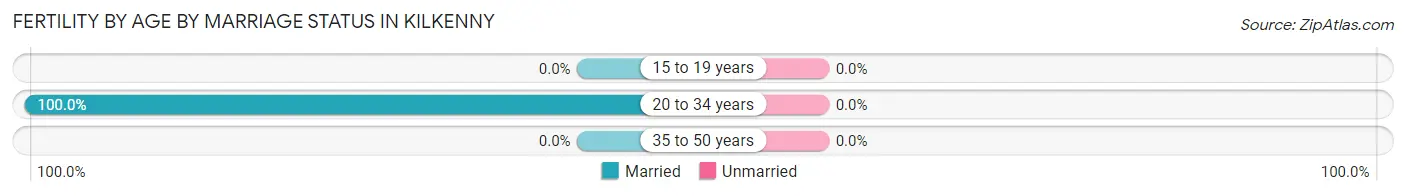
| Age Bracket | Married | Unmarried |
| 15 to 19 years | 0 (0.0%) | 0 (0.0%) |
| 20 to 34 years | 2 (100.0%) | 0 (0.0%) |
| 35 to 50 years | 0 (0.0%) | 0 (0.0%) |
| Total | 2 (100.0%) | 0 (0.0%) |
Fertility by Education in Kilkenny
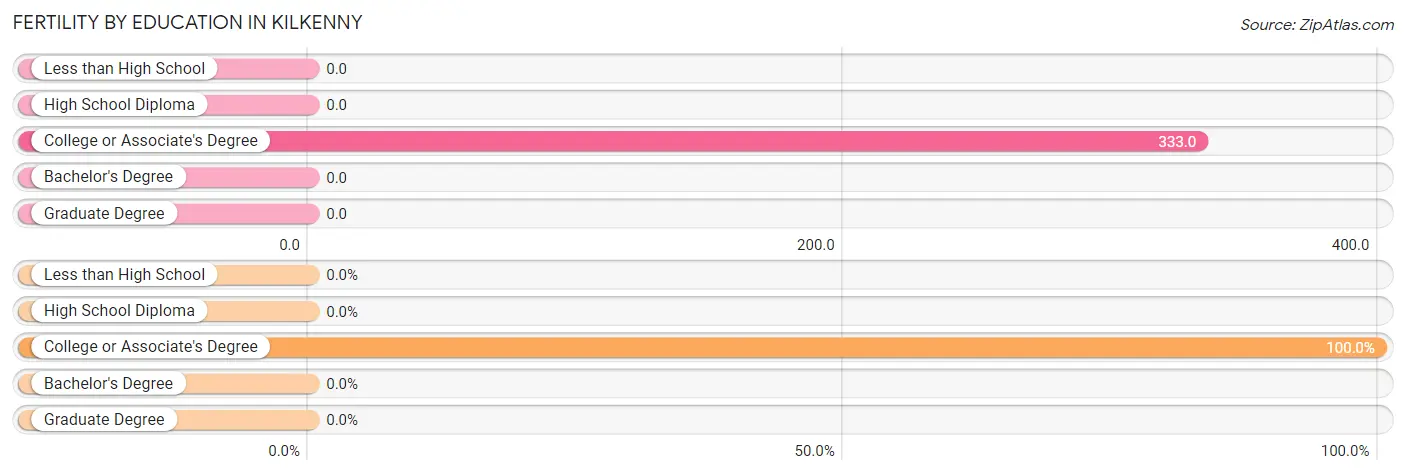
| Educational Attainment | Women with Births | Births / 1,000 Women |
| Less than High School | 0 (0.0%) | 0.0 |
| High School Diploma | 0 (0.0%) | 0.0 |
| College or Associate's Degree | 2 (100.0%) | 333.0 |
| Bachelor's Degree | 0 (0.0%) | 0.0 |
| Graduate Degree | 0 (0.0%) | 0.0 |
| Total | 2 (100.0%) | 250.0 |
Fertility by Education by Marriage Status in Kilkenny
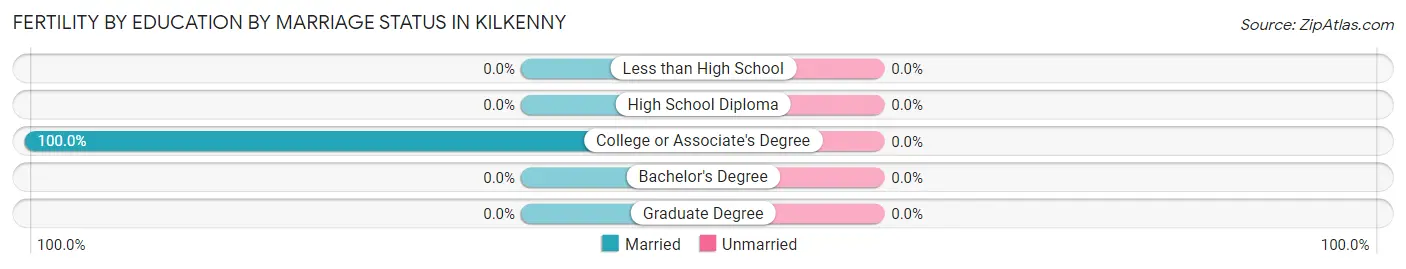
| Educational Attainment | Married | Unmarried |
| Less than High School | 0 (0.0%) | 0 (0.0%) |
| High School Diploma | 0 (0.0%) | 0 (0.0%) |
| College or Associate's Degree | 2 (100.0%) | 0 (0.0%) |
| Bachelor's Degree | 0 (0.0%) | 0 (0.0%) |
| Graduate Degree | 0 (0.0%) | 0 (0.0%) |
| Total | 2 (100.0%) | 0 (0.0%) |
Employment Characteristics in Kilkenny
Employment by Class of Employer in Kilkenny
Among the 31 employed individuals in Kilkenny, private company employees (24 | 77.4%), local government employees (3 | 9.7%), and state government employees (3 | 9.7%) make up the most common classes of employment.
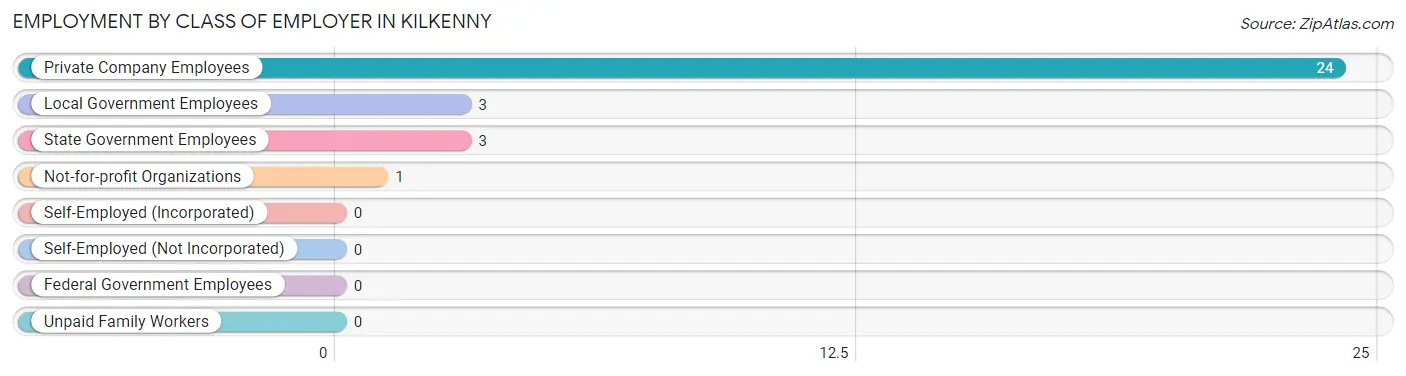
| Employer Class | # Employees | % Employees |
| Private Company Employees | 24 | 77.4% |
| Self-Employed (Incorporated) | 0 | 0.0% |
| Self-Employed (Not Incorporated) | 0 | 0.0% |
| Not-for-profit Organizations | 1 | 3.2% |
| Local Government Employees | 3 | 9.7% |
| State Government Employees | 3 | 9.7% |
| Federal Government Employees | 0 | 0.0% |
| Unpaid Family Workers | 0 | 0.0% |
| Total | 31 | 100.0% |
Employment Status by Age in Kilkenny
According to the labor force statistics for Kilkenny, out of the total population over 16 years of age (60), 53.3% or 32 individuals are in the labor force, with 3.1% or 1 of them unemployed. The age group with the highest labor force participation rate is 20 to 24 years, with 100.0% or 4 individuals in the labor force. Within the labor force, the 60 to 64 years age range has the highest percentage of unemployed individuals, with 25.0% or 1 of them being unemployed.
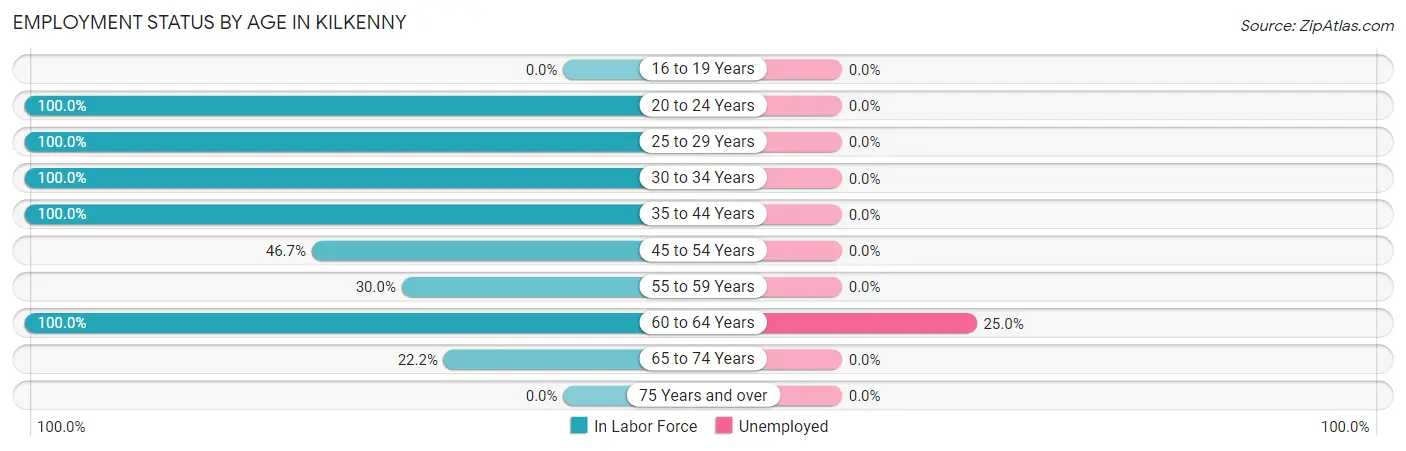
| Age Bracket | In Labor Force | Unemployed |
| 16 to 19 Years | 0 (0.0%) | 0 (0.0%) |
| 20 to 24 Years | 4 (100.0%) | 0 (0.0%) |
| 25 to 29 Years | 9 (100.0%) | 0 (0.0%) |
| 30 to 34 Years | 1 (100.0%) | 0 (0.0%) |
| 35 to 44 Years | 2 (100.0%) | 0 (0.0%) |
| 45 to 54 Years | 7 (46.7%) | 0 (0.0%) |
| 55 to 59 Years | 3 (30.0%) | 0 (0.0%) |
| 60 to 64 Years | 4 (100.0%) | 1 (25.0%) |
| 65 to 74 Years | 2 (22.2%) | 0 (0.0%) |
| 75 Years and over | 0 (0.0%) | 0 (0.0%) |
| Total | 32 (53.3%) | 1 (3.1%) |
Employment Status by Educational Attainment in Kilkenny
According to labor force statistics for Kilkenny, 63.4% of individuals (26) out of the total population between 25 and 64 years of age (41) are in the labor force, with 3.8% or 1 of them being unemployed. The group with the highest labor force participation rate are those with the educational attainment of high school diploma, with 81.8% or 9 individuals in the labor force. Within the labor force, individuals with high school diploma education have the highest percentage of unemployment, with 11.1% or 1 of them being unemployed.
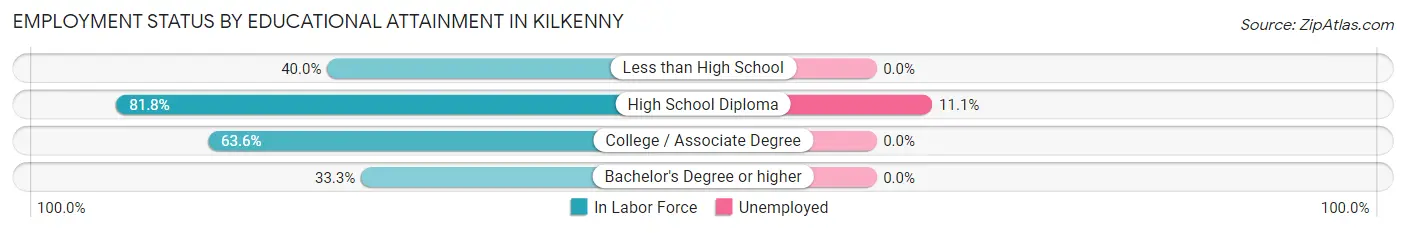
| Educational Attainment | In Labor Force | Unemployed |
| Less than High School | 2 (40.0%) | 0 (0.0%) |
| High School Diploma | 9 (81.8%) | 1 (11.1%) |
| College / Associate Degree | 14 (63.6%) | 0 (0.0%) |
| Bachelor's Degree or higher | 1 (33.3%) | 0 (0.0%) |
| Total | 26 (63.4%) | 2 (3.8%) |
Employment Occupations by Sex in Kilkenny
Management, Business, Science and Arts Occupations
The most common Management, Business, Science and Arts occupations in Kilkenny are Computers, Engineering & Science (4 | 12.9%), Computers & Mathematics (2 | 6.5%), Architecture & Engineering (2 | 6.5%), Community & Social Service (2 | 6.5%), and Education Instruction & Library (2 | 6.5%).
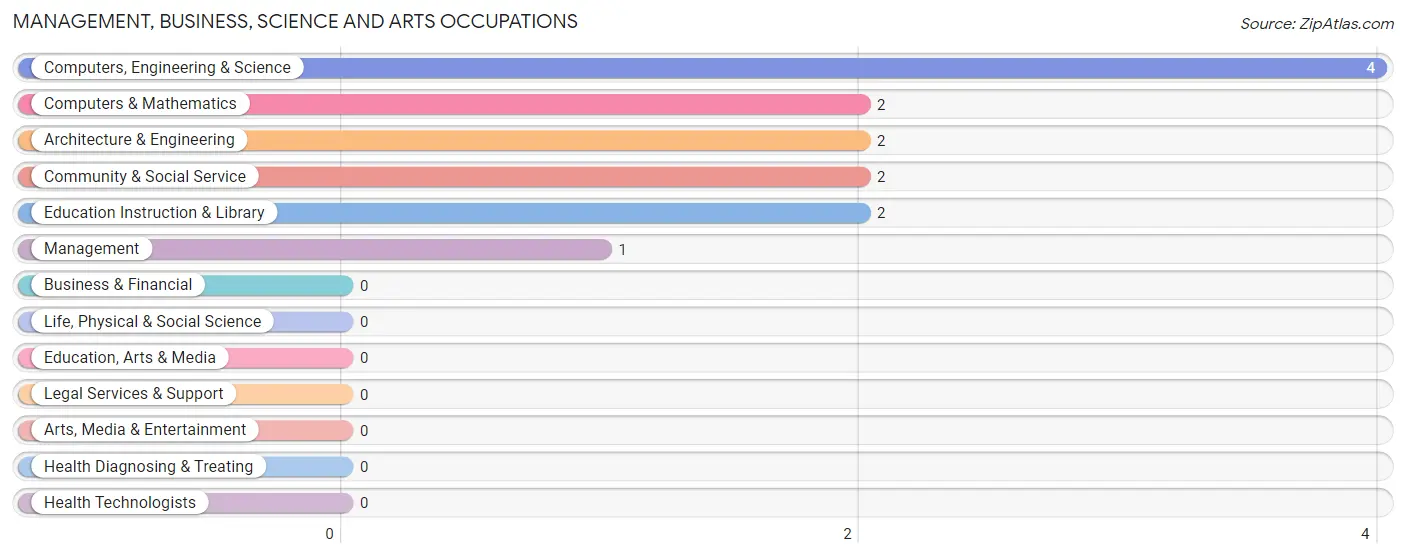
Management, Business, Science and Arts Occupations by Sex
Within the Management, Business, Science and Arts occupations in Kilkenny, the most male-oriented occupations are Computers, Engineering & Science (100.0%), Computers & Mathematics (100.0%), and Architecture & Engineering (100.0%), while the most female-oriented occupations are Management (100.0%), Community & Social Service (100.0%), and Education Instruction & Library (100.0%).
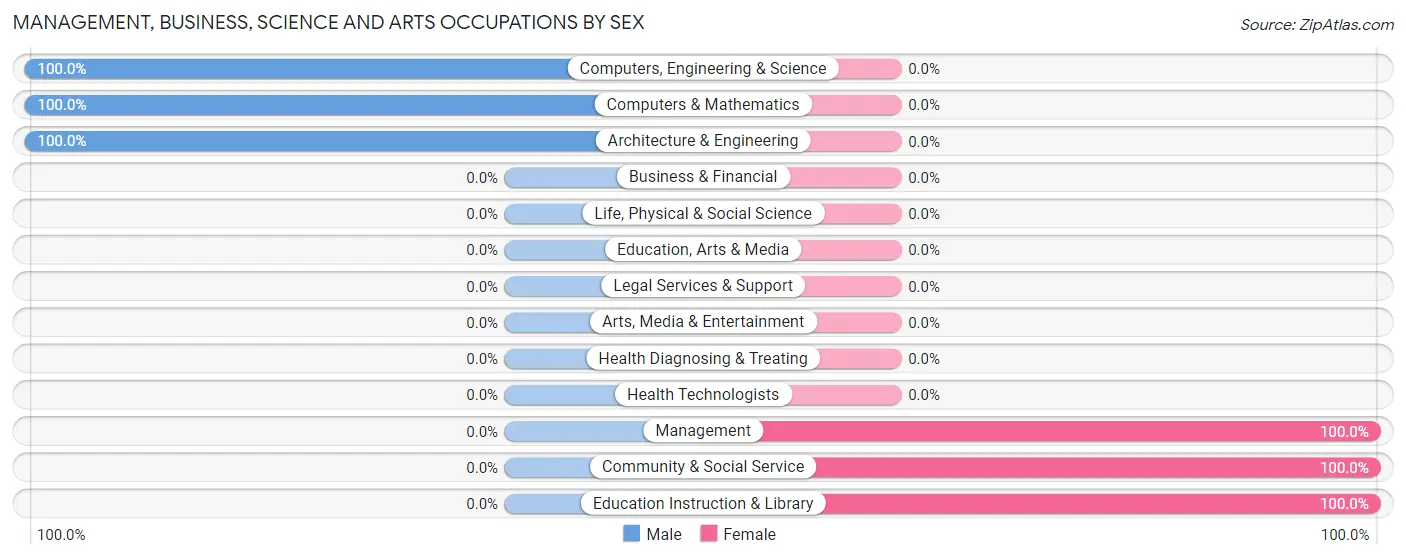
| Occupation | Male | Female |
| Management | 0 (0.0%) | 1 (100.0%) |
| Business & Financial | 0 (0.0%) | 0 (0.0%) |
| Computers, Engineering & Science | 4 (100.0%) | 0 (0.0%) |
| Computers & Mathematics | 2 (100.0%) | 0 (0.0%) |
| Architecture & Engineering | 2 (100.0%) | 0 (0.0%) |
| Life, Physical & Social Science | 0 (0.0%) | 0 (0.0%) |
| Community & Social Service | 0 (0.0%) | 2 (100.0%) |
| Education, Arts & Media | 0 (0.0%) | 0 (0.0%) |
| Legal Services & Support | 0 (0.0%) | 0 (0.0%) |
| Education Instruction & Library | 0 (0.0%) | 2 (100.0%) |
| Arts, Media & Entertainment | 0 (0.0%) | 0 (0.0%) |
| Health Diagnosing & Treating | 0 (0.0%) | 0 (0.0%) |
| Health Technologists | 0 (0.0%) | 0 (0.0%) |
| Total (Category) | 4 (57.1%) | 3 (42.9%) |
| Total (Overall) | 18 (58.1%) | 13 (41.9%) |
Services Occupations
The most common Services occupations in Kilkenny are Healthcare Support (2 | 6.5%), Personal Care & Service (2 | 6.5%), Security & Protection (1 | 3.2%), Law Enforcement (1 | 3.2%), and Cleaning & Maintenance (1 | 3.2%).
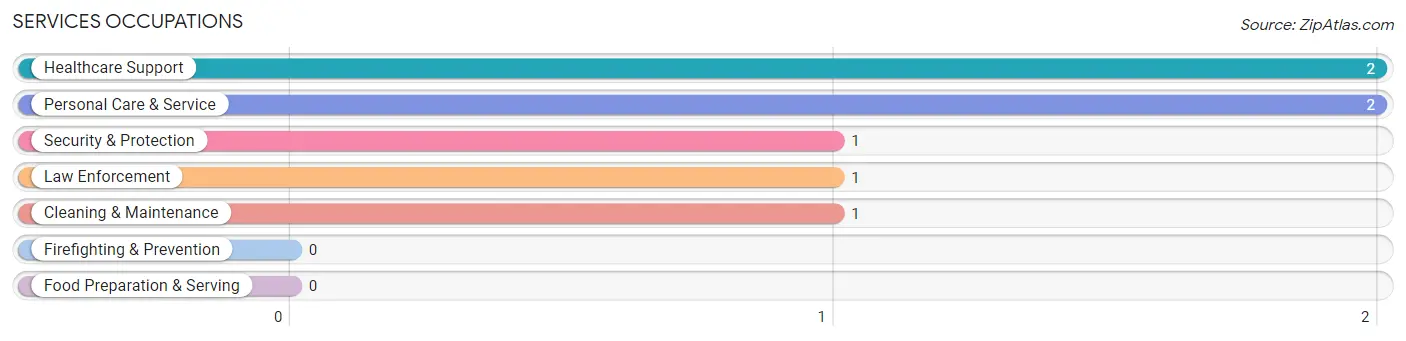
Services Occupations by Sex
Within the Services occupations in Kilkenny, the most male-oriented occupations are Healthcare Support (100.0%), and Cleaning & Maintenance (100.0%), while the most female-oriented occupations are Security & Protection (100.0%), Law Enforcement (100.0%), and Personal Care & Service (100.0%).
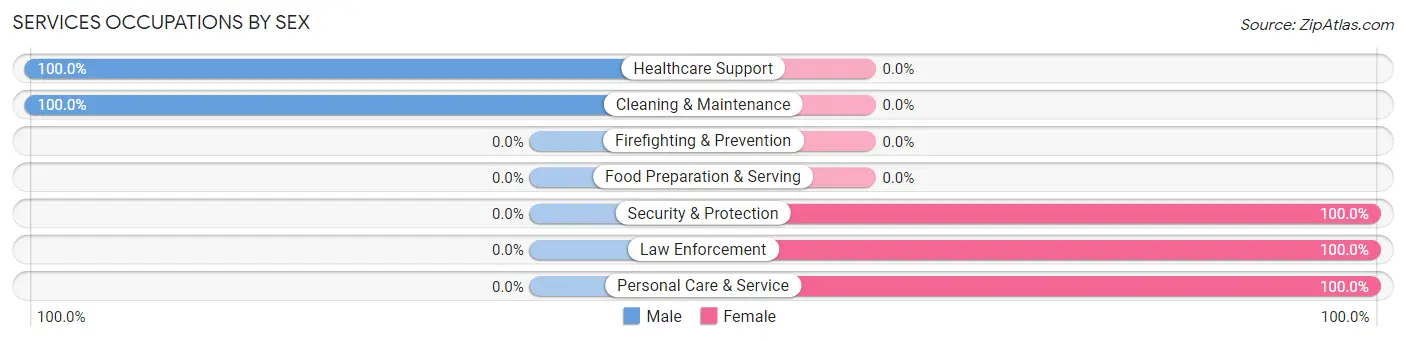
| Occupation | Male | Female |
| Healthcare Support | 2 (100.0%) | 0 (0.0%) |
| Security & Protection | 0 (0.0%) | 1 (100.0%) |
| Firefighting & Prevention | 0 (0.0%) | 0 (0.0%) |
| Law Enforcement | 0 (0.0%) | 1 (100.0%) |
| Food Preparation & Serving | 0 (0.0%) | 0 (0.0%) |
| Cleaning & Maintenance | 1 (100.0%) | 0 (0.0%) |
| Personal Care & Service | 0 (0.0%) | 2 (100.0%) |
| Total (Category) | 3 (50.0%) | 3 (50.0%) |
| Total (Overall) | 18 (58.1%) | 13 (41.9%) |
Sales and Office Occupations
The most common Sales and Office occupations in Kilkenny are , and Office & Administration (6 | 19.4%).

Sales and Office Occupations by Sex
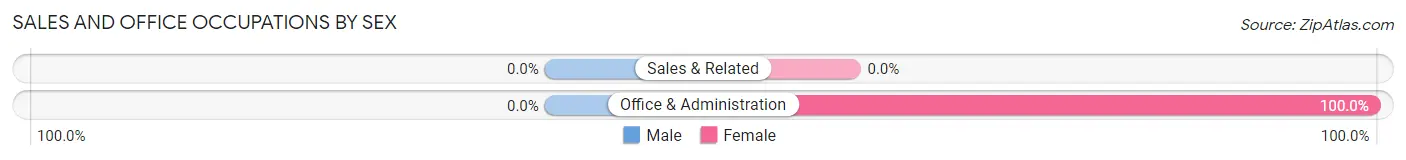
| Occupation | Male | Female |
| Sales & Related | 0 (0.0%) | 0 (0.0%) |
| Office & Administration | 0 (0.0%) | 6 (100.0%) |
| Total (Category) | 0 (0.0%) | 6 (100.0%) |
| Total (Overall) | 18 (58.1%) | 13 (41.9%) |
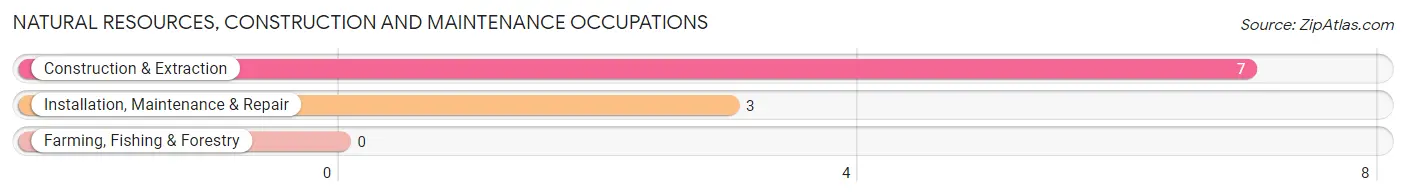
Natural Resources, Construction and Maintenance Occupations
The most common Natural Resources, Construction and Maintenance occupations in Kilkenny are Construction & Extraction (7 | 22.6%), and Installation, Maintenance & Repair (3 | 9.7%).
Natural Resources, Construction and Maintenance Occupations by Sex
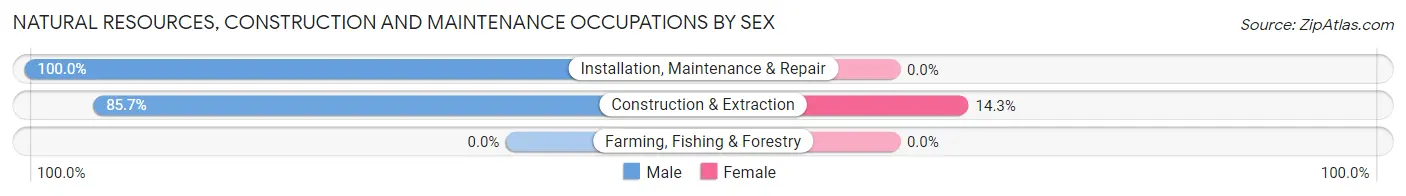
| Occupation | Male | Female |
| Farming, Fishing & Forestry | 0 (0.0%) | 0 (0.0%) |
| Construction & Extraction | 6 (85.7%) | 1 (14.3%) |
| Installation, Maintenance & Repair | 3 (100.0%) | 0 (0.0%) |
| Total (Category) | 9 (90.0%) | 1 (10.0%) |
| Total (Overall) | 18 (58.1%) | 13 (41.9%) |
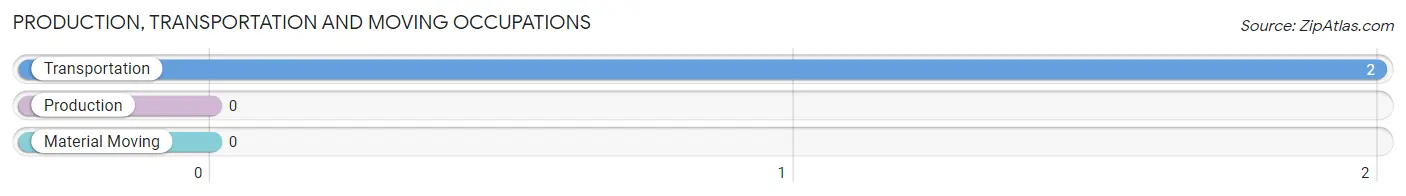
Production, Transportation and Moving Occupations
The most common Production, Transportation and Moving occupations in Kilkenny are , and Transportation (2 | 6.5%).
Production, Transportation and Moving Occupations by Sex
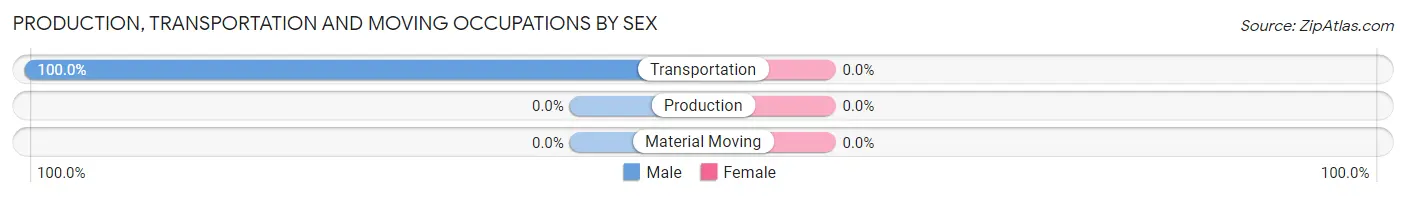
| Occupation | Male | Female |
| Production | 0 (0.0%) | 0 (0.0%) |
| Transportation | 2 (100.0%) | 0 (0.0%) |
| Material Moving | 0 (0.0%) | 0 (0.0%) |
| Total (Category) | 2 (100.0%) | 0 (0.0%) |
| Total (Overall) | 18 (58.1%) | 13 (41.9%) |
Employment Industries by Sex in Kilkenny
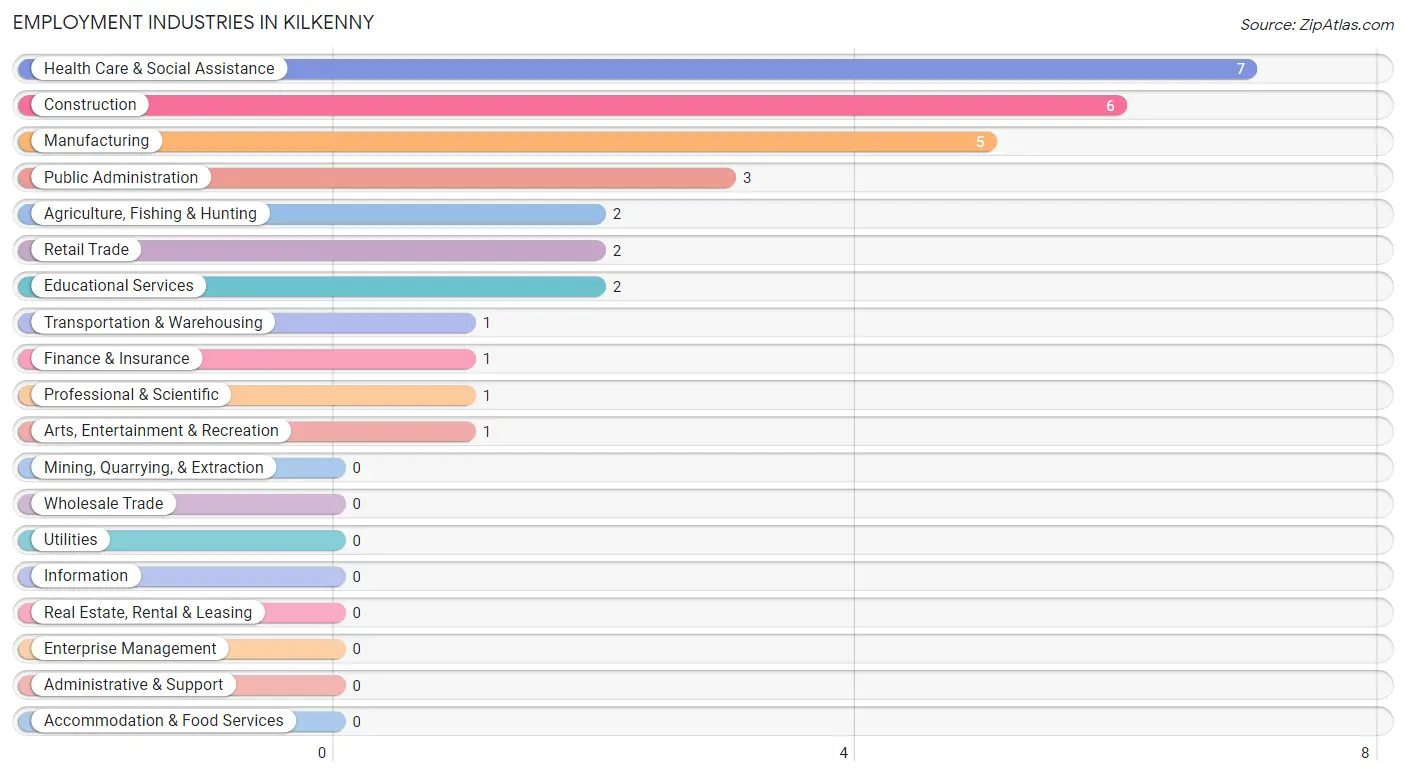
Employment Industries in Kilkenny
The major employment industries in Kilkenny include Health Care & Social Assistance (7 | 22.6%), Construction (6 | 19.4%), Manufacturing (5 | 16.1%), Public Administration (3 | 9.7%), and Agriculture, Fishing & Hunting (2 | 6.5%).
Employment Industries by Sex in Kilkenny
The Kilkenny industries that see more men than women are Manufacturing (100.0%), Retail Trade (100.0%), and Transportation & Warehousing (100.0%), whereas the industries that tend to have a higher number of women are Agriculture, Fishing & Hunting (100.0%), Finance & Insurance (100.0%), and Professional & Scientific (100.0%).
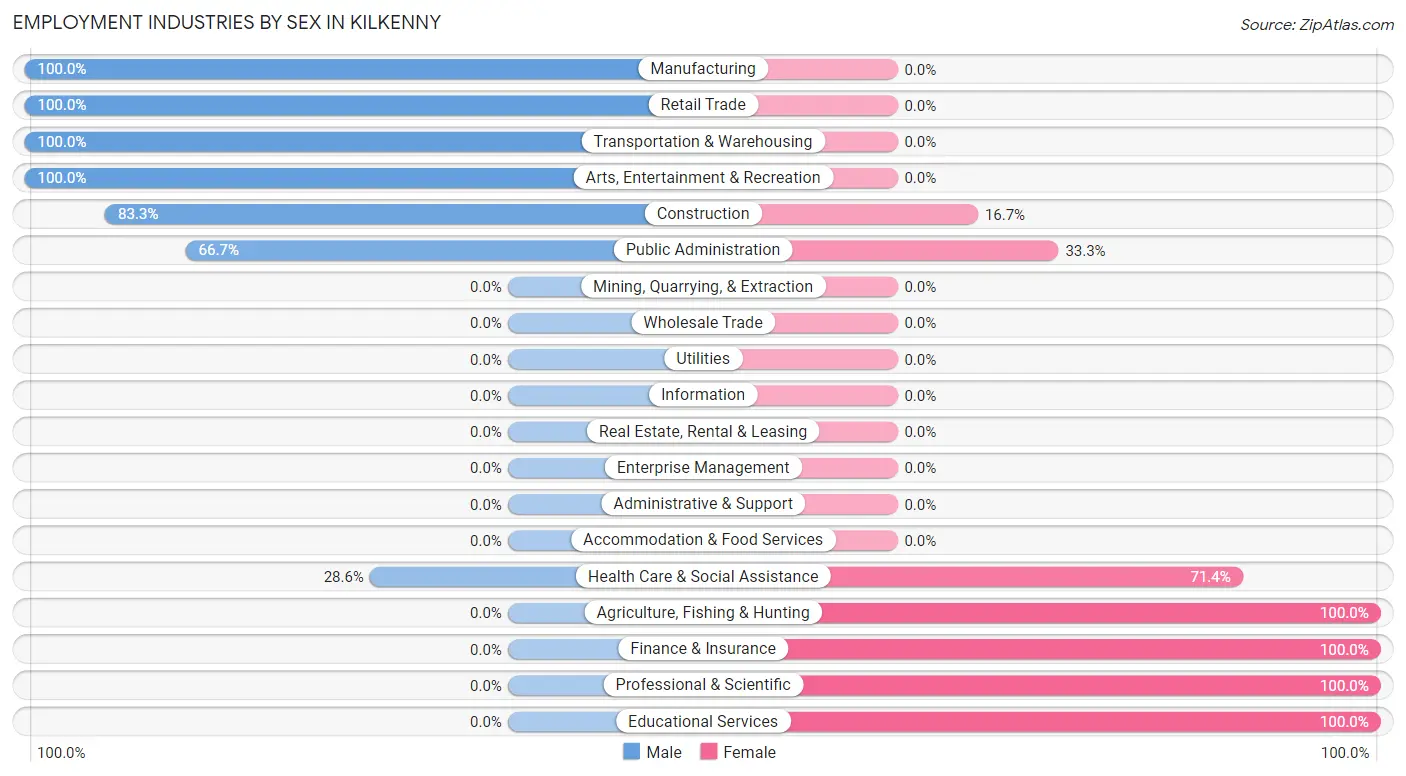
| Industry | Male | Female |
| Agriculture, Fishing & Hunting | 0 (0.0%) | 2 (100.0%) |
| Mining, Quarrying, & Extraction | 0 (0.0%) | 0 (0.0%) |
| Construction | 5 (83.3%) | 1 (16.7%) |
| Manufacturing | 5 (100.0%) | 0 (0.0%) |
| Wholesale Trade | 0 (0.0%) | 0 (0.0%) |
| Retail Trade | 2 (100.0%) | 0 (0.0%) |
| Transportation & Warehousing | 1 (100.0%) | 0 (0.0%) |
| Utilities | 0 (0.0%) | 0 (0.0%) |
| Information | 0 (0.0%) | 0 (0.0%) |
| Finance & Insurance | 0 (0.0%) | 1 (100.0%) |
| Real Estate, Rental & Leasing | 0 (0.0%) | 0 (0.0%) |
| Professional & Scientific | 0 (0.0%) | 1 (100.0%) |
| Enterprise Management | 0 (0.0%) | 0 (0.0%) |
| Administrative & Support | 0 (0.0%) | 0 (0.0%) |
| Educational Services | 0 (0.0%) | 2 (100.0%) |
| Health Care & Social Assistance | 2 (28.6%) | 5 (71.4%) |
| Arts, Entertainment & Recreation | 1 (100.0%) | 0 (0.0%) |
| Accommodation & Food Services | 0 (0.0%) | 0 (0.0%) |
| Public Administration | 2 (66.7%) | 1 (33.3%) |
| Total | 18 (58.1%) | 13 (41.9%) |
Education in Kilkenny
School Enrollment in Kilkenny
The most common levels of schooling among the 17 students in Kilkenny are high school (6 | 35.3%), nursery / preschool (4 | 23.5%), and middle school (4 | 23.5%).
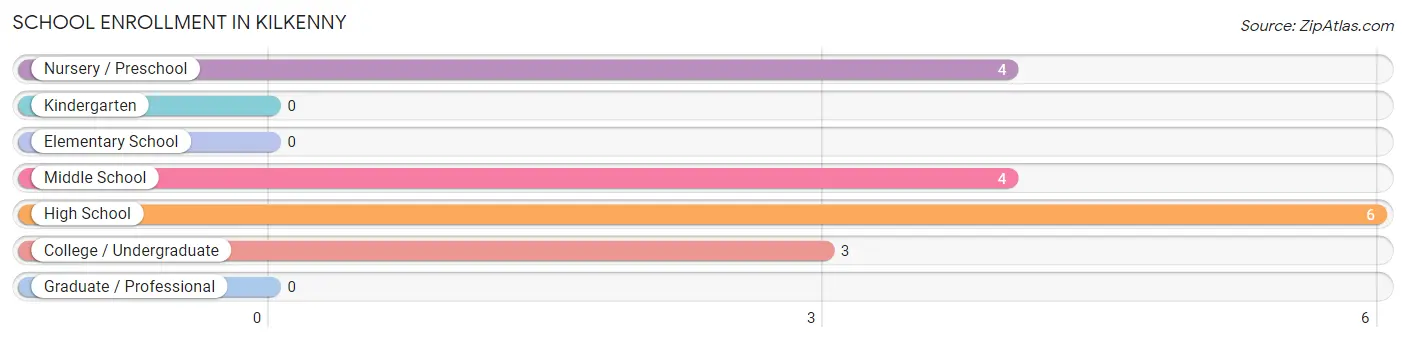
| School Level | # Students | % Students |
| Nursery / Preschool | 4 | 23.5% |
| Kindergarten | 0 | 0.0% |
| Elementary School | 0 | 0.0% |
| Middle School | 4 | 23.5% |
| High School | 6 | 35.3% |
| College / Undergraduate | 3 | 17.6% |
| Graduate / Professional | 0 | 0.0% |
| Total | 17 | 100.0% |
School Enrollment by Age by Funding Source in Kilkenny
Out of a total of 17 students who are enrolled in schools in Kilkenny, 1 (5.9%) attend a private institution, while the remaining 16 (94.1%) are enrolled in public schools. The age group of 35 years and over has the highest likelihood of being enrolled in private schools, with 1 (100.0% in the age bracket) enrolled. Conversely, the age group of 3 to 4 year olds has the lowest likelihood of being enrolled in a private school, with 4 (100.0% in the age bracket) attending a public institution.
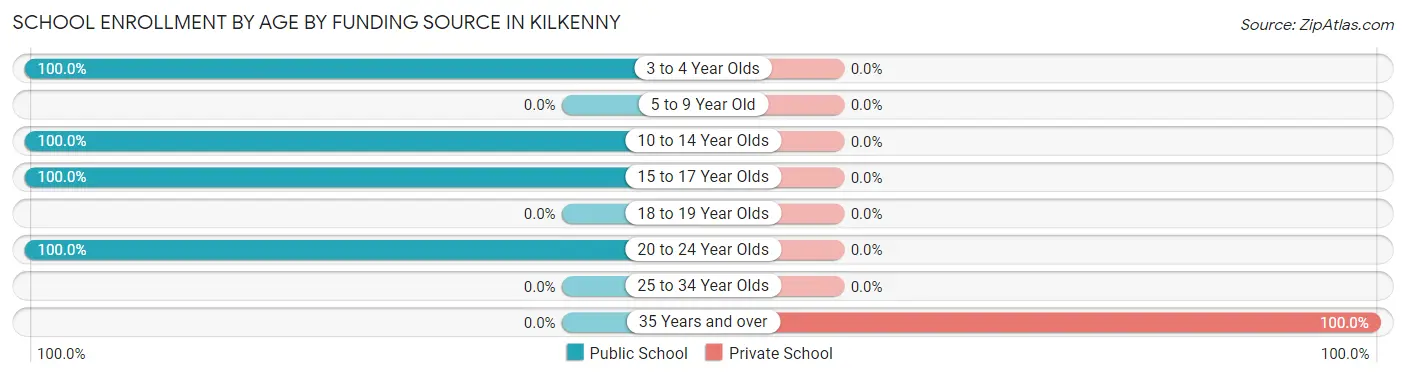
| Age Bracket | Public School | Private School |
| 3 to 4 Year Olds | 4 (100.0%) | 0 (0.0%) |
| 5 to 9 Year Old | 0 (0.0%) | 0 (0.0%) |
| 10 to 14 Year Olds | 4 (100.0%) | 0 (0.0%) |
| 15 to 17 Year Olds | 6 (100.0%) | 0 (0.0%) |
| 18 to 19 Year Olds | 0 (0.0%) | 0 (0.0%) |
| 20 to 24 Year Olds | 2 (100.0%) | 0 (0.0%) |
| 25 to 34 Year Olds | 0 (0.0%) | 0 (0.0%) |
| 35 Years and over | 0 (0.0%) | 1 (100.0%) |
| Total | 16 (94.1%) | 1 (5.9%) |
Educational Attainment by Field of Study in Kilkenny
Business (2 | 66.7%), and education (1 | 33.3%) are the most common fields of study among 3 individuals in Kilkenny who have obtained a bachelor's degree or higher.
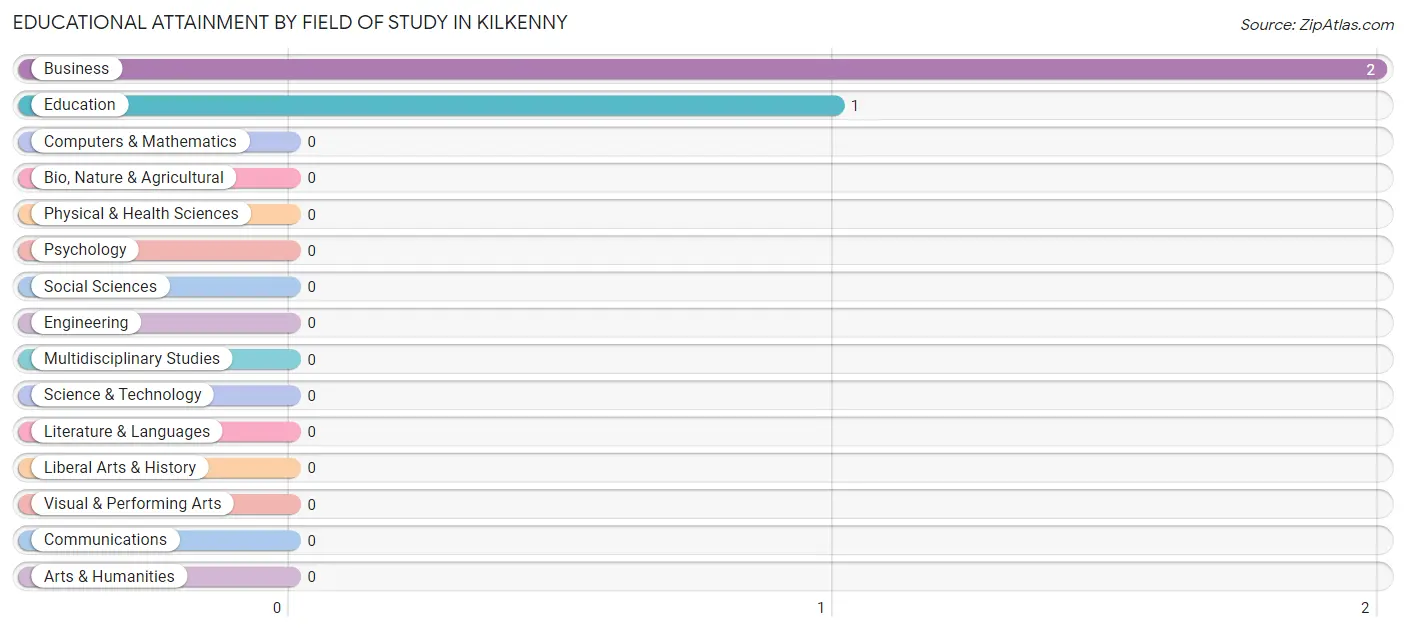
| Field of Study | # Graduates | % Graduates |
| Computers & Mathematics | 0 | 0.0% |
| Bio, Nature & Agricultural | 0 | 0.0% |
| Physical & Health Sciences | 0 | 0.0% |
| Psychology | 0 | 0.0% |
| Social Sciences | 0 | 0.0% |
| Engineering | 0 | 0.0% |
| Multidisciplinary Studies | 0 | 0.0% |
| Science & Technology | 0 | 0.0% |
| Business | 2 | 66.7% |
| Education | 1 | 33.3% |
| Literature & Languages | 0 | 0.0% |
| Liberal Arts & History | 0 | 0.0% |
| Visual & Performing Arts | 0 | 0.0% |
| Communications | 0 | 0.0% |
| Arts & Humanities | 0 | 0.0% |
| Total | 3 | 100.0% |
Transportation & Commute in Kilkenny
Vehicle Availability by Sex in Kilkenny
The most prevalent vehicle ownership categories in Kilkenny are males with 2 vehicles (7, accounting for 38.9%) and females with 2 vehicles (3, making up 53.8%).
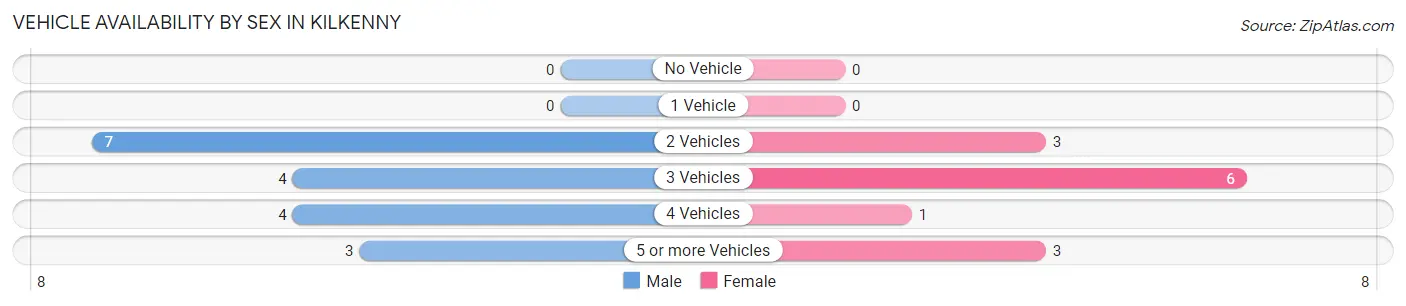
| Vehicles Available | Male | Female |
| No Vehicle | 0 (0.0%) | 0 (0.0%) |
| 1 Vehicle | 0 (0.0%) | 0 (0.0%) |
| 2 Vehicles | 7 (38.9%) | 3 (23.1%) |
| 3 Vehicles | 4 (22.2%) | 6 (46.2%) |
| 4 Vehicles | 4 (22.2%) | 1 (7.7%) |
| 5 or more Vehicles | 3 (16.7%) | 3 (23.1%) |
| Total | 18 (100.0%) | 13 (100.0%) |
Commute Time in Kilkenny
The most frequently occuring commute durations in Kilkenny are 20 to 24 minutes (9 commuters, 29.0%), 45 to 59 minutes (9 commuters, 29.0%), and 60 to 89 minutes (5 commuters, 16.1%).
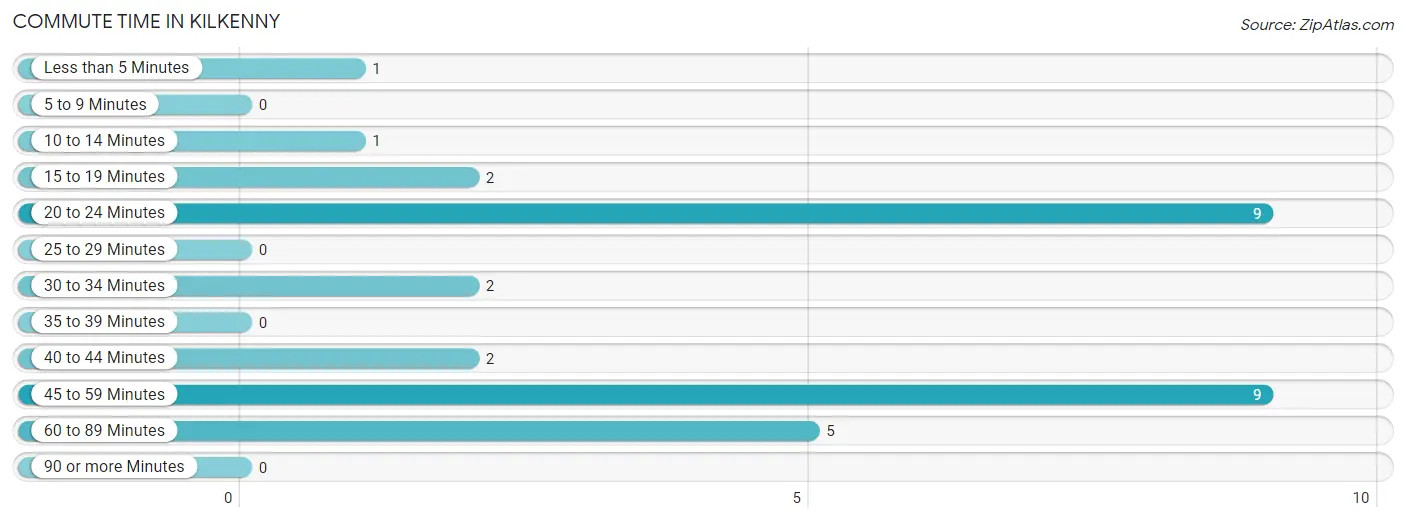
| Commute Time | # Commuters | % Commuters |
| Less than 5 Minutes | 1 | 3.2% |
| 5 to 9 Minutes | 0 | 0.0% |
| 10 to 14 Minutes | 1 | 3.2% |
| 15 to 19 Minutes | 2 | 6.5% |
| 20 to 24 Minutes | 9 | 29.0% |
| 25 to 29 Minutes | 0 | 0.0% |
| 30 to 34 Minutes | 2 | 6.5% |
| 35 to 39 Minutes | 0 | 0.0% |
| 40 to 44 Minutes | 2 | 6.5% |
| 45 to 59 Minutes | 9 | 29.0% |
| 60 to 89 Minutes | 5 | 16.1% |
| 90 or more Minutes | 0 | 0.0% |
Commute Time by Sex in Kilkenny
The most common commute times in Kilkenny are 45 to 59 minutes (8 commuters, 44.4%) for males and 20 to 24 minutes (6 commuters, 46.2%) for females.
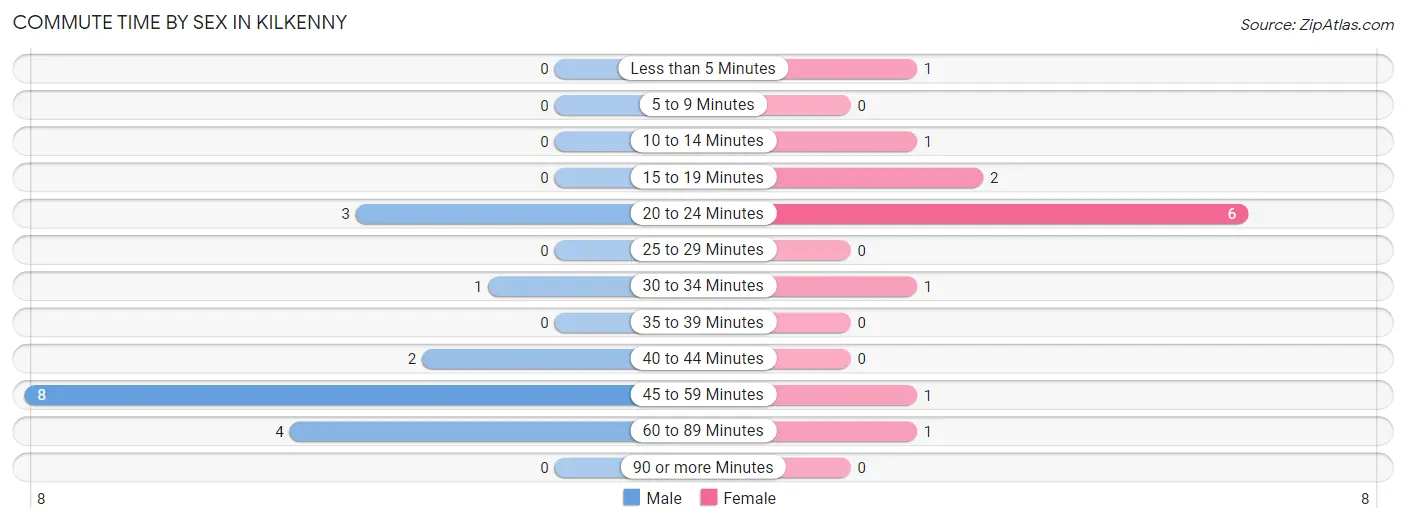
| Commute Time | Male | Female |
| Less than 5 Minutes | 0 (0.0%) | 1 (7.7%) |
| 5 to 9 Minutes | 0 (0.0%) | 0 (0.0%) |
| 10 to 14 Minutes | 0 (0.0%) | 1 (7.7%) |
| 15 to 19 Minutes | 0 (0.0%) | 2 (15.4%) |
| 20 to 24 Minutes | 3 (16.7%) | 6 (46.2%) |
| 25 to 29 Minutes | 0 (0.0%) | 0 (0.0%) |
| 30 to 34 Minutes | 1 (5.6%) | 1 (7.7%) |
| 35 to 39 Minutes | 0 (0.0%) | 0 (0.0%) |
| 40 to 44 Minutes | 2 (11.1%) | 0 (0.0%) |
| 45 to 59 Minutes | 8 (44.4%) | 1 (7.7%) |
| 60 to 89 Minutes | 4 (22.2%) | 1 (7.7%) |
| 90 or more Minutes | 0 (0.0%) | 0 (0.0%) |
Time of Departure to Work by Sex in Kilkenny
The most frequent times of departure to work in Kilkenny are 12:00 AM to 4:59 AM (4, 22.2%) for males and 6:30 AM to 6:59 AM (3, 23.1%) for females.
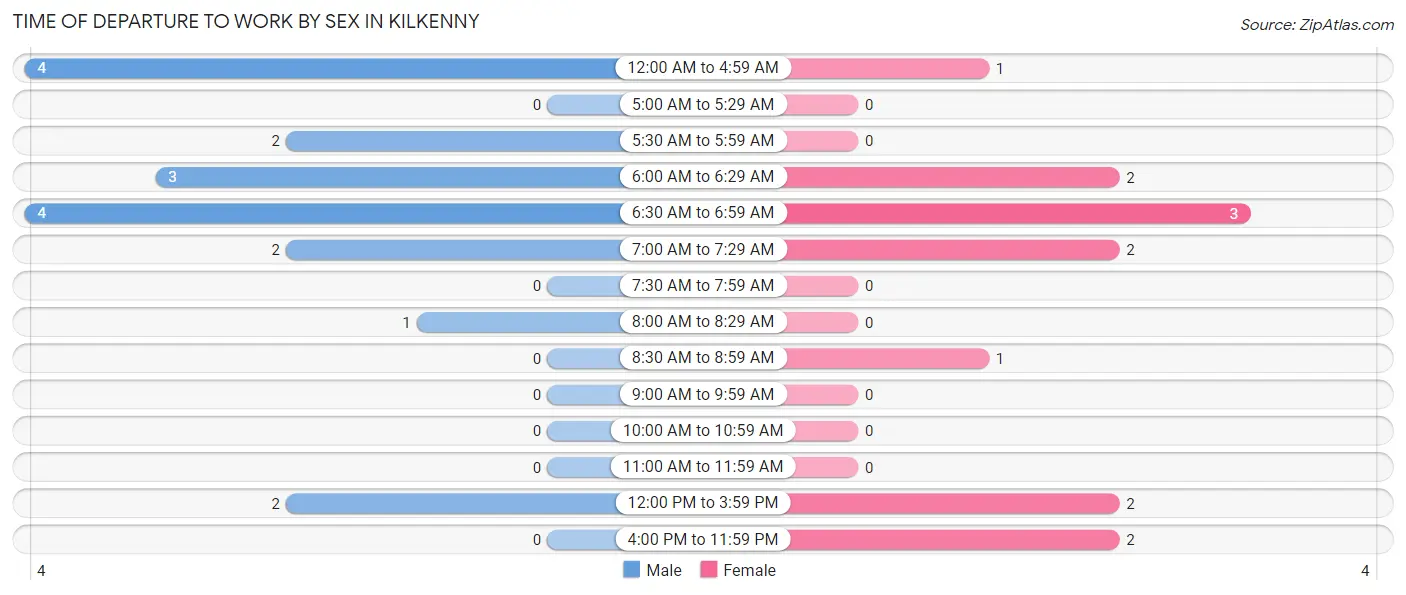
| Time of Departure | Male | Female |
| 12:00 AM to 4:59 AM | 4 (22.2%) | 1 (7.7%) |
| 5:00 AM to 5:29 AM | 0 (0.0%) | 0 (0.0%) |
| 5:30 AM to 5:59 AM | 2 (11.1%) | 0 (0.0%) |
| 6:00 AM to 6:29 AM | 3 (16.7%) | 2 (15.4%) |
| 6:30 AM to 6:59 AM | 4 (22.2%) | 3 (23.1%) |
| 7:00 AM to 7:29 AM | 2 (11.1%) | 2 (15.4%) |
| 7:30 AM to 7:59 AM | 0 (0.0%) | 0 (0.0%) |
| 8:00 AM to 8:29 AM | 1 (5.6%) | 0 (0.0%) |
| 8:30 AM to 8:59 AM | 0 (0.0%) | 1 (7.7%) |
| 9:00 AM to 9:59 AM | 0 (0.0%) | 0 (0.0%) |
| 10:00 AM to 10:59 AM | 0 (0.0%) | 0 (0.0%) |
| 11:00 AM to 11:59 AM | 0 (0.0%) | 0 (0.0%) |
| 12:00 PM to 3:59 PM | 2 (11.1%) | 2 (15.4%) |
| 4:00 PM to 11:59 PM | 0 (0.0%) | 2 (15.4%) |
| Total | 18 (100.0%) | 13 (100.0%) |
Housing Occupancy in Kilkenny
Occupancy by Ownership in Kilkenny
Of the total 41 dwellings in Kilkenny, owner-occupied units account for 41 (100.0%), while renter-occupied units make up 0 (0.0%).
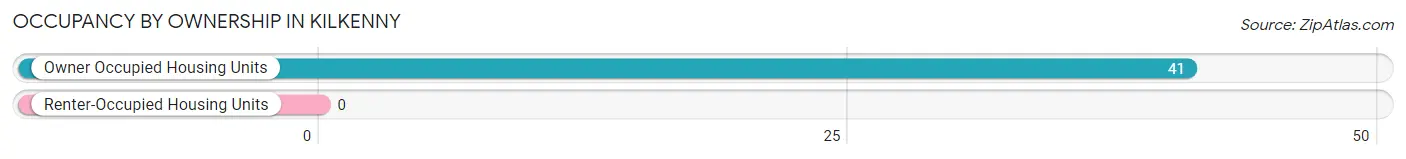
| Occupancy | # Housing Units | % Housing Units |
| Owner Occupied Housing Units | 41 | 100.0% |
| Renter-Occupied Housing Units | 0 | 0.0% |
| Total Occupied Housing Units | 41 | 100.0% |
Occupancy by Household Size in Kilkenny
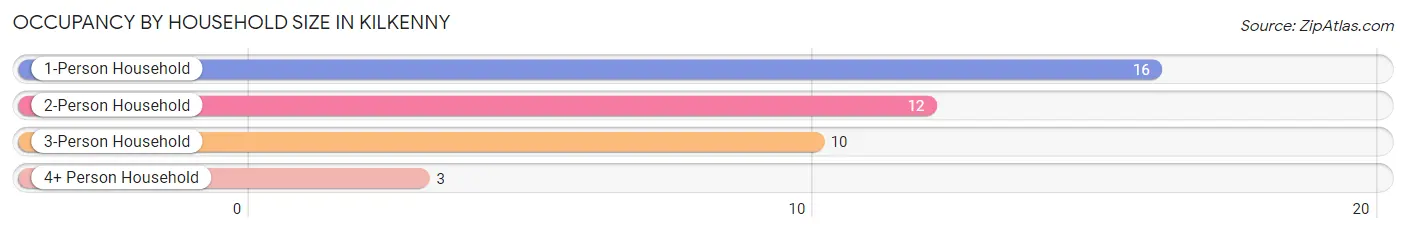
| Household Size | # Housing Units | % Housing Units |
| 1-Person Household | 16 | 39.0% |
| 2-Person Household | 12 | 29.3% |
| 3-Person Household | 10 | 24.4% |
| 4+ Person Household | 3 | 7.3% |
| Total Housing Units | 41 | 100.0% |
Occupancy by Ownership by Household Size in Kilkenny
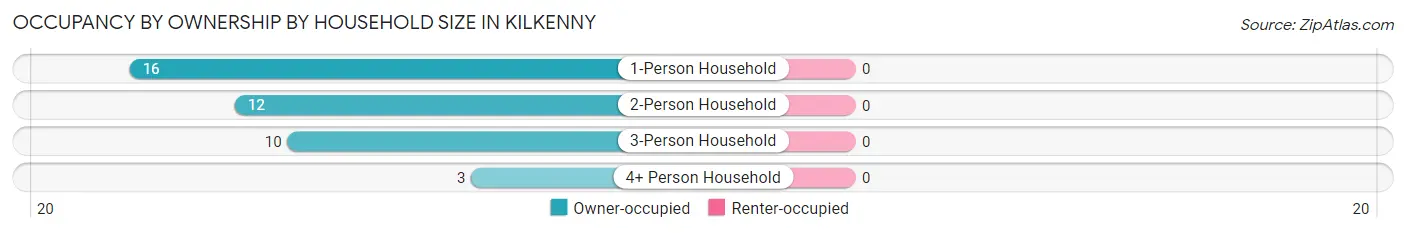
| Household Size | Owner-occupied | Renter-occupied |
| 1-Person Household | 16 (100.0%) | 0 (0.0%) |
| 2-Person Household | 12 (100.0%) | 0 (0.0%) |
| 3-Person Household | 10 (100.0%) | 0 (0.0%) |
| 4+ Person Household | 3 (100.0%) | 0 (0.0%) |
| Total Housing Units | 41 (100.0%) | 0 (0.0%) |
Occupancy by Educational Attainment in Kilkenny
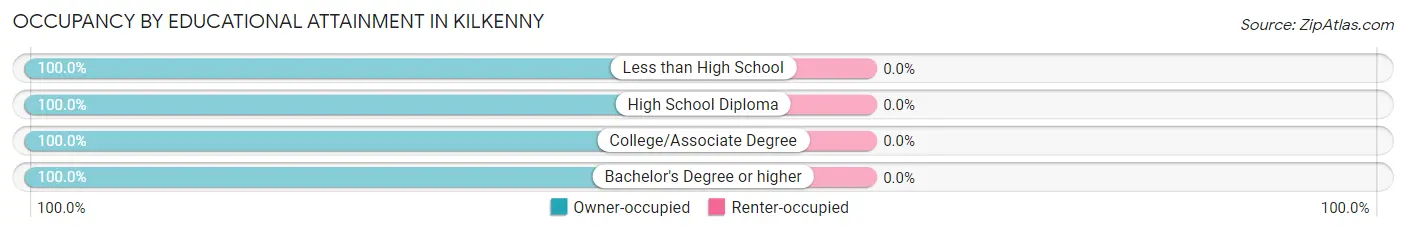
| Household Size | Owner-occupied | Renter-occupied |
| Less than High School | 5 (100.0%) | 0 (0.0%) |
| High School Diploma | 8 (100.0%) | 0 (0.0%) |
| College/Associate Degree | 26 (100.0%) | 0 (0.0%) |
| Bachelor's Degree or higher | 2 (100.0%) | 0 (0.0%) |
Occupancy by Age of Householder in Kilkenny
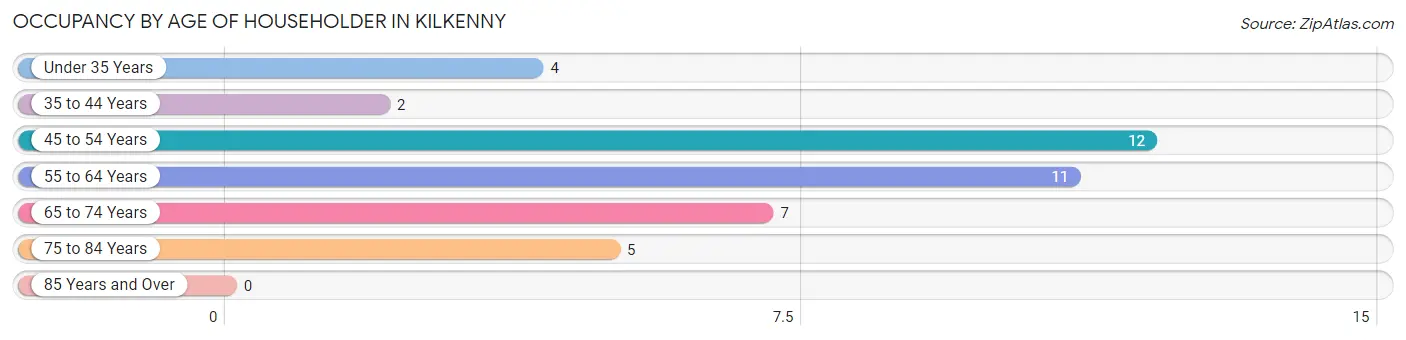
| Age Bracket | # Households | % Households |
| Under 35 Years | 4 | 9.8% |
| 35 to 44 Years | 2 | 4.9% |
| 45 to 54 Years | 12 | 29.3% |
| 55 to 64 Years | 11 | 26.8% |
| 65 to 74 Years | 7 | 17.1% |
| 75 to 84 Years | 5 | 12.2% |
| 85 Years and Over | 0 | 0.0% |
| Total | 41 | 100.0% |
Housing Finances in Kilkenny
Median Income by Occupancy in Kilkenny
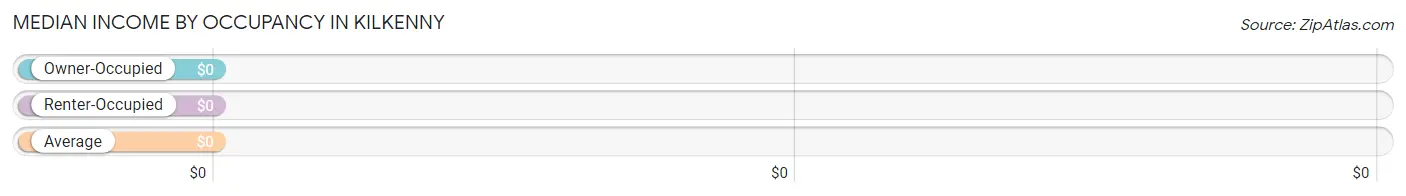
| Occupancy Type | # Households | Median Income |
| Owner-Occupied | 41 (100.0%) | $0 |
| Renter-Occupied | 0 (0.0%) | $0 |
| Average | 41 (100.0%) | $0 |
Occupancy by Householder Income Bracket in Kilkenny
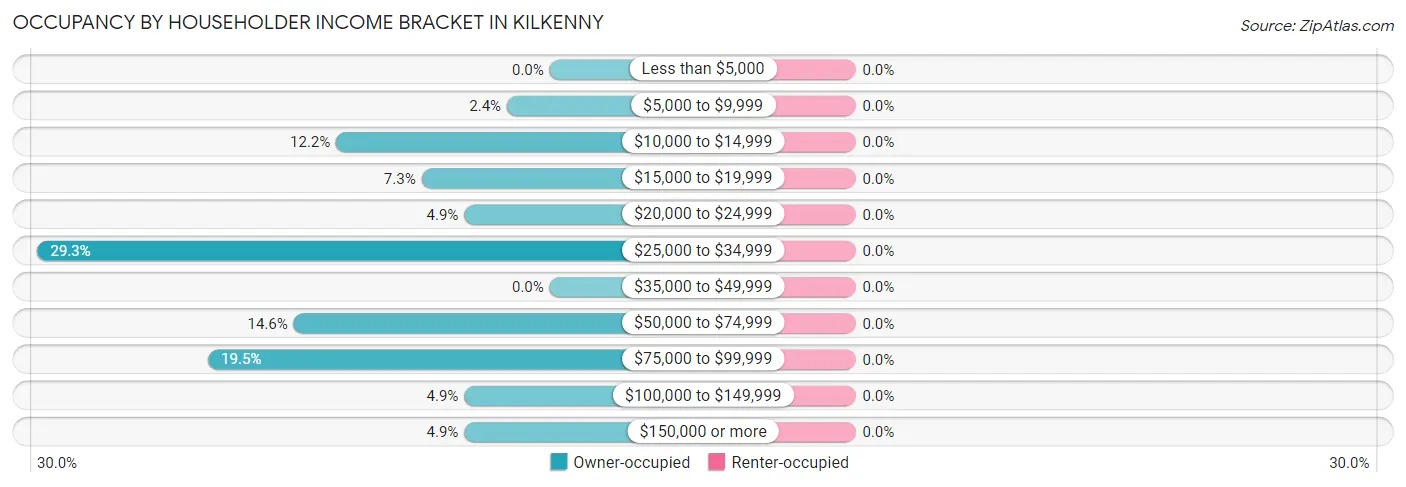
| Income Bracket | Owner-occupied | Renter-occupied |
| Less than $5,000 | 0 (0.0%) | 0 (0.0%) |
| $5,000 to $9,999 | 1 (2.4%) | 0 (0.0%) |
| $10,000 to $14,999 | 5 (12.2%) | 0 (0.0%) |
| $15,000 to $19,999 | 3 (7.3%) | 0 (0.0%) |
| $20,000 to $24,999 | 2 (4.9%) | 0 (0.0%) |
| $25,000 to $34,999 | 12 (29.3%) | 0 (0.0%) |
| $35,000 to $49,999 | 0 (0.0%) | 0 (0.0%) |
| $50,000 to $74,999 | 6 (14.6%) | 0 (0.0%) |
| $75,000 to $99,999 | 8 (19.5%) | 0 (0.0%) |
| $100,000 to $149,999 | 2 (4.9%) | 0 (0.0%) |
| $150,000 or more | 2 (4.9%) | 0 (0.0%) |
| Total | 41 (100.0%) | 0 (0.0%) |
Monthly Housing Cost Tiers in Kilkenny
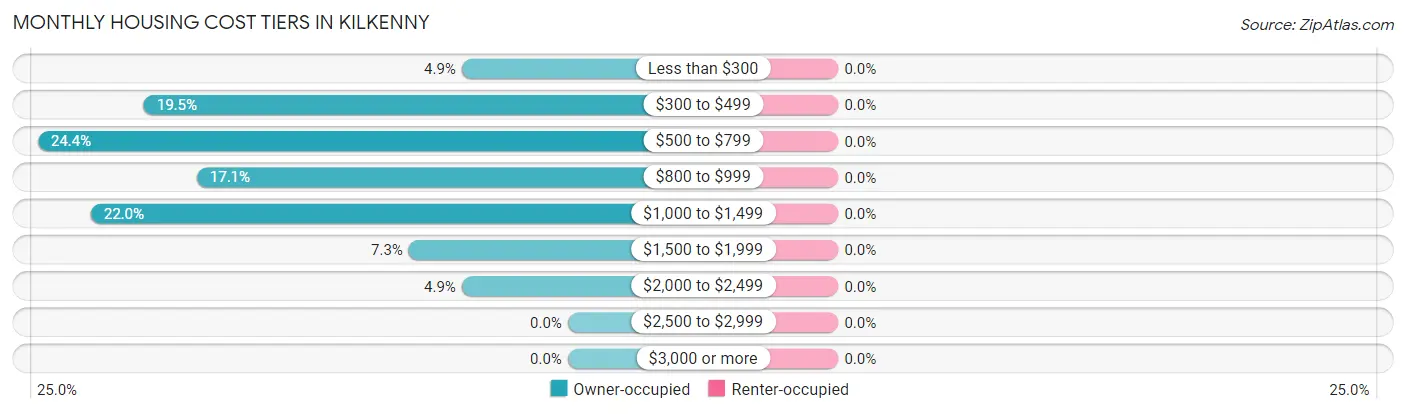
| Monthly Cost | Owner-occupied | Renter-occupied |
| Less than $300 | 2 (4.9%) | 0 (0.0%) |
| $300 to $499 | 8 (19.5%) | 0 (0.0%) |
| $500 to $799 | 10 (24.4%) | 0 (0.0%) |
| $800 to $999 | 7 (17.1%) | 0 (0.0%) |
| $1,000 to $1,499 | 9 (22.0%) | 0 (0.0%) |
| $1,500 to $1,999 | 3 (7.3%) | 0 (0.0%) |
| $2,000 to $2,499 | 2 (4.9%) | 0 (0.0%) |
| $2,500 to $2,999 | 0 (0.0%) | 0 (0.0%) |
| $3,000 or more | 0 (0.0%) | 0 (0.0%) |
| Total | 41 (100.0%) | 0 (0.0%) |
Physical Housing Characteristics in Kilkenny
Housing Structures in Kilkenny
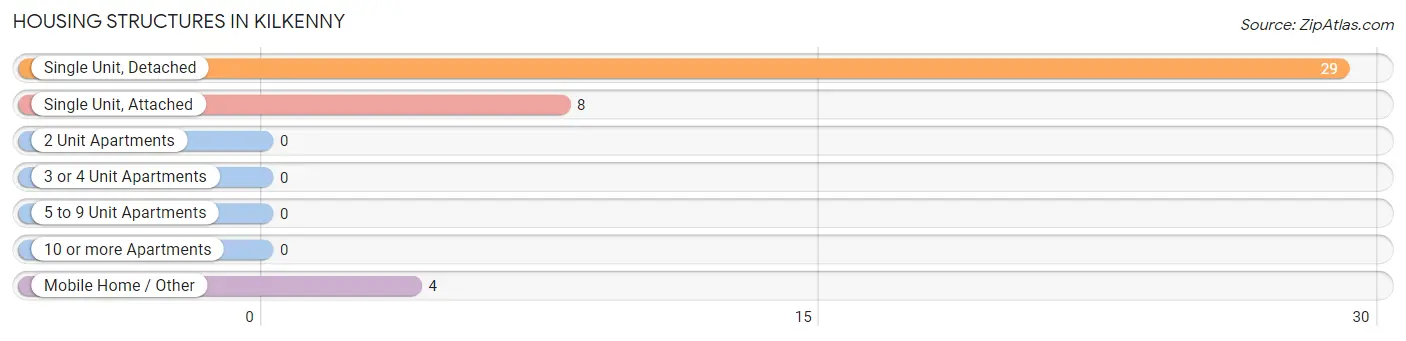
| Structure Type | # Housing Units | % Housing Units |
| Single Unit, Detached | 29 | 70.7% |
| Single Unit, Attached | 8 | 19.5% |
| 2 Unit Apartments | 0 | 0.0% |
| 3 or 4 Unit Apartments | 0 | 0.0% |
| 5 to 9 Unit Apartments | 0 | 0.0% |
| 10 or more Apartments | 0 | 0.0% |
| Mobile Home / Other | 4 | 9.8% |
| Total | 41 | 100.0% |
Housing Structures by Occupancy in Kilkenny
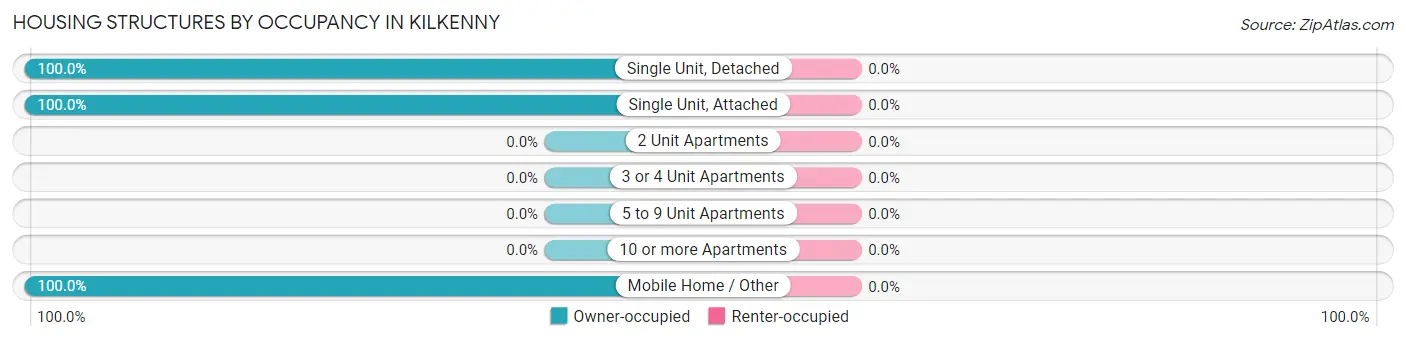
| Structure Type | Owner-occupied | Renter-occupied |
| Single Unit, Detached | 29 (100.0%) | 0 (0.0%) |
| Single Unit, Attached | 8 (100.0%) | 0 (0.0%) |
| 2 Unit Apartments | 0 (0.0%) | 0 (0.0%) |
| 3 or 4 Unit Apartments | 0 (0.0%) | 0 (0.0%) |
| 5 to 9 Unit Apartments | 0 (0.0%) | 0 (0.0%) |
| 10 or more Apartments | 0 (0.0%) | 0 (0.0%) |
| Mobile Home / Other | 4 (100.0%) | 0 (0.0%) |
| Total | 41 (100.0%) | 0 (0.0%) |
Housing Structures by Number of Rooms in Kilkenny
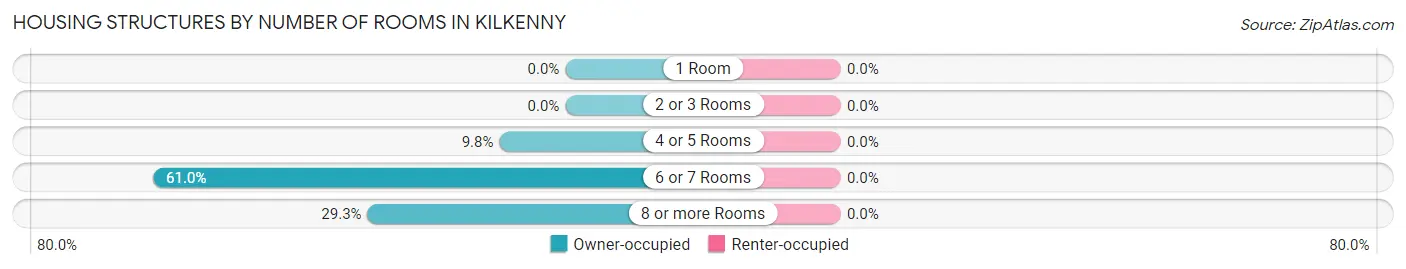
| Number of Rooms | Owner-occupied | Renter-occupied |
| 1 Room | 0 (0.0%) | 0 (0.0%) |
| 2 or 3 Rooms | 0 (0.0%) | 0 (0.0%) |
| 4 or 5 Rooms | 4 (9.8%) | 0 (0.0%) |
| 6 or 7 Rooms | 25 (61.0%) | 0 (0.0%) |
| 8 or more Rooms | 12 (29.3%) | 0 (0.0%) |
| Total | 41 (100.0%) | 0 (0.0%) |
Housing Structure by Heating Type in Kilkenny
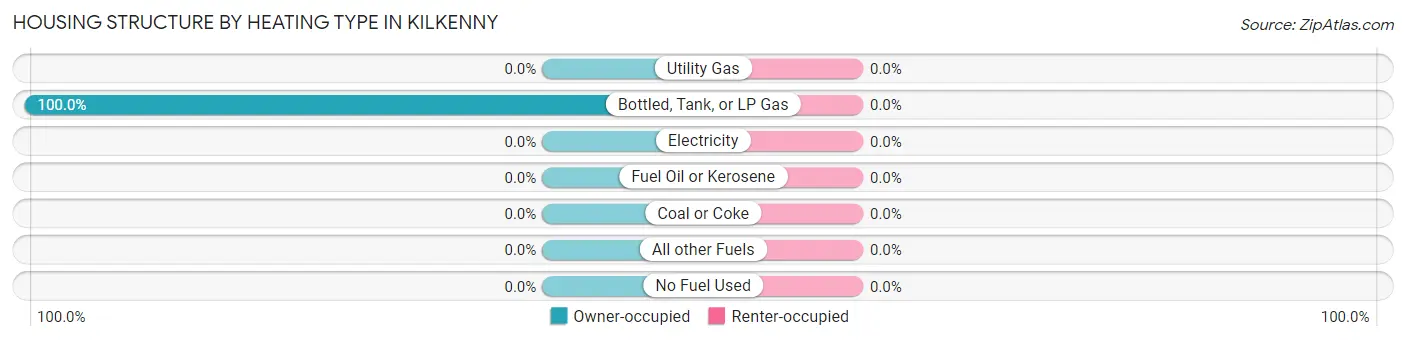
| Heating Type | Owner-occupied | Renter-occupied |
| Utility Gas | 0 (0.0%) | 0 (0.0%) |
| Bottled, Tank, or LP Gas | 41 (100.0%) | 0 (0.0%) |
| Electricity | 0 (0.0%) | 0 (0.0%) |
| Fuel Oil or Kerosene | 0 (0.0%) | 0 (0.0%) |
| Coal or Coke | 0 (0.0%) | 0 (0.0%) |
| All other Fuels | 0 (0.0%) | 0 (0.0%) |
| No Fuel Used | 0 (0.0%) | 0 (0.0%) |
| Total | 41 (100.0%) | 0 (0.0%) |
Household Vehicle Usage in Kilkenny
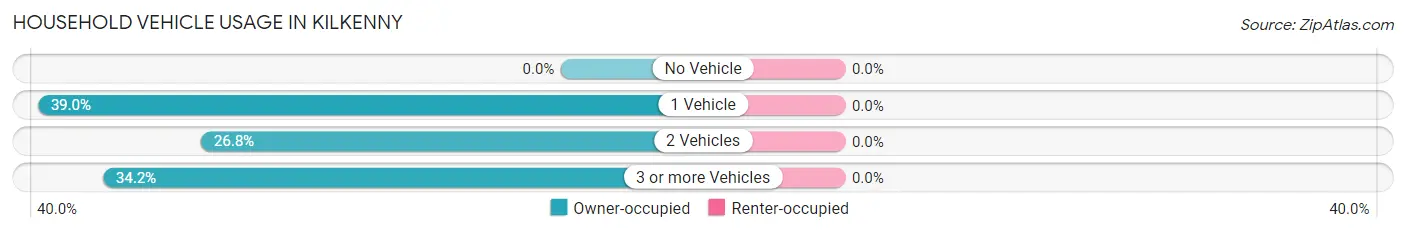
| Vehicles per Household | Owner-occupied | Renter-occupied |
| No Vehicle | 0 (0.0%) | 0 (0.0%) |
| 1 Vehicle | 16 (39.0%) | 0 (0.0%) |
| 2 Vehicles | 11 (26.8%) | 0 (0.0%) |
| 3 or more Vehicles | 14 (34.2%) | 0 (0.0%) |
| Total | 41 (100.0%) | 0 (0.0%) |
Real Estate & Mortgages in Kilkenny
Real Estate and Mortgage Overview in Kilkenny
| Characteristic | Without Mortgage | With Mortgage |
| Housing Units | 15 | 26 |
| Median Property Value | $62,500 | $125,000 |
| Median Household Income | $19,583 | $2 |
| Monthly Housing Costs | - | - |
| Real Estate Taxes | - | - |
Property Value by Mortgage Status in Kilkenny
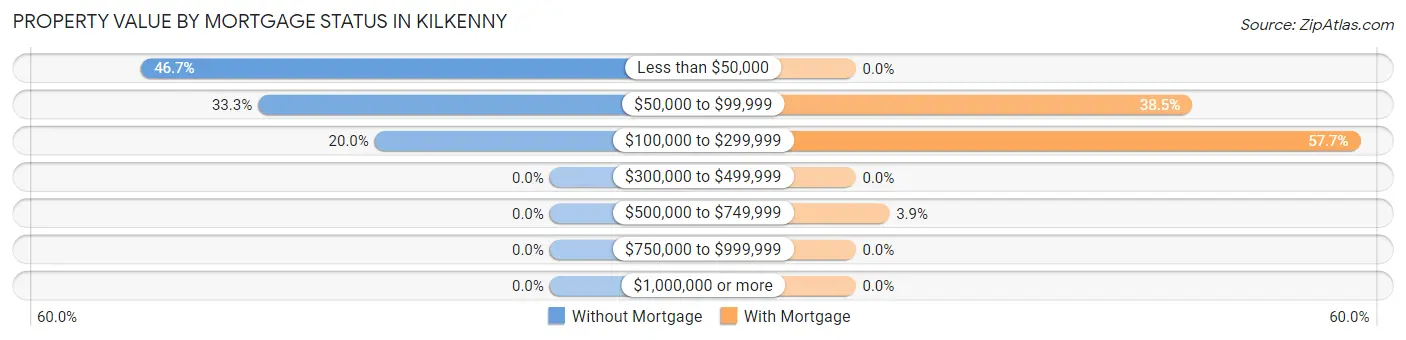
| Property Value | Without Mortgage | With Mortgage |
| Less than $50,000 | 7 (46.7%) | 0 (0.0%) |
| $50,000 to $99,999 | 5 (33.3%) | 10 (38.5%) |
| $100,000 to $299,999 | 3 (20.0%) | 15 (57.7%) |
| $300,000 to $499,999 | 0 (0.0%) | 0 (0.0%) |
| $500,000 to $749,999 | 0 (0.0%) | 1 (3.8%) |
| $750,000 to $999,999 | 0 (0.0%) | 0 (0.0%) |
| $1,000,000 or more | 0 (0.0%) | 0 (0.0%) |
| Total | 15 (100.0%) | 26 (100.0%) |
Household Income by Mortgage Status in Kilkenny
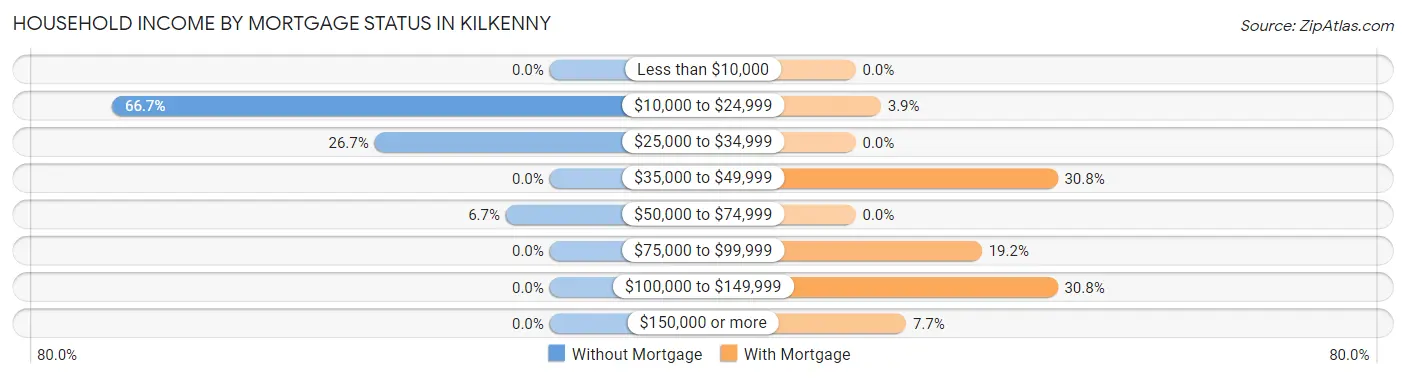
| Household Income | Without Mortgage | With Mortgage |
| Less than $10,000 | 0 (0.0%) | 0 (0.0%) |
| $10,000 to $24,999 | 10 (66.7%) | 1 (3.8%) |
| $25,000 to $34,999 | 4 (26.7%) | 0 (0.0%) |
| $35,000 to $49,999 | 0 (0.0%) | 8 (30.8%) |
| $50,000 to $74,999 | 1 (6.7%) | 0 (0.0%) |
| $75,000 to $99,999 | 0 (0.0%) | 5 (19.2%) |
| $100,000 to $149,999 | 0 (0.0%) | 8 (30.8%) |
| $150,000 or more | 0 (0.0%) | 2 (7.7%) |
| Total | 15 (100.0%) | 26 (100.0%) |
Property Value to Household Income Ratio in Kilkenny
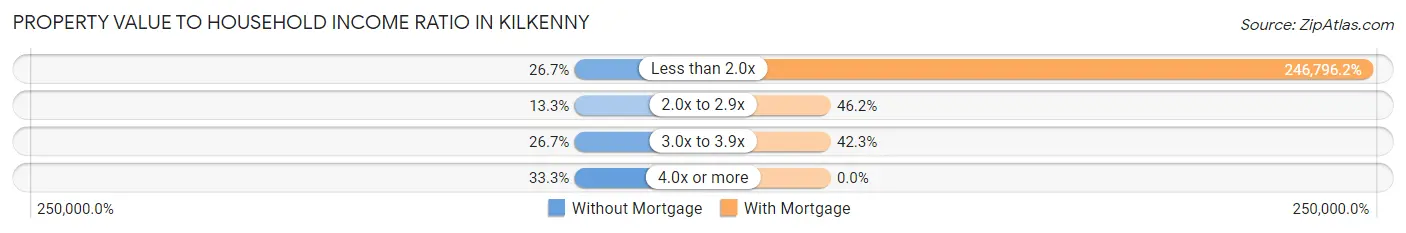
| Value-to-Income Ratio | Without Mortgage | With Mortgage |
| Less than 2.0x | 4 (26.7%) | 64,167 (246,796.1%) |
| 2.0x to 2.9x | 2 (13.3%) | 12 (46.2%) |
| 3.0x to 3.9x | 4 (26.7%) | 11 (42.3%) |
| 4.0x or more | 5 (33.3%) | 0 (0.0%) |
| Total | 15 (100.0%) | 26 (100.0%) |
Real Estate Taxes by Mortgage Status in Kilkenny
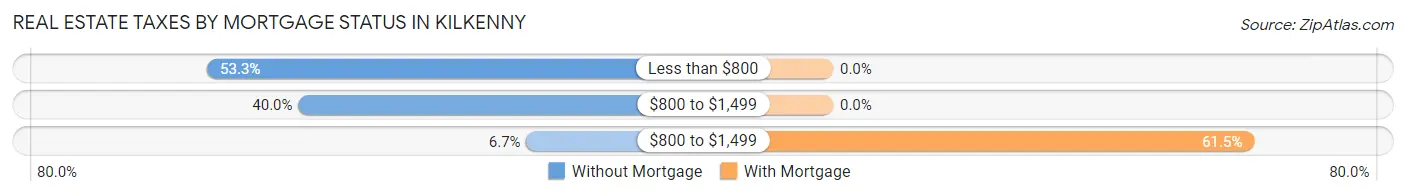
| Property Taxes | Without Mortgage | With Mortgage |
| Less than $800 | 8 (53.3%) | 0 (0.0%) |
| $800 to $1,499 | 6 (40.0%) | 0 (0.0%) |
| $800 to $1,499 | 1 (6.7%) | 16 (61.5%) |
| Total | 15 (100.0%) | 26 (100.0%) |
Health & Disability in Kilkenny
Health Insurance Coverage by Age in Kilkenny
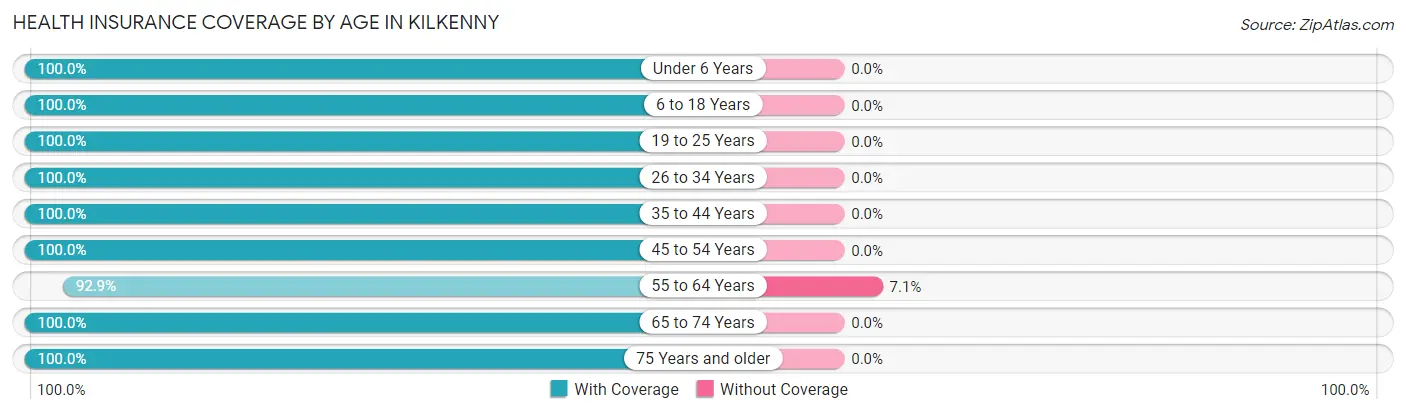
| Age Bracket | With Coverage | Without Coverage |
| Under 6 Years | 6 (100.0%) | 0 (0.0%) |
| 6 to 18 Years | 10 (100.0%) | 0 (0.0%) |
| 19 to 25 Years | 4 (100.0%) | 0 (0.0%) |
| 26 to 34 Years | 10 (100.0%) | 0 (0.0%) |
| 35 to 44 Years | 2 (100.0%) | 0 (0.0%) |
| 45 to 54 Years | 15 (100.0%) | 0 (0.0%) |
| 55 to 64 Years | 13 (92.9%) | 1 (7.1%) |
| 65 to 74 Years | 9 (100.0%) | 0 (0.0%) |
| 75 Years and older | 6 (100.0%) | 0 (0.0%) |
| Total | 75 (98.7%) | 1 (1.3%) |
Health Insurance Coverage by Citizenship Status in Kilkenny
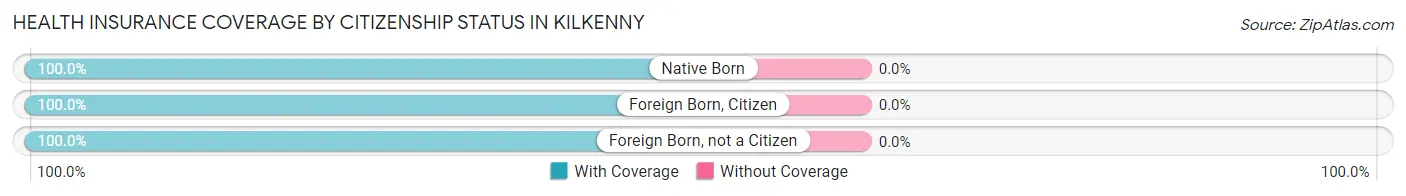
| Citizenship Status | With Coverage | Without Coverage |
| Native Born | 6 (100.0%) | 0 (0.0%) |
| Foreign Born, Citizen | 10 (100.0%) | 0 (0.0%) |
| Foreign Born, not a Citizen | 4 (100.0%) | 0 (0.0%) |
Health Insurance Coverage by Household Income in Kilkenny
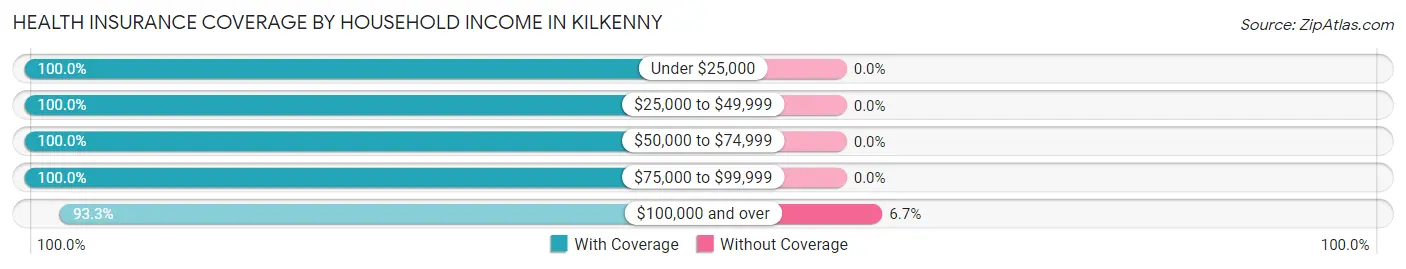
| Household Income | With Coverage | Without Coverage |
| Under $25,000 | 11 (100.0%) | 0 (0.0%) |
| $25,000 to $49,999 | 24 (100.0%) | 0 (0.0%) |
| $50,000 to $74,999 | 11 (100.0%) | 0 (0.0%) |
| $75,000 to $99,999 | 15 (100.0%) | 0 (0.0%) |
| $100,000 and over | 14 (93.3%) | 1 (6.7%) |
Public vs Private Health Insurance Coverage by Age in Kilkenny
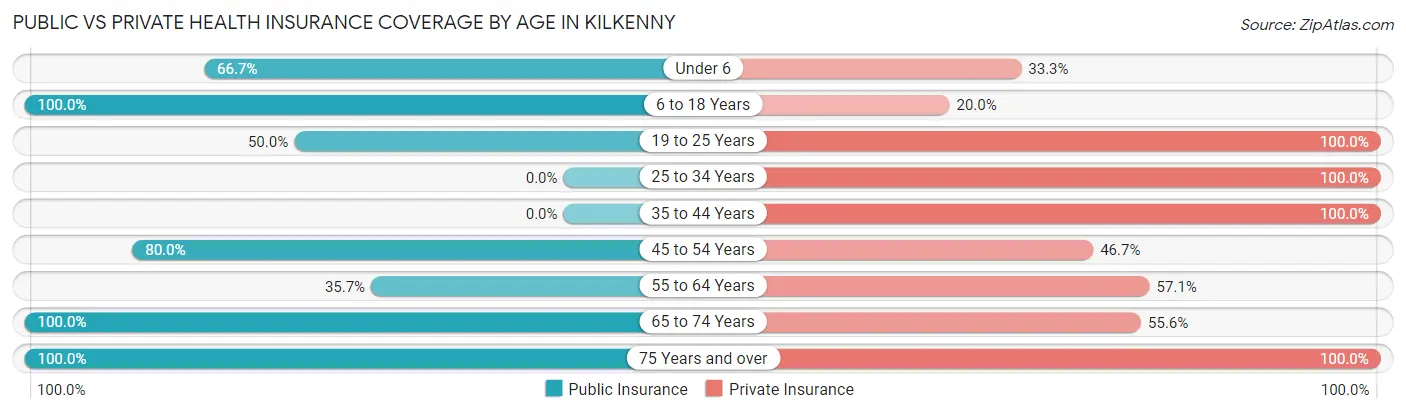
| Age Bracket | Public Insurance | Private Insurance |
| Under 6 | 4 (66.7%) | 2 (33.3%) |
| 6 to 18 Years | 10 (100.0%) | 2 (20.0%) |
| 19 to 25 Years | 2 (50.0%) | 4 (100.0%) |
| 25 to 34 Years | 0 (0.0%) | 10 (100.0%) |
| 35 to 44 Years | 0 (0.0%) | 2 (100.0%) |
| 45 to 54 Years | 12 (80.0%) | 7 (46.7%) |
| 55 to 64 Years | 5 (35.7%) | 8 (57.1%) |
| 65 to 74 Years | 9 (100.0%) | 5 (55.6%) |
| 75 Years and over | 6 (100.0%) | 6 (100.0%) |
| Total | 48 (63.2%) | 46 (60.5%) |
Disability Status by Sex by Age in Kilkenny
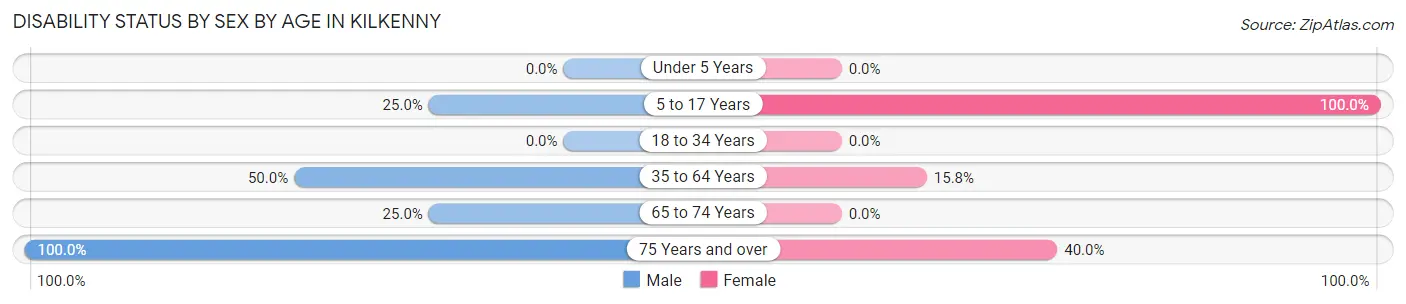
| Age Bracket | Male | Female |
| Under 5 Years | 0 (0.0%) | 0 (0.0%) |
| 5 to 17 Years | 2 (25.0%) | 2 (100.0%) |
| 18 to 34 Years | 0 (0.0%) | 0 (0.0%) |
| 35 to 64 Years | 6 (50.0%) | 3 (15.8%) |
| 65 to 74 Years | 1 (25.0%) | 0 (0.0%) |
| 75 Years and over | 1 (100.0%) | 2 (40.0%) |
Disability Class by Sex by Age in Kilkenny
Disability Class: Hearing Difficulty
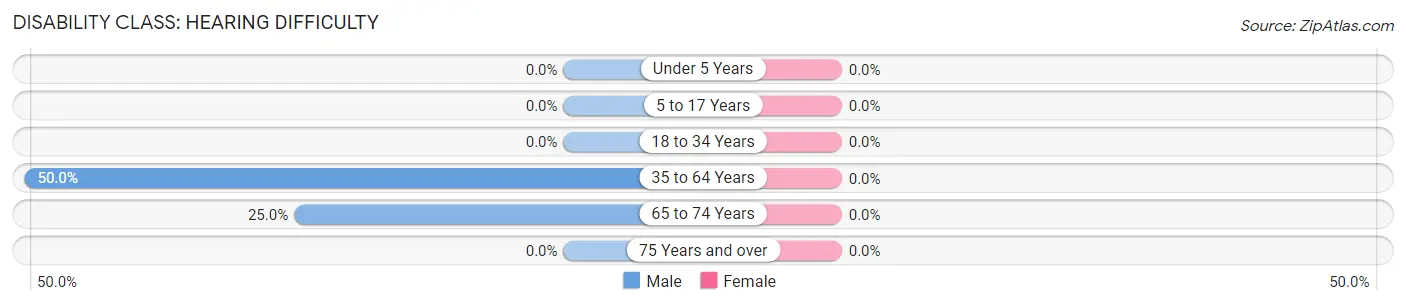
| Age Bracket | Male | Female |
| Under 5 Years | 0 (0.0%) | 0 (0.0%) |
| 5 to 17 Years | 0 (0.0%) | 0 (0.0%) |
| 18 to 34 Years | 0 (0.0%) | 0 (0.0%) |
| 35 to 64 Years | 6 (50.0%) | 0 (0.0%) |
| 65 to 74 Years | 1 (25.0%) | 0 (0.0%) |
| 75 Years and over | 0 (0.0%) | 0 (0.0%) |
Disability Class: Vision Difficulty
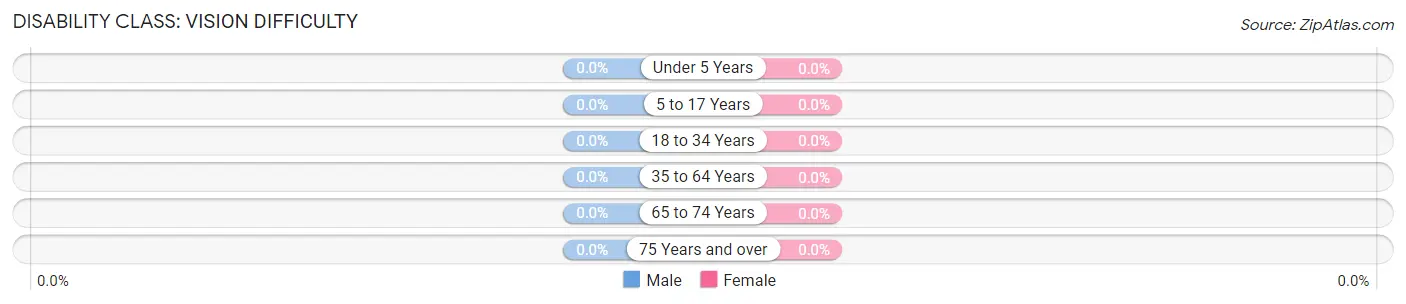
| Age Bracket | Male | Female |
| Under 5 Years | 0 (0.0%) | 0 (0.0%) |
| 5 to 17 Years | 0 (0.0%) | 0 (0.0%) |
| 18 to 34 Years | 0 (0.0%) | 0 (0.0%) |
| 35 to 64 Years | 0 (0.0%) | 0 (0.0%) |
| 65 to 74 Years | 0 (0.0%) | 0 (0.0%) |
| 75 Years and over | 0 (0.0%) | 0 (0.0%) |
Disability Class: Cognitive Difficulty
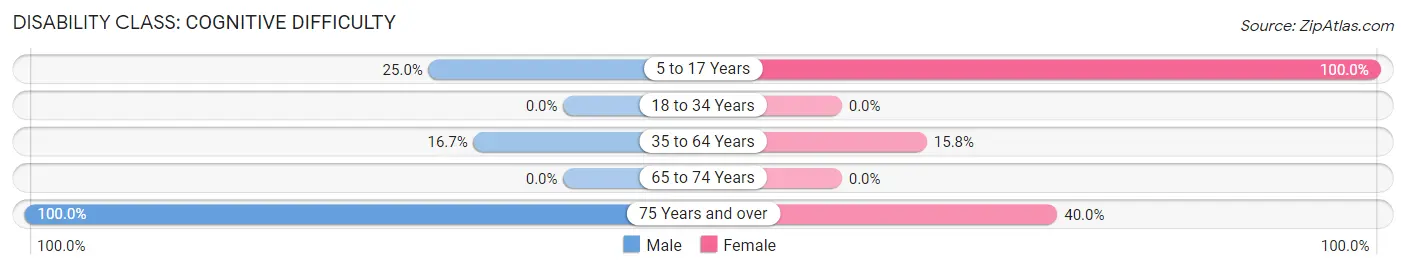
| Age Bracket | Male | Female |
| 5 to 17 Years | 2 (25.0%) | 2 (100.0%) |
| 18 to 34 Years | 0 (0.0%) | 0 (0.0%) |
| 35 to 64 Years | 2 (16.7%) | 3 (15.8%) |
| 65 to 74 Years | 0 (0.0%) | 0 (0.0%) |
| 75 Years and over | 1 (100.0%) | 2 (40.0%) |
Disability Class: Ambulatory Difficulty
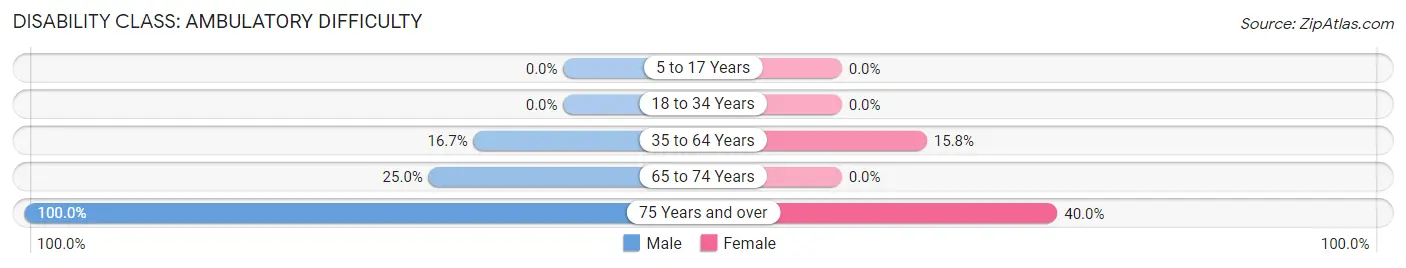
| Age Bracket | Male | Female |
| 5 to 17 Years | 0 (0.0%) | 0 (0.0%) |
| 18 to 34 Years | 0 (0.0%) | 0 (0.0%) |
| 35 to 64 Years | 2 (16.7%) | 3 (15.8%) |
| 65 to 74 Years | 1 (25.0%) | 0 (0.0%) |
| 75 Years and over | 1 (100.0%) | 2 (40.0%) |
Disability Class: Self-Care Difficulty
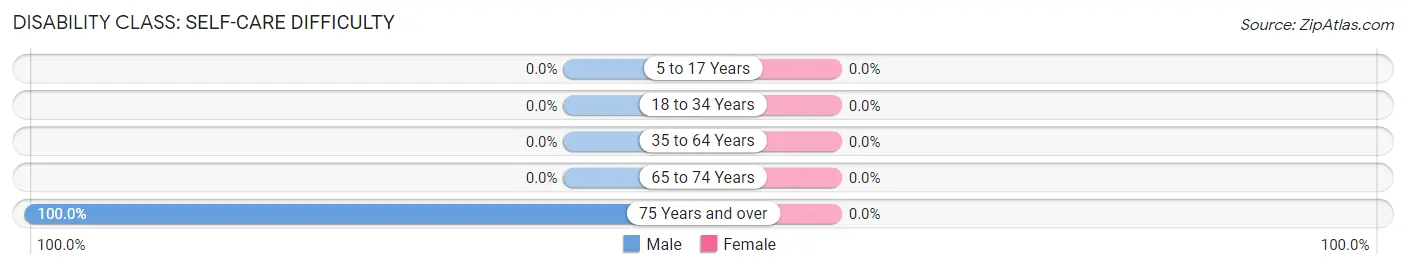
| Age Bracket | Male | Female |
| 5 to 17 Years | 0 (0.0%) | 0 (0.0%) |
| 18 to 34 Years | 0 (0.0%) | 0 (0.0%) |
| 35 to 64 Years | 0 (0.0%) | 0 (0.0%) |
| 65 to 74 Years | 0 (0.0%) | 0 (0.0%) |
| 75 Years and over | 1 (100.0%) | 0 (0.0%) |
Technology Access in Kilkenny
Computing Device Access in Kilkenny
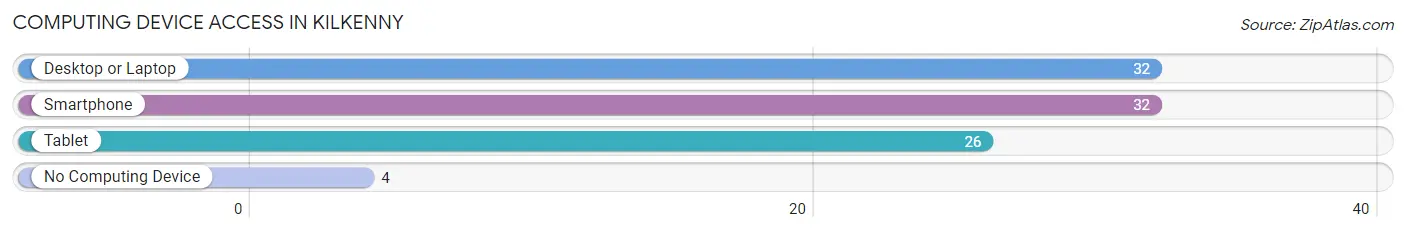
| Device Type | # Households | % Households |
| Desktop or Laptop | 32 | 78.0% |
| Smartphone | 32 | 78.0% |
| Tablet | 26 | 63.4% |
| No Computing Device | 4 | 9.8% |
| Total | 41 | 100.0% |
Internet Access in Kilkenny
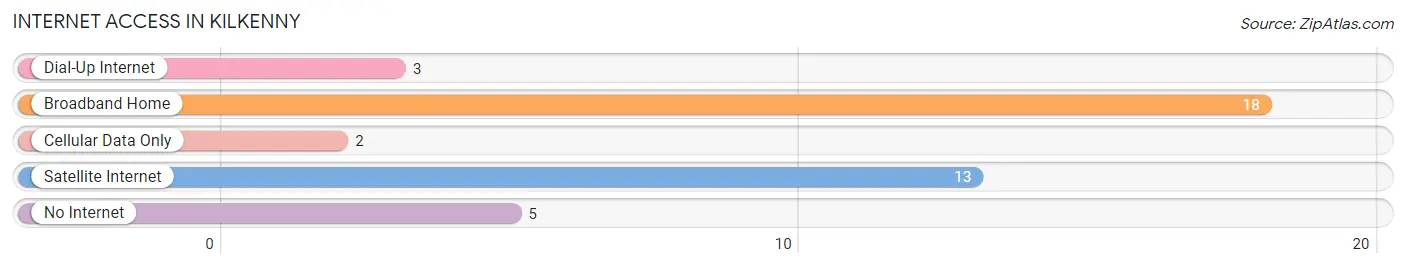
| Internet Type | # Households | % Households |
| Dial-Up Internet | 3 | 7.3% |
| Broadband Home | 18 | 43.9% |
| Cellular Data Only | 2 | 4.9% |
| Satellite Internet | 13 | 31.7% |
| No Internet | 5 | 12.2% |
| Total | 41 | 100.0% |
Kilkenny Summary
Kilkenny is a small city located in the state of Minnesota, United States. It is situated in the southeastern part of the state, in the county of Le Sueur. The city has a population of approximately 1,000 people, and is located about 40 miles southwest of Minneapolis.
Kilkenny was founded in 1856 by Irish immigrants who had come to the area to work in the local lumber industry. The city was named after the Irish city of Kilkenny, and the Irish influence is still evident in the city today. The city is home to a number of historic buildings, including the Kilkenny Hotel, which was built in 1872 and is now listed on the National Register of Historic Places.
Geographically, Kilkenny is located in the Minnesota River Valley, which is part of the larger Minnesota River Basin. The city is situated on the banks of the Minnesota River, and is surrounded by rolling hills and farmland. The city is also located near the junction of Interstate 35 and Highway 169, which provides easy access to the Twin Cities metropolitan area.
Kilkenny's economy is largely based on agriculture and manufacturing. The city is home to several large agricultural operations, including a dairy farm, a hog farm, and a poultry farm. The city also has a number of manufacturing companies, including a plastics manufacturer, a metal fabricator, and a machine shop. In addition, the city is home to a number of small businesses, including restaurants, retail stores, and service providers.
Kilkenny's population is largely white, with a small percentage of African Americans and Hispanics. The median household income in the city is approximately $45,000, and the median home value is around $150,000. The city has a low unemployment rate, and the cost of living is relatively low.
Kilkenny is served by the Le Sueur-Henderson School District, which provides public education to the city's students. The city also has a number of private schools, including a Catholic school and a Lutheran school. The city is home to a number of parks and recreational facilities, including a public swimming pool, a golf course, and a skate park.
Kilkenny is a small city with a rich history and a vibrant economy. The city is home to a number of historic buildings, and its economy is largely based on agriculture and manufacturing. The city is served by the Le Sueur-Henderson School District, and is home to a number of parks and recreational facilities. The city has a low unemployment rate, and the cost of living is relatively low. Kilkenny is a great place to live and work, and is a great place to raise a family.
Common Questions
What is Per Capita Income in Kilkenny?
Per Capita income in Kilkenny is $28,368.
What is Inequality or Gini Index in Kilkenny?
Inequality or Gini Index in Kilkenny is 0.44.
What is the Total Population of Kilkenny?
Total Population of Kilkenny is 76.
What is the Total Male Population of Kilkenny?
Total Male Population of Kilkenny is 35.
What is the Total Female Population of Kilkenny?
Total Female Population of Kilkenny is 41.
What is the Ratio of Males per 100 Females in Kilkenny?
There are 85.37 Males per 100 Females in Kilkenny.
What is the Ratio of Females per 100 Males in Kilkenny?
There are 117.14 Females per 100 Males in Kilkenny.
What is the Median Population Age in Kilkenny?
Median Population Age in Kilkenny is 53.7 Years.
What is the Average Family Size in Kilkenny
Average Family Size in Kilkenny is 2.4 People.
What is the Average Household Size in Kilkenny
Average Household Size in Kilkenny is 1.9 People.
How Large is the Labor Force in Kilkenny?
There are 32 People in the Labor Forcein in Kilkenny.
What is the Percentage of People in the Labor Force in Kilkenny?
53.3% of People are in the Labor Force in Kilkenny.
What is the Unemployment Rate in Kilkenny?
Unemployment Rate in Kilkenny is 3.1%.