Stockton, MN Map & Demographics
Stockton Map
Stockton Overview
$32,228
PER CAPITA INCOME
$83,750
AVG FAMILY INCOME
$71,111
AVG HOUSEHOLD INCOME
18.3%
WAGE / INCOME GAP [ % ]
81.7¢/ $1
WAGE / INCOME GAP [ $ ]
0.34
INEQUALITY / GINI INDEX
723
TOTAL POPULATION
365
MALE POPULATION
358
FEMALE POPULATION
101.96
MALES / 100 FEMALES
98.08
FEMALES / 100 MALES
36.4
MEDIAN AGE
3.1
AVG FAMILY SIZE
2.6
AVG HOUSEHOLD SIZE
390
LABOR FORCE [ PEOPLE ]
76.0%
PERCENT IN LABOR FORCE
3.8%
UNEMPLOYMENT RATE
Stockton Area Codes
Income in Stockton
Income Overview in Stockton
Per Capita Income in Stockton is $32,228, while median incomes of families and households are $83,750 and $71,111 respectively.
| Characteristic | Number | Measure |
| Per Capita Income | 723 | $32,228 |
| Median Family Income | 188 | $83,750 |
| Mean Family Income | 188 | $92,163 |
| Median Household Income | 280 | $71,111 |
| Mean Household Income | 280 | $82,219 |
| Income Deficit | 188 | $0 |
| Wage / Income Gap (%) | 723 | 18.33% |
| Wage / Income Gap ($) | 723 | 81.67¢ per $1 |
| Gini / Inequality Index | 723 | 0.34 |
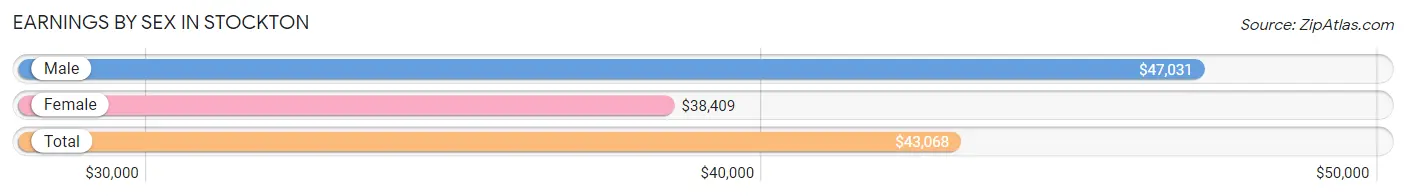
Earnings by Sex in Stockton
Average Earnings in Stockton are $43,068, $47,031 for men and $38,409 for women, a difference of 18.3%.
| Sex | Number | Average Earnings |
| Male | 217 (53.8%) | $47,031 |
| Female | 186 (46.2%) | $38,409 |
| Total | 403 (100.0%) | $43,068 |
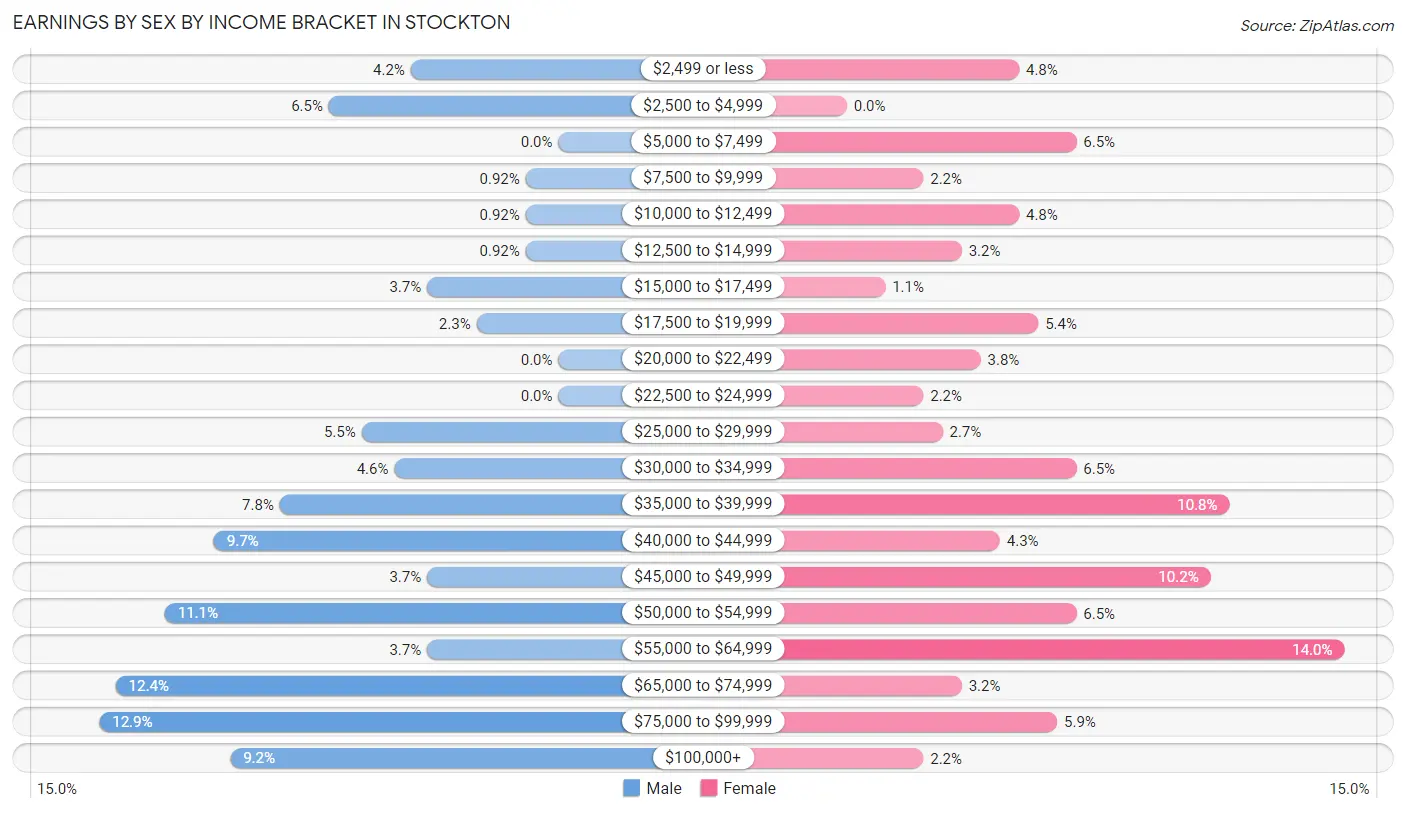
Earnings by Sex by Income Bracket in Stockton
The most common earnings brackets in Stockton are $75,000 to $99,999 for men (28 | 12.9%) and $55,000 to $64,999 for women (26 | 14.0%).
| Income | Male | Female |
| $2,499 or less | 9 (4.2%) | 9 (4.8%) |
| $2,500 to $4,999 | 14 (6.5%) | 0 (0.0%) |
| $5,000 to $7,499 | 0 (0.0%) | 12 (6.5%) |
| $7,500 to $9,999 | 2 (0.9%) | 4 (2.1%) |
| $10,000 to $12,499 | 2 (0.9%) | 9 (4.8%) |
| $12,500 to $14,999 | 2 (0.9%) | 6 (3.2%) |
| $15,000 to $17,499 | 8 (3.7%) | 2 (1.1%) |
| $17,500 to $19,999 | 5 (2.3%) | 10 (5.4%) |
| $20,000 to $22,499 | 0 (0.0%) | 7 (3.8%) |
| $22,500 to $24,999 | 0 (0.0%) | 4 (2.1%) |
| $25,000 to $29,999 | 12 (5.5%) | 5 (2.7%) |
| $30,000 to $34,999 | 10 (4.6%) | 12 (6.5%) |
| $35,000 to $39,999 | 17 (7.8%) | 20 (10.7%) |
| $40,000 to $44,999 | 21 (9.7%) | 8 (4.3%) |
| $45,000 to $49,999 | 8 (3.7%) | 19 (10.2%) |
| $50,000 to $54,999 | 24 (11.1%) | 12 (6.5%) |
| $55,000 to $64,999 | 8 (3.7%) | 26 (14.0%) |
| $65,000 to $74,999 | 27 (12.4%) | 6 (3.2%) |
| $75,000 to $99,999 | 28 (12.9%) | 11 (5.9%) |
| $100,000+ | 20 (9.2%) | 4 (2.1%) |
| Total | 217 (100.0%) | 186 (100.0%) |
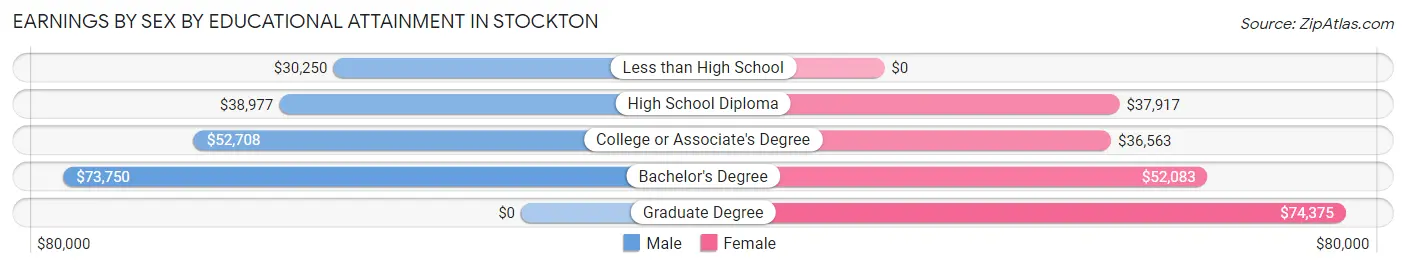
Earnings by Sex by Educational Attainment in Stockton
Average earnings in Stockton are $52,692 for men and $40,536 for women, a difference of 23.1%. Men with an educational attainment of bachelor's degree enjoy the highest average annual earnings of $73,750, while those with less than high school education earn the least with $30,250. Women with an educational attainment of graduate degree earn the most with the average annual earnings of $74,375, while those with college or associate's degree education have the smallest earnings of $36,563.
| Educational Attainment | Male Income | Female Income |
| Less than High School | $30,250 | $0 |
| High School Diploma | $38,977 | $37,917 |
| College or Associate's Degree | $52,708 | $36,563 |
| Bachelor's Degree | $73,750 | $52,083 |
| Graduate Degree | - | - |
| Total | $52,692 | $40,536 |
Family Income in Stockton
Family Income Brackets in Stockton
According to the Stockton family income data, there are 40 families falling into the $100,000 to $149,999 income range, which is the most common income bracket and makes up 21.3% of all families.
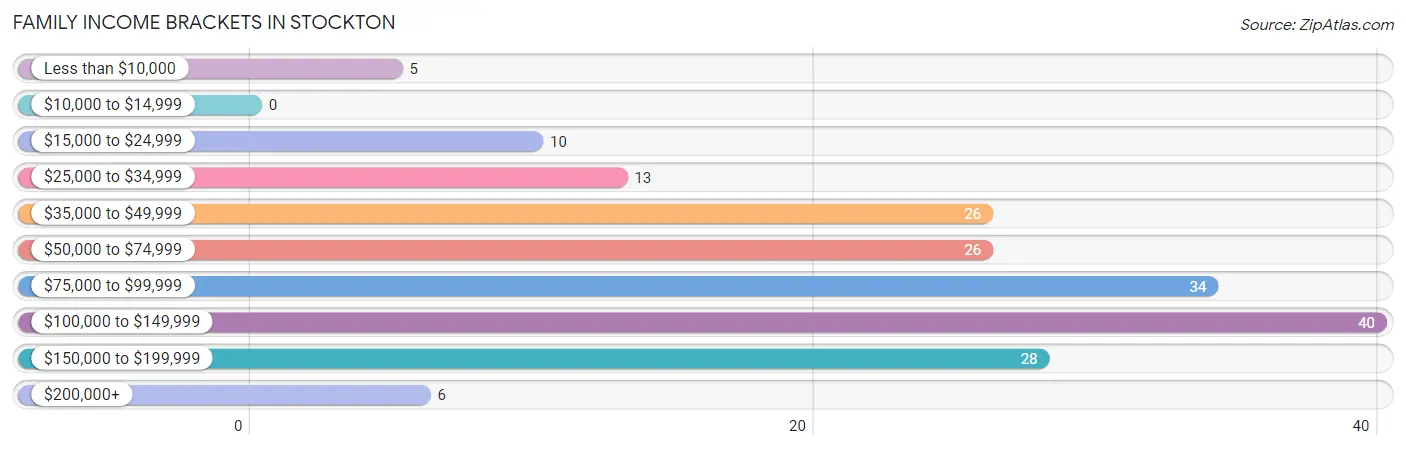
| Income Bracket | # Families | % Families |
| Less than $10,000 | 5 | 2.7% |
| $10,000 to $14,999 | 0 | 0.0% |
| $15,000 to $24,999 | 10 | 5.3% |
| $25,000 to $34,999 | 13 | 6.9% |
| $35,000 to $49,999 | 26 | 13.8% |
| $50,000 to $74,999 | 26 | 13.8% |
| $75,000 to $99,999 | 34 | 18.1% |
| $100,000 to $149,999 | 40 | 21.3% |
| $150,000 to $199,999 | 28 | 14.9% |
| $200,000+ | 6 | 3.2% |
Family Income by Famaliy Size in Stockton
5-person families (17 | 9.0%) account for the highest median family income in Stockton with $175,729 per family, while 5-person families (17 | 9.0%) have the highest median income of $35,146 per family member.
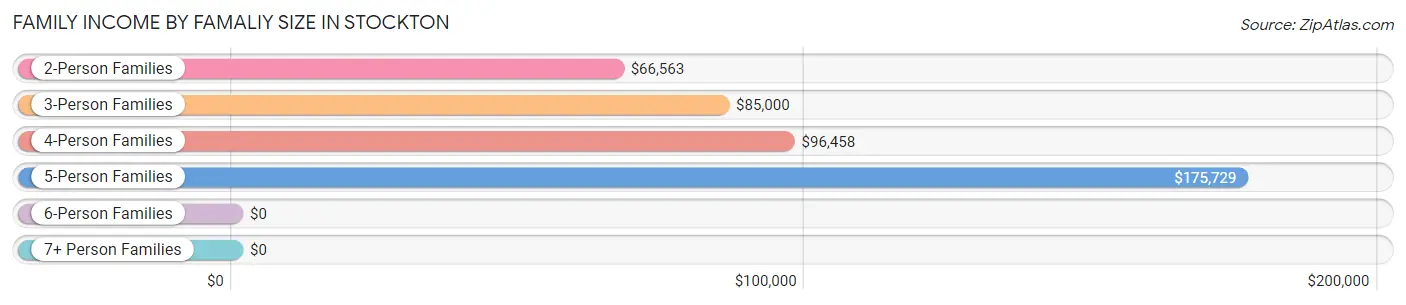
| Income Bracket | # Families | Median Income |
| 2-Person Families | 88 (46.8%) | $66,563 |
| 3-Person Families | 42 (22.3%) | $85,000 |
| 4-Person Families | 37 (19.7%) | $96,458 |
| 5-Person Families | 17 (9.0%) | $175,729 |
| 6-Person Families | 4 (2.1%) | $0 |
| 7+ Person Families | 0 (0.0%) | $0 |
| Total | 188 (100.0%) | $83,750 |
Family Income by Number of Earners in Stockton
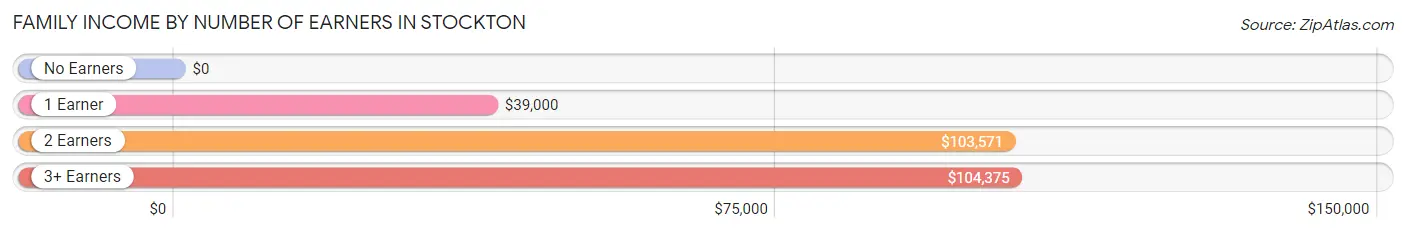
| Number of Earners | # Families | Median Income |
| No Earners | 19 (10.1%) | $0 |
| 1 Earner | 46 (24.5%) | $39,000 |
| 2 Earners | 106 (56.4%) | $103,571 |
| 3+ Earners | 17 (9.0%) | $104,375 |
| Total | 188 (100.0%) | $83,750 |
Household Income in Stockton
Household Income Brackets in Stockton
With 64 households falling in the category, the $35,000 to $49,999 income range is the most frequent in Stockton, accounting for 22.9% of all households. In contrast, only 2 households (0.7%) fall into the less than $10,000 income bracket, making it the least populous group.
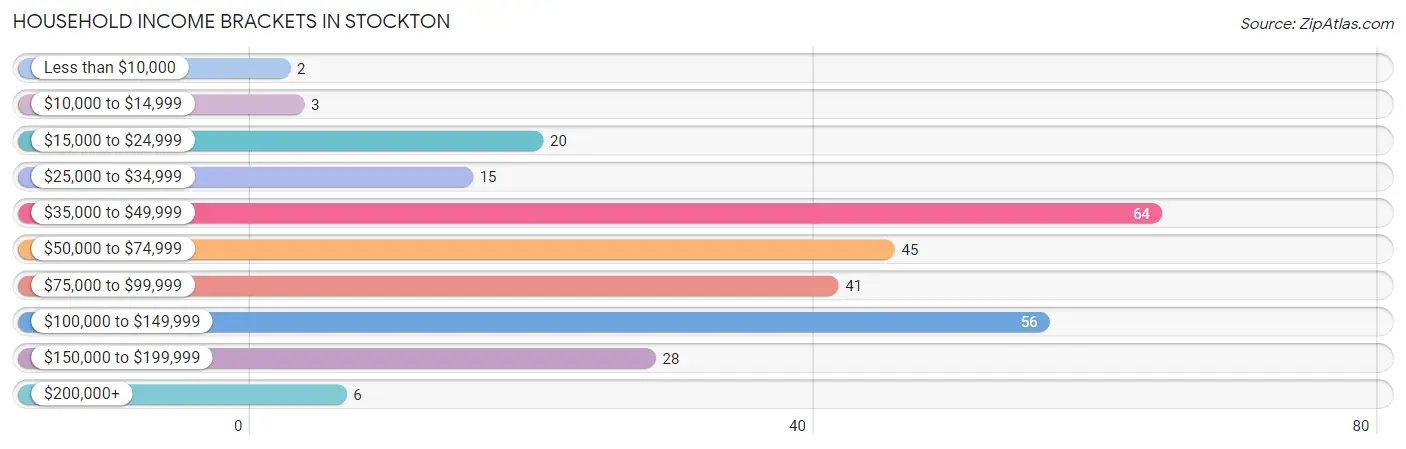
| Income Bracket | # Households | % Households |
| Less than $10,000 | 2 | 0.7% |
| $10,000 to $14,999 | 3 | 1.1% |
| $15,000 to $24,999 | 20 | 7.1% |
| $25,000 to $34,999 | 15 | 5.4% |
| $35,000 to $49,999 | 64 | 22.9% |
| $50,000 to $74,999 | 45 | 16.1% |
| $75,000 to $99,999 | 41 | 14.6% |
| $100,000 to $149,999 | 56 | 20.0% |
| $150,000 to $199,999 | 28 | 10.0% |
| $200,000+ | 6 | 2.1% |
Household Income by Householder Age in Stockton
The median household income in Stockton is $71,111, with the highest median household income of $96,964 found in the 25 to 44 years age bracket for the primary householder. A total of 119 households (42.5%) fall into this category. Meanwhile, the 65+ years age bracket for the primary householder has the lowest median household income of $43,333, with 68 households (24.3%) in this group.
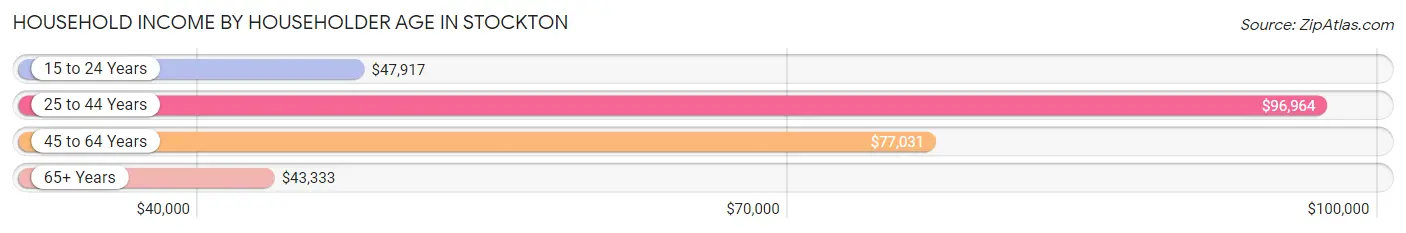
| Income Bracket | # Households | Median Income |
| 15 to 24 Years | 16 (5.7%) | $47,917 |
| 25 to 44 Years | 119 (42.5%) | $96,964 |
| 45 to 64 Years | 77 (27.5%) | $77,031 |
| 65+ Years | 68 (24.3%) | $43,333 |
| Total | 280 (100.0%) | $71,111 |
Poverty in Stockton
Income Below Poverty by Sex and Age in Stockton
With 4.4% poverty level for males and 9.1% for females among the residents of Stockton, 18 to 24 year old males and 18 to 24 year old females are the most vulnerable to poverty, with 7 males (21.9%) and 7 females (36.8%) in their respective age groups living below the poverty level.
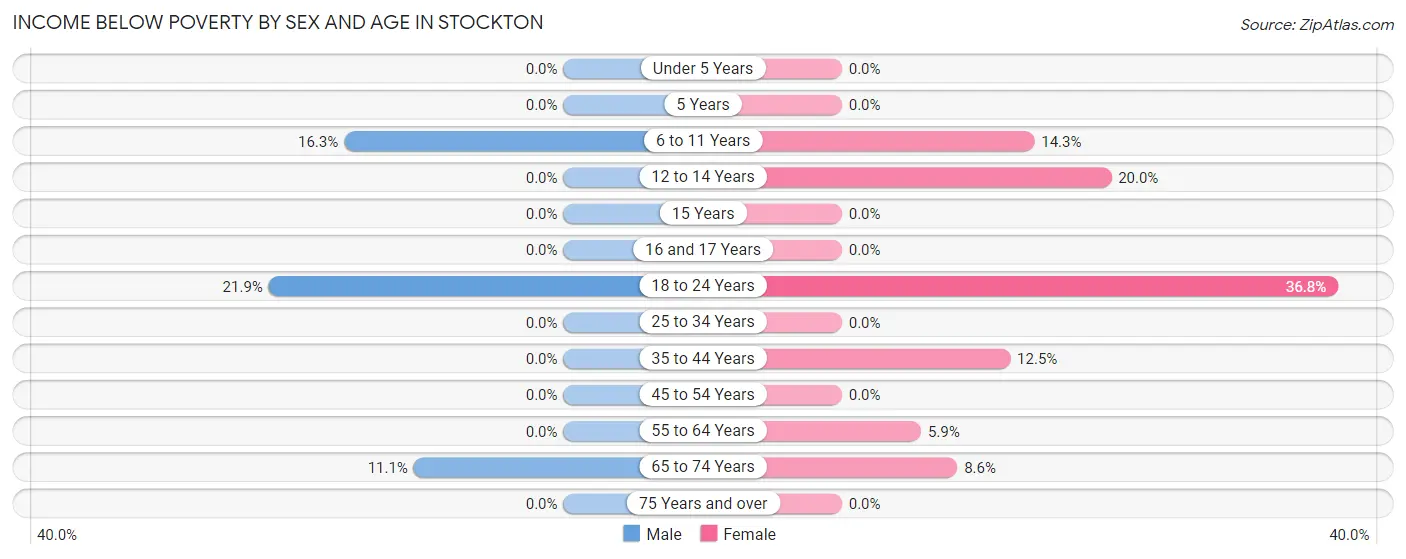
| Age Bracket | Male | Female |
| Under 5 Years | 0 (0.0%) | 0 (0.0%) |
| 5 Years | 0 (0.0%) | 0 (0.0%) |
| 6 to 11 Years | 7 (16.3%) | 7 (14.3%) |
| 12 to 14 Years | 0 (0.0%) | 3 (20.0%) |
| 15 Years | 0 (0.0%) | 0 (0.0%) |
| 16 and 17 Years | 0 (0.0%) | 0 (0.0%) |
| 18 to 24 Years | 7 (21.9%) | 7 (36.8%) |
| 25 to 34 Years | 0 (0.0%) | 0 (0.0%) |
| 35 to 44 Years | 0 (0.0%) | 10 (12.5%) |
| 45 to 54 Years | 0 (0.0%) | 0 (0.0%) |
| 55 to 64 Years | 0 (0.0%) | 2 (5.9%) |
| 65 to 74 Years | 2 (11.1%) | 3 (8.6%) |
| 75 Years and over | 0 (0.0%) | 0 (0.0%) |
| Total | 16 (4.4%) | 32 (9.1%) |
Income Above Poverty by Sex and Age in Stockton
According to the poverty statistics in Stockton, males aged under 5 years and females aged under 5 years are the age groups that are most secure financially, with 100.0% of males and 100.0% of females in these age groups living above the poverty line.
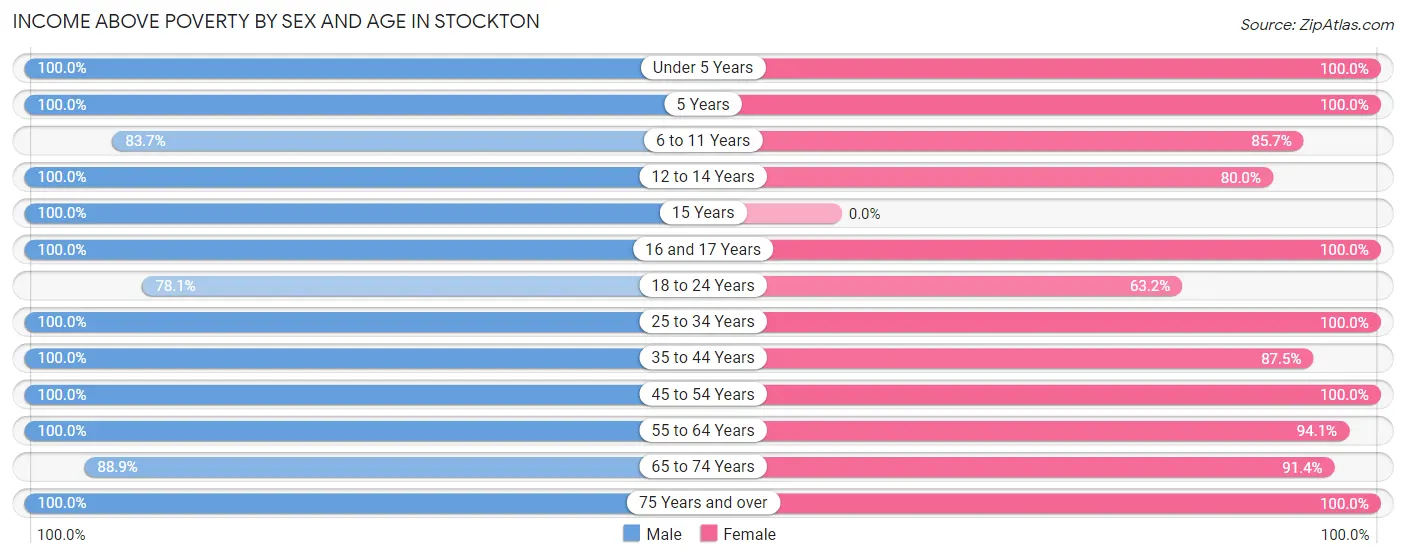
| Age Bracket | Male | Female |
| Under 5 Years | 22 (100.0%) | 41 (100.0%) |
| 5 Years | 3 (100.0%) | 7 (100.0%) |
| 6 to 11 Years | 36 (83.7%) | 42 (85.7%) |
| 12 to 14 Years | 12 (100.0%) | 12 (80.0%) |
| 15 Years | 8 (100.0%) | 0 (0.0%) |
| 16 and 17 Years | 3 (100.0%) | 8 (100.0%) |
| 18 to 24 Years | 25 (78.1%) | 12 (63.2%) |
| 25 to 34 Years | 39 (100.0%) | 30 (100.0%) |
| 35 to 44 Years | 79 (100.0%) | 70 (87.5%) |
| 45 to 54 Years | 37 (100.0%) | 27 (100.0%) |
| 55 to 64 Years | 39 (100.0%) | 32 (94.1%) |
| 65 to 74 Years | 16 (88.9%) | 32 (91.4%) |
| 75 Years and over | 27 (100.0%) | 6 (100.0%) |
| Total | 346 (95.6%) | 319 (90.9%) |
Income Below Poverty Among Married-Couple Families in Stockton
The poverty statistics for married-couple families in Stockton show that 1.3% or 2 of the total 150 families live below the poverty line. Families with no children have the highest poverty rate of 2.4%, comprising of 2 families. On the other hand, families with 1 or 2 children have the lowest poverty rate of 0.0%, which includes 0 families.
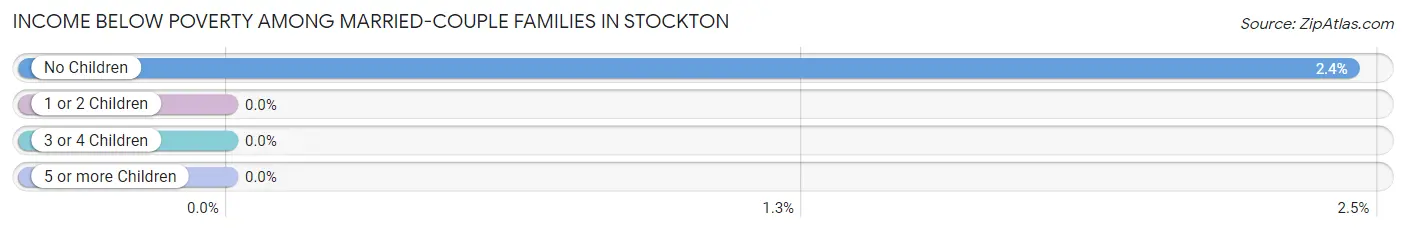
| Children | Above Poverty | Below Poverty |
| No Children | 80 (97.6%) | 2 (2.4%) |
| 1 or 2 Children | 47 (100.0%) | 0 (0.0%) |
| 3 or 4 Children | 21 (100.0%) | 0 (0.0%) |
| 5 or more Children | 0 (0.0%) | 0 (0.0%) |
| Total | 148 (98.7%) | 2 (1.3%) |
Income Below Poverty Among Single-Parent Households in Stockton
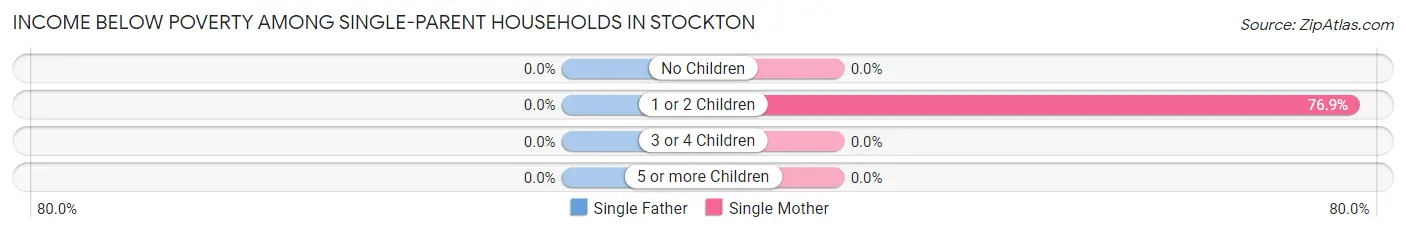
| Children | Single Father | Single Mother |
| No Children | 0 (0.0%) | 0 (0.0%) |
| 1 or 2 Children | 0 (0.0%) | 10 (76.9%) |
| 3 or 4 Children | 0 (0.0%) | 0 (0.0%) |
| 5 or more Children | 0 (0.0%) | 0 (0.0%) |
| Total | 0 (0.0%) | 10 (45.5%) |
Income Below Poverty Among Married-Couple vs Single-Parent Households in Stockton
The poverty data for Stockton shows that 2 of the married-couple family households (1.3%) and 10 of the single-parent households (26.3%) are living below the poverty level. Within the married-couple family households, those with no children have the highest poverty rate, with 2 households (2.4%) falling below the poverty line. Among the single-parent households, those with 1 or 2 children have the highest poverty rate, with 10 household (38.5%) living below poverty.
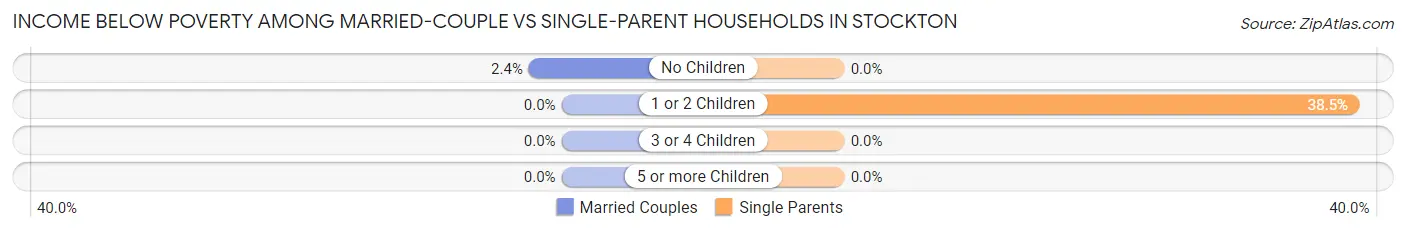
| Children | Married-Couple Families | Single-Parent Households |
| No Children | 2 (2.4%) | 0 (0.0%) |
| 1 or 2 Children | 0 (0.0%) | 10 (38.5%) |
| 3 or 4 Children | 0 (0.0%) | 0 (0.0%) |
| 5 or more Children | 0 (0.0%) | 0 (0.0%) |
| Total | 2 (1.3%) | 10 (26.3%) |
Race in Stockton
The most populous races in Stockton are White / Caucasian (654 | 90.5%), Two or more Races (63 | 8.7%), and Hispanic or Latino (46 | 6.4%).
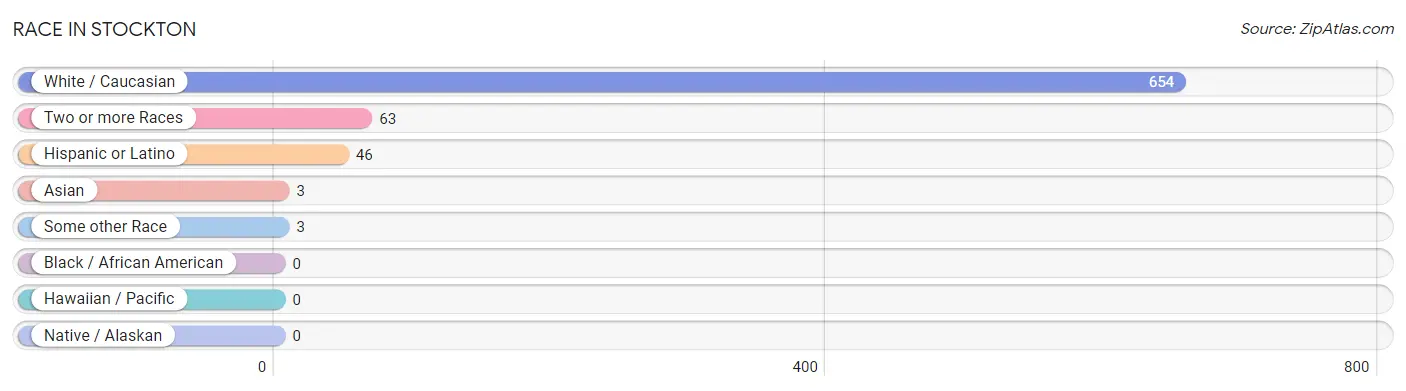
| Race | # Population | % Population |
| Asian | 3 | 0.4% |
| Black / African American | 0 | 0.0% |
| Hawaiian / Pacific | 0 | 0.0% |
| Hispanic or Latino | 46 | 6.4% |
| Native / Alaskan | 0 | 0.0% |
| White / Caucasian | 654 | 90.5% |
| Two or more Races | 63 | 8.7% |
| Some other Race | 3 | 0.4% |
| Total | 723 | 100.0% |
Ancestry in Stockton
The most populous ancestries reported in Stockton are German (354 | 49.0%), Norwegian (140 | 19.4%), Polish (86 | 11.9%), Irish (71 | 9.8%), and Mexican (46 | 6.4%), together accounting for 96.4% of all Stockton residents.
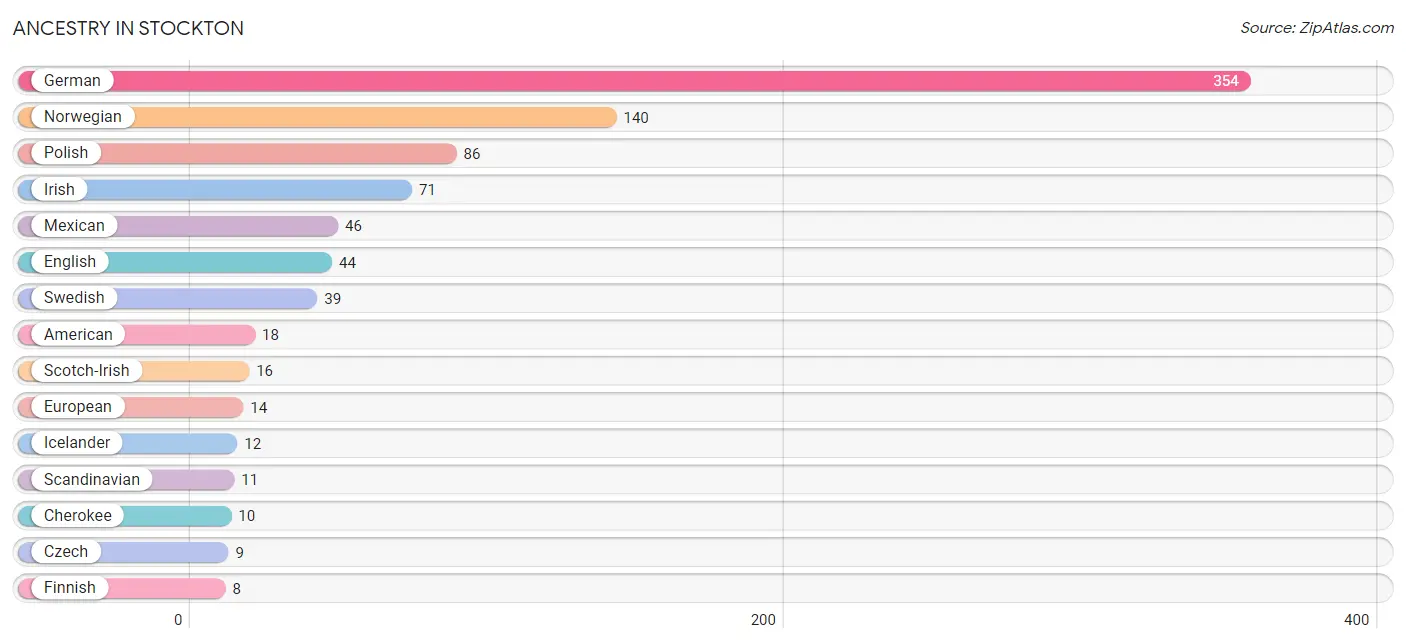
| Ancestry | # Population | % Population |
| American | 18 | 2.5% |
| Cherokee | 10 | 1.4% |
| Creek | 5 | 0.7% |
| Czech | 9 | 1.2% |
| Dutch | 7 | 1.0% |
| English | 44 | 6.1% |
| European | 14 | 1.9% |
| Finnish | 8 | 1.1% |
| French | 4 | 0.5% |
| French Canadian | 2 | 0.3% |
| German | 354 | 49.0% |
| Greek | 3 | 0.4% |
| Icelander | 12 | 1.7% |
| Irish | 71 | 9.8% |
| Korean | 8 | 1.1% |
| Luxembourger | 4 | 0.5% |
| Mexican | 46 | 6.4% |
| Norwegian | 140 | 19.4% |
| Pakistani | 2 | 0.3% |
| Polish | 86 | 11.9% |
| Scandinavian | 11 | 1.5% |
| Scotch-Irish | 16 | 2.2% |
| Swedish | 39 | 5.4% |
| Swiss | 5 | 0.7% |
| Welsh | 2 | 0.3% | View All 25 Rows |
Immigrants in Stockton
The most numerous immigrant groups reported in Stockton came from Asia (3 | 0.4%), Central America (3 | 0.4%), Latin America (3 | 0.4%), Mexico (3 | 0.4%), and Philippines (3 | 0.4%), together accounting for 2.1% of all Stockton residents.
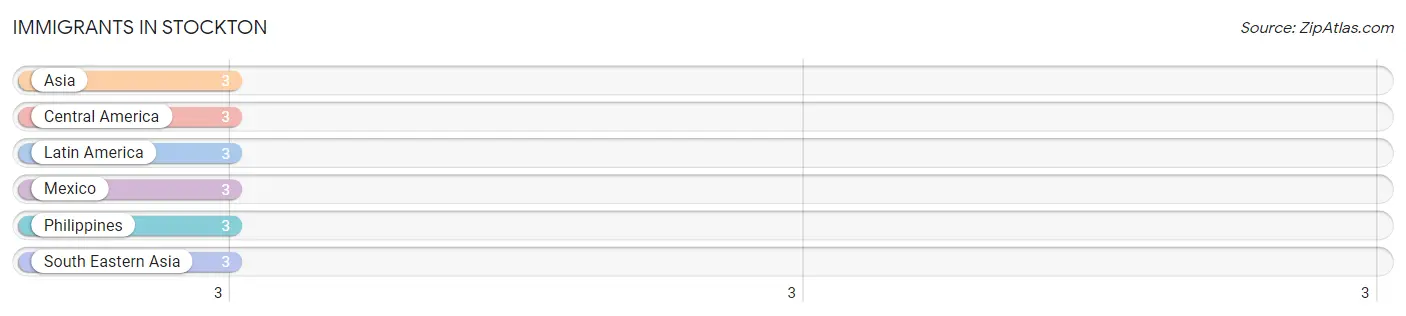
| Immigration Origin | # Population | % Population |
| Asia | 3 | 0.4% |
| Central America | 3 | 0.4% |
| Latin America | 3 | 0.4% |
| Mexico | 3 | 0.4% |
| Philippines | 3 | 0.4% |
| South Eastern Asia | 3 | 0.4% | View All 6 Rows |
Sex and Age in Stockton
Sex and Age in Stockton
The most populous age groups in Stockton are 35 to 39 Years (53 | 14.5%) for men and 35 to 39 Years (57 | 15.9%) for women.
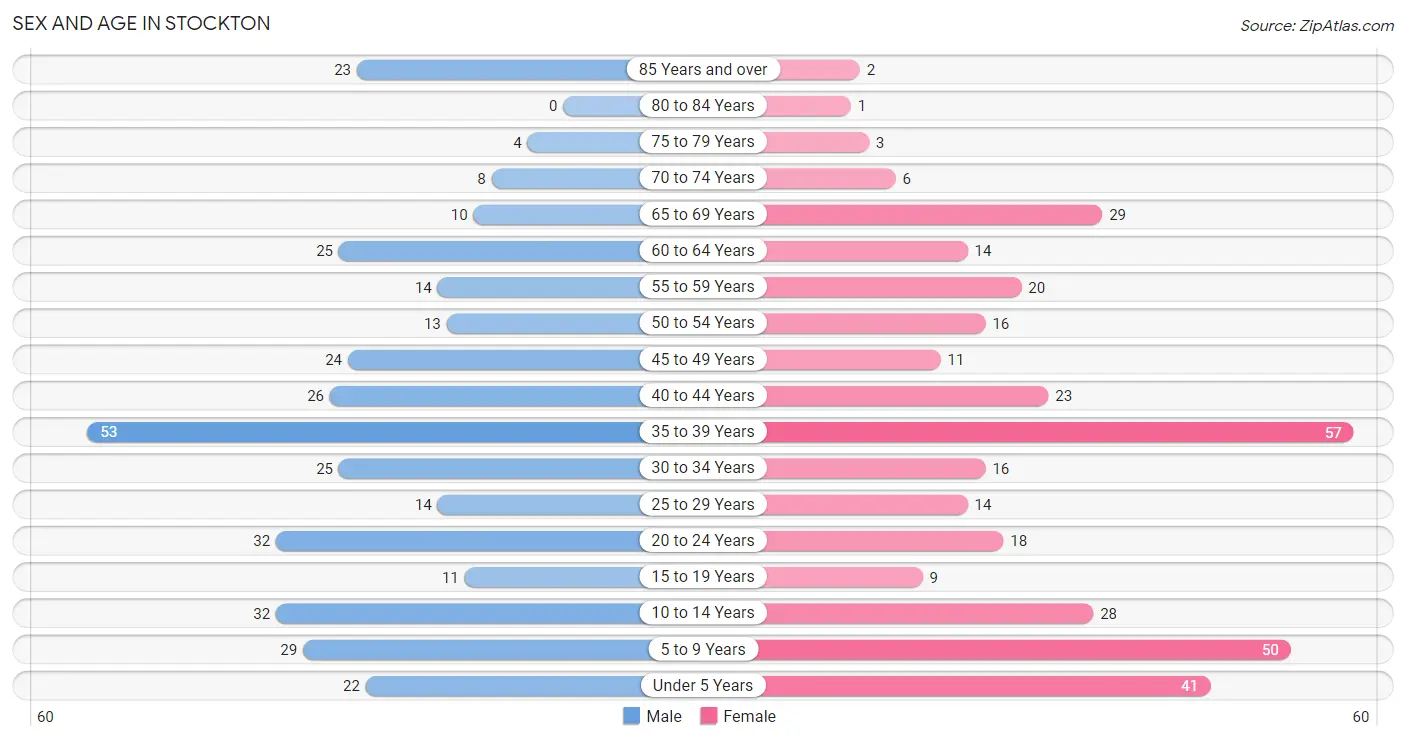
| Age Bracket | Male | Female |
| Under 5 Years | 22 (6.0%) | 41 (11.5%) |
| 5 to 9 Years | 29 (8.0%) | 50 (14.0%) |
| 10 to 14 Years | 32 (8.8%) | 28 (7.8%) |
| 15 to 19 Years | 11 (3.0%) | 9 (2.5%) |
| 20 to 24 Years | 32 (8.8%) | 18 (5.0%) |
| 25 to 29 Years | 14 (3.8%) | 14 (3.9%) |
| 30 to 34 Years | 25 (6.9%) | 16 (4.5%) |
| 35 to 39 Years | 53 (14.5%) | 57 (15.9%) |
| 40 to 44 Years | 26 (7.1%) | 23 (6.4%) |
| 45 to 49 Years | 24 (6.6%) | 11 (3.1%) |
| 50 to 54 Years | 13 (3.6%) | 16 (4.5%) |
| 55 to 59 Years | 14 (3.8%) | 20 (5.6%) |
| 60 to 64 Years | 25 (6.9%) | 14 (3.9%) |
| 65 to 69 Years | 10 (2.7%) | 29 (8.1%) |
| 70 to 74 Years | 8 (2.2%) | 6 (1.7%) |
| 75 to 79 Years | 4 (1.1%) | 3 (0.8%) |
| 80 to 84 Years | 0 (0.0%) | 1 (0.3%) |
| 85 Years and over | 23 (6.3%) | 2 (0.6%) |
| Total | 365 (100.0%) | 358 (100.0%) |
Families and Households in Stockton
Median Family Size in Stockton
The median family size in Stockton is 3.07 persons per family, with married-couple families (150 | 79.8%) accounting for the largest median family size of 3.21 persons per family. On the other hand, single female/mother families (22 | 11.7%) represent the smallest median family size with 2.50 persons per family.
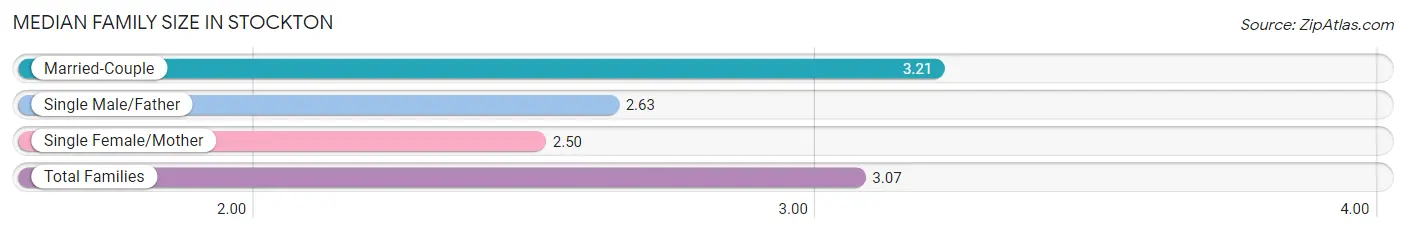
| Family Type | # Families | Family Size |
| Married-Couple | 150 (79.8%) | 3.21 |
| Single Male/Father | 16 (8.5%) | 2.63 |
| Single Female/Mother | 22 (11.7%) | 2.50 |
| Total Families | 188 (100.0%) | 3.07 |
Median Household Size in Stockton
The median household size in Stockton is 2.58 persons per household, with married-couple households (150 | 53.6%) accounting for the largest median household size of 3.21 persons per household. non-family households (92 | 32.9%) represent the smallest median household size with 1.46 persons per household.
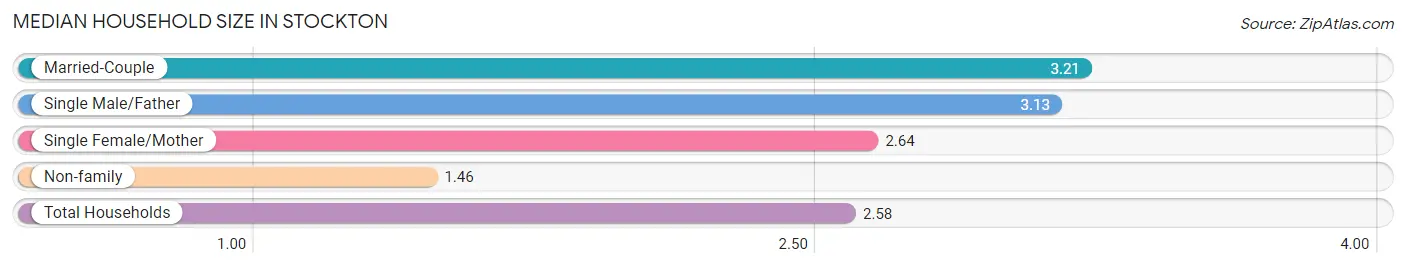
| Household Type | # Households | Household Size |
| Married-Couple | 150 (53.6%) | 3.21 |
| Single Male/Father | 16 (5.7%) | 3.13 |
| Single Female/Mother | 22 (7.9%) | 2.64 |
| Non-family | 92 (32.9%) | 1.46 |
| Total Households | 280 (100.0%) | 2.58 |
Household Size by Marriage Status in Stockton
Out of a total of 280 households in Stockton, 188 (67.1%) are family households, while 92 (32.9%) are nonfamily households. The most numerous type of family households are 2-person households, comprising 85, and the most common type of nonfamily households are 1-person households, comprising 63.
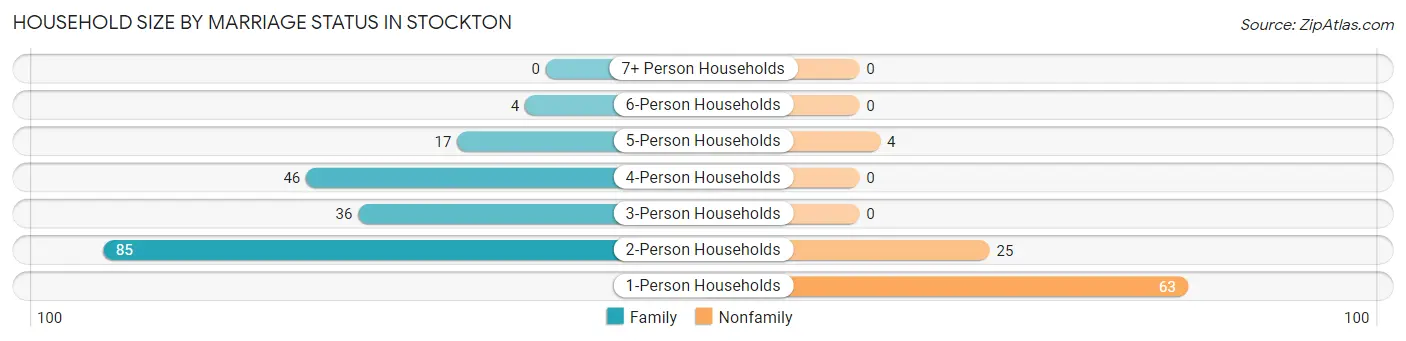
| Household Size | Family Households | Nonfamily Households |
| 1-Person Households | - | 63 (22.5%) |
| 2-Person Households | 85 (30.4%) | 25 (8.9%) |
| 3-Person Households | 36 (12.9%) | 0 (0.0%) |
| 4-Person Households | 46 (16.4%) | 0 (0.0%) |
| 5-Person Households | 17 (6.1%) | 4 (1.4%) |
| 6-Person Households | 4 (1.4%) | 0 (0.0%) |
| 7+ Person Households | 0 (0.0%) | 0 (0.0%) |
| Total | 188 (67.1%) | 92 (32.9%) |
Female Fertility in Stockton
Fertility by Age in Stockton
Average fertility rate in Stockton is 58.0 births per 1,000 women. Women in the age bracket of 15 to 19 years have the highest fertility rate with 111.0 births per 1,000 women. Women in the age bracket of 35 to 50 years acount for 55.6% of all women with births.
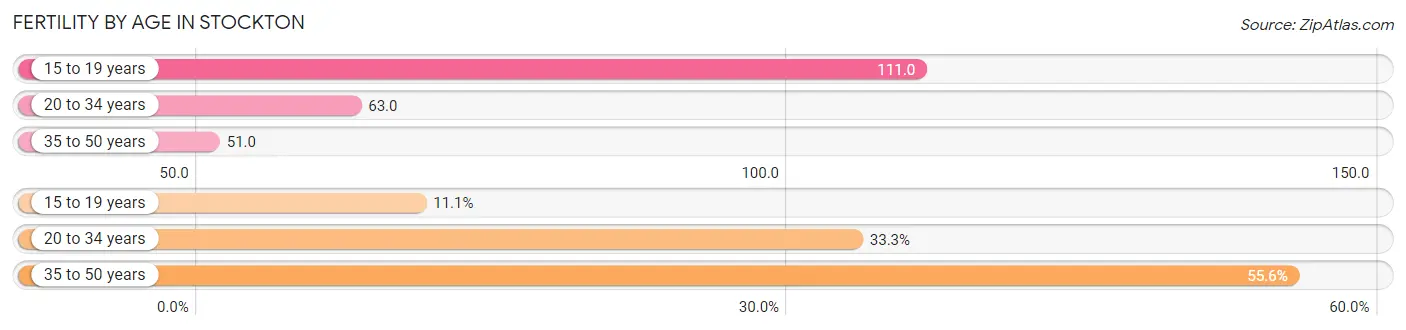
| Age Bracket | Women with Births | Births / 1,000 Women |
| 15 to 19 years | 1 (11.1%) | 111.0 |
| 20 to 34 years | 3 (33.3%) | 63.0 |
| 35 to 50 years | 5 (55.6%) | 51.0 |
| Total | 9 (100.0%) | 58.0 |
Fertility by Age by Marriage Status in Stockton
88.9% of women with births (9) in Stockton are married. The highest percentage of unmarried women with births falls into 15 to 19 years age bracket with 100.0% of them unmarried at the time of birth, while the lowest percentage of unmarried women with births belong to 20 to 34 years age bracket with 0.0% of them unmarried.
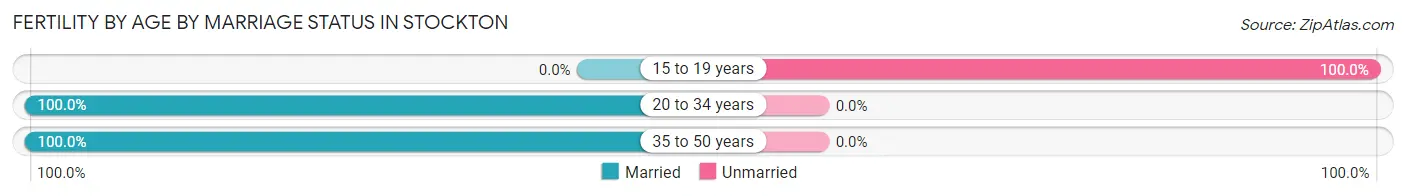
| Age Bracket | Married | Unmarried |
| 15 to 19 years | 0 (0.0%) | 1 (100.0%) |
| 20 to 34 years | 3 (100.0%) | 0 (0.0%) |
| 35 to 50 years | 5 (100.0%) | 0 (0.0%) |
| Total | 8 (88.9%) | 1 (11.1%) |
Fertility by Education in Stockton
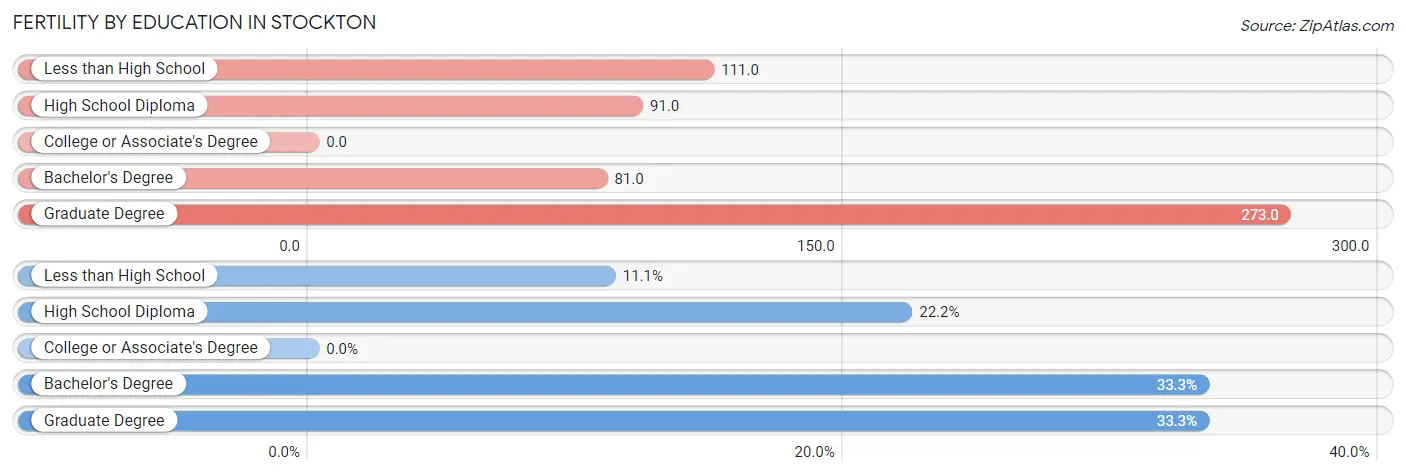
| Educational Attainment | Women with Births | Births / 1,000 Women |
| Less than High School | 1 (11.1%) | 111.0 |
| High School Diploma | 2 (22.2%) | 91.0 |
| College or Associate's Degree | 0 (0.0%) | 0.0 |
| Bachelor's Degree | 3 (33.3%) | 81.0 |
| Graduate Degree | 3 (33.3%) | 273.0 |
| Total | 9 (100.0%) | 58.0 |
Fertility by Education by Marriage Status in Stockton
11.1% of women with births in Stockton are unmarried. Women with the educational attainment of high school diploma are most likely to be married with 100.0% of them married at childbirth, while women with the educational attainment of less than high school are least likely to be married with 100.0% of them unmarried at childbirth.
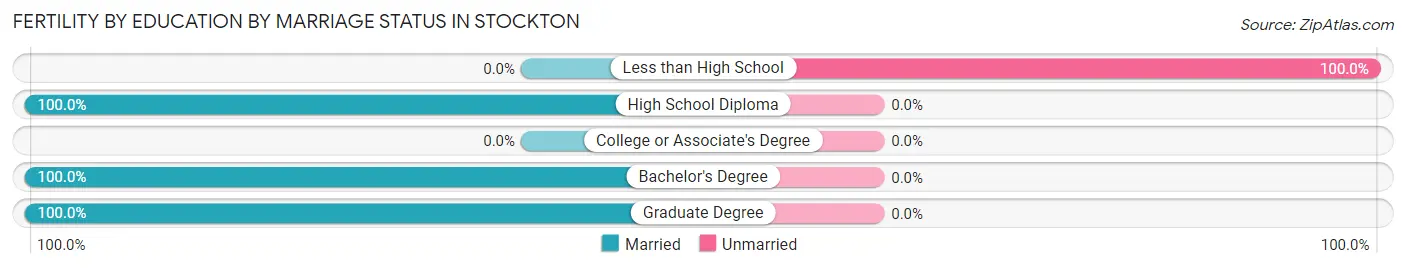
| Educational Attainment | Married | Unmarried |
| Less than High School | 0 (0.0%) | 1 (100.0%) |
| High School Diploma | 2 (100.0%) | 0 (0.0%) |
| College or Associate's Degree | 0 (0.0%) | 0 (0.0%) |
| Bachelor's Degree | 3 (100.0%) | 0 (0.0%) |
| Graduate Degree | 3 (100.0%) | 0 (0.0%) |
| Total | 8 (88.9%) | 1 (11.1%) |
Employment Characteristics in Stockton
Employment by Class of Employer in Stockton
Among the 375 employed individuals in Stockton, private company employees (262 | 69.9%), not-for-profit organizations (55 | 14.7%), and local government employees (22 | 5.9%) make up the most common classes of employment.
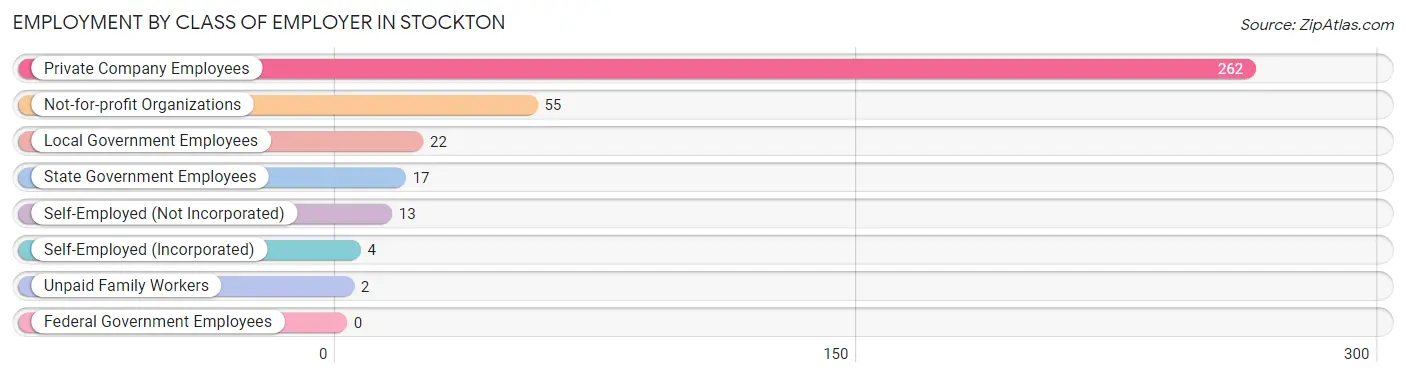
| Employer Class | # Employees | % Employees |
| Private Company Employees | 262 | 69.9% |
| Self-Employed (Incorporated) | 4 | 1.1% |
| Self-Employed (Not Incorporated) | 13 | 3.5% |
| Not-for-profit Organizations | 55 | 14.7% |
| Local Government Employees | 22 | 5.9% |
| State Government Employees | 17 | 4.5% |
| Federal Government Employees | 0 | 0.0% |
| Unpaid Family Workers | 2 | 0.5% |
| Total | 375 | 100.0% |
Employment Status by Age in Stockton
According to the labor force statistics for Stockton, out of the total population over 16 years of age (513), 76.0% or 390 individuals are in the labor force, with 3.8% or 15 of them unemployed. The age group with the highest labor force participation rate is 20 to 24 years, with 100.0% or 50 individuals in the labor force. Within the labor force, the 20 to 24 years age range has the highest percentage of unemployed individuals, with 28.0% or 14 of them being unemployed.
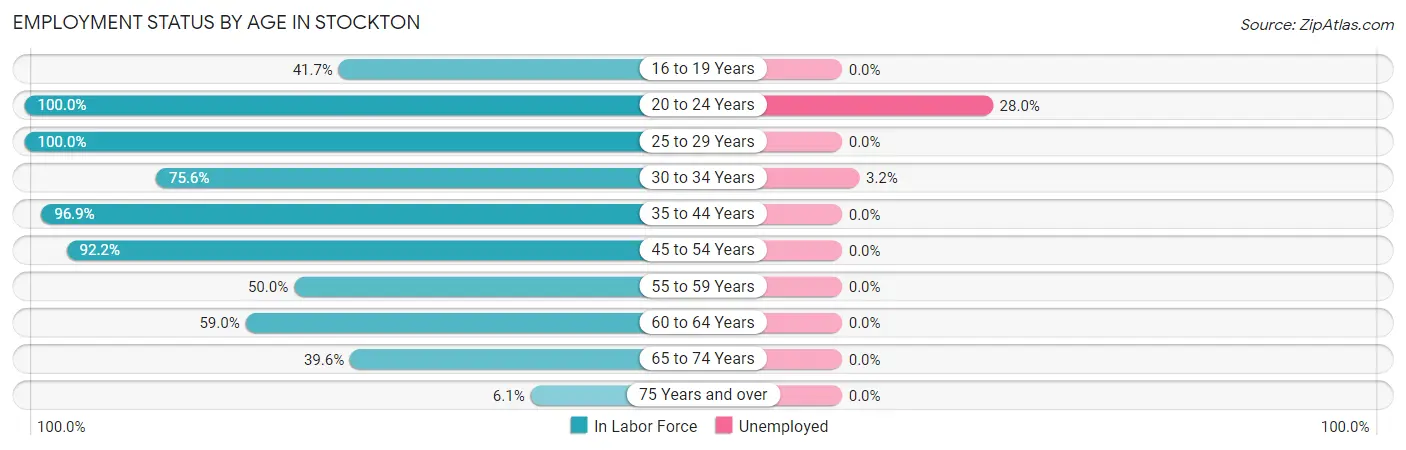
| Age Bracket | In Labor Force | Unemployed |
| 16 to 19 Years | 5 (41.7%) | 0 (0.0%) |
| 20 to 24 Years | 50 (100.0%) | 14 (28.0%) |
| 25 to 29 Years | 28 (100.0%) | 0 (0.0%) |
| 30 to 34 Years | 31 (75.6%) | 1 (3.2%) |
| 35 to 44 Years | 154 (96.9%) | 0 (0.0%) |
| 45 to 54 Years | 59 (92.2%) | 0 (0.0%) |
| 55 to 59 Years | 17 (50.0%) | 0 (0.0%) |
| 60 to 64 Years | 23 (59.0%) | 0 (0.0%) |
| 65 to 74 Years | 21 (39.6%) | 0 (0.0%) |
| 75 Years and over | 2 (6.1%) | 0 (0.0%) |
| Total | 390 (76.0%) | 15 (3.8%) |
Employment Status by Educational Attainment in Stockton
According to labor force statistics for Stockton, 85.5% of individuals (312) out of the total population between 25 and 64 years of age (365) are in the labor force, with 0.3% or 1 of them being unemployed. The group with the highest labor force participation rate are those with the educational attainment of bachelor's degree or higher, with 98.0% or 100 individuals in the labor force. Within the labor force, individuals with high school diploma education have the highest percentage of unemployment, with 1.9% or 1 of them being unemployed.
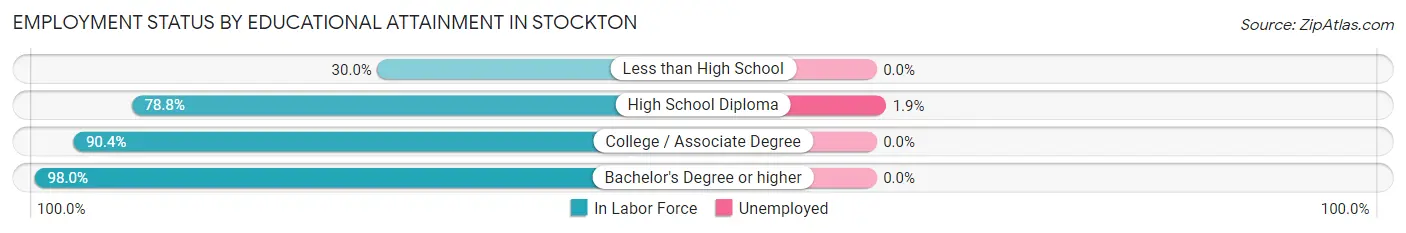
| Educational Attainment | In Labor Force | Unemployed |
| Less than High School | 9 (30.0%) | 0 (0.0%) |
| High School Diploma | 52 (78.8%) | 1 (1.9%) |
| College / Associate Degree | 151 (90.4%) | 0 (0.0%) |
| Bachelor's Degree or higher | 100 (98.0%) | 0 (0.0%) |
| Total | 312 (85.5%) | 1 (0.3%) |
Employment Occupations by Sex in Stockton
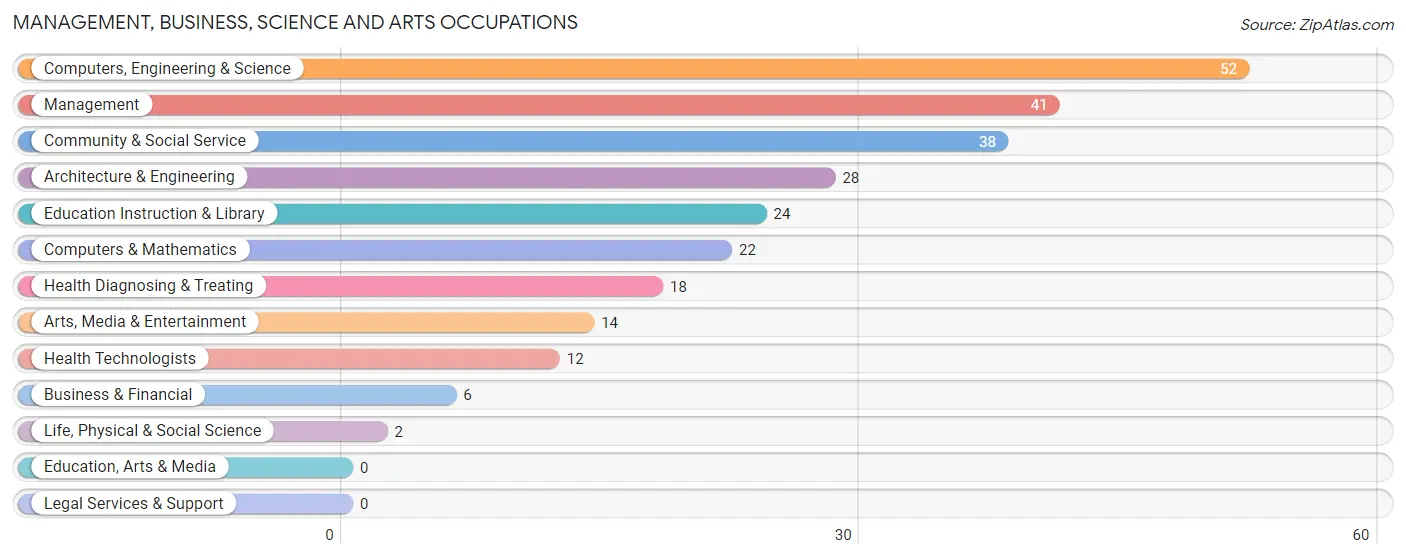
Management, Business, Science and Arts Occupations
The most common Management, Business, Science and Arts occupations in Stockton are Computers, Engineering & Science (52 | 13.9%), Management (41 | 10.9%), Community & Social Service (38 | 10.1%), Architecture & Engineering (28 | 7.5%), and Education Instruction & Library (24 | 6.4%).
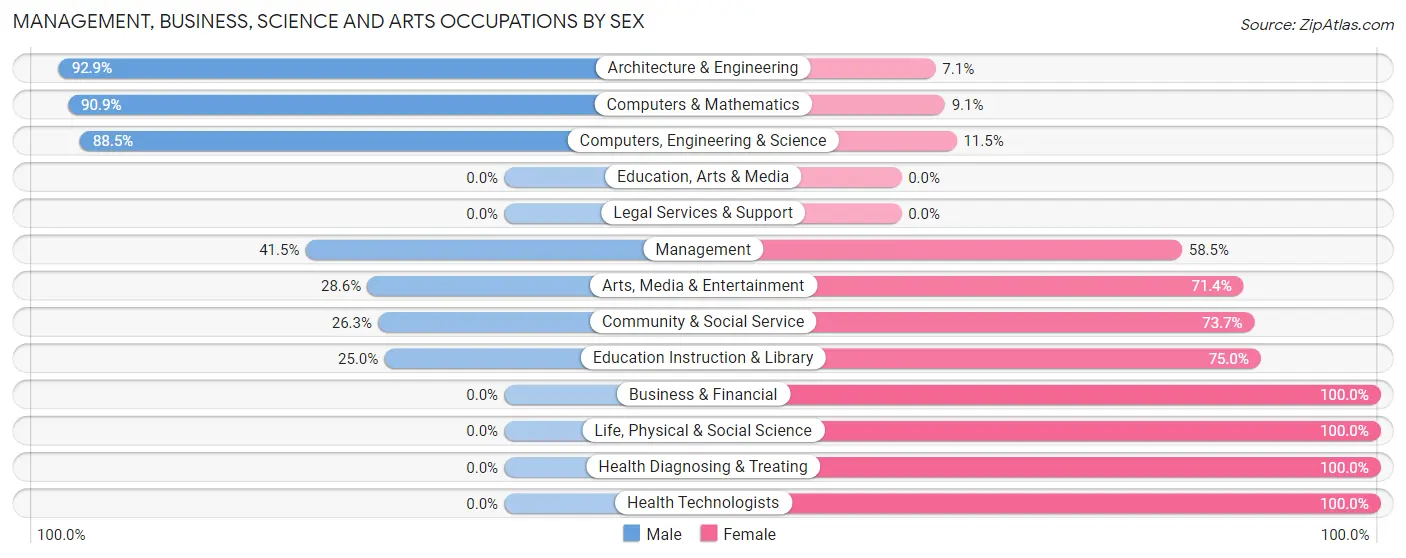
Management, Business, Science and Arts Occupations by Sex
Within the Management, Business, Science and Arts occupations in Stockton, the most male-oriented occupations are Architecture & Engineering (92.9%), Computers & Mathematics (90.9%), and Computers, Engineering & Science (88.5%), while the most female-oriented occupations are Business & Financial (100.0%), Life, Physical & Social Science (100.0%), and Health Diagnosing & Treating (100.0%).
| Occupation | Male | Female |
| Management | 17 (41.5%) | 24 (58.5%) |
| Business & Financial | 0 (0.0%) | 6 (100.0%) |
| Computers, Engineering & Science | 46 (88.5%) | 6 (11.5%) |
| Computers & Mathematics | 20 (90.9%) | 2 (9.1%) |
| Architecture & Engineering | 26 (92.9%) | 2 (7.1%) |
| Life, Physical & Social Science | 0 (0.0%) | 2 (100.0%) |
| Community & Social Service | 10 (26.3%) | 28 (73.7%) |
| Education, Arts & Media | 0 (0.0%) | 0 (0.0%) |
| Legal Services & Support | 0 (0.0%) | 0 (0.0%) |
| Education Instruction & Library | 6 (25.0%) | 18 (75.0%) |
| Arts, Media & Entertainment | 4 (28.6%) | 10 (71.4%) |
| Health Diagnosing & Treating | 0 (0.0%) | 18 (100.0%) |
| Health Technologists | 0 (0.0%) | 12 (100.0%) |
| Total (Category) | 73 (47.1%) | 82 (52.9%) |
| Total (Overall) | 196 (52.3%) | 179 (47.7%) |
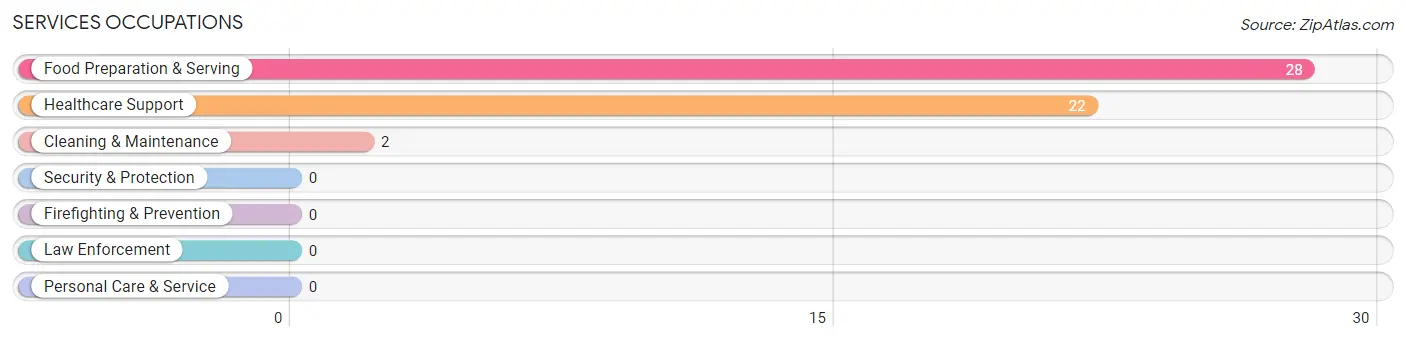
Services Occupations
The most common Services occupations in Stockton are Food Preparation & Serving (28 | 7.5%), Healthcare Support (22 | 5.9%), and Cleaning & Maintenance (2 | 0.5%).
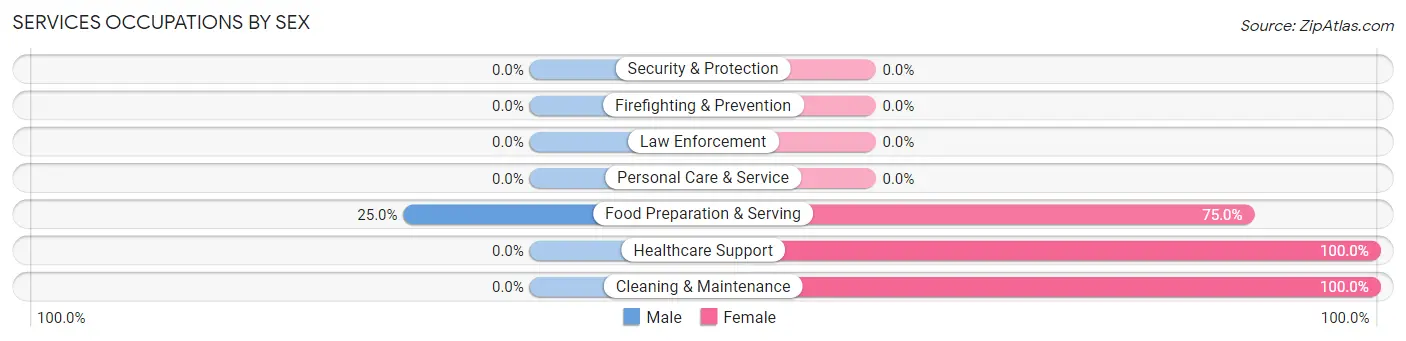
Services Occupations by Sex
| Occupation | Male | Female |
| Healthcare Support | 0 (0.0%) | 22 (100.0%) |
| Security & Protection | 0 (0.0%) | 0 (0.0%) |
| Firefighting & Prevention | 0 (0.0%) | 0 (0.0%) |
| Law Enforcement | 0 (0.0%) | 0 (0.0%) |
| Food Preparation & Serving | 7 (25.0%) | 21 (75.0%) |
| Cleaning & Maintenance | 0 (0.0%) | 2 (100.0%) |
| Personal Care & Service | 0 (0.0%) | 0 (0.0%) |
| Total (Category) | 7 (13.5%) | 45 (86.5%) |
| Total (Overall) | 196 (52.3%) | 179 (47.7%) |
Sales and Office Occupations
The most common Sales and Office occupations in Stockton are Office & Administration (34 | 9.1%), and Sales & Related (21 | 5.6%).
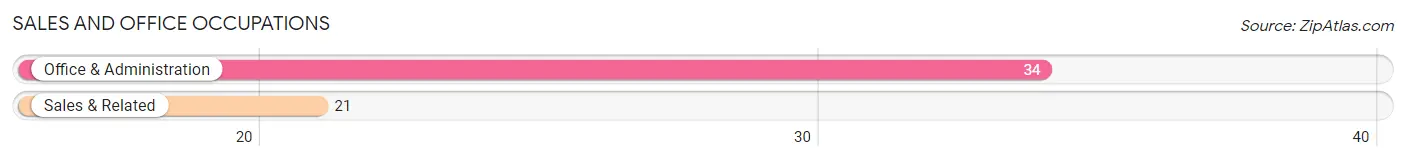
Sales and Office Occupations by Sex
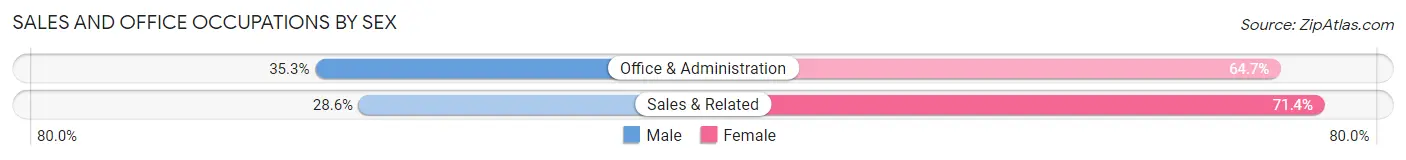
| Occupation | Male | Female |
| Sales & Related | 6 (28.6%) | 15 (71.4%) |
| Office & Administration | 12 (35.3%) | 22 (64.7%) |
| Total (Category) | 18 (32.7%) | 37 (67.3%) |
| Total (Overall) | 196 (52.3%) | 179 (47.7%) |
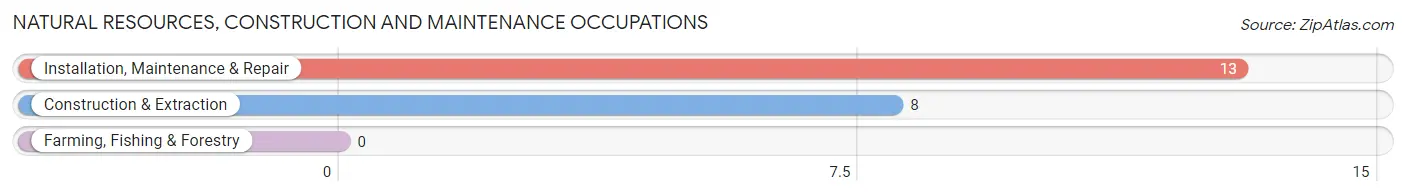
Natural Resources, Construction and Maintenance Occupations
The most common Natural Resources, Construction and Maintenance occupations in Stockton are Installation, Maintenance & Repair (13 | 3.5%), and Construction & Extraction (8 | 2.1%).
Natural Resources, Construction and Maintenance Occupations by Sex
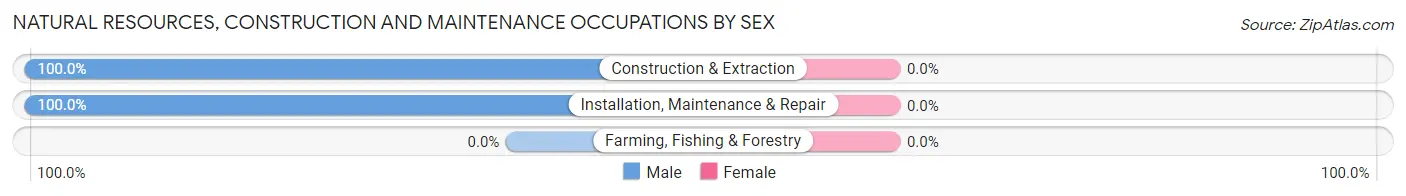
| Occupation | Male | Female |
| Farming, Fishing & Forestry | 0 (0.0%) | 0 (0.0%) |
| Construction & Extraction | 8 (100.0%) | 0 (0.0%) |
| Installation, Maintenance & Repair | 13 (100.0%) | 0 (0.0%) |
| Total (Category) | 21 (100.0%) | 0 (0.0%) |
| Total (Overall) | 196 (52.3%) | 179 (47.7%) |
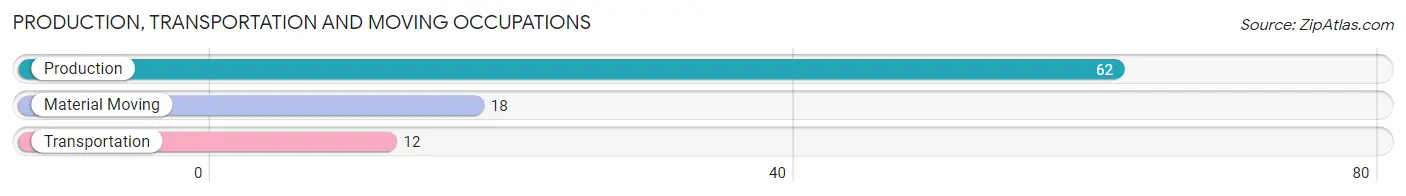
Production, Transportation and Moving Occupations
The most common Production, Transportation and Moving occupations in Stockton are Production (62 | 16.5%), Material Moving (18 | 4.8%), and Transportation (12 | 3.2%).
Production, Transportation and Moving Occupations by Sex
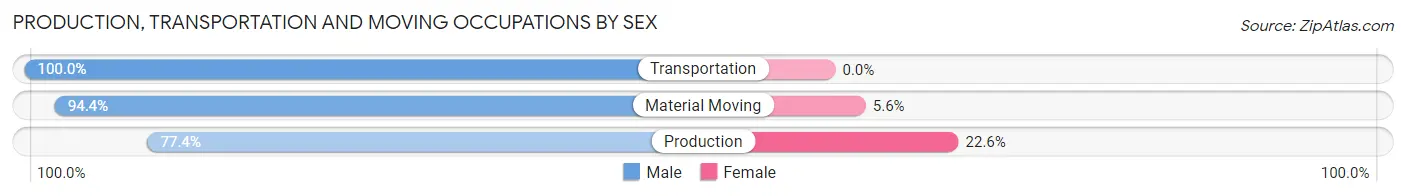
| Occupation | Male | Female |
| Production | 48 (77.4%) | 14 (22.6%) |
| Transportation | 12 (100.0%) | 0 (0.0%) |
| Material Moving | 17 (94.4%) | 1 (5.6%) |
| Total (Category) | 77 (83.7%) | 15 (16.3%) |
| Total (Overall) | 196 (52.3%) | 179 (47.7%) |
Employment Industries by Sex in Stockton
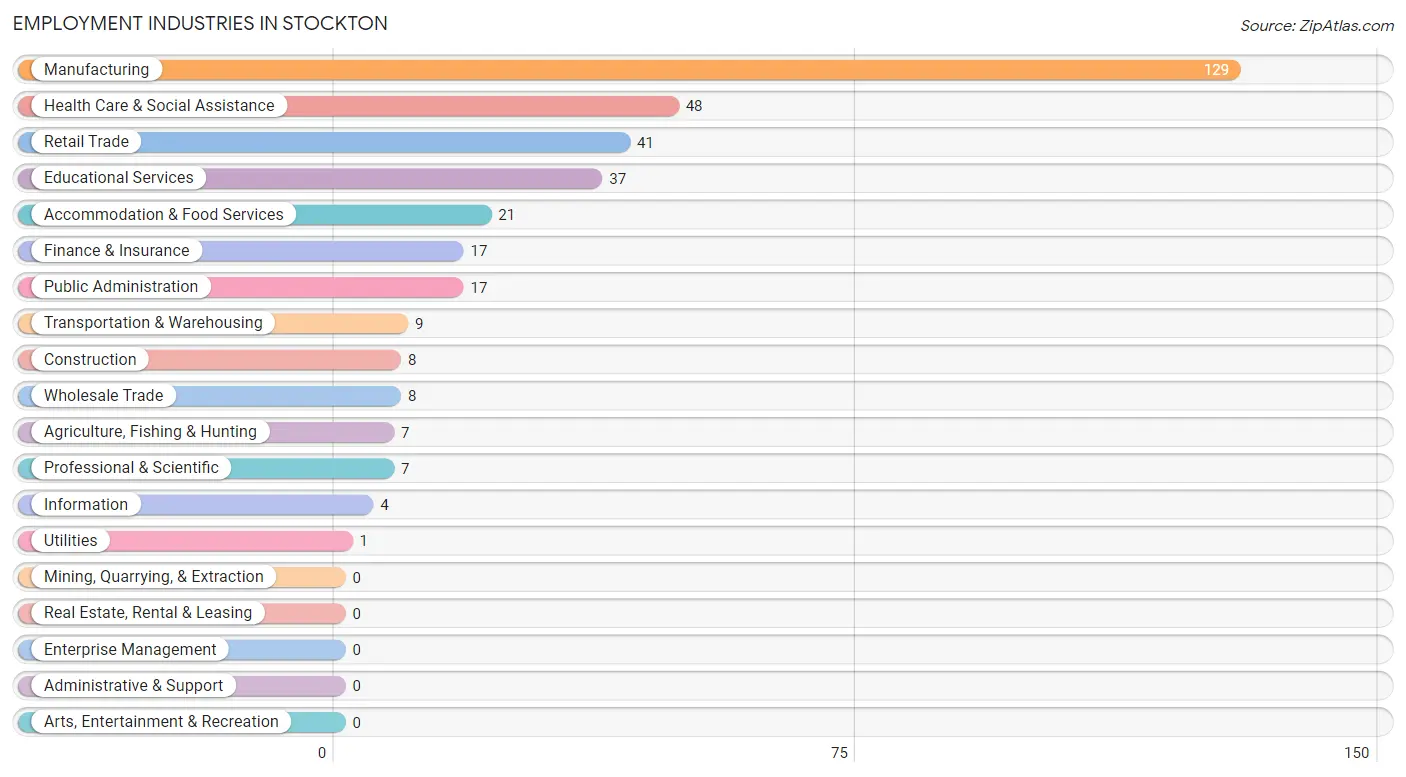
Employment Industries in Stockton
The major employment industries in Stockton include Manufacturing (129 | 34.4%), Health Care & Social Assistance (48 | 12.8%), Retail Trade (41 | 10.9%), Educational Services (37 | 9.9%), and Accommodation & Food Services (21 | 5.6%).
Employment Industries by Sex in Stockton
The Stockton industries that see more men than women are Agriculture, Fishing & Hunting (100.0%), Construction (100.0%), and Wholesale Trade (100.0%), whereas the industries that tend to have a higher number of women are Utilities (100.0%), Finance & Insurance (100.0%), and Accommodation & Food Services (100.0%).

| Industry | Male | Female |
| Agriculture, Fishing & Hunting | 7 (100.0%) | 0 (0.0%) |
| Mining, Quarrying, & Extraction | 0 (0.0%) | 0 (0.0%) |
| Construction | 8 (100.0%) | 0 (0.0%) |
| Manufacturing | 104 (80.6%) | 25 (19.4%) |
| Wholesale Trade | 8 (100.0%) | 0 (0.0%) |
| Retail Trade | 29 (70.7%) | 12 (29.3%) |
| Transportation & Warehousing | 9 (100.0%) | 0 (0.0%) |
| Utilities | 0 (0.0%) | 1 (100.0%) |
| Information | 2 (50.0%) | 2 (50.0%) |
| Finance & Insurance | 0 (0.0%) | 17 (100.0%) |
| Real Estate, Rental & Leasing | 0 (0.0%) | 0 (0.0%) |
| Professional & Scientific | 3 (42.9%) | 4 (57.1%) |
| Enterprise Management | 0 (0.0%) | 0 (0.0%) |
| Administrative & Support | 0 (0.0%) | 0 (0.0%) |
| Educational Services | 8 (21.6%) | 29 (78.4%) |
| Health Care & Social Assistance | 6 (12.5%) | 42 (87.5%) |
| Arts, Entertainment & Recreation | 0 (0.0%) | 0 (0.0%) |
| Accommodation & Food Services | 0 (0.0%) | 21 (100.0%) |
| Public Administration | 0 (0.0%) | 17 (100.0%) |
| Total | 196 (52.3%) | 179 (47.7%) |
Education in Stockton
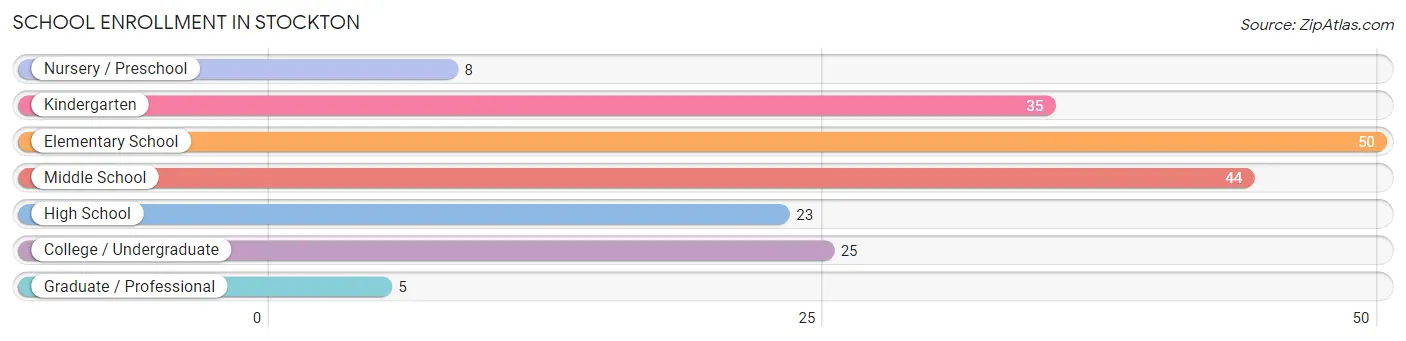
School Enrollment in Stockton
The most common levels of schooling among the 190 students in Stockton are elementary school (50 | 26.3%), middle school (44 | 23.2%), and kindergarten (35 | 18.4%).
| School Level | # Students | % Students |
| Nursery / Preschool | 8 | 4.2% |
| Kindergarten | 35 | 18.4% |
| Elementary School | 50 | 26.3% |
| Middle School | 44 | 23.2% |
| High School | 23 | 12.1% |
| College / Undergraduate | 25 | 13.2% |
| Graduate / Professional | 5 | 2.6% |
| Total | 190 | 100.0% |
School Enrollment by Age by Funding Source in Stockton
Out of a total of 190 students who are enrolled in schools in Stockton, 29 (15.3%) attend a private institution, while the remaining 161 (84.7%) are enrolled in public schools. The age group of 25 to 34 year olds has the highest likelihood of being enrolled in private schools, with 2 (28.6% in the age bracket) enrolled. Conversely, the age group of 3 to 4 year olds has the lowest likelihood of being enrolled in a private school, with 5 (100.0% in the age bracket) attending a public institution.
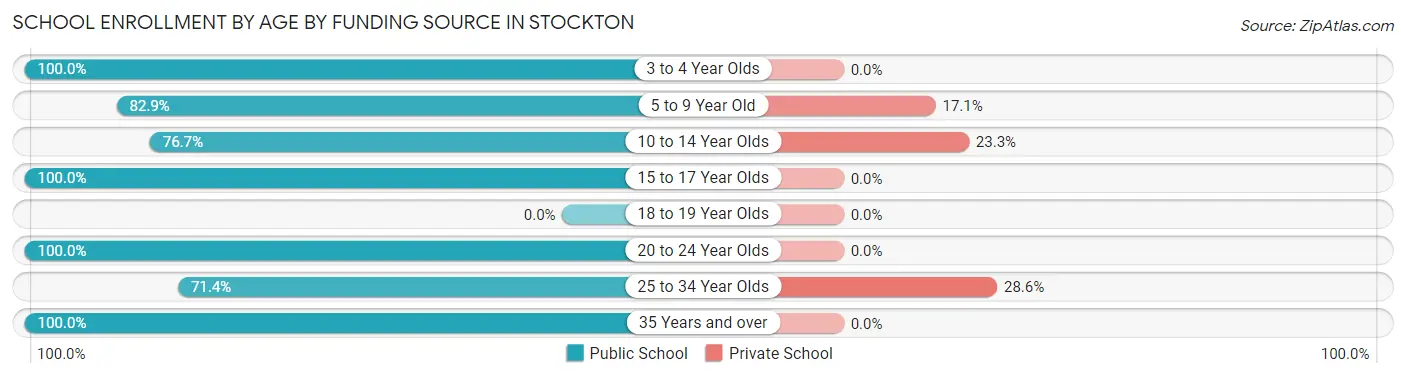
| Age Bracket | Public School | Private School |
| 3 to 4 Year Olds | 5 (100.0%) | 0 (0.0%) |
| 5 to 9 Year Old | 63 (82.9%) | 13 (17.1%) |
| 10 to 14 Year Olds | 46 (76.7%) | 14 (23.3%) |
| 15 to 17 Year Olds | 19 (100.0%) | 0 (0.0%) |
| 18 to 19 Year Olds | 0 (0.0%) | 0 (0.0%) |
| 20 to 24 Year Olds | 18 (100.0%) | 0 (0.0%) |
| 25 to 34 Year Olds | 5 (71.4%) | 2 (28.6%) |
| 35 Years and over | 5 (100.0%) | 0 (0.0%) |
| Total | 161 (84.7%) | 29 (15.3%) |
Educational Attainment by Field of Study in Stockton
Business (26 | 22.6%), engineering (19 | 16.5%), science & technology (15 | 13.0%), education (15 | 13.0%), and physical & health sciences (12 | 10.4%) are the most common fields of study among 115 individuals in Stockton who have obtained a bachelor's degree or higher.
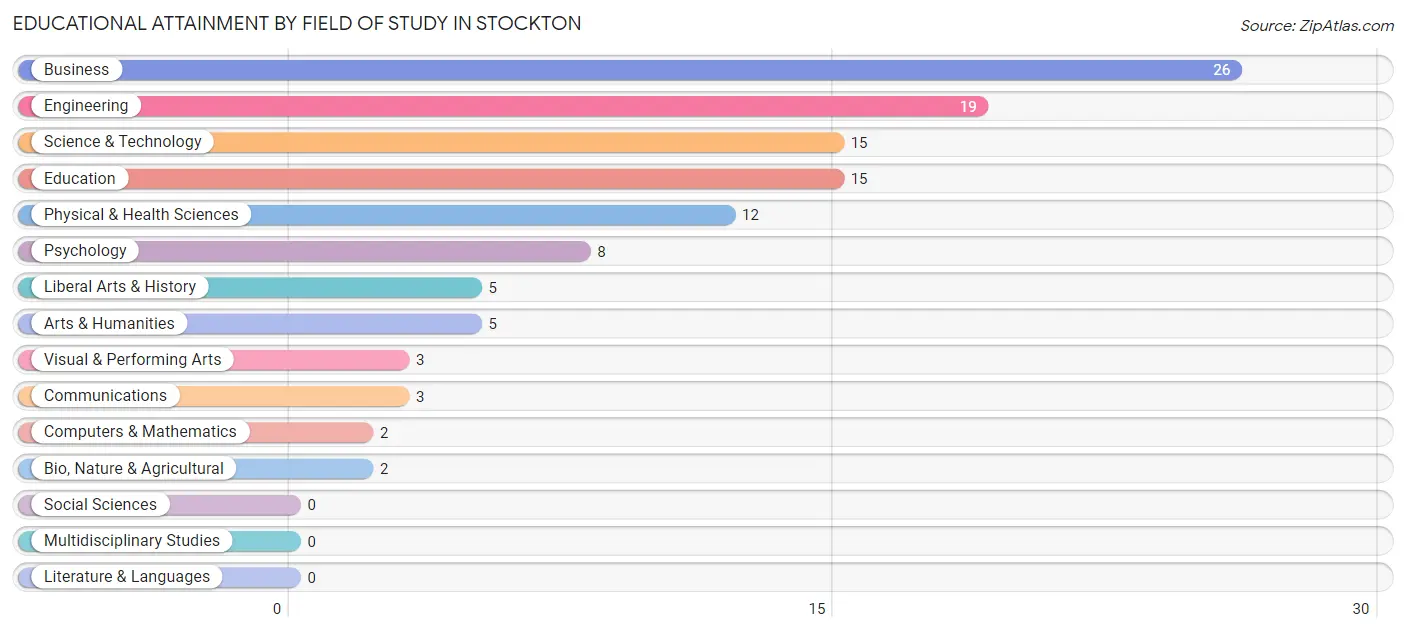
| Field of Study | # Graduates | % Graduates |
| Computers & Mathematics | 2 | 1.7% |
| Bio, Nature & Agricultural | 2 | 1.7% |
| Physical & Health Sciences | 12 | 10.4% |
| Psychology | 8 | 7.0% |
| Social Sciences | 0 | 0.0% |
| Engineering | 19 | 16.5% |
| Multidisciplinary Studies | 0 | 0.0% |
| Science & Technology | 15 | 13.0% |
| Business | 26 | 22.6% |
| Education | 15 | 13.0% |
| Literature & Languages | 0 | 0.0% |
| Liberal Arts & History | 5 | 4.3% |
| Visual & Performing Arts | 3 | 2.6% |
| Communications | 3 | 2.6% |
| Arts & Humanities | 5 | 4.3% |
| Total | 115 | 100.0% |
Transportation & Commute in Stockton
Vehicle Availability by Sex in Stockton
The most prevalent vehicle ownership categories in Stockton are males with 2 vehicles (104, accounting for 53.1%) and females with 2 vehicles (97, making up 58.1%).
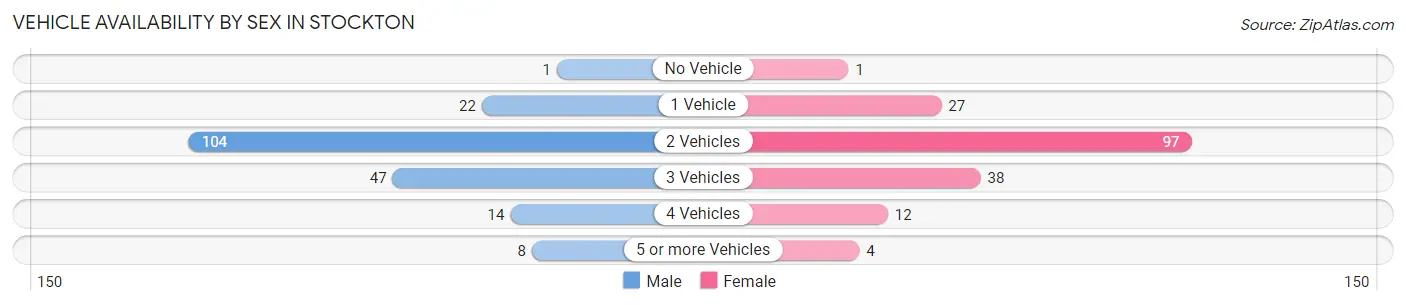
| Vehicles Available | Male | Female |
| No Vehicle | 1 (0.5%) | 1 (0.6%) |
| 1 Vehicle | 22 (11.2%) | 27 (15.1%) |
| 2 Vehicles | 104 (53.1%) | 97 (54.2%) |
| 3 Vehicles | 47 (24.0%) | 38 (21.2%) |
| 4 Vehicles | 14 (7.1%) | 12 (6.7%) |
| 5 or more Vehicles | 8 (4.1%) | 4 (2.2%) |
| Total | 196 (100.0%) | 179 (100.0%) |
Commute Time in Stockton
The most frequently occuring commute durations in Stockton are 10 to 14 minutes (94 commuters, 26.3%), 15 to 19 minutes (93 commuters, 26.1%), and 20 to 24 minutes (48 commuters, 13.5%).
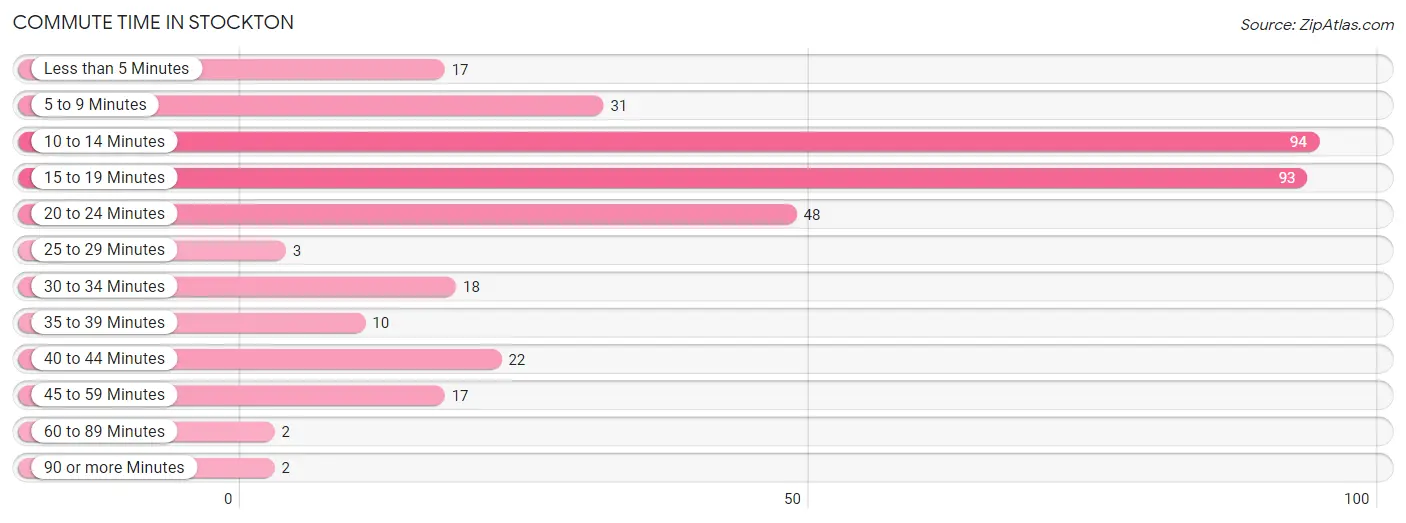
| Commute Time | # Commuters | % Commuters |
| Less than 5 Minutes | 17 | 4.8% |
| 5 to 9 Minutes | 31 | 8.7% |
| 10 to 14 Minutes | 94 | 26.3% |
| 15 to 19 Minutes | 93 | 26.1% |
| 20 to 24 Minutes | 48 | 13.5% |
| 25 to 29 Minutes | 3 | 0.8% |
| 30 to 34 Minutes | 18 | 5.0% |
| 35 to 39 Minutes | 10 | 2.8% |
| 40 to 44 Minutes | 22 | 6.2% |
| 45 to 59 Minutes | 17 | 4.8% |
| 60 to 89 Minutes | 2 | 0.6% |
| 90 or more Minutes | 2 | 0.6% |
Commute Time by Sex in Stockton
The most common commute times in Stockton are 10 to 14 minutes (55 commuters, 28.5%) for males and 10 to 14 minutes (39 commuters, 23.8%) for females.
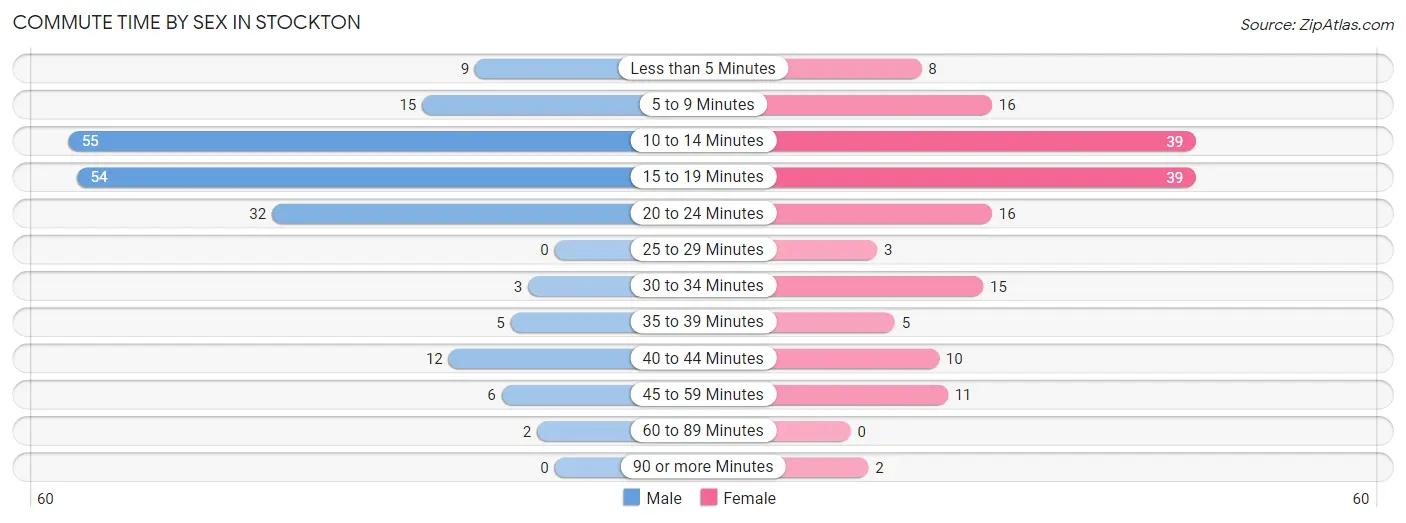
| Commute Time | Male | Female |
| Less than 5 Minutes | 9 (4.7%) | 8 (4.9%) |
| 5 to 9 Minutes | 15 (7.8%) | 16 (9.8%) |
| 10 to 14 Minutes | 55 (28.5%) | 39 (23.8%) |
| 15 to 19 Minutes | 54 (28.0%) | 39 (23.8%) |
| 20 to 24 Minutes | 32 (16.6%) | 16 (9.8%) |
| 25 to 29 Minutes | 0 (0.0%) | 3 (1.8%) |
| 30 to 34 Minutes | 3 (1.5%) | 15 (9.1%) |
| 35 to 39 Minutes | 5 (2.6%) | 5 (3.0%) |
| 40 to 44 Minutes | 12 (6.2%) | 10 (6.1%) |
| 45 to 59 Minutes | 6 (3.1%) | 11 (6.7%) |
| 60 to 89 Minutes | 2 (1.0%) | 0 (0.0%) |
| 90 or more Minutes | 0 (0.0%) | 2 (1.2%) |
Time of Departure to Work by Sex in Stockton
The most frequent times of departure to work in Stockton are 6:00 AM to 6:29 AM (41, 21.2%) for males and 7:00 AM to 7:29 AM (46, 28.1%) for females.
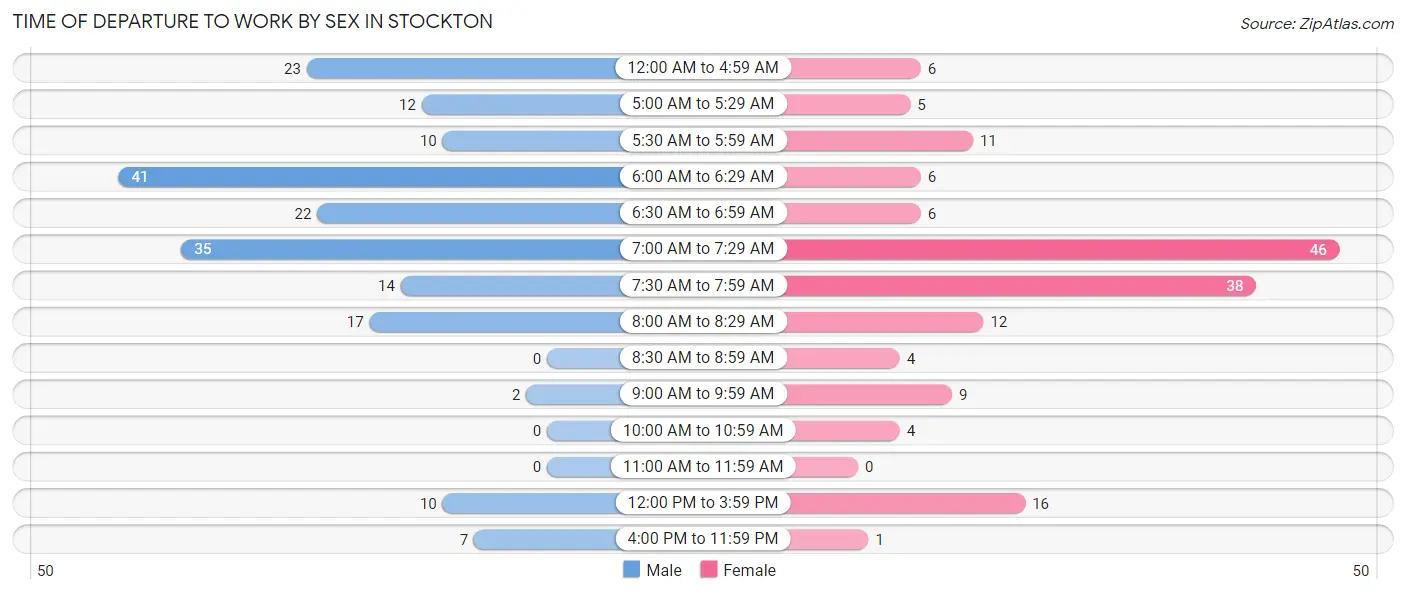
| Time of Departure | Male | Female |
| 12:00 AM to 4:59 AM | 23 (11.9%) | 6 (3.7%) |
| 5:00 AM to 5:29 AM | 12 (6.2%) | 5 (3.0%) |
| 5:30 AM to 5:59 AM | 10 (5.2%) | 11 (6.7%) |
| 6:00 AM to 6:29 AM | 41 (21.2%) | 6 (3.7%) |
| 6:30 AM to 6:59 AM | 22 (11.4%) | 6 (3.7%) |
| 7:00 AM to 7:29 AM | 35 (18.1%) | 46 (28.1%) |
| 7:30 AM to 7:59 AM | 14 (7.2%) | 38 (23.2%) |
| 8:00 AM to 8:29 AM | 17 (8.8%) | 12 (7.3%) |
| 8:30 AM to 8:59 AM | 0 (0.0%) | 4 (2.4%) |
| 9:00 AM to 9:59 AM | 2 (1.0%) | 9 (5.5%) |
| 10:00 AM to 10:59 AM | 0 (0.0%) | 4 (2.4%) |
| 11:00 AM to 11:59 AM | 0 (0.0%) | 0 (0.0%) |
| 12:00 PM to 3:59 PM | 10 (5.2%) | 16 (9.8%) |
| 4:00 PM to 11:59 PM | 7 (3.6%) | 1 (0.6%) |
| Total | 193 (100.0%) | 164 (100.0%) |
Housing Occupancy in Stockton
Occupancy by Ownership in Stockton
Of the total 280 dwellings in Stockton, owner-occupied units account for 244 (87.1%), while renter-occupied units make up 36 (12.9%).
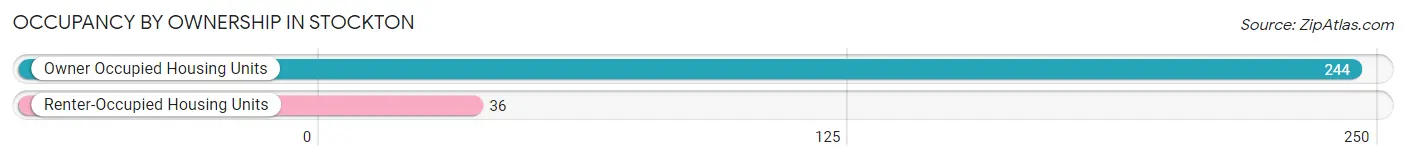
| Occupancy | # Housing Units | % Housing Units |
| Owner Occupied Housing Units | 244 | 87.1% |
| Renter-Occupied Housing Units | 36 | 12.9% |
| Total Occupied Housing Units | 280 | 100.0% |
Occupancy by Household Size in Stockton
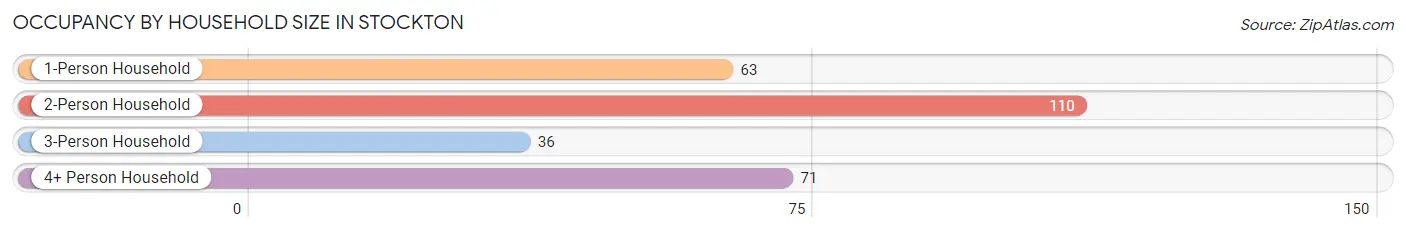
| Household Size | # Housing Units | % Housing Units |
| 1-Person Household | 63 | 22.5% |
| 2-Person Household | 110 | 39.3% |
| 3-Person Household | 36 | 12.9% |
| 4+ Person Household | 71 | 25.4% |
| Total Housing Units | 280 | 100.0% |
Occupancy by Ownership by Household Size in Stockton
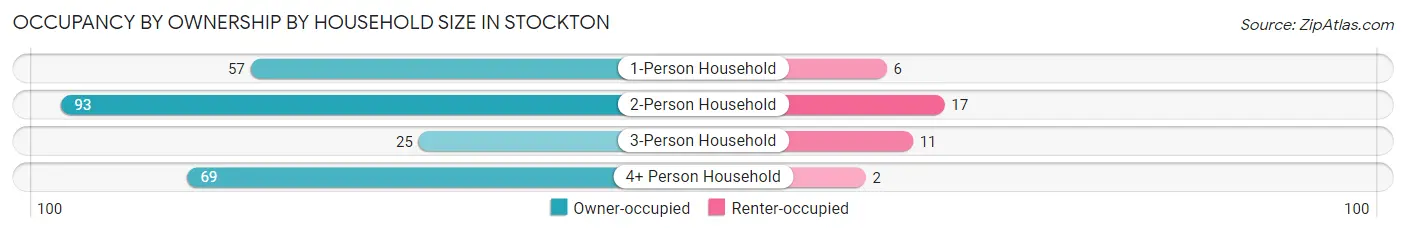
| Household Size | Owner-occupied | Renter-occupied |
| 1-Person Household | 57 (90.5%) | 6 (9.5%) |
| 2-Person Household | 93 (84.6%) | 17 (15.4%) |
| 3-Person Household | 25 (69.4%) | 11 (30.6%) |
| 4+ Person Household | 69 (97.2%) | 2 (2.8%) |
| Total Housing Units | 244 (87.1%) | 36 (12.9%) |
Occupancy by Educational Attainment in Stockton
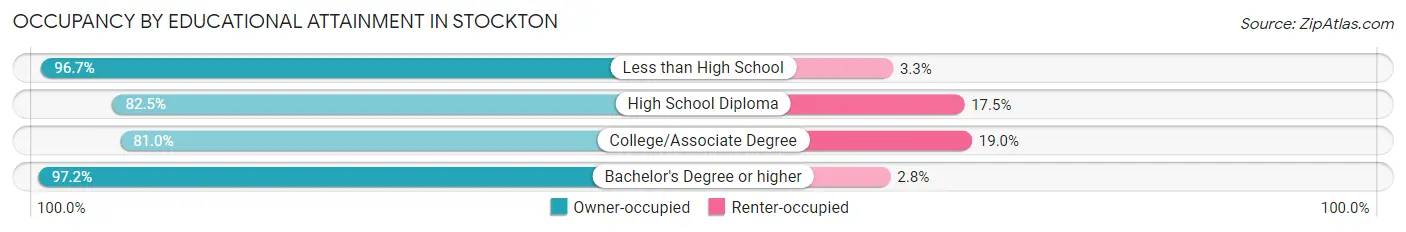
| Household Size | Owner-occupied | Renter-occupied |
| Less than High School | 29 (96.7%) | 1 (3.3%) |
| High School Diploma | 52 (82.5%) | 11 (17.5%) |
| College/Associate Degree | 94 (81.0%) | 22 (19.0%) |
| Bachelor's Degree or higher | 69 (97.2%) | 2 (2.8%) |
Occupancy by Age of Householder in Stockton
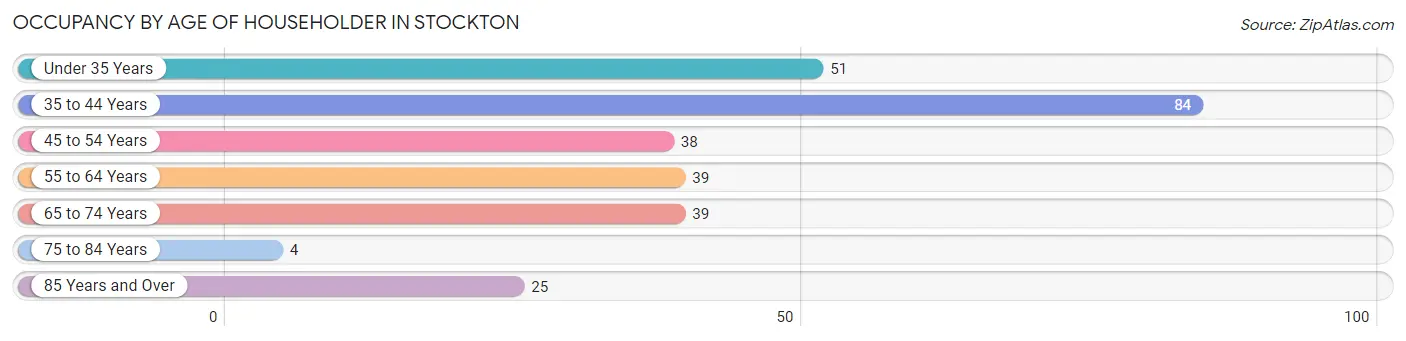
| Age Bracket | # Households | % Households |
| Under 35 Years | 51 | 18.2% |
| 35 to 44 Years | 84 | 30.0% |
| 45 to 54 Years | 38 | 13.6% |
| 55 to 64 Years | 39 | 13.9% |
| 65 to 74 Years | 39 | 13.9% |
| 75 to 84 Years | 4 | 1.4% |
| 85 Years and Over | 25 | 8.9% |
| Total | 280 | 100.0% |
Housing Finances in Stockton
Median Income by Occupancy in Stockton
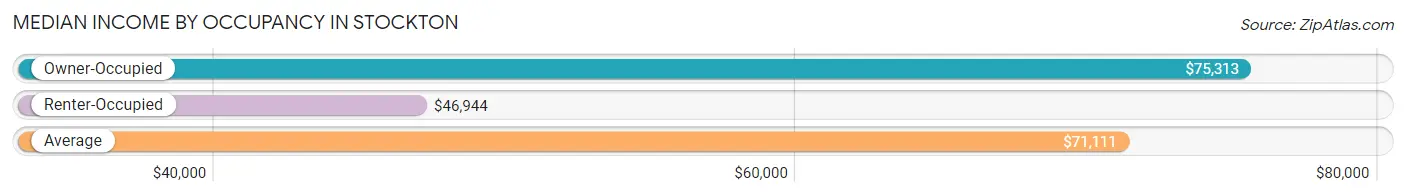
| Occupancy Type | # Households | Median Income |
| Owner-Occupied | 244 (87.1%) | $75,313 |
| Renter-Occupied | 36 (12.9%) | $46,944 |
| Average | 280 (100.0%) | $71,111 |
Occupancy by Householder Income Bracket in Stockton
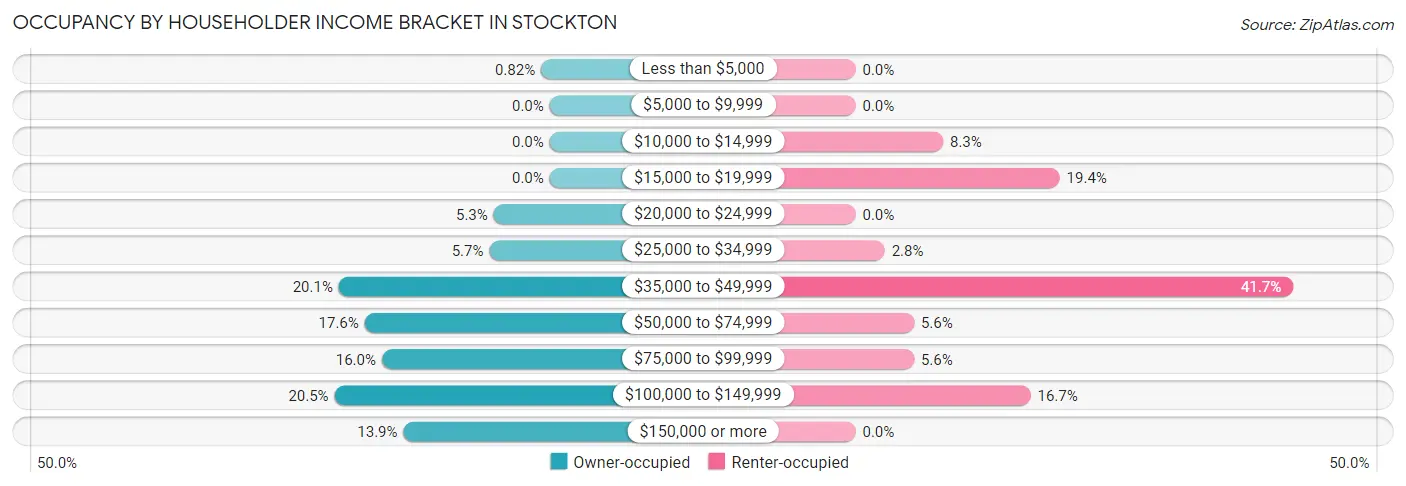
| Income Bracket | Owner-occupied | Renter-occupied |
| Less than $5,000 | 2 (0.8%) | 0 (0.0%) |
| $5,000 to $9,999 | 0 (0.0%) | 0 (0.0%) |
| $10,000 to $14,999 | 0 (0.0%) | 3 (8.3%) |
| $15,000 to $19,999 | 0 (0.0%) | 7 (19.4%) |
| $20,000 to $24,999 | 13 (5.3%) | 0 (0.0%) |
| $25,000 to $34,999 | 14 (5.7%) | 1 (2.8%) |
| $35,000 to $49,999 | 49 (20.1%) | 15 (41.7%) |
| $50,000 to $74,999 | 43 (17.6%) | 2 (5.6%) |
| $75,000 to $99,999 | 39 (16.0%) | 2 (5.6%) |
| $100,000 to $149,999 | 50 (20.5%) | 6 (16.7%) |
| $150,000 or more | 34 (13.9%) | 0 (0.0%) |
| Total | 244 (100.0%) | 36 (100.0%) |
Monthly Housing Cost Tiers in Stockton
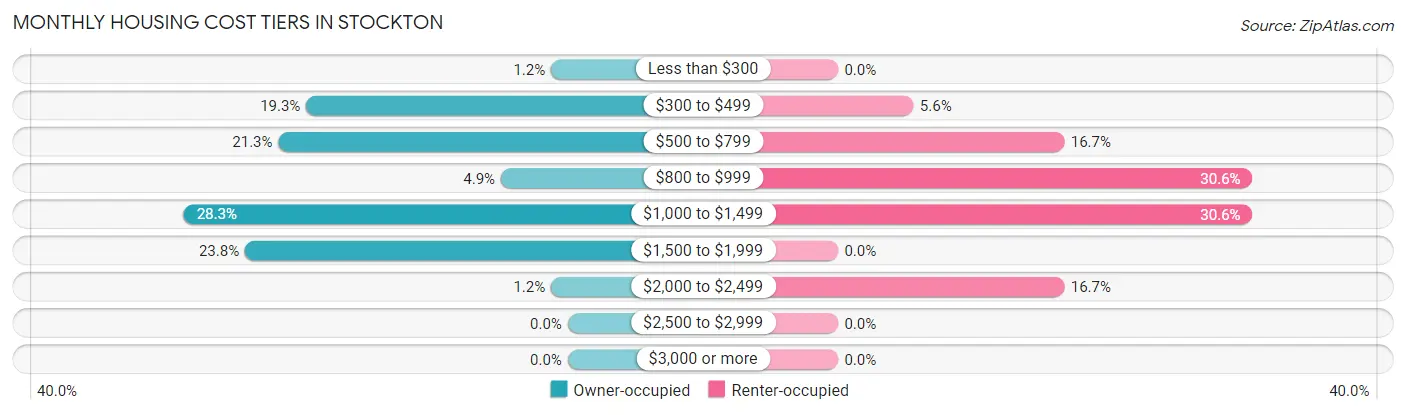
| Monthly Cost | Owner-occupied | Renter-occupied |
| Less than $300 | 3 (1.2%) | 0 (0.0%) |
| $300 to $499 | 47 (19.3%) | 2 (5.6%) |
| $500 to $799 | 52 (21.3%) | 6 (16.7%) |
| $800 to $999 | 12 (4.9%) | 11 (30.6%) |
| $1,000 to $1,499 | 69 (28.3%) | 11 (30.6%) |
| $1,500 to $1,999 | 58 (23.8%) | 0 (0.0%) |
| $2,000 to $2,499 | 3 (1.2%) | 6 (16.7%) |
| $2,500 to $2,999 | 0 (0.0%) | 0 (0.0%) |
| $3,000 or more | 0 (0.0%) | 0 (0.0%) |
| Total | 244 (100.0%) | 36 (100.0%) |
Physical Housing Characteristics in Stockton
Housing Structures in Stockton
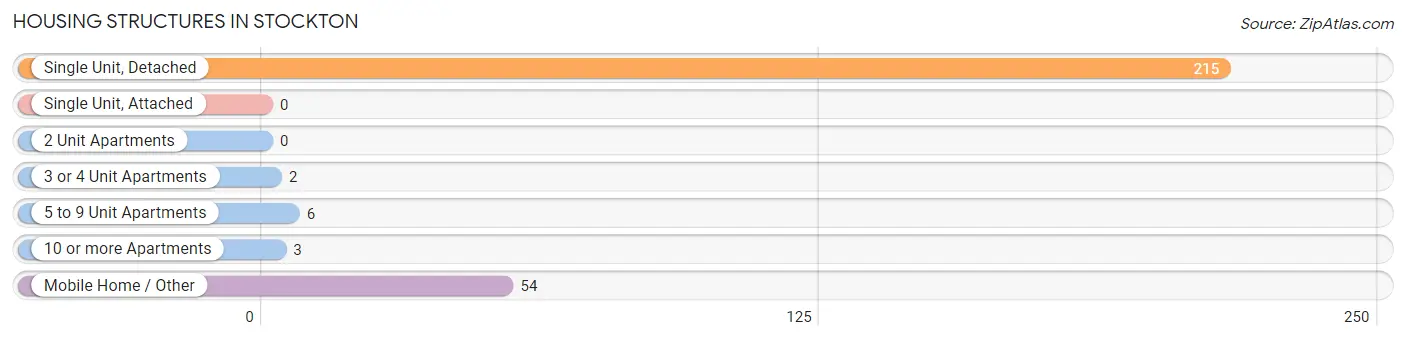
| Structure Type | # Housing Units | % Housing Units |
| Single Unit, Detached | 215 | 76.8% |
| Single Unit, Attached | 0 | 0.0% |
| 2 Unit Apartments | 0 | 0.0% |
| 3 or 4 Unit Apartments | 2 | 0.7% |
| 5 to 9 Unit Apartments | 6 | 2.1% |
| 10 or more Apartments | 3 | 1.1% |
| Mobile Home / Other | 54 | 19.3% |
| Total | 280 | 100.0% |
Housing Structures by Occupancy in Stockton
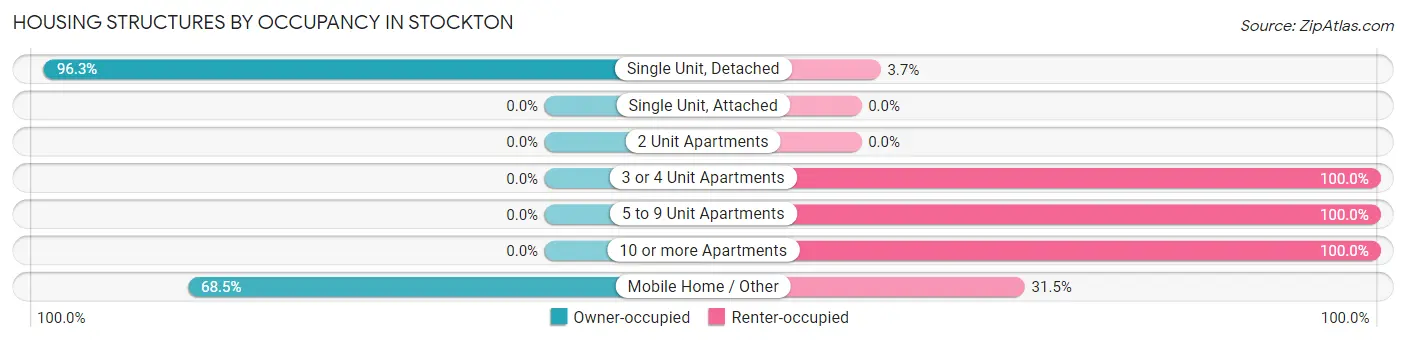
| Structure Type | Owner-occupied | Renter-occupied |
| Single Unit, Detached | 207 (96.3%) | 8 (3.7%) |
| Single Unit, Attached | 0 (0.0%) | 0 (0.0%) |
| 2 Unit Apartments | 0 (0.0%) | 0 (0.0%) |
| 3 or 4 Unit Apartments | 0 (0.0%) | 2 (100.0%) |
| 5 to 9 Unit Apartments | 0 (0.0%) | 6 (100.0%) |
| 10 or more Apartments | 0 (0.0%) | 3 (100.0%) |
| Mobile Home / Other | 37 (68.5%) | 17 (31.5%) |
| Total | 244 (87.1%) | 36 (12.9%) |
Housing Structures by Number of Rooms in Stockton
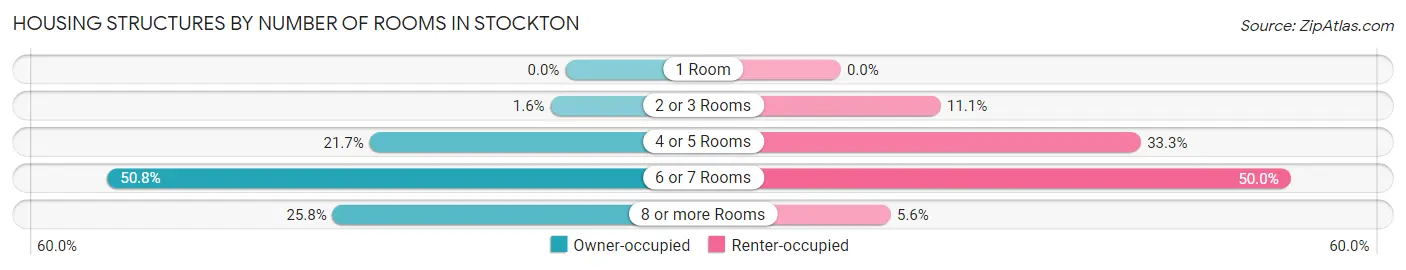
| Number of Rooms | Owner-occupied | Renter-occupied |
| 1 Room | 0 (0.0%) | 0 (0.0%) |
| 2 or 3 Rooms | 4 (1.6%) | 4 (11.1%) |
| 4 or 5 Rooms | 53 (21.7%) | 12 (33.3%) |
| 6 or 7 Rooms | 124 (50.8%) | 18 (50.0%) |
| 8 or more Rooms | 63 (25.8%) | 2 (5.6%) |
| Total | 244 (100.0%) | 36 (100.0%) |
Housing Structure by Heating Type in Stockton
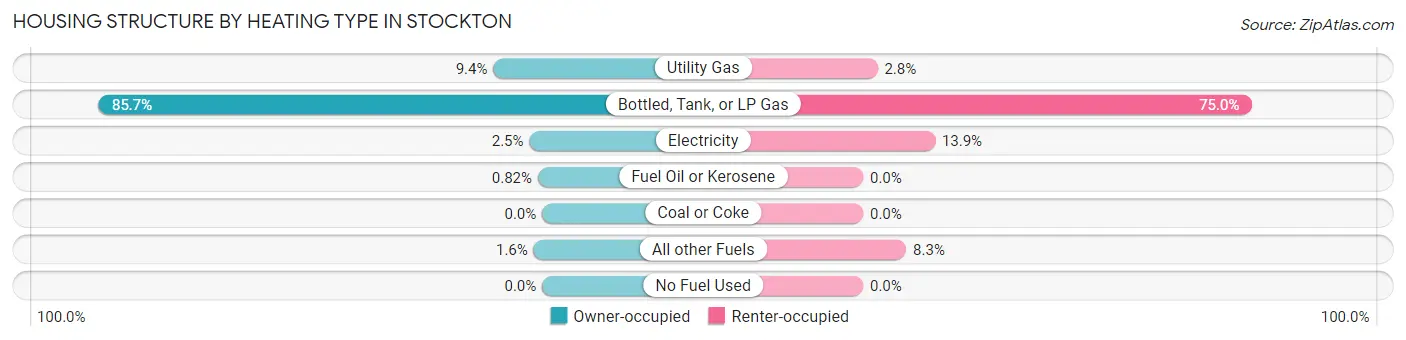
| Heating Type | Owner-occupied | Renter-occupied |
| Utility Gas | 23 (9.4%) | 1 (2.8%) |
| Bottled, Tank, or LP Gas | 209 (85.7%) | 27 (75.0%) |
| Electricity | 6 (2.5%) | 5 (13.9%) |
| Fuel Oil or Kerosene | 2 (0.8%) | 0 (0.0%) |
| Coal or Coke | 0 (0.0%) | 0 (0.0%) |
| All other Fuels | 4 (1.6%) | 3 (8.3%) |
| No Fuel Used | 0 (0.0%) | 0 (0.0%) |
| Total | 244 (100.0%) | 36 (100.0%) |
Household Vehicle Usage in Stockton
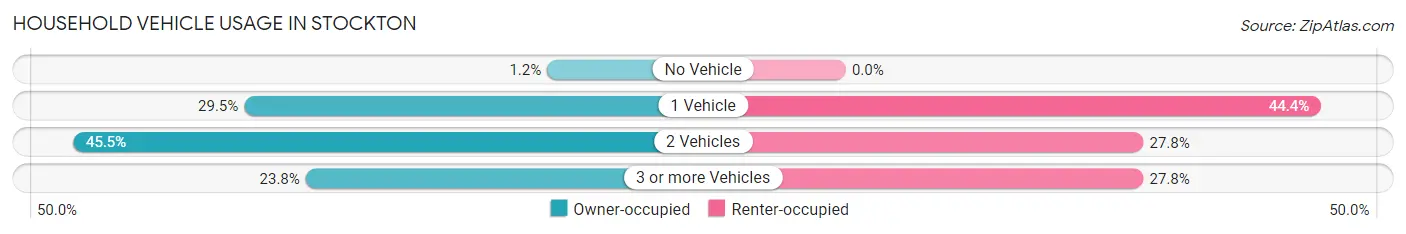
| Vehicles per Household | Owner-occupied | Renter-occupied |
| No Vehicle | 3 (1.2%) | 0 (0.0%) |
| 1 Vehicle | 72 (29.5%) | 16 (44.4%) |
| 2 Vehicles | 111 (45.5%) | 10 (27.8%) |
| 3 or more Vehicles | 58 (23.8%) | 10 (27.8%) |
| Total | 244 (100.0%) | 36 (100.0%) |
Real Estate & Mortgages in Stockton
Real Estate and Mortgage Overview in Stockton
| Characteristic | Without Mortgage | With Mortgage |
| Housing Units | 110 | 134 |
| Median Property Value | $125,000 | $239,700 |
| Median Household Income | $43,913 | $30 |
| Monthly Housing Costs | $513 | $0 |
| Real Estate Taxes | $1,375 | $3 |
Property Value by Mortgage Status in Stockton
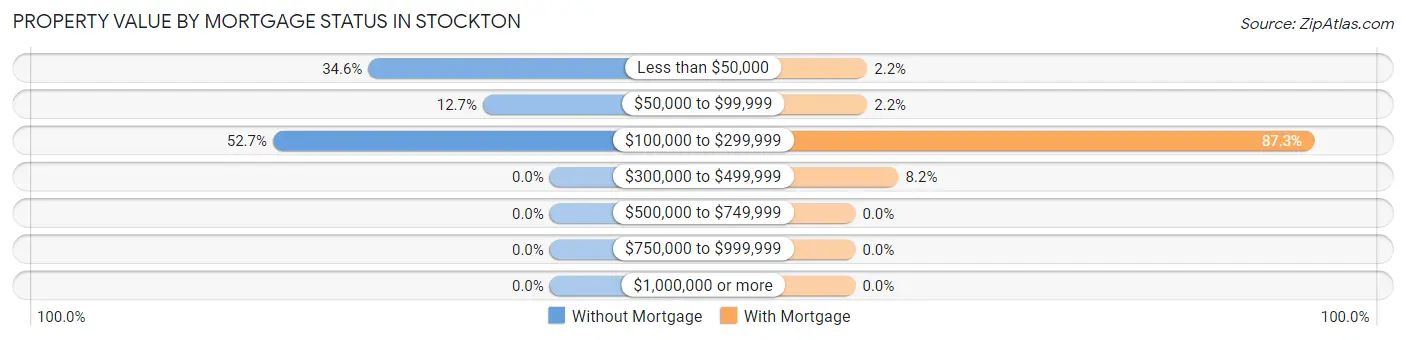
| Property Value | Without Mortgage | With Mortgage |
| Less than $50,000 | 38 (34.5%) | 3 (2.2%) |
| $50,000 to $99,999 | 14 (12.7%) | 3 (2.2%) |
| $100,000 to $299,999 | 58 (52.7%) | 117 (87.3%) |
| $300,000 to $499,999 | 0 (0.0%) | 11 (8.2%) |
| $500,000 to $749,999 | 0 (0.0%) | 0 (0.0%) |
| $750,000 to $999,999 | 0 (0.0%) | 0 (0.0%) |
| $1,000,000 or more | 0 (0.0%) | 0 (0.0%) |
| Total | 110 (100.0%) | 134 (100.0%) |
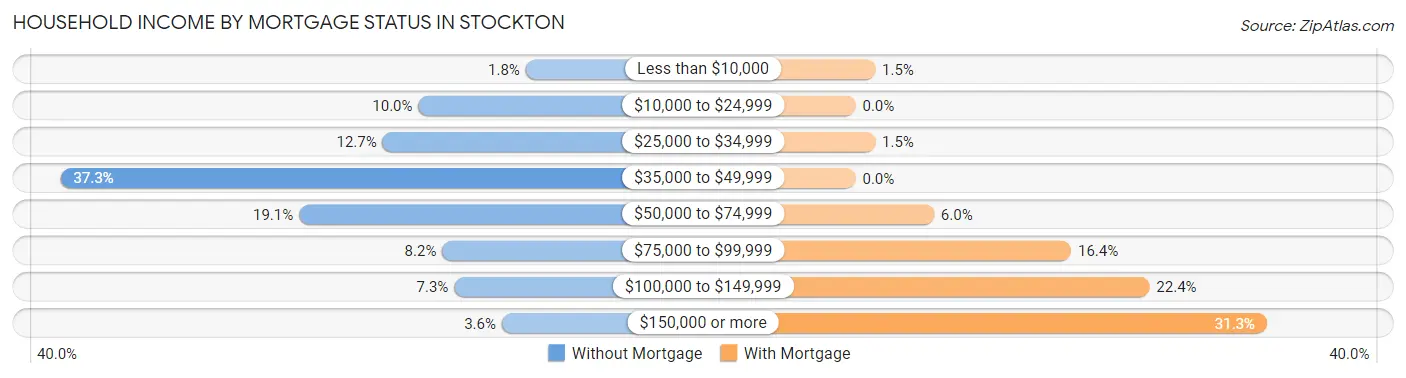
Household Income by Mortgage Status in Stockton
| Household Income | Without Mortgage | With Mortgage |
| Less than $10,000 | 2 (1.8%) | 2 (1.5%) |
| $10,000 to $24,999 | 11 (10.0%) | 0 (0.0%) |
| $25,000 to $34,999 | 14 (12.7%) | 2 (1.5%) |
| $35,000 to $49,999 | 41 (37.3%) | 0 (0.0%) |
| $50,000 to $74,999 | 21 (19.1%) | 8 (6.0%) |
| $75,000 to $99,999 | 9 (8.2%) | 22 (16.4%) |
| $100,000 to $149,999 | 8 (7.3%) | 30 (22.4%) |
| $150,000 or more | 4 (3.6%) | 42 (31.3%) |
| Total | 110 (100.0%) | 134 (100.0%) |
Property Value to Household Income Ratio in Stockton
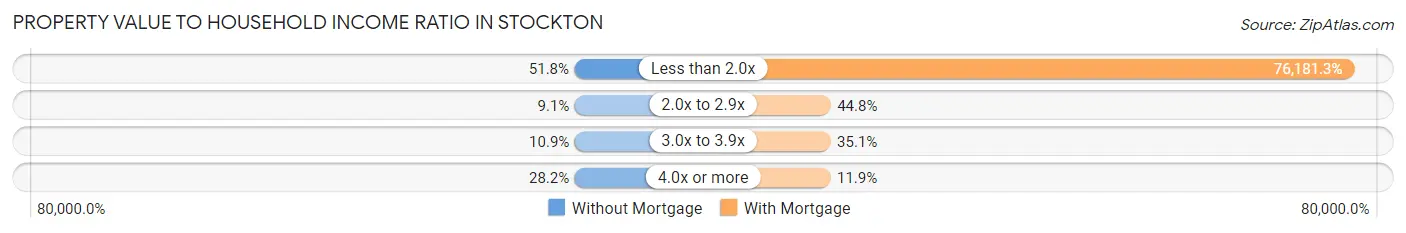
| Value-to-Income Ratio | Without Mortgage | With Mortgage |
| Less than 2.0x | 57 (51.8%) | 102,083 (76,181.3%) |
| 2.0x to 2.9x | 10 (9.1%) | 60 (44.8%) |
| 3.0x to 3.9x | 12 (10.9%) | 47 (35.1%) |
| 4.0x or more | 31 (28.2%) | 16 (11.9%) |
| Total | 110 (100.0%) | 134 (100.0%) |
Real Estate Taxes by Mortgage Status in Stockton
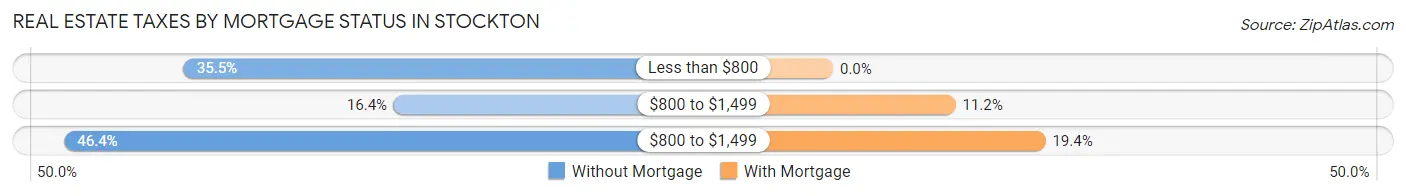
| Property Taxes | Without Mortgage | With Mortgage |
| Less than $800 | 39 (35.4%) | 0 (0.0%) |
| $800 to $1,499 | 18 (16.4%) | 15 (11.2%) |
| $800 to $1,499 | 51 (46.4%) | 26 (19.4%) |
| Total | 110 (100.0%) | 134 (100.0%) |
Health & Disability in Stockton
Health Insurance Coverage by Age in Stockton
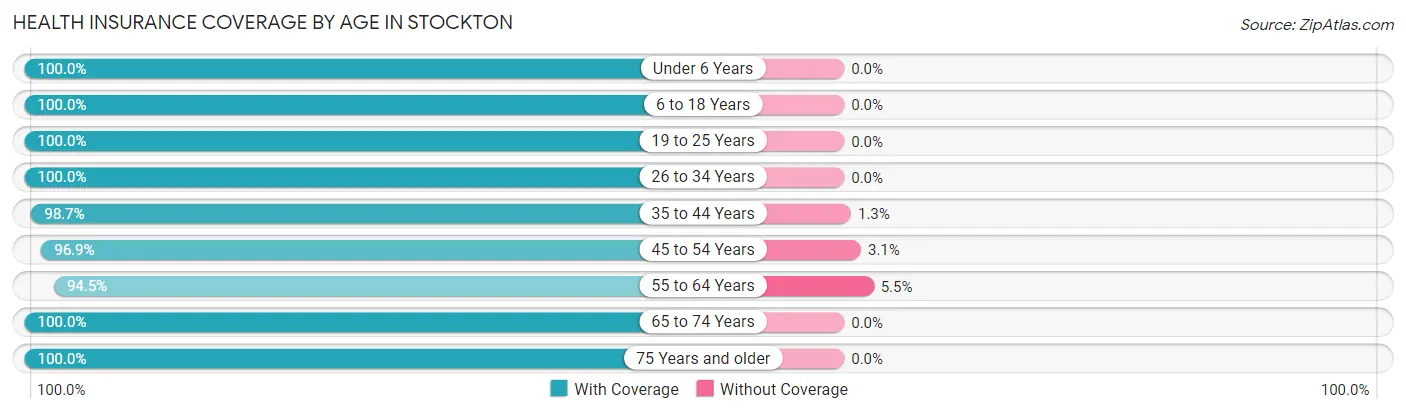
| Age Bracket | With Coverage | Without Coverage |
| Under 6 Years | 73 (100.0%) | 0 (0.0%) |
| 6 to 18 Years | 149 (100.0%) | 0 (0.0%) |
| 19 to 25 Years | 50 (100.0%) | 0 (0.0%) |
| 26 to 34 Years | 69 (100.0%) | 0 (0.0%) |
| 35 to 44 Years | 157 (98.7%) | 2 (1.3%) |
| 45 to 54 Years | 62 (96.9%) | 2 (3.1%) |
| 55 to 64 Years | 69 (94.5%) | 4 (5.5%) |
| 65 to 74 Years | 53 (100.0%) | 0 (0.0%) |
| 75 Years and older | 33 (100.0%) | 0 (0.0%) |
| Total | 715 (98.9%) | 8 (1.1%) |
Health Insurance Coverage by Citizenship Status in Stockton
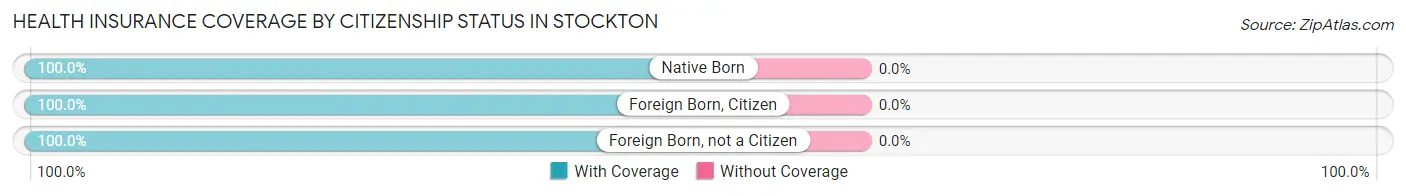
| Citizenship Status | With Coverage | Without Coverage |
| Native Born | 73 (100.0%) | 0 (0.0%) |
| Foreign Born, Citizen | 149 (100.0%) | 0 (0.0%) |
| Foreign Born, not a Citizen | 50 (100.0%) | 0 (0.0%) |
Health Insurance Coverage by Household Income in Stockton
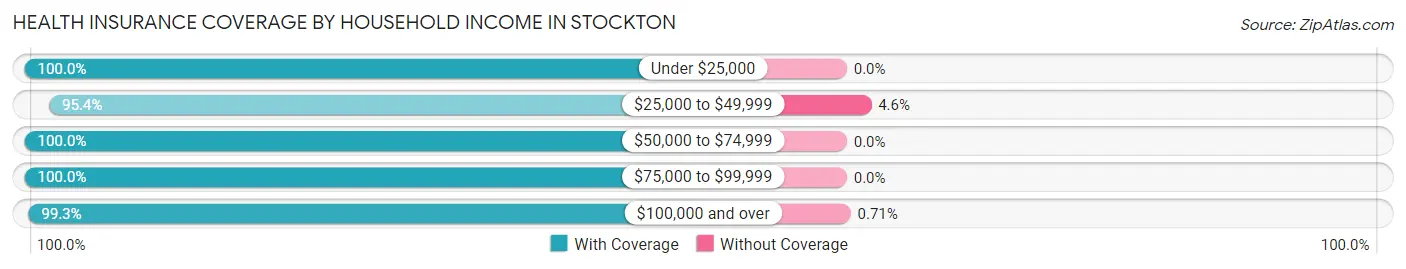
| Household Income | With Coverage | Without Coverage |
| Under $25,000 | 54 (100.0%) | 0 (0.0%) |
| $25,000 to $49,999 | 125 (95.4%) | 6 (4.6%) |
| $50,000 to $74,999 | 122 (100.0%) | 0 (0.0%) |
| $75,000 to $99,999 | 136 (100.0%) | 0 (0.0%) |
| $100,000 and over | 278 (99.3%) | 2 (0.7%) |
Public vs Private Health Insurance Coverage by Age in Stockton
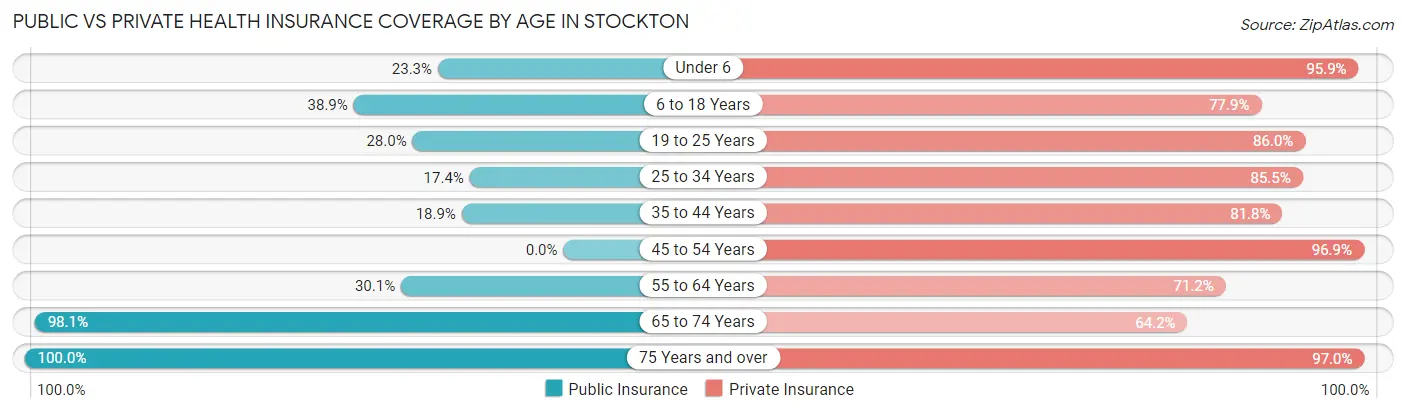
| Age Bracket | Public Insurance | Private Insurance |
| Under 6 | 17 (23.3%) | 70 (95.9%) |
| 6 to 18 Years | 58 (38.9%) | 116 (77.8%) |
| 19 to 25 Years | 14 (28.0%) | 43 (86.0%) |
| 25 to 34 Years | 12 (17.4%) | 59 (85.5%) |
| 35 to 44 Years | 30 (18.9%) | 130 (81.8%) |
| 45 to 54 Years | 0 (0.0%) | 62 (96.9%) |
| 55 to 64 Years | 22 (30.1%) | 52 (71.2%) |
| 65 to 74 Years | 52 (98.1%) | 34 (64.1%) |
| 75 Years and over | 33 (100.0%) | 32 (97.0%) |
| Total | 238 (32.9%) | 598 (82.7%) |
Disability Status by Sex by Age in Stockton
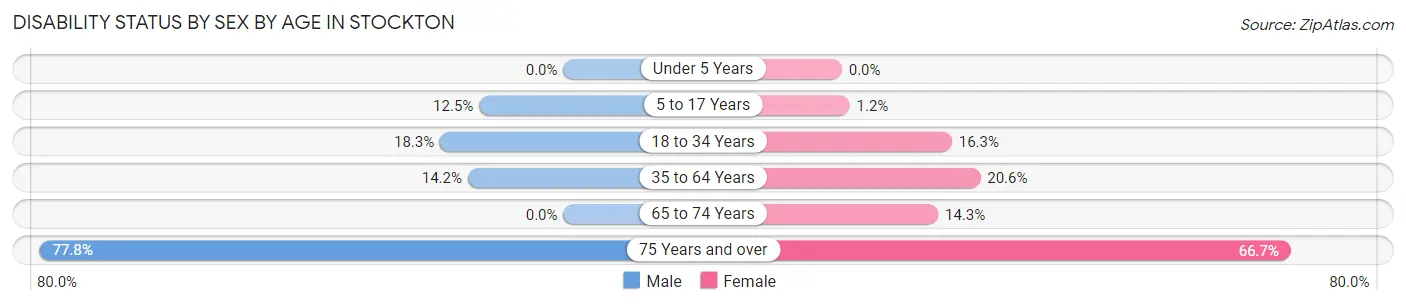
| Age Bracket | Male | Female |
| Under 5 Years | 0 (0.0%) | 0 (0.0%) |
| 5 to 17 Years | 9 (12.5%) | 1 (1.2%) |
| 18 to 34 Years | 13 (18.3%) | 8 (16.3%) |
| 35 to 64 Years | 22 (14.2%) | 29 (20.6%) |
| 65 to 74 Years | 0 (0.0%) | 5 (14.3%) |
| 75 Years and over | 21 (77.8%) | 4 (66.7%) |
Disability Class by Sex by Age in Stockton
Disability Class: Hearing Difficulty
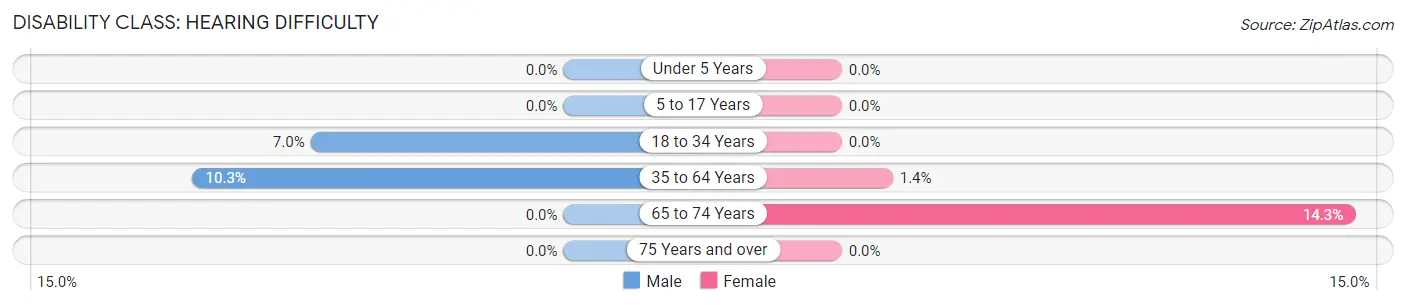
| Age Bracket | Male | Female |
| Under 5 Years | 0 (0.0%) | 0 (0.0%) |
| 5 to 17 Years | 0 (0.0%) | 0 (0.0%) |
| 18 to 34 Years | 5 (7.0%) | 0 (0.0%) |
| 35 to 64 Years | 16 (10.3%) | 2 (1.4%) |
| 65 to 74 Years | 0 (0.0%) | 5 (14.3%) |
| 75 Years and over | 0 (0.0%) | 0 (0.0%) |
Disability Class: Vision Difficulty
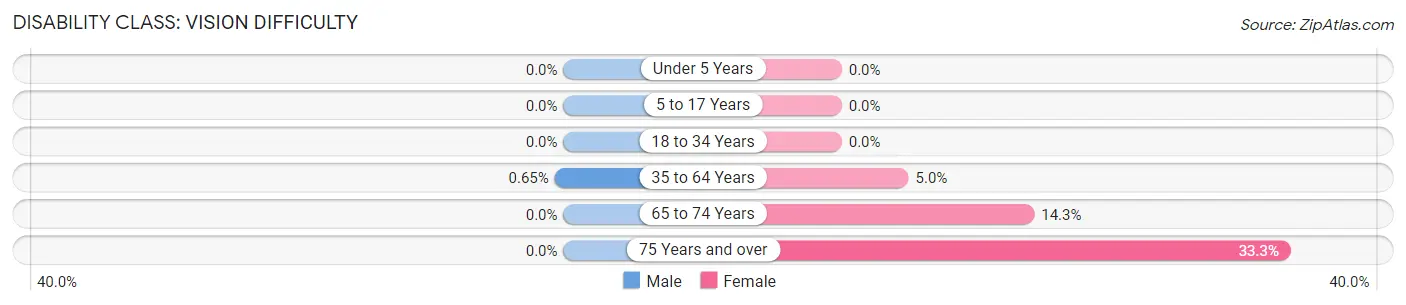
| Age Bracket | Male | Female |
| Under 5 Years | 0 (0.0%) | 0 (0.0%) |
| 5 to 17 Years | 0 (0.0%) | 0 (0.0%) |
| 18 to 34 Years | 0 (0.0%) | 0 (0.0%) |
| 35 to 64 Years | 1 (0.6%) | 7 (5.0%) |
| 65 to 74 Years | 0 (0.0%) | 5 (14.3%) |
| 75 Years and over | 0 (0.0%) | 2 (33.3%) |
Disability Class: Cognitive Difficulty
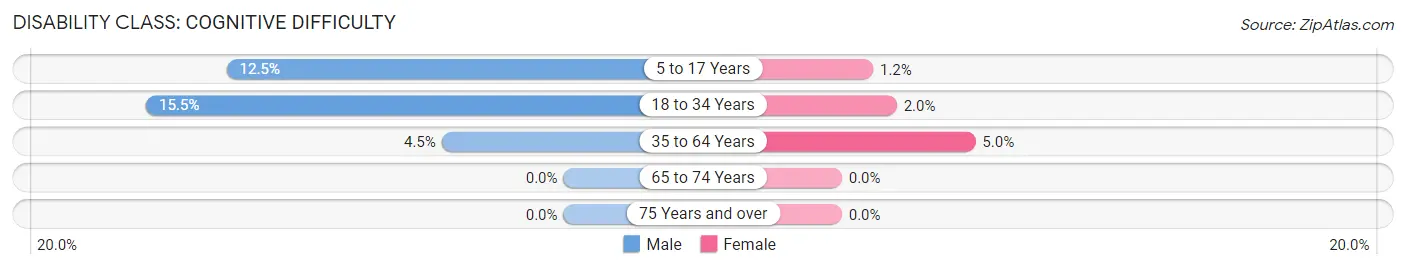
| Age Bracket | Male | Female |
| 5 to 17 Years | 9 (12.5%) | 1 (1.2%) |
| 18 to 34 Years | 11 (15.5%) | 1 (2.0%) |
| 35 to 64 Years | 7 (4.5%) | 7 (5.0%) |
| 65 to 74 Years | 0 (0.0%) | 0 (0.0%) |
| 75 Years and over | 0 (0.0%) | 0 (0.0%) |
Disability Class: Ambulatory Difficulty
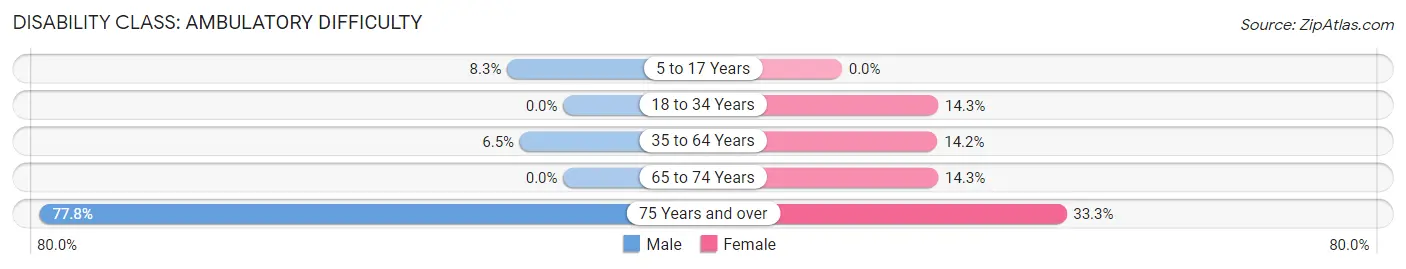
| Age Bracket | Male | Female |
| 5 to 17 Years | 6 (8.3%) | 0 (0.0%) |
| 18 to 34 Years | 0 (0.0%) | 7 (14.3%) |
| 35 to 64 Years | 10 (6.5%) | 20 (14.2%) |
| 65 to 74 Years | 0 (0.0%) | 5 (14.3%) |
| 75 Years and over | 21 (77.8%) | 2 (33.3%) |
Disability Class: Self-Care Difficulty
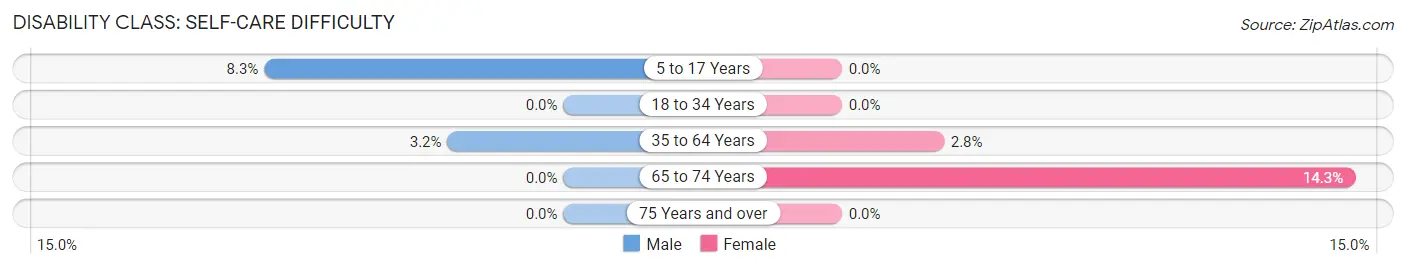
| Age Bracket | Male | Female |
| 5 to 17 Years | 6 (8.3%) | 0 (0.0%) |
| 18 to 34 Years | 0 (0.0%) | 0 (0.0%) |
| 35 to 64 Years | 5 (3.2%) | 4 (2.8%) |
| 65 to 74 Years | 0 (0.0%) | 5 (14.3%) |
| 75 Years and over | 0 (0.0%) | 0 (0.0%) |
Technology Access in Stockton
Computing Device Access in Stockton
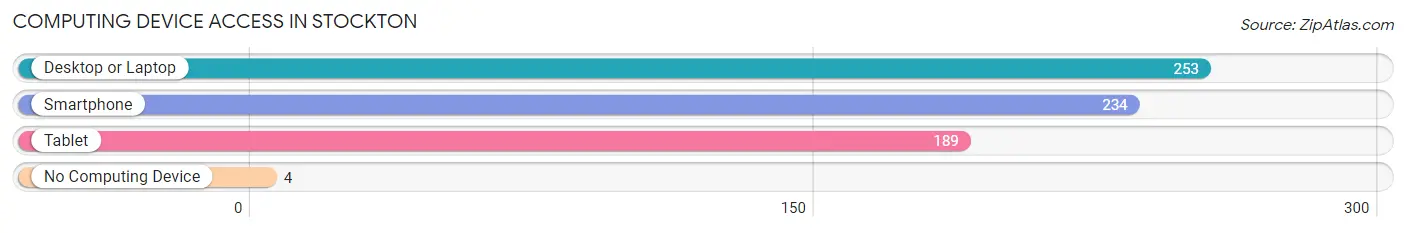
| Device Type | # Households | % Households |
| Desktop or Laptop | 253 | 90.4% |
| Smartphone | 234 | 83.6% |
| Tablet | 189 | 67.5% |
| No Computing Device | 4 | 1.4% |
| Total | 280 | 100.0% |
Internet Access in Stockton
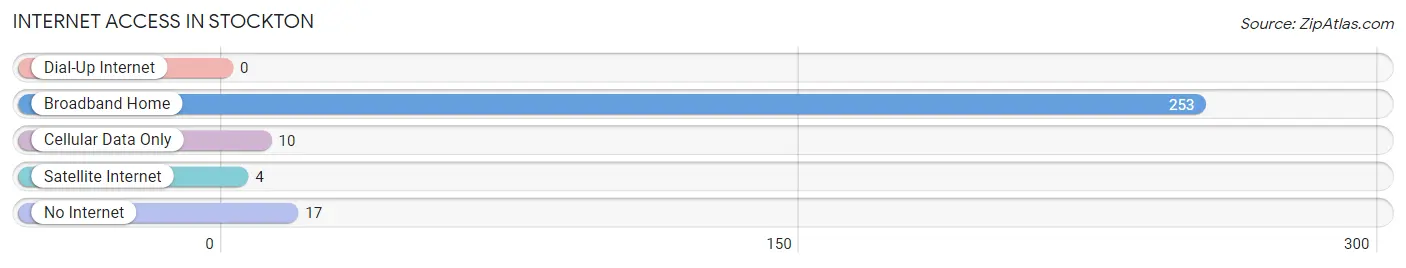
| Internet Type | # Households | % Households |
| Dial-Up Internet | 0 | 0.0% |
| Broadband Home | 253 | 90.4% |
| Cellular Data Only | 10 | 3.6% |
| Satellite Internet | 4 | 1.4% |
| No Internet | 17 | 6.1% |
| Total | 280 | 100.0% |
Stockton Summary
Stockton, Minnesota is a small town located in Goodhue County, in the southeastern corner of the state. It is situated on the banks of the Mississippi River, about 25 miles south of the Twin Cities. The town has a population of just over 1,000 people, and is part of the Red Wing Metropolitan Statistical Area.
History
Stockton was founded in 1854 by a group of settlers from New York. The town was named after Stockton, New York, the hometown of the settlers. The town was originally a farming community, and the settlers built a sawmill and gristmill to help support the local economy.
In the late 19th century, Stockton became a popular tourist destination. The town was known for its scenic beauty, and visitors came to enjoy the river and the surrounding countryside. The town also became a popular destination for hunters and fishermen.
In the early 20th century, Stockton began to experience a decline in population. The Great Depression and World War II caused many people to leave the area in search of better opportunities. The population of Stockton dropped to just over 500 people by the 1950s.
In the late 20th century, Stockton began to experience a resurgence. The town was revitalized by the construction of a new bridge over the Mississippi River, which connected Stockton to the Twin Cities. The bridge also brought new businesses and jobs to the area.
Geography
Stockton is located in the southeastern corner of Minnesota, on the banks of the Mississippi River. The town is situated in a rural area, surrounded by rolling hills and farmland. The town is located about 25 miles south of the Twin Cities.
The climate in Stockton is typical of the Midwest, with cold winters and hot summers. The average temperature in the winter is around 20 degrees Fahrenheit, and the average temperature in the summer is around 75 degrees Fahrenheit.
Economy
The economy of Stockton is largely based on agriculture and tourism. The town is home to several farms, which produce a variety of crops, including corn, soybeans, and wheat. The town is also home to several wineries, which produce a variety of wines.
Tourism is an important part of the local economy. The town is home to several historic sites, including the Stockton Mill, which was built in 1854. The town is also home to several parks and recreational areas, which attract visitors from all over the state.
Demographics
As of the 2010 census, the population of Stockton was 1,072. The racial makeup of the town was 97.3% White, 0.7% African American, 0.3% Native American, 0.2% Asian, 0.1% Pacific Islander, and 1.4% from other races. The median household income in Stockton was $45,938, and the median family income was $51,250.
Conclusion
Stockton, Minnesota is a small town located in Goodhue County, in the southeastern corner of the state. It is situated on the banks of the Mississippi River, about 25 miles south of the Twin Cities. The town has a population of just over 1,000 people, and is part of the Red Wing Metropolitan Statistical Area. The economy of Stockton is largely based on agriculture and tourism, and the town is home to several historic sites and recreational areas. The population of Stockton is 97.3% White, and the median household income is $45,938.
Common Questions
What is Per Capita Income in Stockton?
Per Capita income in Stockton is $32,228.
What is the Median Family Income in Stockton?
Median Family Income in Stockton is $83,750.
What is the Median Household income in Stockton?
Median Household Income in Stockton is $71,111.
What is Income or Wage Gap in Stockton?
Income or Wage Gap in Stockton is 18.3%.
Women in Stockton earn 81.7 cents for every dollar earned by a man.
What is Inequality or Gini Index in Stockton?
Inequality or Gini Index in Stockton is 0.34.
What is the Total Population of Stockton?
Total Population of Stockton is 723.
What is the Total Male Population of Stockton?
Total Male Population of Stockton is 365.
What is the Total Female Population of Stockton?
Total Female Population of Stockton is 358.
What is the Ratio of Males per 100 Females in Stockton?
There are 101.96 Males per 100 Females in Stockton.
What is the Ratio of Females per 100 Males in Stockton?
There are 98.08 Females per 100 Males in Stockton.
What is the Median Population Age in Stockton?
Median Population Age in Stockton is 36.4 Years.
What is the Average Family Size in Stockton
Average Family Size in Stockton is 3.1 People.
What is the Average Household Size in Stockton
Average Household Size in Stockton is 2.6 People.
How Large is the Labor Force in Stockton?
There are 390 People in the Labor Forcein in Stockton.
What is the Percentage of People in the Labor Force in Stockton?
76.0% of People are in the Labor Force in Stockton.
What is the Unemployment Rate in Stockton?
Unemployment Rate in Stockton is 3.8%.