Alberta, MN Map & Demographics
Alberta Map
Alberta Overview
$41,754
PER CAPITA INCOME
$95,417
AVG FAMILY INCOME
$95,139
AVG HOUSEHOLD INCOME
35.6%
WAGE / INCOME GAP [ % ]
64.4¢/ $1
WAGE / INCOME GAP [ $ ]
0.25
INEQUALITY / GINI INDEX
101
TOTAL POPULATION
49
MALE POPULATION
52
FEMALE POPULATION
94.23
MALES / 100 FEMALES
106.12
FEMALES / 100 MALES
63.0
MEDIAN AGE
3.0
AVG FAMILY SIZE
2.5
AVG HOUSEHOLD SIZE
70
LABOR FORCE [ PEOPLE ]
77.8%
PERCENT IN LABOR FORCE
Alberta Zip Codes
Alberta Area Codes
Income in Alberta
Income Overview in Alberta
Per Capita Income in Alberta is $41,754, while median incomes of families and households are $95,417 and $95,139 respectively.
| Characteristic | Number | Measure |
| Per Capita Income | 101 | $41,754 |
| Median Family Income | 29 | $95,417 |
| Mean Family Income | 29 | $91,800 |
| Median Household Income | 41 | $95,139 |
| Mean Household Income | 41 | $83,254 |
| Income Deficit | 29 | $0 |
| Wage / Income Gap (%) | 101 | 35.62% |
| Wage / Income Gap ($) | 101 | 64.38¢ per $1 |
| Gini / Inequality Index | 101 | 0.25 |
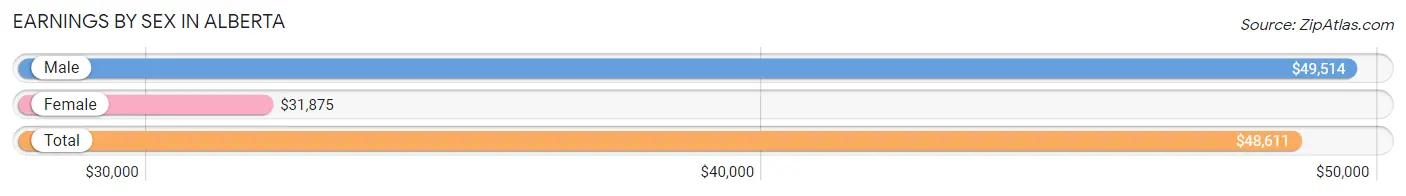
Earnings by Sex in Alberta
Average Earnings in Alberta are $48,611, $49,514 for men and $31,875 for women, a difference of 35.6%.
| Sex | Number | Average Earnings |
| Male | 37 (51.4%) | $49,514 |
| Female | 35 (48.6%) | $31,875 |
| Total | 72 (100.0%) | $48,611 |
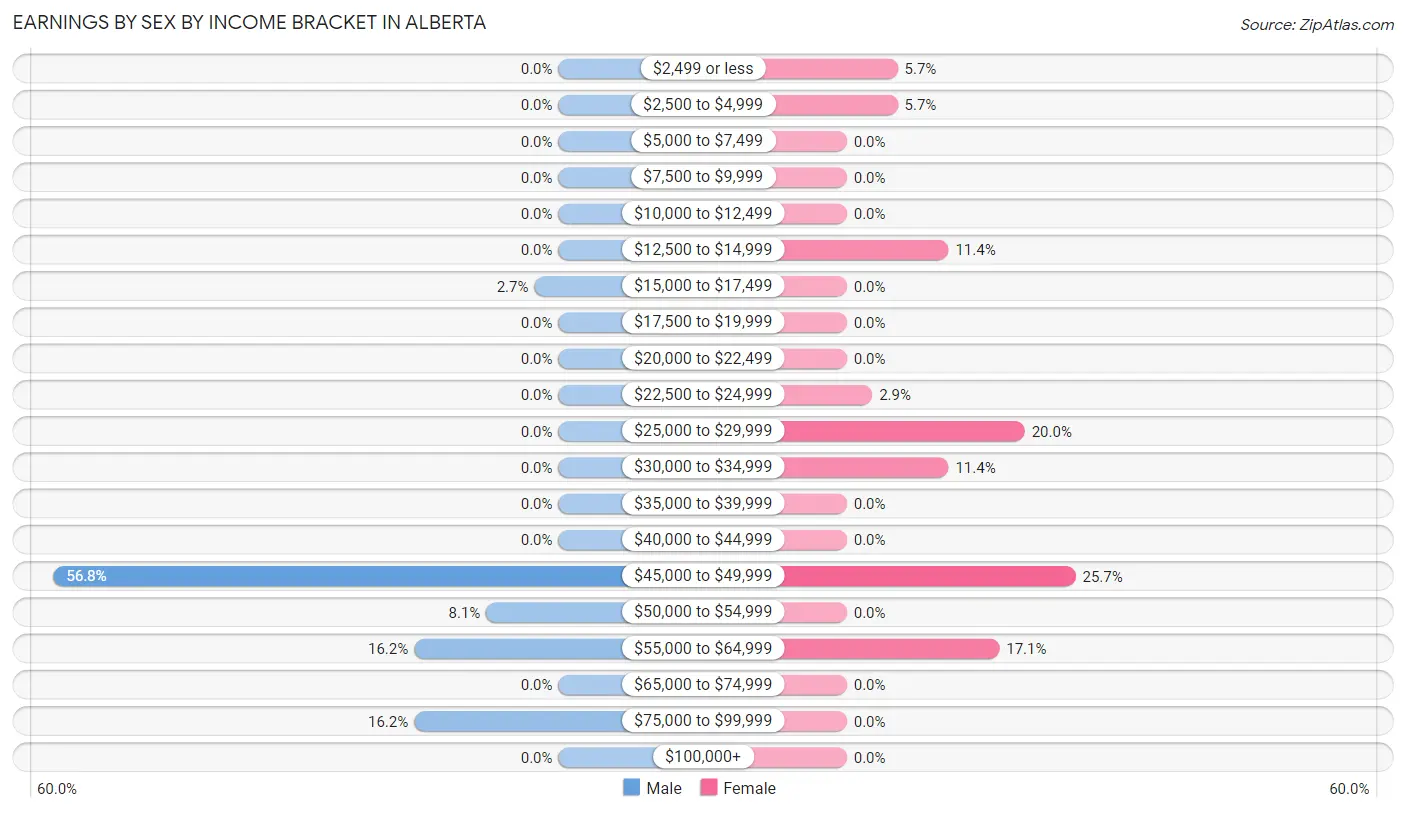
Earnings by Sex by Income Bracket in Alberta
The most common earnings brackets in Alberta are $45,000 to $49,999 for men (21 | 56.8%) and $45,000 to $49,999 for women (9 | 25.7%).
| Income | Male | Female |
| $2,499 or less | 0 (0.0%) | 2 (5.7%) |
| $2,500 to $4,999 | 0 (0.0%) | 2 (5.7%) |
| $5,000 to $7,499 | 0 (0.0%) | 0 (0.0%) |
| $7,500 to $9,999 | 0 (0.0%) | 0 (0.0%) |
| $10,000 to $12,499 | 0 (0.0%) | 0 (0.0%) |
| $12,500 to $14,999 | 0 (0.0%) | 4 (11.4%) |
| $15,000 to $17,499 | 1 (2.7%) | 0 (0.0%) |
| $17,500 to $19,999 | 0 (0.0%) | 0 (0.0%) |
| $20,000 to $22,499 | 0 (0.0%) | 0 (0.0%) |
| $22,500 to $24,999 | 0 (0.0%) | 1 (2.9%) |
| $25,000 to $29,999 | 0 (0.0%) | 7 (20.0%) |
| $30,000 to $34,999 | 0 (0.0%) | 4 (11.4%) |
| $35,000 to $39,999 | 0 (0.0%) | 0 (0.0%) |
| $40,000 to $44,999 | 0 (0.0%) | 0 (0.0%) |
| $45,000 to $49,999 | 21 (56.8%) | 9 (25.7%) |
| $50,000 to $54,999 | 3 (8.1%) | 0 (0.0%) |
| $55,000 to $64,999 | 6 (16.2%) | 6 (17.1%) |
| $65,000 to $74,999 | 0 (0.0%) | 0 (0.0%) |
| $75,000 to $99,999 | 6 (16.2%) | 0 (0.0%) |
| $100,000+ | 0 (0.0%) | 0 (0.0%) |
| Total | 37 (100.0%) | 35 (100.0%) |
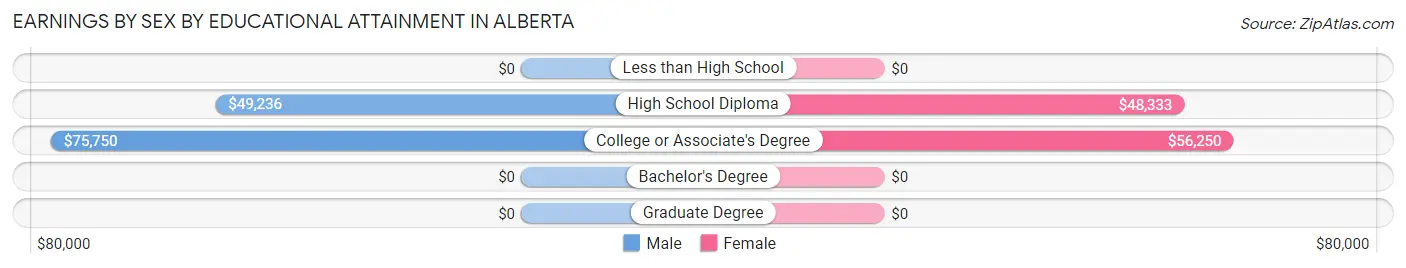
Earnings by Sex by Educational Attainment in Alberta
Average earnings in Alberta are $49,514 for men and $48,056 for women, a difference of 2.9%. Men with an educational attainment of college or associate's degree enjoy the highest average annual earnings of $75,750, while those with high school diploma education earn the least with $49,236. Women with an educational attainment of college or associate's degree earn the most with the average annual earnings of $56,250, while those with high school diploma education have the smallest earnings of $48,333.
| Educational Attainment | Male Income | Female Income |
| Less than High School | - | - |
| High School Diploma | $49,236 | $48,333 |
| College or Associate's Degree | $75,750 | $56,250 |
| Bachelor's Degree | - | - |
| Graduate Degree | - | - |
| Total | $49,514 | $48,056 |
Family Income in Alberta
Family Income Brackets in Alberta
According to the Alberta family income data, there are 14 families falling into the $75,000 to $99,999 income range, which is the most common income bracket and makes up 48.3% of all families.
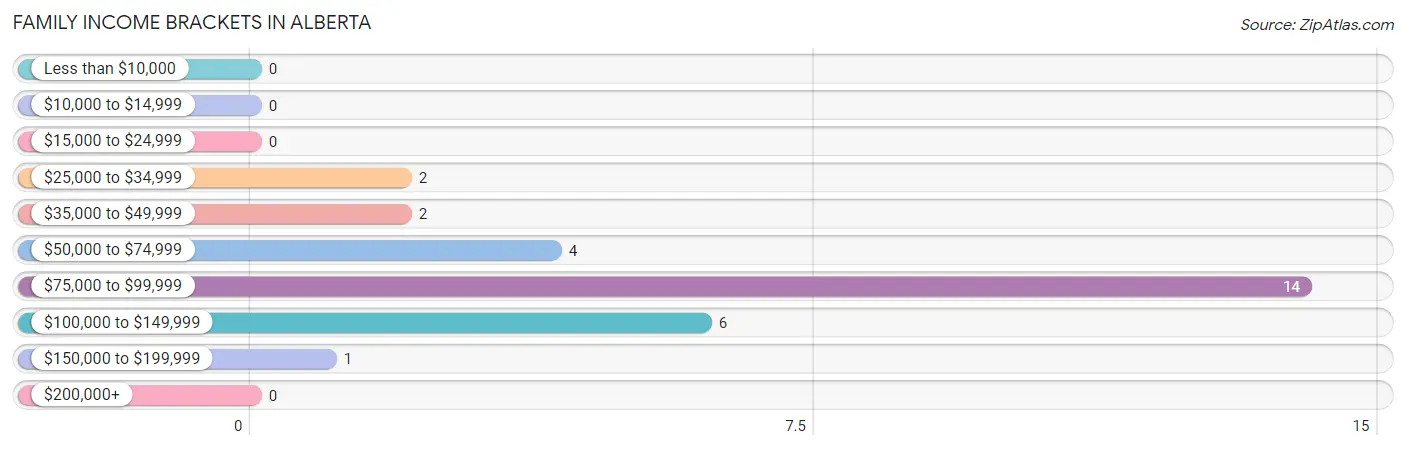
| Income Bracket | # Families | % Families |
| Less than $10,000 | 0 | 0.0% |
| $10,000 to $14,999 | 0 | 0.0% |
| $15,000 to $24,999 | 0 | 0.0% |
| $25,000 to $34,999 | 2 | 6.9% |
| $35,000 to $49,999 | 2 | 6.9% |
| $50,000 to $74,999 | 4 | 13.8% |
| $75,000 to $99,999 | 14 | 48.3% |
| $100,000 to $149,999 | 6 | 20.7% |
| $150,000 to $199,999 | 1 | 3.4% |
| $200,000+ | 0 | 0.0% |
Family Income by Famaliy Size in Alberta
2-person families (21 | 72.4%) account for the highest median family income in Alberta with $96,528 per family, while 2-person families (21 | 72.4%) have the highest median income of $48,264 per family member.
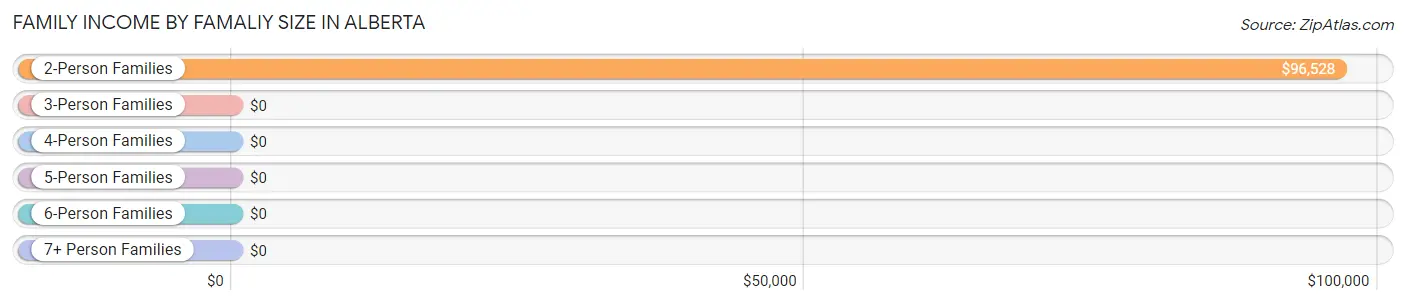
| Income Bracket | # Families | Median Income |
| 2-Person Families | 21 (72.4%) | $96,528 |
| 3-Person Families | 4 (13.8%) | $0 |
| 4-Person Families | 2 (6.9%) | $0 |
| 5-Person Families | 0 (0.0%) | $0 |
| 6-Person Families | 2 (6.9%) | $0 |
| 7+ Person Families | 0 (0.0%) | $0 |
| Total | 29 (100.0%) | $95,417 |
Family Income by Number of Earners in Alberta
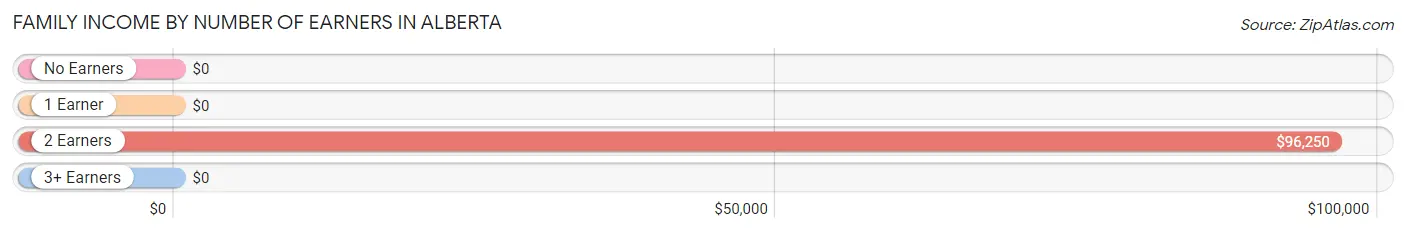
| Number of Earners | # Families | Median Income |
| No Earners | 4 (13.8%) | $0 |
| 1 Earner | 3 (10.3%) | $0 |
| 2 Earners | 21 (72.4%) | $96,250 |
| 3+ Earners | 1 (3.5%) | $0 |
| Total | 29 (100.0%) | $95,417 |
Household Income in Alberta
Household Income Brackets in Alberta
With 20 households falling in the category, the $75,000 to $99,999 income range is the most frequent in Alberta, accounting for 48.8% of all households.
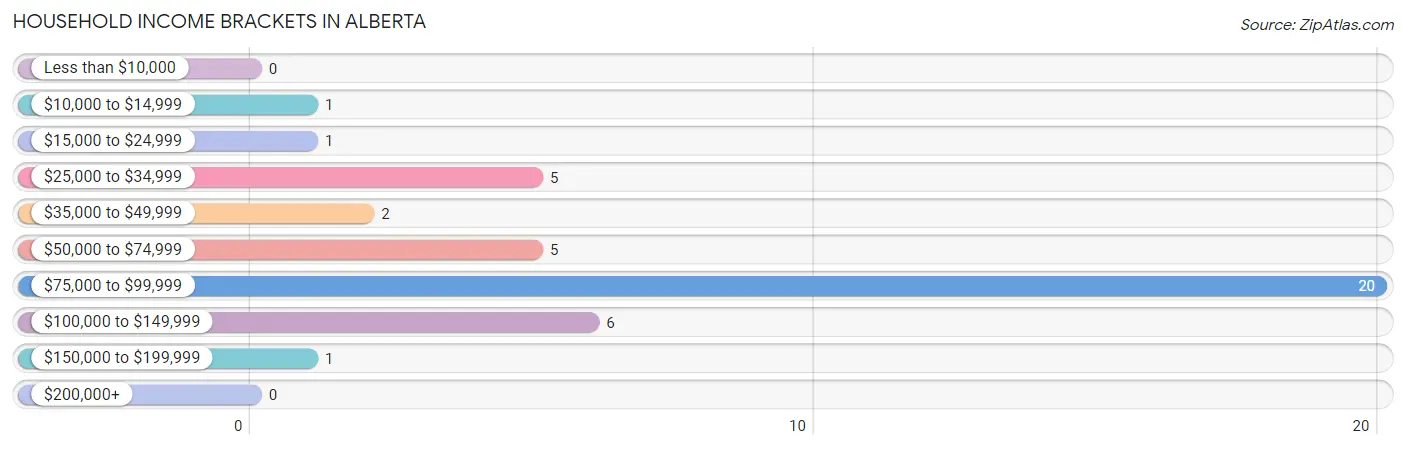
| Income Bracket | # Households | % Households |
| Less than $10,000 | 0 | 0.0% |
| $10,000 to $14,999 | 1 | 2.4% |
| $15,000 to $24,999 | 1 | 2.4% |
| $25,000 to $34,999 | 5 | 12.2% |
| $35,000 to $49,999 | 2 | 4.9% |
| $50,000 to $74,999 | 5 | 12.2% |
| $75,000 to $99,999 | 20 | 48.8% |
| $100,000 to $149,999 | 6 | 14.6% |
| $150,000 to $199,999 | 1 | 2.4% |
| $200,000+ | 0 | 0.0% |
Household Income by Householder Age in Alberta
The median household income in Alberta is $95,139, with the highest median household income of $96,528 found in the 45 to 64 years age bracket for the primary householder. A total of 29 households (70.7%) fall into this category. Meanwhile, the 15 to 24 years age bracket for the primary householder has the lowest median household income of $0, with 1 households (2.4%) in this group.
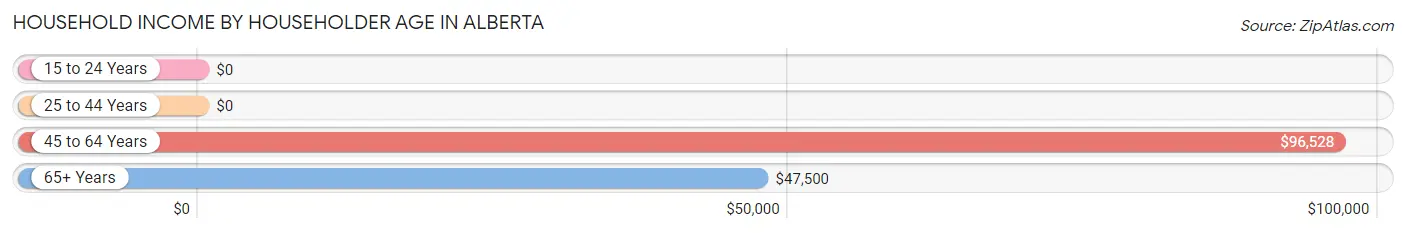
| Income Bracket | # Households | Median Income |
| 15 to 24 Years | 1 (2.4%) | $0 |
| 25 to 44 Years | 3 (7.3%) | $0 |
| 45 to 64 Years | 29 (70.7%) | $96,528 |
| 65+ Years | 8 (19.5%) | $47,500 |
| Total | 41 (100.0%) | $95,139 |
Poverty in Alberta
Income Below Poverty by Sex and Age in Alberta
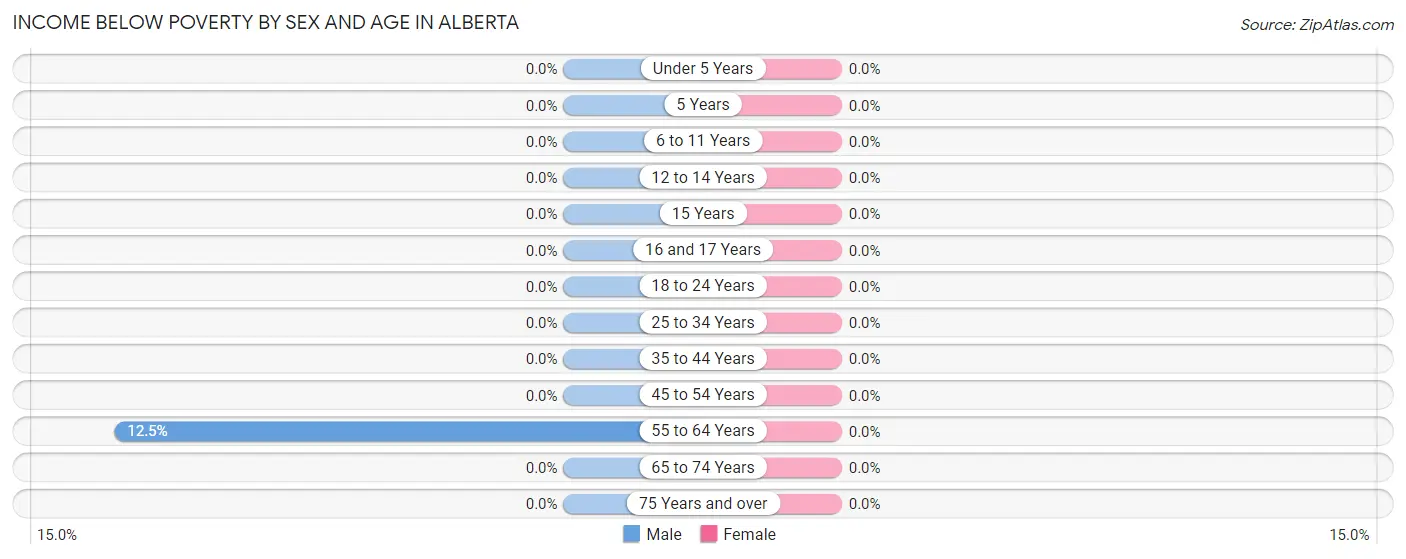
| Age Bracket | Male | Female |
| Under 5 Years | 0 (0.0%) | 0 (0.0%) |
| 5 Years | 0 (0.0%) | 0 (0.0%) |
| 6 to 11 Years | 0 (0.0%) | 0 (0.0%) |
| 12 to 14 Years | 0 (0.0%) | 0 (0.0%) |
| 15 Years | 0 (0.0%) | 0 (0.0%) |
| 16 and 17 Years | 0 (0.0%) | 0 (0.0%) |
| 18 to 24 Years | 0 (0.0%) | 0 (0.0%) |
| 25 to 34 Years | 0 (0.0%) | 0 (0.0%) |
| 35 to 44 Years | 0 (0.0%) | 0 (0.0%) |
| 45 to 54 Years | 0 (0.0%) | 0 (0.0%) |
| 55 to 64 Years | 1 (12.5%) | 0 (0.0%) |
| 65 to 74 Years | 0 (0.0%) | 0 (0.0%) |
| 75 Years and over | 0 (0.0%) | 0 (0.0%) |
| Total | 1 (2.0%) | 0 (0.0%) |
Income Above Poverty by Sex and Age in Alberta
According to the poverty statistics in Alberta, males aged under 5 years and females aged under 5 years are the age groups that are most secure financially, with 100.0% of males and 100.0% of females in these age groups living above the poverty line.
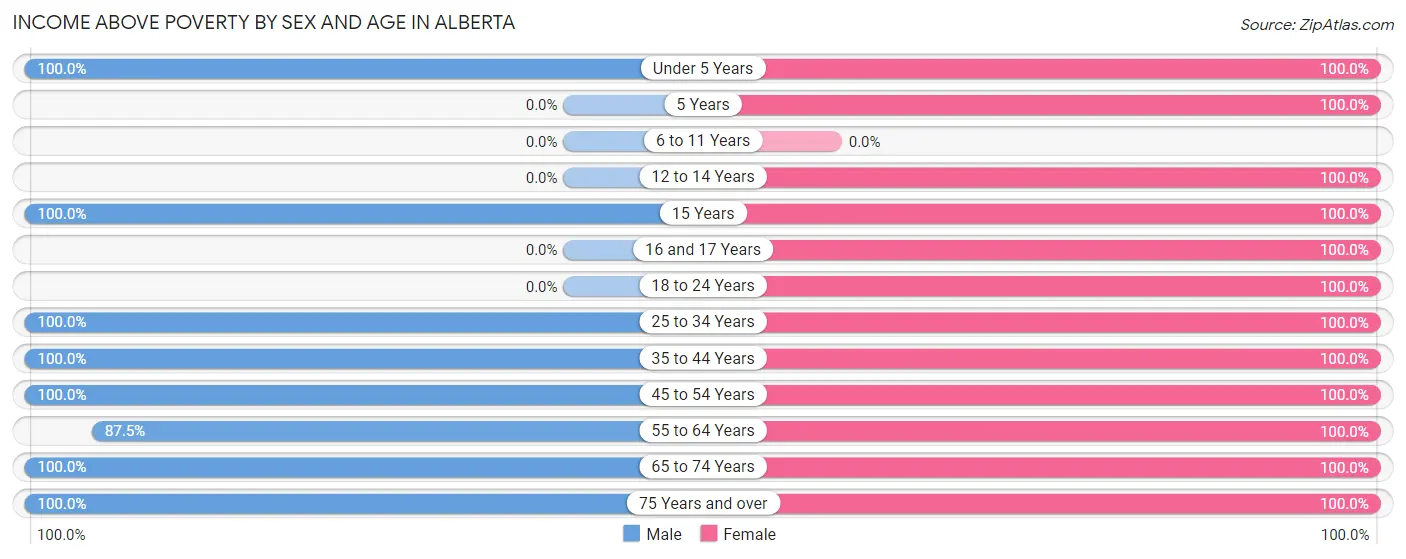
| Age Bracket | Male | Female |
| Under 5 Years | 1 (100.0%) | 3 (100.0%) |
| 5 Years | 0 (0.0%) | 2 (100.0%) |
| 6 to 11 Years | 0 (0.0%) | 0 (0.0%) |
| 12 to 14 Years | 0 (0.0%) | 2 (100.0%) |
| 15 Years | 2 (100.0%) | 1 (100.0%) |
| 16 and 17 Years | 0 (0.0%) | 8 (100.0%) |
| 18 to 24 Years | 0 (0.0%) | 1 (100.0%) |
| 25 to 34 Years | 2 (100.0%) | 3 (100.0%) |
| 35 to 44 Years | 1 (100.0%) | 3 (100.0%) |
| 45 to 54 Years | 11 (100.0%) | 7 (100.0%) |
| 55 to 64 Years | 7 (87.5%) | 14 (100.0%) |
| 65 to 74 Years | 21 (100.0%) | 7 (100.0%) |
| 75 Years and over | 3 (100.0%) | 1 (100.0%) |
| Total | 48 (98.0%) | 52 (100.0%) |
Income Below Poverty Among Married-Couple Families in Alberta
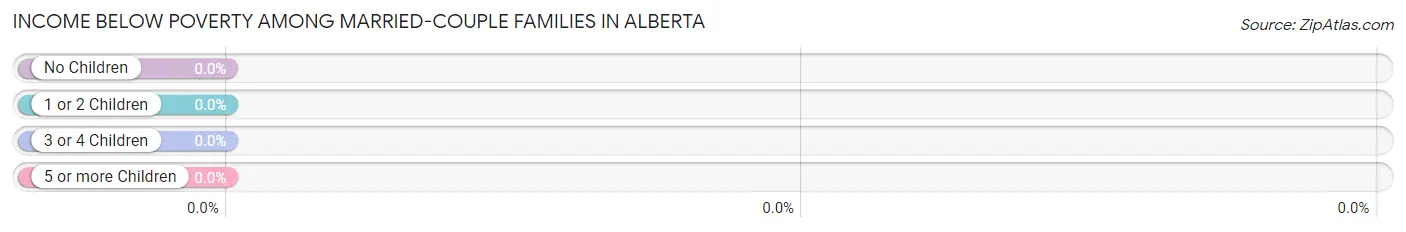
| Children | Above Poverty | Below Poverty |
| No Children | 19 (100.0%) | 0 (0.0%) |
| 1 or 2 Children | 5 (100.0%) | 0 (0.0%) |
| 3 or 4 Children | 2 (100.0%) | 0 (0.0%) |
| 5 or more Children | 0 (0.0%) | 0 (0.0%) |
| Total | 26 (100.0%) | 0 (0.0%) |
Income Below Poverty Among Single-Parent Households in Alberta
| Children | Single Father | Single Mother |
| No Children | 0 (0.0%) | 0 (0.0%) |
| 1 or 2 Children | 0 (0.0%) | 0 (0.0%) |
| 3 or 4 Children | 0 (0.0%) | 0 (0.0%) |
| 5 or more Children | 0 (0.0%) | 0 (0.0%) |
| Total | 0 (0.0%) | 0 (0.0%) |
Income Below Poverty Among Married-Couple vs Single-Parent Households in Alberta
| Children | Married-Couple Families | Single-Parent Households |
| No Children | 0 (0.0%) | 0 (0.0%) |
| 1 or 2 Children | 0 (0.0%) | 0 (0.0%) |
| 3 or 4 Children | 0 (0.0%) | 0 (0.0%) |
| 5 or more Children | 0 (0.0%) | 0 (0.0%) |
| Total | 0 (0.0%) | 0 (0.0%) |
Race in Alberta
The most populous races in Alberta are , and White / Caucasian (101 | 100.0%).
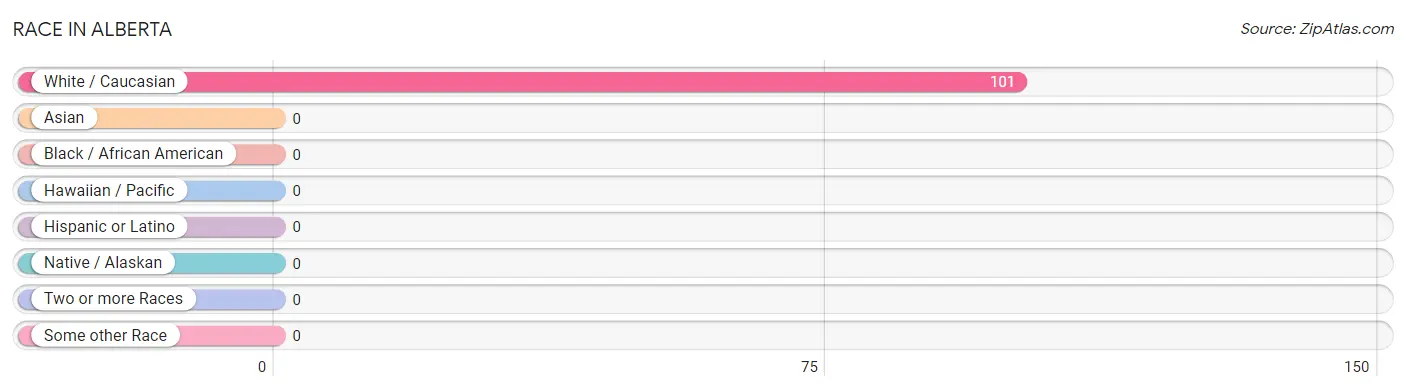
| Race | # Population | % Population |
| Asian | 0 | 0.0% |
| Black / African American | 0 | 0.0% |
| Hawaiian / Pacific | 0 | 0.0% |
| Hispanic or Latino | 0 | 0.0% |
| Native / Alaskan | 0 | 0.0% |
| White / Caucasian | 101 | 100.0% |
| Two or more Races | 0 | 0.0% |
| Some other Race | 0 | 0.0% |
| Total | 101 | 100.0% |
Ancestry in Alberta
The most populous ancestries reported in Alberta are German (69 | 68.3%), Norwegian (41 | 40.6%), French (8 | 7.9%), Luxembourger (5 | 5.0%), and Dutch (4 | 4.0%), together accounting for 125.7% of all Alberta residents.
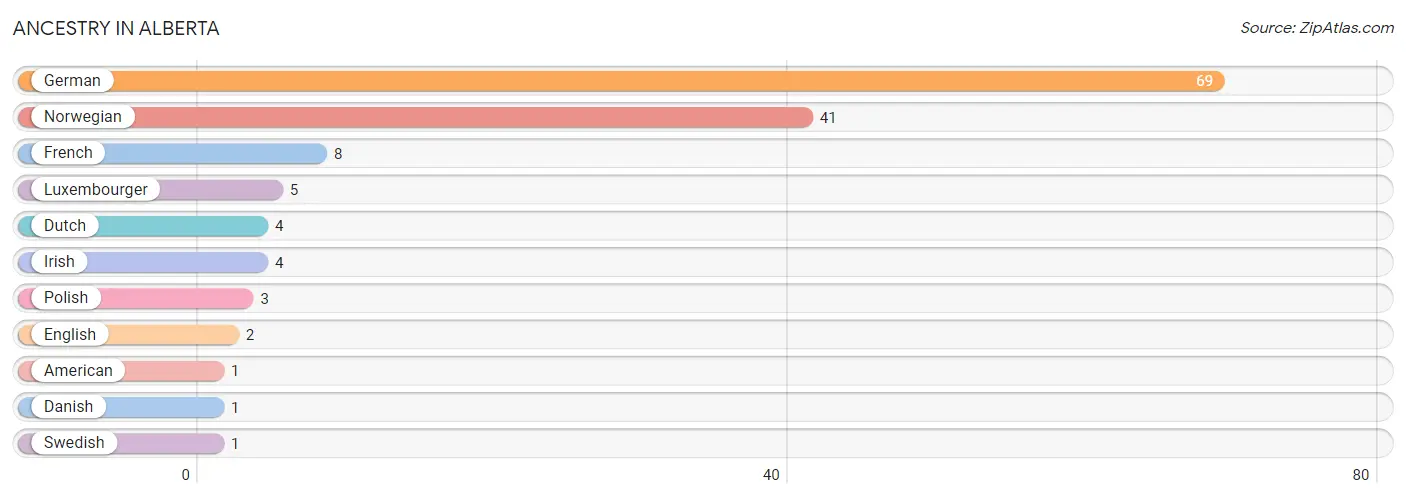
| Ancestry | # Population | % Population |
| American | 1 | 1.0% |
| Danish | 1 | 1.0% |
| Dutch | 4 | 4.0% |
| English | 2 | 2.0% |
| French | 8 | 7.9% |
| German | 69 | 68.3% |
| Irish | 4 | 4.0% |
| Luxembourger | 5 | 5.0% |
| Norwegian | 41 | 40.6% |
| Polish | 3 | 3.0% |
| Swedish | 1 | 1.0% | View All 11 Rows |
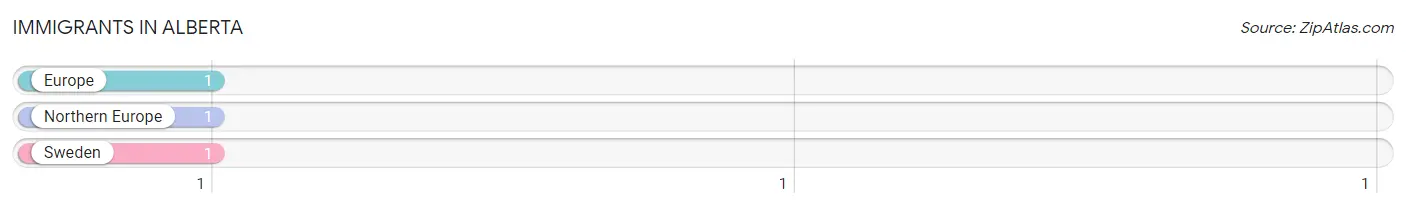
Immigrants in Alberta
The most numerous immigrant groups reported in Alberta came from Europe (1 | 1.0%), Northern Europe (1 | 1.0%), and Sweden (1 | 1.0%), together accounting for 3.0% of all Alberta residents.
| Immigration Origin | # Population | % Population |
| Europe | 1 | 1.0% |
| Northern Europe | 1 | 1.0% |
| Sweden | 1 | 1.0% | View All 3 Rows |
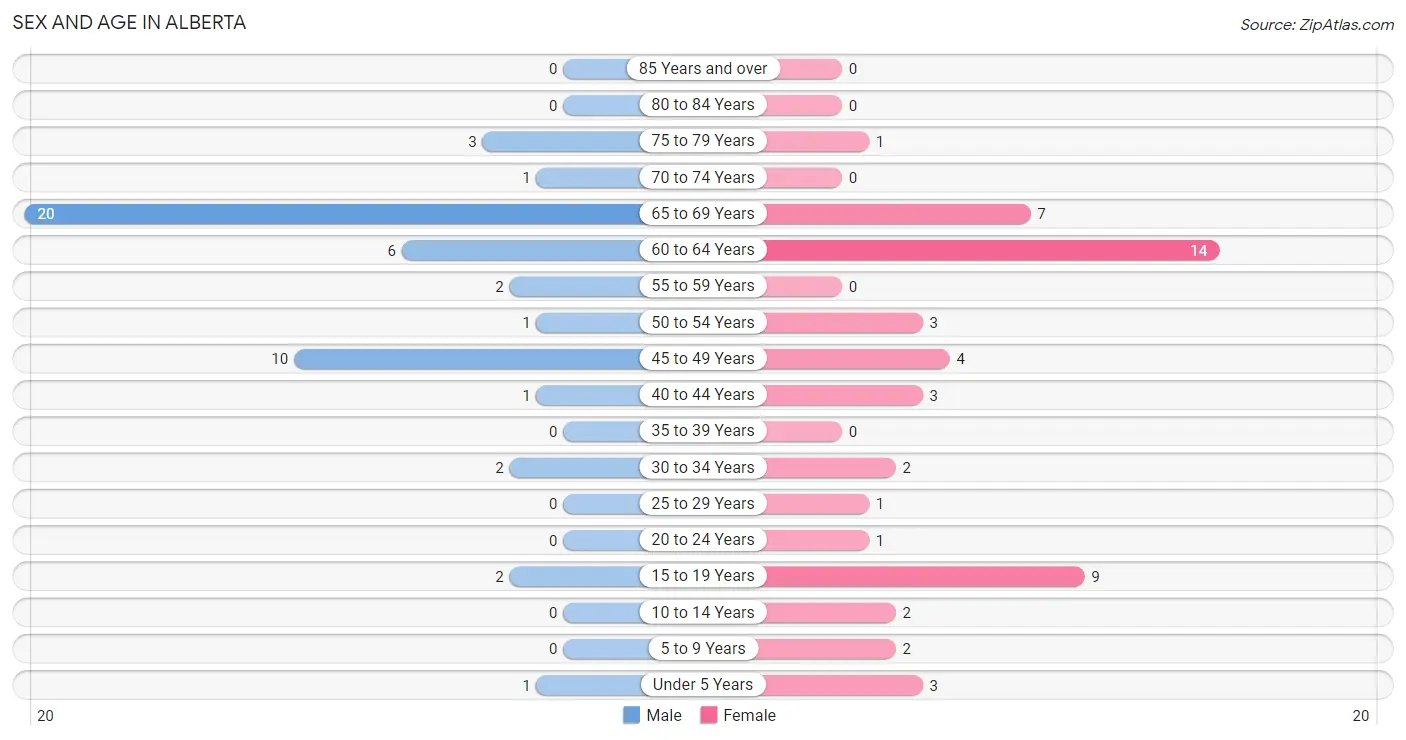
Sex and Age in Alberta
Sex and Age in Alberta
The most populous age groups in Alberta are 65 to 69 Years (20 | 40.8%) for men and 60 to 64 Years (14 | 26.9%) for women.
| Age Bracket | Male | Female |
| Under 5 Years | 1 (2.0%) | 3 (5.8%) |
| 5 to 9 Years | 0 (0.0%) | 2 (3.8%) |
| 10 to 14 Years | 0 (0.0%) | 2 (3.8%) |
| 15 to 19 Years | 2 (4.1%) | 9 (17.3%) |
| 20 to 24 Years | 0 (0.0%) | 1 (1.9%) |
| 25 to 29 Years | 0 (0.0%) | 1 (1.9%) |
| 30 to 34 Years | 2 (4.1%) | 2 (3.8%) |
| 35 to 39 Years | 0 (0.0%) | 0 (0.0%) |
| 40 to 44 Years | 1 (2.0%) | 3 (5.8%) |
| 45 to 49 Years | 10 (20.4%) | 4 (7.7%) |
| 50 to 54 Years | 1 (2.0%) | 3 (5.8%) |
| 55 to 59 Years | 2 (4.1%) | 0 (0.0%) |
| 60 to 64 Years | 6 (12.2%) | 14 (26.9%) |
| 65 to 69 Years | 20 (40.8%) | 7 (13.5%) |
| 70 to 74 Years | 1 (2.0%) | 0 (0.0%) |
| 75 to 79 Years | 3 (6.1%) | 1 (1.9%) |
| 80 to 84 Years | 0 (0.0%) | 0 (0.0%) |
| 85 Years and over | 0 (0.0%) | 0 (0.0%) |
| Total | 49 (100.0%) | 52 (100.0%) |
Families and Households in Alberta
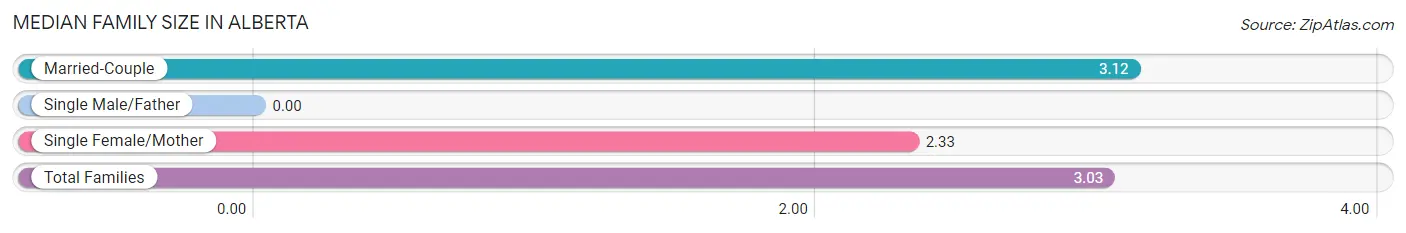
Median Family Size in Alberta
| Family Type | # Families | Family Size |
| Married-Couple | 26 (89.7%) | 3.12 |
| Single Male/Father | 0 (0.0%) | - |
| Single Female/Mother | 3 (10.3%) | 2.33 |
| Total Families | 29 (100.0%) | 3.03 |
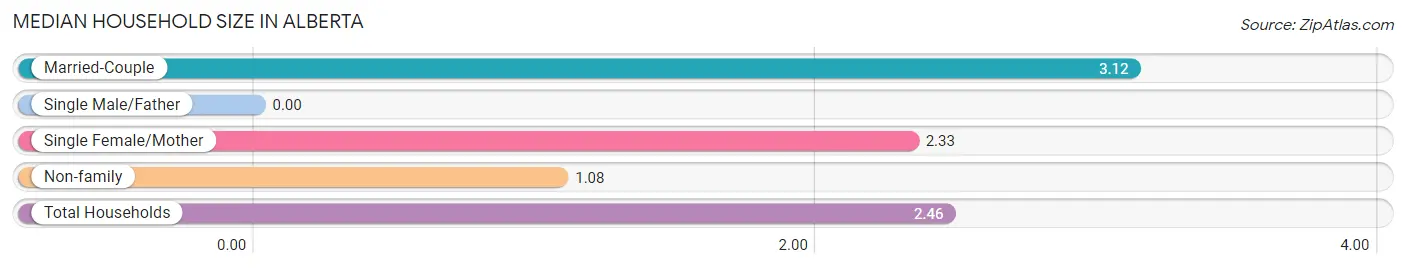
Median Household Size in Alberta
| Household Type | # Households | Household Size |
| Married-Couple | 26 (63.4%) | 3.12 |
| Single Male/Father | 0 (0.0%) | - |
| Single Female/Mother | 3 (7.3%) | 2.33 |
| Non-family | 12 (29.3%) | 1.08 |
| Total Households | 41 (100.0%) | 2.46 |
Household Size by Marriage Status in Alberta
Out of a total of 41 households in Alberta, 29 (70.7%) are family households, while 12 (29.3%) are nonfamily households. The most numerous type of family households are 2-person households, comprising 21, and the most common type of nonfamily households are 1-person households, comprising 11.
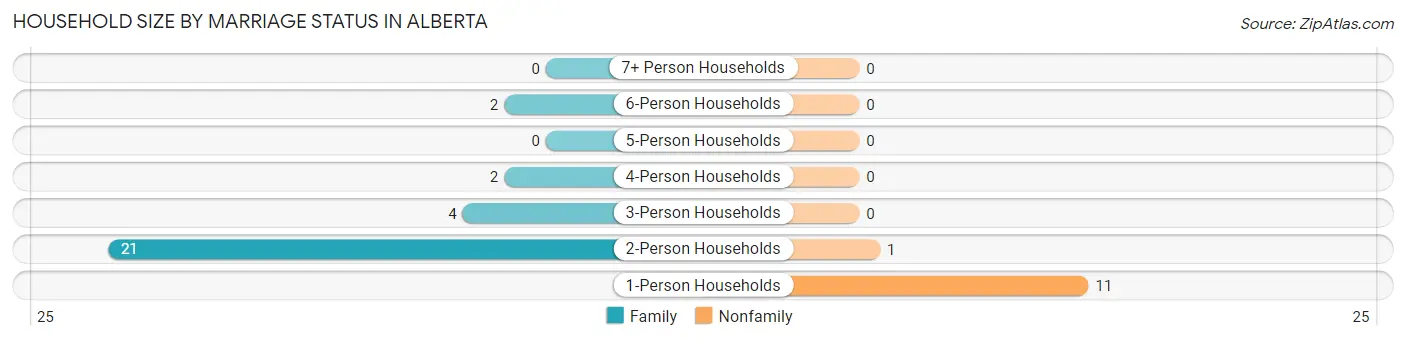
| Household Size | Family Households | Nonfamily Households |
| 1-Person Households | - | 11 (26.8%) |
| 2-Person Households | 21 (51.2%) | 1 (2.4%) |
| 3-Person Households | 4 (9.8%) | 0 (0.0%) |
| 4-Person Households | 2 (4.9%) | 0 (0.0%) |
| 5-Person Households | 0 (0.0%) | 0 (0.0%) |
| 6-Person Households | 2 (4.9%) | 0 (0.0%) |
| 7+ Person Households | 0 (0.0%) | 0 (0.0%) |
| Total | 29 (70.7%) | 12 (29.3%) |
Female Fertility in Alberta
Fertility by Age in Alberta
Average fertility rate in Alberta is 87.0 births per 1,000 women. Women in the age bracket of 20 to 34 years have the highest fertility rate with 500.0 births per 1,000 women. Women in the age bracket of 20 to 34 years acount for 100.0% of all women with births.
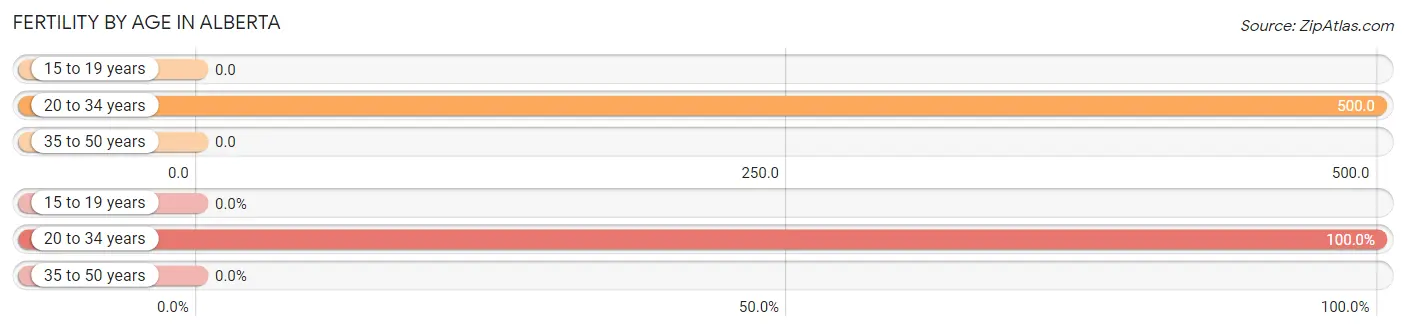
| Age Bracket | Women with Births | Births / 1,000 Women |
| 15 to 19 years | 0 (0.0%) | 0.0 |
| 20 to 34 years | 2 (100.0%) | 500.0 |
| 35 to 50 years | 0 (0.0%) | 0.0 |
| Total | 2 (100.0%) | 87.0 |
Fertility by Age by Marriage Status in Alberta
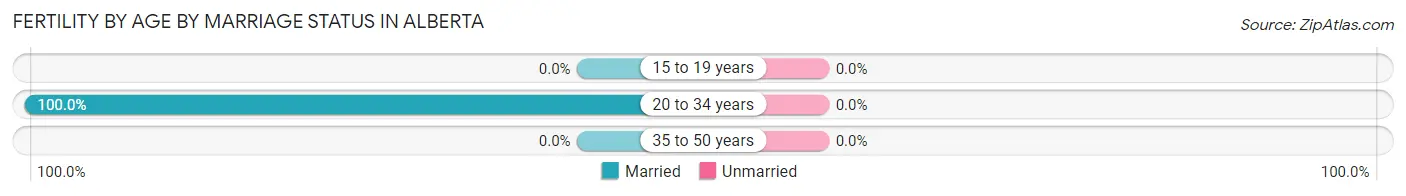
| Age Bracket | Married | Unmarried |
| 15 to 19 years | 0 (0.0%) | 0 (0.0%) |
| 20 to 34 years | 2 (100.0%) | 0 (0.0%) |
| 35 to 50 years | 0 (0.0%) | 0 (0.0%) |
| Total | 2 (100.0%) | 0 (0.0%) |
Fertility by Education in Alberta
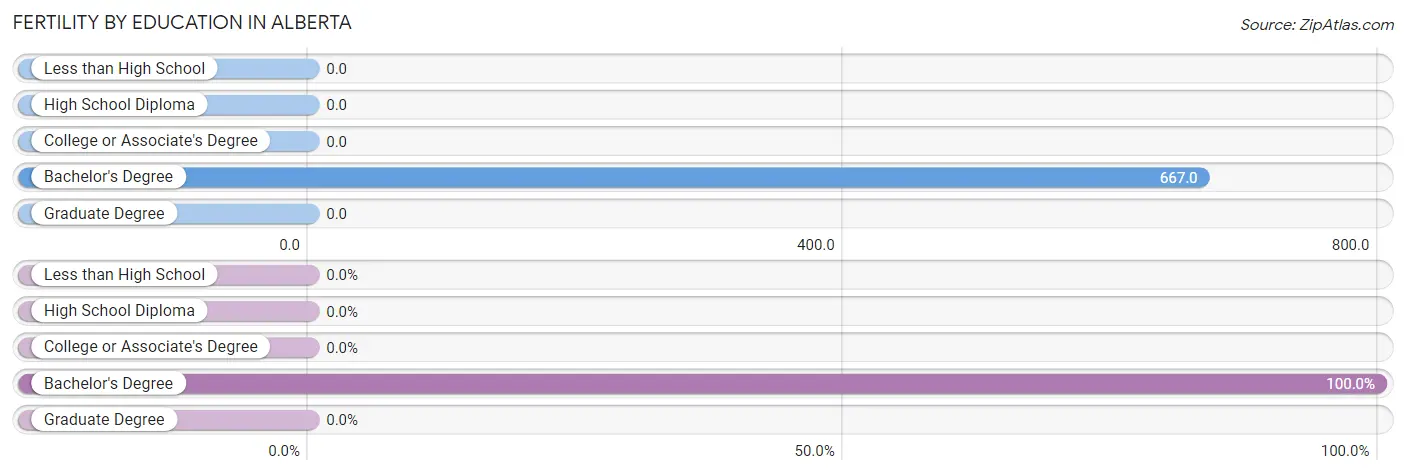
| Educational Attainment | Women with Births | Births / 1,000 Women |
| Less than High School | 0 (0.0%) | 0.0 |
| High School Diploma | 0 (0.0%) | 0.0 |
| College or Associate's Degree | 0 (0.0%) | 0.0 |
| Bachelor's Degree | 2 (100.0%) | 667.0 |
| Graduate Degree | 0 (0.0%) | 0.0 |
| Total | 2 (100.0%) | 87.0 |
Fertility by Education by Marriage Status in Alberta
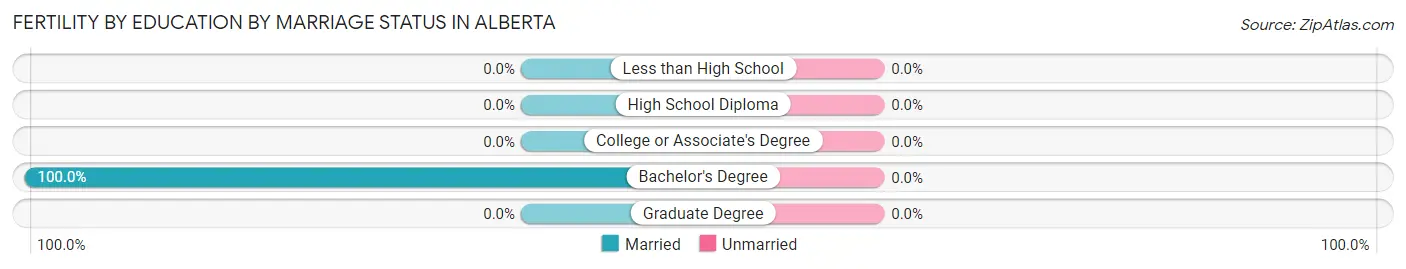
| Educational Attainment | Married | Unmarried |
| Less than High School | 0 (0.0%) | 0 (0.0%) |
| High School Diploma | 0 (0.0%) | 0 (0.0%) |
| College or Associate's Degree | 0 (0.0%) | 0 (0.0%) |
| Bachelor's Degree | 2 (100.0%) | 0 (0.0%) |
| Graduate Degree | 0 (0.0%) | 0 (0.0%) |
| Total | 2 (100.0%) | 0 (0.0%) |
Employment Characteristics in Alberta
Employment by Class of Employer in Alberta
Among the 70 employed individuals in Alberta, private company employees (57 | 81.4%), not-for-profit organizations (6 | 8.6%), and self-employed (not incorporated) (3 | 4.3%) make up the most common classes of employment.
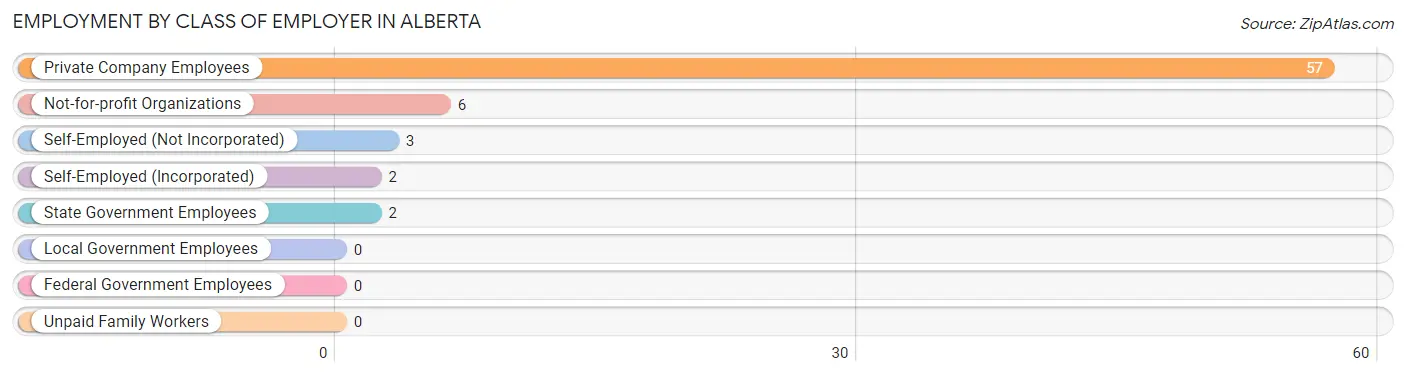
| Employer Class | # Employees | % Employees |
| Private Company Employees | 57 | 81.4% |
| Self-Employed (Incorporated) | 2 | 2.9% |
| Self-Employed (Not Incorporated) | 3 | 4.3% |
| Not-for-profit Organizations | 6 | 8.6% |
| Local Government Employees | 0 | 0.0% |
| State Government Employees | 2 | 2.9% |
| Federal Government Employees | 0 | 0.0% |
| Unpaid Family Workers | 0 | 0.0% |
| Total | 70 | 100.0% |
Employment Status by Age in Alberta
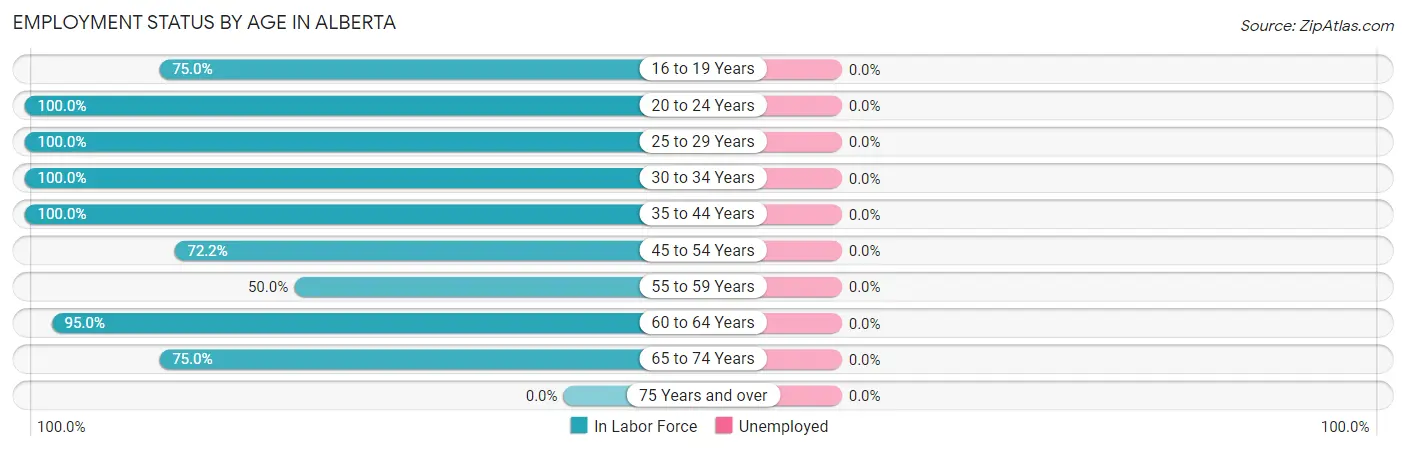
| Age Bracket | In Labor Force | Unemployed |
| 16 to 19 Years | 6 (75.0%) | 0 (0.0%) |
| 20 to 24 Years | 1 (100.0%) | 0 (0.0%) |
| 25 to 29 Years | 1 (100.0%) | 0 (0.0%) |
| 30 to 34 Years | 4 (100.0%) | 0 (0.0%) |
| 35 to 44 Years | 4 (100.0%) | 0 (0.0%) |
| 45 to 54 Years | 13 (72.2%) | 0 (0.0%) |
| 55 to 59 Years | 1 (50.0%) | 0 (0.0%) |
| 60 to 64 Years | 19 (95.0%) | 0 (0.0%) |
| 65 to 74 Years | 21 (75.0%) | 0 (0.0%) |
| 75 Years and over | 0 (0.0%) | 0 (0.0%) |
| Total | 70 (77.8%) | 0 (0.0%) |
Employment Status by Educational Attainment in Alberta
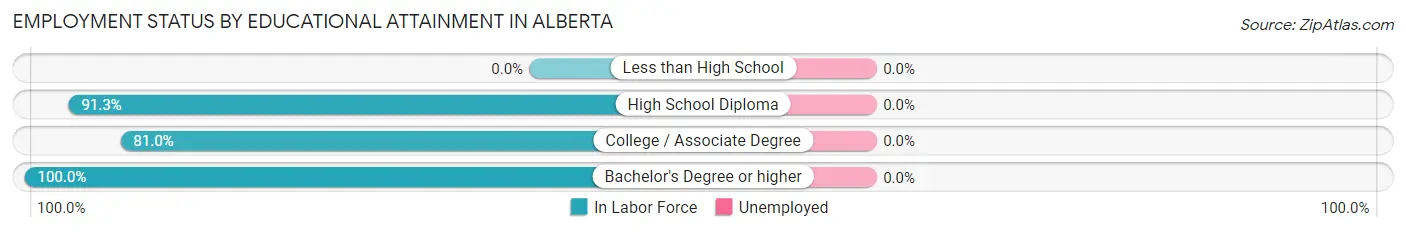
| Educational Attainment | In Labor Force | Unemployed |
| Less than High School | 0 (0.0%) | 0 (0.0%) |
| High School Diploma | 21 (91.3%) | 0 (0.0%) |
| College / Associate Degree | 17 (81.0%) | 0 (0.0%) |
| Bachelor's Degree or higher | 4 (100.0%) | 0 (0.0%) |
| Total | 42 (85.7%) | 0 (0.0%) |
Employment Occupations by Sex in Alberta
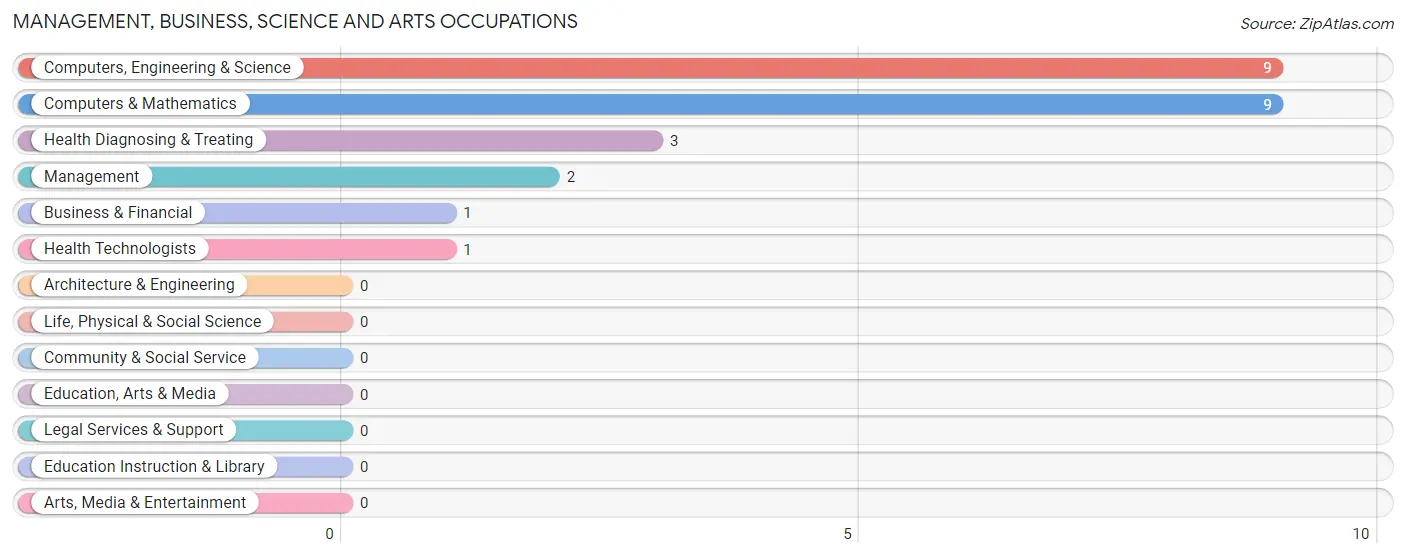
Management, Business, Science and Arts Occupations
The most common Management, Business, Science and Arts occupations in Alberta are Computers, Engineering & Science (9 | 12.9%), Computers & Mathematics (9 | 12.9%), Health Diagnosing & Treating (3 | 4.3%), Management (2 | 2.9%), and Business & Financial (1 | 1.4%).
Management, Business, Science and Arts Occupations by Sex
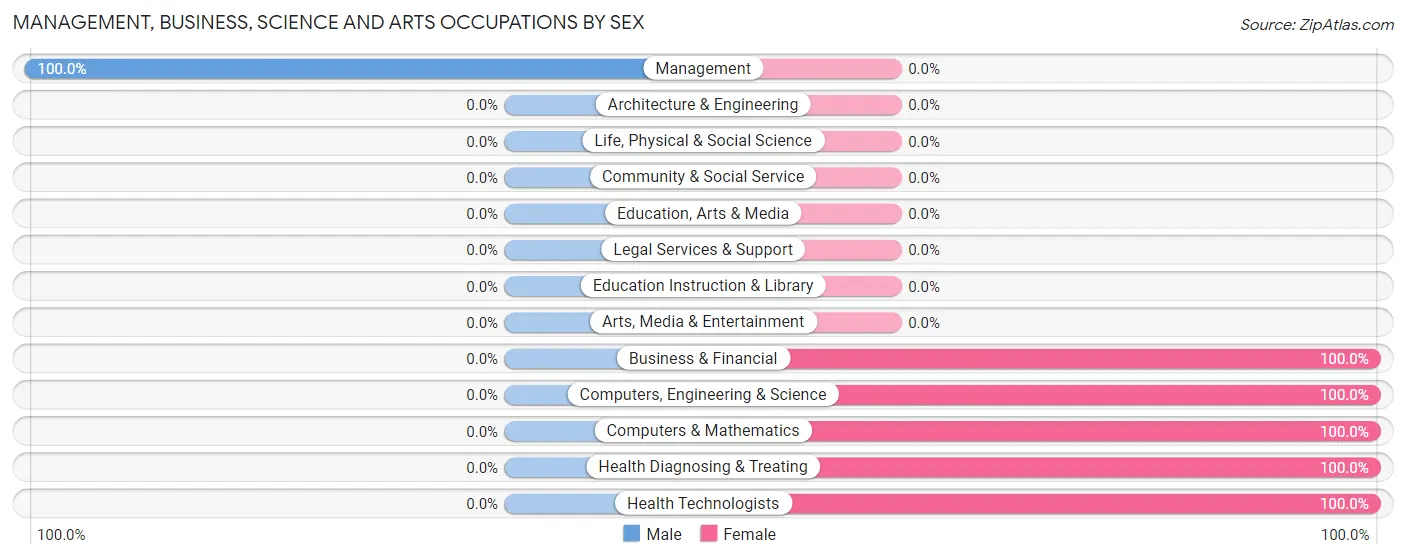
| Occupation | Male | Female |
| Management | 2 (100.0%) | 0 (0.0%) |
| Business & Financial | 0 (0.0%) | 1 (100.0%) |
| Computers, Engineering & Science | 0 (0.0%) | 9 (100.0%) |
| Computers & Mathematics | 0 (0.0%) | 9 (100.0%) |
| Architecture & Engineering | 0 (0.0%) | 0 (0.0%) |
| Life, Physical & Social Science | 0 (0.0%) | 0 (0.0%) |
| Community & Social Service | 0 (0.0%) | 0 (0.0%) |
| Education, Arts & Media | 0 (0.0%) | 0 (0.0%) |
| Legal Services & Support | 0 (0.0%) | 0 (0.0%) |
| Education Instruction & Library | 0 (0.0%) | 0 (0.0%) |
| Arts, Media & Entertainment | 0 (0.0%) | 0 (0.0%) |
| Health Diagnosing & Treating | 0 (0.0%) | 3 (100.0%) |
| Health Technologists | 0 (0.0%) | 1 (100.0%) |
| Total (Category) | 2 (13.3%) | 13 (86.7%) |
| Total (Overall) | 37 (52.9%) | 33 (47.1%) |
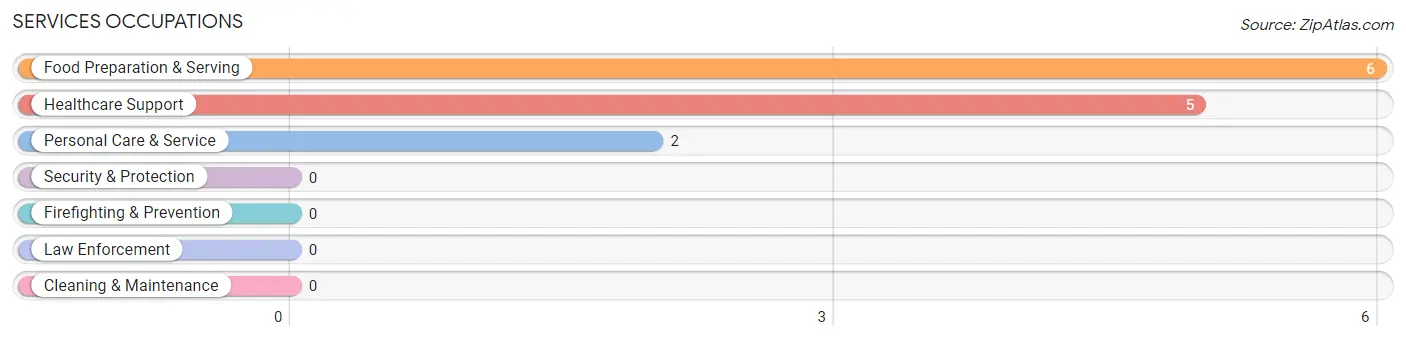
Services Occupations
The most common Services occupations in Alberta are Food Preparation & Serving (6 | 8.6%), Healthcare Support (5 | 7.1%), and Personal Care & Service (2 | 2.9%).
Services Occupations by Sex
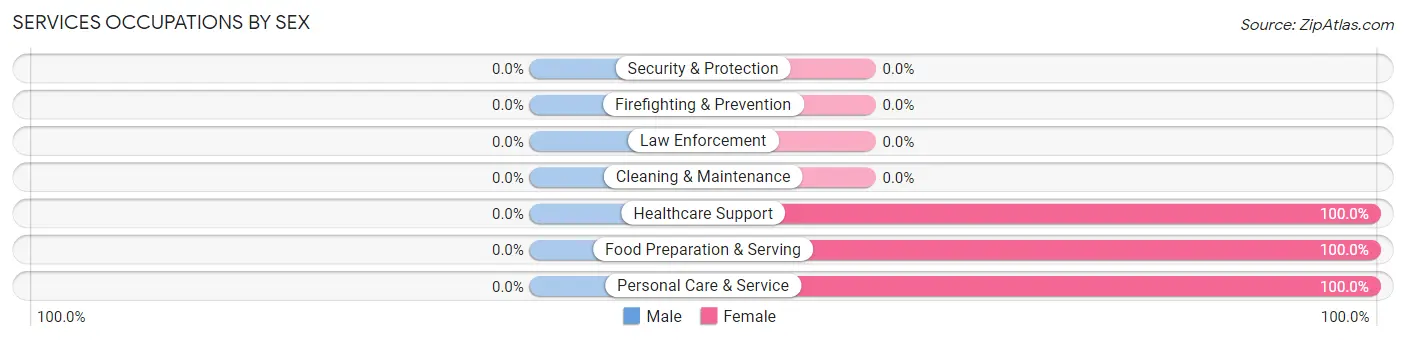
| Occupation | Male | Female |
| Healthcare Support | 0 (0.0%) | 5 (100.0%) |
| Security & Protection | 0 (0.0%) | 0 (0.0%) |
| Firefighting & Prevention | 0 (0.0%) | 0 (0.0%) |
| Law Enforcement | 0 (0.0%) | 0 (0.0%) |
| Food Preparation & Serving | 0 (0.0%) | 6 (100.0%) |
| Cleaning & Maintenance | 0 (0.0%) | 0 (0.0%) |
| Personal Care & Service | 0 (0.0%) | 2 (100.0%) |
| Total (Category) | 0 (0.0%) | 13 (100.0%) |
| Total (Overall) | 37 (52.9%) | 33 (47.1%) |
Sales and Office Occupations
The most common Sales and Office occupations in Alberta are Sales & Related (8 | 11.4%), and Office & Administration (6 | 8.6%).
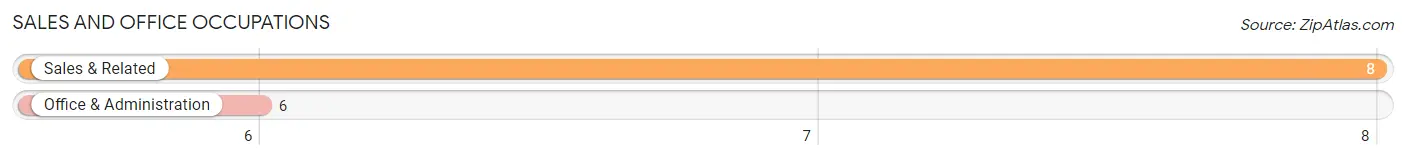
Sales and Office Occupations by Sex
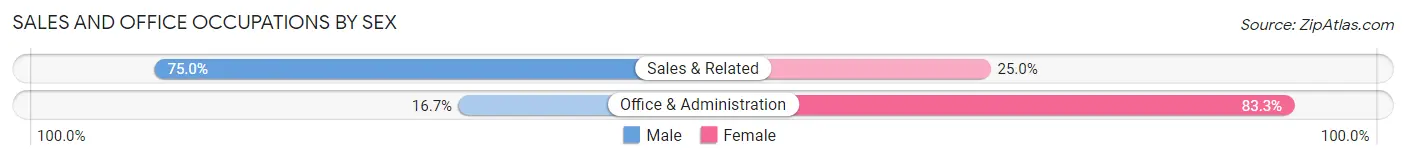
| Occupation | Male | Female |
| Sales & Related | 6 (75.0%) | 2 (25.0%) |
| Office & Administration | 1 (16.7%) | 5 (83.3%) |
| Total (Category) | 7 (50.0%) | 7 (50.0%) |
| Total (Overall) | 37 (52.9%) | 33 (47.1%) |
Natural Resources, Construction and Maintenance Occupations
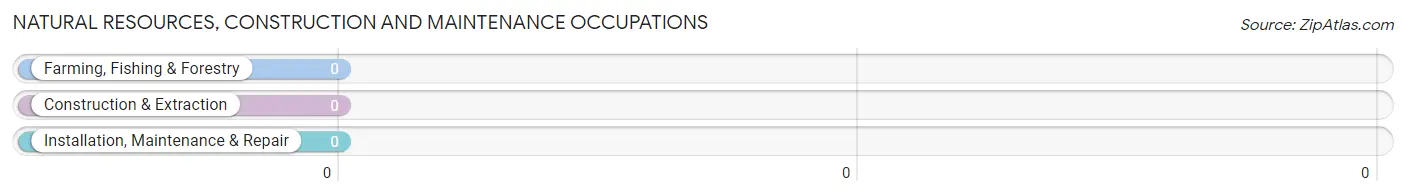
Natural Resources, Construction and Maintenance Occupations by Sex
| Occupation | Male | Female |
| Farming, Fishing & Forestry | 0 (0.0%) | 0 (0.0%) |
| Construction & Extraction | 0 (0.0%) | 0 (0.0%) |
| Installation, Maintenance & Repair | 0 (0.0%) | 0 (0.0%) |
| Total (Category) | 0 (0.0%) | 0 (0.0%) |
| Total (Overall) | 37 (52.9%) | 33 (47.1%) |
Production, Transportation and Moving Occupations
The most common Production, Transportation and Moving occupations in Alberta are Production (25 | 35.7%), and Transportation (3 | 4.3%).
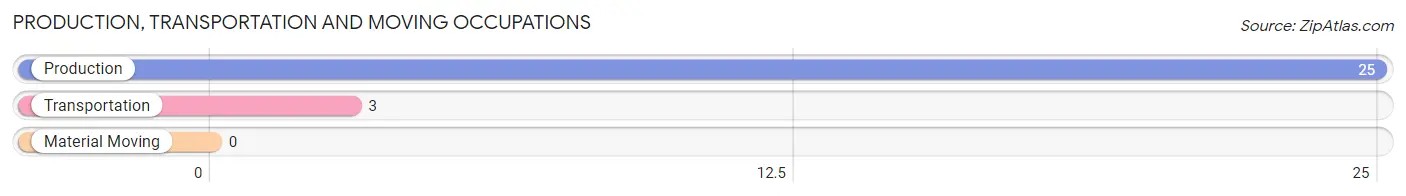
Production, Transportation and Moving Occupations by Sex
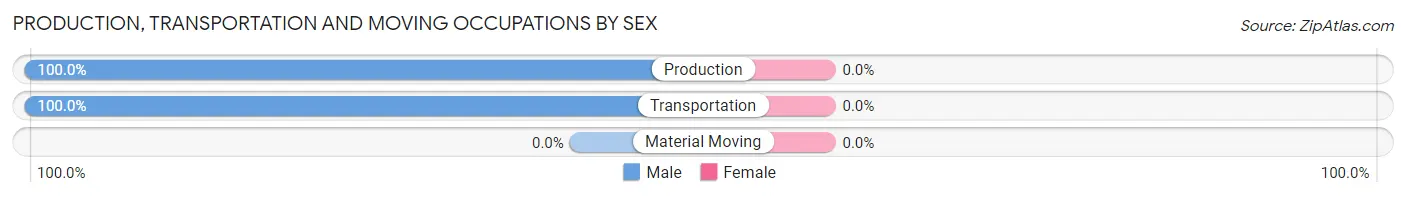
| Occupation | Male | Female |
| Production | 25 (100.0%) | 0 (0.0%) |
| Transportation | 3 (100.0%) | 0 (0.0%) |
| Material Moving | 0 (0.0%) | 0 (0.0%) |
| Total (Category) | 28 (100.0%) | 0 (0.0%) |
| Total (Overall) | 37 (52.9%) | 33 (47.1%) |
Employment Industries by Sex in Alberta
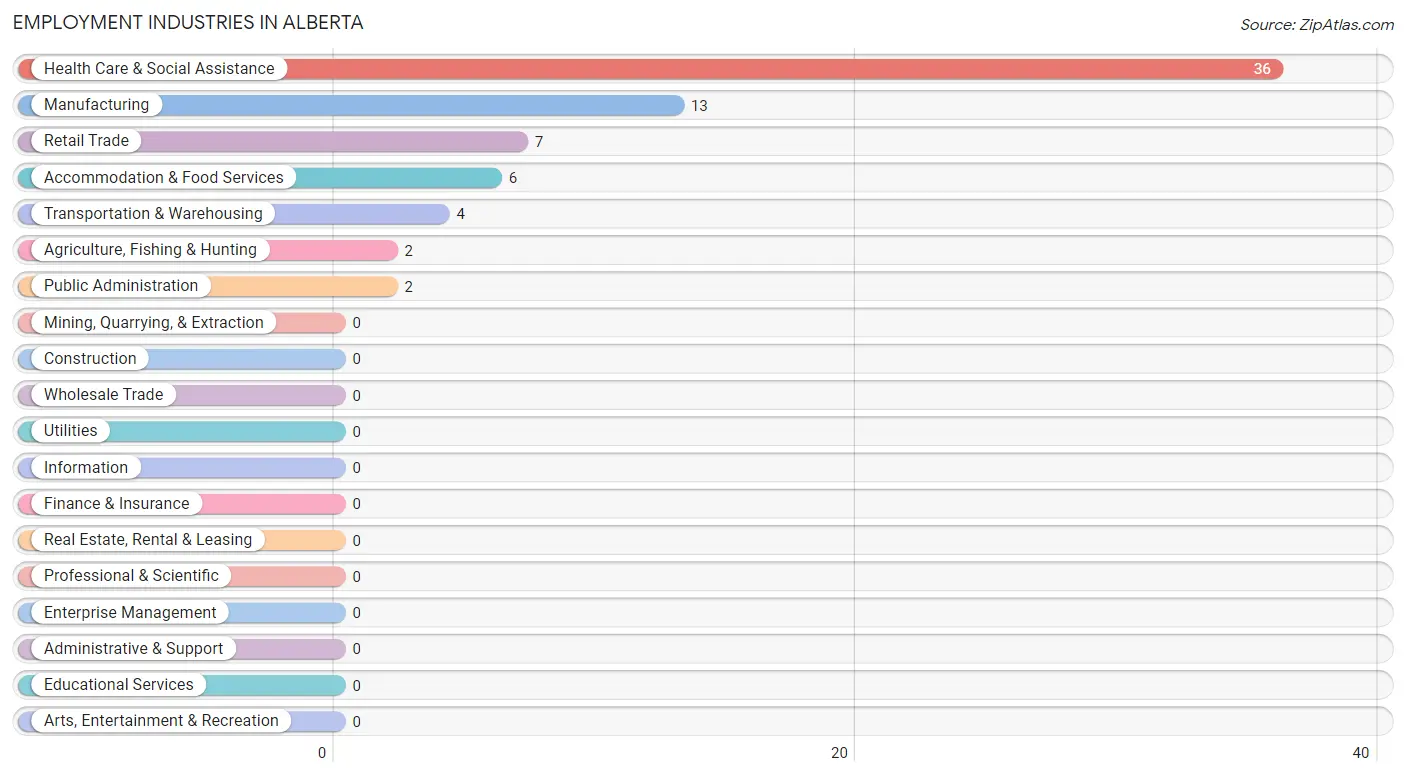
Employment Industries in Alberta
The major employment industries in Alberta include Health Care & Social Assistance (36 | 51.4%), Manufacturing (13 | 18.6%), Retail Trade (7 | 10.0%), Accommodation & Food Services (6 | 8.6%), and Transportation & Warehousing (4 | 5.7%).
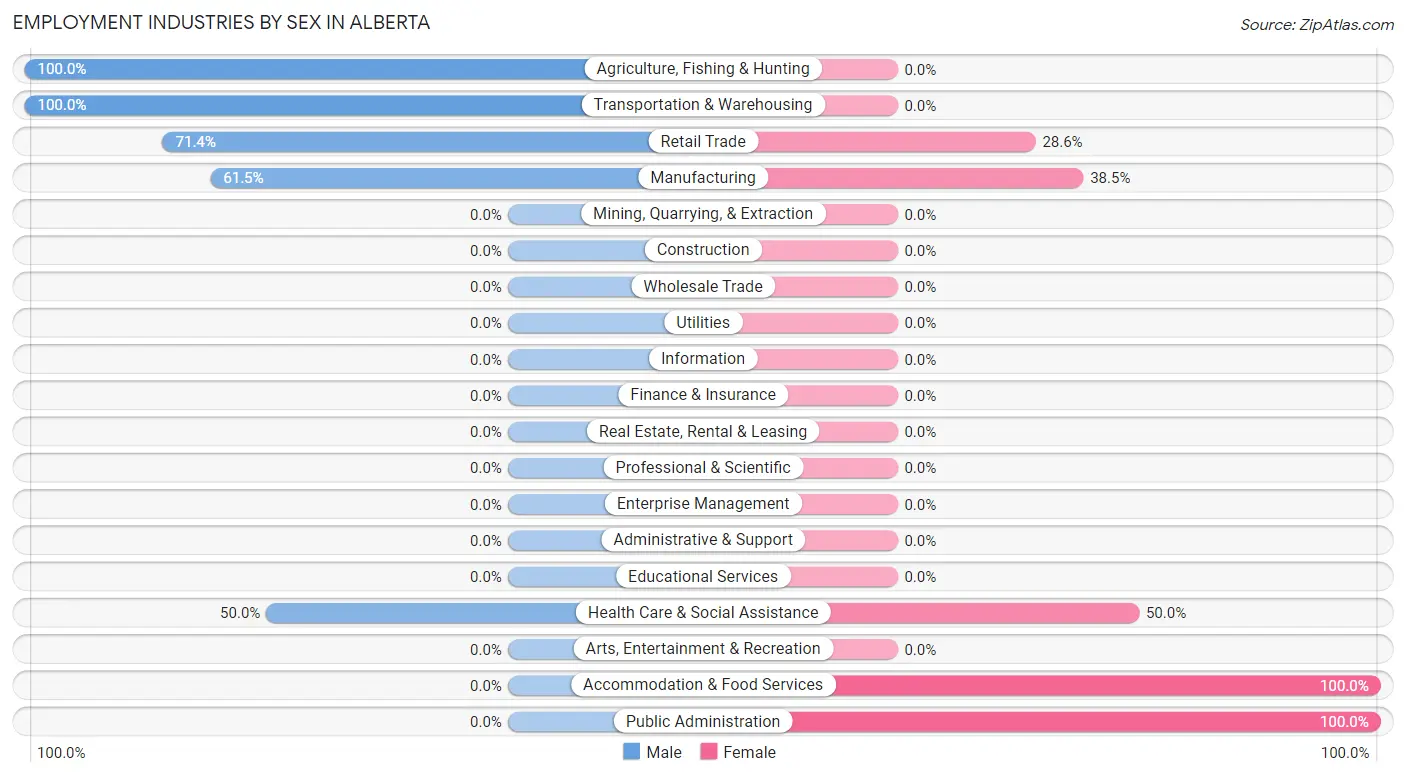
Employment Industries by Sex in Alberta
The Alberta industries that see more men than women are Agriculture, Fishing & Hunting (100.0%), Transportation & Warehousing (100.0%), and Retail Trade (71.4%), whereas the industries that tend to have a higher number of women are Accommodation & Food Services (100.0%), Public Administration (100.0%), and Health Care & Social Assistance (50.0%).
| Industry | Male | Female |
| Agriculture, Fishing & Hunting | 2 (100.0%) | 0 (0.0%) |
| Mining, Quarrying, & Extraction | 0 (0.0%) | 0 (0.0%) |
| Construction | 0 (0.0%) | 0 (0.0%) |
| Manufacturing | 8 (61.5%) | 5 (38.5%) |
| Wholesale Trade | 0 (0.0%) | 0 (0.0%) |
| Retail Trade | 5 (71.4%) | 2 (28.6%) |
| Transportation & Warehousing | 4 (100.0%) | 0 (0.0%) |
| Utilities | 0 (0.0%) | 0 (0.0%) |
| Information | 0 (0.0%) | 0 (0.0%) |
| Finance & Insurance | 0 (0.0%) | 0 (0.0%) |
| Real Estate, Rental & Leasing | 0 (0.0%) | 0 (0.0%) |
| Professional & Scientific | 0 (0.0%) | 0 (0.0%) |
| Enterprise Management | 0 (0.0%) | 0 (0.0%) |
| Administrative & Support | 0 (0.0%) | 0 (0.0%) |
| Educational Services | 0 (0.0%) | 0 (0.0%) |
| Health Care & Social Assistance | 18 (50.0%) | 18 (50.0%) |
| Arts, Entertainment & Recreation | 0 (0.0%) | 0 (0.0%) |
| Accommodation & Food Services | 0 (0.0%) | 6 (100.0%) |
| Public Administration | 0 (0.0%) | 2 (100.0%) |
| Total | 37 (52.9%) | 33 (47.1%) |
Education in Alberta
School Enrollment in Alberta
The most common levels of schooling among the 15 students in Alberta are high school (10 | 66.7%), middle school (3 | 20.0%), and kindergarten (2 | 13.3%).
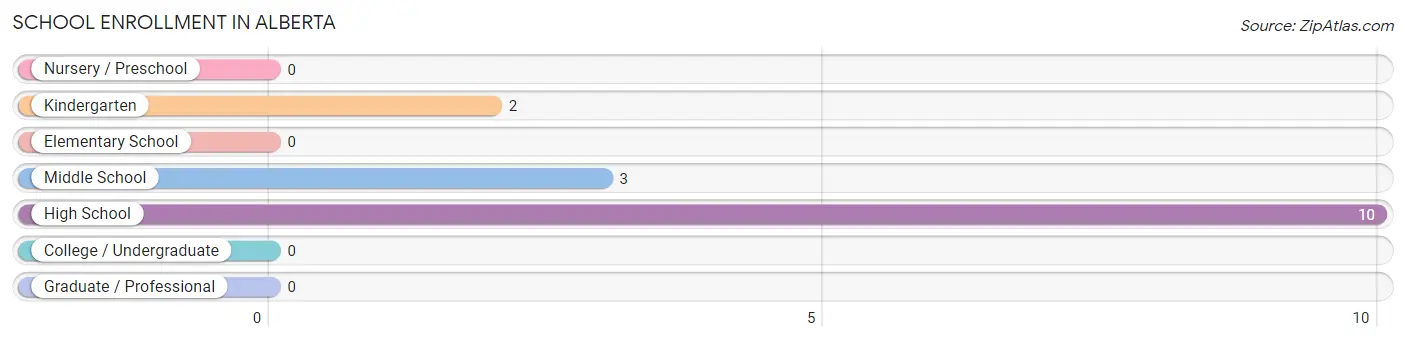
| School Level | # Students | % Students |
| Nursery / Preschool | 0 | 0.0% |
| Kindergarten | 2 | 13.3% |
| Elementary School | 0 | 0.0% |
| Middle School | 3 | 20.0% |
| High School | 10 | 66.7% |
| College / Undergraduate | 0 | 0.0% |
| Graduate / Professional | 0 | 0.0% |
| Total | 15 | 100.0% |
School Enrollment by Age by Funding Source in Alberta
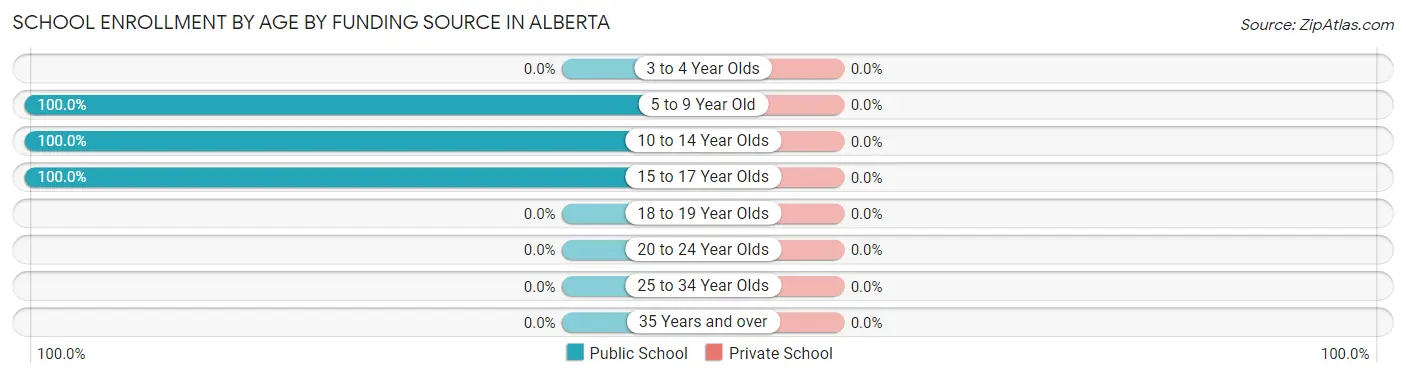
| Age Bracket | Public School | Private School |
| 3 to 4 Year Olds | 0 (0.0%) | 0 (0.0%) |
| 5 to 9 Year Old | 2 (100.0%) | 0 (0.0%) |
| 10 to 14 Year Olds | 2 (100.0%) | 0 (0.0%) |
| 15 to 17 Year Olds | 11 (100.0%) | 0 (0.0%) |
| 18 to 19 Year Olds | 0 (0.0%) | 0 (0.0%) |
| 20 to 24 Year Olds | 0 (0.0%) | 0 (0.0%) |
| 25 to 34 Year Olds | 0 (0.0%) | 0 (0.0%) |
| 35 Years and over | 0 (0.0%) | 0 (0.0%) |
| Total | 15 (100.0%) | 0 (0.0%) |
Educational Attainment by Field of Study in Alberta
Education (5 | 71.4%), visual & performing arts (1 | 14.3%), and communications (1 | 14.3%) are the most common fields of study among 7 individuals in Alberta who have obtained a bachelor's degree or higher.
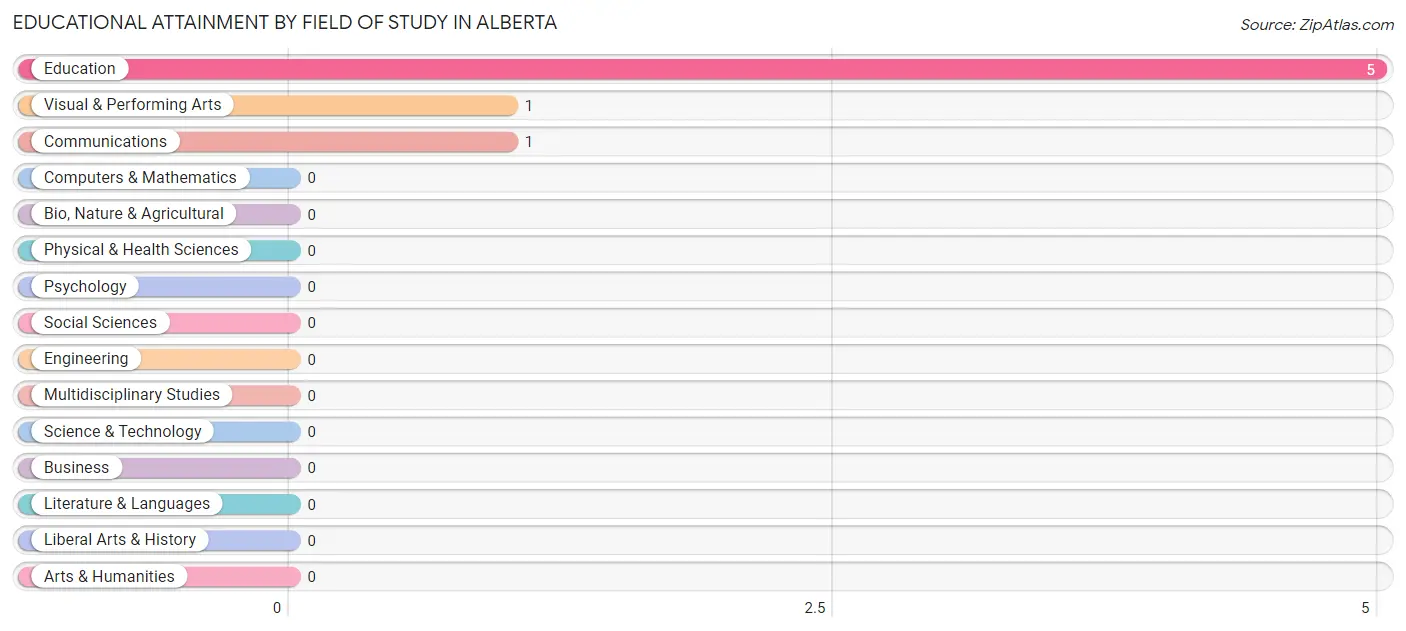
| Field of Study | # Graduates | % Graduates |
| Computers & Mathematics | 0 | 0.0% |
| Bio, Nature & Agricultural | 0 | 0.0% |
| Physical & Health Sciences | 0 | 0.0% |
| Psychology | 0 | 0.0% |
| Social Sciences | 0 | 0.0% |
| Engineering | 0 | 0.0% |
| Multidisciplinary Studies | 0 | 0.0% |
| Science & Technology | 0 | 0.0% |
| Business | 0 | 0.0% |
| Education | 5 | 71.4% |
| Literature & Languages | 0 | 0.0% |
| Liberal Arts & History | 0 | 0.0% |
| Visual & Performing Arts | 1 | 14.3% |
| Communications | 1 | 14.3% |
| Arts & Humanities | 0 | 0.0% |
| Total | 7 | 100.0% |
Transportation & Commute in Alberta
Vehicle Availability by Sex in Alberta
The most prevalent vehicle ownership categories in Alberta are males with 2 vehicles (26, accounting for 70.3%) and females with 2 vehicles (19, making up 78.8%).
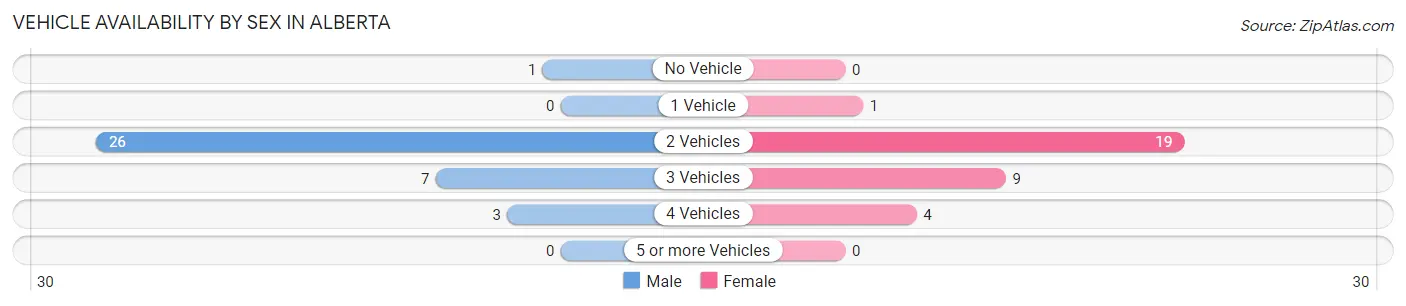
| Vehicles Available | Male | Female |
| No Vehicle | 1 (2.7%) | 0 (0.0%) |
| 1 Vehicle | 0 (0.0%) | 1 (3.0%) |
| 2 Vehicles | 26 (70.3%) | 19 (57.6%) |
| 3 Vehicles | 7 (18.9%) | 9 (27.3%) |
| 4 Vehicles | 3 (8.1%) | 4 (12.1%) |
| 5 or more Vehicles | 0 (0.0%) | 0 (0.0%) |
| Total | 37 (100.0%) | 33 (100.0%) |
Commute Time in Alberta
The most frequently occuring commute durations in Alberta are 10 to 14 minutes (33 commuters, 50.0%), 15 to 19 minutes (17 commuters, 25.8%), and 20 to 24 minutes (10 commuters, 15.1%).
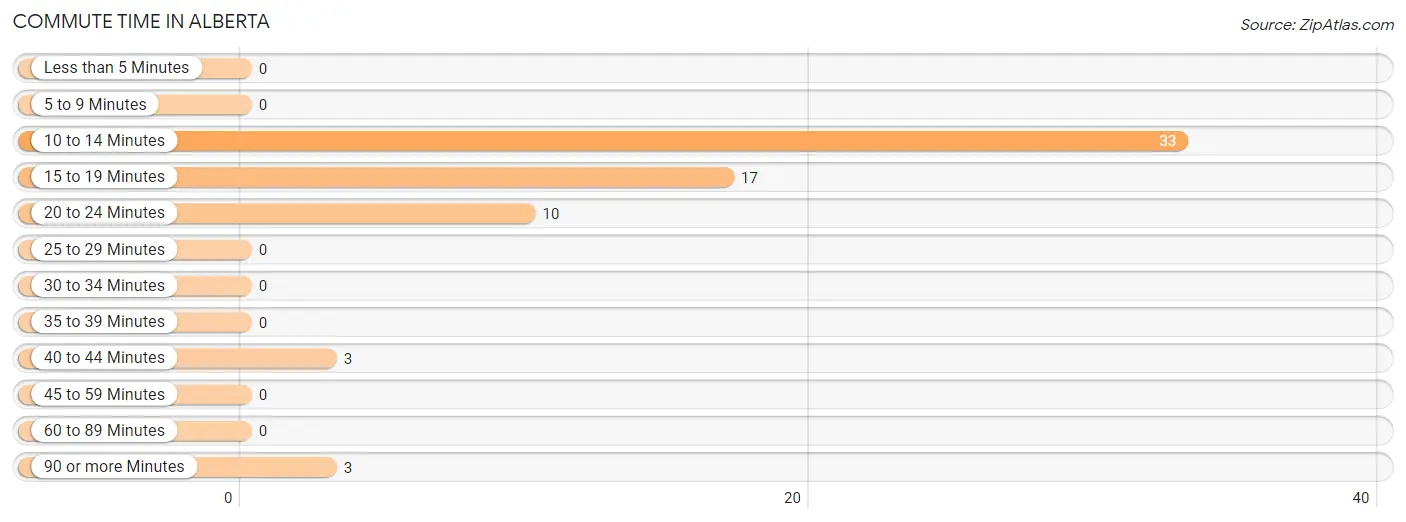
| Commute Time | # Commuters | % Commuters |
| Less than 5 Minutes | 0 | 0.0% |
| 5 to 9 Minutes | 0 | 0.0% |
| 10 to 14 Minutes | 33 | 50.0% |
| 15 to 19 Minutes | 17 | 25.8% |
| 20 to 24 Minutes | 10 | 15.1% |
| 25 to 29 Minutes | 0 | 0.0% |
| 30 to 34 Minutes | 0 | 0.0% |
| 35 to 39 Minutes | 0 | 0.0% |
| 40 to 44 Minutes | 3 | 4.5% |
| 45 to 59 Minutes | 0 | 0.0% |
| 60 to 89 Minutes | 0 | 0.0% |
| 90 or more Minutes | 3 | 4.5% |
Commute Time by Sex in Alberta
The most common commute times in Alberta are 10 to 14 minutes (23 commuters, 63.9%) for males and 15 to 19 minutes (12 commuters, 40.0%) for females.
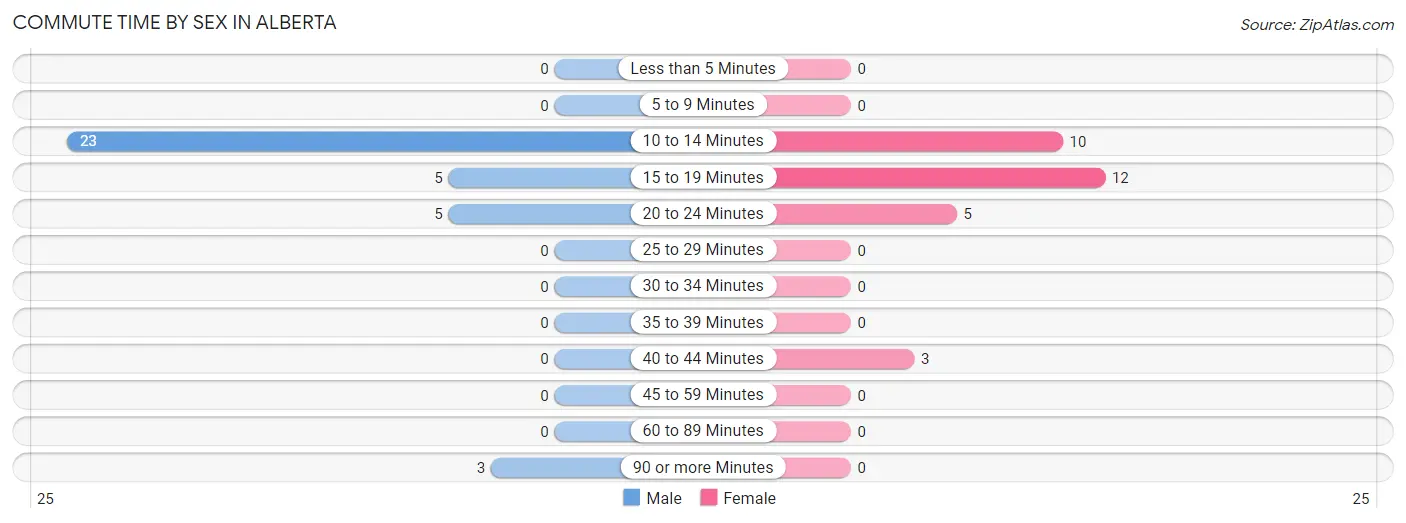
| Commute Time | Male | Female |
| Less than 5 Minutes | 0 (0.0%) | 0 (0.0%) |
| 5 to 9 Minutes | 0 (0.0%) | 0 (0.0%) |
| 10 to 14 Minutes | 23 (63.9%) | 10 (33.3%) |
| 15 to 19 Minutes | 5 (13.9%) | 12 (40.0%) |
| 20 to 24 Minutes | 5 (13.9%) | 5 (16.7%) |
| 25 to 29 Minutes | 0 (0.0%) | 0 (0.0%) |
| 30 to 34 Minutes | 0 (0.0%) | 0 (0.0%) |
| 35 to 39 Minutes | 0 (0.0%) | 0 (0.0%) |
| 40 to 44 Minutes | 0 (0.0%) | 3 (10.0%) |
| 45 to 59 Minutes | 0 (0.0%) | 0 (0.0%) |
| 60 to 89 Minutes | 0 (0.0%) | 0 (0.0%) |
| 90 or more Minutes | 3 (8.3%) | 0 (0.0%) |
Time of Departure to Work by Sex in Alberta
The most frequent times of departure to work in Alberta are 7:00 AM to 7:29 AM (19, 52.8%) for males and 7:00 AM to 7:29 AM (14, 46.7%) for females.
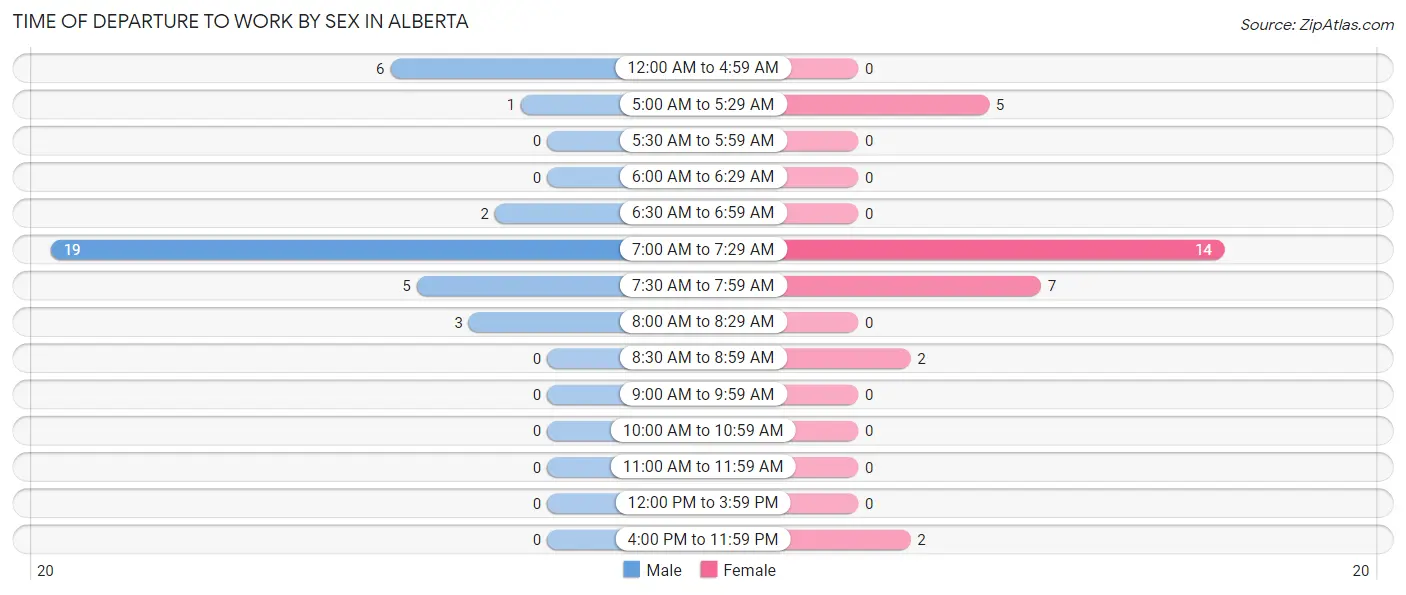
| Time of Departure | Male | Female |
| 12:00 AM to 4:59 AM | 6 (16.7%) | 0 (0.0%) |
| 5:00 AM to 5:29 AM | 1 (2.8%) | 5 (16.7%) |
| 5:30 AM to 5:59 AM | 0 (0.0%) | 0 (0.0%) |
| 6:00 AM to 6:29 AM | 0 (0.0%) | 0 (0.0%) |
| 6:30 AM to 6:59 AM | 2 (5.6%) | 0 (0.0%) |
| 7:00 AM to 7:29 AM | 19 (52.8%) | 14 (46.7%) |
| 7:30 AM to 7:59 AM | 5 (13.9%) | 7 (23.3%) |
| 8:00 AM to 8:29 AM | 3 (8.3%) | 0 (0.0%) |
| 8:30 AM to 8:59 AM | 0 (0.0%) | 2 (6.7%) |
| 9:00 AM to 9:59 AM | 0 (0.0%) | 0 (0.0%) |
| 10:00 AM to 10:59 AM | 0 (0.0%) | 0 (0.0%) |
| 11:00 AM to 11:59 AM | 0 (0.0%) | 0 (0.0%) |
| 12:00 PM to 3:59 PM | 0 (0.0%) | 0 (0.0%) |
| 4:00 PM to 11:59 PM | 0 (0.0%) | 2 (6.7%) |
| Total | 36 (100.0%) | 30 (100.0%) |
Housing Occupancy in Alberta
Occupancy by Ownership in Alberta
Of the total 41 dwellings in Alberta, owner-occupied units account for 39 (95.1%), while renter-occupied units make up 2 (4.9%).
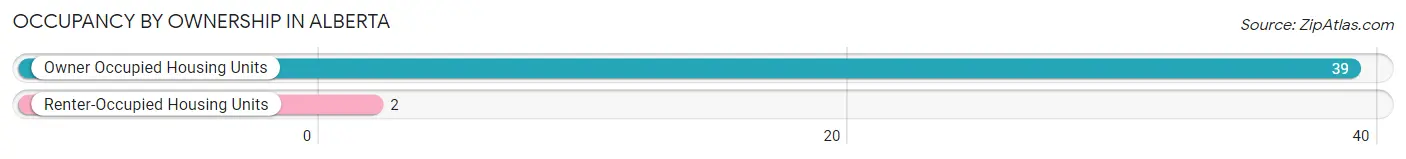
| Occupancy | # Housing Units | % Housing Units |
| Owner Occupied Housing Units | 39 | 95.1% |
| Renter-Occupied Housing Units | 2 | 4.9% |
| Total Occupied Housing Units | 41 | 100.0% |
Occupancy by Household Size in Alberta
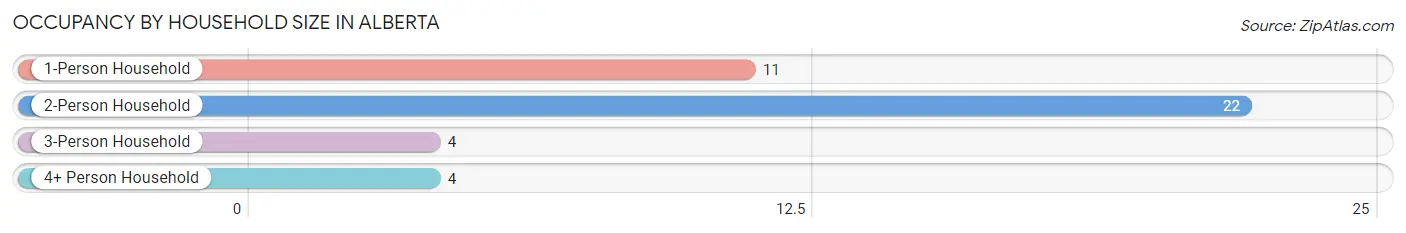
| Household Size | # Housing Units | % Housing Units |
| 1-Person Household | 11 | 26.8% |
| 2-Person Household | 22 | 53.7% |
| 3-Person Household | 4 | 9.8% |
| 4+ Person Household | 4 | 9.8% |
| Total Housing Units | 41 | 100.0% |
Occupancy by Ownership by Household Size in Alberta
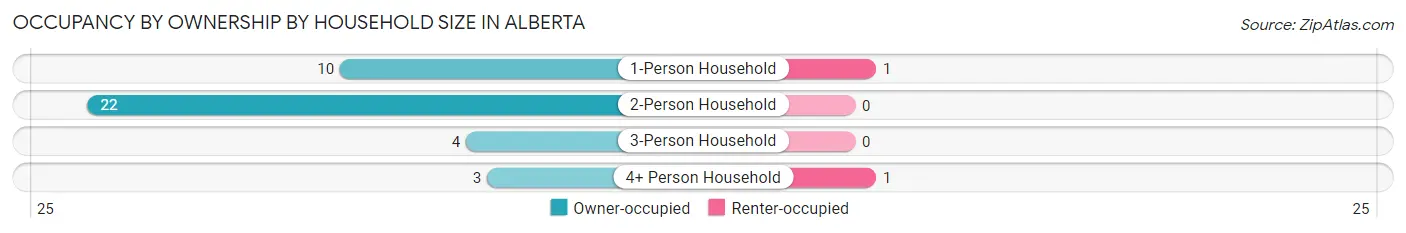
| Household Size | Owner-occupied | Renter-occupied |
| 1-Person Household | 10 (90.9%) | 1 (9.1%) |
| 2-Person Household | 22 (100.0%) | 0 (0.0%) |
| 3-Person Household | 4 (100.0%) | 0 (0.0%) |
| 4+ Person Household | 3 (75.0%) | 1 (25.0%) |
| Total Housing Units | 39 (95.1%) | 2 (4.9%) |
Occupancy by Educational Attainment in Alberta
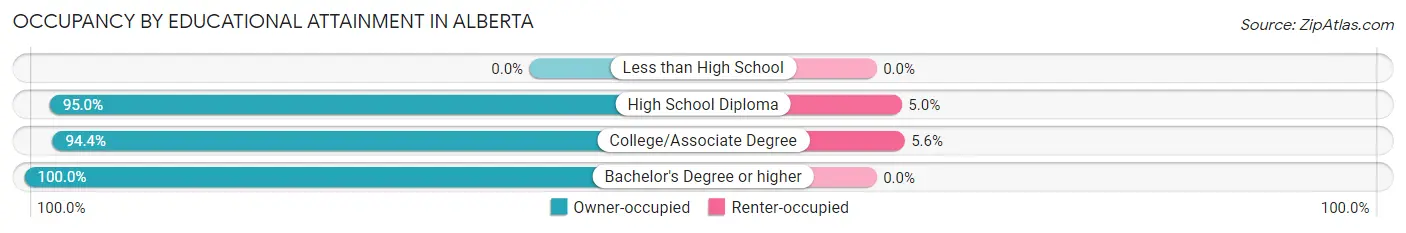
| Household Size | Owner-occupied | Renter-occupied |
| Less than High School | 0 (0.0%) | 0 (0.0%) |
| High School Diploma | 19 (95.0%) | 1 (5.0%) |
| College/Associate Degree | 17 (94.4%) | 1 (5.6%) |
| Bachelor's Degree or higher | 3 (100.0%) | 0 (0.0%) |
Occupancy by Age of Householder in Alberta
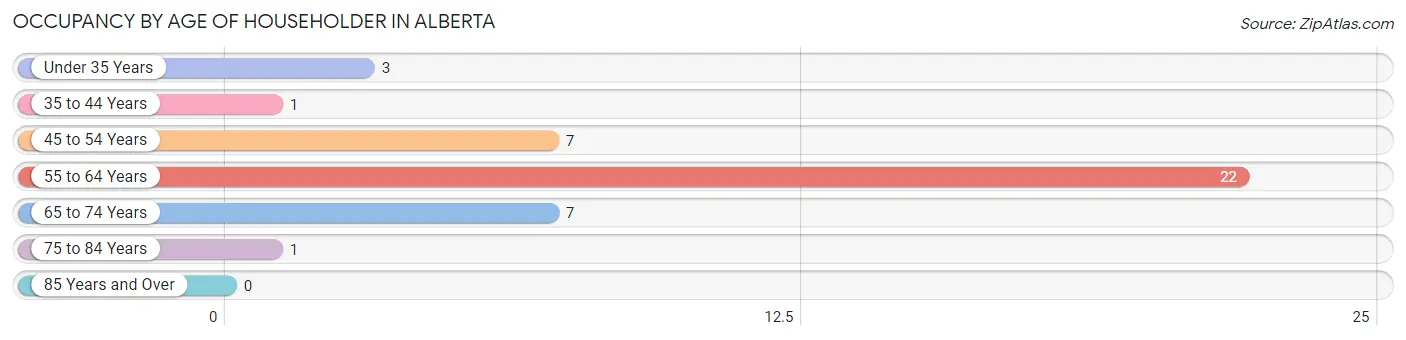
| Age Bracket | # Households | % Households |
| Under 35 Years | 3 | 7.3% |
| 35 to 44 Years | 1 | 2.4% |
| 45 to 54 Years | 7 | 17.1% |
| 55 to 64 Years | 22 | 53.7% |
| 65 to 74 Years | 7 | 17.1% |
| 75 to 84 Years | 1 | 2.4% |
| 85 Years and Over | 0 | 0.0% |
| Total | 41 | 100.0% |
Housing Finances in Alberta
Median Income by Occupancy in Alberta
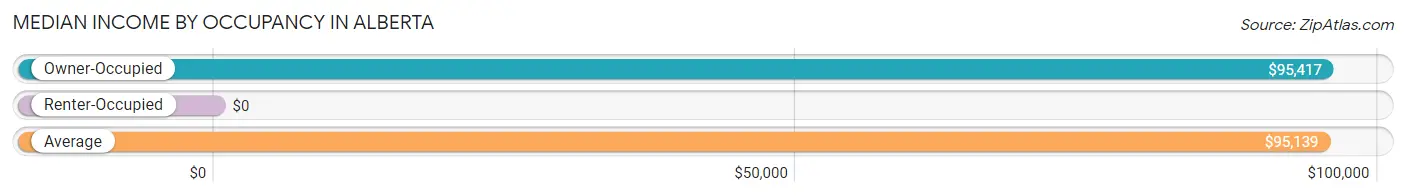
| Occupancy Type | # Households | Median Income |
| Owner-Occupied | 39 (95.1%) | $95,417 |
| Renter-Occupied | 2 (4.9%) | $0 |
| Average | 41 (100.0%) | $95,139 |
Occupancy by Householder Income Bracket in Alberta
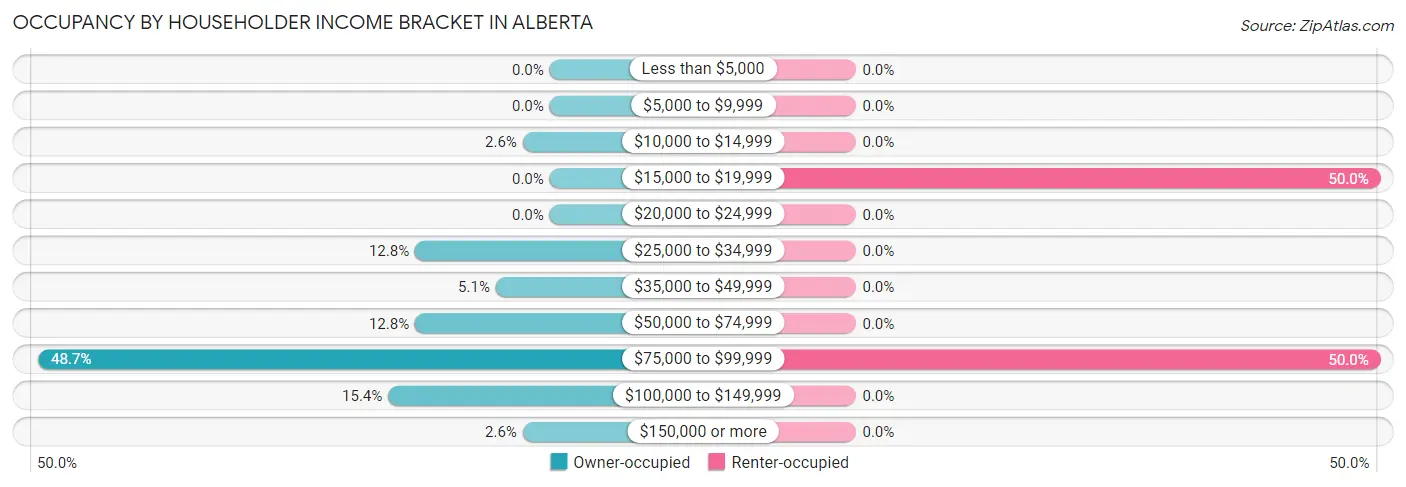
| Income Bracket | Owner-occupied | Renter-occupied |
| Less than $5,000 | 0 (0.0%) | 0 (0.0%) |
| $5,000 to $9,999 | 0 (0.0%) | 0 (0.0%) |
| $10,000 to $14,999 | 1 (2.6%) | 0 (0.0%) |
| $15,000 to $19,999 | 0 (0.0%) | 1 (50.0%) |
| $20,000 to $24,999 | 0 (0.0%) | 0 (0.0%) |
| $25,000 to $34,999 | 5 (12.8%) | 0 (0.0%) |
| $35,000 to $49,999 | 2 (5.1%) | 0 (0.0%) |
| $50,000 to $74,999 | 5 (12.8%) | 0 (0.0%) |
| $75,000 to $99,999 | 19 (48.7%) | 1 (50.0%) |
| $100,000 to $149,999 | 6 (15.4%) | 0 (0.0%) |
| $150,000 or more | 1 (2.6%) | 0 (0.0%) |
| Total | 39 (100.0%) | 2 (100.0%) |
Monthly Housing Cost Tiers in Alberta
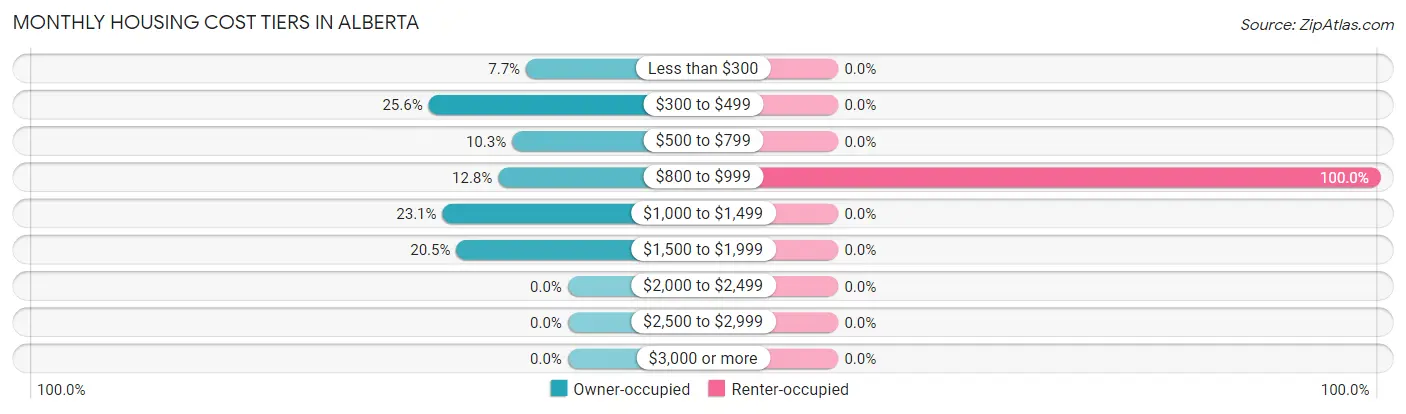
| Monthly Cost | Owner-occupied | Renter-occupied |
| Less than $300 | 3 (7.7%) | 0 (0.0%) |
| $300 to $499 | 10 (25.6%) | 0 (0.0%) |
| $500 to $799 | 4 (10.3%) | 0 (0.0%) |
| $800 to $999 | 5 (12.8%) | 2 (100.0%) |
| $1,000 to $1,499 | 9 (23.1%) | 0 (0.0%) |
| $1,500 to $1,999 | 8 (20.5%) | 0 (0.0%) |
| $2,000 to $2,499 | 0 (0.0%) | 0 (0.0%) |
| $2,500 to $2,999 | 0 (0.0%) | 0 (0.0%) |
| $3,000 or more | 0 (0.0%) | 0 (0.0%) |
| Total | 39 (100.0%) | 2 (100.0%) |
Physical Housing Characteristics in Alberta
Housing Structures in Alberta
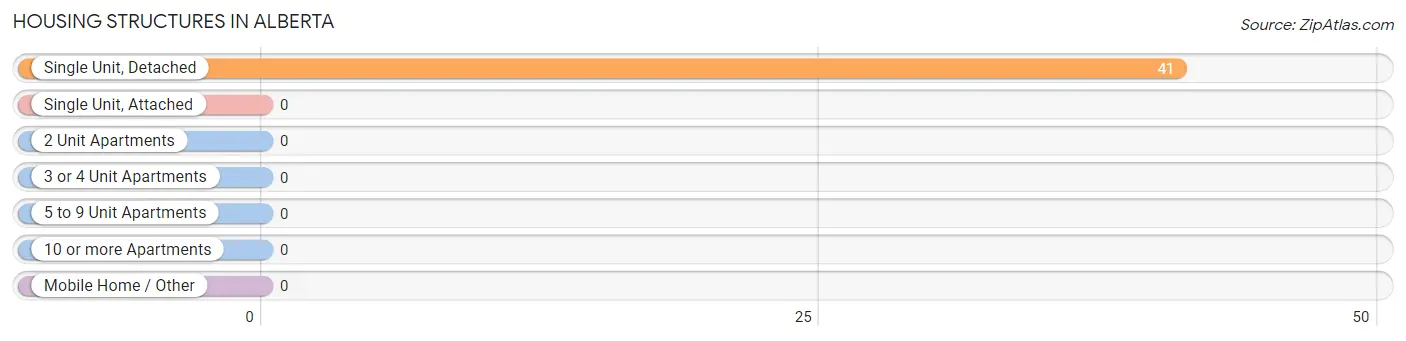
| Structure Type | # Housing Units | % Housing Units |
| Single Unit, Detached | 41 | 100.0% |
| Single Unit, Attached | 0 | 0.0% |
| 2 Unit Apartments | 0 | 0.0% |
| 3 or 4 Unit Apartments | 0 | 0.0% |
| 5 to 9 Unit Apartments | 0 | 0.0% |
| 10 or more Apartments | 0 | 0.0% |
| Mobile Home / Other | 0 | 0.0% |
| Total | 41 | 100.0% |
Housing Structures by Occupancy in Alberta
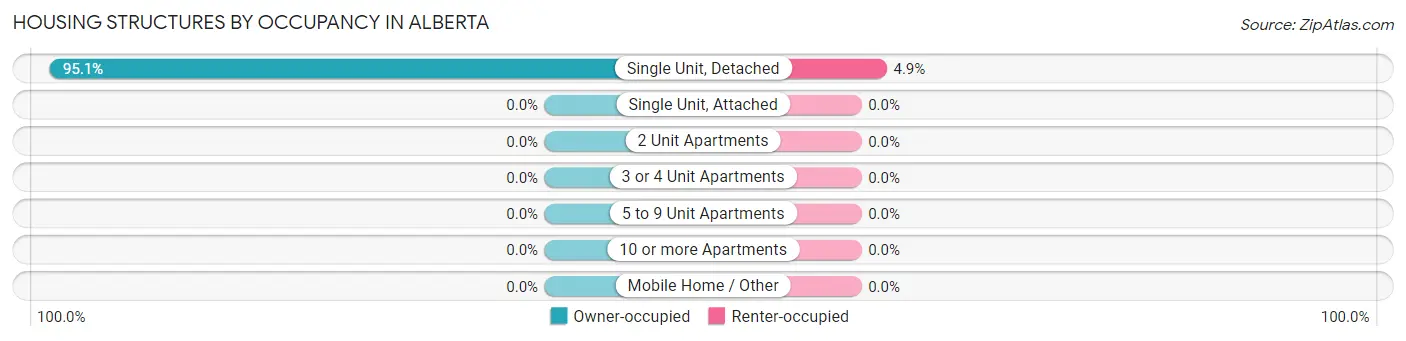
| Structure Type | Owner-occupied | Renter-occupied |
| Single Unit, Detached | 39 (95.1%) | 2 (4.9%) |
| Single Unit, Attached | 0 (0.0%) | 0 (0.0%) |
| 2 Unit Apartments | 0 (0.0%) | 0 (0.0%) |
| 3 or 4 Unit Apartments | 0 (0.0%) | 0 (0.0%) |
| 5 to 9 Unit Apartments | 0 (0.0%) | 0 (0.0%) |
| 10 or more Apartments | 0 (0.0%) | 0 (0.0%) |
| Mobile Home / Other | 0 (0.0%) | 0 (0.0%) |
| Total | 39 (95.1%) | 2 (4.9%) |
Housing Structures by Number of Rooms in Alberta
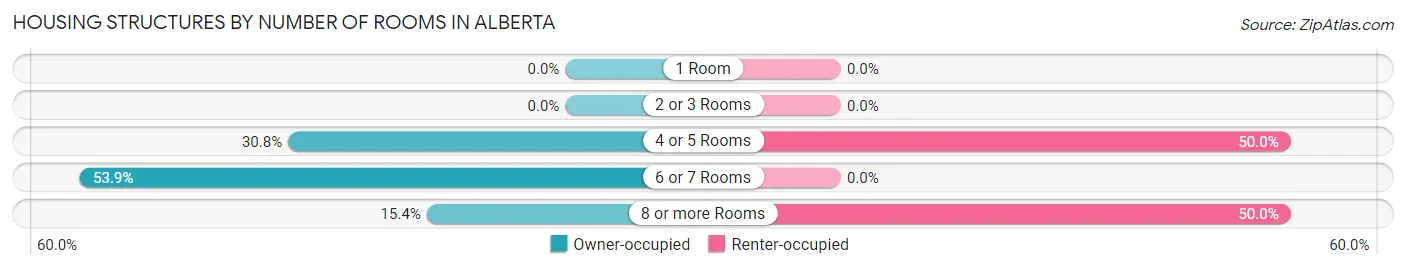
| Number of Rooms | Owner-occupied | Renter-occupied |
| 1 Room | 0 (0.0%) | 0 (0.0%) |
| 2 or 3 Rooms | 0 (0.0%) | 0 (0.0%) |
| 4 or 5 Rooms | 12 (30.8%) | 1 (50.0%) |
| 6 or 7 Rooms | 21 (53.8%) | 0 (0.0%) |
| 8 or more Rooms | 6 (15.4%) | 1 (50.0%) |
| Total | 39 (100.0%) | 2 (100.0%) |
Housing Structure by Heating Type in Alberta
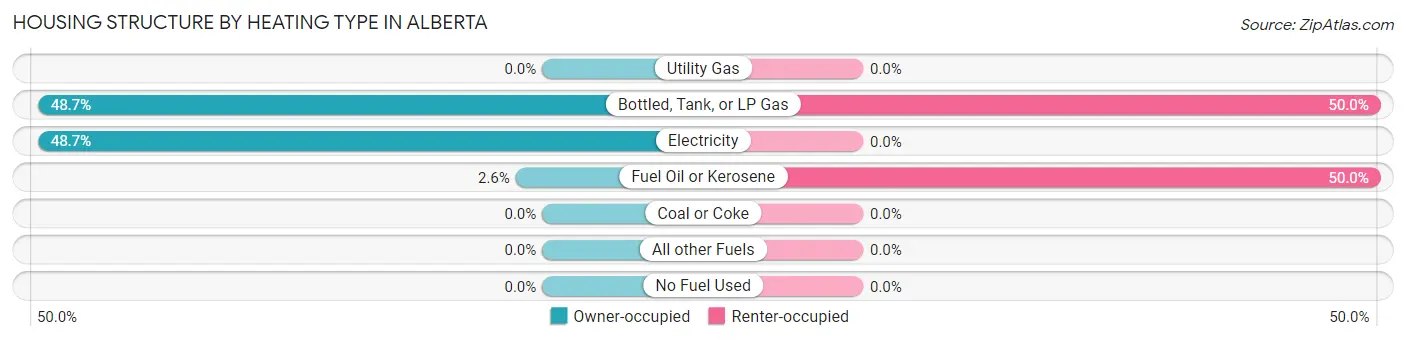
| Heating Type | Owner-occupied | Renter-occupied |
| Utility Gas | 0 (0.0%) | 0 (0.0%) |
| Bottled, Tank, or LP Gas | 19 (48.7%) | 1 (50.0%) |
| Electricity | 19 (48.7%) | 0 (0.0%) |
| Fuel Oil or Kerosene | 1 (2.6%) | 1 (50.0%) |
| Coal or Coke | 0 (0.0%) | 0 (0.0%) |
| All other Fuels | 0 (0.0%) | 0 (0.0%) |
| No Fuel Used | 0 (0.0%) | 0 (0.0%) |
| Total | 39 (100.0%) | 2 (100.0%) |
Household Vehicle Usage in Alberta
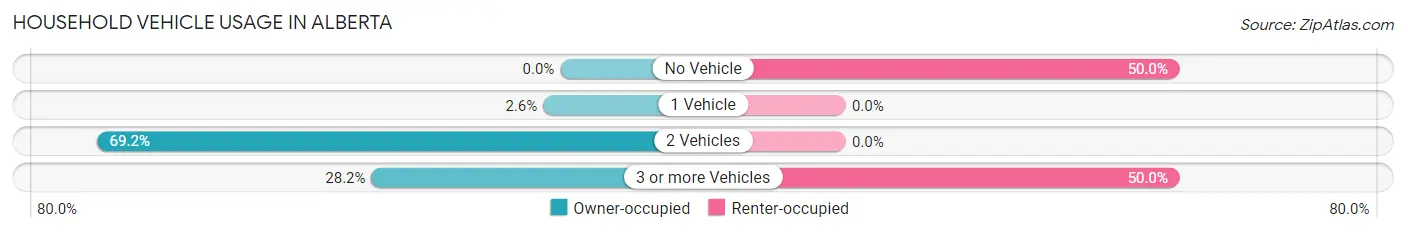
| Vehicles per Household | Owner-occupied | Renter-occupied |
| No Vehicle | 0 (0.0%) | 1 (50.0%) |
| 1 Vehicle | 1 (2.6%) | 0 (0.0%) |
| 2 Vehicles | 27 (69.2%) | 0 (0.0%) |
| 3 or more Vehicles | 11 (28.2%) | 1 (50.0%) |
| Total | 39 (100.0%) | 2 (100.0%) |
Real Estate & Mortgages in Alberta
Real Estate and Mortgage Overview in Alberta
| Characteristic | Without Mortgage | With Mortgage |
| Housing Units | 20 | 19 |
| Median Property Value | $53,000 | $0 |
| Median Household Income | $86,250 | $0 |
| Monthly Housing Costs | $470 | $0 |
| Real Estate Taxes | $700 | $0 |
Property Value by Mortgage Status in Alberta
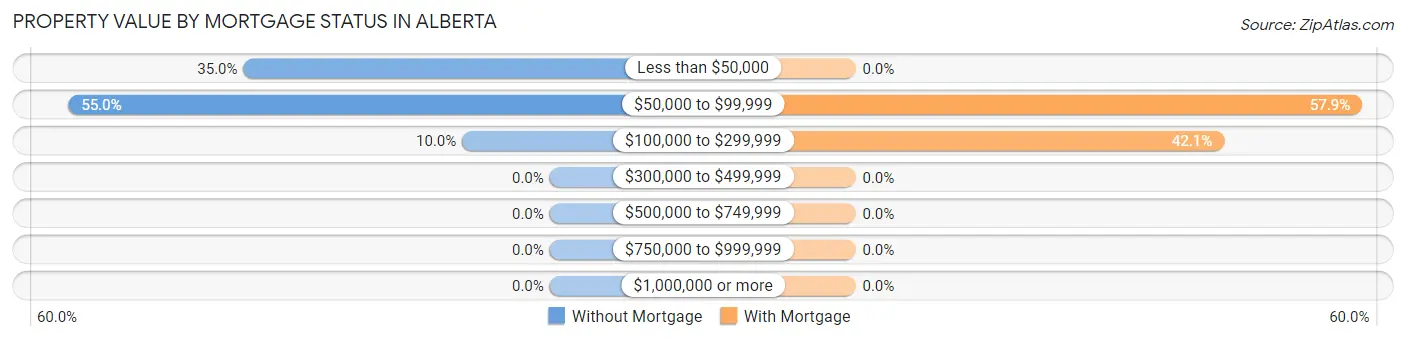
| Property Value | Without Mortgage | With Mortgage |
| Less than $50,000 | 7 (35.0%) | 0 (0.0%) |
| $50,000 to $99,999 | 11 (55.0%) | 11 (57.9%) |
| $100,000 to $299,999 | 2 (10.0%) | 8 (42.1%) |
| $300,000 to $499,999 | 0 (0.0%) | 0 (0.0%) |
| $500,000 to $749,999 | 0 (0.0%) | 0 (0.0%) |
| $750,000 to $999,999 | 0 (0.0%) | 0 (0.0%) |
| $1,000,000 or more | 0 (0.0%) | 0 (0.0%) |
| Total | 20 (100.0%) | 19 (100.0%) |
Household Income by Mortgage Status in Alberta
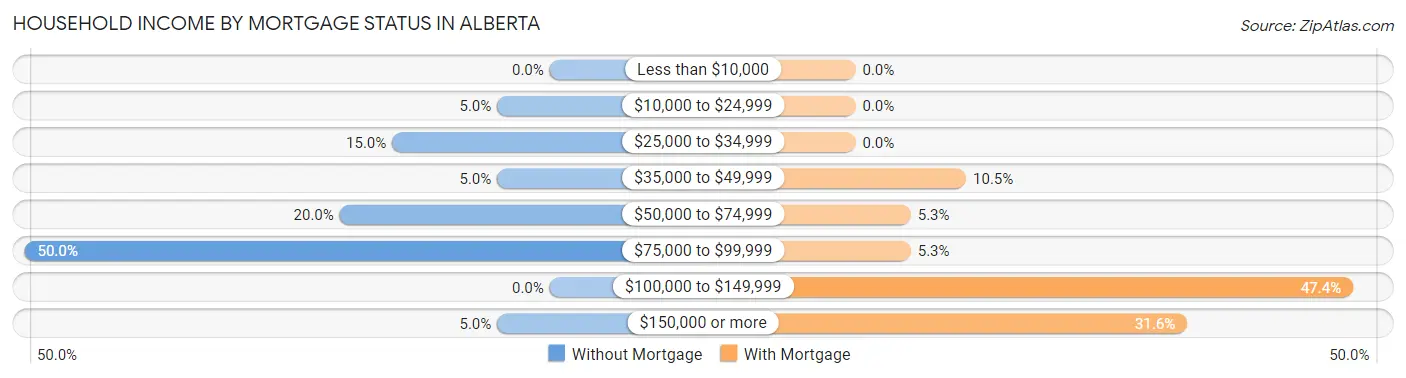
| Household Income | Without Mortgage | With Mortgage |
| Less than $10,000 | 0 (0.0%) | 0 (0.0%) |
| $10,000 to $24,999 | 1 (5.0%) | 0 (0.0%) |
| $25,000 to $34,999 | 3 (15.0%) | 0 (0.0%) |
| $35,000 to $49,999 | 1 (5.0%) | 2 (10.5%) |
| $50,000 to $74,999 | 4 (20.0%) | 1 (5.3%) |
| $75,000 to $99,999 | 10 (50.0%) | 1 (5.3%) |
| $100,000 to $149,999 | 0 (0.0%) | 9 (47.4%) |
| $150,000 or more | 1 (5.0%) | 6 (31.6%) |
| Total | 20 (100.0%) | 19 (100.0%) |
Property Value to Household Income Ratio in Alberta
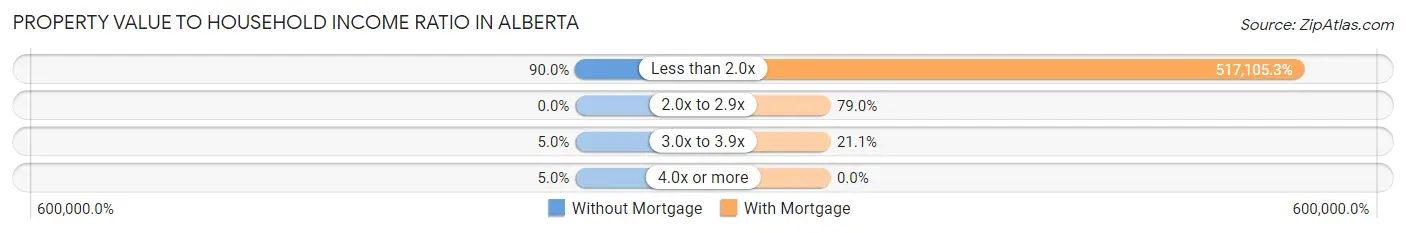
| Value-to-Income Ratio | Without Mortgage | With Mortgage |
| Less than 2.0x | 18 (90.0%) | 98,250 (517,105.3%) |
| 2.0x to 2.9x | 0 (0.0%) | 15 (78.9%) |
| 3.0x to 3.9x | 1 (5.0%) | 4 (21.0%) |
| 4.0x or more | 1 (5.0%) | 0 (0.0%) |
| Total | 20 (100.0%) | 19 (100.0%) |
Real Estate Taxes by Mortgage Status in Alberta
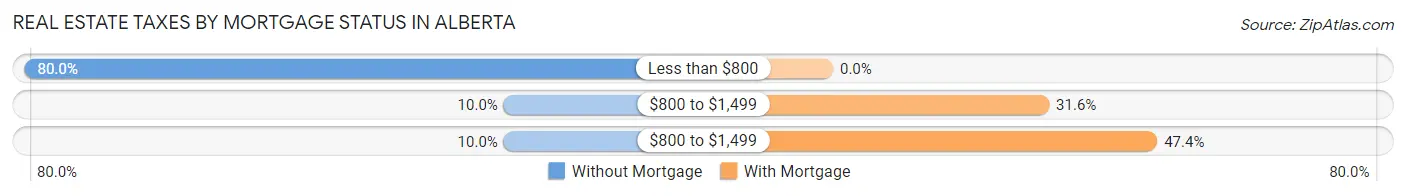
| Property Taxes | Without Mortgage | With Mortgage |
| Less than $800 | 16 (80.0%) | 0 (0.0%) |
| $800 to $1,499 | 2 (10.0%) | 6 (31.6%) |
| $800 to $1,499 | 2 (10.0%) | 9 (47.4%) |
| Total | 20 (100.0%) | 19 (100.0%) |
Health & Disability in Alberta
Health Insurance Coverage by Age in Alberta
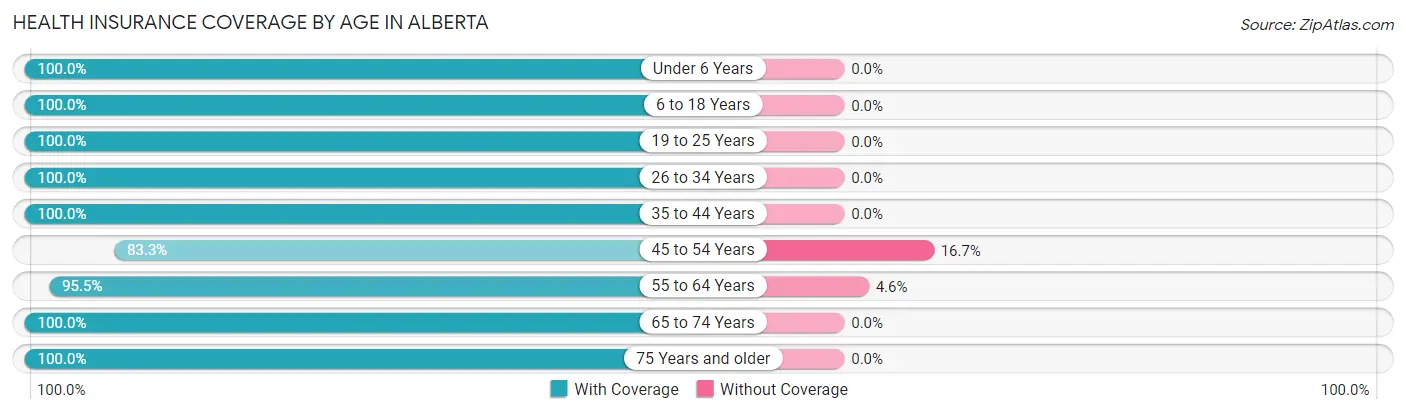
| Age Bracket | With Coverage | Without Coverage |
| Under 6 Years | 6 (100.0%) | 0 (0.0%) |
| 6 to 18 Years | 13 (100.0%) | 0 (0.0%) |
| 19 to 25 Years | 1 (100.0%) | 0 (0.0%) |
| 26 to 34 Years | 5 (100.0%) | 0 (0.0%) |
| 35 to 44 Years | 4 (100.0%) | 0 (0.0%) |
| 45 to 54 Years | 15 (83.3%) | 3 (16.7%) |
| 55 to 64 Years | 21 (95.5%) | 1 (4.5%) |
| 65 to 74 Years | 28 (100.0%) | 0 (0.0%) |
| 75 Years and older | 4 (100.0%) | 0 (0.0%) |
| Total | 97 (96.0%) | 4 (4.0%) |
Health Insurance Coverage by Citizenship Status in Alberta
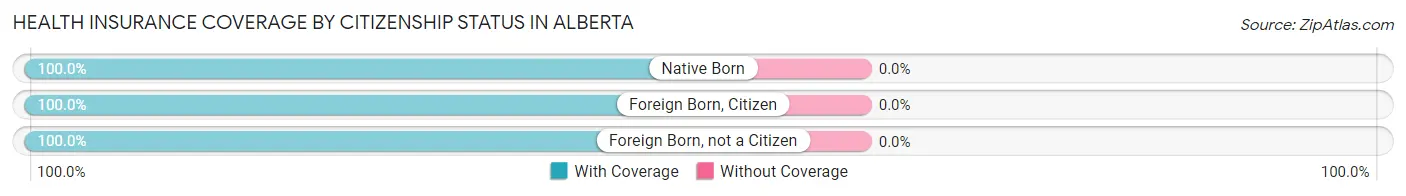
| Citizenship Status | With Coverage | Without Coverage |
| Native Born | 6 (100.0%) | 0 (0.0%) |
| Foreign Born, Citizen | 13 (100.0%) | 0 (0.0%) |
| Foreign Born, not a Citizen | 1 (100.0%) | 0 (0.0%) |
Health Insurance Coverage by Household Income in Alberta
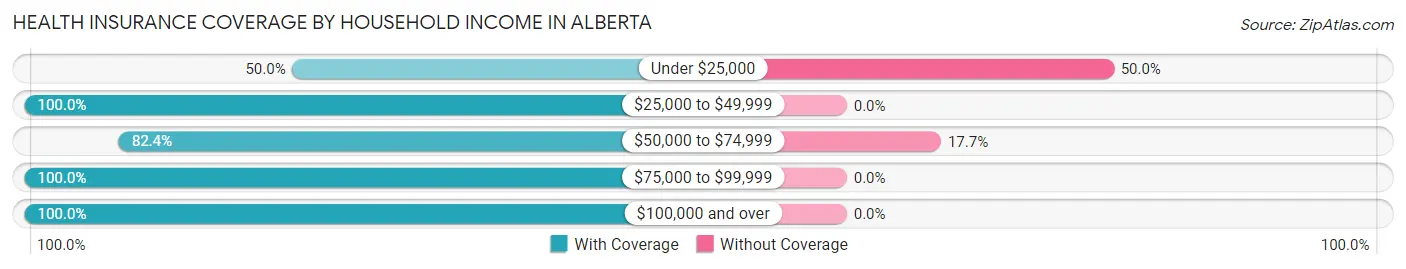
| Household Income | With Coverage | Without Coverage |
| Under $25,000 | 1 (50.0%) | 1 (50.0%) |
| $25,000 to $49,999 | 12 (100.0%) | 0 (0.0%) |
| $50,000 to $74,999 | 14 (82.4%) | 3 (17.6%) |
| $75,000 to $99,999 | 54 (100.0%) | 0 (0.0%) |
| $100,000 and over | 16 (100.0%) | 0 (0.0%) |
Public vs Private Health Insurance Coverage by Age in Alberta
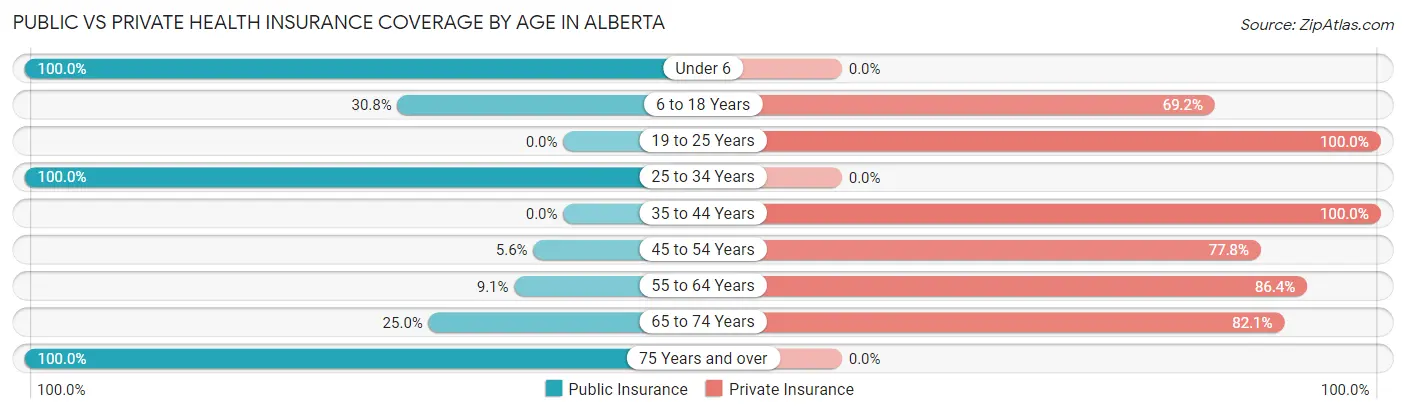
| Age Bracket | Public Insurance | Private Insurance |
| Under 6 | 6 (100.0%) | 0 (0.0%) |
| 6 to 18 Years | 4 (30.8%) | 9 (69.2%) |
| 19 to 25 Years | 0 (0.0%) | 1 (100.0%) |
| 25 to 34 Years | 5 (100.0%) | 0 (0.0%) |
| 35 to 44 Years | 0 (0.0%) | 4 (100.0%) |
| 45 to 54 Years | 1 (5.6%) | 14 (77.8%) |
| 55 to 64 Years | 2 (9.1%) | 19 (86.4%) |
| 65 to 74 Years | 7 (25.0%) | 23 (82.1%) |
| 75 Years and over | 4 (100.0%) | 0 (0.0%) |
| Total | 29 (28.7%) | 70 (69.3%) |
Disability Status by Sex by Age in Alberta
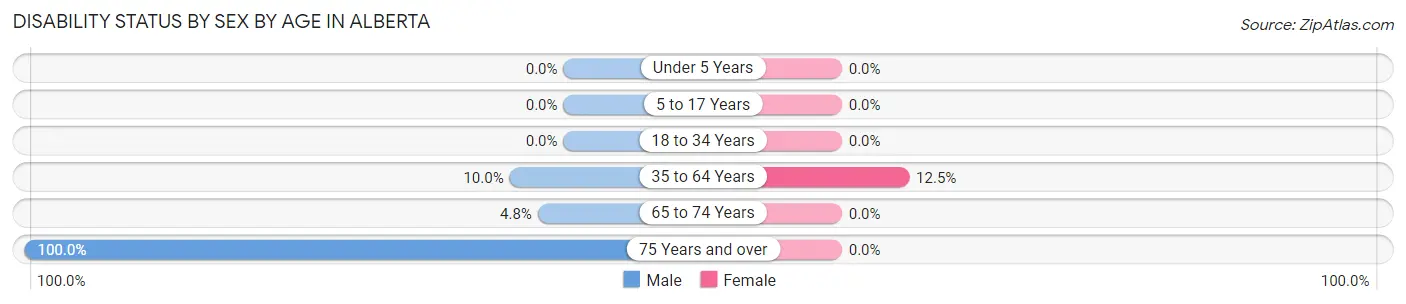
| Age Bracket | Male | Female |
| Under 5 Years | 0 (0.0%) | 0 (0.0%) |
| 5 to 17 Years | 0 (0.0%) | 0 (0.0%) |
| 18 to 34 Years | 0 (0.0%) | 0 (0.0%) |
| 35 to 64 Years | 2 (10.0%) | 3 (12.5%) |
| 65 to 74 Years | 1 (4.8%) | 0 (0.0%) |
| 75 Years and over | 3 (100.0%) | 0 (0.0%) |
Disability Class by Sex by Age in Alberta
Disability Class: Hearing Difficulty
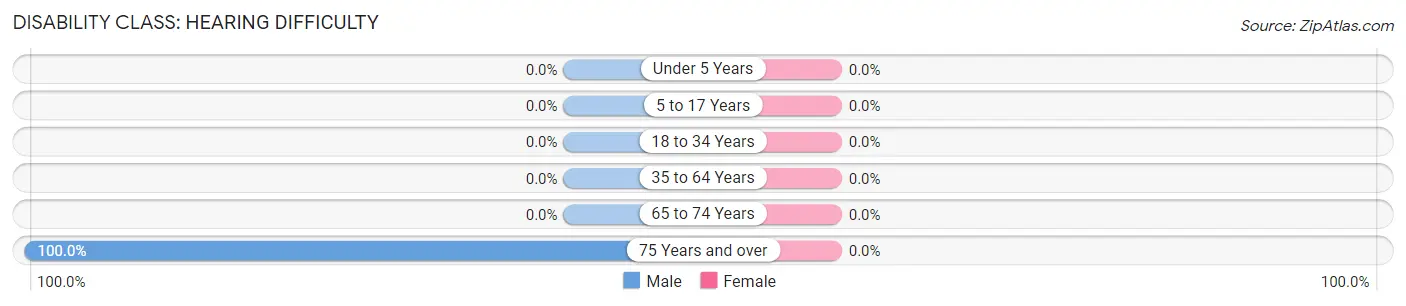
| Age Bracket | Male | Female |
| Under 5 Years | 0 (0.0%) | 0 (0.0%) |
| 5 to 17 Years | 0 (0.0%) | 0 (0.0%) |
| 18 to 34 Years | 0 (0.0%) | 0 (0.0%) |
| 35 to 64 Years | 0 (0.0%) | 0 (0.0%) |
| 65 to 74 Years | 0 (0.0%) | 0 (0.0%) |
| 75 Years and over | 3 (100.0%) | 0 (0.0%) |
Disability Class: Vision Difficulty
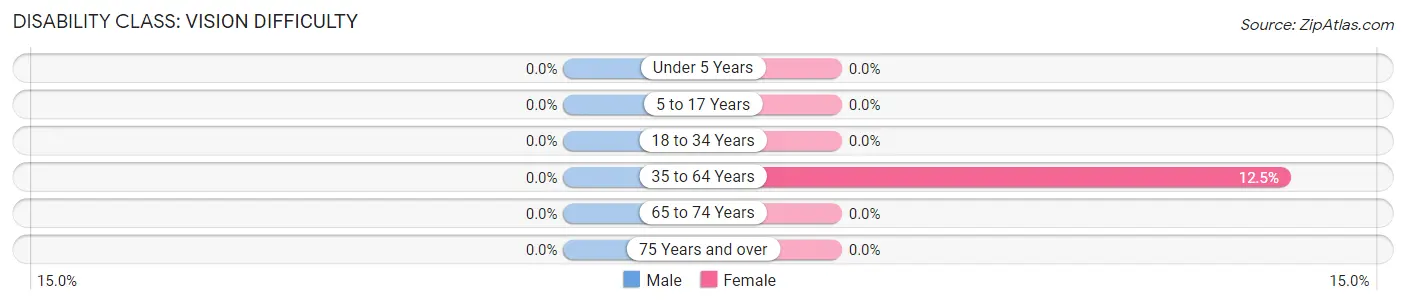
| Age Bracket | Male | Female |
| Under 5 Years | 0 (0.0%) | 0 (0.0%) |
| 5 to 17 Years | 0 (0.0%) | 0 (0.0%) |
| 18 to 34 Years | 0 (0.0%) | 0 (0.0%) |
| 35 to 64 Years | 0 (0.0%) | 3 (12.5%) |
| 65 to 74 Years | 0 (0.0%) | 0 (0.0%) |
| 75 Years and over | 0 (0.0%) | 0 (0.0%) |
Disability Class: Cognitive Difficulty
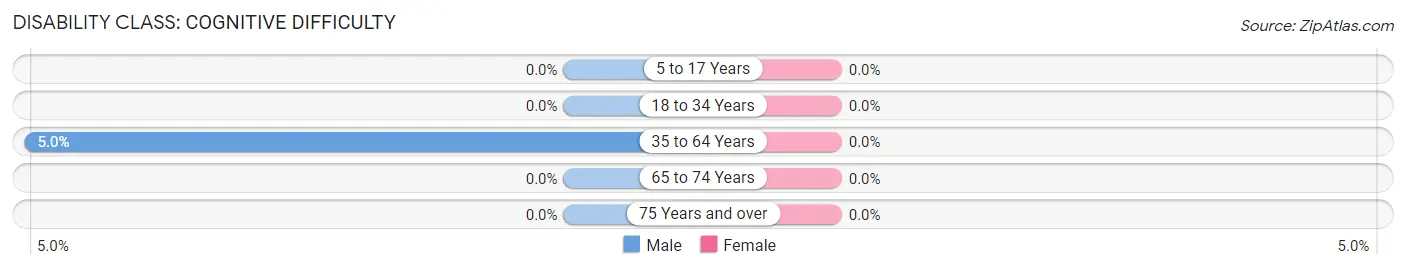
| Age Bracket | Male | Female |
| 5 to 17 Years | 0 (0.0%) | 0 (0.0%) |
| 18 to 34 Years | 0 (0.0%) | 0 (0.0%) |
| 35 to 64 Years | 1 (5.0%) | 0 (0.0%) |
| 65 to 74 Years | 0 (0.0%) | 0 (0.0%) |
| 75 Years and over | 0 (0.0%) | 0 (0.0%) |
Disability Class: Ambulatory Difficulty
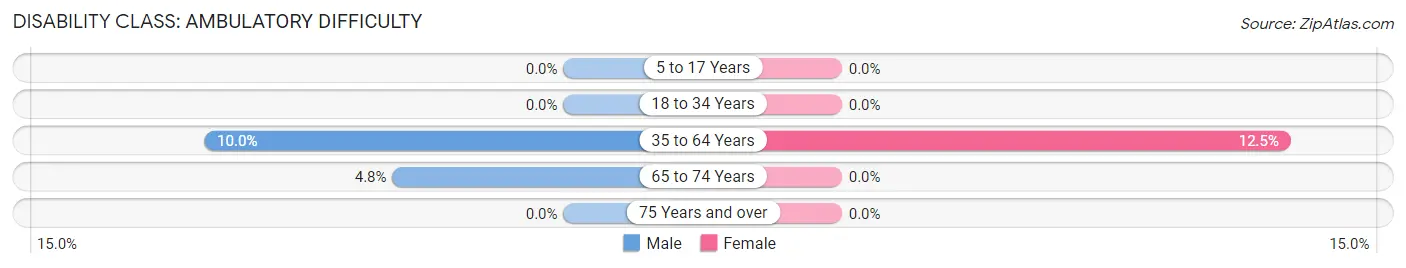
| Age Bracket | Male | Female |
| 5 to 17 Years | 0 (0.0%) | 0 (0.0%) |
| 18 to 34 Years | 0 (0.0%) | 0 (0.0%) |
| 35 to 64 Years | 2 (10.0%) | 3 (12.5%) |
| 65 to 74 Years | 1 (4.8%) | 0 (0.0%) |
| 75 Years and over | 0 (0.0%) | 0 (0.0%) |
Disability Class: Self-Care Difficulty
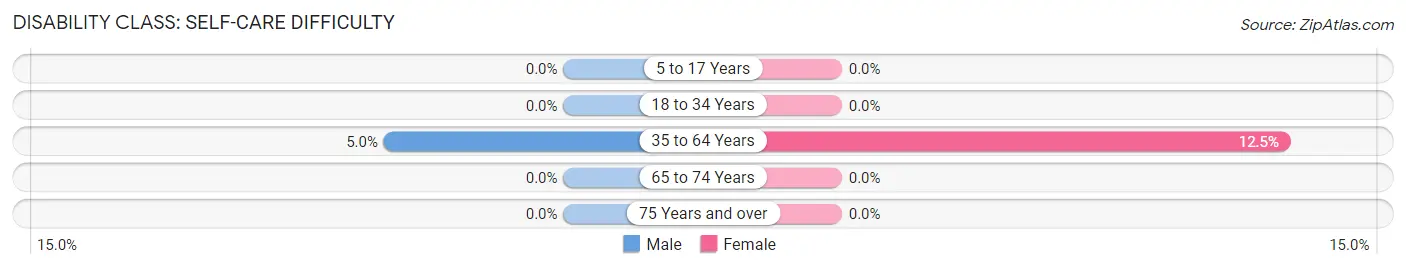
| Age Bracket | Male | Female |
| 5 to 17 Years | 0 (0.0%) | 0 (0.0%) |
| 18 to 34 Years | 0 (0.0%) | 0 (0.0%) |
| 35 to 64 Years | 1 (5.0%) | 3 (12.5%) |
| 65 to 74 Years | 0 (0.0%) | 0 (0.0%) |
| 75 Years and over | 0 (0.0%) | 0 (0.0%) |
Technology Access in Alberta
Computing Device Access in Alberta
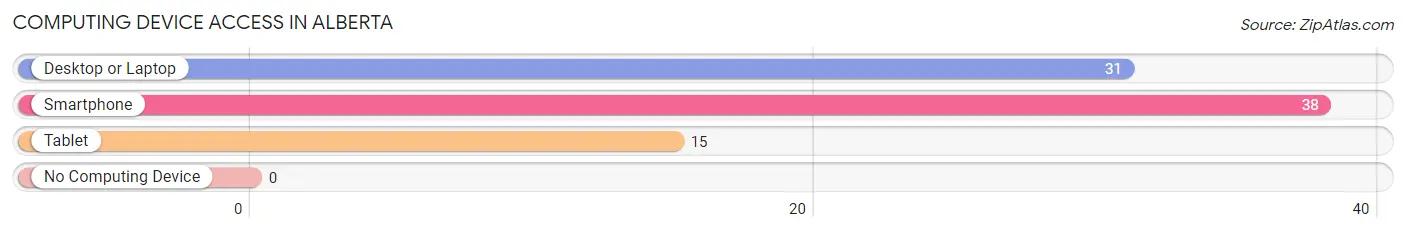
| Device Type | # Households | % Households |
| Desktop or Laptop | 31 | 75.6% |
| Smartphone | 38 | 92.7% |
| Tablet | 15 | 36.6% |
| No Computing Device | 0 | 0.0% |
| Total | 41 | 100.0% |
Internet Access in Alberta
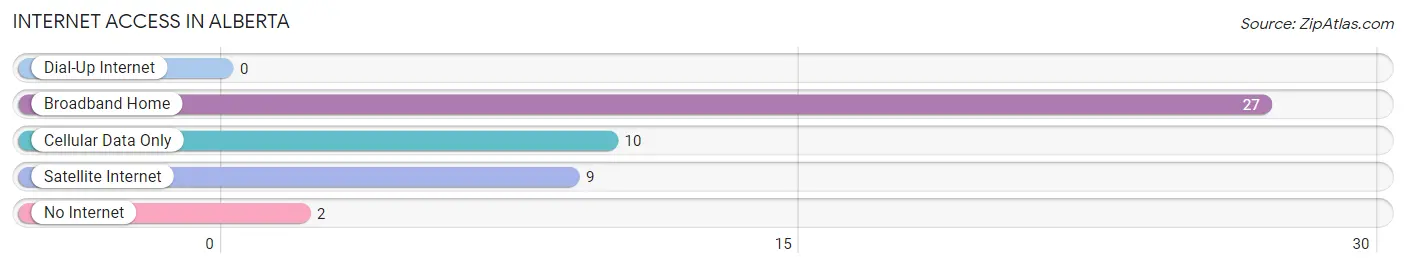
| Internet Type | # Households | % Households |
| Dial-Up Internet | 0 | 0.0% |
| Broadband Home | 27 | 65.8% |
| Cellular Data Only | 10 | 24.4% |
| Satellite Internet | 9 | 22.0% |
| No Internet | 2 | 4.9% |
| Total | 41 | 100.0% |
Alberta Summary
Alberta is a small city located in the state of Minnesota, United States. It is situated in the southeastern corner of the state, near the border with Wisconsin. The city has a population of approximately 1,500 people and is part of the Twin Cities metropolitan area.
Geography
Alberta is located in southeastern Minnesota, near the border with Wisconsin. It is situated in the St. Croix River Valley, which is part of the Driftless Area. The city is surrounded by rolling hills and is located on the banks of the St. Croix River. The city is located approximately 25 miles from the Twin Cities of Minneapolis and St. Paul.
The climate in Alberta is typical of the Upper Midwest, with cold winters and hot summers. The average annual temperature is around 40 degrees Fahrenheit. The average annual precipitation is around 30 inches.
History
Alberta was founded in 1856 by settlers from Sweden. The city was named after Queen Victoria's daughter, Princess Alberta. The city was originally a farming community, but it soon developed into a small industrial center.
In the late 19th century, Alberta was home to several sawmills, a flour mill, and a brickyard. The city also had a number of small businesses, including a blacksmith shop, a general store, and a hotel.
In the early 20th century, Alberta experienced a period of growth and prosperity. The city was home to several factories, including a furniture factory, a canning factory, and a creamery. The city also had a number of small businesses, including a bank, a newspaper, and a movie theater.
Economy
Today, Alberta is a small city with a population of approximately 1,500 people. The city is home to several small businesses, including a grocery store, a hardware store, and a restaurant. The city also has a number of small manufacturing companies, including a furniture factory and a canning factory.
The city is also home to a number of small farms, which produce a variety of crops, including corn, soybeans, and hay. The city is also home to a number of small businesses, including a bank, a newspaper, and a movie theater.
Demographics
As of the 2010 census, the population of Alberta was 1,500 people. The racial makeup of the city was 97.3% White, 0.7% African American, 0.3% Native American, 0.3% Asian, and 1.3% from other races. The median household income was $45,000, and the median family income was $50,000.
The city is home to a number of churches, including the First Baptist Church, the First Lutheran Church, and the St. John's Catholic Church. The city also has a public library and a number of parks.
Conclusion
Alberta is a small city located in southeastern Minnesota, near the border with Wisconsin. The city has a population of approximately 1,500 people and is part of the Twin Cities metropolitan area. The city was founded in 1856 by settlers from Sweden and was named after Queen Victoria's daughter, Princess Alberta. The city has a number of small businesses, including a grocery store, a hardware store, and a restaurant. The city is also home to a number of small farms, which produce a variety of crops. The city is home to a number of churches, a public library, and a number of parks. The median household income in the city is $45,000, and the median family income is $50,000.
Common Questions
What is Per Capita Income in Alberta?
Per Capita income in Alberta is $41,754.
What is the Median Family Income in Alberta?
Median Family Income in Alberta is $95,417.
What is the Median Household income in Alberta?
Median Household Income in Alberta is $95,139.
What is Income or Wage Gap in Alberta?
Income or Wage Gap in Alberta is 35.6%.
Women in Alberta earn 64.4 cents for every dollar earned by a man.
What is Inequality or Gini Index in Alberta?
Inequality or Gini Index in Alberta is 0.25.
What is the Total Population of Alberta?
Total Population of Alberta is 101.
What is the Total Male Population of Alberta?
Total Male Population of Alberta is 49.
What is the Total Female Population of Alberta?
Total Female Population of Alberta is 52.
What is the Ratio of Males per 100 Females in Alberta?
There are 94.23 Males per 100 Females in Alberta.
What is the Ratio of Females per 100 Males in Alberta?
There are 106.12 Females per 100 Males in Alberta.
What is the Median Population Age in Alberta?
Median Population Age in Alberta is 63.0 Years.
What is the Average Family Size in Alberta
Average Family Size in Alberta is 3.0 People.
What is the Average Household Size in Alberta
Average Household Size in Alberta is 2.5 People.
How Large is the Labor Force in Alberta?
There are 70 People in the Labor Forcein in Alberta.
What is the Percentage of People in the Labor Force in Alberta?
77.8% of People are in the Labor Force in Alberta.