Maple Plain, MN Map & Demographics
Maple Plain Map
Maple Plain Overview
$37,142
PER CAPITA INCOME
$105,972
AVG FAMILY INCOME
$77,813
AVG HOUSEHOLD INCOME
30.2%
WAGE / INCOME GAP [ % ]
69.8¢/ $1
WAGE / INCOME GAP [ $ ]
0.38
INEQUALITY / GINI INDEX
1,780
TOTAL POPULATION
965
MALE POPULATION
815
FEMALE POPULATION
118.40
MALES / 100 FEMALES
84.46
FEMALES / 100 MALES
37.9
MEDIAN AGE
3.0
AVG FAMILY SIZE
2.3
AVG HOUSEHOLD SIZE
853
LABOR FORCE [ PEOPLE ]
62.6%
PERCENT IN LABOR FORCE
2.9%
UNEMPLOYMENT RATE
Maple Plain Zip Codes
Maple Plain Area Codes
Income in Maple Plain
Income Overview in Maple Plain
Per Capita Income in Maple Plain is $37,142, while median incomes of families and households are $105,972 and $77,813 respectively.
| Characteristic | Number | Measure |
| Per Capita Income | 1,780 | $37,142 |
| Median Family Income | 437 | $105,972 |
| Mean Family Income | 437 | $111,282 |
| Median Household Income | 756 | $77,813 |
| Mean Household Income | 756 | $85,784 |
| Income Deficit | 437 | $0 |
| Wage / Income Gap (%) | 1,780 | 30.23% |
| Wage / Income Gap ($) | 1,780 | 69.77¢ per $1 |
| Gini / Inequality Index | 1,780 | 0.38 |
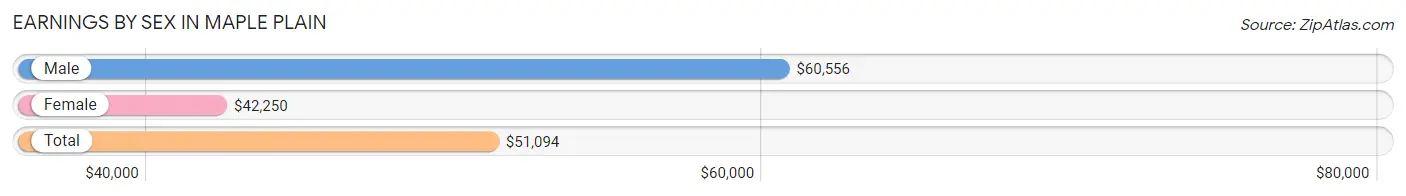
Earnings by Sex in Maple Plain
Average Earnings in Maple Plain are $51,094, $60,556 for men and $42,250 for women, a difference of 30.2%.
| Sex | Number | Average Earnings |
| Male | 498 (54.5%) | $60,556 |
| Female | 416 (45.5%) | $42,250 |
| Total | 914 (100.0%) | $51,094 |
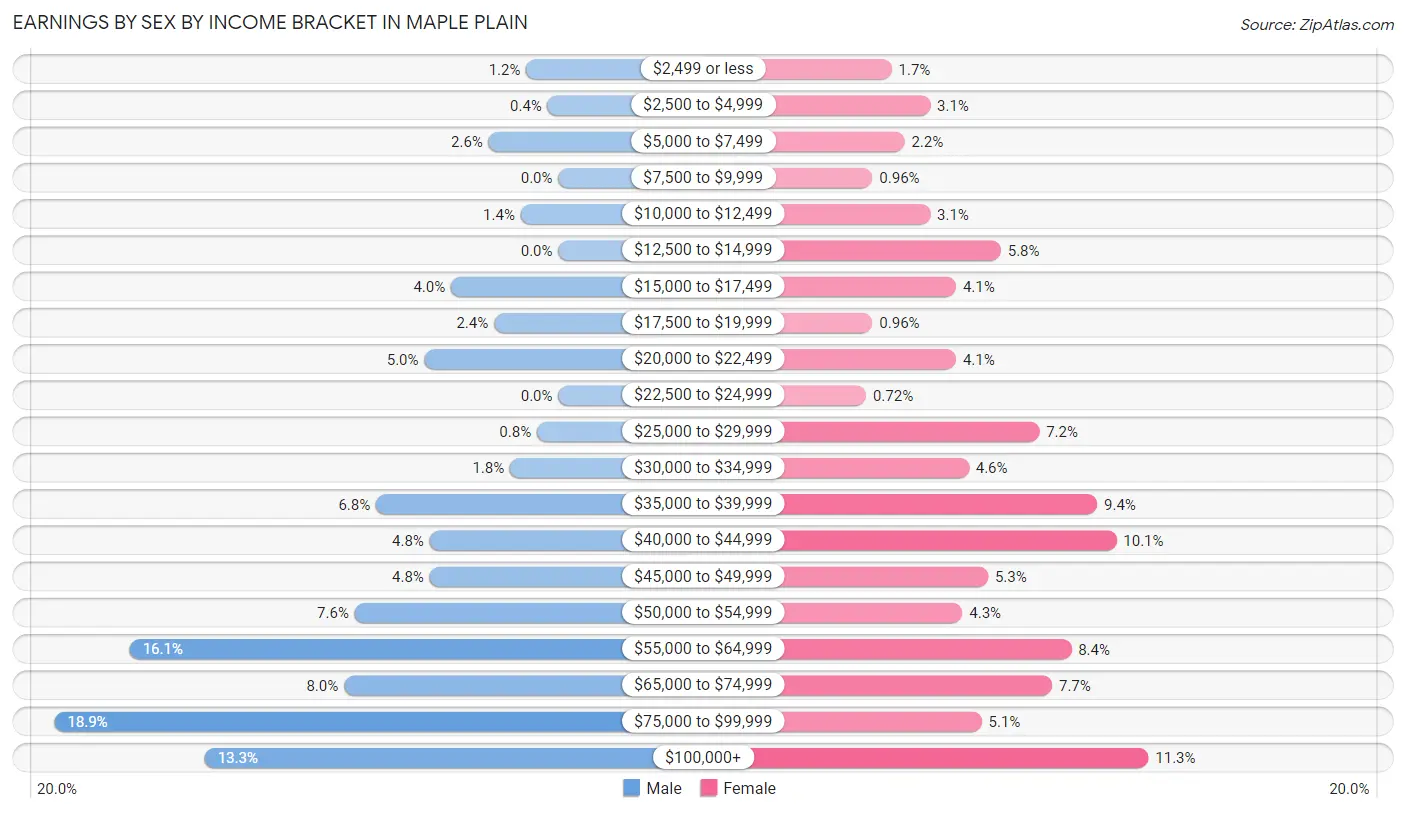
Earnings by Sex by Income Bracket in Maple Plain
The most common earnings brackets in Maple Plain are $75,000 to $99,999 for men (94 | 18.9%) and $100,000+ for women (47 | 11.3%).
| Income | Male | Female |
| $2,499 or less | 6 (1.2%) | 7 (1.7%) |
| $2,500 to $4,999 | 2 (0.4%) | 13 (3.1%) |
| $5,000 to $7,499 | 13 (2.6%) | 9 (2.2%) |
| $7,500 to $9,999 | 0 (0.0%) | 4 (1.0%) |
| $10,000 to $12,499 | 7 (1.4%) | 13 (3.1%) |
| $12,500 to $14,999 | 0 (0.0%) | 24 (5.8%) |
| $15,000 to $17,499 | 20 (4.0%) | 17 (4.1%) |
| $17,500 to $19,999 | 12 (2.4%) | 4 (1.0%) |
| $20,000 to $22,499 | 25 (5.0%) | 17 (4.1%) |
| $22,500 to $24,999 | 0 (0.0%) | 3 (0.7%) |
| $25,000 to $29,999 | 4 (0.8%) | 30 (7.2%) |
| $30,000 to $34,999 | 9 (1.8%) | 19 (4.6%) |
| $35,000 to $39,999 | 34 (6.8%) | 39 (9.4%) |
| $40,000 to $44,999 | 24 (4.8%) | 42 (10.1%) |
| $45,000 to $49,999 | 24 (4.8%) | 22 (5.3%) |
| $50,000 to $54,999 | 38 (7.6%) | 18 (4.3%) |
| $55,000 to $64,999 | 80 (16.1%) | 35 (8.4%) |
| $65,000 to $74,999 | 40 (8.0%) | 32 (7.7%) |
| $75,000 to $99,999 | 94 (18.9%) | 21 (5.1%) |
| $100,000+ | 66 (13.3%) | 47 (11.3%) |
| Total | 498 (100.0%) | 416 (100.0%) |
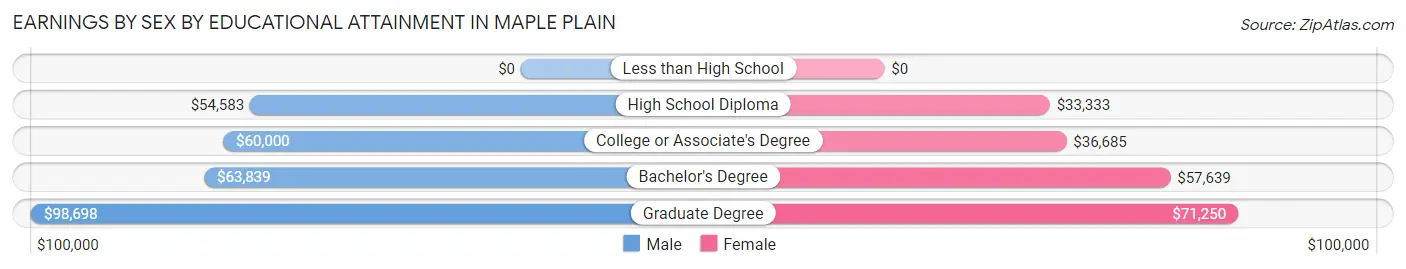
Earnings by Sex by Educational Attainment in Maple Plain
Average earnings in Maple Plain are $62,821 for men and $43,672 for women, a difference of 30.5%. Men with an educational attainment of graduate degree enjoy the highest average annual earnings of $98,698, while those with high school diploma education earn the least with $54,583. Women with an educational attainment of graduate degree earn the most with the average annual earnings of $71,250, while those with high school diploma education have the smallest earnings of $33,333.
| Educational Attainment | Male Income | Female Income |
| Less than High School | - | - |
| High School Diploma | $54,583 | $33,333 |
| College or Associate's Degree | $60,000 | $36,685 |
| Bachelor's Degree | $63,839 | $57,639 |
| Graduate Degree | $98,698 | $71,250 |
| Total | $62,821 | $43,672 |
Family Income in Maple Plain
Family Income Brackets in Maple Plain
According to the Maple Plain family income data, there are 125 families falling into the $100,000 to $149,999 income range, which is the most common income bracket and makes up 28.6% of all families.
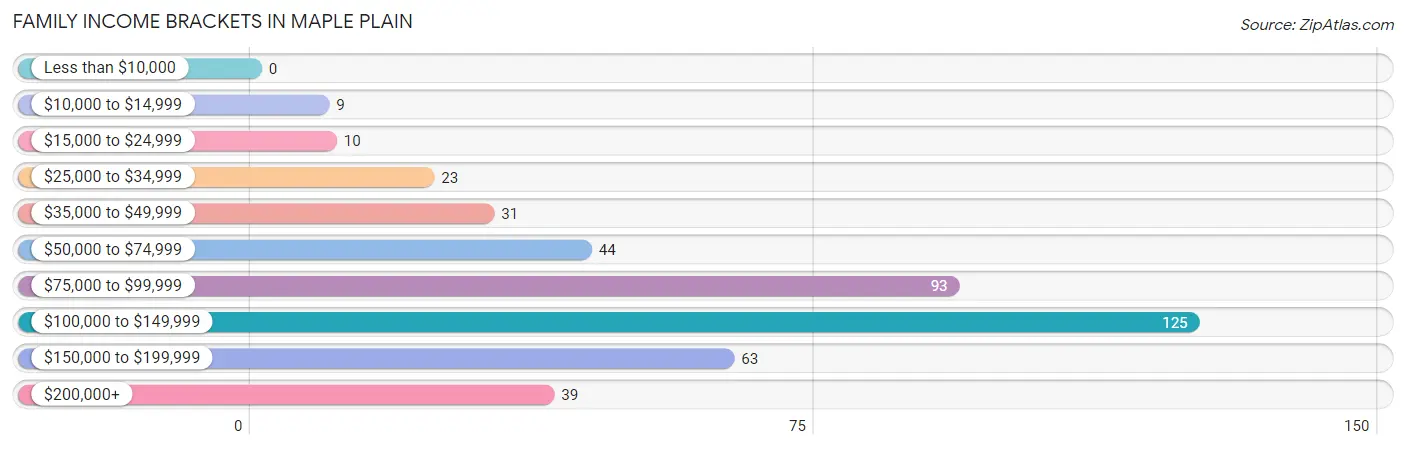
| Income Bracket | # Families | % Families |
| Less than $10,000 | 0 | 0.0% |
| $10,000 to $14,999 | 9 | 2.1% |
| $15,000 to $24,999 | 10 | 2.3% |
| $25,000 to $34,999 | 23 | 5.3% |
| $35,000 to $49,999 | 31 | 7.1% |
| $50,000 to $74,999 | 44 | 10.1% |
| $75,000 to $99,999 | 93 | 21.3% |
| $100,000 to $149,999 | 125 | 28.6% |
| $150,000 to $199,999 | 63 | 14.4% |
| $200,000+ | 39 | 8.9% |
Family Income by Famaliy Size in Maple Plain
4-person families (78 | 17.8%) account for the highest median family income in Maple Plain with $146,667 per family, while 2-person families (206 | 47.1%) have the highest median income of $47,280 per family member.
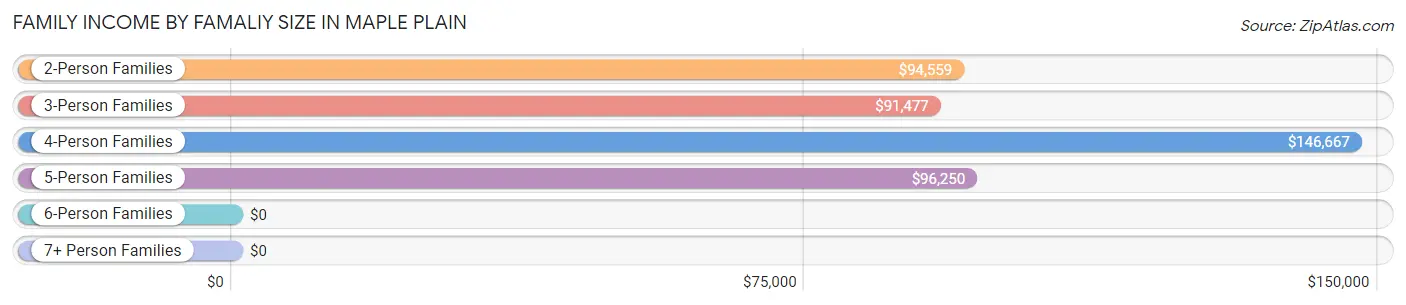
| Income Bracket | # Families | Median Income |
| 2-Person Families | 206 (47.1%) | $94,559 |
| 3-Person Families | 93 (21.3%) | $91,477 |
| 4-Person Families | 78 (17.8%) | $146,667 |
| 5-Person Families | 48 (11.0%) | $96,250 |
| 6-Person Families | 12 (2.8%) | $0 |
| 7+ Person Families | 0 (0.0%) | $0 |
| Total | 437 (100.0%) | $105,972 |
Family Income by Number of Earners in Maple Plain
The median family income in Maple Plain is $105,972, with families comprising 2 earners (200) having the highest median family income of $138,929, while families with 1 earner (170) have the lowest median family income of $84,688, accounting for 45.8% and 38.9% of families, respectively.
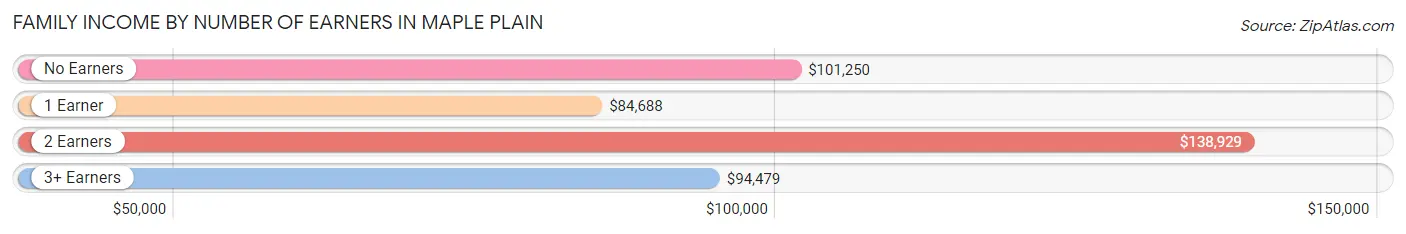
| Number of Earners | # Families | Median Income |
| No Earners | 36 (8.2%) | $101,250 |
| 1 Earner | 170 (38.9%) | $84,688 |
| 2 Earners | 200 (45.8%) | $138,929 |
| 3+ Earners | 31 (7.1%) | $94,479 |
| Total | 437 (100.0%) | $105,972 |
Household Income in Maple Plain
Household Income Brackets in Maple Plain
With 156 households falling in the category, the $100,000 to $149,999 income range is the most frequent in Maple Plain, accounting for 20.6% of all households. In contrast, only 24 households (3.2%) fall into the less than $10,000 income bracket, making it the least populous group.
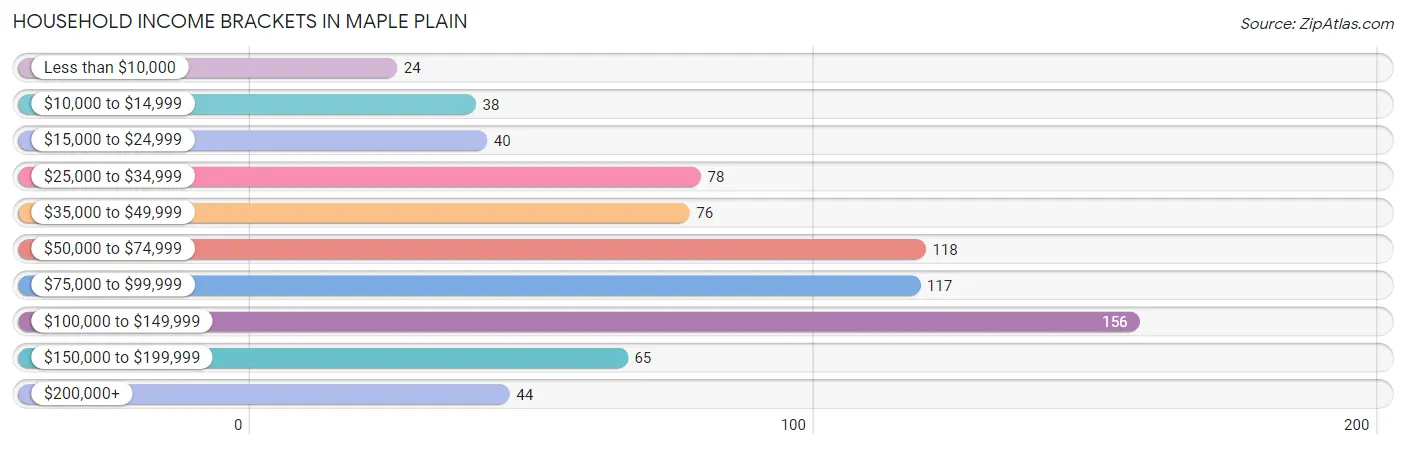
| Income Bracket | # Households | % Households |
| Less than $10,000 | 24 | 3.2% |
| $10,000 to $14,999 | 38 | 5.0% |
| $15,000 to $24,999 | 40 | 5.3% |
| $25,000 to $34,999 | 78 | 10.3% |
| $35,000 to $49,999 | 76 | 10.1% |
| $50,000 to $74,999 | 118 | 15.6% |
| $75,000 to $99,999 | 117 | 15.5% |
| $100,000 to $149,999 | 156 | 20.6% |
| $150,000 to $199,999 | 65 | 8.6% |
| $200,000+ | 44 | 5.8% |
Household Income by Householder Age in Maple Plain
The median household income in Maple Plain is $77,813, with the highest median household income of $93,015 found in the 25 to 44 years age bracket for the primary householder. A total of 302 households (40.0%) fall into this category. Meanwhile, the 65+ years age bracket for the primary householder has the lowest median household income of $0, with 207 households (27.4%) in this group.
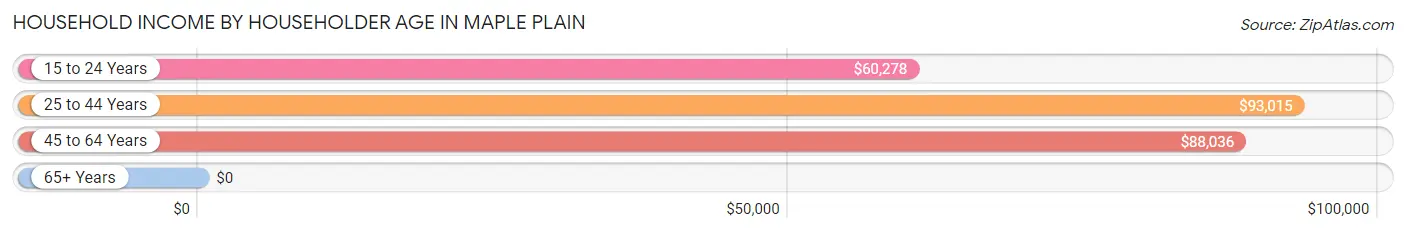
| Income Bracket | # Households | Median Income |
| 15 to 24 Years | 26 (3.4%) | $60,278 |
| 25 to 44 Years | 302 (40.0%) | $93,015 |
| 45 to 64 Years | 221 (29.2%) | $88,036 |
| 65+ Years | 207 (27.4%) | $0 |
| Total | 756 (100.0%) | $77,813 |
Poverty in Maple Plain
Income Below Poverty by Sex and Age in Maple Plain
With 8.9% poverty level for males and 9.8% for females among the residents of Maple Plain, 5 year old males and 6 to 11 year old females are the most vulnerable to poverty, with 5 males (27.8%) and 15 females (25.4%) in their respective age groups living below the poverty level.
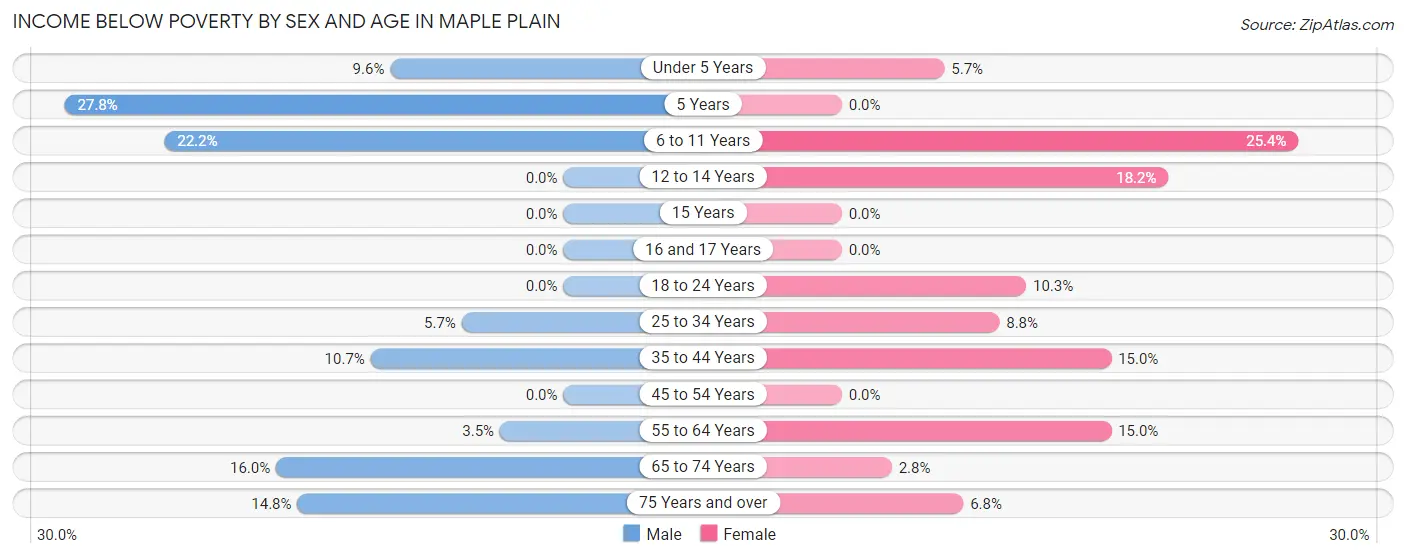
| Age Bracket | Male | Female |
| Under 5 Years | 8 (9.6%) | 4 (5.7%) |
| 5 Years | 5 (27.8%) | 0 (0.0%) |
| 6 to 11 Years | 20 (22.2%) | 15 (25.4%) |
| 12 to 14 Years | 0 (0.0%) | 4 (18.2%) |
| 15 Years | 0 (0.0%) | 0 (0.0%) |
| 16 and 17 Years | 0 (0.0%) | 0 (0.0%) |
| 18 to 24 Years | 0 (0.0%) | 4 (10.3%) |
| 25 to 34 Years | 6 (5.7%) | 10 (8.8%) |
| 35 to 44 Years | 19 (10.7%) | 18 (15.0%) |
| 45 to 54 Years | 0 (0.0%) | 0 (0.0%) |
| 55 to 64 Years | 3 (3.5%) | 15 (15.0%) |
| 65 to 74 Years | 16 (16.0%) | 2 (2.8%) |
| 75 Years and over | 4 (14.8%) | 5 (6.8%) |
| Total | 81 (8.9%) | 77 (9.8%) |
Income Above Poverty by Sex and Age in Maple Plain
According to the poverty statistics in Maple Plain, males aged 12 to 14 years and females aged 5 years are the age groups that are most secure financially, with 100.0% of males and 100.0% of females in these age groups living above the poverty line.
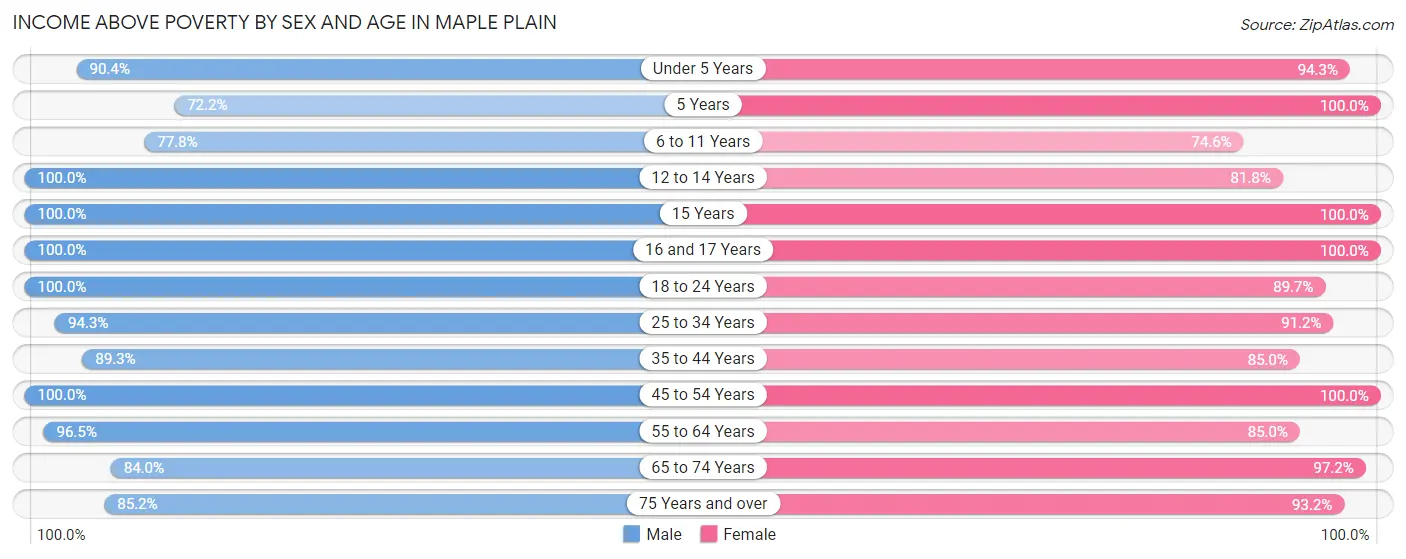
| Age Bracket | Male | Female |
| Under 5 Years | 75 (90.4%) | 66 (94.3%) |
| 5 Years | 13 (72.2%) | 3 (100.0%) |
| 6 to 11 Years | 70 (77.8%) | 44 (74.6%) |
| 12 to 14 Years | 36 (100.0%) | 18 (81.8%) |
| 15 Years | 11 (100.0%) | 10 (100.0%) |
| 16 and 17 Years | 25 (100.0%) | 22 (100.0%) |
| 18 to 24 Years | 60 (100.0%) | 35 (89.7%) |
| 25 to 34 Years | 100 (94.3%) | 104 (91.2%) |
| 35 to 44 Years | 158 (89.3%) | 102 (85.0%) |
| 45 to 54 Years | 93 (100.0%) | 78 (100.0%) |
| 55 to 64 Years | 82 (96.5%) | 85 (85.0%) |
| 65 to 74 Years | 84 (84.0%) | 70 (97.2%) |
| 75 Years and over | 23 (85.2%) | 69 (93.2%) |
| Total | 830 (91.1%) | 706 (90.2%) |
Income Below Poverty Among Married-Couple Families in Maple Plain
The poverty statistics for married-couple families in Maple Plain show that 0.9% or 3 of the total 330 families live below the poverty line. Families with 3 or 4 children have the highest poverty rate of 7.9%, comprising of 3 families. On the other hand, families with no children have the lowest poverty rate of 0.0%, which includes 0 families.
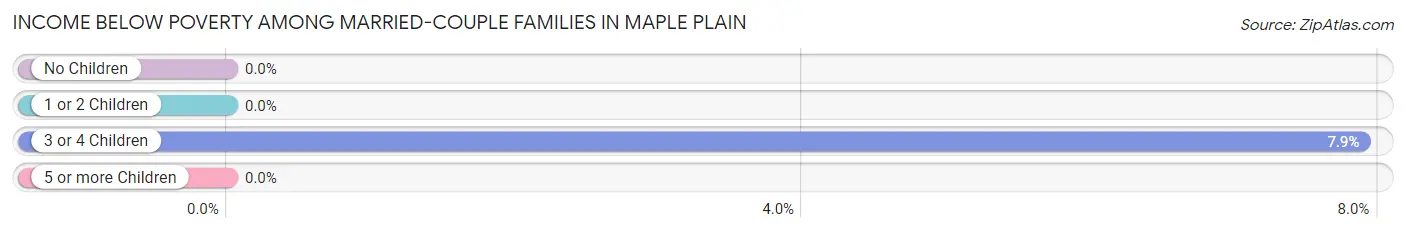
| Children | Above Poverty | Below Poverty |
| No Children | 169 (100.0%) | 0 (0.0%) |
| 1 or 2 Children | 123 (100.0%) | 0 (0.0%) |
| 3 or 4 Children | 35 (92.1%) | 3 (7.9%) |
| 5 or more Children | 0 (0.0%) | 0 (0.0%) |
| Total | 327 (99.1%) | 3 (0.9%) |
Income Below Poverty Among Single-Parent Households in Maple Plain
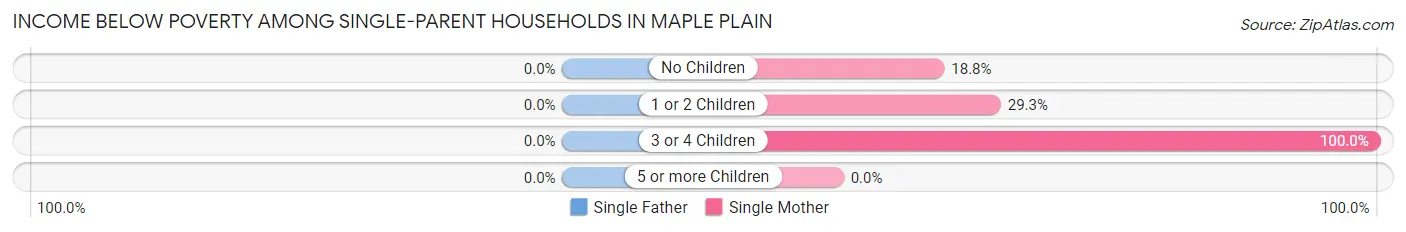
| Children | Single Father | Single Mother |
| No Children | 0 (0.0%) | 3 (18.8%) |
| 1 or 2 Children | 0 (0.0%) | 12 (29.3%) |
| 3 or 4 Children | 0 (0.0%) | 3 (100.0%) |
| 5 or more Children | 0 (0.0%) | 0 (0.0%) |
| Total | 0 (0.0%) | 18 (30.0%) |
Income Below Poverty Among Married-Couple vs Single-Parent Households in Maple Plain
The poverty data for Maple Plain shows that 3 of the married-couple family households (0.9%) and 18 of the single-parent households (16.8%) are living below the poverty level. Within the married-couple family households, those with 3 or 4 children have the highest poverty rate, with 3 households (7.9%) falling below the poverty line. Among the single-parent households, those with 3 or 4 children have the highest poverty rate, with 3 household (50.0%) living below poverty.
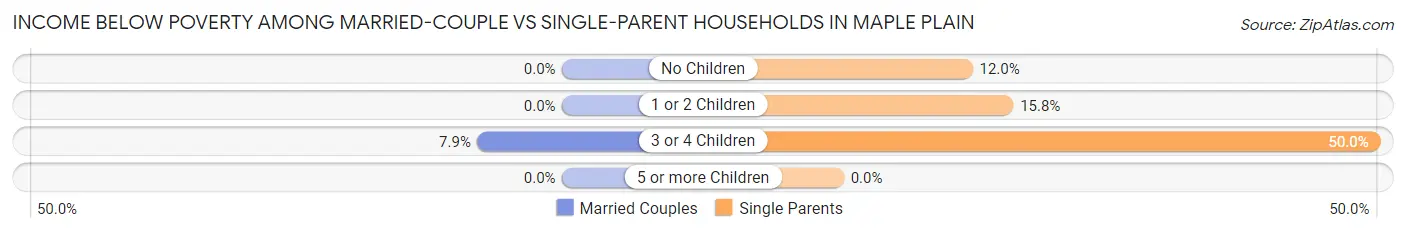
| Children | Married-Couple Families | Single-Parent Households |
| No Children | 0 (0.0%) | 3 (12.0%) |
| 1 or 2 Children | 0 (0.0%) | 12 (15.8%) |
| 3 or 4 Children | 3 (7.9%) | 3 (50.0%) |
| 5 or more Children | 0 (0.0%) | 0 (0.0%) |
| Total | 3 (0.9%) | 18 (16.8%) |
Race in Maple Plain
The most populous races in Maple Plain are White / Caucasian (1,551 | 87.1%), Hispanic or Latino (164 | 9.2%), and Two or more Races (108 | 6.1%).
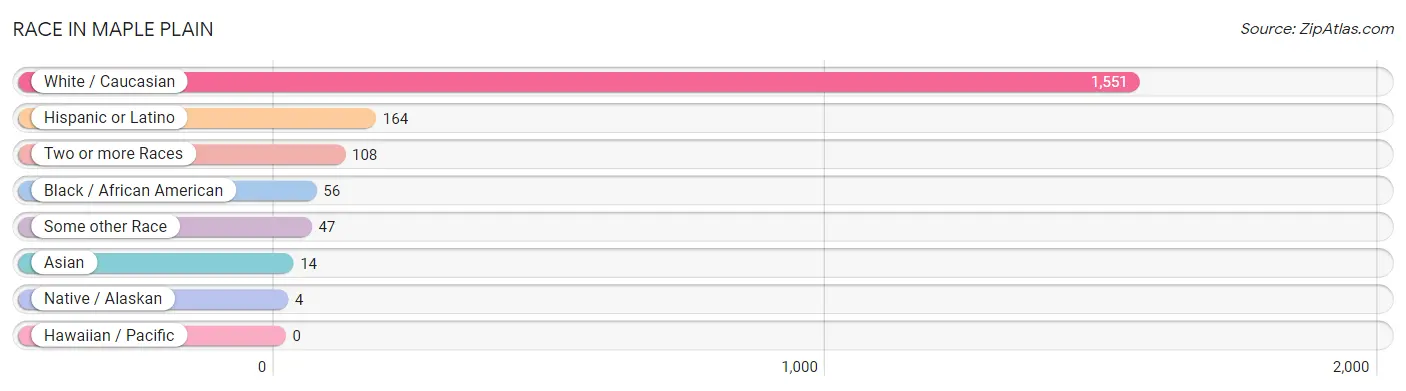
| Race | # Population | % Population |
| Asian | 14 | 0.8% |
| Black / African American | 56 | 3.2% |
| Hawaiian / Pacific | 0 | 0.0% |
| Hispanic or Latino | 164 | 9.2% |
| Native / Alaskan | 4 | 0.2% |
| White / Caucasian | 1,551 | 87.1% |
| Two or more Races | 108 | 6.1% |
| Some other Race | 47 | 2.6% |
| Total | 1,780 | 100.0% |
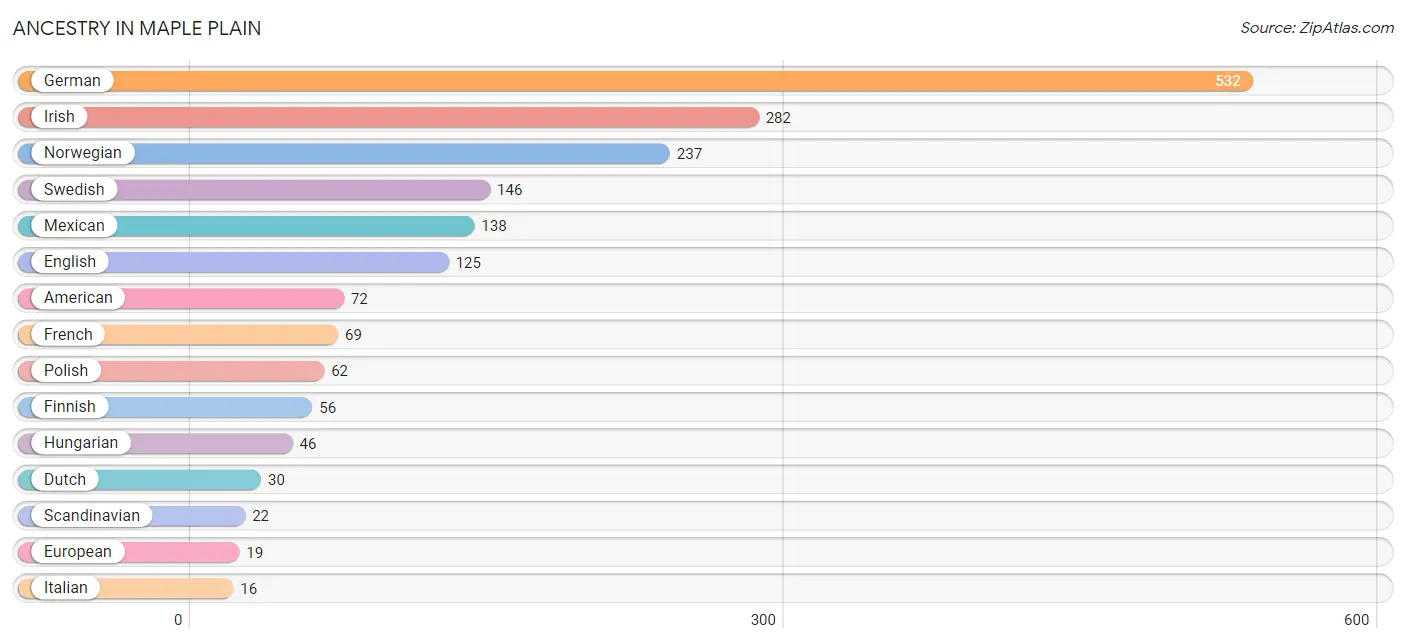
Ancestry in Maple Plain
The most populous ancestries reported in Maple Plain are German (532 | 29.9%), Irish (282 | 15.8%), Norwegian (237 | 13.3%), Swedish (146 | 8.2%), and Mexican (138 | 7.7%), together accounting for 75.0% of all Maple Plain residents.
| Ancestry | # Population | % Population |
| African | 3 | 0.2% |
| American | 72 | 4.0% |
| Arab | 5 | 0.3% |
| Belgian | 6 | 0.3% |
| Blackfeet | 13 | 0.7% |
| British | 7 | 0.4% |
| Central American | 7 | 0.4% |
| Cherokee | 4 | 0.2% |
| Chippewa | 12 | 0.7% |
| Costa Rican | 7 | 0.4% |
| Croatian | 2 | 0.1% |
| Czech | 6 | 0.3% |
| Czechoslovakian | 4 | 0.2% |
| Danish | 9 | 0.5% |
| Dutch | 30 | 1.7% |
| English | 125 | 7.0% |
| European | 19 | 1.1% |
| Finnish | 56 | 3.2% |
| French | 69 | 3.9% |
| French Canadian | 10 | 0.6% |
| German | 532 | 29.9% |
| Hungarian | 46 | 2.6% |
| Irish | 282 | 15.8% |
| Italian | 16 | 0.9% |
| Korean | 14 | 0.8% |
| Lebanese | 5 | 0.3% |
| Liberian | 12 | 0.7% |
| Luxembourger | 4 | 0.2% |
| Mexican | 138 | 7.7% |
| Northern European | 2 | 0.1% |
| Norwegian | 237 | 13.3% |
| Peruvian | 16 | 0.9% |
| Polish | 62 | 3.5% |
| Portuguese | 5 | 0.3% |
| Romanian | 3 | 0.2% |
| Scandinavian | 22 | 1.2% |
| Scotch-Irish | 7 | 0.4% |
| Scottish | 14 | 0.8% |
| Slovene | 2 | 0.1% |
| South American | 16 | 0.9% |
| South American Indian | 4 | 0.2% |
| Spaniard | 3 | 0.2% |
| Sri Lankan | 14 | 0.8% |
| Subsaharan African | 15 | 0.8% |
| Swedish | 146 | 8.2% |
| Ukrainian | 16 | 0.9% |
| Welsh | 8 | 0.4% | View All 47 Rows |
Immigrants in Maple Plain
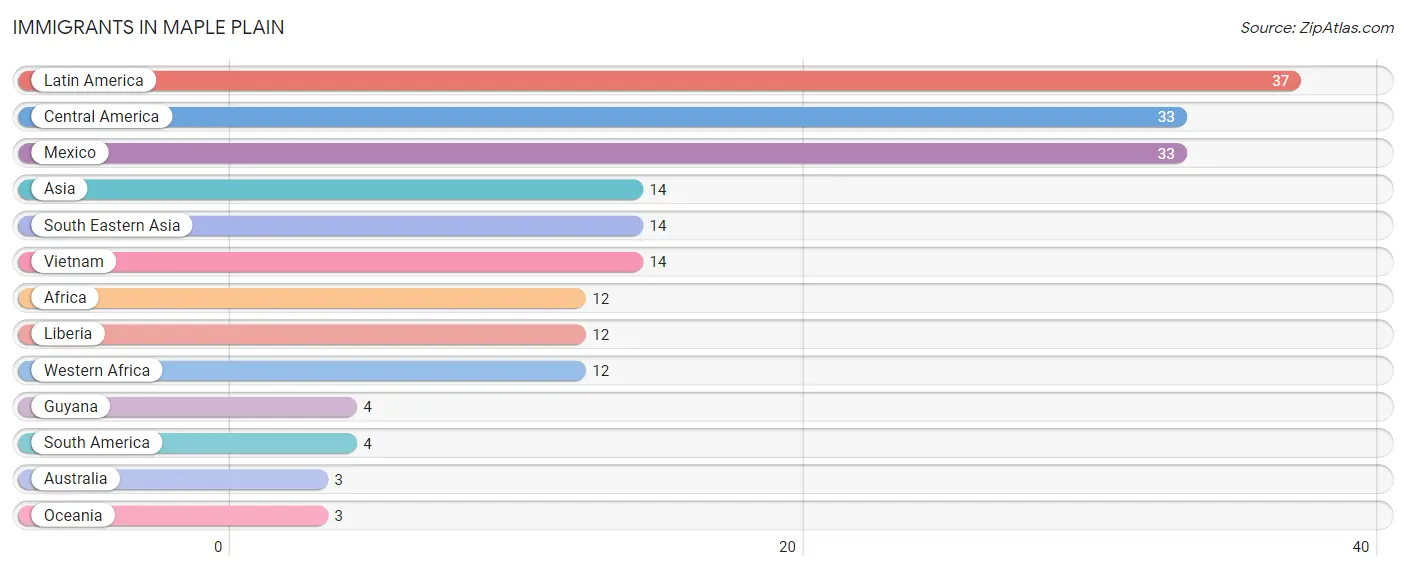
The most numerous immigrant groups reported in Maple Plain came from Latin America (37 | 2.1%), Central America (33 | 1.8%), Mexico (33 | 1.8%), Asia (14 | 0.8%), and South Eastern Asia (14 | 0.8%), together accounting for 7.4% of all Maple Plain residents.
| Immigration Origin | # Population | % Population |
| Africa | 12 | 0.7% |
| Asia | 14 | 0.8% |
| Australia | 3 | 0.2% |
| Central America | 33 | 1.8% |
| Guyana | 4 | 0.2% |
| Latin America | 37 | 2.1% |
| Liberia | 12 | 0.7% |
| Mexico | 33 | 1.8% |
| Oceania | 3 | 0.2% |
| South America | 4 | 0.2% |
| South Eastern Asia | 14 | 0.8% |
| Vietnam | 14 | 0.8% |
| Western Africa | 12 | 0.7% | View All 13 Rows |
Sex and Age in Maple Plain
Sex and Age in Maple Plain
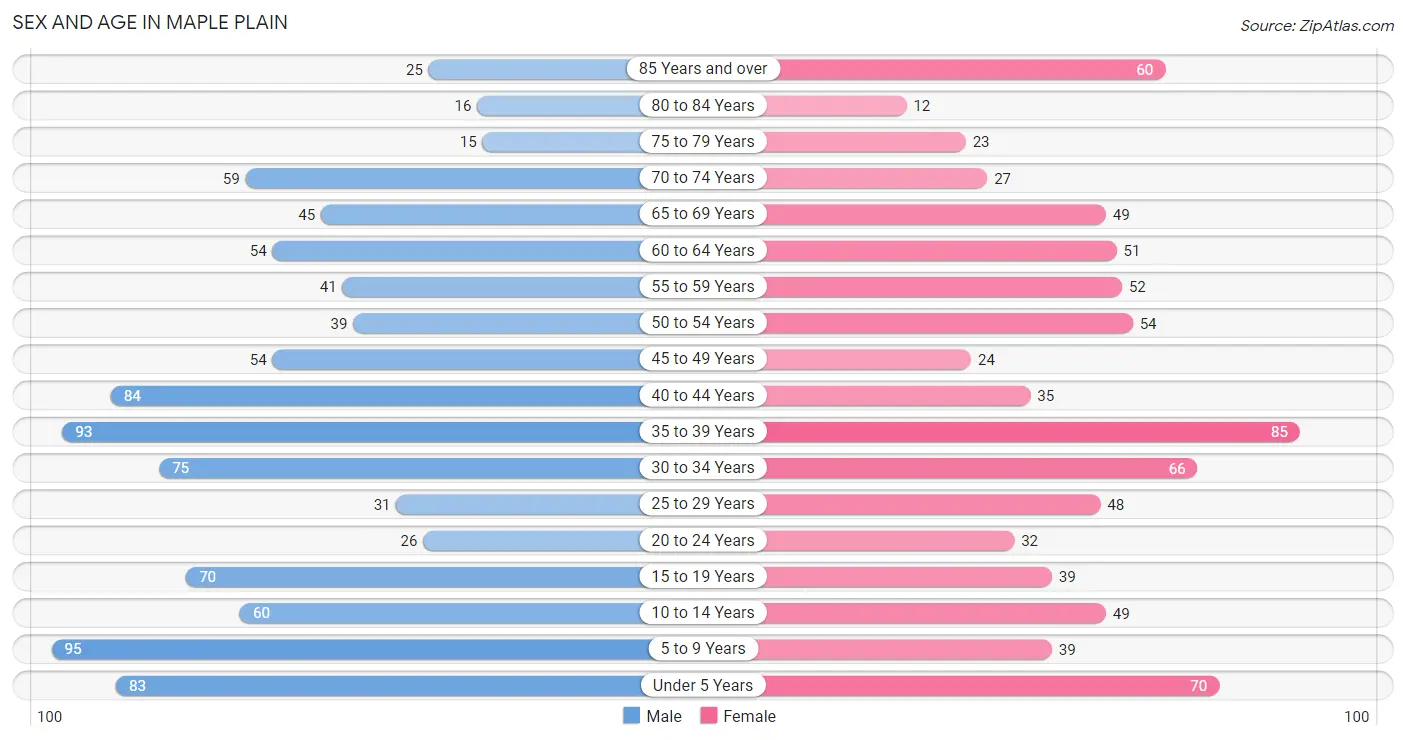
The most populous age groups in Maple Plain are 5 to 9 Years (95 | 9.8%) for men and 35 to 39 Years (85 | 10.4%) for women.
| Age Bracket | Male | Female |
| Under 5 Years | 83 (8.6%) | 70 (8.6%) |
| 5 to 9 Years | 95 (9.8%) | 39 (4.8%) |
| 10 to 14 Years | 60 (6.2%) | 49 (6.0%) |
| 15 to 19 Years | 70 (7.2%) | 39 (4.8%) |
| 20 to 24 Years | 26 (2.7%) | 32 (3.9%) |
| 25 to 29 Years | 31 (3.2%) | 48 (5.9%) |
| 30 to 34 Years | 75 (7.8%) | 66 (8.1%) |
| 35 to 39 Years | 93 (9.6%) | 85 (10.4%) |
| 40 to 44 Years | 84 (8.7%) | 35 (4.3%) |
| 45 to 49 Years | 54 (5.6%) | 24 (2.9%) |
| 50 to 54 Years | 39 (4.0%) | 54 (6.6%) |
| 55 to 59 Years | 41 (4.3%) | 52 (6.4%) |
| 60 to 64 Years | 54 (5.6%) | 51 (6.3%) |
| 65 to 69 Years | 45 (4.7%) | 49 (6.0%) |
| 70 to 74 Years | 59 (6.1%) | 27 (3.3%) |
| 75 to 79 Years | 15 (1.5%) | 23 (2.8%) |
| 80 to 84 Years | 16 (1.7%) | 12 (1.5%) |
| 85 Years and over | 25 (2.6%) | 60 (7.4%) |
| Total | 965 (100.0%) | 815 (100.0%) |
Families and Households in Maple Plain
Median Family Size in Maple Plain
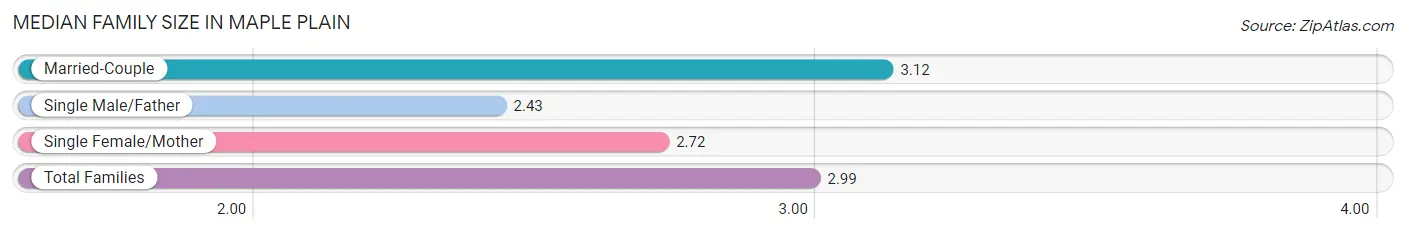
The median family size in Maple Plain is 2.99 persons per family, with married-couple families (330 | 75.5%) accounting for the largest median family size of 3.12 persons per family. On the other hand, single male/father families (47 | 10.8%) represent the smallest median family size with 2.43 persons per family.
| Family Type | # Families | Family Size |
| Married-Couple | 330 (75.5%) | 3.12 |
| Single Male/Father | 47 (10.8%) | 2.43 |
| Single Female/Mother | 60 (13.7%) | 2.72 |
| Total Families | 437 (100.0%) | 2.99 |
Median Household Size in Maple Plain
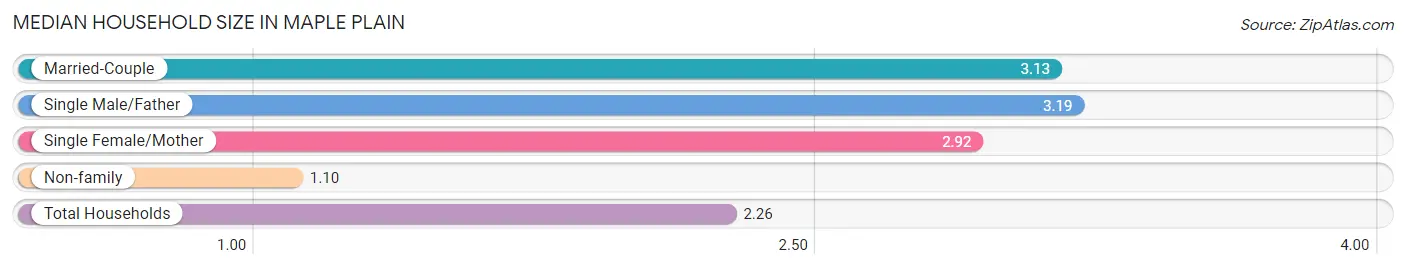
The median household size in Maple Plain is 2.26 persons per household, with single male/father households (47 | 6.2%) accounting for the largest median household size of 3.19 persons per household. non-family households (319 | 42.2%) represent the smallest median household size with 1.10 persons per household.
| Household Type | # Households | Household Size |
| Married-Couple | 330 (43.6%) | 3.13 |
| Single Male/Father | 47 (6.2%) | 3.19 |
| Single Female/Mother | 60 (7.9%) | 2.92 |
| Non-family | 319 (42.2%) | 1.10 |
| Total Households | 756 (100.0%) | 2.26 |
Household Size by Marriage Status in Maple Plain
Out of a total of 756 households in Maple Plain, 437 (57.8%) are family households, while 319 (42.2%) are nonfamily households. The most numerous type of family households are 2-person households, comprising 177, and the most common type of nonfamily households are 1-person households, comprising 289.
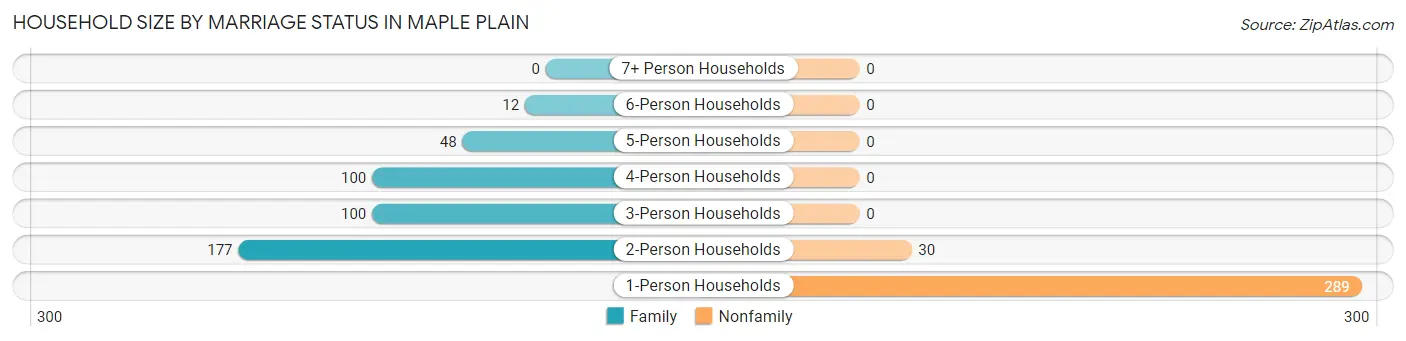
| Household Size | Family Households | Nonfamily Households |
| 1-Person Households | - | 289 (38.2%) |
| 2-Person Households | 177 (23.4%) | 30 (4.0%) |
| 3-Person Households | 100 (13.2%) | 0 (0.0%) |
| 4-Person Households | 100 (13.2%) | 0 (0.0%) |
| 5-Person Households | 48 (6.4%) | 0 (0.0%) |
| 6-Person Households | 12 (1.6%) | 0 (0.0%) |
| 7+ Person Households | 0 (0.0%) | 0 (0.0%) |
| Total | 437 (57.8%) | 319 (42.2%) |
Female Fertility in Maple Plain
Fertility by Age in Maple Plain
Average fertility rate in Maple Plain is 99.0 births per 1,000 women. Women in the age bracket of 20 to 34 years have the highest fertility rate with 199.0 births per 1,000 women. Women in the age bracket of 20 to 34 years acount for 80.6% of all women with births.
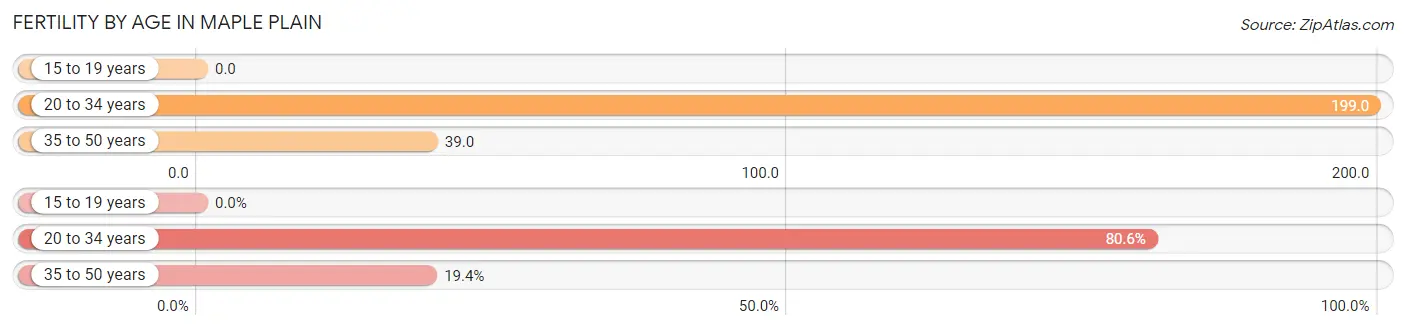
| Age Bracket | Women with Births | Births / 1,000 Women |
| 15 to 19 years | 0 (0.0%) | 0.0 |
| 20 to 34 years | 29 (80.6%) | 199.0 |
| 35 to 50 years | 7 (19.4%) | 39.0 |
| Total | 36 (100.0%) | 99.0 |
Fertility by Age by Marriage Status in Maple Plain
80.6% of women with births (36) in Maple Plain are married. The highest percentage of unmarried women with births falls into 20 to 34 years age bracket with 24.1% of them unmarried at the time of birth, while the lowest percentage of unmarried women with births belong to 35 to 50 years age bracket with 0.0% of them unmarried.
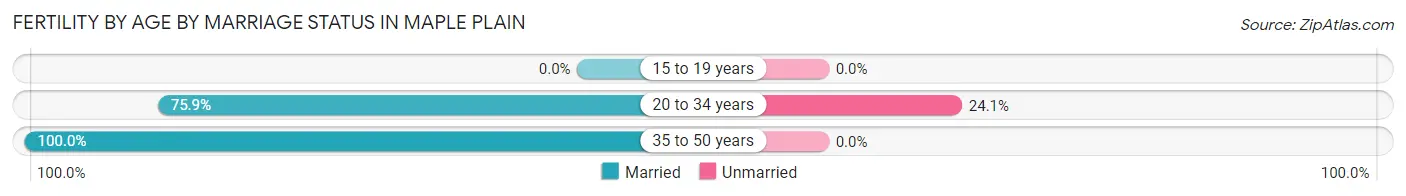
| Age Bracket | Married | Unmarried |
| 15 to 19 years | 0 (0.0%) | 0 (0.0%) |
| 20 to 34 years | 22 (75.9%) | 7 (24.1%) |
| 35 to 50 years | 7 (100.0%) | 0 (0.0%) |
| Total | 29 (80.6%) | 7 (19.4%) |
Fertility by Education in Maple Plain
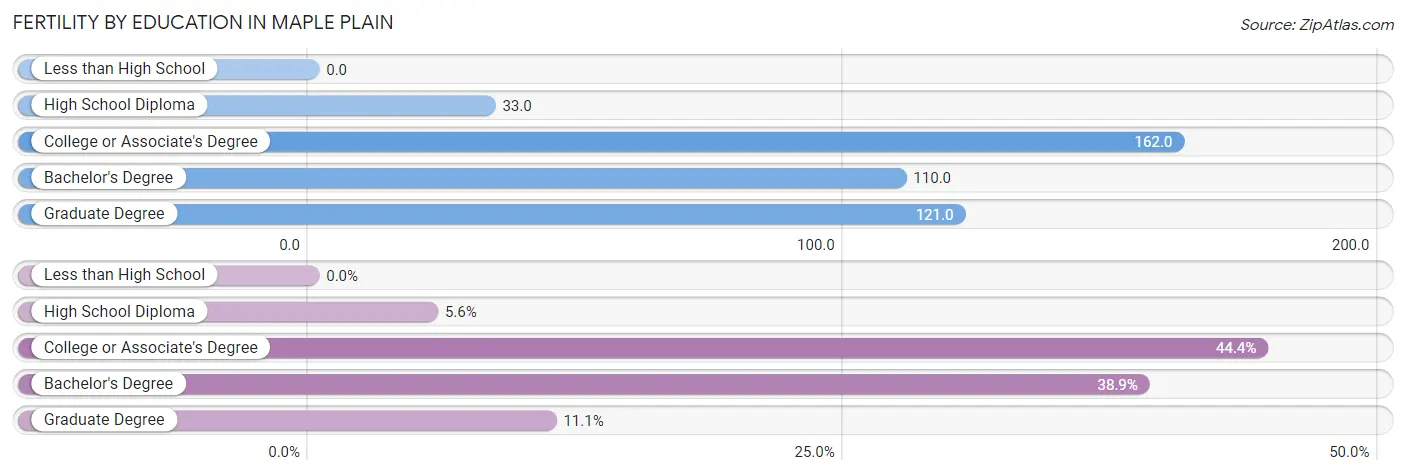
| Educational Attainment | Women with Births | Births / 1,000 Women |
| Less than High School | 0 (0.0%) | 0.0 |
| High School Diploma | 2 (5.6%) | 33.0 |
| College or Associate's Degree | 16 (44.4%) | 162.0 |
| Bachelor's Degree | 14 (38.9%) | 110.0 |
| Graduate Degree | 4 (11.1%) | 121.0 |
| Total | 36 (100.0%) | 99.0 |
Fertility by Education by Marriage Status in Maple Plain
19.4% of women with births in Maple Plain are unmarried. Women with the educational attainment of high school diploma are most likely to be married with 100.0% of them married at childbirth, while women with the educational attainment of college or associate's degree are least likely to be married with 43.8% of them unmarried at childbirth.
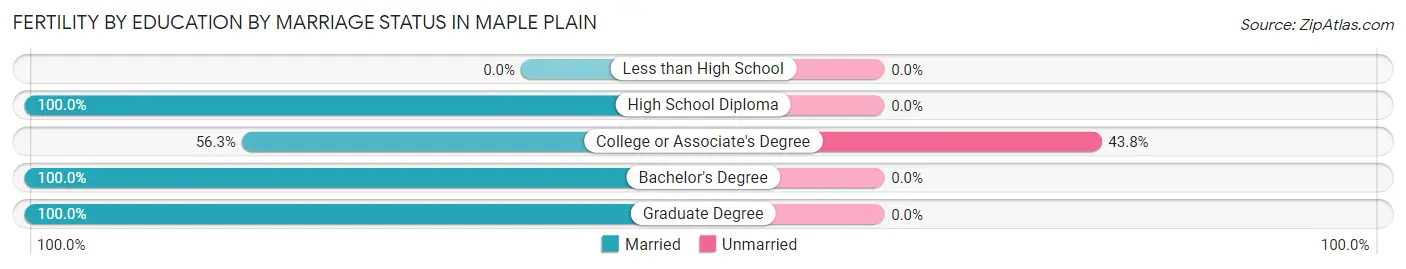
| Educational Attainment | Married | Unmarried |
| Less than High School | 0 (0.0%) | 0 (0.0%) |
| High School Diploma | 2 (100.0%) | 0 (0.0%) |
| College or Associate's Degree | 9 (56.2%) | 7 (43.8%) |
| Bachelor's Degree | 14 (100.0%) | 0 (0.0%) |
| Graduate Degree | 4 (100.0%) | 0 (0.0%) |
| Total | 29 (80.6%) | 7 (19.4%) |
Employment Characteristics in Maple Plain
Employment by Class of Employer in Maple Plain
Among the 828 employed individuals in Maple Plain, private company employees (617 | 74.5%), not-for-profit organizations (78 | 9.4%), and local government employees (72 | 8.7%) make up the most common classes of employment.
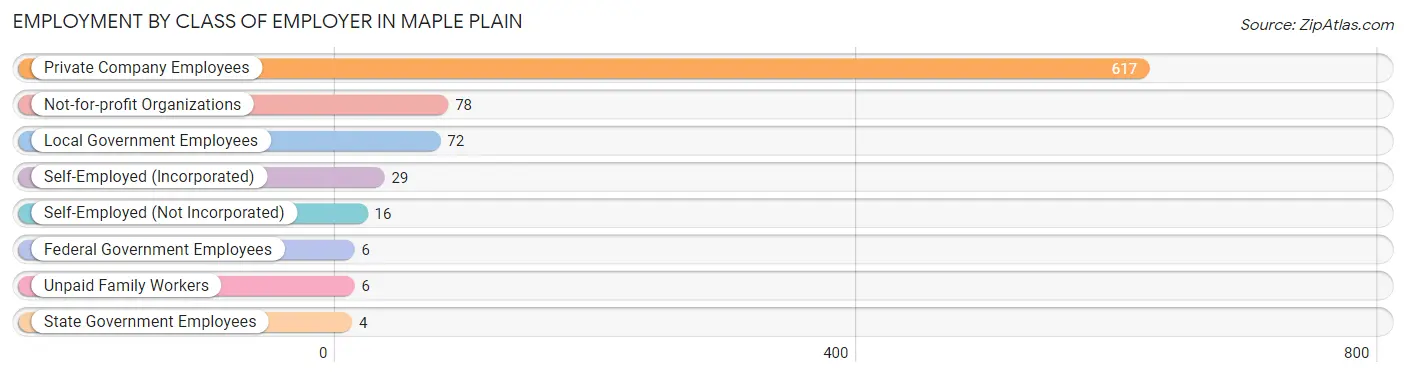
| Employer Class | # Employees | % Employees |
| Private Company Employees | 617 | 74.5% |
| Self-Employed (Incorporated) | 29 | 3.5% |
| Self-Employed (Not Incorporated) | 16 | 1.9% |
| Not-for-profit Organizations | 78 | 9.4% |
| Local Government Employees | 72 | 8.7% |
| State Government Employees | 4 | 0.5% |
| Federal Government Employees | 6 | 0.7% |
| Unpaid Family Workers | 6 | 0.7% |
| Total | 828 | 100.0% |
Employment Status by Age in Maple Plain
According to the labor force statistics for Maple Plain, out of the total population over 16 years of age (1,363), 62.6% or 853 individuals are in the labor force, with 2.9% or 25 of them unemployed. The age group with the highest labor force participation rate is 45 to 54 years, with 98.2% or 168 individuals in the labor force. Within the labor force, the 16 to 19 years age range has the highest percentage of unemployed individuals, with 37.0% or 10 of them being unemployed.
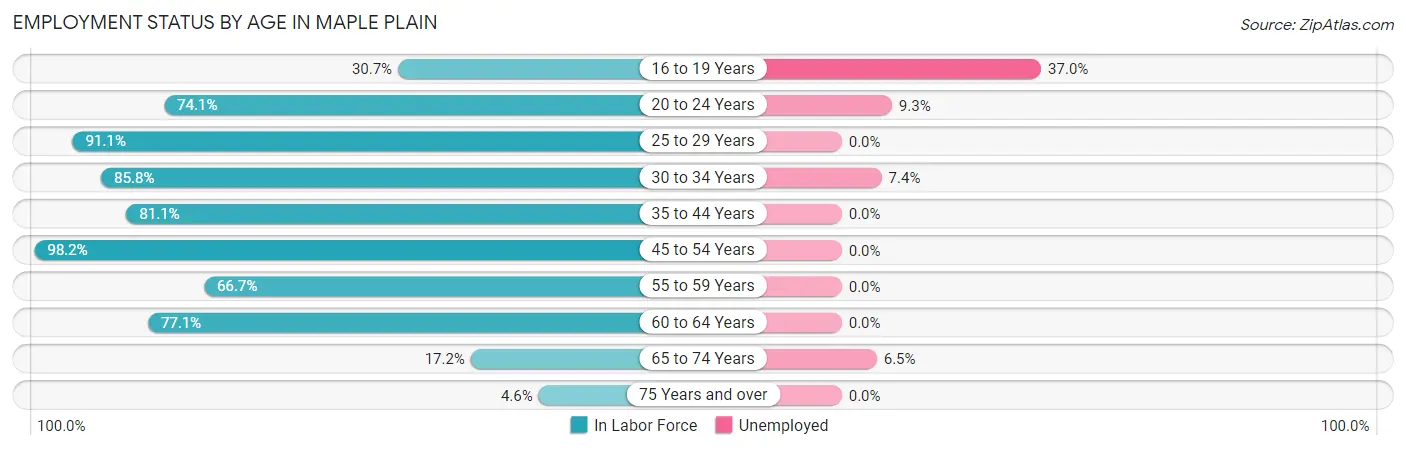
| Age Bracket | In Labor Force | Unemployed |
| 16 to 19 Years | 27 (30.7%) | 10 (37.0%) |
| 20 to 24 Years | 43 (74.1%) | 4 (9.3%) |
| 25 to 29 Years | 72 (91.1%) | 0 (0.0%) |
| 30 to 34 Years | 121 (85.8%) | 9 (7.4%) |
| 35 to 44 Years | 241 (81.1%) | 0 (0.0%) |
| 45 to 54 Years | 168 (98.2%) | 0 (0.0%) |
| 55 to 59 Years | 62 (66.7%) | 0 (0.0%) |
| 60 to 64 Years | 81 (77.1%) | 0 (0.0%) |
| 65 to 74 Years | 31 (17.2%) | 2 (6.5%) |
| 75 Years and over | 7 (4.6%) | 0 (0.0%) |
| Total | 853 (62.6%) | 25 (2.9%) |
Employment Status by Educational Attainment in Maple Plain
According to labor force statistics for Maple Plain, 84.1% of individuals (745) out of the total population between 25 and 64 years of age (886) are in the labor force, with 1.2% or 9 of them being unemployed. The group with the highest labor force participation rate are those with the educational attainment of bachelor's degree or higher, with 96.9% or 346 individuals in the labor force. Within the labor force, individuals with college / associate degree education have the highest percentage of unemployment, with 1.7% or 4 of them being unemployed.
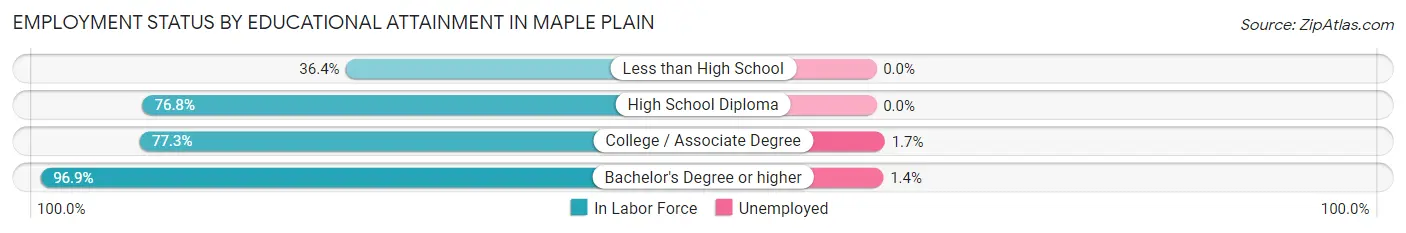
| Educational Attainment | In Labor Force | Unemployed |
| Less than High School | 8 (36.4%) | 0 (0.0%) |
| High School Diploma | 152 (76.8%) | 0 (0.0%) |
| College / Associate Degree | 239 (77.3%) | 5 (1.7%) |
| Bachelor's Degree or higher | 346 (96.9%) | 5 (1.4%) |
| Total | 745 (84.1%) | 11 (1.2%) |
Employment Occupations by Sex in Maple Plain
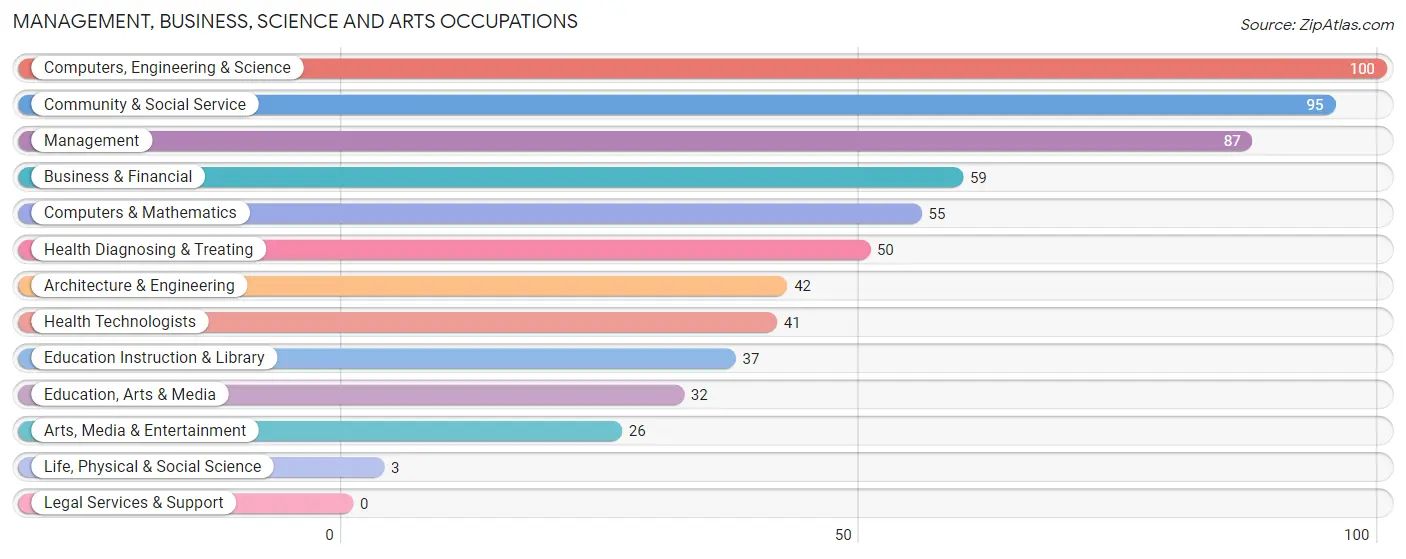
Management, Business, Science and Arts Occupations
The most common Management, Business, Science and Arts occupations in Maple Plain are Computers, Engineering & Science (100 | 12.1%), Community & Social Service (95 | 11.5%), Management (87 | 10.5%), Business & Financial (59 | 7.1%), and Computers & Mathematics (55 | 6.6%).
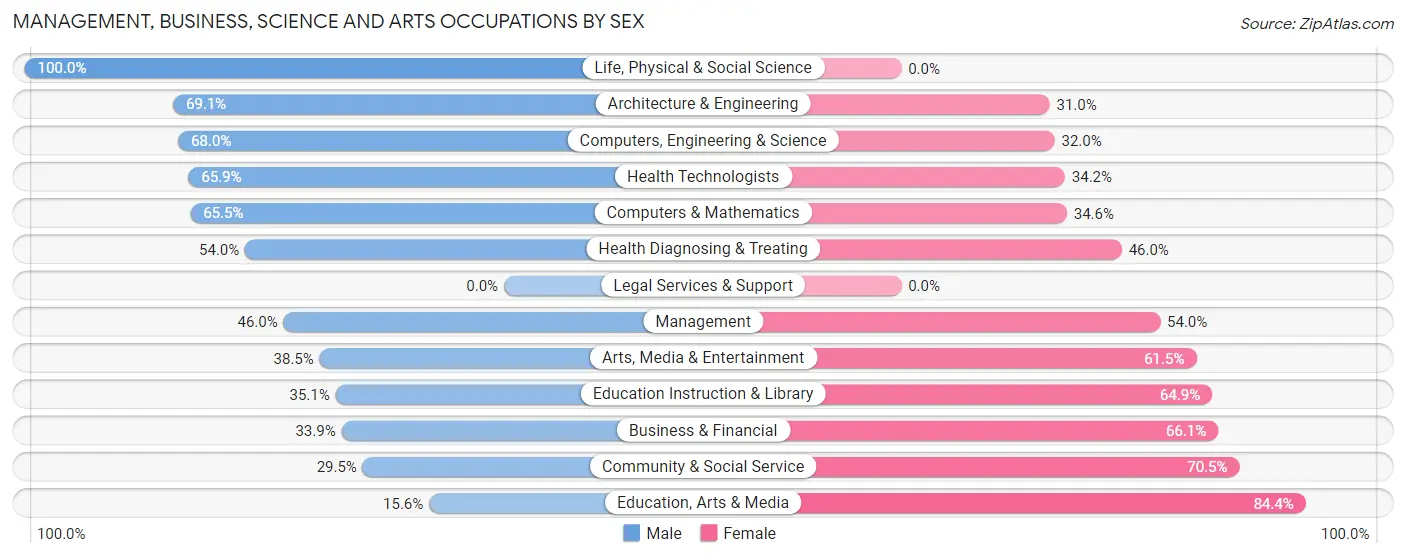
Management, Business, Science and Arts Occupations by Sex
Within the Management, Business, Science and Arts occupations in Maple Plain, the most male-oriented occupations are Life, Physical & Social Science (100.0%), Architecture & Engineering (69.1%), and Computers, Engineering & Science (68.0%), while the most female-oriented occupations are Education, Arts & Media (84.4%), Community & Social Service (70.5%), and Business & Financial (66.1%).
| Occupation | Male | Female |
| Management | 40 (46.0%) | 47 (54.0%) |
| Business & Financial | 20 (33.9%) | 39 (66.1%) |
| Computers, Engineering & Science | 68 (68.0%) | 32 (32.0%) |
| Computers & Mathematics | 36 (65.4%) | 19 (34.5%) |
| Architecture & Engineering | 29 (69.1%) | 13 (30.9%) |
| Life, Physical & Social Science | 3 (100.0%) | 0 (0.0%) |
| Community & Social Service | 28 (29.5%) | 67 (70.5%) |
| Education, Arts & Media | 5 (15.6%) | 27 (84.4%) |
| Legal Services & Support | 0 (0.0%) | 0 (0.0%) |
| Education Instruction & Library | 13 (35.1%) | 24 (64.9%) |
| Arts, Media & Entertainment | 10 (38.5%) | 16 (61.5%) |
| Health Diagnosing & Treating | 27 (54.0%) | 23 (46.0%) |
| Health Technologists | 27 (65.8%) | 14 (34.2%) |
| Total (Category) | 183 (46.8%) | 208 (53.2%) |
| Total (Overall) | 446 (53.9%) | 382 (46.1%) |
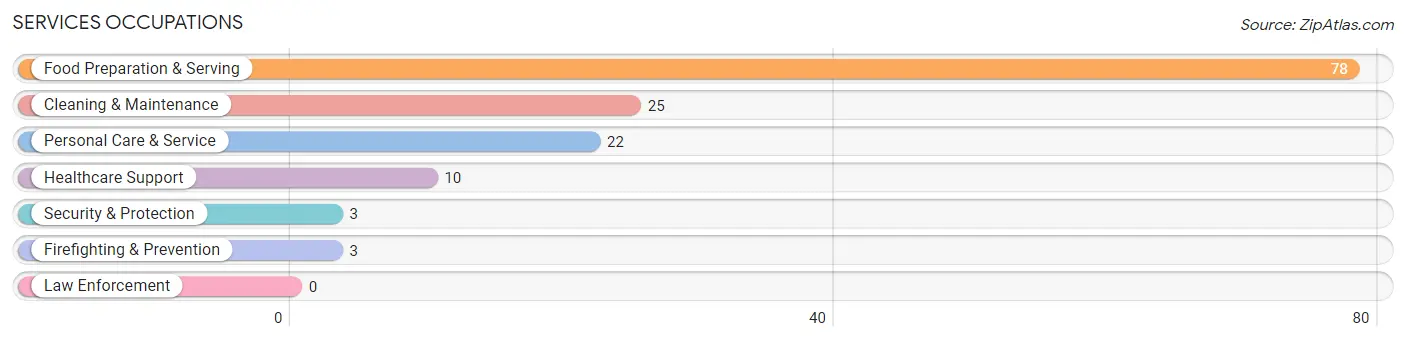
Services Occupations
The most common Services occupations in Maple Plain are Food Preparation & Serving (78 | 9.4%), Cleaning & Maintenance (25 | 3.0%), Personal Care & Service (22 | 2.7%), Healthcare Support (10 | 1.2%), and Security & Protection (3 | 0.4%).
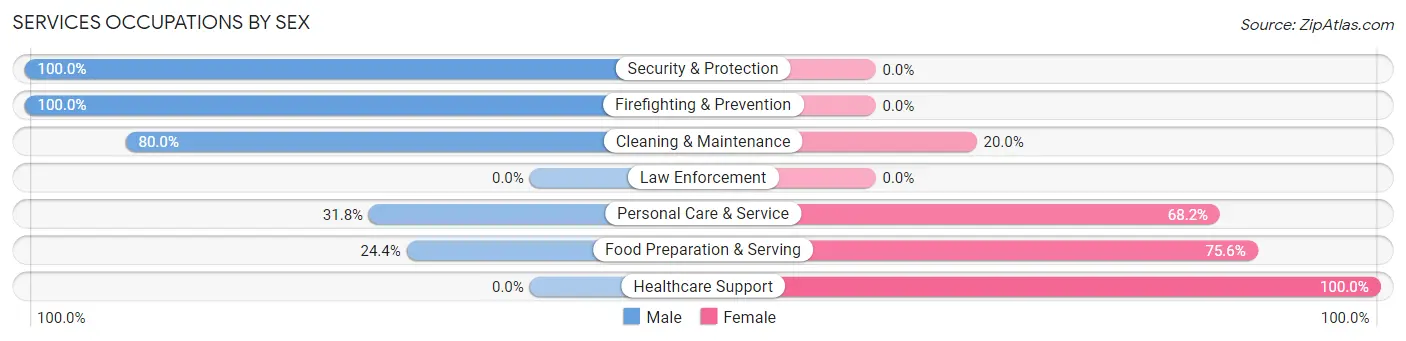
Services Occupations by Sex
Within the Services occupations in Maple Plain, the most male-oriented occupations are Security & Protection (100.0%), Firefighting & Prevention (100.0%), and Cleaning & Maintenance (80.0%), while the most female-oriented occupations are Healthcare Support (100.0%), Food Preparation & Serving (75.6%), and Personal Care & Service (68.2%).
| Occupation | Male | Female |
| Healthcare Support | 0 (0.0%) | 10 (100.0%) |
| Security & Protection | 3 (100.0%) | 0 (0.0%) |
| Firefighting & Prevention | 3 (100.0%) | 0 (0.0%) |
| Law Enforcement | 0 (0.0%) | 0 (0.0%) |
| Food Preparation & Serving | 19 (24.4%) | 59 (75.6%) |
| Cleaning & Maintenance | 20 (80.0%) | 5 (20.0%) |
| Personal Care & Service | 7 (31.8%) | 15 (68.2%) |
| Total (Category) | 49 (35.5%) | 89 (64.5%) |
| Total (Overall) | 446 (53.9%) | 382 (46.1%) |
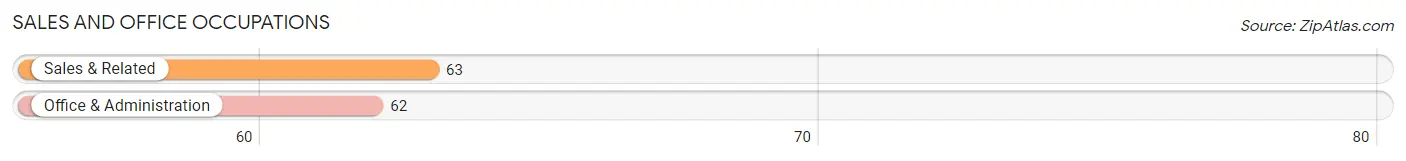
Sales and Office Occupations
The most common Sales and Office occupations in Maple Plain are Sales & Related (63 | 7.6%), and Office & Administration (62 | 7.5%).
Sales and Office Occupations by Sex
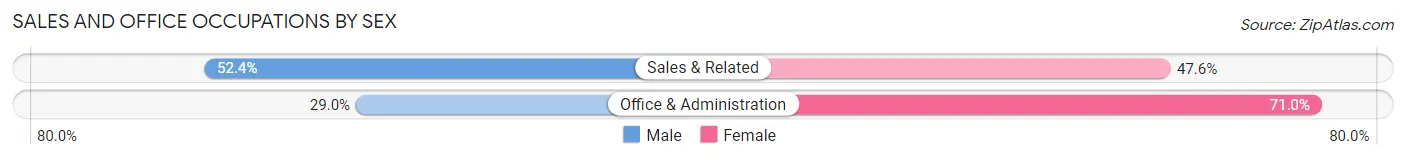
| Occupation | Male | Female |
| Sales & Related | 33 (52.4%) | 30 (47.6%) |
| Office & Administration | 18 (29.0%) | 44 (71.0%) |
| Total (Category) | 51 (40.8%) | 74 (59.2%) |
| Total (Overall) | 446 (53.9%) | 382 (46.1%) |
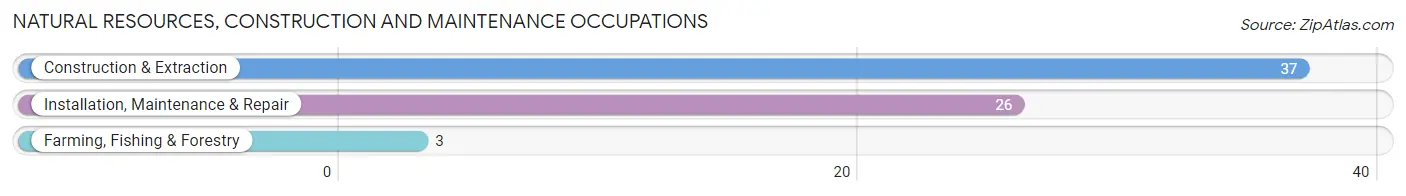
Natural Resources, Construction and Maintenance Occupations
The most common Natural Resources, Construction and Maintenance occupations in Maple Plain are Construction & Extraction (37 | 4.5%), Installation, Maintenance & Repair (26 | 3.1%), and Farming, Fishing & Forestry (3 | 0.4%).
Natural Resources, Construction and Maintenance Occupations by Sex
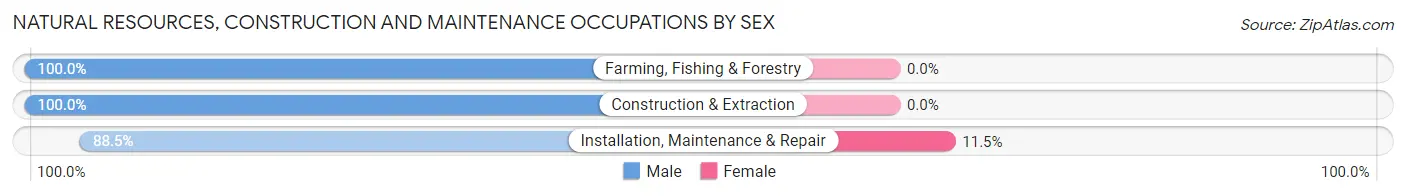
| Occupation | Male | Female |
| Farming, Fishing & Forestry | 3 (100.0%) | 0 (0.0%) |
| Construction & Extraction | 37 (100.0%) | 0 (0.0%) |
| Installation, Maintenance & Repair | 23 (88.5%) | 3 (11.5%) |
| Total (Category) | 63 (95.5%) | 3 (4.5%) |
| Total (Overall) | 446 (53.9%) | 382 (46.1%) |
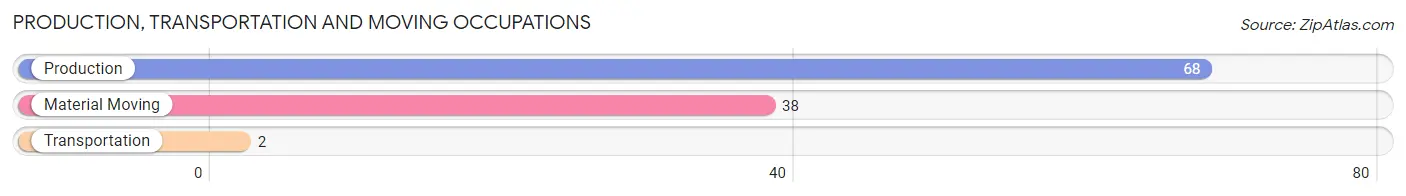
Production, Transportation and Moving Occupations
The most common Production, Transportation and Moving occupations in Maple Plain are Production (68 | 8.2%), Material Moving (38 | 4.6%), and Transportation (2 | 0.2%).
Production, Transportation and Moving Occupations by Sex
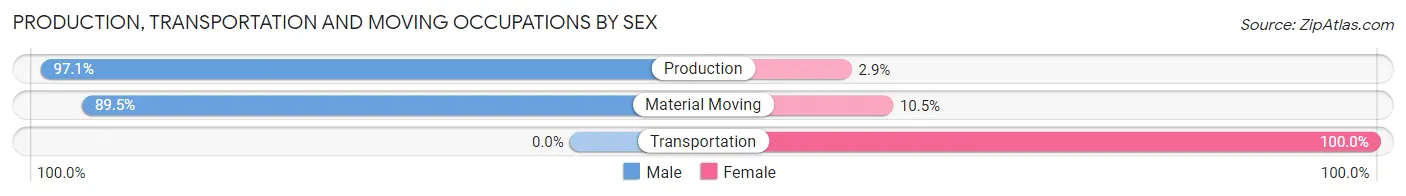
| Occupation | Male | Female |
| Production | 66 (97.1%) | 2 (2.9%) |
| Transportation | 0 (0.0%) | 2 (100.0%) |
| Material Moving | 34 (89.5%) | 4 (10.5%) |
| Total (Category) | 100 (92.6%) | 8 (7.4%) |
| Total (Overall) | 446 (53.9%) | 382 (46.1%) |
Employment Industries by Sex in Maple Plain
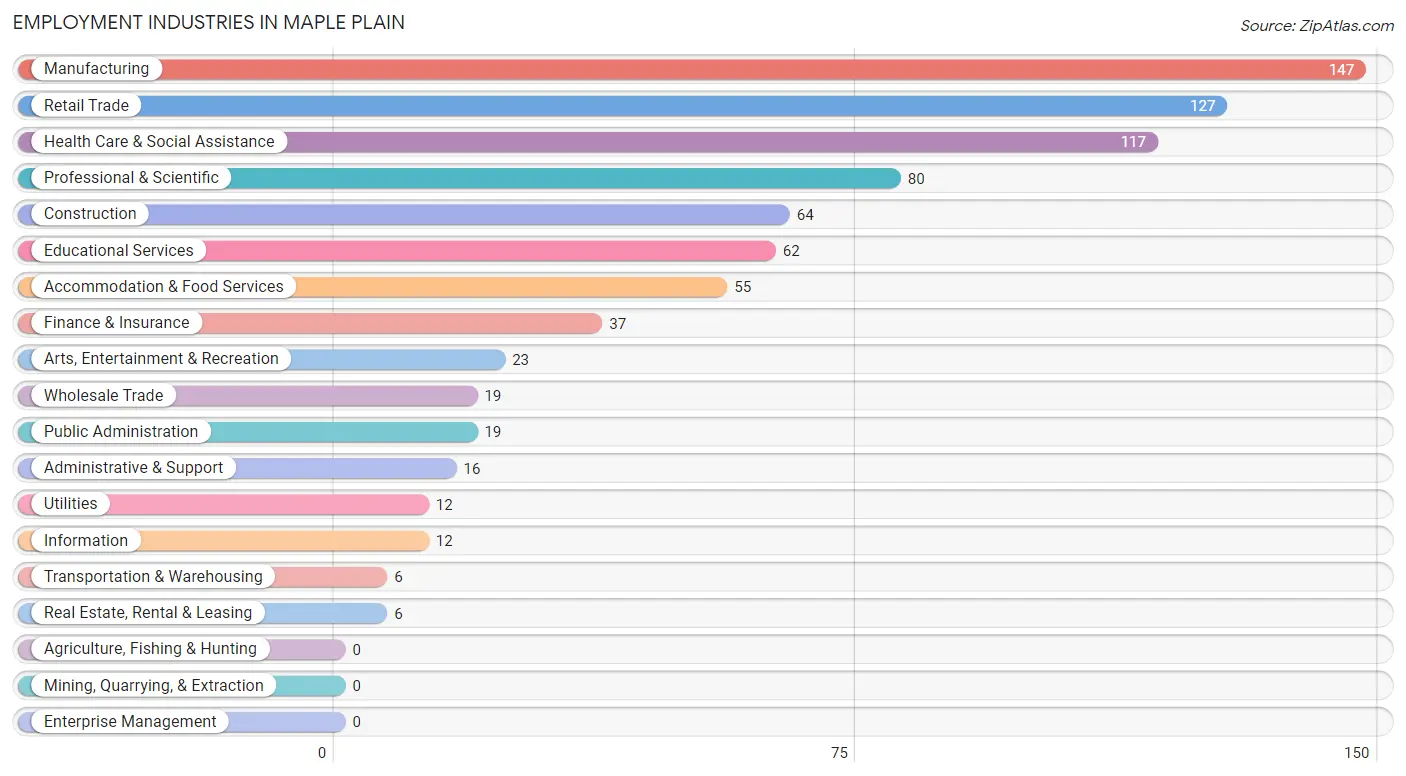
Employment Industries in Maple Plain
The major employment industries in Maple Plain include Manufacturing (147 | 17.7%), Retail Trade (127 | 15.3%), Health Care & Social Assistance (117 | 14.1%), Professional & Scientific (80 | 9.7%), and Construction (64 | 7.7%).
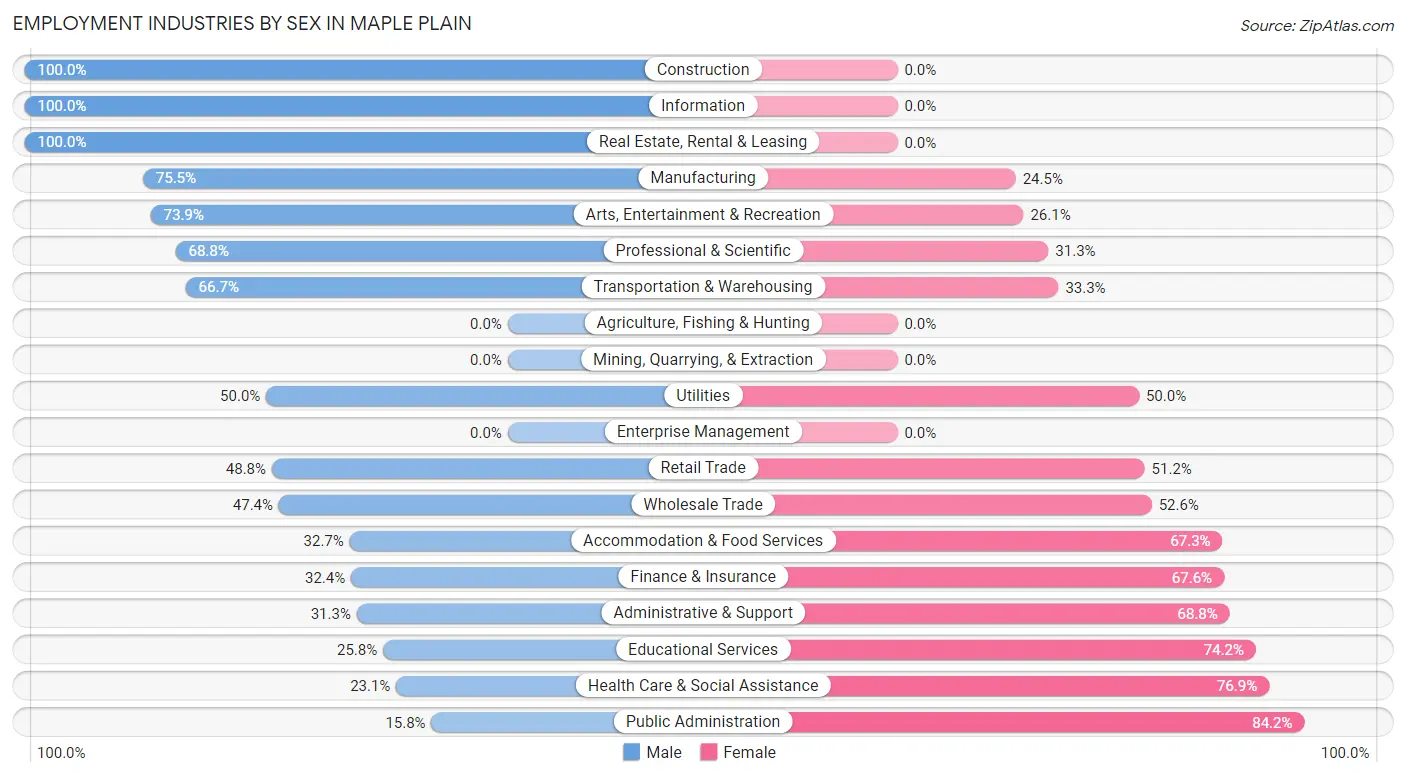
Employment Industries by Sex in Maple Plain
The Maple Plain industries that see more men than women are Construction (100.0%), Information (100.0%), and Real Estate, Rental & Leasing (100.0%), whereas the industries that tend to have a higher number of women are Public Administration (84.2%), Health Care & Social Assistance (76.9%), and Educational Services (74.2%).
| Industry | Male | Female |
| Agriculture, Fishing & Hunting | 0 (0.0%) | 0 (0.0%) |
| Mining, Quarrying, & Extraction | 0 (0.0%) | 0 (0.0%) |
| Construction | 64 (100.0%) | 0 (0.0%) |
| Manufacturing | 111 (75.5%) | 36 (24.5%) |
| Wholesale Trade | 9 (47.4%) | 10 (52.6%) |
| Retail Trade | 62 (48.8%) | 65 (51.2%) |
| Transportation & Warehousing | 4 (66.7%) | 2 (33.3%) |
| Utilities | 6 (50.0%) | 6 (50.0%) |
| Information | 12 (100.0%) | 0 (0.0%) |
| Finance & Insurance | 12 (32.4%) | 25 (67.6%) |
| Real Estate, Rental & Leasing | 6 (100.0%) | 0 (0.0%) |
| Professional & Scientific | 55 (68.8%) | 25 (31.2%) |
| Enterprise Management | 0 (0.0%) | 0 (0.0%) |
| Administrative & Support | 5 (31.2%) | 11 (68.8%) |
| Educational Services | 16 (25.8%) | 46 (74.2%) |
| Health Care & Social Assistance | 27 (23.1%) | 90 (76.9%) |
| Arts, Entertainment & Recreation | 17 (73.9%) | 6 (26.1%) |
| Accommodation & Food Services | 18 (32.7%) | 37 (67.3%) |
| Public Administration | 3 (15.8%) | 16 (84.2%) |
| Total | 446 (53.9%) | 382 (46.1%) |
Education in Maple Plain
School Enrollment in Maple Plain
The most common levels of schooling among the 387 students in Maple Plain are elementary school (127 | 32.8%), high school (110 | 28.4%), and middle school (55 | 14.2%).
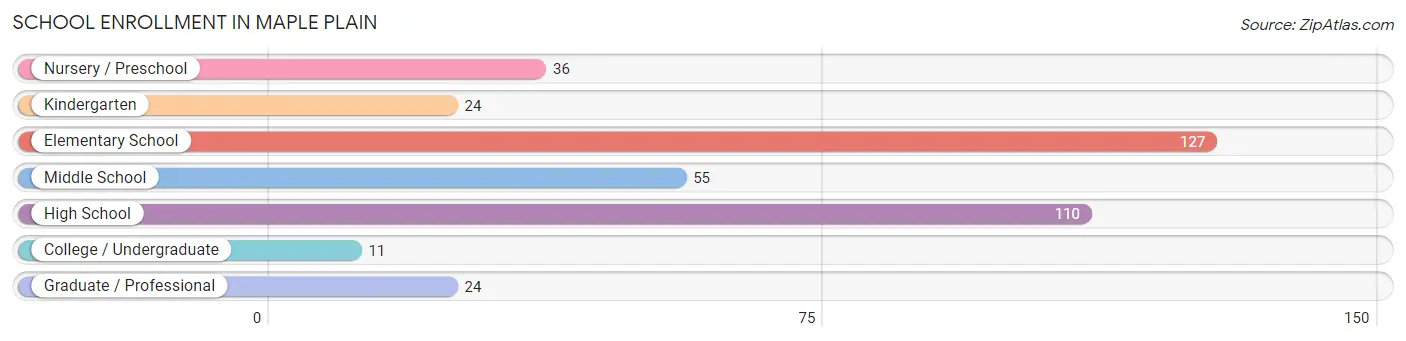
| School Level | # Students | % Students |
| Nursery / Preschool | 36 | 9.3% |
| Kindergarten | 24 | 6.2% |
| Elementary School | 127 | 32.8% |
| Middle School | 55 | 14.2% |
| High School | 110 | 28.4% |
| College / Undergraduate | 11 | 2.8% |
| Graduate / Professional | 24 | 6.2% |
| Total | 387 | 100.0% |
School Enrollment by Age by Funding Source in Maple Plain
Out of a total of 387 students who are enrolled in schools in Maple Plain, 46 (11.9%) attend a private institution, while the remaining 341 (88.1%) are enrolled in public schools. The age group of 25 to 34 year olds has the highest likelihood of being enrolled in private schools, with 10 (100.0% in the age bracket) enrolled. Conversely, the age group of 15 to 17 year olds has the lowest likelihood of being enrolled in a private school, with 68 (100.0% in the age bracket) attending a public institution.
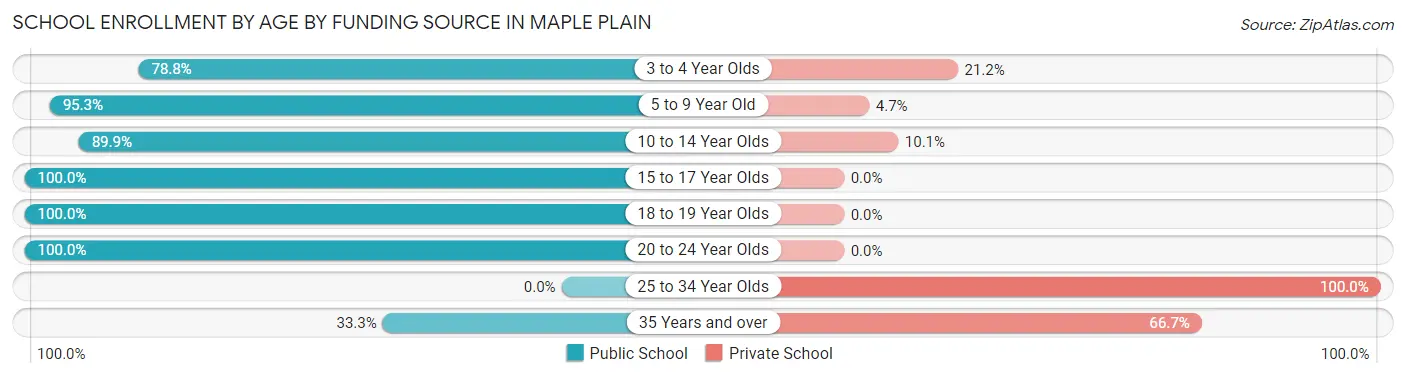
| Age Bracket | Public School | Private School |
| 3 to 4 Year Olds | 26 (78.8%) | 7 (21.2%) |
| 5 to 9 Year Old | 122 (95.3%) | 6 (4.7%) |
| 10 to 14 Year Olds | 98 (89.9%) | 11 (10.1%) |
| 15 to 17 Year Olds | 68 (100.0%) | 0 (0.0%) |
| 18 to 19 Year Olds | 15 (100.0%) | 0 (0.0%) |
| 20 to 24 Year Olds | 6 (100.0%) | 0 (0.0%) |
| 25 to 34 Year Olds | 0 (0.0%) | 10 (100.0%) |
| 35 Years and over | 6 (33.3%) | 12 (66.7%) |
| Total | 341 (88.1%) | 46 (11.9%) |
Educational Attainment by Field of Study in Maple Plain
Business (87 | 18.3%), education (74 | 15.6%), science & technology (51 | 10.7%), arts & humanities (47 | 9.9%), and bio, nature & agricultural (36 | 7.6%) are the most common fields of study among 475 individuals in Maple Plain who have obtained a bachelor's degree or higher.
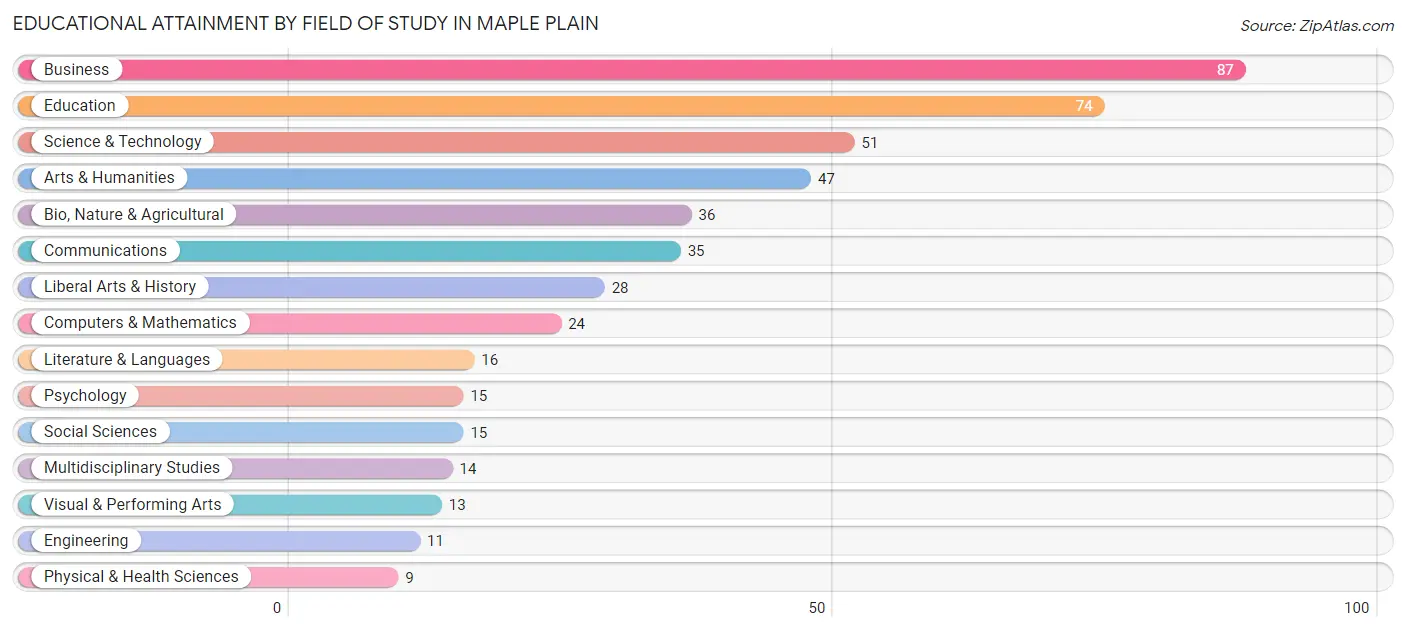
| Field of Study | # Graduates | % Graduates |
| Computers & Mathematics | 24 | 5.1% |
| Bio, Nature & Agricultural | 36 | 7.6% |
| Physical & Health Sciences | 9 | 1.9% |
| Psychology | 15 | 3.2% |
| Social Sciences | 15 | 3.2% |
| Engineering | 11 | 2.3% |
| Multidisciplinary Studies | 14 | 2.9% |
| Science & Technology | 51 | 10.7% |
| Business | 87 | 18.3% |
| Education | 74 | 15.6% |
| Literature & Languages | 16 | 3.4% |
| Liberal Arts & History | 28 | 5.9% |
| Visual & Performing Arts | 13 | 2.7% |
| Communications | 35 | 7.4% |
| Arts & Humanities | 47 | 9.9% |
| Total | 475 | 100.0% |
Transportation & Commute in Maple Plain
Vehicle Availability by Sex in Maple Plain
The most prevalent vehicle ownership categories in Maple Plain are males with 2 vehicles (260, accounting for 58.3%) and females with 2 vehicles (190, making up 68.1%).
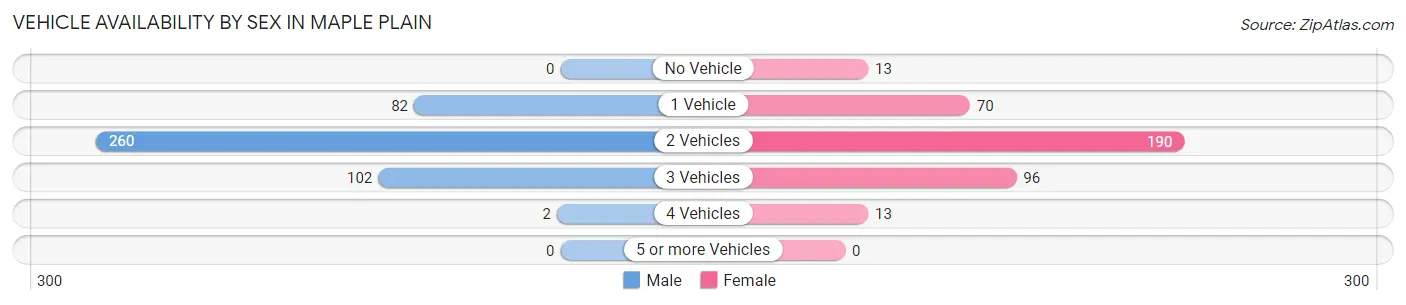
| Vehicles Available | Male | Female |
| No Vehicle | 0 (0.0%) | 13 (3.4%) |
| 1 Vehicle | 82 (18.4%) | 70 (18.3%) |
| 2 Vehicles | 260 (58.3%) | 190 (49.7%) |
| 3 Vehicles | 102 (22.9%) | 96 (25.1%) |
| 4 Vehicles | 2 (0.4%) | 13 (3.4%) |
| 5 or more Vehicles | 0 (0.0%) | 0 (0.0%) |
| Total | 446 (100.0%) | 382 (100.0%) |
Commute Time in Maple Plain
The most frequently occuring commute durations in Maple Plain are 20 to 24 minutes (144 commuters, 19.7%), 25 to 29 minutes (113 commuters, 15.5%), and 15 to 19 minutes (106 commuters, 14.5%).
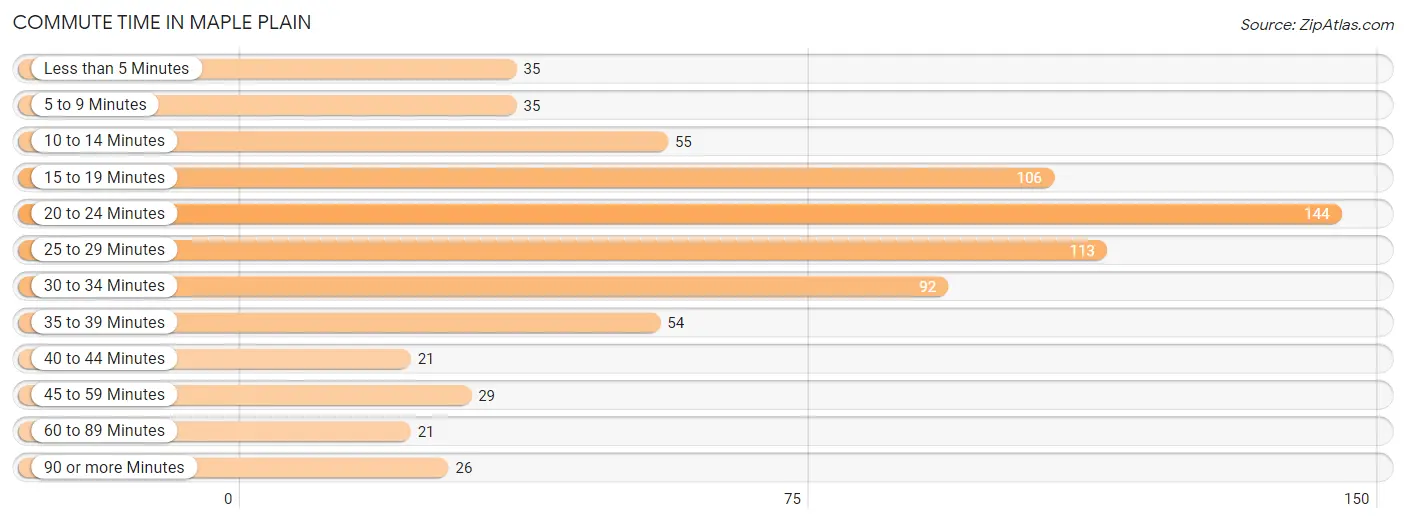
| Commute Time | # Commuters | % Commuters |
| Less than 5 Minutes | 35 | 4.8% |
| 5 to 9 Minutes | 35 | 4.8% |
| 10 to 14 Minutes | 55 | 7.5% |
| 15 to 19 Minutes | 106 | 14.5% |
| 20 to 24 Minutes | 144 | 19.7% |
| 25 to 29 Minutes | 113 | 15.5% |
| 30 to 34 Minutes | 92 | 12.6% |
| 35 to 39 Minutes | 54 | 7.4% |
| 40 to 44 Minutes | 21 | 2.9% |
| 45 to 59 Minutes | 29 | 4.0% |
| 60 to 89 Minutes | 21 | 2.9% |
| 90 or more Minutes | 26 | 3.6% |
Commute Time by Sex in Maple Plain
The most common commute times in Maple Plain are 20 to 24 minutes (75 commuters, 18.5%) for males and 20 to 24 minutes (69 commuters, 21.2%) for females.
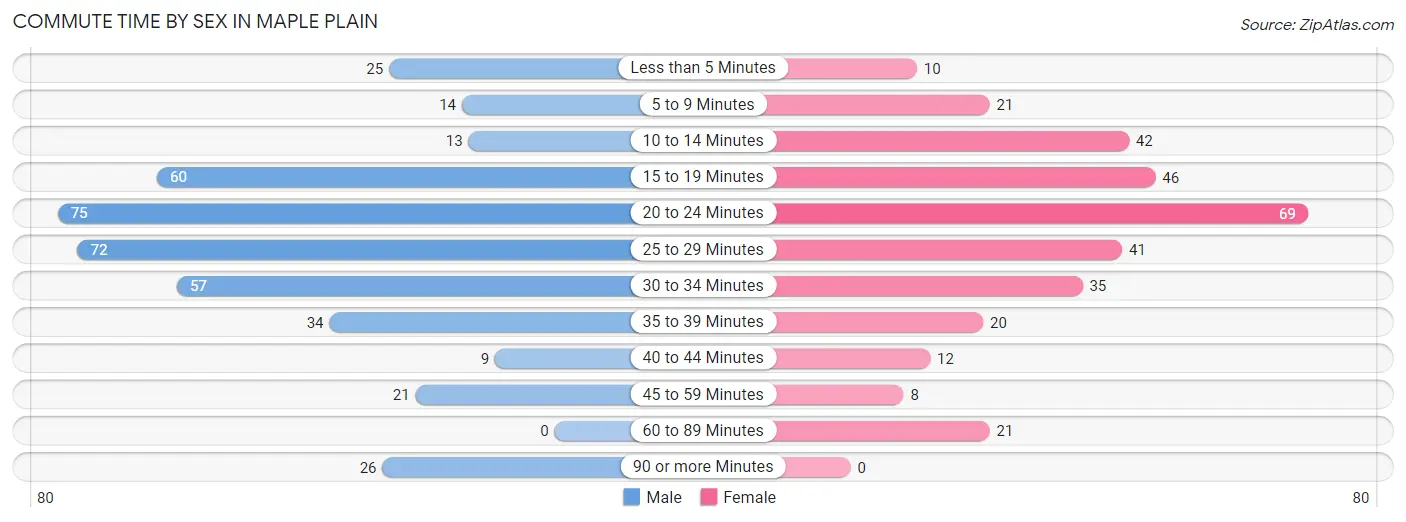
| Commute Time | Male | Female |
| Less than 5 Minutes | 25 (6.2%) | 10 (3.1%) |
| 5 to 9 Minutes | 14 (3.5%) | 21 (6.5%) |
| 10 to 14 Minutes | 13 (3.2%) | 42 (12.9%) |
| 15 to 19 Minutes | 60 (14.8%) | 46 (14.1%) |
| 20 to 24 Minutes | 75 (18.5%) | 69 (21.2%) |
| 25 to 29 Minutes | 72 (17.7%) | 41 (12.6%) |
| 30 to 34 Minutes | 57 (14.0%) | 35 (10.8%) |
| 35 to 39 Minutes | 34 (8.4%) | 20 (6.1%) |
| 40 to 44 Minutes | 9 (2.2%) | 12 (3.7%) |
| 45 to 59 Minutes | 21 (5.2%) | 8 (2.5%) |
| 60 to 89 Minutes | 0 (0.0%) | 21 (6.5%) |
| 90 or more Minutes | 26 (6.4%) | 0 (0.0%) |
Time of Departure to Work by Sex in Maple Plain
The most frequent times of departure to work in Maple Plain are 7:00 AM to 7:29 AM (88, 21.7%) for males and 7:00 AM to 7:29 AM (59, 18.1%) for females.
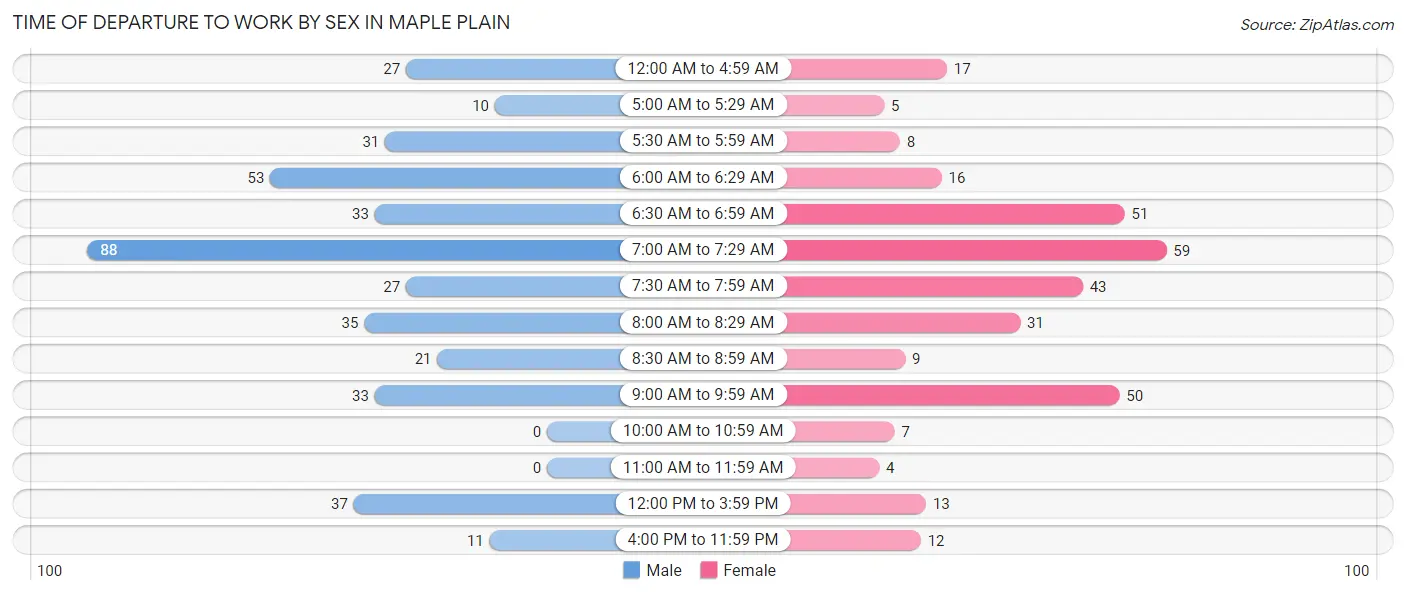
| Time of Departure | Male | Female |
| 12:00 AM to 4:59 AM | 27 (6.7%) | 17 (5.2%) |
| 5:00 AM to 5:29 AM | 10 (2.5%) | 5 (1.5%) |
| 5:30 AM to 5:59 AM | 31 (7.6%) | 8 (2.5%) |
| 6:00 AM to 6:29 AM | 53 (13.1%) | 16 (4.9%) |
| 6:30 AM to 6:59 AM | 33 (8.1%) | 51 (15.7%) |
| 7:00 AM to 7:29 AM | 88 (21.7%) | 59 (18.1%) |
| 7:30 AM to 7:59 AM | 27 (6.7%) | 43 (13.2%) |
| 8:00 AM to 8:29 AM | 35 (8.6%) | 31 (9.5%) |
| 8:30 AM to 8:59 AM | 21 (5.2%) | 9 (2.8%) |
| 9:00 AM to 9:59 AM | 33 (8.1%) | 50 (15.4%) |
| 10:00 AM to 10:59 AM | 0 (0.0%) | 7 (2.1%) |
| 11:00 AM to 11:59 AM | 0 (0.0%) | 4 (1.2%) |
| 12:00 PM to 3:59 PM | 37 (9.1%) | 13 (4.0%) |
| 4:00 PM to 11:59 PM | 11 (2.7%) | 12 (3.7%) |
| Total | 406 (100.0%) | 325 (100.0%) |
Housing Occupancy in Maple Plain
Occupancy by Ownership in Maple Plain
Of the total 756 dwellings in Maple Plain, owner-occupied units account for 426 (56.4%), while renter-occupied units make up 330 (43.6%).
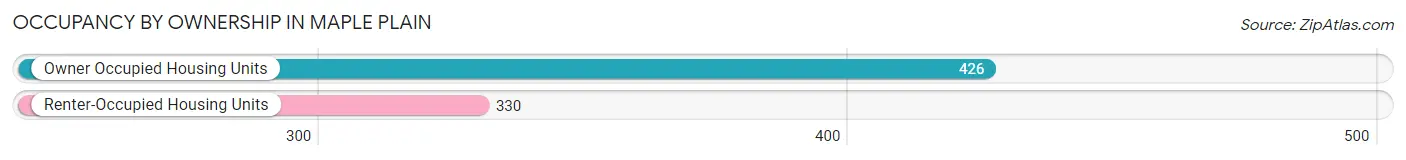
| Occupancy | # Housing Units | % Housing Units |
| Owner Occupied Housing Units | 426 | 56.4% |
| Renter-Occupied Housing Units | 330 | 43.6% |
| Total Occupied Housing Units | 756 | 100.0% |
Occupancy by Household Size in Maple Plain
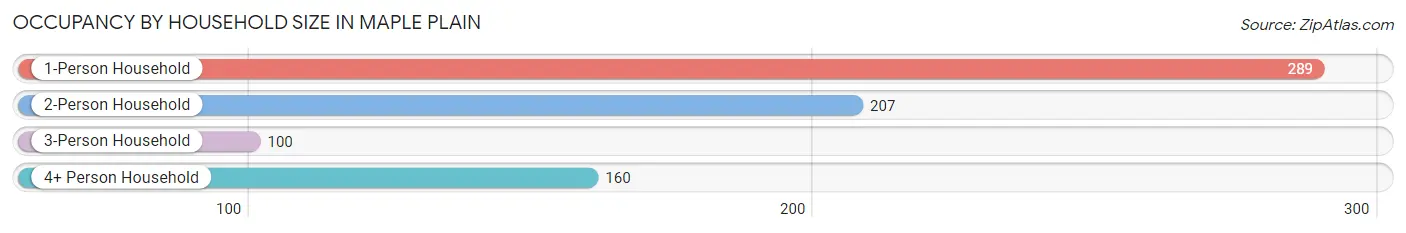
| Household Size | # Housing Units | % Housing Units |
| 1-Person Household | 289 | 38.2% |
| 2-Person Household | 207 | 27.4% |
| 3-Person Household | 100 | 13.2% |
| 4+ Person Household | 160 | 21.2% |
| Total Housing Units | 756 | 100.0% |
Occupancy by Ownership by Household Size in Maple Plain
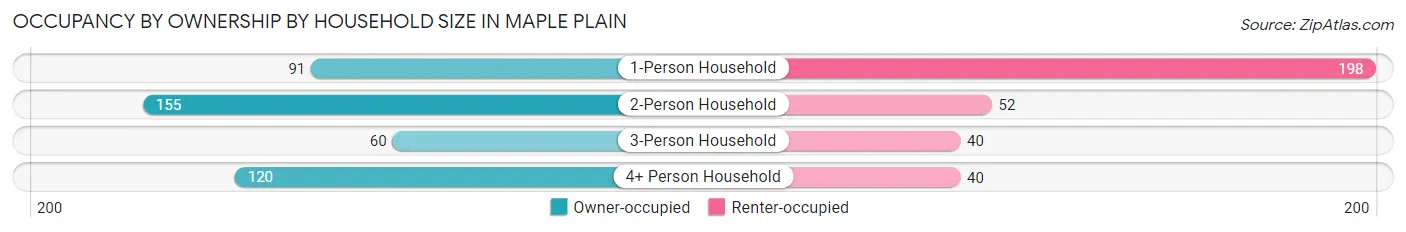
| Household Size | Owner-occupied | Renter-occupied |
| 1-Person Household | 91 (31.5%) | 198 (68.5%) |
| 2-Person Household | 155 (74.9%) | 52 (25.1%) |
| 3-Person Household | 60 (60.0%) | 40 (40.0%) |
| 4+ Person Household | 120 (75.0%) | 40 (25.0%) |
| Total Housing Units | 426 (56.4%) | 330 (43.6%) |
Occupancy by Educational Attainment in Maple Plain
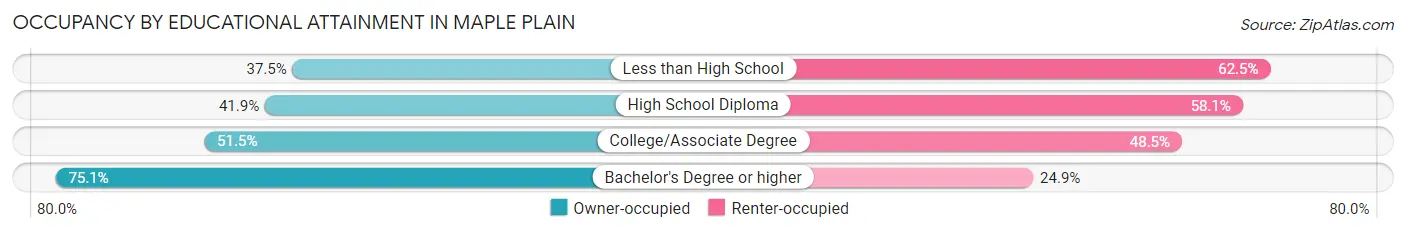
| Household Size | Owner-occupied | Renter-occupied |
| Less than High School | 12 (37.5%) | 20 (62.5%) |
| High School Diploma | 85 (41.9%) | 118 (58.1%) |
| College/Associate Degree | 136 (51.5%) | 128 (48.5%) |
| Bachelor's Degree or higher | 193 (75.1%) | 64 (24.9%) |
Occupancy by Age of Householder in Maple Plain
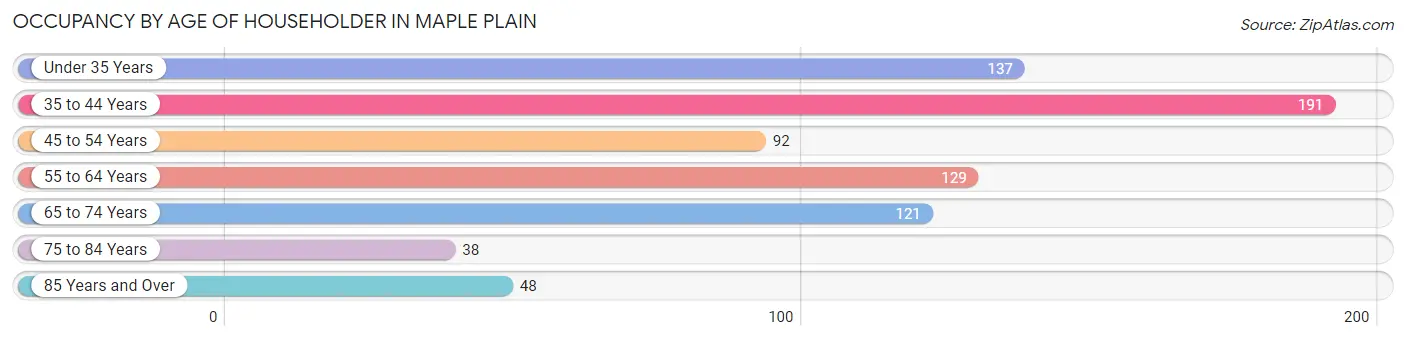
| Age Bracket | # Households | % Households |
| Under 35 Years | 137 | 18.1% |
| 35 to 44 Years | 191 | 25.3% |
| 45 to 54 Years | 92 | 12.2% |
| 55 to 64 Years | 129 | 17.1% |
| 65 to 74 Years | 121 | 16.0% |
| 75 to 84 Years | 38 | 5.0% |
| 85 Years and Over | 48 | 6.4% |
| Total | 756 | 100.0% |
Housing Finances in Maple Plain
Median Income by Occupancy in Maple Plain
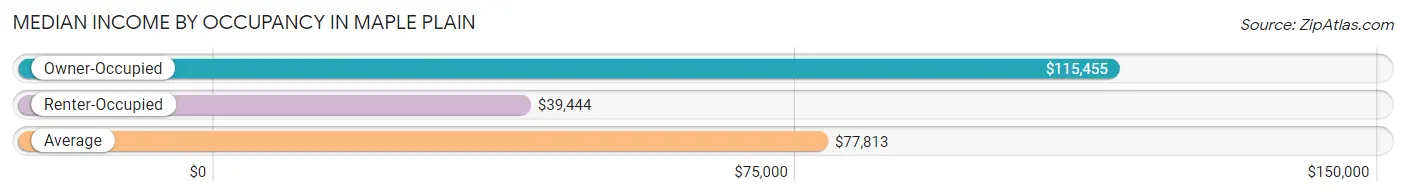
| Occupancy Type | # Households | Median Income |
| Owner-Occupied | 426 (56.4%) | $115,455 |
| Renter-Occupied | 330 (43.6%) | $39,444 |
| Average | 756 (100.0%) | $77,813 |
Occupancy by Householder Income Bracket in Maple Plain
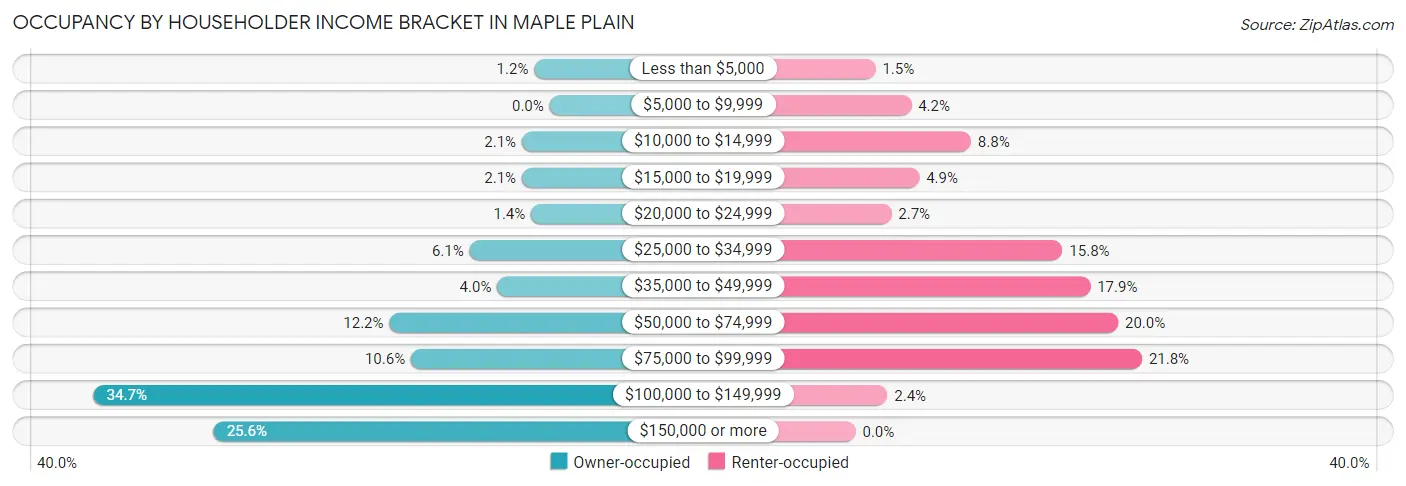
| Income Bracket | Owner-occupied | Renter-occupied |
| Less than $5,000 | 5 (1.2%) | 5 (1.5%) |
| $5,000 to $9,999 | 0 (0.0%) | 14 (4.2%) |
| $10,000 to $14,999 | 9 (2.1%) | 29 (8.8%) |
| $15,000 to $19,999 | 9 (2.1%) | 16 (4.9%) |
| $20,000 to $24,999 | 6 (1.4%) | 9 (2.7%) |
| $25,000 to $34,999 | 26 (6.1%) | 52 (15.8%) |
| $35,000 to $49,999 | 17 (4.0%) | 59 (17.9%) |
| $50,000 to $74,999 | 52 (12.2%) | 66 (20.0%) |
| $75,000 to $99,999 | 45 (10.6%) | 72 (21.8%) |
| $100,000 to $149,999 | 148 (34.7%) | 8 (2.4%) |
| $150,000 or more | 109 (25.6%) | 0 (0.0%) |
| Total | 426 (100.0%) | 330 (100.0%) |
Monthly Housing Cost Tiers in Maple Plain
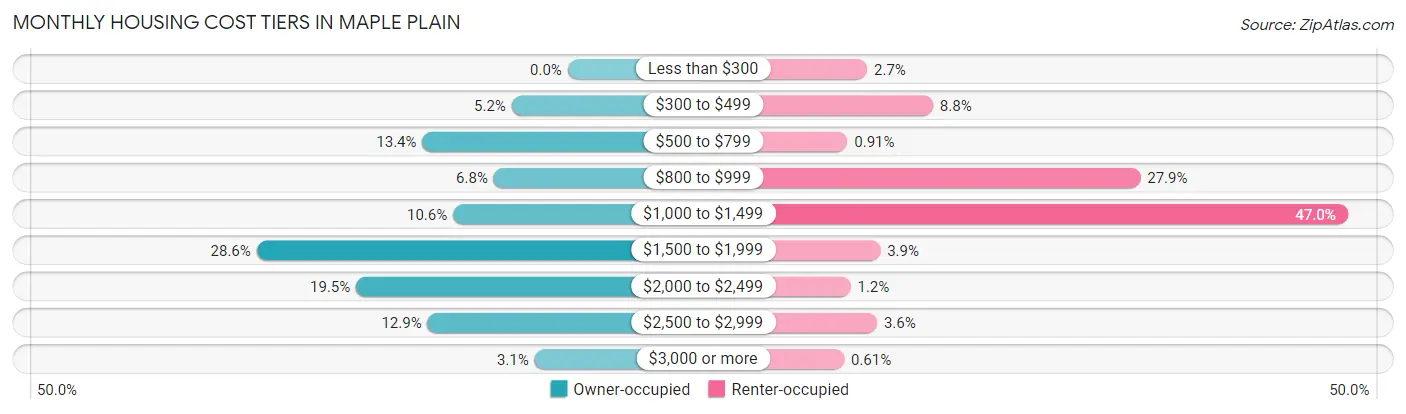
| Monthly Cost | Owner-occupied | Renter-occupied |
| Less than $300 | 0 (0.0%) | 9 (2.7%) |
| $300 to $499 | 22 (5.2%) | 29 (8.8%) |
| $500 to $799 | 57 (13.4%) | 3 (0.9%) |
| $800 to $999 | 29 (6.8%) | 92 (27.9%) |
| $1,000 to $1,499 | 45 (10.6%) | 155 (47.0%) |
| $1,500 to $1,999 | 122 (28.6%) | 13 (3.9%) |
| $2,000 to $2,499 | 83 (19.5%) | 4 (1.2%) |
| $2,500 to $2,999 | 55 (12.9%) | 12 (3.6%) |
| $3,000 or more | 13 (3.0%) | 2 (0.6%) |
| Total | 426 (100.0%) | 330 (100.0%) |
Physical Housing Characteristics in Maple Plain
Housing Structures in Maple Plain
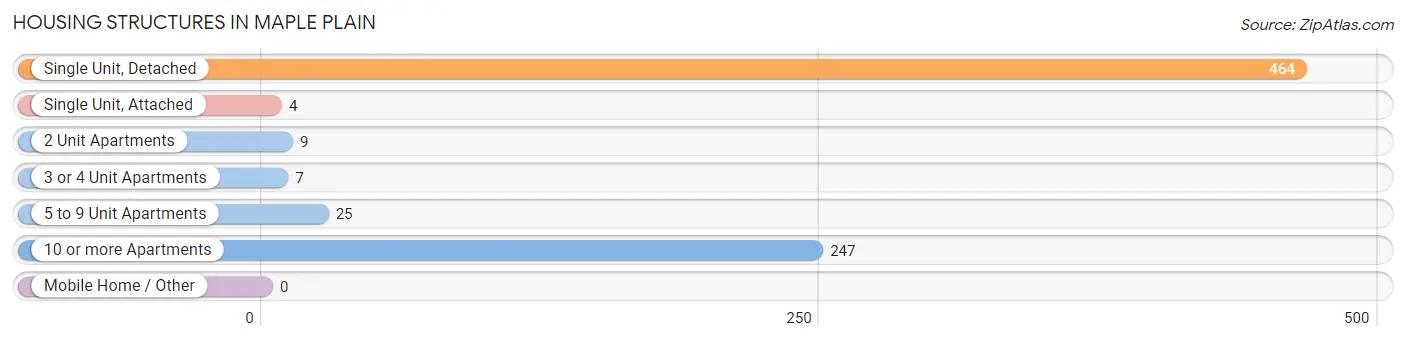
| Structure Type | # Housing Units | % Housing Units |
| Single Unit, Detached | 464 | 61.4% |
| Single Unit, Attached | 4 | 0.5% |
| 2 Unit Apartments | 9 | 1.2% |
| 3 or 4 Unit Apartments | 7 | 0.9% |
| 5 to 9 Unit Apartments | 25 | 3.3% |
| 10 or more Apartments | 247 | 32.7% |
| Mobile Home / Other | 0 | 0.0% |
| Total | 756 | 100.0% |
Housing Structures by Occupancy in Maple Plain
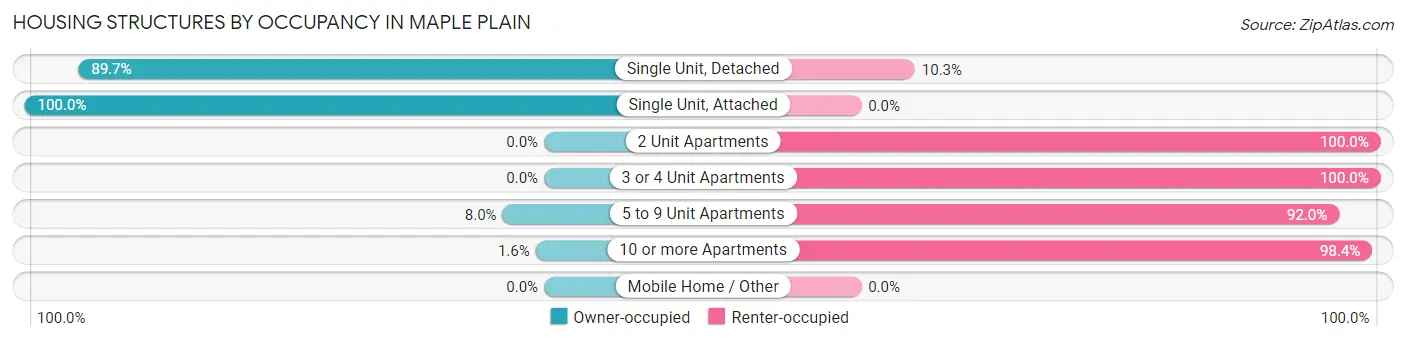
| Structure Type | Owner-occupied | Renter-occupied |
| Single Unit, Detached | 416 (89.7%) | 48 (10.3%) |
| Single Unit, Attached | 4 (100.0%) | 0 (0.0%) |
| 2 Unit Apartments | 0 (0.0%) | 9 (100.0%) |
| 3 or 4 Unit Apartments | 0 (0.0%) | 7 (100.0%) |
| 5 to 9 Unit Apartments | 2 (8.0%) | 23 (92.0%) |
| 10 or more Apartments | 4 (1.6%) | 243 (98.4%) |
| Mobile Home / Other | 0 (0.0%) | 0 (0.0%) |
| Total | 426 (56.4%) | 330 (43.6%) |
Housing Structures by Number of Rooms in Maple Plain
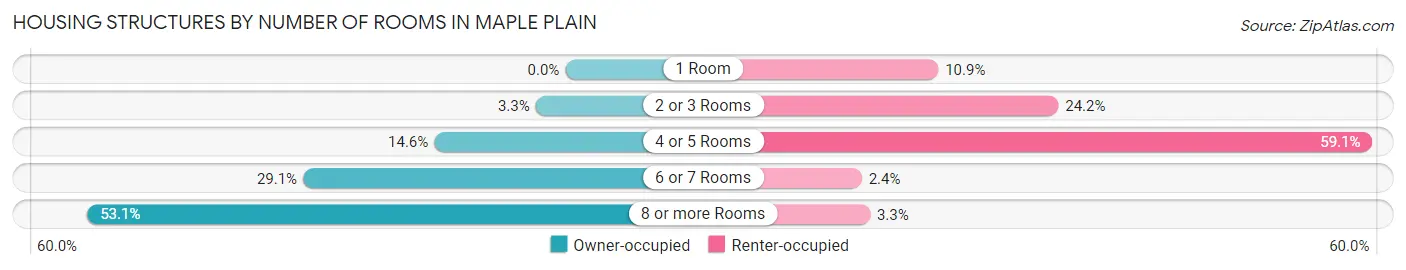
| Number of Rooms | Owner-occupied | Renter-occupied |
| 1 Room | 0 (0.0%) | 36 (10.9%) |
| 2 or 3 Rooms | 14 (3.3%) | 80 (24.2%) |
| 4 or 5 Rooms | 62 (14.5%) | 195 (59.1%) |
| 6 or 7 Rooms | 124 (29.1%) | 8 (2.4%) |
| 8 or more Rooms | 226 (53.0%) | 11 (3.3%) |
| Total | 426 (100.0%) | 330 (100.0%) |
Housing Structure by Heating Type in Maple Plain
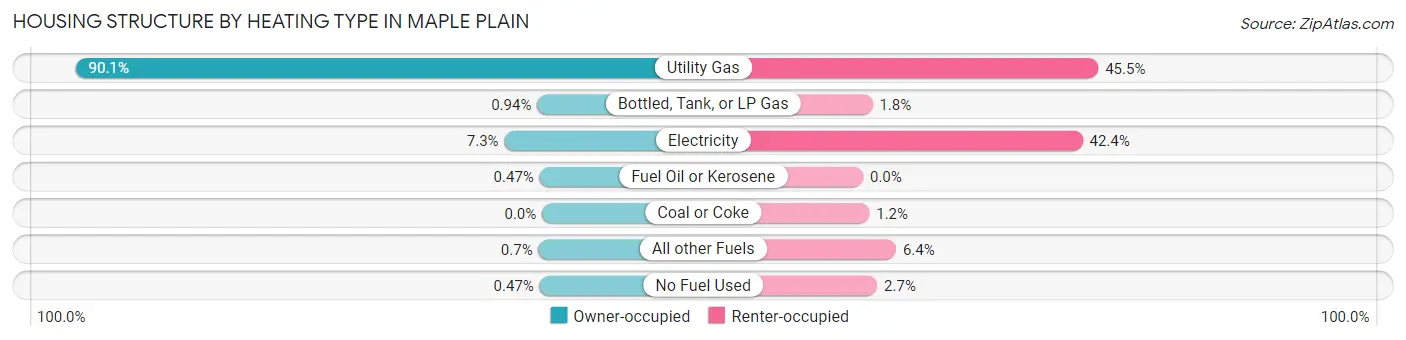
| Heating Type | Owner-occupied | Renter-occupied |
| Utility Gas | 384 (90.1%) | 150 (45.5%) |
| Bottled, Tank, or LP Gas | 4 (0.9%) | 6 (1.8%) |
| Electricity | 31 (7.3%) | 140 (42.4%) |
| Fuel Oil or Kerosene | 2 (0.5%) | 0 (0.0%) |
| Coal or Coke | 0 (0.0%) | 4 (1.2%) |
| All other Fuels | 3 (0.7%) | 21 (6.4%) |
| No Fuel Used | 2 (0.5%) | 9 (2.7%) |
| Total | 426 (100.0%) | 330 (100.0%) |
Household Vehicle Usage in Maple Plain
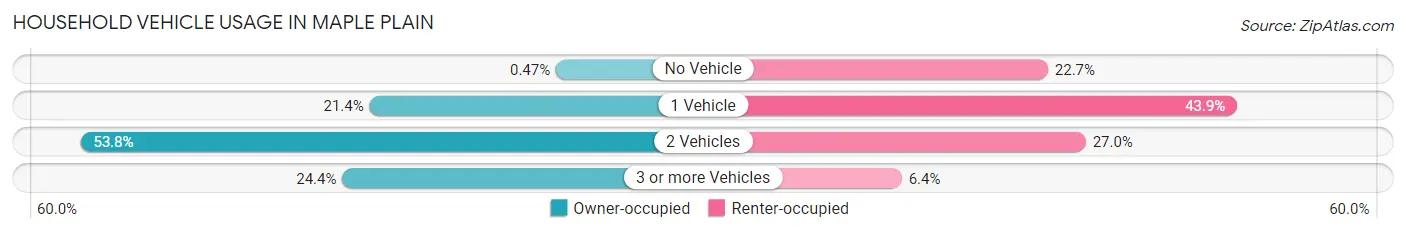
| Vehicles per Household | Owner-occupied | Renter-occupied |
| No Vehicle | 2 (0.5%) | 75 (22.7%) |
| 1 Vehicle | 91 (21.4%) | 145 (43.9%) |
| 2 Vehicles | 229 (53.8%) | 89 (27.0%) |
| 3 or more Vehicles | 104 (24.4%) | 21 (6.4%) |
| Total | 426 (100.0%) | 330 (100.0%) |
Real Estate & Mortgages in Maple Plain
Real Estate and Mortgage Overview in Maple Plain
| Characteristic | Without Mortgage | With Mortgage |
| Housing Units | 121 | 305 |
| Median Property Value | $298,500 | $310,300 |
| Median Household Income | $95,625 | $79 |
| Monthly Housing Costs | $714 | $13 |
| Real Estate Taxes | $3,741 | $8 |
Property Value by Mortgage Status in Maple Plain
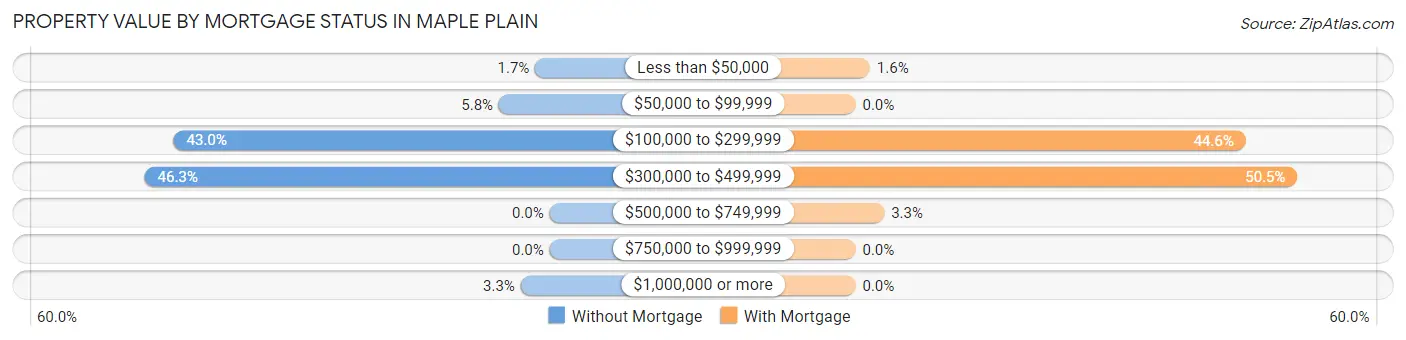
| Property Value | Without Mortgage | With Mortgage |
| Less than $50,000 | 2 (1.7%) | 5 (1.6%) |
| $50,000 to $99,999 | 7 (5.8%) | 0 (0.0%) |
| $100,000 to $299,999 | 52 (43.0%) | 136 (44.6%) |
| $300,000 to $499,999 | 56 (46.3%) | 154 (50.5%) |
| $500,000 to $749,999 | 0 (0.0%) | 10 (3.3%) |
| $750,000 to $999,999 | 0 (0.0%) | 0 (0.0%) |
| $1,000,000 or more | 4 (3.3%) | 0 (0.0%) |
| Total | 121 (100.0%) | 305 (100.0%) |
Household Income by Mortgage Status in Maple Plain
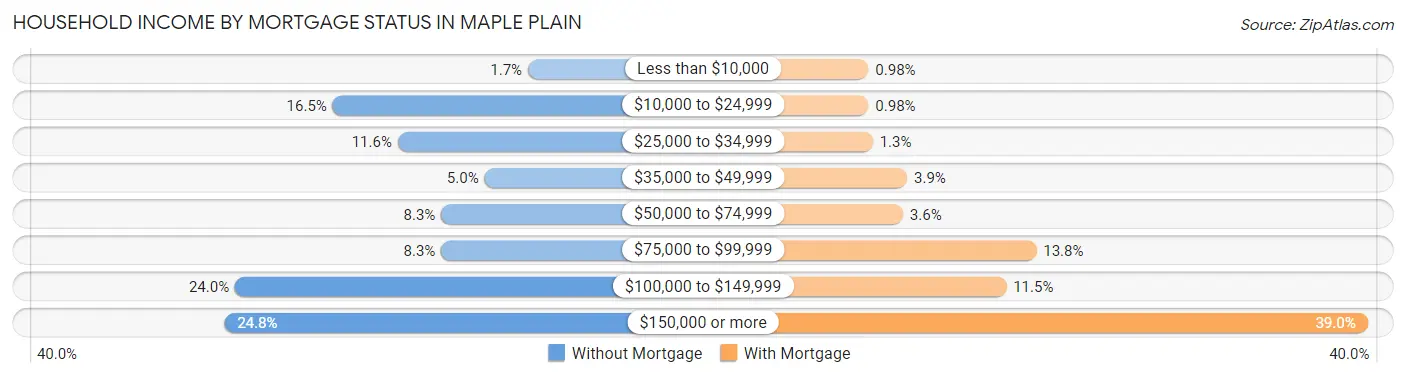
| Household Income | Without Mortgage | With Mortgage |
| Less than $10,000 | 2 (1.7%) | 3 (1.0%) |
| $10,000 to $24,999 | 20 (16.5%) | 3 (1.0%) |
| $25,000 to $34,999 | 14 (11.6%) | 4 (1.3%) |
| $35,000 to $49,999 | 6 (5.0%) | 12 (3.9%) |
| $50,000 to $74,999 | 10 (8.3%) | 11 (3.6%) |
| $75,000 to $99,999 | 10 (8.3%) | 42 (13.8%) |
| $100,000 to $149,999 | 29 (24.0%) | 35 (11.5%) |
| $150,000 or more | 30 (24.8%) | 119 (39.0%) |
| Total | 121 (100.0%) | 305 (100.0%) |
Property Value to Household Income Ratio in Maple Plain
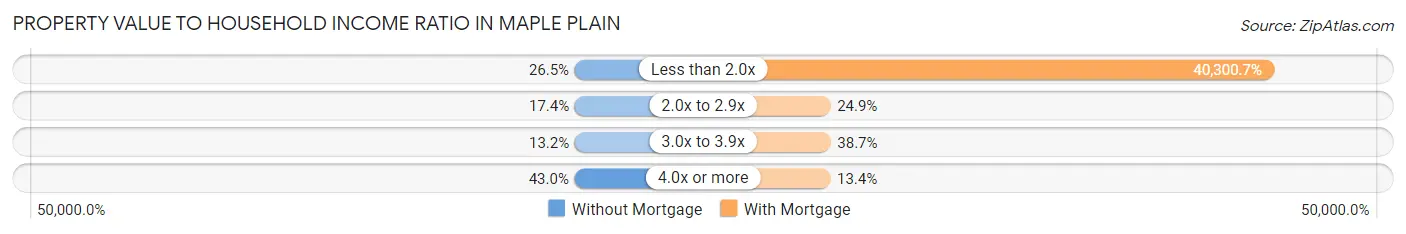
| Value-to-Income Ratio | Without Mortgage | With Mortgage |
| Less than 2.0x | 32 (26.5%) | 122,917 (40,300.7%) |
| 2.0x to 2.9x | 21 (17.4%) | 76 (24.9%) |
| 3.0x to 3.9x | 16 (13.2%) | 118 (38.7%) |
| 4.0x or more | 52 (43.0%) | 41 (13.4%) |
| Total | 121 (100.0%) | 305 (100.0%) |
Real Estate Taxes by Mortgage Status in Maple Plain
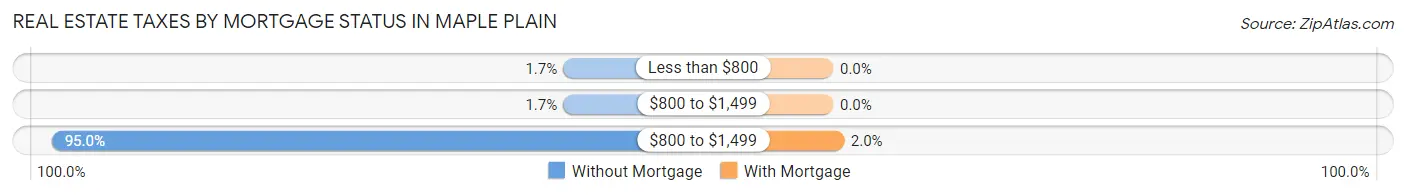
| Property Taxes | Without Mortgage | With Mortgage |
| Less than $800 | 2 (1.7%) | 0 (0.0%) |
| $800 to $1,499 | 2 (1.7%) | 0 (0.0%) |
| $800 to $1,499 | 115 (95.0%) | 6 (2.0%) |
| Total | 121 (100.0%) | 305 (100.0%) |
Health & Disability in Maple Plain
Health Insurance Coverage by Age in Maple Plain
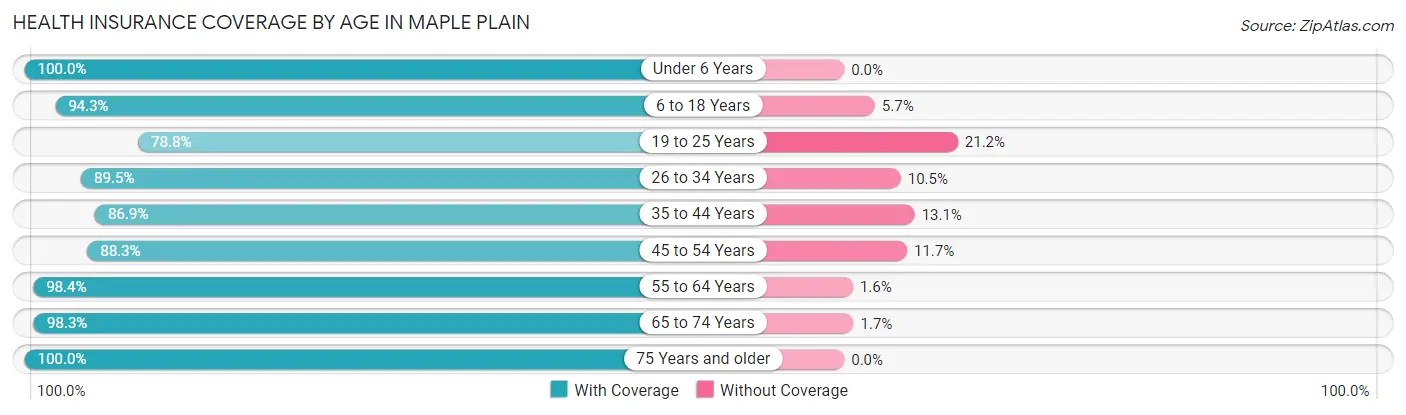
| Age Bracket | With Coverage | Without Coverage |
| Under 6 Years | 174 (100.0%) | 0 (0.0%) |
| 6 to 18 Years | 297 (94.3%) | 18 (5.7%) |
| 19 to 25 Years | 67 (78.8%) | 18 (21.2%) |
| 26 to 34 Years | 187 (89.5%) | 22 (10.5%) |
| 35 to 44 Years | 258 (86.9%) | 39 (13.1%) |
| 45 to 54 Years | 151 (88.3%) | 20 (11.7%) |
| 55 to 64 Years | 182 (98.4%) | 3 (1.6%) |
| 65 to 74 Years | 169 (98.3%) | 3 (1.7%) |
| 75 Years and older | 101 (100.0%) | 0 (0.0%) |
| Total | 1,586 (92.8%) | 123 (7.2%) |
Health Insurance Coverage by Citizenship Status in Maple Plain
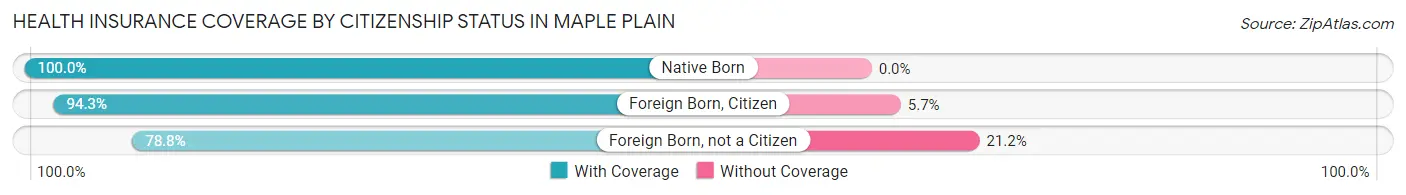
| Citizenship Status | With Coverage | Without Coverage |
| Native Born | 174 (100.0%) | 0 (0.0%) |
| Foreign Born, Citizen | 297 (94.3%) | 18 (5.7%) |
| Foreign Born, not a Citizen | 67 (78.8%) | 18 (21.2%) |
Health Insurance Coverage by Household Income in Maple Plain
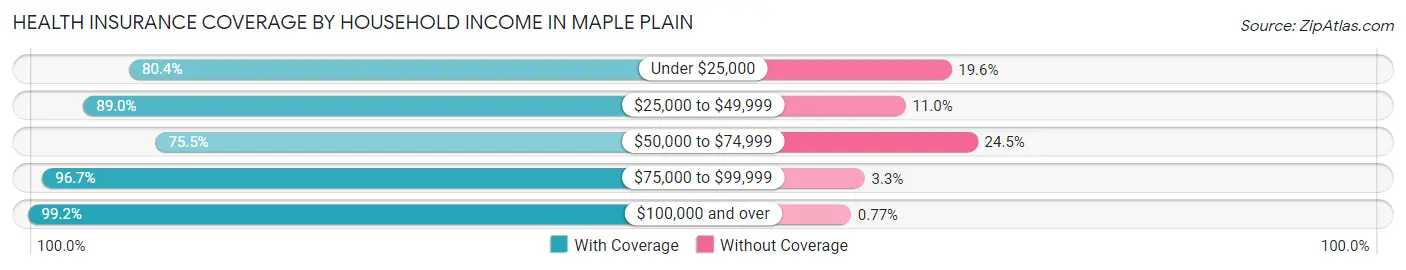
| Household Income | With Coverage | Without Coverage |
| Under $25,000 | 115 (80.4%) | 28 (19.6%) |
| $25,000 to $49,999 | 218 (89.0%) | 27 (11.0%) |
| $50,000 to $74,999 | 157 (75.5%) | 51 (24.5%) |
| $75,000 to $99,999 | 319 (96.7%) | 11 (3.3%) |
| $100,000 and over | 777 (99.2%) | 6 (0.8%) |
Public vs Private Health Insurance Coverage by Age in Maple Plain
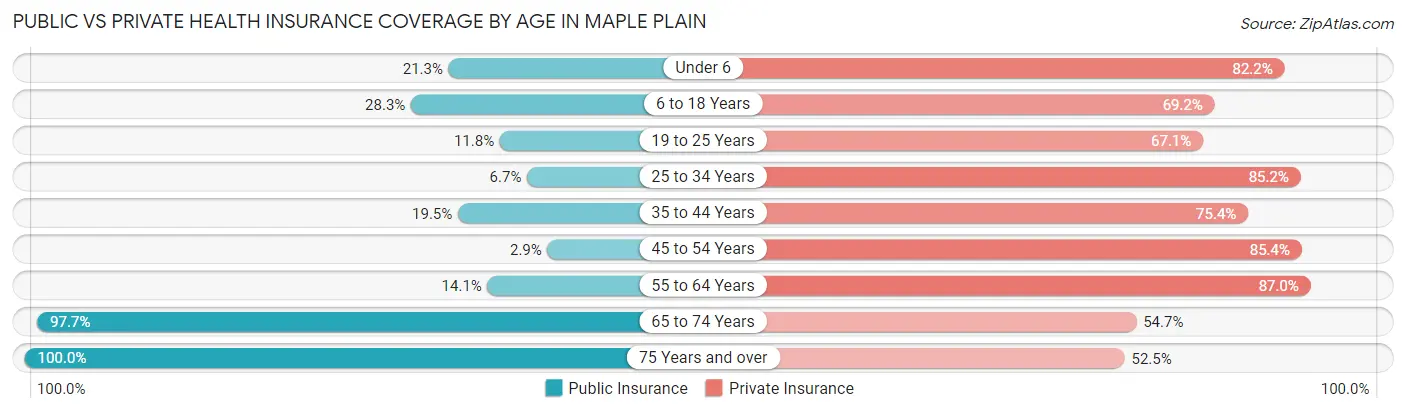
| Age Bracket | Public Insurance | Private Insurance |
| Under 6 | 37 (21.3%) | 143 (82.2%) |
| 6 to 18 Years | 89 (28.2%) | 218 (69.2%) |
| 19 to 25 Years | 10 (11.8%) | 57 (67.1%) |
| 25 to 34 Years | 14 (6.7%) | 178 (85.2%) |
| 35 to 44 Years | 58 (19.5%) | 224 (75.4%) |
| 45 to 54 Years | 5 (2.9%) | 146 (85.4%) |
| 55 to 64 Years | 26 (14.1%) | 161 (87.0%) |
| 65 to 74 Years | 168 (97.7%) | 94 (54.6%) |
| 75 Years and over | 101 (100.0%) | 53 (52.5%) |
| Total | 508 (29.7%) | 1,274 (74.6%) |
Disability Status by Sex by Age in Maple Plain
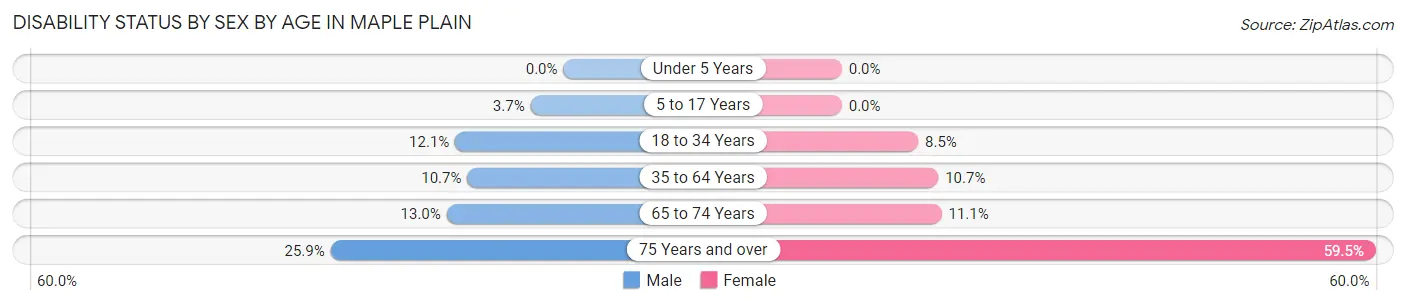
| Age Bracket | Male | Female |
| Under 5 Years | 0 (0.0%) | 0 (0.0%) |
| 5 to 17 Years | 7 (3.7%) | 0 (0.0%) |
| 18 to 34 Years | 20 (12.0%) | 13 (8.5%) |
| 35 to 64 Years | 38 (10.7%) | 32 (10.7%) |
| 65 to 74 Years | 13 (13.0%) | 8 (11.1%) |
| 75 Years and over | 7 (25.9%) | 44 (59.5%) |
Disability Class by Sex by Age in Maple Plain
Disability Class: Hearing Difficulty
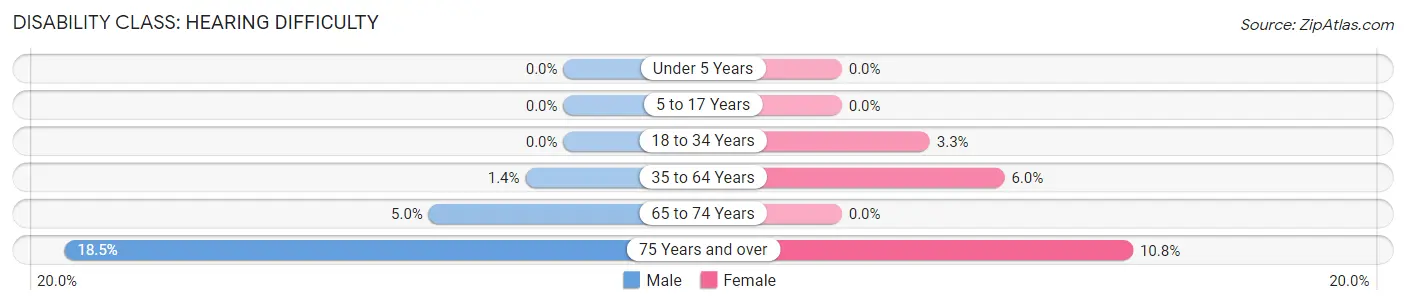
| Age Bracket | Male | Female |
| Under 5 Years | 0 (0.0%) | 0 (0.0%) |
| 5 to 17 Years | 0 (0.0%) | 0 (0.0%) |
| 18 to 34 Years | 0 (0.0%) | 5 (3.3%) |
| 35 to 64 Years | 5 (1.4%) | 18 (6.0%) |
| 65 to 74 Years | 5 (5.0%) | 0 (0.0%) |
| 75 Years and over | 5 (18.5%) | 8 (10.8%) |
Disability Class: Vision Difficulty
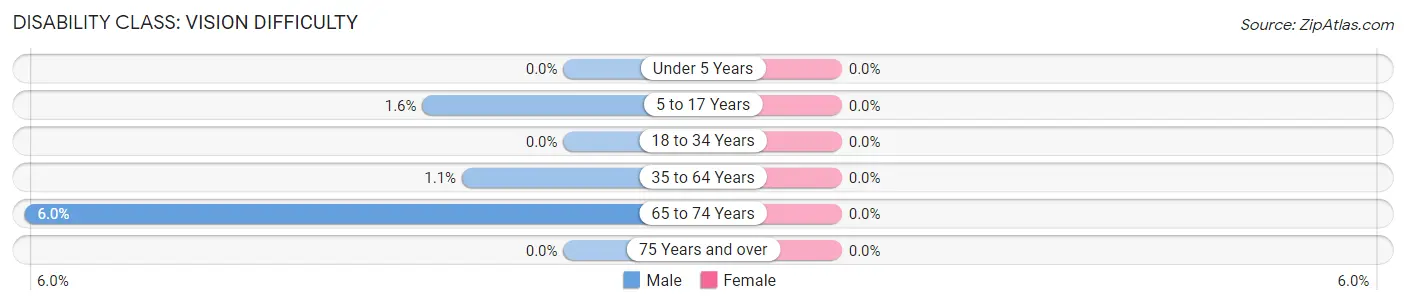
| Age Bracket | Male | Female |
| Under 5 Years | 0 (0.0%) | 0 (0.0%) |
| 5 to 17 Years | 3 (1.6%) | 0 (0.0%) |
| 18 to 34 Years | 0 (0.0%) | 0 (0.0%) |
| 35 to 64 Years | 4 (1.1%) | 0 (0.0%) |
| 65 to 74 Years | 6 (6.0%) | 0 (0.0%) |
| 75 Years and over | 0 (0.0%) | 0 (0.0%) |
Disability Class: Cognitive Difficulty
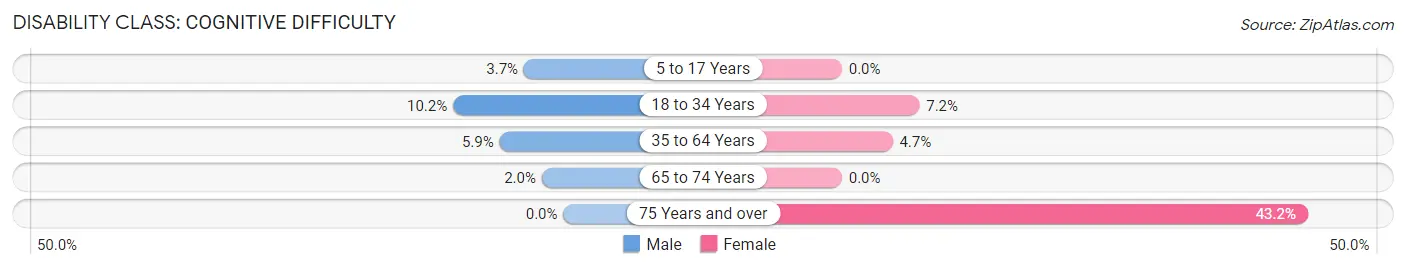
| Age Bracket | Male | Female |
| 5 to 17 Years | 7 (3.7%) | 0 (0.0%) |
| 18 to 34 Years | 17 (10.2%) | 11 (7.2%) |
| 35 to 64 Years | 21 (5.9%) | 14 (4.7%) |
| 65 to 74 Years | 2 (2.0%) | 0 (0.0%) |
| 75 Years and over | 0 (0.0%) | 32 (43.2%) |
Disability Class: Ambulatory Difficulty
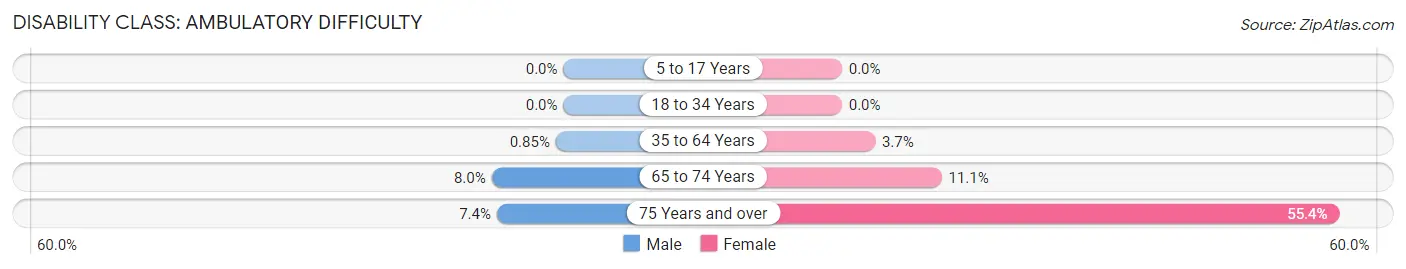
| Age Bracket | Male | Female |
| 5 to 17 Years | 0 (0.0%) | 0 (0.0%) |
| 18 to 34 Years | 0 (0.0%) | 0 (0.0%) |
| 35 to 64 Years | 3 (0.9%) | 11 (3.7%) |
| 65 to 74 Years | 8 (8.0%) | 8 (11.1%) |
| 75 Years and over | 2 (7.4%) | 41 (55.4%) |
Disability Class: Self-Care Difficulty
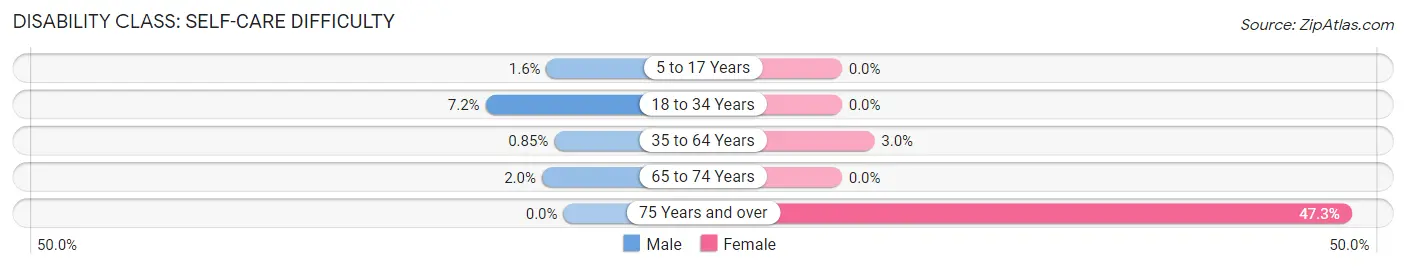
| Age Bracket | Male | Female |
| 5 to 17 Years | 3 (1.6%) | 0 (0.0%) |
| 18 to 34 Years | 12 (7.2%) | 0 (0.0%) |
| 35 to 64 Years | 3 (0.9%) | 9 (3.0%) |
| 65 to 74 Years | 2 (2.0%) | 0 (0.0%) |
| 75 Years and over | 0 (0.0%) | 35 (47.3%) |
Technology Access in Maple Plain
Computing Device Access in Maple Plain
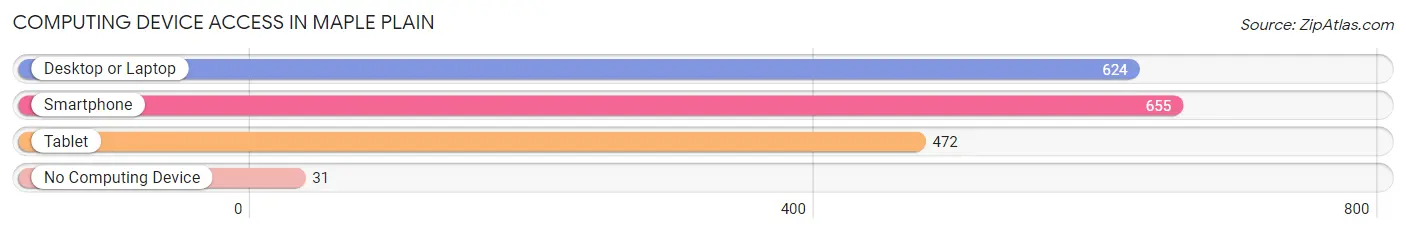
| Device Type | # Households | % Households |
| Desktop or Laptop | 624 | 82.5% |
| Smartphone | 655 | 86.6% |
| Tablet | 472 | 62.4% |
| No Computing Device | 31 | 4.1% |
| Total | 756 | 100.0% |
Internet Access in Maple Plain
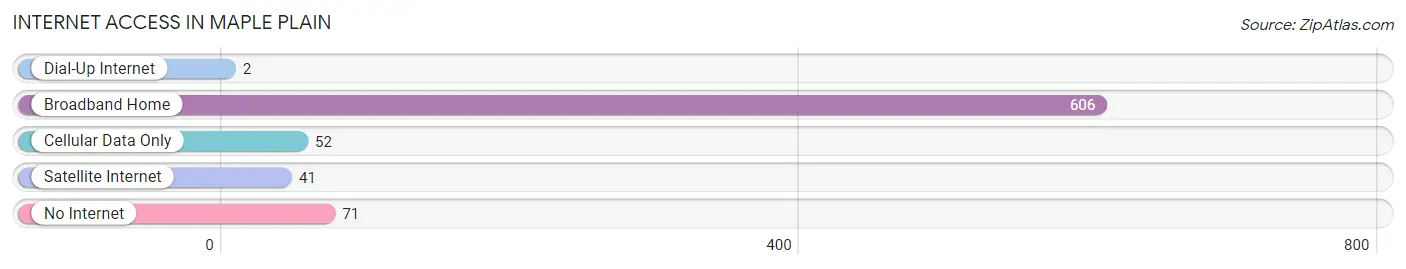
| Internet Type | # Households | % Households |
| Dial-Up Internet | 2 | 0.3% |
| Broadband Home | 606 | 80.2% |
| Cellular Data Only | 52 | 6.9% |
| Satellite Internet | 41 | 5.4% |
| No Internet | 71 | 9.4% |
| Total | 756 | 100.0% |
Maple Plain Summary
Maple Plain is a small city located in Hennepin County, Minnesota, United States. The city is situated on the western edge of the Minneapolis-St. Paul metropolitan area, approximately 25 miles west of downtown Minneapolis. As of the 2010 census, the population of Maple Plain was 1,569.
History
The area that is now Maple Plain was first settled in the mid-1800s by a group of German immigrants. The town was originally known as “Maple Grove” and was officially incorporated in 1887. The name was changed to Maple Plain in 1895.
The city was originally a farming community, but in the early 1900s, the area began to develop into a small industrial center. The first industry to locate in Maple Plain was the Maple Plain Canning Company, which opened in 1906. The company was later renamed the Maple Plain Canning and Manufacturing Company and was the largest employer in the city for many years.
In the 1950s, Maple Plain began to experience a period of growth and development. The city was home to several small businesses, including a lumberyard, a hardware store, and a grocery store. The city also had a post office, a bank, and a movie theater.
Geography
Maple Plain is located in Hennepin County, Minnesota, approximately 25 miles west of downtown Minneapolis. The city is situated on the western edge of the Minneapolis-St. Paul metropolitan area.
The city has a total area of 1.2 square miles, all of which is land. The terrain is generally flat, with some rolling hills in the northern part of the city. The city is located on the banks of the Crow River, which flows through the city from east to west.
Economy
The economy of Maple Plain is largely based on small businesses and light industry. The city is home to several small businesses, including a lumberyard, a hardware store, and a grocery store. The city also has a post office, a bank, and a movie theater.
The largest employer in the city is the Maple Plain Canning and Manufacturing Company, which has been in operation since 1906. The company produces canned fruits and vegetables, as well as other food products.
Demographics
As of the 2010 census, the population of Maple Plain was 1,569. The racial makeup of the city was 95.3% White, 0.9% African American, 0.3% Native American, 0.7% Asian, 0.1% Pacific Islander, 1.2% from other races, and 1.5% from two or more races. Hispanic or Latino of any race were 3.2% of the population.
The median household income in Maple Plain was $50,938, and the median family income was $60,938. The per capita income for the city was $25,938. About 4.3% of families and 5.7% of the population were below the poverty line, including 8.3% of those under age 18 and 4.3% of those age 65 or over.
Common Questions
What is Per Capita Income in Maple Plain?
Per Capita income in Maple Plain is $37,142.
What is the Median Family Income in Maple Plain?
Median Family Income in Maple Plain is $105,972.
What is the Median Household income in Maple Plain?
Median Household Income in Maple Plain is $77,813.
What is Income or Wage Gap in Maple Plain?
Income or Wage Gap in Maple Plain is 30.2%.
Women in Maple Plain earn 69.8 cents for every dollar earned by a man.
What is Inequality or Gini Index in Maple Plain?
Inequality or Gini Index in Maple Plain is 0.38.
What is the Total Population of Maple Plain?
Total Population of Maple Plain is 1,780.
What is the Total Male Population of Maple Plain?
Total Male Population of Maple Plain is 965.
What is the Total Female Population of Maple Plain?
Total Female Population of Maple Plain is 815.
What is the Ratio of Males per 100 Females in Maple Plain?
There are 118.40 Males per 100 Females in Maple Plain.
What is the Ratio of Females per 100 Males in Maple Plain?
There are 84.46 Females per 100 Males in Maple Plain.
What is the Median Population Age in Maple Plain?
Median Population Age in Maple Plain is 37.9 Years.
What is the Average Family Size in Maple Plain
Average Family Size in Maple Plain is 3.0 People.
What is the Average Household Size in Maple Plain
Average Household Size in Maple Plain is 2.3 People.
How Large is the Labor Force in Maple Plain?
There are 853 People in the Labor Forcein in Maple Plain.
What is the Percentage of People in the Labor Force in Maple Plain?
62.6% of People are in the Labor Force in Maple Plain.
What is the Unemployment Rate in Maple Plain?
Unemployment Rate in Maple Plain is 2.9%.