Pine Springs, MN Map & Demographics
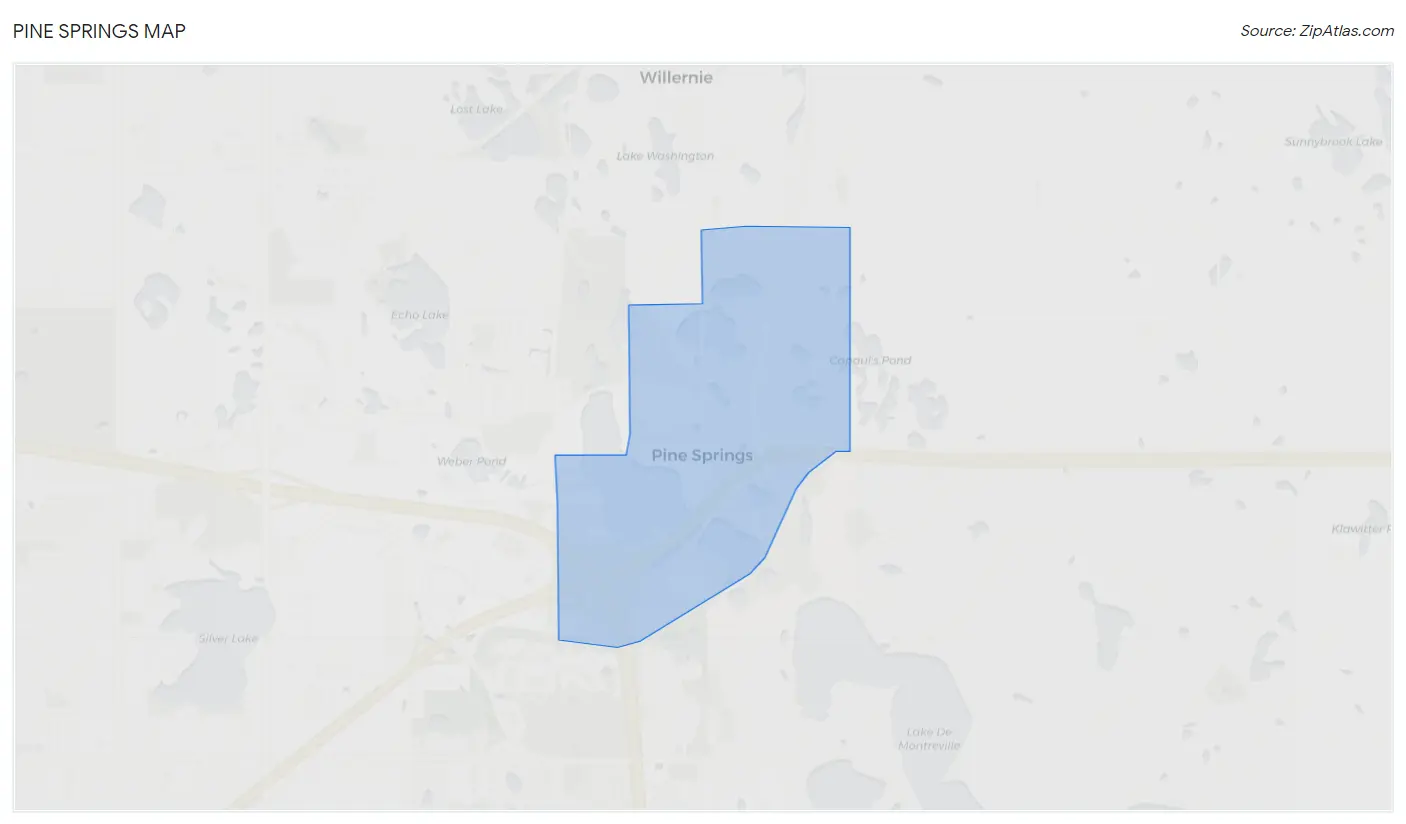
Pine Springs Map
Pine Springs Overview
$62,121
PER CAPITA INCOME
$170,313
AVG FAMILY INCOME
$160,625
AVG HOUSEHOLD INCOME
20.4%
WAGE / INCOME GAP [ % ]
79.6¢/ $1
WAGE / INCOME GAP [ $ ]
0.34
INEQUALITY / GINI INDEX
443
TOTAL POPULATION
236
MALE POPULATION
207
FEMALE POPULATION
114.01
MALES / 100 FEMALES
87.71
FEMALES / 100 MALES
43.8
MEDIAN AGE
3.2
AVG FAMILY SIZE
3.0
AVG HOUSEHOLD SIZE
204
LABOR FORCE [ PEOPLE ]
60.0%
PERCENT IN LABOR FORCE
3.4%
UNEMPLOYMENT RATE
Pine Springs Area Codes
Income in Pine Springs
Income Overview in Pine Springs
Per Capita Income in Pine Springs is $62,121, while median incomes of families and households are $170,313 and $160,625 respectively.
| Characteristic | Number | Measure |
| Per Capita Income | 443 | $62,121 |
| Median Family Income | 118 | $170,313 |
| Mean Family Income | 118 | $200,781 |
| Median Household Income | 148 | $160,625 |
| Mean Household Income | 148 | $184,888 |
| Income Deficit | 118 | $0 |
| Wage / Income Gap (%) | 443 | 20.35% |
| Wage / Income Gap ($) | 443 | 79.65¢ per $1 |
| Gini / Inequality Index | 443 | 0.34 |
Earnings by Sex in Pine Springs
Average Earnings in Pine Springs are $61,250, $70,625 for men and $56,250 for women, a difference of 20.3%.
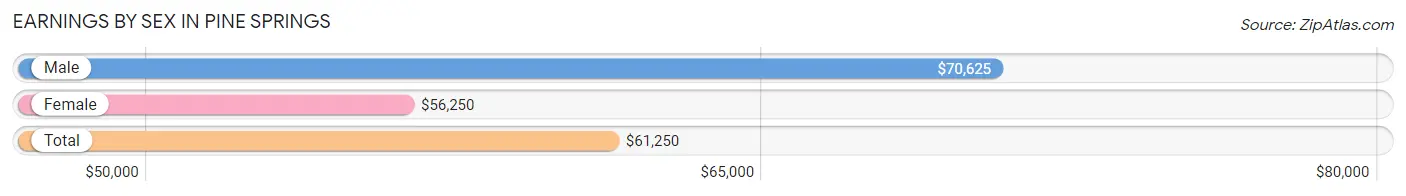
| Sex | Number | Average Earnings |
| Male | 119 (54.6%) | $70,625 |
| Female | 99 (45.4%) | $56,250 |
| Total | 218 (100.0%) | $61,250 |
Earnings by Sex by Income Bracket in Pine Springs
The most common earnings brackets in Pine Springs are $100,000+ for men (51 | 42.9%) and $100,000+ for women (22 | 22.2%).
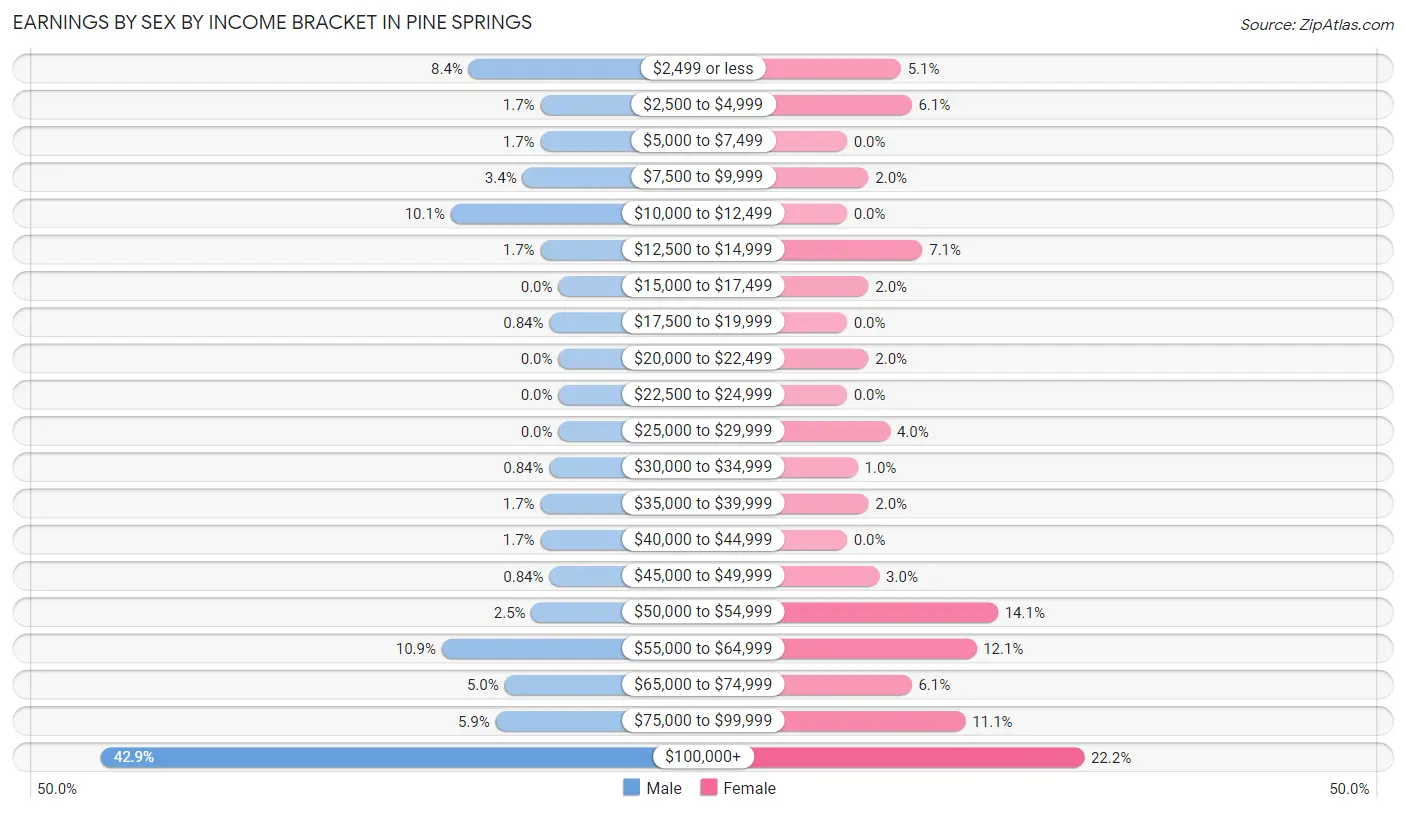
| Income | Male | Female |
| $2,499 or less | 10 (8.4%) | 5 (5.1%) |
| $2,500 to $4,999 | 2 (1.7%) | 6 (6.1%) |
| $5,000 to $7,499 | 2 (1.7%) | 0 (0.0%) |
| $7,500 to $9,999 | 4 (3.4%) | 2 (2.0%) |
| $10,000 to $12,499 | 12 (10.1%) | 0 (0.0%) |
| $12,500 to $14,999 | 2 (1.7%) | 7 (7.1%) |
| $15,000 to $17,499 | 0 (0.0%) | 2 (2.0%) |
| $17,500 to $19,999 | 1 (0.8%) | 0 (0.0%) |
| $20,000 to $22,499 | 0 (0.0%) | 2 (2.0%) |
| $22,500 to $24,999 | 0 (0.0%) | 0 (0.0%) |
| $25,000 to $29,999 | 0 (0.0%) | 4 (4.0%) |
| $30,000 to $34,999 | 1 (0.8%) | 1 (1.0%) |
| $35,000 to $39,999 | 2 (1.7%) | 2 (2.0%) |
| $40,000 to $44,999 | 2 (1.7%) | 0 (0.0%) |
| $45,000 to $49,999 | 1 (0.8%) | 3 (3.0%) |
| $50,000 to $54,999 | 3 (2.5%) | 14 (14.1%) |
| $55,000 to $64,999 | 13 (10.9%) | 12 (12.1%) |
| $65,000 to $74,999 | 6 (5.0%) | 6 (6.1%) |
| $75,000 to $99,999 | 7 (5.9%) | 11 (11.1%) |
| $100,000+ | 51 (42.9%) | 22 (22.2%) |
| Total | 119 (100.0%) | 99 (100.0%) |
Earnings by Sex by Educational Attainment in Pine Springs
Average earnings in Pine Springs are $102,917 for men and $59,250 for women, a difference of 42.4%. Men with an educational attainment of graduate degree enjoy the highest average annual earnings of $146,875, while those with college or associate's degree education earn the least with $58,958. Women with an educational attainment of graduate degree earn the most with the average annual earnings of $100,313, while those with bachelor's degree education have the smallest earnings of $62,813.
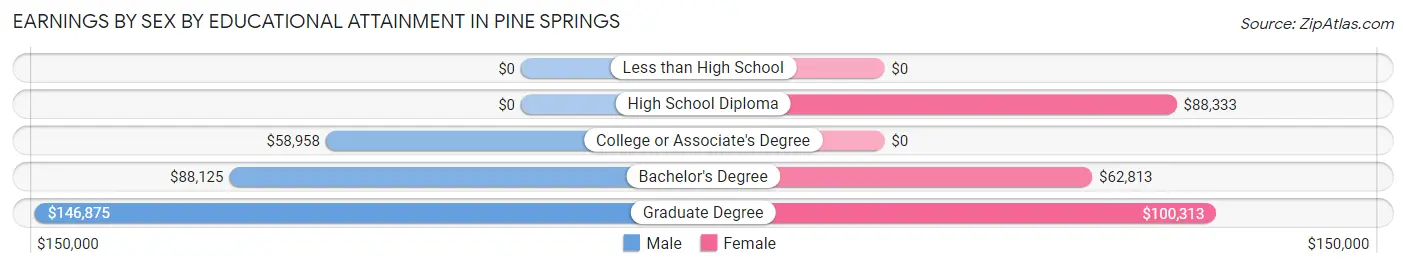
| Educational Attainment | Male Income | Female Income |
| Less than High School | - | - |
| High School Diploma | - | - |
| College or Associate's Degree | $58,958 | $0 |
| Bachelor's Degree | $88,125 | $62,813 |
| Graduate Degree | $146,875 | $100,313 |
| Total | $102,917 | $59,250 |
Family Income in Pine Springs
Family Income Brackets in Pine Springs
According to the Pine Springs family income data, there are 50 families falling into the $200,000+ income range, which is the most common income bracket and makes up 42.4% of all families.
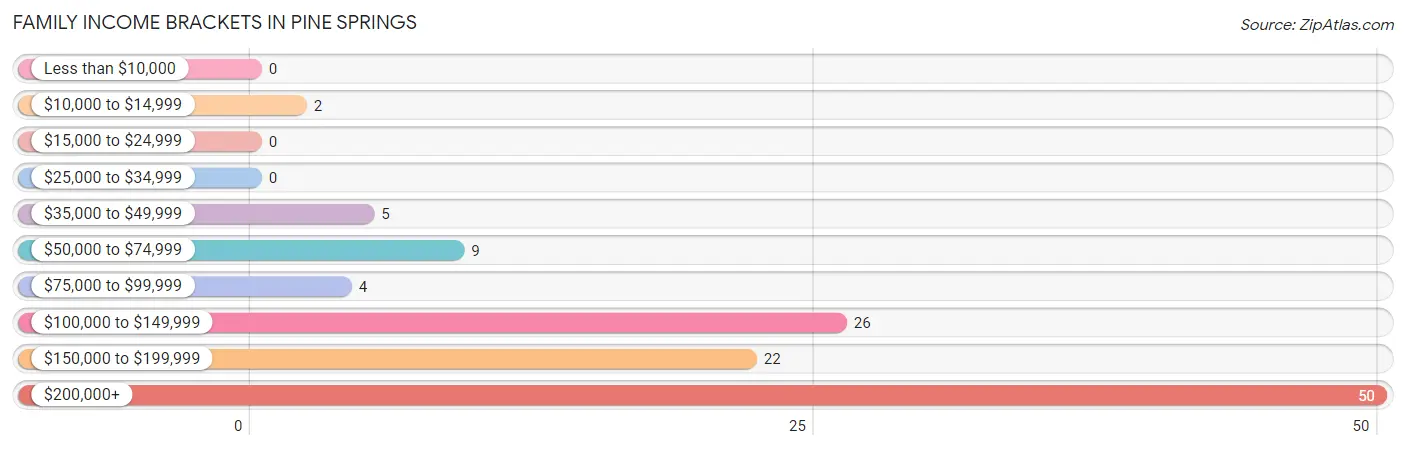
| Income Bracket | # Families | % Families |
| Less than $10,000 | 0 | 0.0% |
| $10,000 to $14,999 | 2 | 1.7% |
| $15,000 to $24,999 | 0 | 0.0% |
| $25,000 to $34,999 | 0 | 0.0% |
| $35,000 to $49,999 | 5 | 4.2% |
| $50,000 to $74,999 | 9 | 7.6% |
| $75,000 to $99,999 | 4 | 3.4% |
| $100,000 to $149,999 | 26 | 22.0% |
| $150,000 to $199,999 | 22 | 18.6% |
| $200,000+ | 50 | 42.4% |
Family Income by Famaliy Size in Pine Springs
2-person families (53 | 44.9%) account for the highest median family income in Pine Springs with $176,250 per family, while 2-person families (53 | 44.9%) have the highest median income of $88,125 per family member.
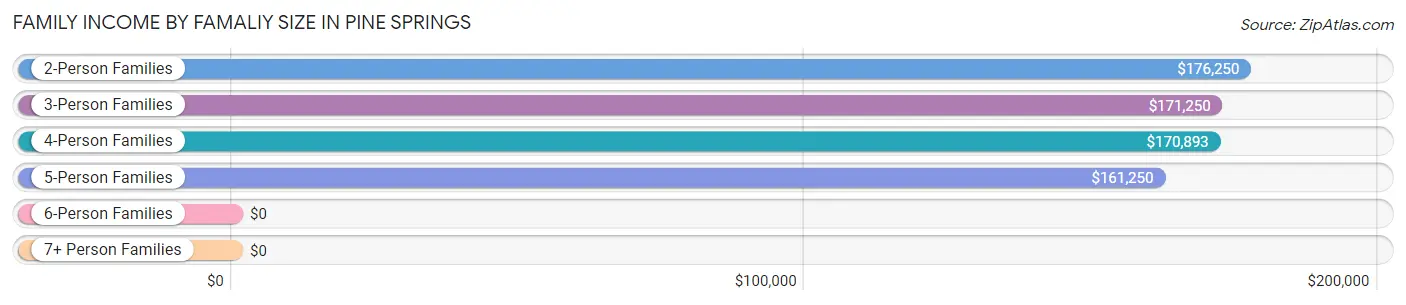
| Income Bracket | # Families | Median Income |
| 2-Person Families | 53 (44.9%) | $176,250 |
| 3-Person Families | 13 (11.0%) | $171,250 |
| 4-Person Families | 37 (31.4%) | $170,893 |
| 5-Person Families | 12 (10.2%) | $161,250 |
| 6-Person Families | 3 (2.5%) | $0 |
| 7+ Person Families | 0 (0.0%) | $0 |
| Total | 118 (100.0%) | $170,313 |
Family Income by Number of Earners in Pine Springs
The median family income in Pine Springs is $170,313, with families comprising 3+ earners (12) having the highest median family income of $223,750, while families with 1 earner (37) have the lowest median family income of $131,406, accounting for 10.2% and 31.4% of families, respectively.
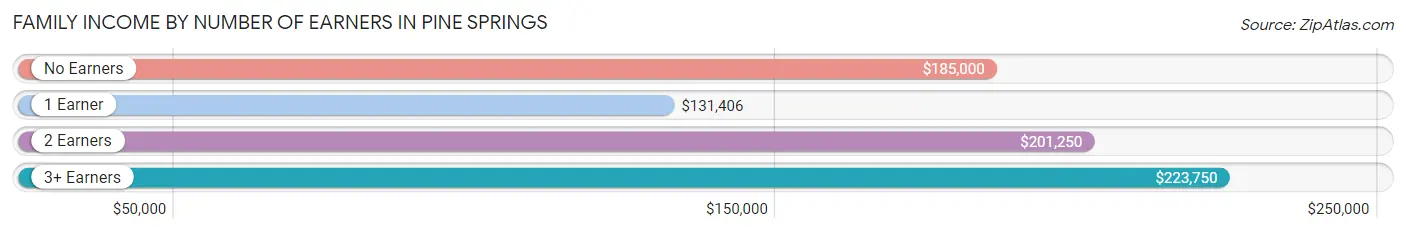
| Number of Earners | # Families | Median Income |
| No Earners | 24 (20.3%) | $185,000 |
| 1 Earner | 37 (31.4%) | $131,406 |
| 2 Earners | 45 (38.1%) | $201,250 |
| 3+ Earners | 12 (10.2%) | $223,750 |
| Total | 118 (100.0%) | $170,313 |
Household Income in Pine Springs
Household Income Brackets in Pine Springs
With 52 households falling in the category, the $200,000+ income range is the most frequent in Pine Springs, accounting for 35.1% of all households.
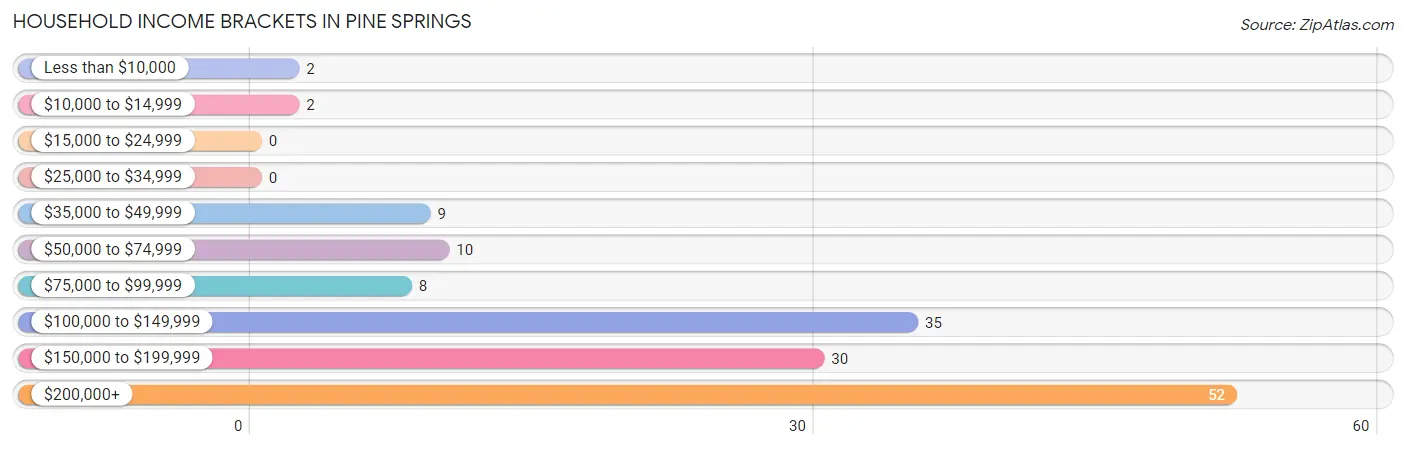
| Income Bracket | # Households | % Households |
| Less than $10,000 | 2 | 1.4% |
| $10,000 to $14,999 | 2 | 1.4% |
| $15,000 to $24,999 | 0 | 0.0% |
| $25,000 to $34,999 | 0 | 0.0% |
| $35,000 to $49,999 | 9 | 6.1% |
| $50,000 to $74,999 | 10 | 6.8% |
| $75,000 to $99,999 | 8 | 5.4% |
| $100,000 to $149,999 | 35 | 23.6% |
| $150,000 to $199,999 | 30 | 20.3% |
| $200,000+ | 52 | 35.1% |
Household Income by Householder Age in Pine Springs
The median household income in Pine Springs is $160,625, with the highest median household income of $216,250 found in the 25 to 44 years age bracket for the primary householder. A total of 23 households (15.5%) fall into this category. Meanwhile, the 15 to 24 years age bracket for the primary householder has the lowest median household income of $0, with 2 households (1.3%) in this group.
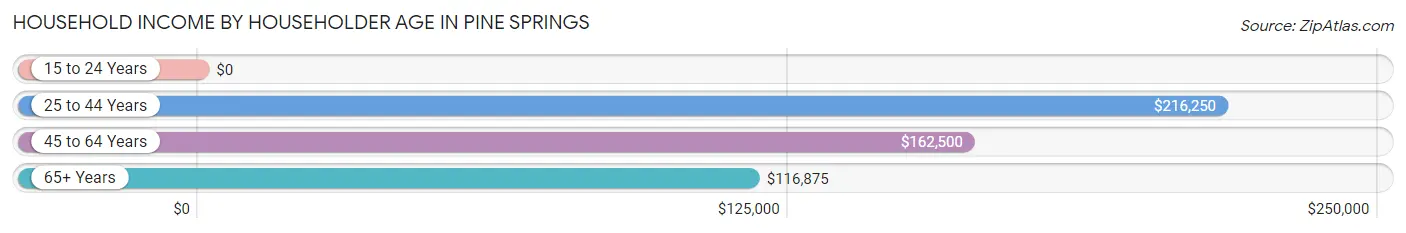
| Income Bracket | # Households | Median Income |
| 15 to 24 Years | 2 (1.3%) | $0 |
| 25 to 44 Years | 23 (15.5%) | $216,250 |
| 45 to 64 Years | 82 (55.4%) | $162,500 |
| 65+ Years | 41 (27.7%) | $116,875 |
| Total | 148 (100.0%) | $160,625 |
Poverty in Pine Springs
Income Below Poverty by Sex and Age in Pine Springs
With 3.4% poverty level for males and 1.5% for females among the residents of Pine Springs, 18 to 24 year old males and 55 to 64 year old females are the most vulnerable to poverty, with 6 males (30.0%) and 2 females (5.9%) in their respective age groups living below the poverty level.
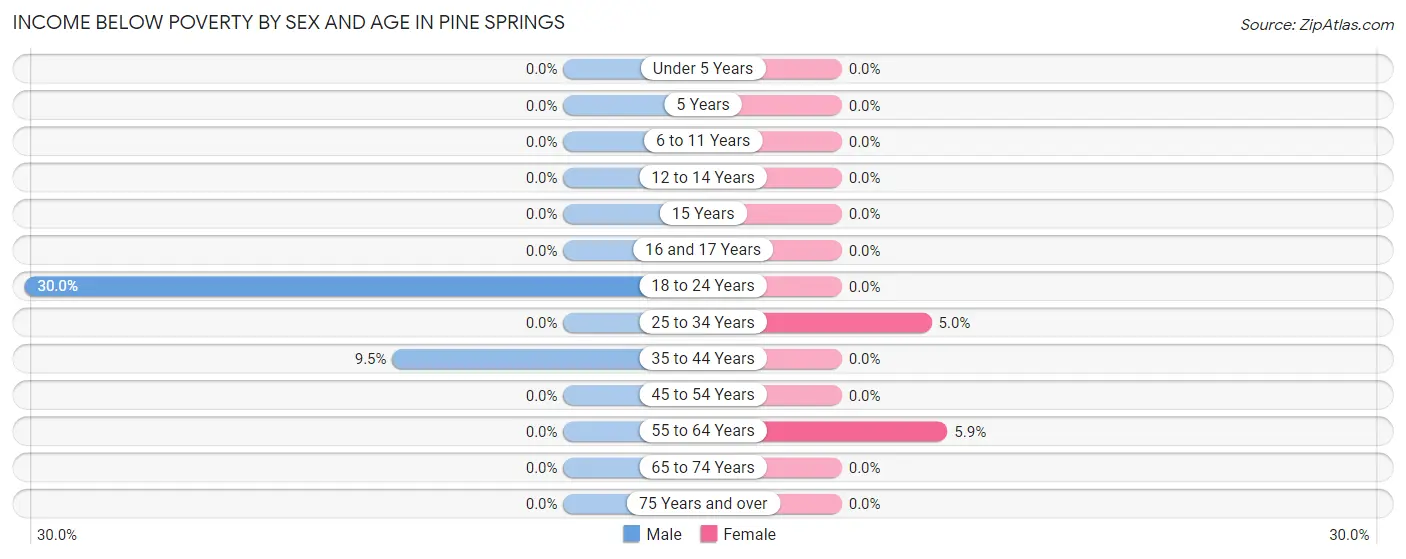
| Age Bracket | Male | Female |
| Under 5 Years | 0 (0.0%) | 0 (0.0%) |
| 5 Years | 0 (0.0%) | 0 (0.0%) |
| 6 to 11 Years | 0 (0.0%) | 0 (0.0%) |
| 12 to 14 Years | 0 (0.0%) | 0 (0.0%) |
| 15 Years | 0 (0.0%) | 0 (0.0%) |
| 16 and 17 Years | 0 (0.0%) | 0 (0.0%) |
| 18 to 24 Years | 6 (30.0%) | 0 (0.0%) |
| 25 to 34 Years | 0 (0.0%) | 1 (5.0%) |
| 35 to 44 Years | 2 (9.5%) | 0 (0.0%) |
| 45 to 54 Years | 0 (0.0%) | 0 (0.0%) |
| 55 to 64 Years | 0 (0.0%) | 2 (5.9%) |
| 65 to 74 Years | 0 (0.0%) | 0 (0.0%) |
| 75 Years and over | 0 (0.0%) | 0 (0.0%) |
| Total | 8 (3.4%) | 3 (1.5%) |
Income Above Poverty by Sex and Age in Pine Springs
According to the poverty statistics in Pine Springs, males aged under 5 years and females aged under 5 years are the age groups that are most secure financially, with 100.0% of males and 100.0% of females in these age groups living above the poverty line.
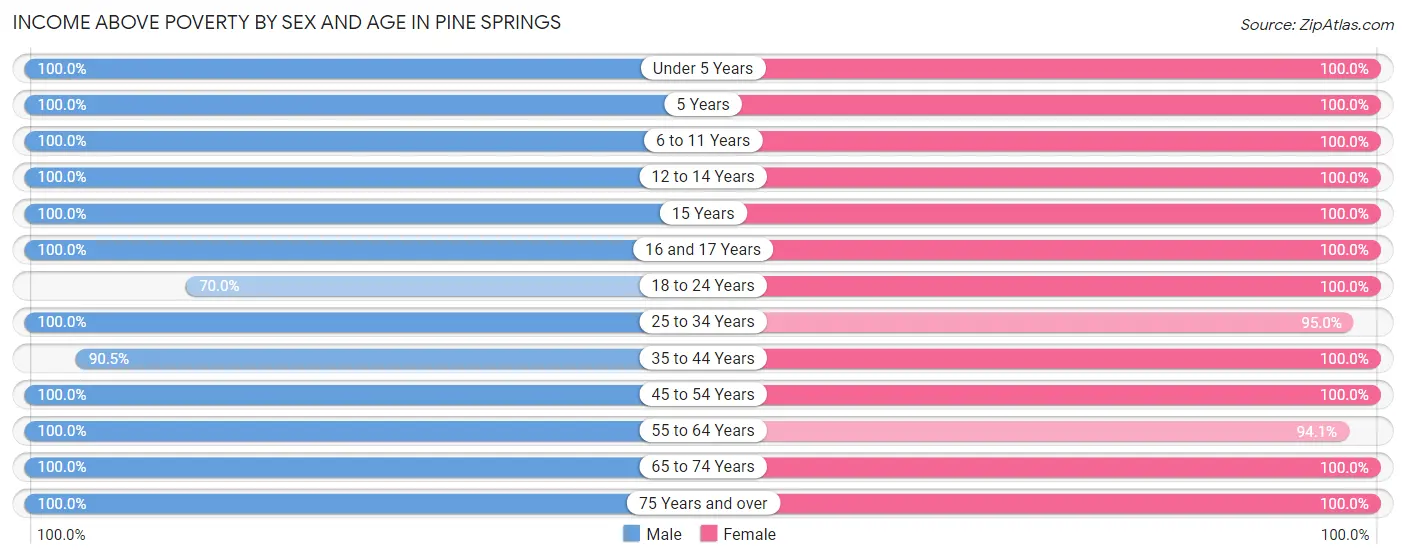
| Age Bracket | Male | Female |
| Under 5 Years | 7 (100.0%) | 12 (100.0%) |
| 5 Years | 4 (100.0%) | 3 (100.0%) |
| 6 to 11 Years | 30 (100.0%) | 13 (100.0%) |
| 12 to 14 Years | 15 (100.0%) | 8 (100.0%) |
| 15 Years | 2 (100.0%) | 9 (100.0%) |
| 16 and 17 Years | 10 (100.0%) | 1 (100.0%) |
| 18 to 24 Years | 14 (70.0%) | 9 (100.0%) |
| 25 to 34 Years | 10 (100.0%) | 19 (95.0%) |
| 35 to 44 Years | 19 (90.5%) | 30 (100.0%) |
| 45 to 54 Years | 41 (100.0%) | 34 (100.0%) |
| 55 to 64 Years | 29 (100.0%) | 32 (94.1%) |
| 65 to 74 Years | 37 (100.0%) | 27 (100.0%) |
| 75 Years and over | 10 (100.0%) | 7 (100.0%) |
| Total | 228 (96.6%) | 204 (98.6%) |
Income Below Poverty Among Married-Couple Families in Pine Springs
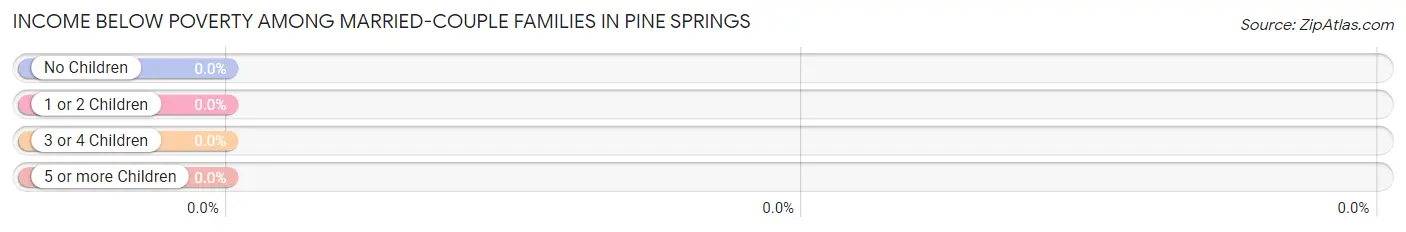
| Children | Above Poverty | Below Poverty |
| No Children | 57 (100.0%) | 0 (0.0%) |
| 1 or 2 Children | 43 (100.0%) | 0 (0.0%) |
| 3 or 4 Children | 12 (100.0%) | 0 (0.0%) |
| 5 or more Children | 0 (0.0%) | 0 (0.0%) |
| Total | 112 (100.0%) | 0 (0.0%) |
Income Below Poverty Among Single-Parent Households in Pine Springs
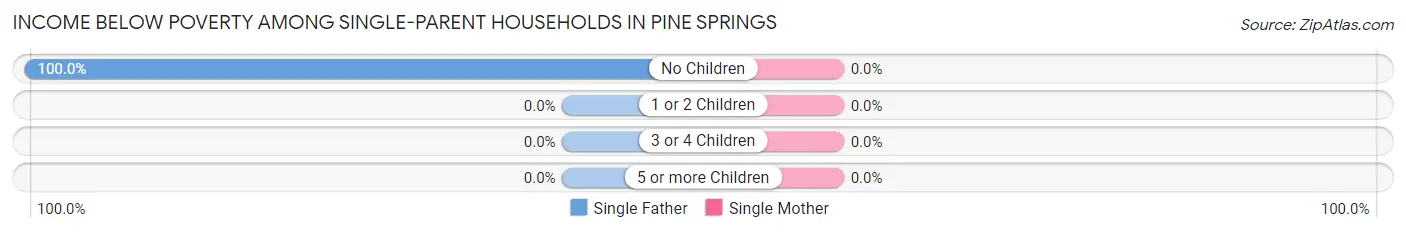
| Children | Single Father | Single Mother |
| No Children | 2 (100.0%) | 0 (0.0%) |
| 1 or 2 Children | 0 (0.0%) | 0 (0.0%) |
| 3 or 4 Children | 0 (0.0%) | 0 (0.0%) |
| 5 or more Children | 0 (0.0%) | 0 (0.0%) |
| Total | 2 (100.0%) | 0 (0.0%) |
Income Below Poverty Among Married-Couple vs Single-Parent Households in Pine Springs
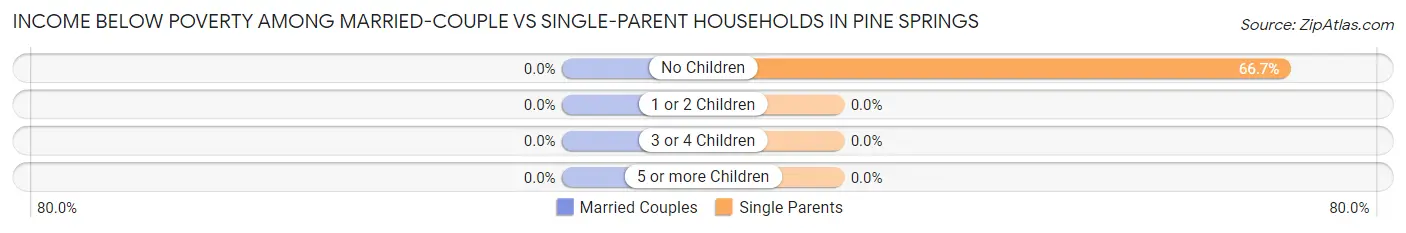
| Children | Married-Couple Families | Single-Parent Households |
| No Children | 0 (0.0%) | 2 (66.7%) |
| 1 or 2 Children | 0 (0.0%) | 0 (0.0%) |
| 3 or 4 Children | 0 (0.0%) | 0 (0.0%) |
| 5 or more Children | 0 (0.0%) | 0 (0.0%) |
| Total | 0 (0.0%) | 2 (33.3%) |
Race in Pine Springs
The most populous races in Pine Springs are White / Caucasian (388 | 87.6%), Two or more Races (26 | 5.9%), and Black / African American (19 | 4.3%).
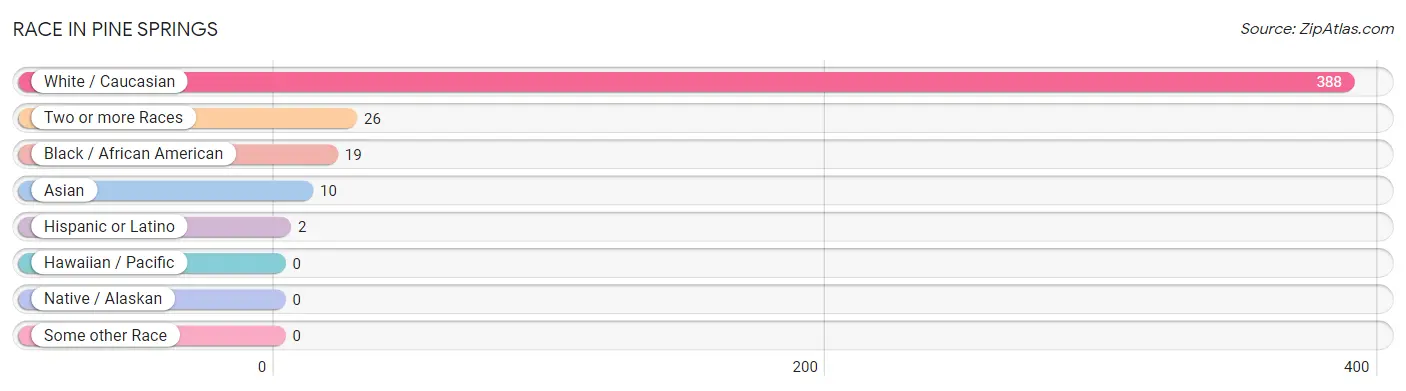
| Race | # Population | % Population |
| Asian | 10 | 2.3% |
| Black / African American | 19 | 4.3% |
| Hawaiian / Pacific | 0 | 0.0% |
| Hispanic or Latino | 2 | 0.4% |
| Native / Alaskan | 0 | 0.0% |
| White / Caucasian | 388 | 87.6% |
| Two or more Races | 26 | 5.9% |
| Some other Race | 0 | 0.0% |
| Total | 443 | 100.0% |
Ancestry in Pine Springs
The most populous ancestries reported in Pine Springs are German (181 | 40.9%), Swedish (55 | 12.4%), Norwegian (50 | 11.3%), Irish (46 | 10.4%), and Scandinavian (32 | 7.2%), together accounting for 82.2% of all Pine Springs residents.
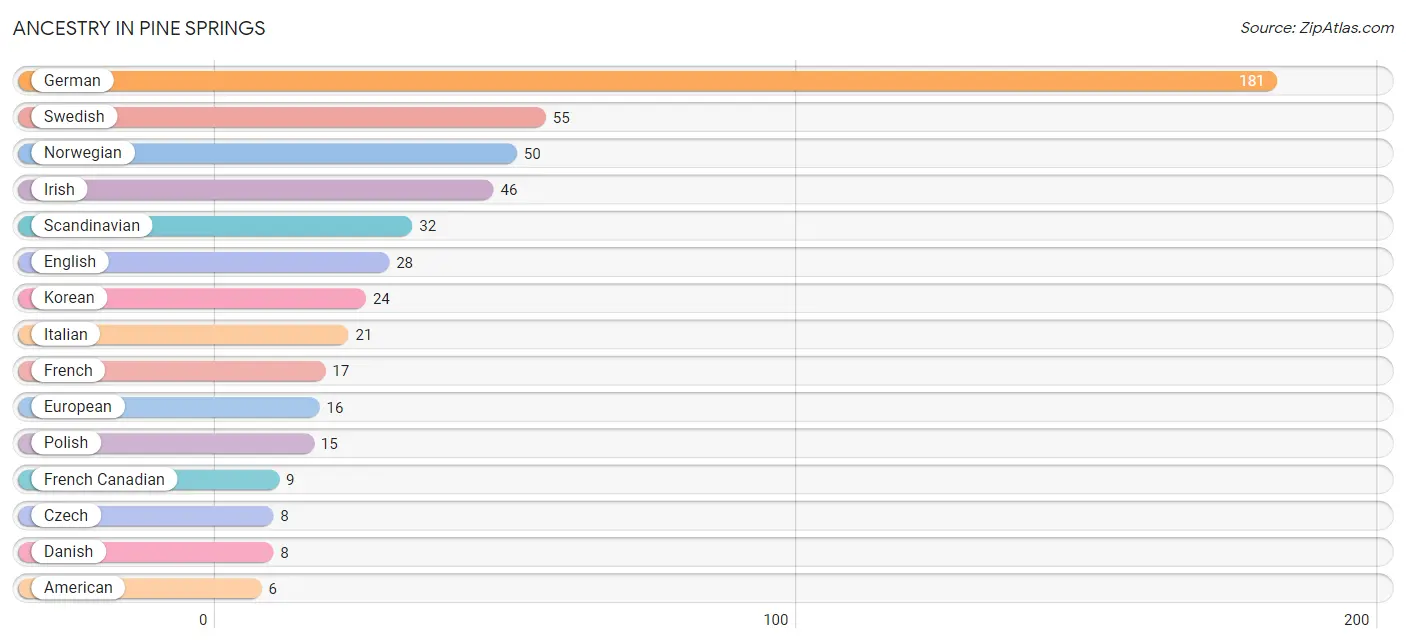
| Ancestry | # Population | % Population |
| American | 6 | 1.3% |
| Canadian | 1 | 0.2% |
| Colombian | 2 | 0.4% |
| Czech | 8 | 1.8% |
| Danish | 8 | 1.8% |
| Dutch | 1 | 0.2% |
| Eastern European | 3 | 0.7% |
| English | 28 | 6.3% |
| European | 16 | 3.6% |
| Finnish | 5 | 1.1% |
| French | 17 | 3.8% |
| French Canadian | 9 | 2.0% |
| German | 181 | 40.9% |
| Ghanaian | 3 | 0.7% |
| Greek | 1 | 0.2% |
| Indian (Asian) | 4 | 0.9% |
| Irish | 46 | 10.4% |
| Italian | 21 | 4.7% |
| Korean | 24 | 5.4% |
| Lithuanian | 2 | 0.4% |
| Northern European | 2 | 0.4% |
| Norwegian | 50 | 11.3% |
| Polish | 15 | 3.4% |
| Russian | 1 | 0.2% |
| Scandinavian | 32 | 7.2% |
| Scotch-Irish | 2 | 0.4% |
| Scottish | 5 | 1.1% |
| South American | 2 | 0.4% |
| Subsaharan African | 3 | 0.7% |
| Swedish | 55 | 12.4% |
| Welsh | 2 | 0.4% | View All 31 Rows |
Immigrants in Pine Springs
The most numerous immigrant groups reported in Pine Springs came from Asia (10 | 2.3%), Philippines (6 | 1.3%), South Eastern Asia (6 | 1.3%), China (4 | 0.9%), and Eastern Asia (4 | 0.9%), together accounting for 6.8% of all Pine Springs residents.
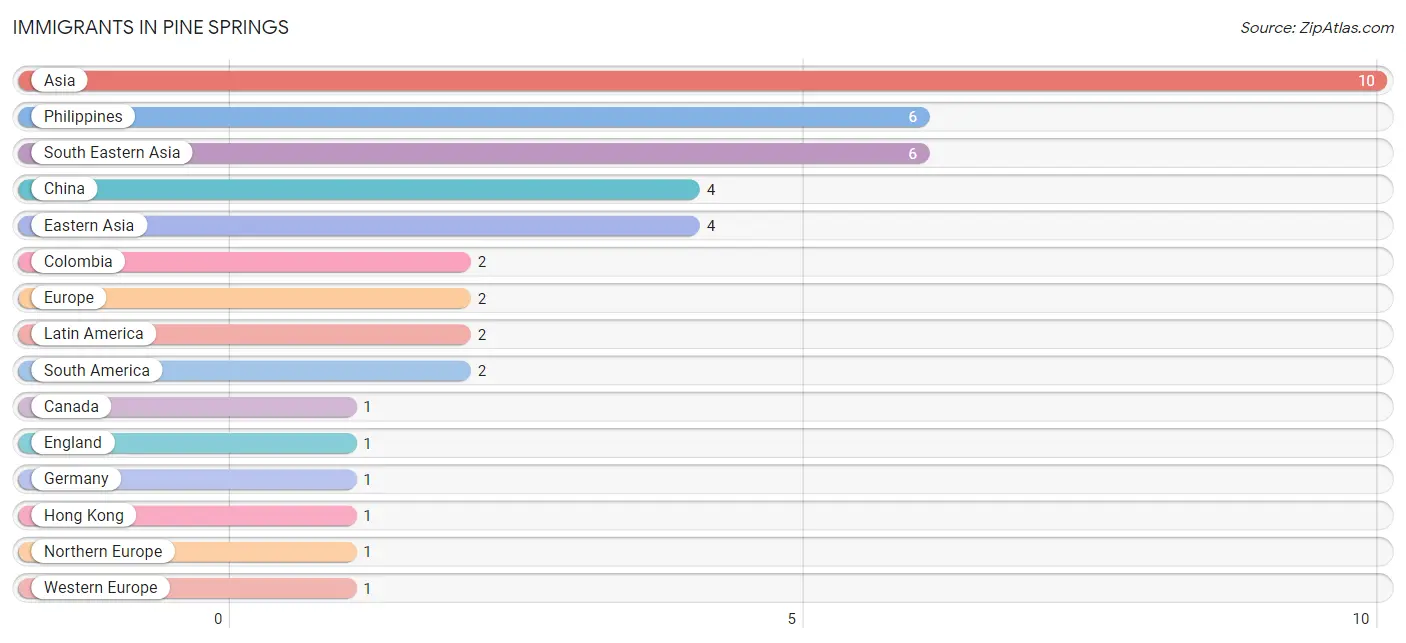
| Immigration Origin | # Population | % Population |
| Asia | 10 | 2.3% |
| Canada | 1 | 0.2% |
| China | 4 | 0.9% |
| Colombia | 2 | 0.4% |
| Eastern Asia | 4 | 0.9% |
| England | 1 | 0.2% |
| Europe | 2 | 0.4% |
| Germany | 1 | 0.2% |
| Hong Kong | 1 | 0.2% |
| Latin America | 2 | 0.4% |
| Northern Europe | 1 | 0.2% |
| Philippines | 6 | 1.3% |
| South America | 2 | 0.4% |
| South Eastern Asia | 6 | 1.3% |
| Western Europe | 1 | 0.2% | View All 15 Rows |
Sex and Age in Pine Springs
Sex and Age in Pine Springs
The most populous age groups in Pine Springs are 5 to 9 Years (28 | 11.9%) for men and 45 to 49 Years (22 | 10.6%) for women.
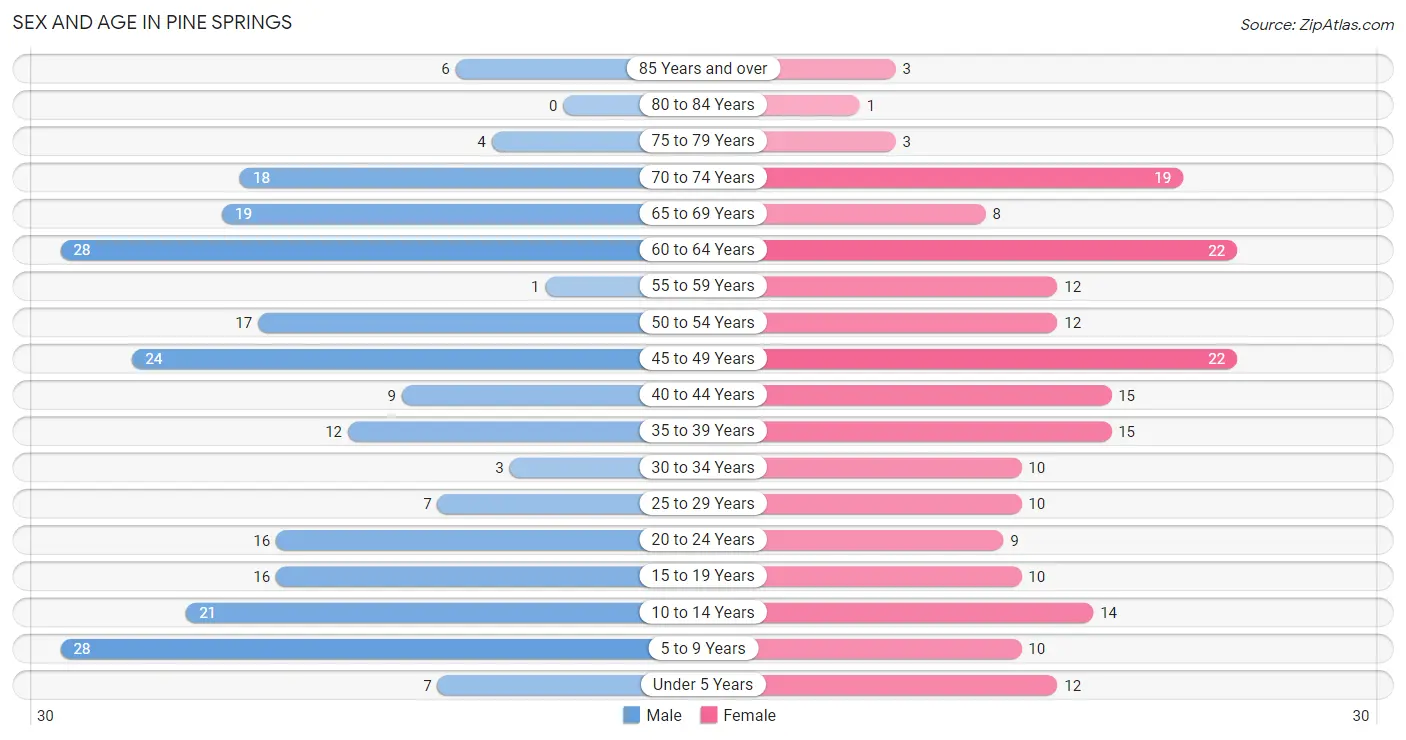
| Age Bracket | Male | Female |
| Under 5 Years | 7 (3.0%) | 12 (5.8%) |
| 5 to 9 Years | 28 (11.9%) | 10 (4.8%) |
| 10 to 14 Years | 21 (8.9%) | 14 (6.8%) |
| 15 to 19 Years | 16 (6.8%) | 10 (4.8%) |
| 20 to 24 Years | 16 (6.8%) | 9 (4.3%) |
| 25 to 29 Years | 7 (3.0%) | 10 (4.8%) |
| 30 to 34 Years | 3 (1.3%) | 10 (4.8%) |
| 35 to 39 Years | 12 (5.1%) | 15 (7.2%) |
| 40 to 44 Years | 9 (3.8%) | 15 (7.2%) |
| 45 to 49 Years | 24 (10.2%) | 22 (10.6%) |
| 50 to 54 Years | 17 (7.2%) | 12 (5.8%) |
| 55 to 59 Years | 1 (0.4%) | 12 (5.8%) |
| 60 to 64 Years | 28 (11.9%) | 22 (10.6%) |
| 65 to 69 Years | 19 (8.1%) | 8 (3.9%) |
| 70 to 74 Years | 18 (7.6%) | 19 (9.2%) |
| 75 to 79 Years | 4 (1.7%) | 3 (1.5%) |
| 80 to 84 Years | 0 (0.0%) | 1 (0.5%) |
| 85 Years and over | 6 (2.5%) | 3 (1.5%) |
| Total | 236 (100.0%) | 207 (100.0%) |
Families and Households in Pine Springs
Median Family Size in Pine Springs
The median family size in Pine Springs is 3.22 persons per family, with married-couple families (112 | 94.9%) accounting for the largest median family size of 3.27 persons per family. On the other hand, single male/father families (2 | 1.7%) represent the smallest median family size with 1.50 persons per family.
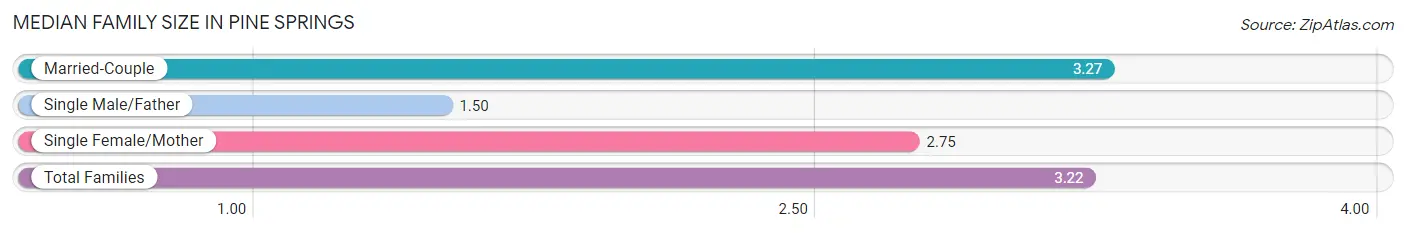
| Family Type | # Families | Family Size |
| Married-Couple | 112 (94.9%) | 3.27 |
| Single Male/Father | 2 (1.7%) | 1.50 |
| Single Female/Mother | 4 (3.4%) | 2.75 |
| Total Families | 118 (100.0%) | 3.22 |
Median Household Size in Pine Springs
The median household size in Pine Springs is 2.99 persons per household, with married-couple households (112 | 75.7%) accounting for the largest median household size of 3.37 persons per household. single male/father households (2 | 1.3%) represent the smallest median household size with 1.50 persons per household.
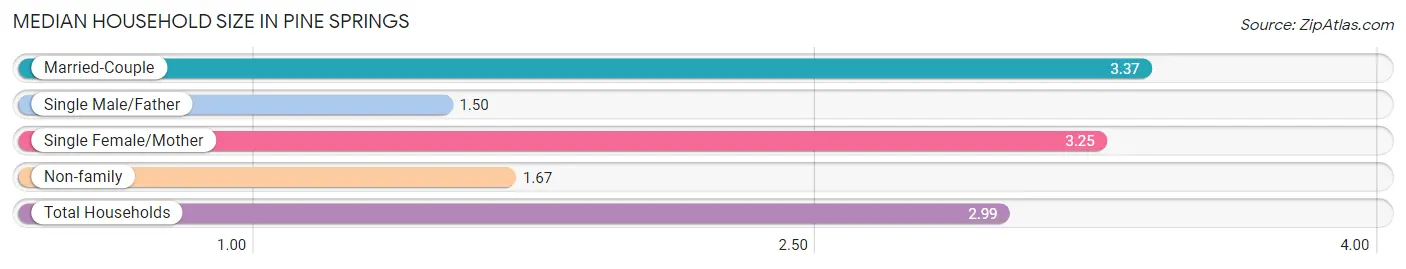
| Household Type | # Households | Household Size |
| Married-Couple | 112 (75.7%) | 3.37 |
| Single Male/Father | 2 (1.3%) | 1.50 |
| Single Female/Mother | 4 (2.7%) | 3.25 |
| Non-family | 30 (20.3%) | 1.67 |
| Total Households | 148 (100.0%) | 2.99 |
Household Size by Marriage Status in Pine Springs
Out of a total of 148 households in Pine Springs, 118 (79.7%) are family households, while 30 (20.3%) are nonfamily households. The most numerous type of family households are 2-person households, comprising 53, and the most common type of nonfamily households are 2-person households, comprising 19.
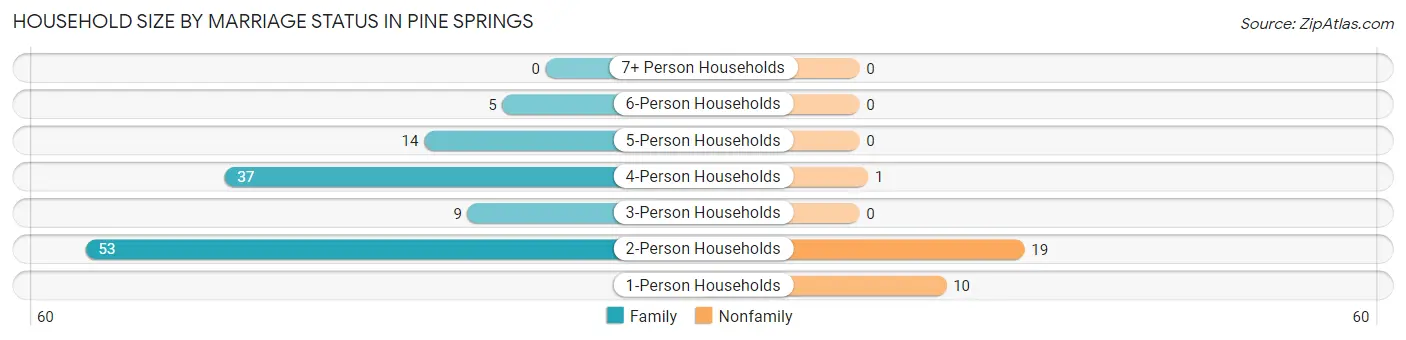
| Household Size | Family Households | Nonfamily Households |
| 1-Person Households | - | 10 (6.8%) |
| 2-Person Households | 53 (35.8%) | 19 (12.8%) |
| 3-Person Households | 9 (6.1%) | 0 (0.0%) |
| 4-Person Households | 37 (25.0%) | 1 (0.7%) |
| 5-Person Households | 14 (9.5%) | 0 (0.0%) |
| 6-Person Households | 5 (3.4%) | 0 (0.0%) |
| 7+ Person Households | 0 (0.0%) | 0 (0.0%) |
| Total | 118 (79.7%) | 30 (20.3%) |
Female Fertility in Pine Springs
Fertility by Age in Pine Springs
Average fertility rate in Pine Springs is 11.0 births per 1,000 women. Women in the age bracket of 35 to 50 years have the highest fertility rate with 19.0 births per 1,000 women. Women in the age bracket of 35 to 50 years acount for 100.0% of all women with births.
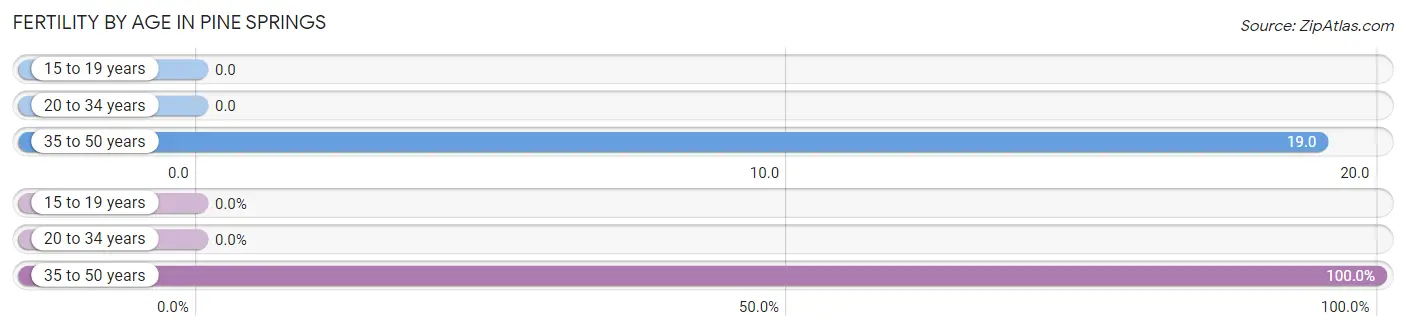
| Age Bracket | Women with Births | Births / 1,000 Women |
| 15 to 19 years | 0 (0.0%) | 0.0 |
| 20 to 34 years | 0 (0.0%) | 0.0 |
| 35 to 50 years | 1 (100.0%) | 19.0 |
| Total | 1 (100.0%) | 11.0 |
Fertility by Age by Marriage Status in Pine Springs
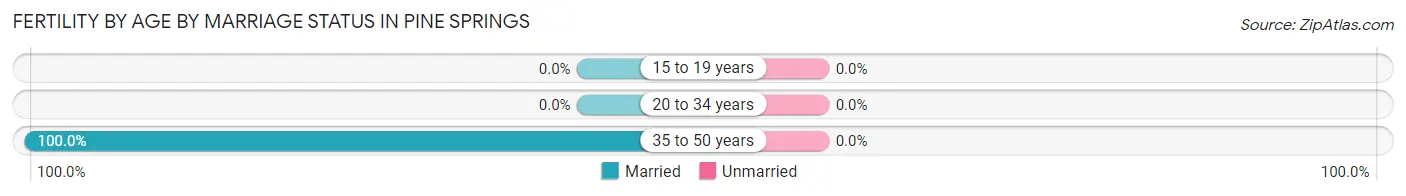
| Age Bracket | Married | Unmarried |
| 15 to 19 years | 0 (0.0%) | 0 (0.0%) |
| 20 to 34 years | 0 (0.0%) | 0 (0.0%) |
| 35 to 50 years | 1 (100.0%) | 0 (0.0%) |
| Total | 1 (100.0%) | 0 (0.0%) |
Fertility by Education in Pine Springs
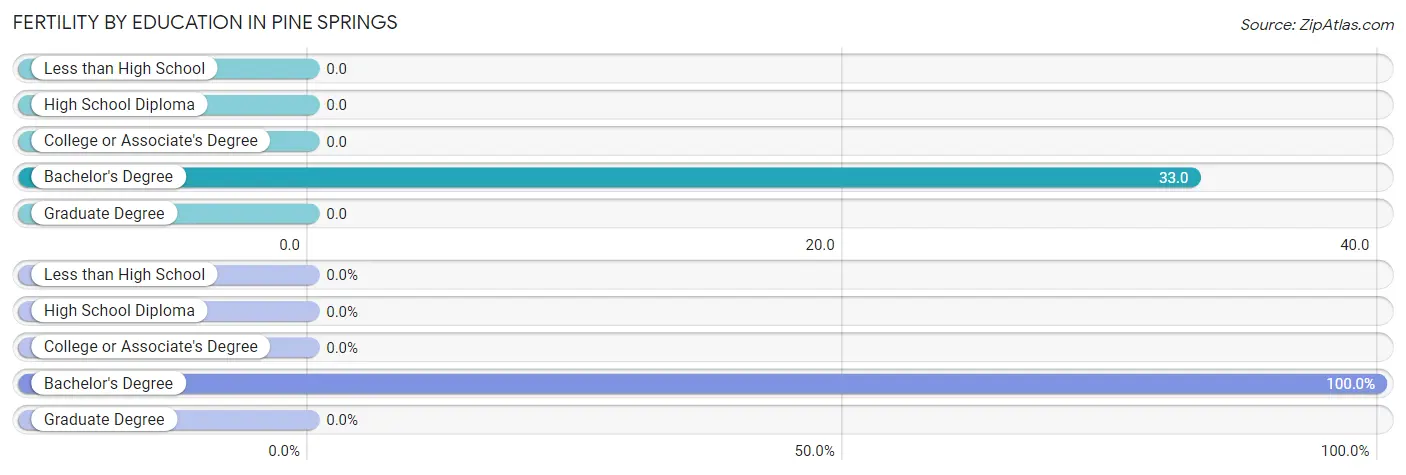
| Educational Attainment | Women with Births | Births / 1,000 Women |
| Less than High School | 0 (0.0%) | 0.0 |
| High School Diploma | 0 (0.0%) | 0.0 |
| College or Associate's Degree | 0 (0.0%) | 0.0 |
| Bachelor's Degree | 1 (100.0%) | 33.0 |
| Graduate Degree | 0 (0.0%) | 0.0 |
| Total | 1 (100.0%) | 11.0 |
Fertility by Education by Marriage Status in Pine Springs
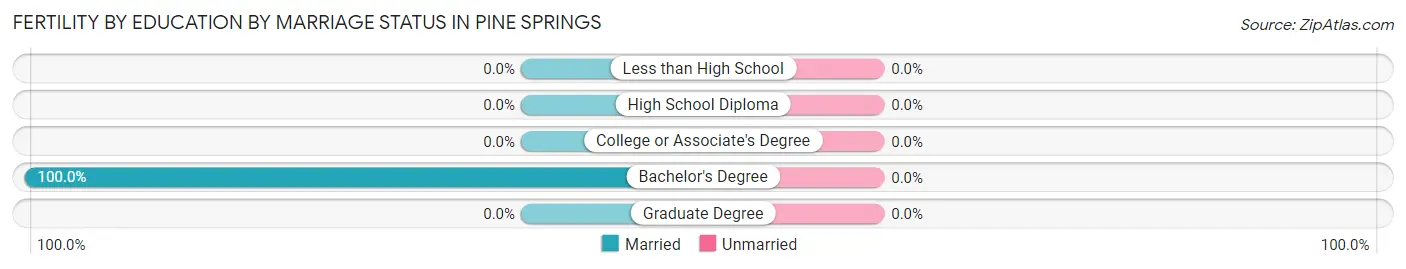
| Educational Attainment | Married | Unmarried |
| Less than High School | 0 (0.0%) | 0 (0.0%) |
| High School Diploma | 0 (0.0%) | 0 (0.0%) |
| College or Associate's Degree | 0 (0.0%) | 0 (0.0%) |
| Bachelor's Degree | 1 (100.0%) | 0 (0.0%) |
| Graduate Degree | 0 (0.0%) | 0 (0.0%) |
| Total | 1 (100.0%) | 0 (0.0%) |
Employment Characteristics in Pine Springs
Employment by Class of Employer in Pine Springs
Among the 189 employed individuals in Pine Springs, private company employees (141 | 74.6%), not-for-profit organizations (15 | 7.9%), and self-employed (incorporated) (10 | 5.3%) make up the most common classes of employment.
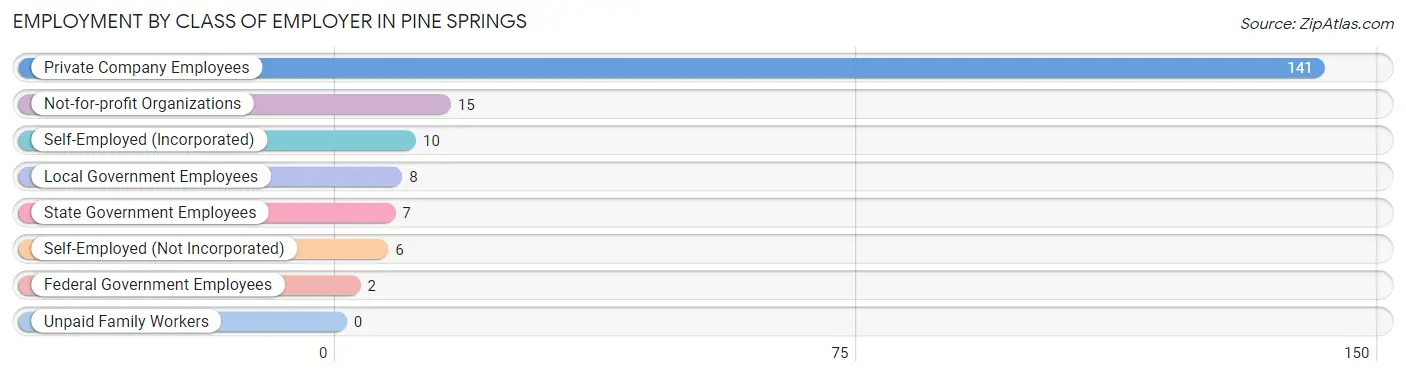
| Employer Class | # Employees | % Employees |
| Private Company Employees | 141 | 74.6% |
| Self-Employed (Incorporated) | 10 | 5.3% |
| Self-Employed (Not Incorporated) | 6 | 3.2% |
| Not-for-profit Organizations | 15 | 7.9% |
| Local Government Employees | 8 | 4.2% |
| State Government Employees | 7 | 3.7% |
| Federal Government Employees | 2 | 1.1% |
| Unpaid Family Workers | 0 | 0.0% |
| Total | 189 | 100.0% |
Employment Status by Age in Pine Springs
According to the labor force statistics for Pine Springs, out of the total population over 16 years of age (340), 60.0% or 204 individuals are in the labor force, with 3.4% or 7 of them unemployed. The age group with the highest labor force participation rate is 25 to 29 years, with 100.0% or 17 individuals in the labor force. Within the labor force, the 65 to 74 years age range has the highest percentage of unemployed individuals, with 11.1% or 1 of them being unemployed.
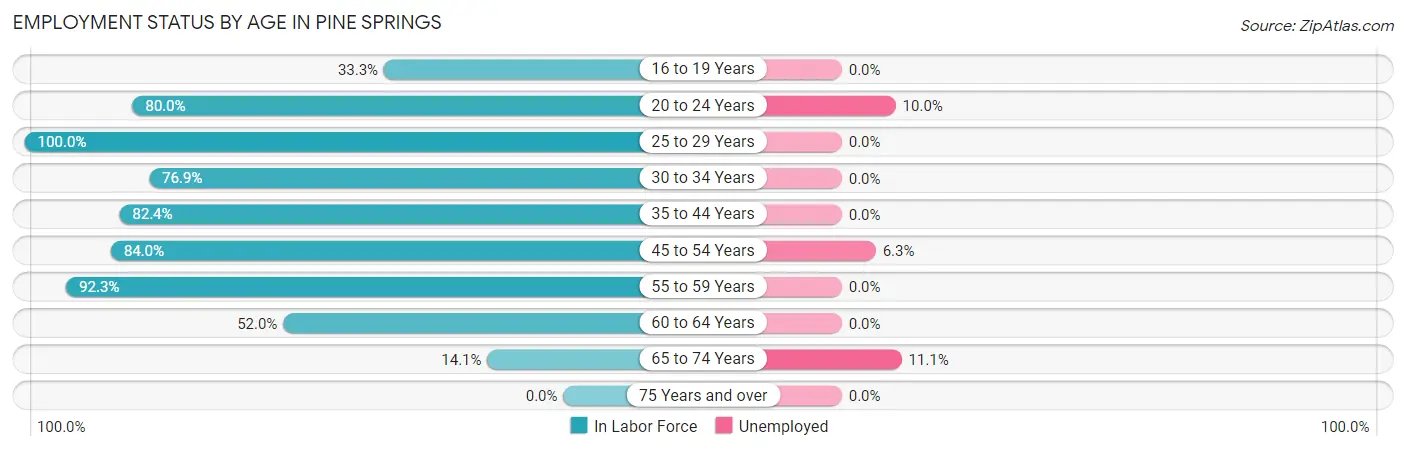
| Age Bracket | In Labor Force | Unemployed |
| 16 to 19 Years | 5 (33.3%) | 0 (0.0%) |
| 20 to 24 Years | 20 (80.0%) | 2 (10.0%) |
| 25 to 29 Years | 17 (100.0%) | 0 (0.0%) |
| 30 to 34 Years | 10 (76.9%) | 0 (0.0%) |
| 35 to 44 Years | 42 (82.4%) | 0 (0.0%) |
| 45 to 54 Years | 63 (84.0%) | 4 (6.3%) |
| 55 to 59 Years | 12 (92.3%) | 0 (0.0%) |
| 60 to 64 Years | 26 (52.0%) | 0 (0.0%) |
| 65 to 74 Years | 9 (14.1%) | 1 (11.1%) |
| 75 Years and over | 0 (0.0%) | 0 (0.0%) |
| Total | 204 (60.0%) | 7 (3.4%) |
Employment Status by Educational Attainment in Pine Springs
According to labor force statistics for Pine Springs, 77.6% of individuals (170) out of the total population between 25 and 64 years of age (219) are in the labor force, with 2.4% or 4 of them being unemployed. The group with the highest labor force participation rate are those with the educational attainment of bachelor's degree or higher, with 80.0% or 112 individuals in the labor force. Within the labor force, individuals with bachelor's degree or higher education have the highest percentage of unemployment, with 3.6% or 4 of them being unemployed.
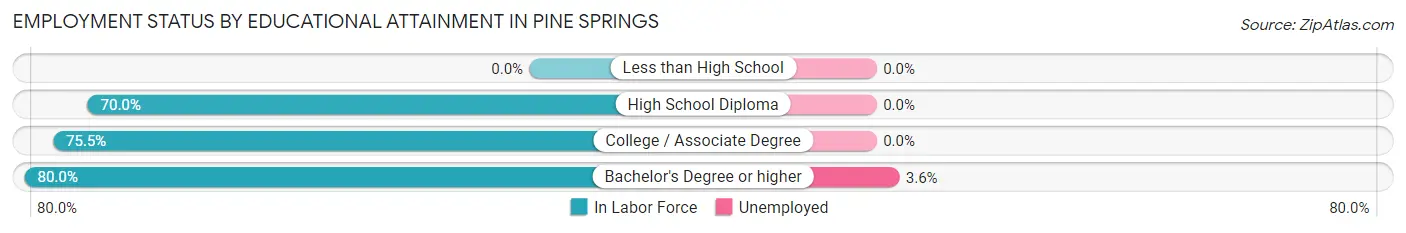
| Educational Attainment | In Labor Force | Unemployed |
| Less than High School | 0 (0.0%) | 0 (0.0%) |
| High School Diploma | 21 (70.0%) | 0 (0.0%) |
| College / Associate Degree | 37 (75.5%) | 0 (0.0%) |
| Bachelor's Degree or higher | 112 (80.0%) | 5 (3.6%) |
| Total | 170 (77.6%) | 5 (2.4%) |
Employment Occupations by Sex in Pine Springs
Management, Business, Science and Arts Occupations
The most common Management, Business, Science and Arts occupations in Pine Springs are Management (37 | 18.8%), Community & Social Service (24 | 12.2%), Computers, Engineering & Science (22 | 11.2%), Health Diagnosing & Treating (18 | 9.1%), and Business & Financial (15 | 7.6%).
Management, Business, Science and Arts Occupations by Sex
Within the Management, Business, Science and Arts occupations in Pine Springs, the most male-oriented occupations are Architecture & Engineering (100.0%), Legal Services & Support (75.0%), and Computers, Engineering & Science (68.2%), while the most female-oriented occupations are Education, Arts & Media (100.0%), Arts, Media & Entertainment (100.0%), and Health Diagnosing & Treating (83.3%).
| Occupation | Male | Female |
| Management | 25 (67.6%) | 12 (32.4%) |
| Business & Financial | 8 (53.3%) | 7 (46.7%) |
| Computers, Engineering & Science | 15 (68.2%) | 7 (31.8%) |
| Computers & Mathematics | 6 (66.7%) | 3 (33.3%) |
| Architecture & Engineering | 8 (100.0%) | 0 (0.0%) |
| Life, Physical & Social Science | 1 (20.0%) | 4 (80.0%) |
| Community & Social Service | 7 (29.2%) | 17 (70.8%) |
| Education, Arts & Media | 0 (0.0%) | 1 (100.0%) |
| Legal Services & Support | 3 (75.0%) | 1 (25.0%) |
| Education Instruction & Library | 4 (33.3%) | 8 (66.7%) |
| Arts, Media & Entertainment | 0 (0.0%) | 7 (100.0%) |
| Health Diagnosing & Treating | 3 (16.7%) | 15 (83.3%) |
| Health Technologists | 3 (20.0%) | 12 (80.0%) |
| Total (Category) | 58 (50.0%) | 58 (50.0%) |
| Total (Overall) | 107 (54.3%) | 90 (45.7%) |
Services Occupations
The most common Services occupations in Pine Springs are Food Preparation & Serving (14 | 7.1%), Healthcare Support (9 | 4.6%), Personal Care & Service (3 | 1.5%), Security & Protection (1 | 0.5%), and Law Enforcement (1 | 0.5%).
Services Occupations by Sex
Within the Services occupations in Pine Springs, the most male-oriented occupations are Security & Protection (100.0%), Law Enforcement (100.0%), and Food Preparation & Serving (78.6%), while the most female-oriented occupations are Healthcare Support (100.0%), Personal Care & Service (100.0%), and Food Preparation & Serving (21.4%).
| Occupation | Male | Female |
| Healthcare Support | 0 (0.0%) | 9 (100.0%) |
| Security & Protection | 1 (100.0%) | 0 (0.0%) |
| Firefighting & Prevention | 0 (0.0%) | 0 (0.0%) |
| Law Enforcement | 1 (100.0%) | 0 (0.0%) |
| Food Preparation & Serving | 11 (78.6%) | 3 (21.4%) |
| Cleaning & Maintenance | 0 (0.0%) | 0 (0.0%) |
| Personal Care & Service | 0 (0.0%) | 3 (100.0%) |
| Total (Category) | 12 (44.4%) | 15 (55.6%) |
| Total (Overall) | 107 (54.3%) | 90 (45.7%) |
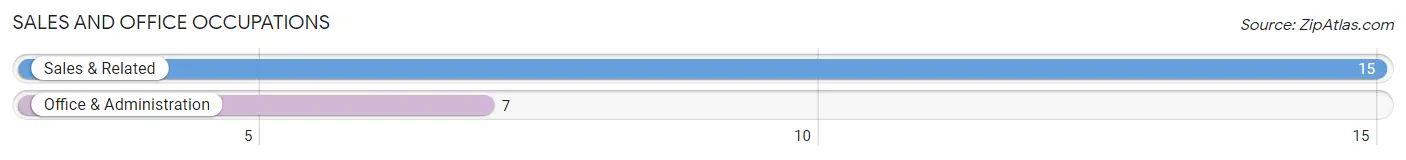
Sales and Office Occupations
The most common Sales and Office occupations in Pine Springs are Sales & Related (15 | 7.6%), and Office & Administration (7 | 3.5%).
Sales and Office Occupations by Sex
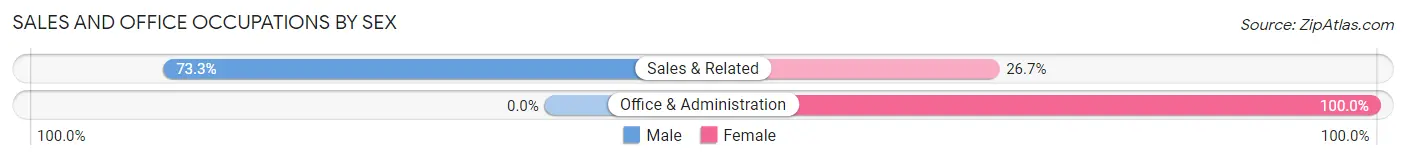
| Occupation | Male | Female |
| Sales & Related | 11 (73.3%) | 4 (26.7%) |
| Office & Administration | 0 (0.0%) | 7 (100.0%) |
| Total (Category) | 11 (50.0%) | 11 (50.0%) |
| Total (Overall) | 107 (54.3%) | 90 (45.7%) |
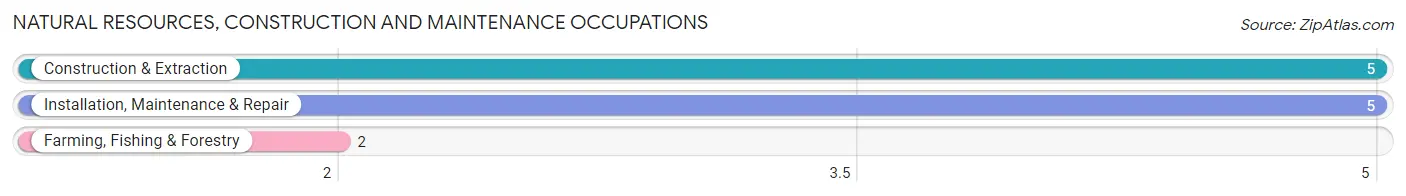
Natural Resources, Construction and Maintenance Occupations
The most common Natural Resources, Construction and Maintenance occupations in Pine Springs are Construction & Extraction (5 | 2.5%), Installation, Maintenance & Repair (5 | 2.5%), and Farming, Fishing & Forestry (2 | 1.0%).
Natural Resources, Construction and Maintenance Occupations by Sex
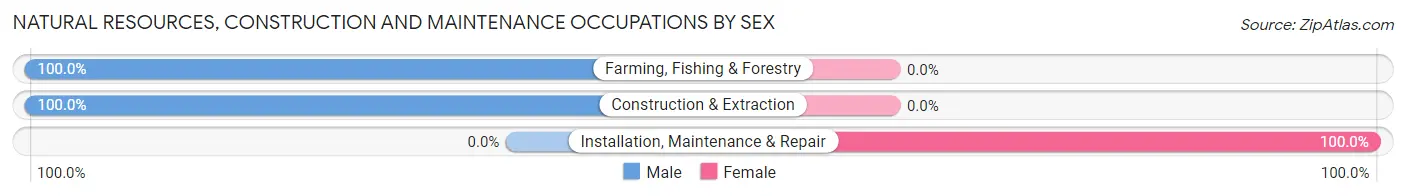
| Occupation | Male | Female |
| Farming, Fishing & Forestry | 2 (100.0%) | 0 (0.0%) |
| Construction & Extraction | 5 (100.0%) | 0 (0.0%) |
| Installation, Maintenance & Repair | 0 (0.0%) | 5 (100.0%) |
| Total (Category) | 7 (58.3%) | 5 (41.7%) |
| Total (Overall) | 107 (54.3%) | 90 (45.7%) |
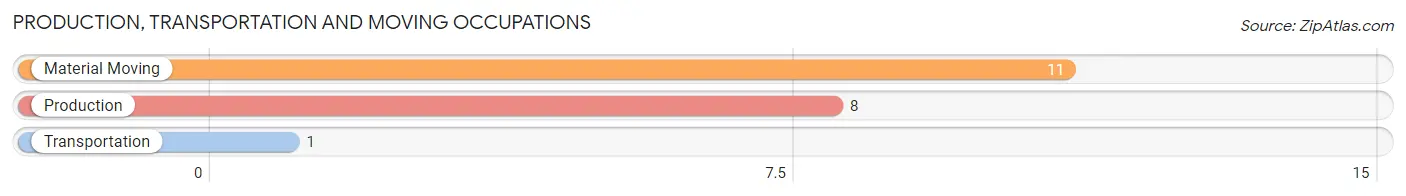
Production, Transportation and Moving Occupations
The most common Production, Transportation and Moving occupations in Pine Springs are Material Moving (11 | 5.6%), Production (8 | 4.1%), and Transportation (1 | 0.5%).
Production, Transportation and Moving Occupations by Sex
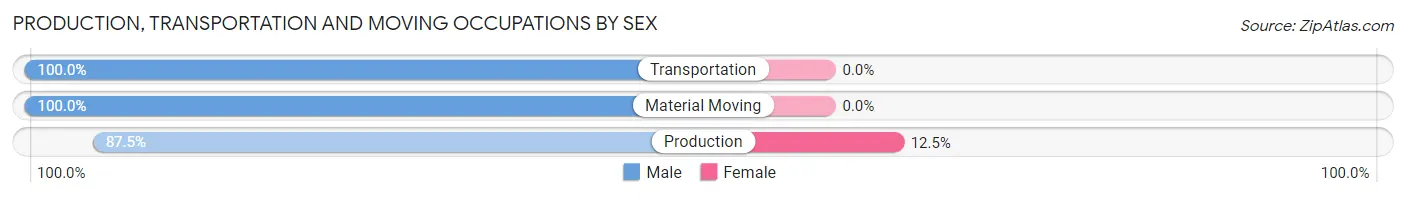
| Occupation | Male | Female |
| Production | 7 (87.5%) | 1 (12.5%) |
| Transportation | 1 (100.0%) | 0 (0.0%) |
| Material Moving | 11 (100.0%) | 0 (0.0%) |
| Total (Category) | 19 (95.0%) | 1 (5.0%) |
| Total (Overall) | 107 (54.3%) | 90 (45.7%) |
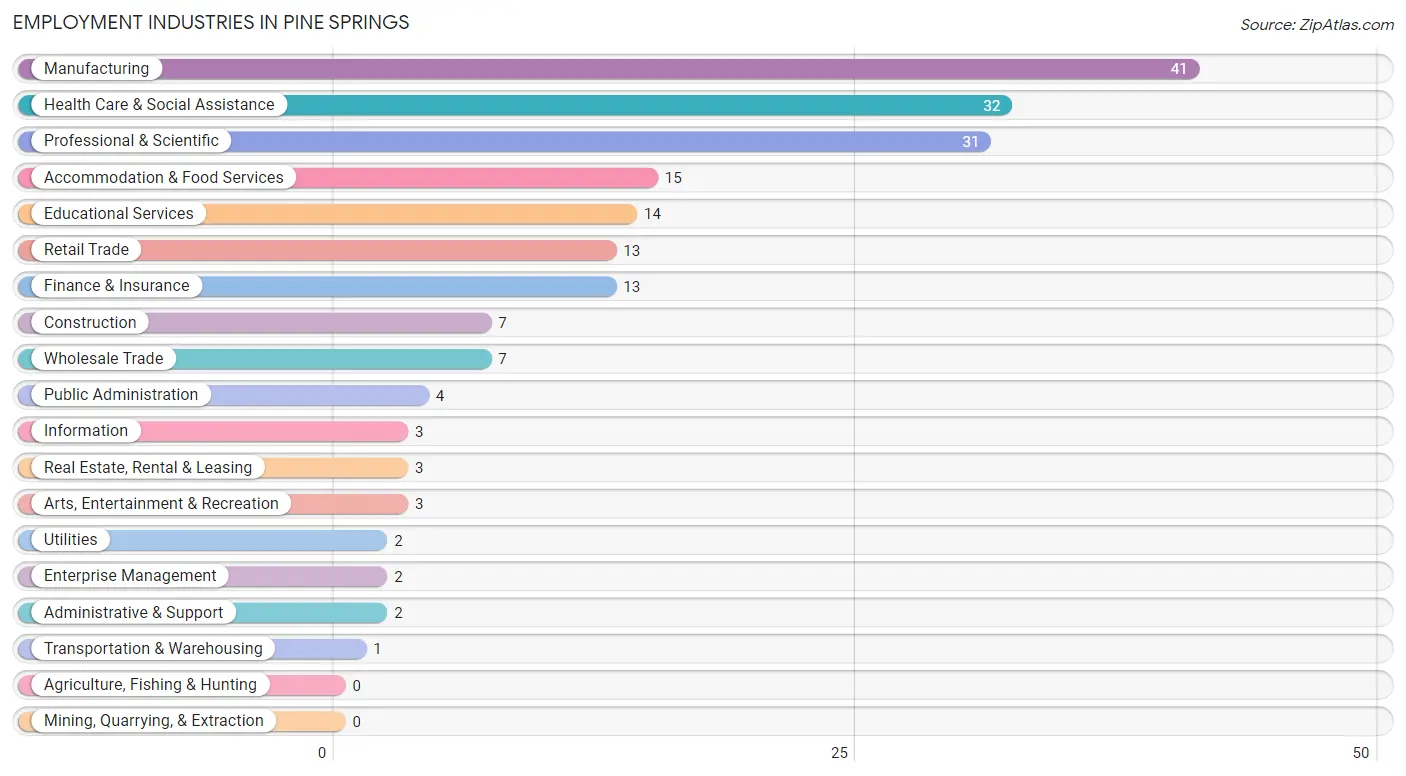
Employment Industries by Sex in Pine Springs
Employment Industries in Pine Springs
The major employment industries in Pine Springs include Manufacturing (41 | 20.8%), Health Care & Social Assistance (32 | 16.2%), Professional & Scientific (31 | 15.7%), Accommodation & Food Services (15 | 7.6%), and Educational Services (14 | 7.1%).
Employment Industries by Sex in Pine Springs
The Pine Springs industries that see more men than women are Construction (100.0%), Transportation & Warehousing (100.0%), and Real Estate, Rental & Leasing (100.0%), whereas the industries that tend to have a higher number of women are Arts, Entertainment & Recreation (100.0%), Health Care & Social Assistance (90.6%), and Wholesale Trade (71.4%).
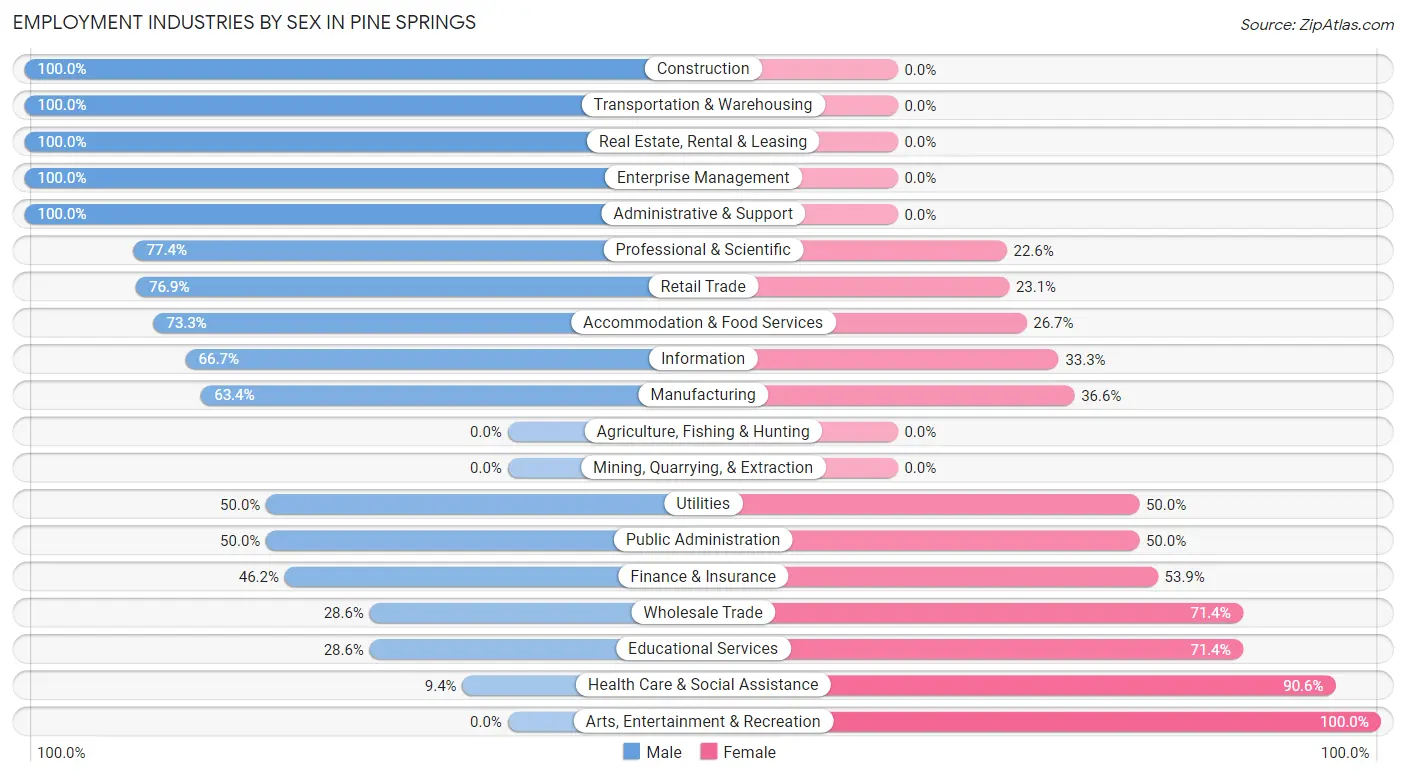
| Industry | Male | Female |
| Agriculture, Fishing & Hunting | 0 (0.0%) | 0 (0.0%) |
| Mining, Quarrying, & Extraction | 0 (0.0%) | 0 (0.0%) |
| Construction | 7 (100.0%) | 0 (0.0%) |
| Manufacturing | 26 (63.4%) | 15 (36.6%) |
| Wholesale Trade | 2 (28.6%) | 5 (71.4%) |
| Retail Trade | 10 (76.9%) | 3 (23.1%) |
| Transportation & Warehousing | 1 (100.0%) | 0 (0.0%) |
| Utilities | 1 (50.0%) | 1 (50.0%) |
| Information | 2 (66.7%) | 1 (33.3%) |
| Finance & Insurance | 6 (46.2%) | 7 (53.8%) |
| Real Estate, Rental & Leasing | 3 (100.0%) | 0 (0.0%) |
| Professional & Scientific | 24 (77.4%) | 7 (22.6%) |
| Enterprise Management | 2 (100.0%) | 0 (0.0%) |
| Administrative & Support | 2 (100.0%) | 0 (0.0%) |
| Educational Services | 4 (28.6%) | 10 (71.4%) |
| Health Care & Social Assistance | 3 (9.4%) | 29 (90.6%) |
| Arts, Entertainment & Recreation | 0 (0.0%) | 3 (100.0%) |
| Accommodation & Food Services | 11 (73.3%) | 4 (26.7%) |
| Public Administration | 2 (50.0%) | 2 (50.0%) |
| Total | 107 (54.3%) | 90 (45.7%) |
Education in Pine Springs
School Enrollment in Pine Springs
The most common levels of schooling among the 109 students in Pine Springs are elementary school (33 | 30.3%), high school (28 | 25.7%), and middle school (27 | 24.8%).
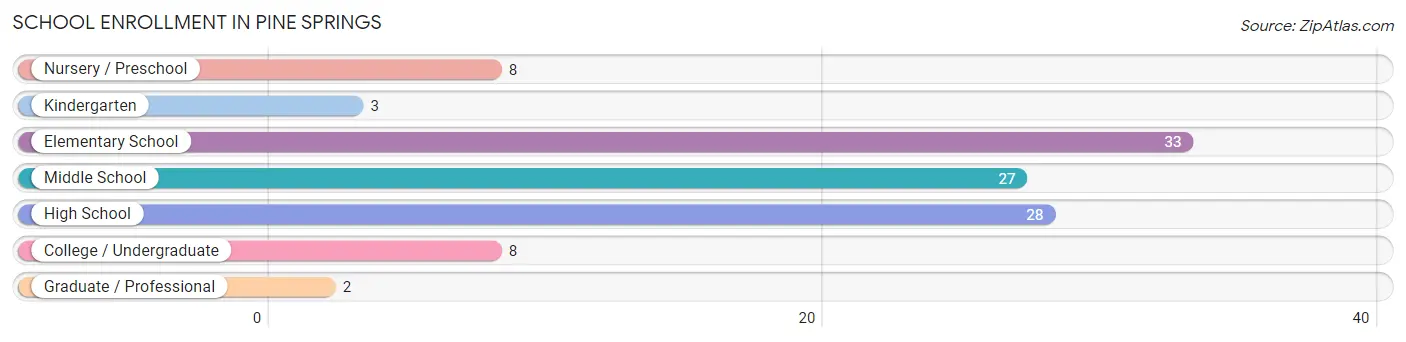
| School Level | # Students | % Students |
| Nursery / Preschool | 8 | 7.3% |
| Kindergarten | 3 | 2.8% |
| Elementary School | 33 | 30.3% |
| Middle School | 27 | 24.8% |
| High School | 28 | 25.7% |
| College / Undergraduate | 8 | 7.3% |
| Graduate / Professional | 2 | 1.8% |
| Total | 109 | 100.0% |
School Enrollment by Age by Funding Source in Pine Springs
Out of a total of 109 students who are enrolled in schools in Pine Springs, 9 (8.3%) attend a private institution, while the remaining 100 (91.7%) are enrolled in public schools. The age group of 3 to 4 year olds has the highest likelihood of being enrolled in private schools, with 2 (50.0% in the age bracket) enrolled. Conversely, the age group of 18 to 19 year olds has the lowest likelihood of being enrolled in a private school, with 4 (100.0% in the age bracket) attending a public institution.
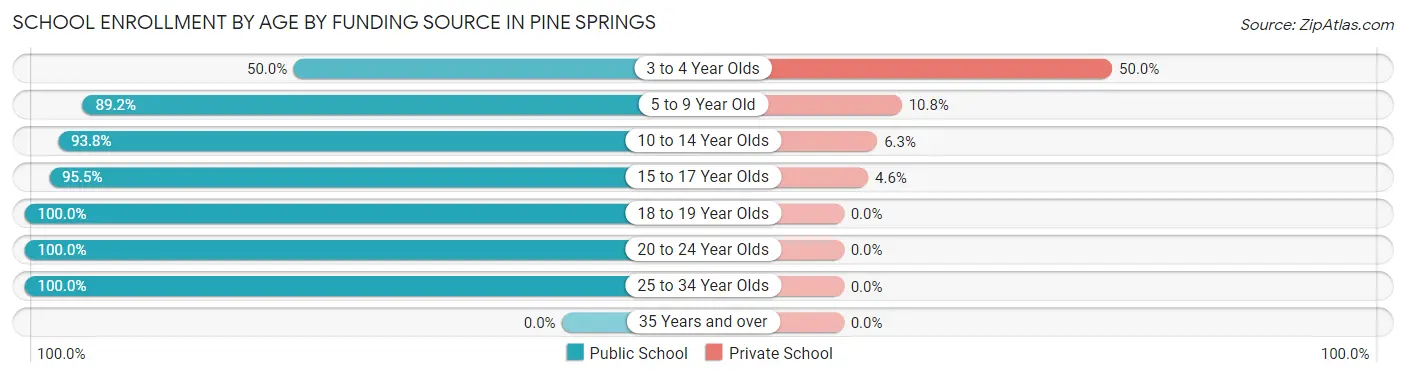
| Age Bracket | Public School | Private School |
| 3 to 4 Year Olds | 2 (50.0%) | 2 (50.0%) |
| 5 to 9 Year Old | 33 (89.2%) | 4 (10.8%) |
| 10 to 14 Year Olds | 30 (93.8%) | 2 (6.2%) |
| 15 to 17 Year Olds | 21 (95.5%) | 1 (4.5%) |
| 18 to 19 Year Olds | 4 (100.0%) | 0 (0.0%) |
| 20 to 24 Year Olds | 7 (100.0%) | 0 (0.0%) |
| 25 to 34 Year Olds | 3 (100.0%) | 0 (0.0%) |
| 35 Years and over | 0 (0.0%) | 0 (0.0%) |
| Total | 100 (91.7%) | 9 (8.3%) |
Educational Attainment by Field of Study in Pine Springs
Business (48 | 22.9%), education (34 | 16.2%), science & technology (32 | 15.2%), engineering (21 | 10.0%), and bio, nature & agricultural (16 | 7.6%) are the most common fields of study among 210 individuals in Pine Springs who have obtained a bachelor's degree or higher.
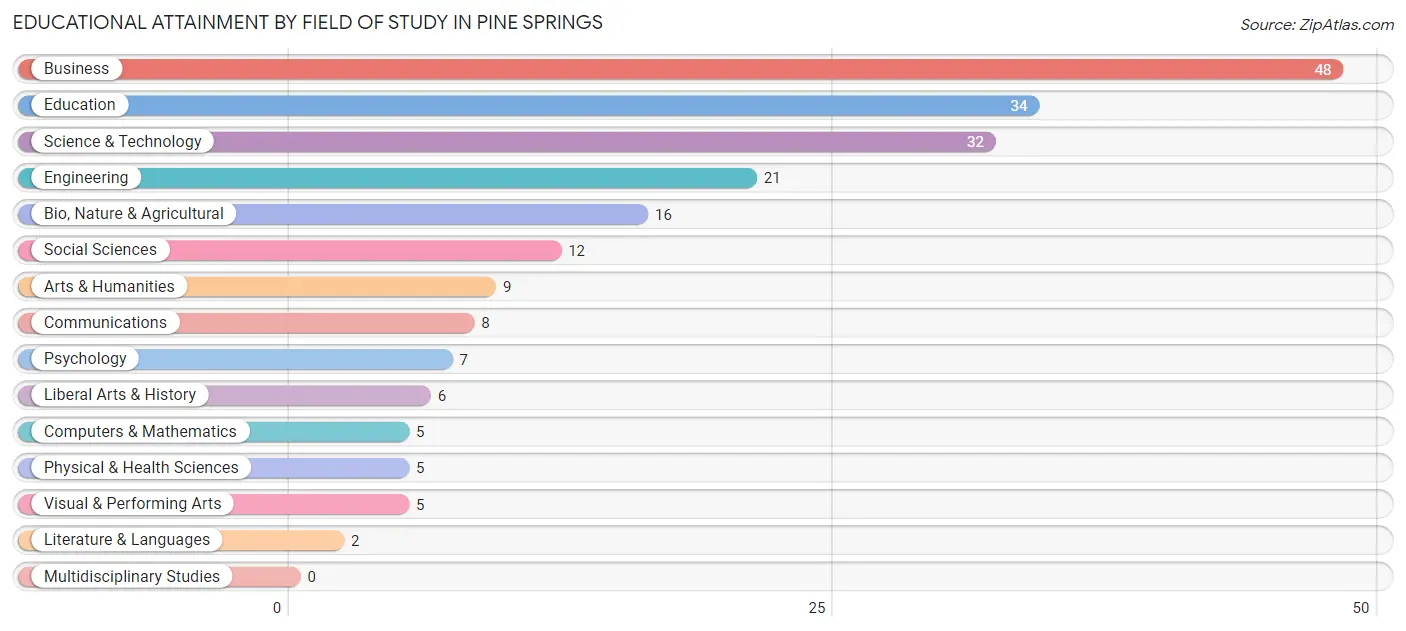
| Field of Study | # Graduates | % Graduates |
| Computers & Mathematics | 5 | 2.4% |
| Bio, Nature & Agricultural | 16 | 7.6% |
| Physical & Health Sciences | 5 | 2.4% |
| Psychology | 7 | 3.3% |
| Social Sciences | 12 | 5.7% |
| Engineering | 21 | 10.0% |
| Multidisciplinary Studies | 0 | 0.0% |
| Science & Technology | 32 | 15.2% |
| Business | 48 | 22.9% |
| Education | 34 | 16.2% |
| Literature & Languages | 2 | 0.9% |
| Liberal Arts & History | 6 | 2.9% |
| Visual & Performing Arts | 5 | 2.4% |
| Communications | 8 | 3.8% |
| Arts & Humanities | 9 | 4.3% |
| Total | 210 | 100.0% |
Transportation & Commute in Pine Springs
Vehicle Availability by Sex in Pine Springs
The most prevalent vehicle ownership categories in Pine Springs are males with 3 vehicles (44, accounting for 41.1%) and females with 3 vehicles (29, making up 53.7%).
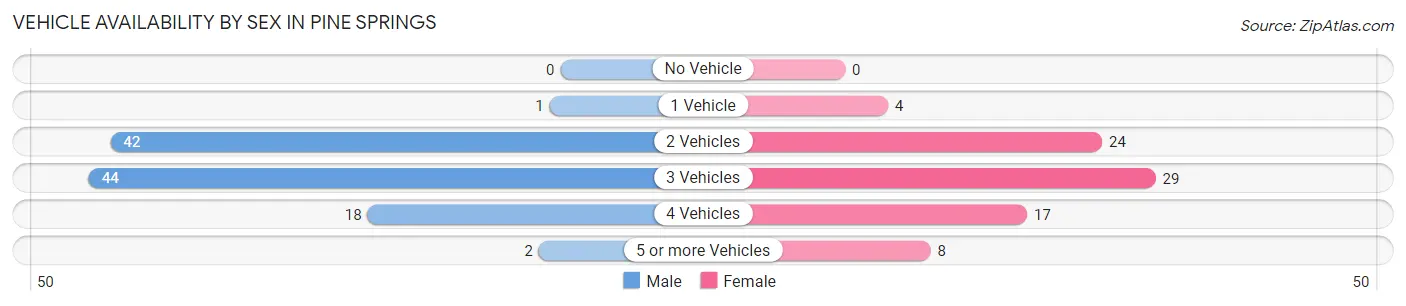
| Vehicles Available | Male | Female |
| No Vehicle | 0 (0.0%) | 0 (0.0%) |
| 1 Vehicle | 1 (0.9%) | 4 (4.9%) |
| 2 Vehicles | 42 (39.3%) | 24 (29.3%) |
| 3 Vehicles | 44 (41.1%) | 29 (35.4%) |
| 4 Vehicles | 18 (16.8%) | 17 (20.7%) |
| 5 or more Vehicles | 2 (1.9%) | 8 (9.8%) |
| Total | 107 (100.0%) | 82 (100.0%) |
Commute Time in Pine Springs
The most frequently occuring commute durations in Pine Springs are 20 to 24 minutes (30 commuters, 19.4%), 30 to 34 minutes (29 commuters, 18.7%), and 10 to 14 minutes (26 commuters, 16.8%).
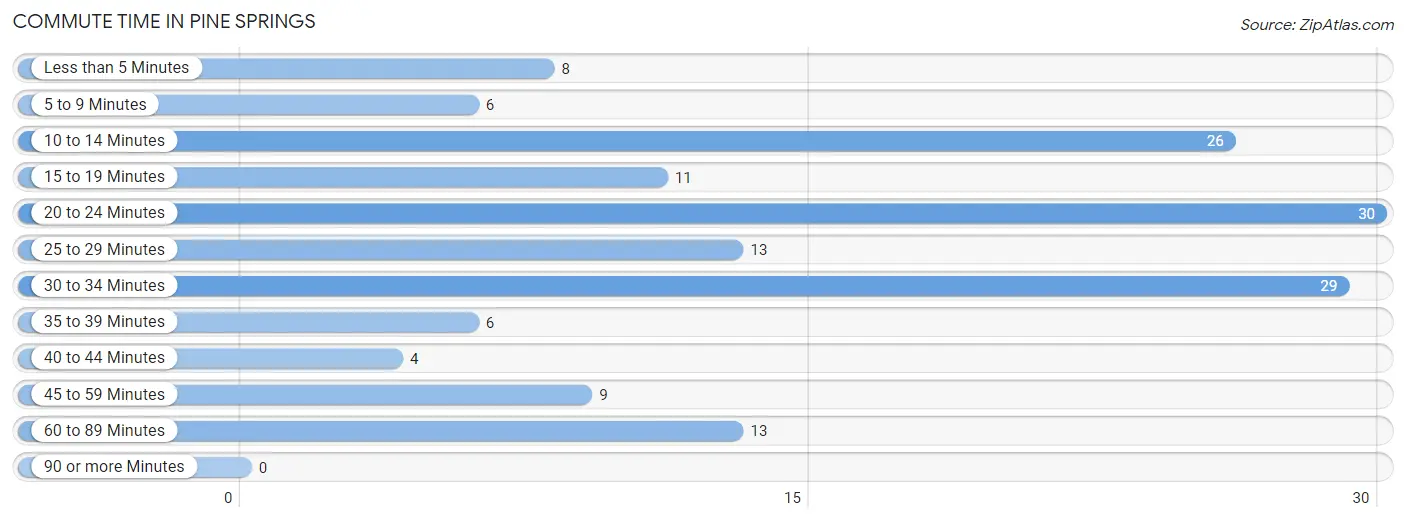
| Commute Time | # Commuters | % Commuters |
| Less than 5 Minutes | 8 | 5.2% |
| 5 to 9 Minutes | 6 | 3.9% |
| 10 to 14 Minutes | 26 | 16.8% |
| 15 to 19 Minutes | 11 | 7.1% |
| 20 to 24 Minutes | 30 | 19.4% |
| 25 to 29 Minutes | 13 | 8.4% |
| 30 to 34 Minutes | 29 | 18.7% |
| 35 to 39 Minutes | 6 | 3.9% |
| 40 to 44 Minutes | 4 | 2.6% |
| 45 to 59 Minutes | 9 | 5.8% |
| 60 to 89 Minutes | 13 | 8.4% |
| 90 or more Minutes | 0 | 0.0% |
Commute Time by Sex in Pine Springs
The most common commute times in Pine Springs are 10 to 14 minutes (17 commuters, 20.0%) for males and 20 to 24 minutes (14 commuters, 20.0%) for females.
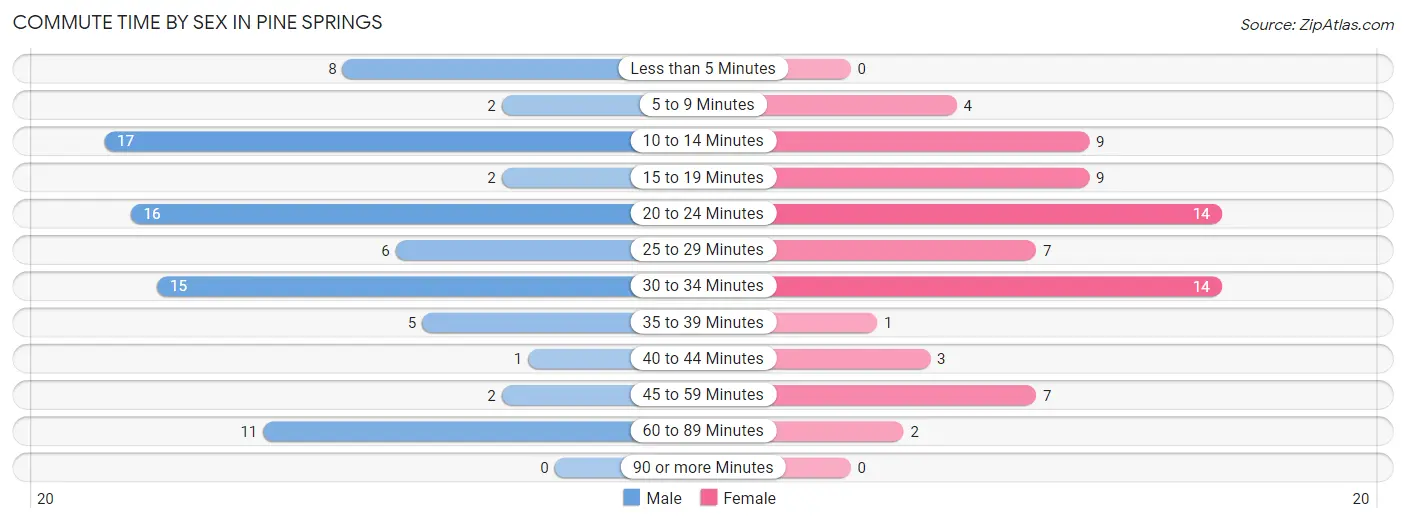
| Commute Time | Male | Female |
| Less than 5 Minutes | 8 (9.4%) | 0 (0.0%) |
| 5 to 9 Minutes | 2 (2.4%) | 4 (5.7%) |
| 10 to 14 Minutes | 17 (20.0%) | 9 (12.9%) |
| 15 to 19 Minutes | 2 (2.4%) | 9 (12.9%) |
| 20 to 24 Minutes | 16 (18.8%) | 14 (20.0%) |
| 25 to 29 Minutes | 6 (7.1%) | 7 (10.0%) |
| 30 to 34 Minutes | 15 (17.6%) | 14 (20.0%) |
| 35 to 39 Minutes | 5 (5.9%) | 1 (1.4%) |
| 40 to 44 Minutes | 1 (1.2%) | 3 (4.3%) |
| 45 to 59 Minutes | 2 (2.4%) | 7 (10.0%) |
| 60 to 89 Minutes | 11 (12.9%) | 2 (2.9%) |
| 90 or more Minutes | 0 (0.0%) | 0 (0.0%) |
Time of Departure to Work by Sex in Pine Springs
The most frequent times of departure to work in Pine Springs are 8:00 AM to 8:29 AM (19, 22.4%) for males and 6:00 AM to 6:29 AM (10, 14.3%) for females.
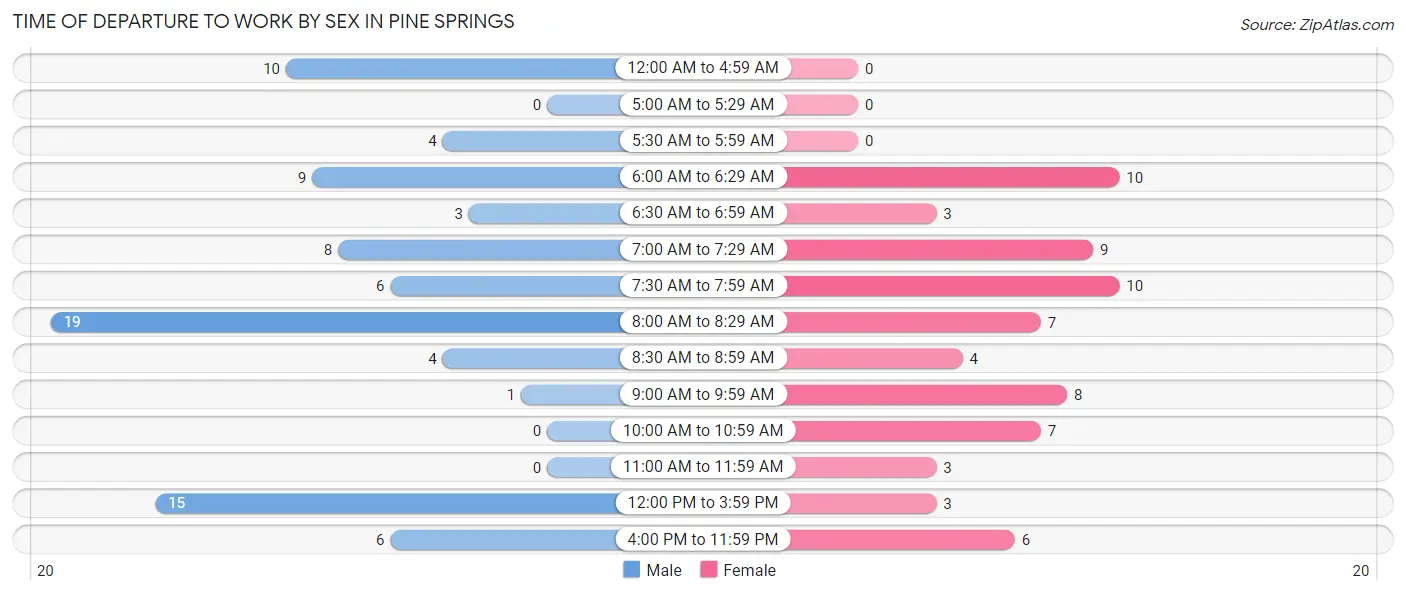
| Time of Departure | Male | Female |
| 12:00 AM to 4:59 AM | 10 (11.8%) | 0 (0.0%) |
| 5:00 AM to 5:29 AM | 0 (0.0%) | 0 (0.0%) |
| 5:30 AM to 5:59 AM | 4 (4.7%) | 0 (0.0%) |
| 6:00 AM to 6:29 AM | 9 (10.6%) | 10 (14.3%) |
| 6:30 AM to 6:59 AM | 3 (3.5%) | 3 (4.3%) |
| 7:00 AM to 7:29 AM | 8 (9.4%) | 9 (12.9%) |
| 7:30 AM to 7:59 AM | 6 (7.1%) | 10 (14.3%) |
| 8:00 AM to 8:29 AM | 19 (22.4%) | 7 (10.0%) |
| 8:30 AM to 8:59 AM | 4 (4.7%) | 4 (5.7%) |
| 9:00 AM to 9:59 AM | 1 (1.2%) | 8 (11.4%) |
| 10:00 AM to 10:59 AM | 0 (0.0%) | 7 (10.0%) |
| 11:00 AM to 11:59 AM | 0 (0.0%) | 3 (4.3%) |
| 12:00 PM to 3:59 PM | 15 (17.6%) | 3 (4.3%) |
| 4:00 PM to 11:59 PM | 6 (7.1%) | 6 (8.6%) |
| Total | 85 (100.0%) | 70 (100.0%) |
Housing Occupancy in Pine Springs
Occupancy by Ownership in Pine Springs
Of the total 148 dwellings in Pine Springs, owner-occupied units account for 147 (99.3%), while renter-occupied units make up 1 (0.7%).
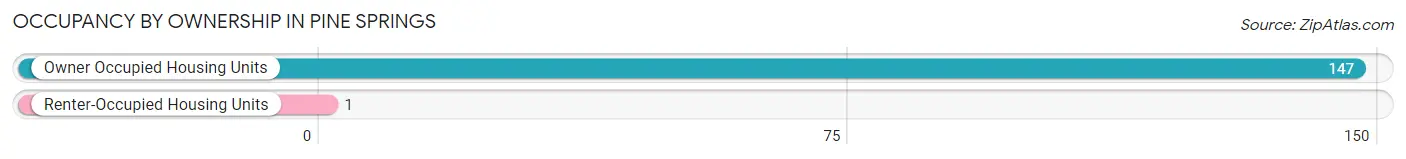
| Occupancy | # Housing Units | % Housing Units |
| Owner Occupied Housing Units | 147 | 99.3% |
| Renter-Occupied Housing Units | 1 | 0.7% |
| Total Occupied Housing Units | 148 | 100.0% |
Occupancy by Household Size in Pine Springs
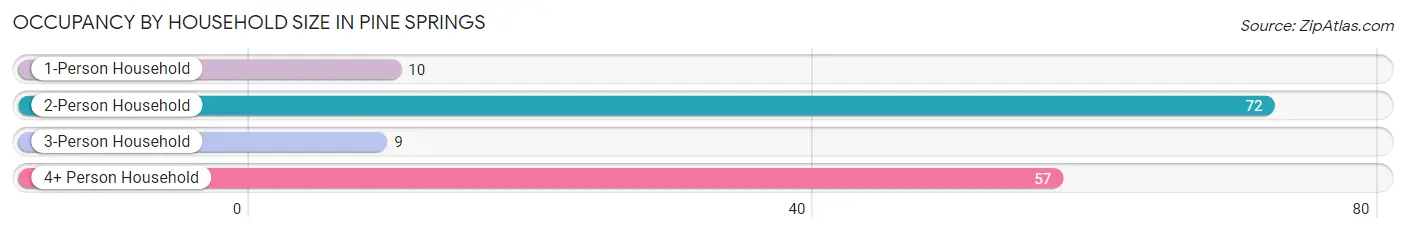
| Household Size | # Housing Units | % Housing Units |
| 1-Person Household | 10 | 6.8% |
| 2-Person Household | 72 | 48.6% |
| 3-Person Household | 9 | 6.1% |
| 4+ Person Household | 57 | 38.5% |
| Total Housing Units | 148 | 100.0% |
Occupancy by Ownership by Household Size in Pine Springs
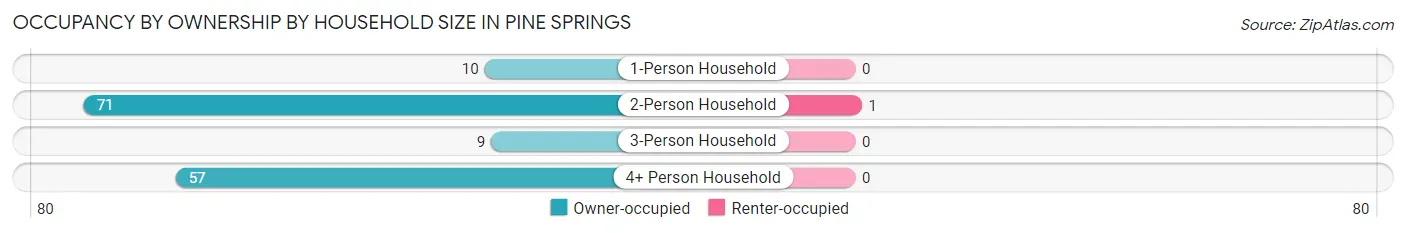
| Household Size | Owner-occupied | Renter-occupied |
| 1-Person Household | 10 (100.0%) | 0 (0.0%) |
| 2-Person Household | 71 (98.6%) | 1 (1.4%) |
| 3-Person Household | 9 (100.0%) | 0 (0.0%) |
| 4+ Person Household | 57 (100.0%) | 0 (0.0%) |
| Total Housing Units | 147 (99.3%) | 1 (0.7%) |
Occupancy by Educational Attainment in Pine Springs
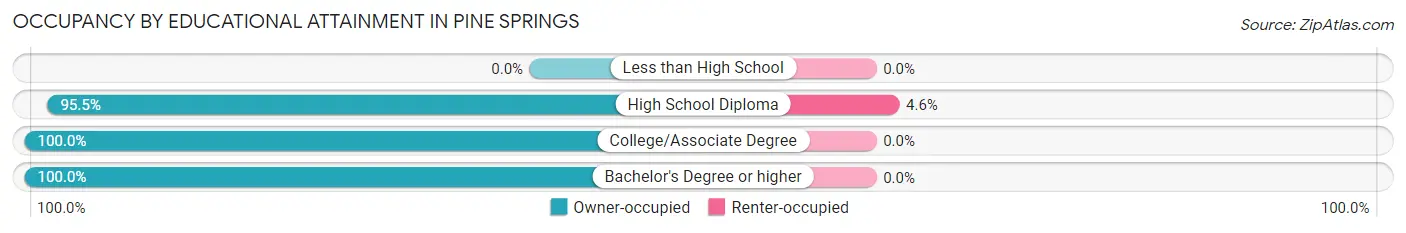
| Household Size | Owner-occupied | Renter-occupied |
| Less than High School | 0 (0.0%) | 0 (0.0%) |
| High School Diploma | 21 (95.5%) | 1 (4.5%) |
| College/Associate Degree | 40 (100.0%) | 0 (0.0%) |
| Bachelor's Degree or higher | 86 (100.0%) | 0 (0.0%) |
Occupancy by Age of Householder in Pine Springs
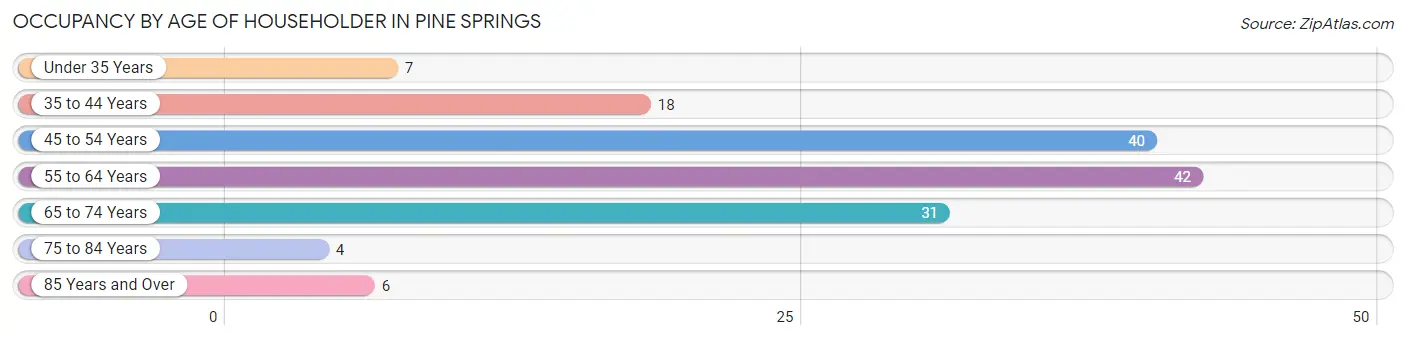
| Age Bracket | # Households | % Households |
| Under 35 Years | 7 | 4.7% |
| 35 to 44 Years | 18 | 12.2% |
| 45 to 54 Years | 40 | 27.0% |
| 55 to 64 Years | 42 | 28.4% |
| 65 to 74 Years | 31 | 20.9% |
| 75 to 84 Years | 4 | 2.7% |
| 85 Years and Over | 6 | 4.1% |
| Total | 148 | 100.0% |
Housing Finances in Pine Springs
Median Income by Occupancy in Pine Springs
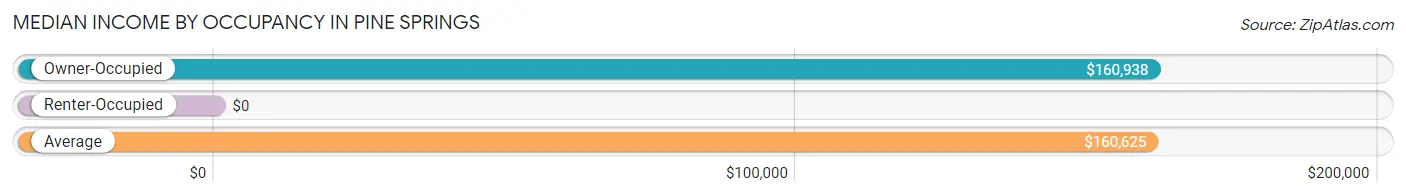
| Occupancy Type | # Households | Median Income |
| Owner-Occupied | 147 (99.3%) | $160,938 |
| Renter-Occupied | 1 (0.7%) | $0 |
| Average | 148 (100.0%) | $160,625 |
Occupancy by Householder Income Bracket in Pine Springs
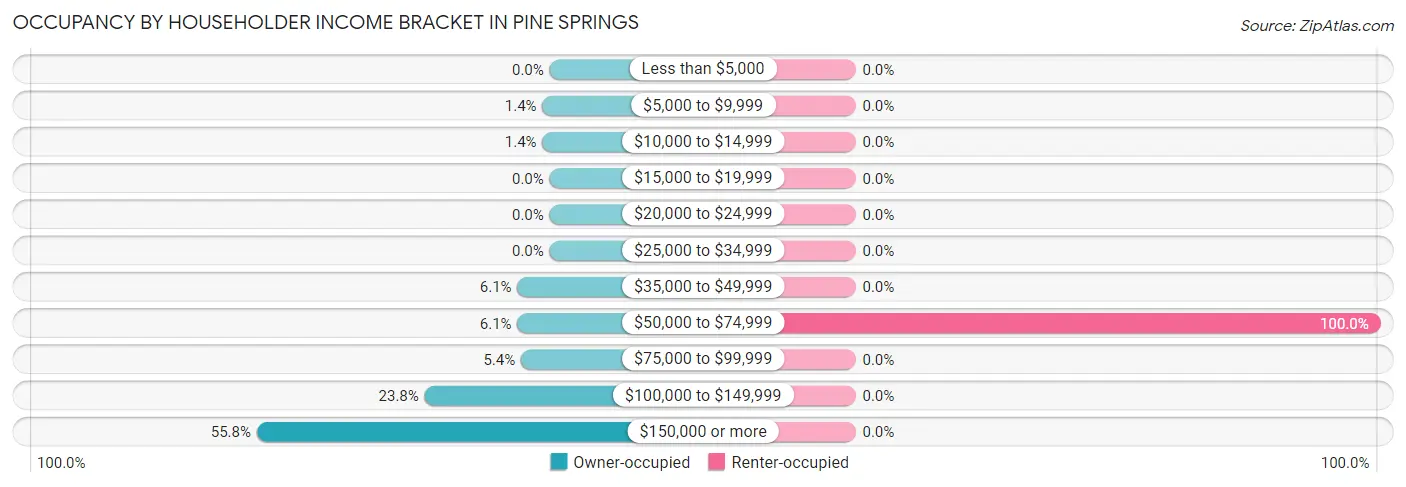
| Income Bracket | Owner-occupied | Renter-occupied |
| Less than $5,000 | 0 (0.0%) | 0 (0.0%) |
| $5,000 to $9,999 | 2 (1.4%) | 0 (0.0%) |
| $10,000 to $14,999 | 2 (1.4%) | 0 (0.0%) |
| $15,000 to $19,999 | 0 (0.0%) | 0 (0.0%) |
| $20,000 to $24,999 | 0 (0.0%) | 0 (0.0%) |
| $25,000 to $34,999 | 0 (0.0%) | 0 (0.0%) |
| $35,000 to $49,999 | 9 (6.1%) | 0 (0.0%) |
| $50,000 to $74,999 | 9 (6.1%) | 1 (100.0%) |
| $75,000 to $99,999 | 8 (5.4%) | 0 (0.0%) |
| $100,000 to $149,999 | 35 (23.8%) | 0 (0.0%) |
| $150,000 or more | 82 (55.8%) | 0 (0.0%) |
| Total | 147 (100.0%) | 1 (100.0%) |
Monthly Housing Cost Tiers in Pine Springs
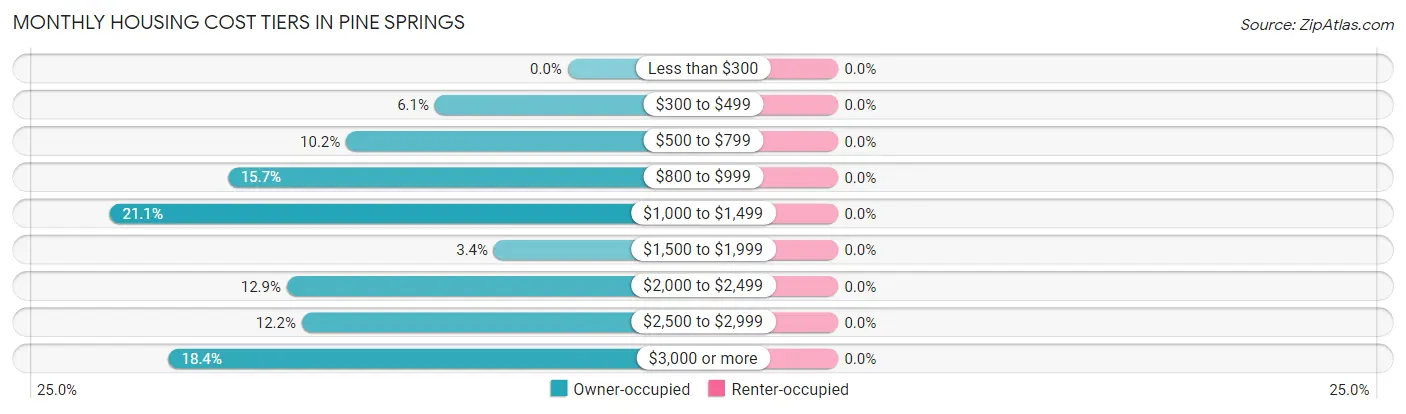
| Monthly Cost | Owner-occupied | Renter-occupied |
| Less than $300 | 0 (0.0%) | 0 (0.0%) |
| $300 to $499 | 9 (6.1%) | 0 (0.0%) |
| $500 to $799 | 15 (10.2%) | 0 (0.0%) |
| $800 to $999 | 23 (15.7%) | 0 (0.0%) |
| $1,000 to $1,499 | 31 (21.1%) | 0 (0.0%) |
| $1,500 to $1,999 | 5 (3.4%) | 0 (0.0%) |
| $2,000 to $2,499 | 19 (12.9%) | 0 (0.0%) |
| $2,500 to $2,999 | 18 (12.2%) | 0 (0.0%) |
| $3,000 or more | 27 (18.4%) | 0 (0.0%) |
| Total | 147 (100.0%) | 1 (100.0%) |
Physical Housing Characteristics in Pine Springs
Housing Structures in Pine Springs
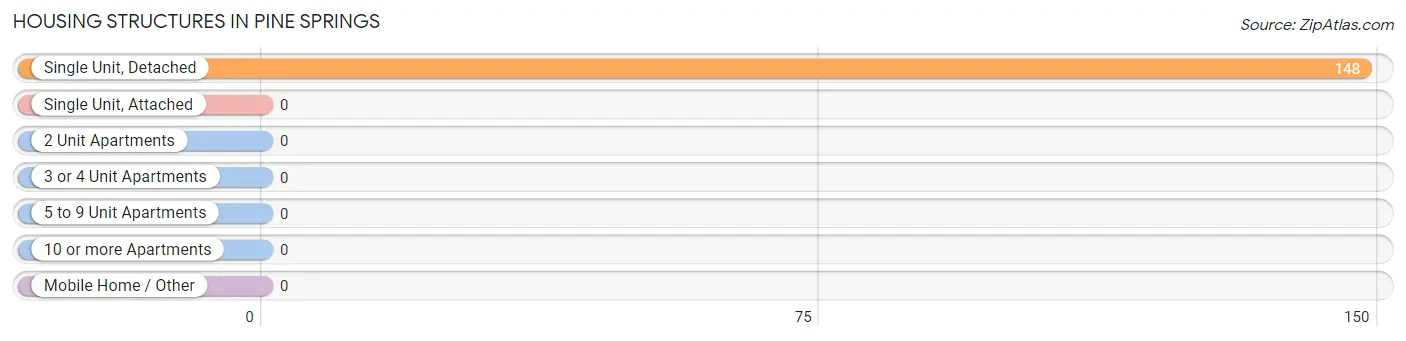
| Structure Type | # Housing Units | % Housing Units |
| Single Unit, Detached | 148 | 100.0% |
| Single Unit, Attached | 0 | 0.0% |
| 2 Unit Apartments | 0 | 0.0% |
| 3 or 4 Unit Apartments | 0 | 0.0% |
| 5 to 9 Unit Apartments | 0 | 0.0% |
| 10 or more Apartments | 0 | 0.0% |
| Mobile Home / Other | 0 | 0.0% |
| Total | 148 | 100.0% |
Housing Structures by Occupancy in Pine Springs
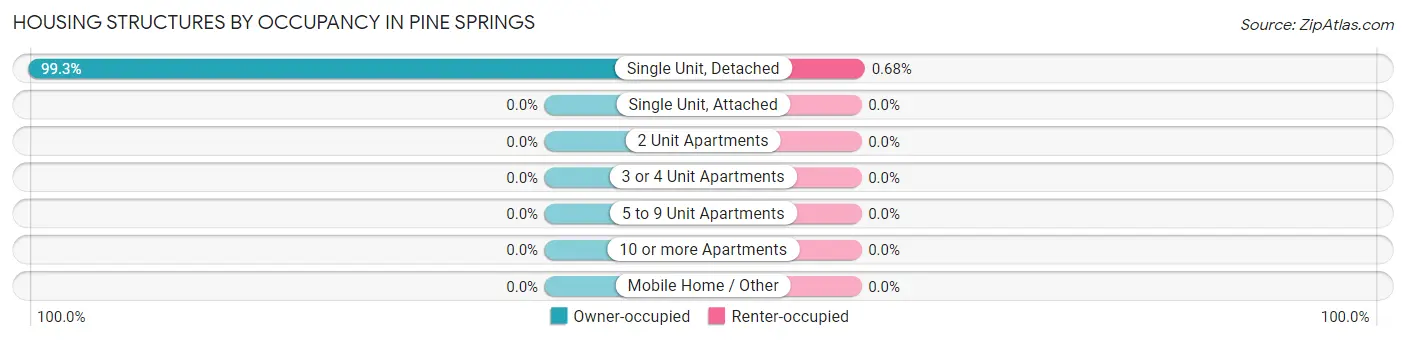
| Structure Type | Owner-occupied | Renter-occupied |
| Single Unit, Detached | 147 (99.3%) | 1 (0.7%) |
| Single Unit, Attached | 0 (0.0%) | 0 (0.0%) |
| 2 Unit Apartments | 0 (0.0%) | 0 (0.0%) |
| 3 or 4 Unit Apartments | 0 (0.0%) | 0 (0.0%) |
| 5 to 9 Unit Apartments | 0 (0.0%) | 0 (0.0%) |
| 10 or more Apartments | 0 (0.0%) | 0 (0.0%) |
| Mobile Home / Other | 0 (0.0%) | 0 (0.0%) |
| Total | 147 (99.3%) | 1 (0.7%) |
Housing Structures by Number of Rooms in Pine Springs
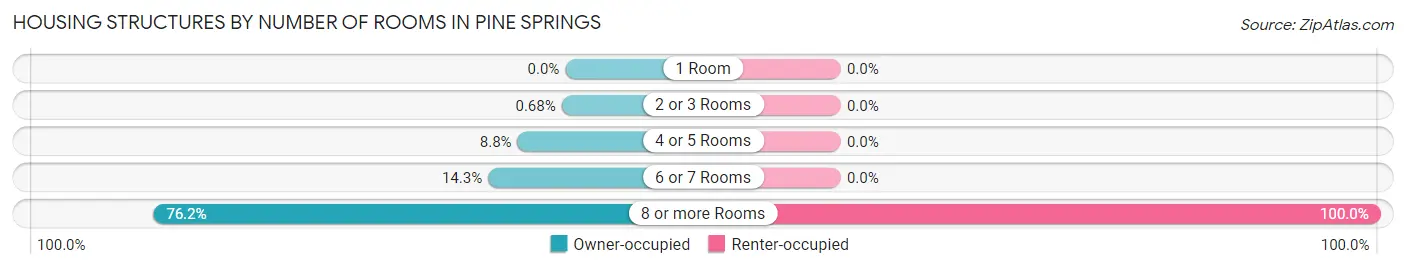
| Number of Rooms | Owner-occupied | Renter-occupied |
| 1 Room | 0 (0.0%) | 0 (0.0%) |
| 2 or 3 Rooms | 1 (0.7%) | 0 (0.0%) |
| 4 or 5 Rooms | 13 (8.8%) | 0 (0.0%) |
| 6 or 7 Rooms | 21 (14.3%) | 0 (0.0%) |
| 8 or more Rooms | 112 (76.2%) | 1 (100.0%) |
| Total | 147 (100.0%) | 1 (100.0%) |
Housing Structure by Heating Type in Pine Springs
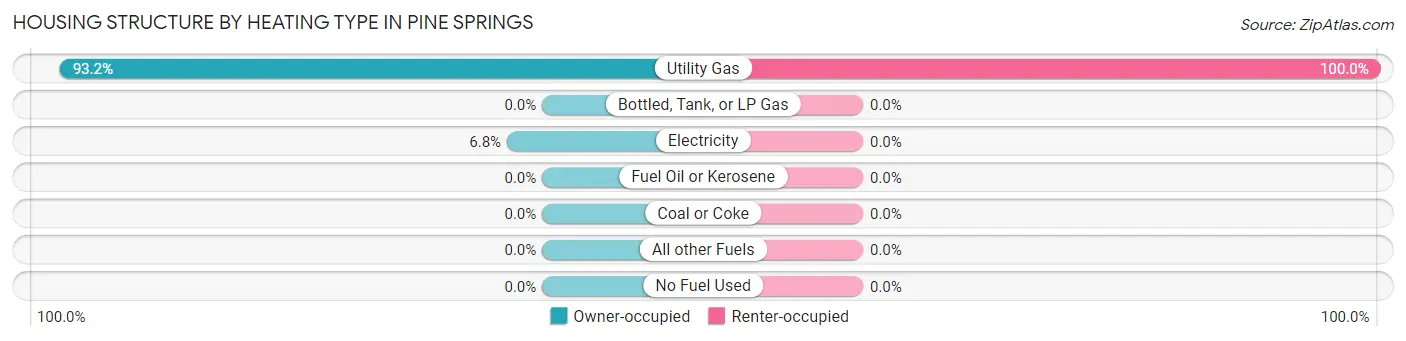
| Heating Type | Owner-occupied | Renter-occupied |
| Utility Gas | 137 (93.2%) | 1 (100.0%) |
| Bottled, Tank, or LP Gas | 0 (0.0%) | 0 (0.0%) |
| Electricity | 10 (6.8%) | 0 (0.0%) |
| Fuel Oil or Kerosene | 0 (0.0%) | 0 (0.0%) |
| Coal or Coke | 0 (0.0%) | 0 (0.0%) |
| All other Fuels | 0 (0.0%) | 0 (0.0%) |
| No Fuel Used | 0 (0.0%) | 0 (0.0%) |
| Total | 147 (100.0%) | 1 (100.0%) |
Household Vehicle Usage in Pine Springs
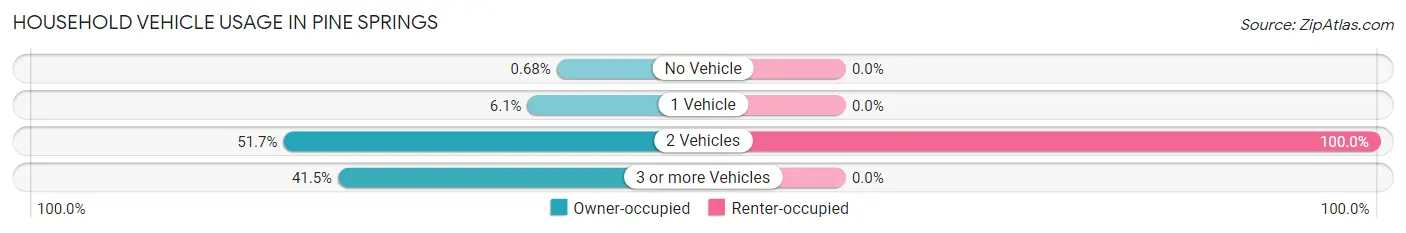
| Vehicles per Household | Owner-occupied | Renter-occupied |
| No Vehicle | 1 (0.7%) | 0 (0.0%) |
| 1 Vehicle | 9 (6.1%) | 0 (0.0%) |
| 2 Vehicles | 76 (51.7%) | 1 (100.0%) |
| 3 or more Vehicles | 61 (41.5%) | 0 (0.0%) |
| Total | 147 (100.0%) | 1 (100.0%) |
Real Estate & Mortgages in Pine Springs
Real Estate and Mortgage Overview in Pine Springs
| Characteristic | Without Mortgage | With Mortgage |
| Housing Units | 64 | 83 |
| Median Property Value | $568,800 | $587,300 |
| Median Household Income | $132,500 | $52 |
| Monthly Housing Costs | $856 | $27 |
| Real Estate Taxes | $4,525 | $0 |
Property Value by Mortgage Status in Pine Springs
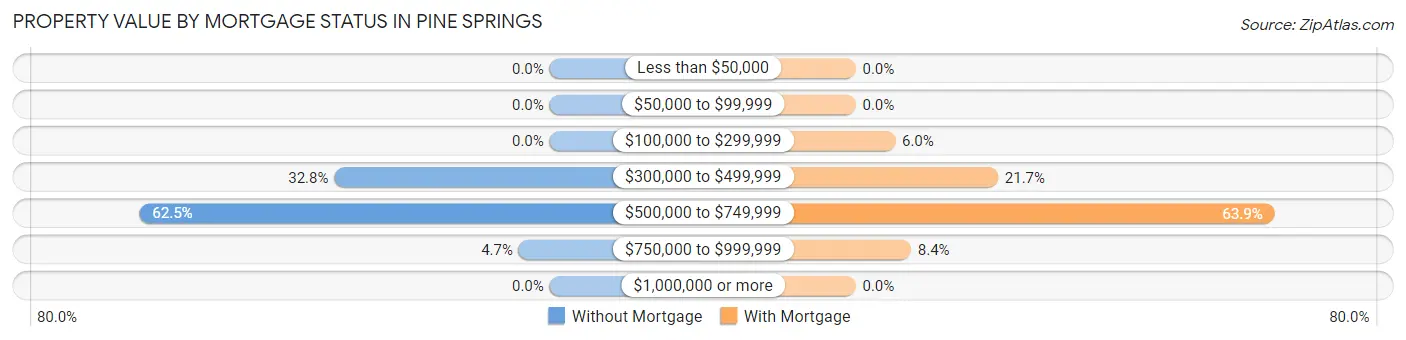
| Property Value | Without Mortgage | With Mortgage |
| Less than $50,000 | 0 (0.0%) | 0 (0.0%) |
| $50,000 to $99,999 | 0 (0.0%) | 0 (0.0%) |
| $100,000 to $299,999 | 0 (0.0%) | 5 (6.0%) |
| $300,000 to $499,999 | 21 (32.8%) | 18 (21.7%) |
| $500,000 to $749,999 | 40 (62.5%) | 53 (63.9%) |
| $750,000 to $999,999 | 3 (4.7%) | 7 (8.4%) |
| $1,000,000 or more | 0 (0.0%) | 0 (0.0%) |
| Total | 64 (100.0%) | 83 (100.0%) |
Household Income by Mortgage Status in Pine Springs
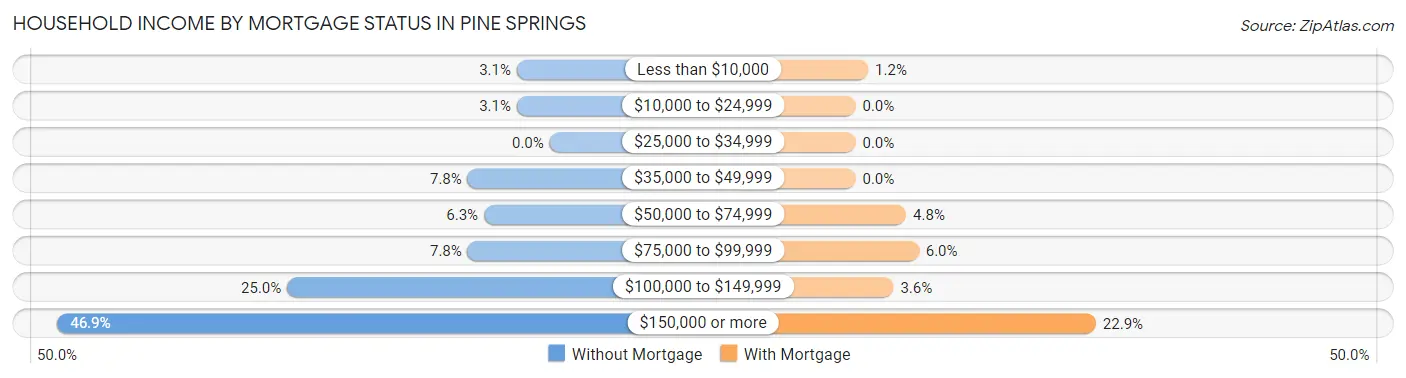
| Household Income | Without Mortgage | With Mortgage |
| Less than $10,000 | 2 (3.1%) | 1 (1.2%) |
| $10,000 to $24,999 | 2 (3.1%) | 0 (0.0%) |
| $25,000 to $34,999 | 0 (0.0%) | 0 (0.0%) |
| $35,000 to $49,999 | 5 (7.8%) | 0 (0.0%) |
| $50,000 to $74,999 | 4 (6.2%) | 4 (4.8%) |
| $75,000 to $99,999 | 5 (7.8%) | 5 (6.0%) |
| $100,000 to $149,999 | 16 (25.0%) | 3 (3.6%) |
| $150,000 or more | 30 (46.9%) | 19 (22.9%) |
| Total | 64 (100.0%) | 83 (100.0%) |
Property Value to Household Income Ratio in Pine Springs
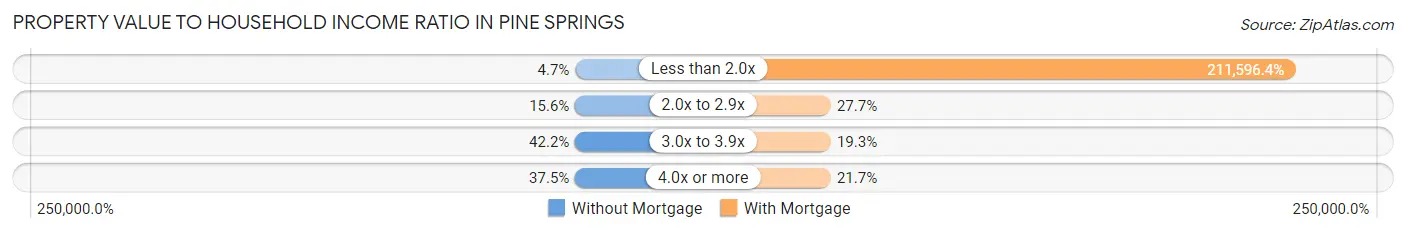
| Value-to-Income Ratio | Without Mortgage | With Mortgage |
| Less than 2.0x | 3 (4.7%) | 175,625 (211,596.4%) |
| 2.0x to 2.9x | 10 (15.6%) | 23 (27.7%) |
| 3.0x to 3.9x | 27 (42.2%) | 16 (19.3%) |
| 4.0x or more | 24 (37.5%) | 18 (21.7%) |
| Total | 64 (100.0%) | 83 (100.0%) |
Real Estate Taxes by Mortgage Status in Pine Springs
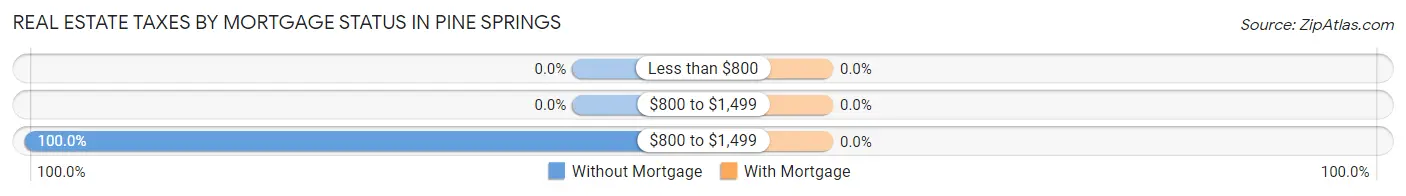
| Property Taxes | Without Mortgage | With Mortgage |
| Less than $800 | 0 (0.0%) | 0 (0.0%) |
| $800 to $1,499 | 0 (0.0%) | 0 (0.0%) |
| $800 to $1,499 | 64 (100.0%) | 0 (0.0%) |
| Total | 64 (100.0%) | 83 (100.0%) |
Health & Disability in Pine Springs
Health Insurance Coverage by Age in Pine Springs
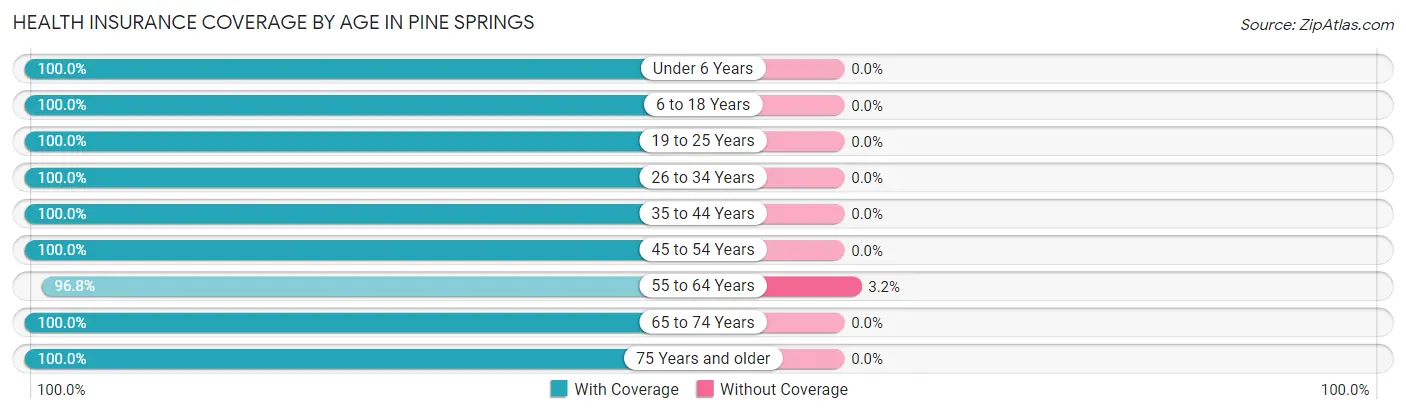
| Age Bracket | With Coverage | Without Coverage |
| Under 6 Years | 26 (100.0%) | 0 (0.0%) |
| 6 to 18 Years | 92 (100.0%) | 0 (0.0%) |
| 19 to 25 Years | 26 (100.0%) | 0 (0.0%) |
| 26 to 34 Years | 29 (100.0%) | 0 (0.0%) |
| 35 to 44 Years | 51 (100.0%) | 0 (0.0%) |
| 45 to 54 Years | 75 (100.0%) | 0 (0.0%) |
| 55 to 64 Years | 61 (96.8%) | 2 (3.2%) |
| 65 to 74 Years | 64 (100.0%) | 0 (0.0%) |
| 75 Years and older | 17 (100.0%) | 0 (0.0%) |
| Total | 441 (99.6%) | 2 (0.4%) |
Health Insurance Coverage by Citizenship Status in Pine Springs
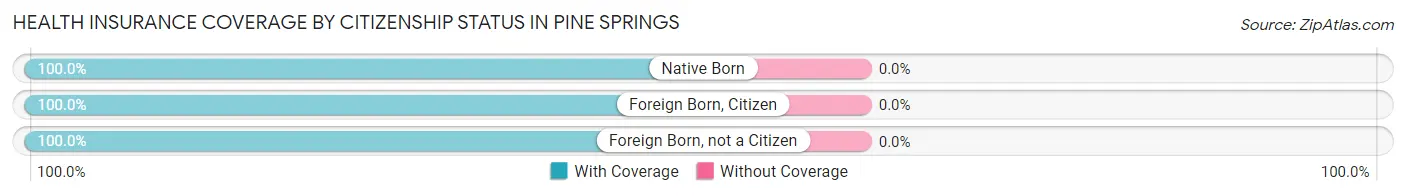
| Citizenship Status | With Coverage | Without Coverage |
| Native Born | 26 (100.0%) | 0 (0.0%) |
| Foreign Born, Citizen | 92 (100.0%) | 0 (0.0%) |
| Foreign Born, not a Citizen | 26 (100.0%) | 0 (0.0%) |
Health Insurance Coverage by Household Income in Pine Springs
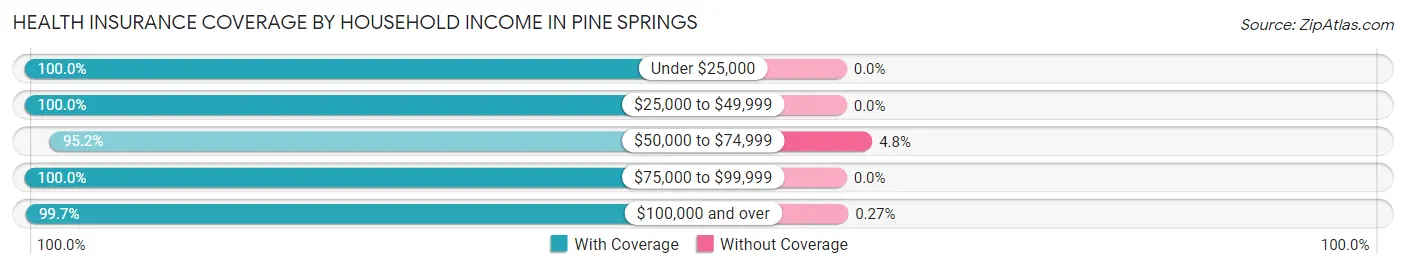
| Household Income | With Coverage | Without Coverage |
| Under $25,000 | 5 (100.0%) | 0 (0.0%) |
| $25,000 to $49,999 | 19 (100.0%) | 0 (0.0%) |
| $50,000 to $74,999 | 20 (95.2%) | 1 (4.8%) |
| $75,000 to $99,999 | 29 (100.0%) | 0 (0.0%) |
| $100,000 and over | 368 (99.7%) | 1 (0.3%) |
Public vs Private Health Insurance Coverage by Age in Pine Springs
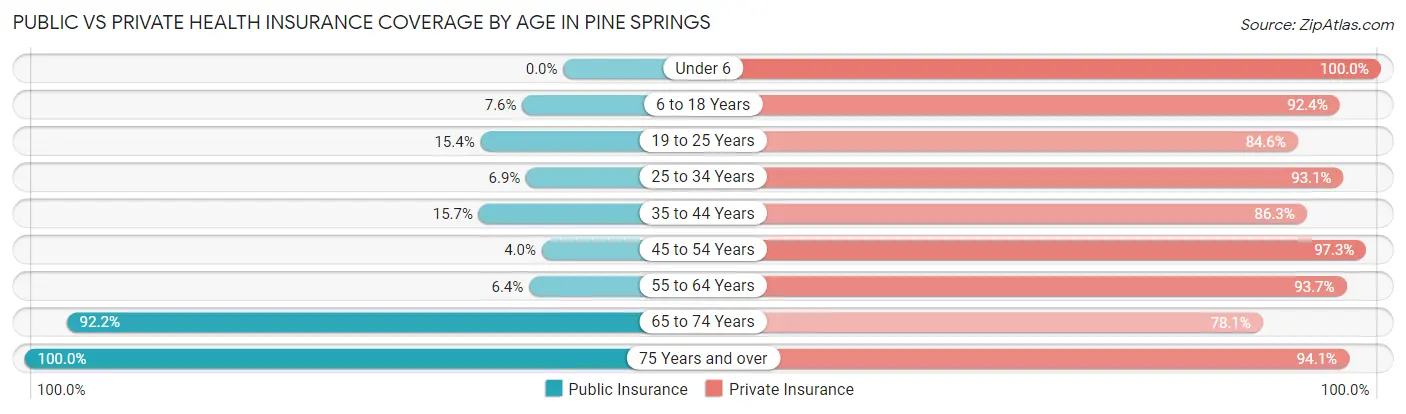
| Age Bracket | Public Insurance | Private Insurance |
| Under 6 | 0 (0.0%) | 26 (100.0%) |
| 6 to 18 Years | 7 (7.6%) | 85 (92.4%) |
| 19 to 25 Years | 4 (15.4%) | 22 (84.6%) |
| 25 to 34 Years | 2 (6.9%) | 27 (93.1%) |
| 35 to 44 Years | 8 (15.7%) | 44 (86.3%) |
| 45 to 54 Years | 3 (4.0%) | 73 (97.3%) |
| 55 to 64 Years | 4 (6.4%) | 59 (93.6%) |
| 65 to 74 Years | 59 (92.2%) | 50 (78.1%) |
| 75 Years and over | 17 (100.0%) | 16 (94.1%) |
| Total | 104 (23.5%) | 402 (90.7%) |
Disability Status by Sex by Age in Pine Springs
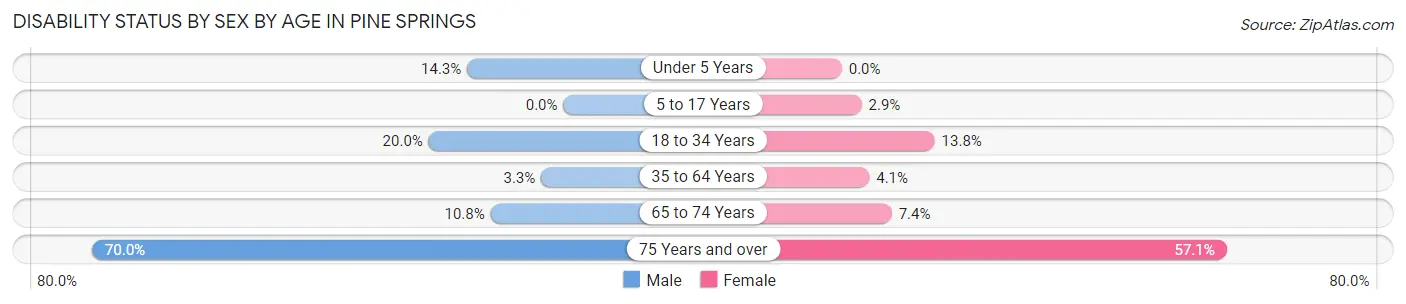
| Age Bracket | Male | Female |
| Under 5 Years | 1 (14.3%) | 0 (0.0%) |
| 5 to 17 Years | 0 (0.0%) | 1 (2.9%) |
| 18 to 34 Years | 6 (20.0%) | 4 (13.8%) |
| 35 to 64 Years | 3 (3.3%) | 4 (4.1%) |
| 65 to 74 Years | 4 (10.8%) | 2 (7.4%) |
| 75 Years and over | 7 (70.0%) | 4 (57.1%) |
Disability Class by Sex by Age in Pine Springs
Disability Class: Hearing Difficulty
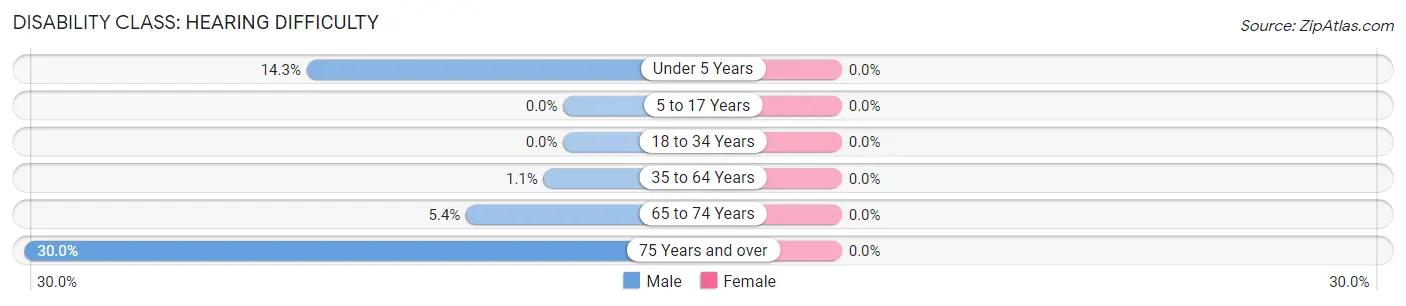
| Age Bracket | Male | Female |
| Under 5 Years | 1 (14.3%) | 0 (0.0%) |
| 5 to 17 Years | 0 (0.0%) | 0 (0.0%) |
| 18 to 34 Years | 0 (0.0%) | 0 (0.0%) |
| 35 to 64 Years | 1 (1.1%) | 0 (0.0%) |
| 65 to 74 Years | 2 (5.4%) | 0 (0.0%) |
| 75 Years and over | 3 (30.0%) | 0 (0.0%) |
Disability Class: Vision Difficulty
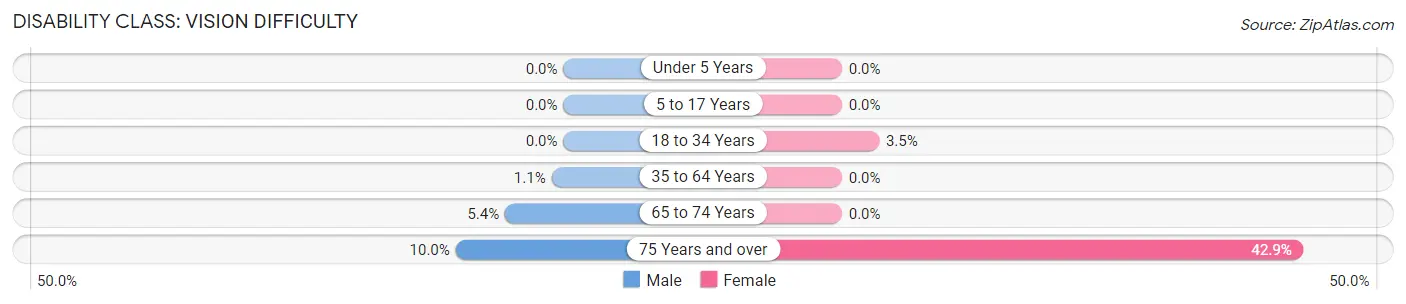
| Age Bracket | Male | Female |
| Under 5 Years | 0 (0.0%) | 0 (0.0%) |
| 5 to 17 Years | 0 (0.0%) | 0 (0.0%) |
| 18 to 34 Years | 0 (0.0%) | 1 (3.5%) |
| 35 to 64 Years | 1 (1.1%) | 0 (0.0%) |
| 65 to 74 Years | 2 (5.4%) | 0 (0.0%) |
| 75 Years and over | 1 (10.0%) | 3 (42.9%) |
Disability Class: Cognitive Difficulty
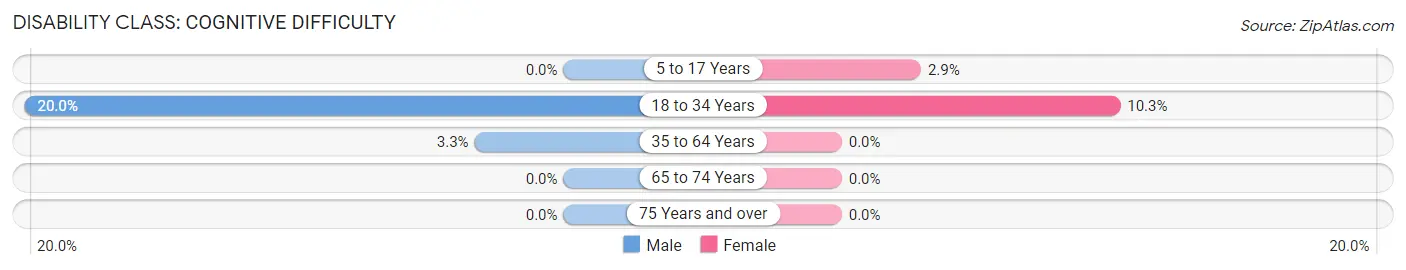
| Age Bracket | Male | Female |
| 5 to 17 Years | 0 (0.0%) | 1 (2.9%) |
| 18 to 34 Years | 6 (20.0%) | 3 (10.3%) |
| 35 to 64 Years | 3 (3.3%) | 0 (0.0%) |
| 65 to 74 Years | 0 (0.0%) | 0 (0.0%) |
| 75 Years and over | 0 (0.0%) | 0 (0.0%) |
Disability Class: Ambulatory Difficulty
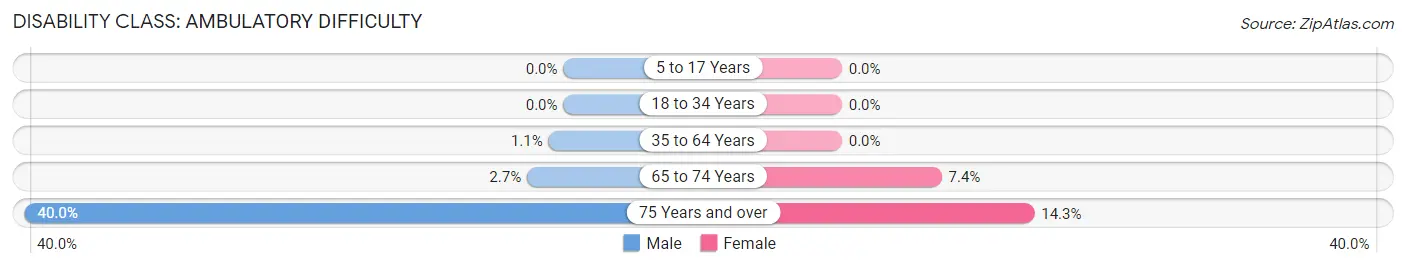
| Age Bracket | Male | Female |
| 5 to 17 Years | 0 (0.0%) | 0 (0.0%) |
| 18 to 34 Years | 0 (0.0%) | 0 (0.0%) |
| 35 to 64 Years | 1 (1.1%) | 0 (0.0%) |
| 65 to 74 Years | 1 (2.7%) | 2 (7.4%) |
| 75 Years and over | 4 (40.0%) | 1 (14.3%) |
Disability Class: Self-Care Difficulty
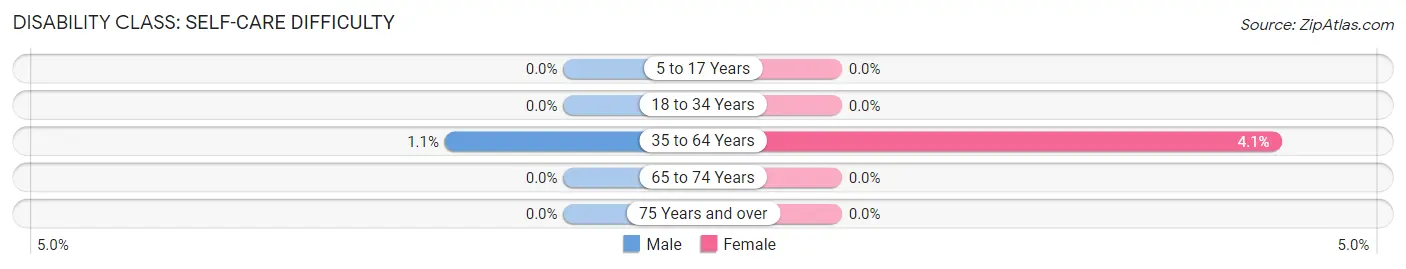
| Age Bracket | Male | Female |
| 5 to 17 Years | 0 (0.0%) | 0 (0.0%) |
| 18 to 34 Years | 0 (0.0%) | 0 (0.0%) |
| 35 to 64 Years | 1 (1.1%) | 4 (4.1%) |
| 65 to 74 Years | 0 (0.0%) | 0 (0.0%) |
| 75 Years and over | 0 (0.0%) | 0 (0.0%) |
Technology Access in Pine Springs
Computing Device Access in Pine Springs
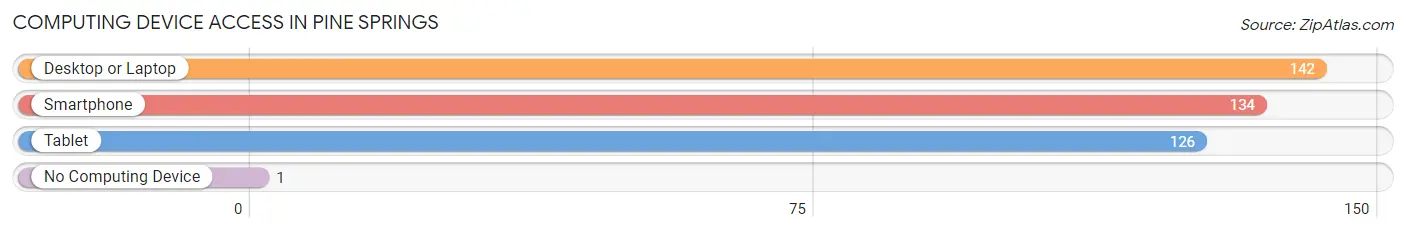
| Device Type | # Households | % Households |
| Desktop or Laptop | 142 | 96.0% |
| Smartphone | 134 | 90.5% |
| Tablet | 126 | 85.1% |
| No Computing Device | 1 | 0.7% |
| Total | 148 | 100.0% |
Internet Access in Pine Springs
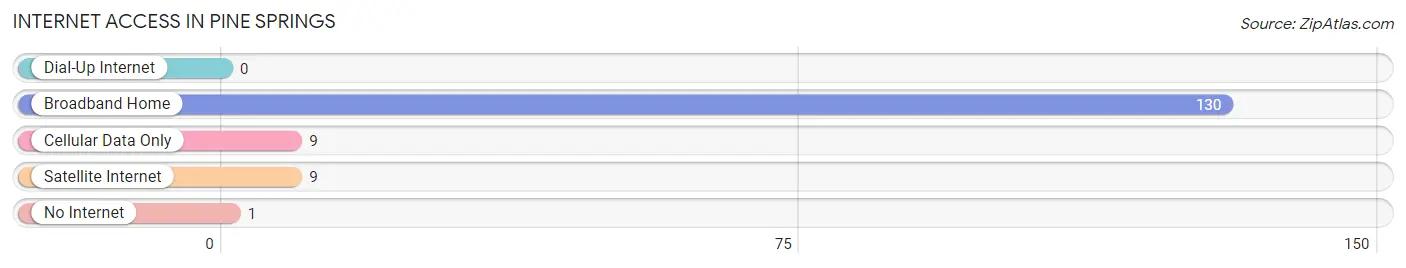
| Internet Type | # Households | % Households |
| Dial-Up Internet | 0 | 0.0% |
| Broadband Home | 130 | 87.8% |
| Cellular Data Only | 9 | 6.1% |
| Satellite Internet | 9 | 6.1% |
| No Internet | 1 | 0.7% |
| Total | 148 | 100.0% |
Pine Springs Summary
Pine Springs is a small unincorporated community located in the northern part of Minnesota, in St. Louis County. It is situated on the western shore of Lake Vermilion, a large lake in the northern part of the state. The community is located about 20 miles north of Duluth and about 30 miles south of International Falls.
History
Pine Springs was first settled in the late 1800s by a group of Finnish immigrants. The settlers were attracted to the area by the abundance of timber and the potential for fishing and hunting. The first settlers built a sawmill and a small store, and the community grew slowly over the years. By the early 1900s, the community had a post office, a school, and a few other businesses.
In the early 1900s, the area around Pine Springs was heavily logged, and the community began to decline. By the mid-1900s, the population had dropped to just a few dozen people. In the late 1900s, the area began to experience a resurgence, as people began to move to the area for its natural beauty and recreational opportunities.
Geography
Pine Springs is located in the northern part of Minnesota, in St. Louis County. It is situated on the western shore of Lake Vermilion, a large lake in the northern part of the state. The community is located about 20 miles north of Duluth and about 30 miles south of International Falls.
The area around Pine Springs is mostly forested, with a mix of coniferous and deciduous trees. The terrain is mostly flat, with some rolling hills. The climate is generally cool and humid, with cold winters and warm summers.
Economy
The economy of Pine Springs is largely based on tourism and recreation. The area is popular with fishermen, hunters, and outdoor enthusiasts. There are several resorts and lodges in the area, as well as a number of campgrounds. The area is also home to several marinas, which offer boat rentals and other services.
In addition to tourism and recreation, the area is also home to several small businesses, including a few restaurants, a grocery store, and a few other retail establishments.
Demographics
As of the 2010 census, the population of Pine Springs was 545. The racial makeup of the community was 97.3% White, 0.7% Native American, 0.2% Asian, 0.2% from other races, and 1.6% from two or more races. The median household income was $41,250, and the median family income was $45,625. The per capita income was $20,945.
Conclusion
Pine Springs is a small unincorporated community located in the northern part of Minnesota, in St. Louis County. It is situated on the western shore of Lake Vermilion, a large lake in the northern part of the state. The community was first settled in the late 1800s by a group of Finnish immigrants, and the area was heavily logged in the early 1900s. Today, the economy of Pine Springs is largely based on tourism and recreation, and the population of the community was 545 as of the 2010 census.
Common Questions
What is Per Capita Income in Pine Springs?
Per Capita income in Pine Springs is $62,121.
What is the Median Family Income in Pine Springs?
Median Family Income in Pine Springs is $170,313.
What is the Median Household income in Pine Springs?
Median Household Income in Pine Springs is $160,625.
What is Income or Wage Gap in Pine Springs?
Income or Wage Gap in Pine Springs is 20.4%.
Women in Pine Springs earn 79.6 cents for every dollar earned by a man.
What is Inequality or Gini Index in Pine Springs?
Inequality or Gini Index in Pine Springs is 0.34.
What is the Total Population of Pine Springs?
Total Population of Pine Springs is 443.
What is the Total Male Population of Pine Springs?
Total Male Population of Pine Springs is 236.
What is the Total Female Population of Pine Springs?
Total Female Population of Pine Springs is 207.
What is the Ratio of Males per 100 Females in Pine Springs?
There are 114.01 Males per 100 Females in Pine Springs.
What is the Ratio of Females per 100 Males in Pine Springs?
There are 87.71 Females per 100 Males in Pine Springs.
What is the Median Population Age in Pine Springs?
Median Population Age in Pine Springs is 43.8 Years.
What is the Average Family Size in Pine Springs
Average Family Size in Pine Springs is 3.2 People.
What is the Average Household Size in Pine Springs
Average Household Size in Pine Springs is 3.0 People.
How Large is the Labor Force in Pine Springs?
There are 204 People in the Labor Forcein in Pine Springs.
What is the Percentage of People in the Labor Force in Pine Springs?
60.0% of People are in the Labor Force in Pine Springs.
What is the Unemployment Rate in Pine Springs?
Unemployment Rate in Pine Springs is 3.4%.