Columbus, MN Map & Demographics
Columbus Map
Columbus Overview
$45,435
PER CAPITA INCOME
$123,929
AVG FAMILY INCOME
$103,906
AVG HOUSEHOLD INCOME
40.3%
WAGE / INCOME GAP [ % ]
59.7¢/ $1
WAGE / INCOME GAP [ $ ]
0.31
INEQUALITY / GINI INDEX
4,180
TOTAL POPULATION
2,203
MALE POPULATION
1,977
FEMALE POPULATION
111.43
MALES / 100 FEMALES
89.74
FEMALES / 100 MALES
47.0
MEDIAN AGE
2.8
AVG FAMILY SIZE
2.6
AVG HOUSEHOLD SIZE
2,487
LABOR FORCE [ PEOPLE ]
70.9%
PERCENT IN LABOR FORCE
2.1%
UNEMPLOYMENT RATE
Columbus Area Codes
Income in Columbus
Income Overview in Columbus
Per Capita Income in Columbus is $45,435, while median incomes of families and households are $123,929 and $103,906 respectively.
| Characteristic | Number | Measure |
| Per Capita Income | 4,180 | $45,435 |
| Median Family Income | 1,286 | $123,929 |
| Mean Family Income | 1,286 | $122,587 |
| Median Household Income | 1,613 | $103,906 |
| Mean Household Income | 1,613 | $116,115 |
| Income Deficit | 1,286 | $0 |
| Wage / Income Gap (%) | 4,180 | 40.27% |
| Wage / Income Gap ($) | 4,180 | 59.73¢ per $1 |
| Gini / Inequality Index | 4,180 | 0.31 |
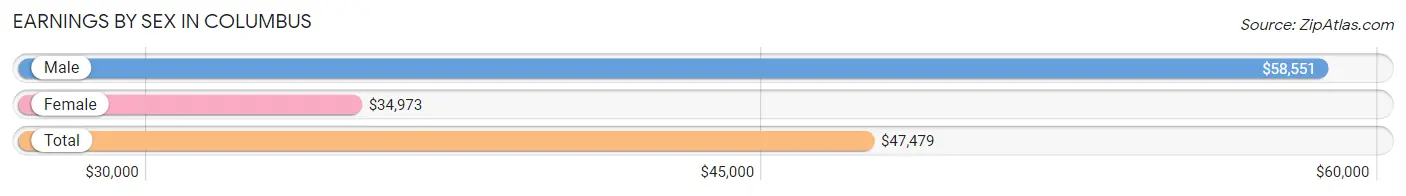
Earnings by Sex in Columbus
Average Earnings in Columbus are $47,479, $58,551 for men and $34,973 for women, a difference of 40.3%.
| Sex | Number | Average Earnings |
| Male | 1,341 (51.5%) | $58,551 |
| Female | 1,263 (48.5%) | $34,973 |
| Total | 2,604 (100.0%) | $47,479 |
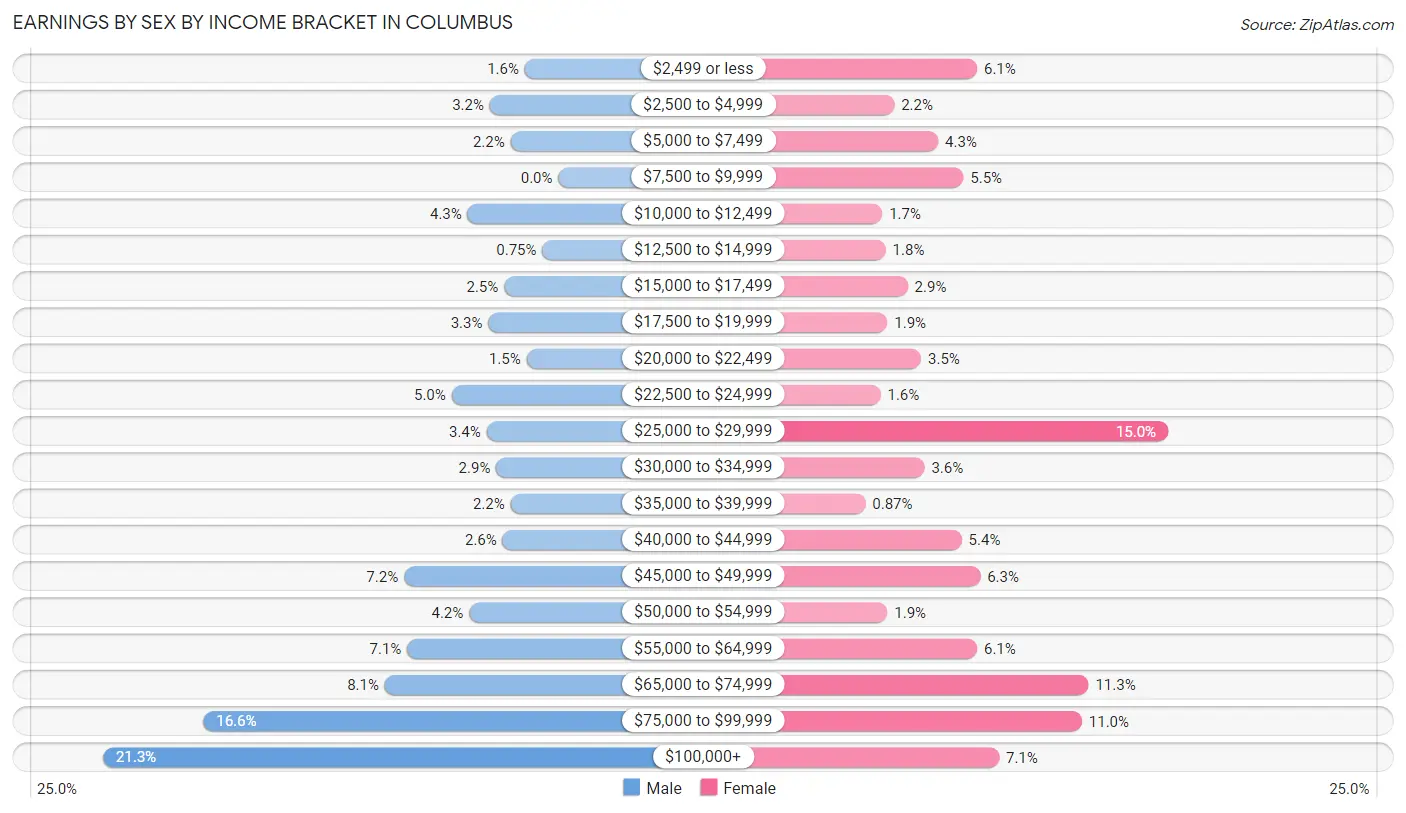
Earnings by Sex by Income Bracket in Columbus
The most common earnings brackets in Columbus are $100,000+ for men (286 | 21.3%) and $25,000 to $29,999 for women (190 | 15.0%).
| Income | Male | Female |
| $2,499 or less | 21 (1.6%) | 77 (6.1%) |
| $2,500 to $4,999 | 43 (3.2%) | 28 (2.2%) |
| $5,000 to $7,499 | 30 (2.2%) | 54 (4.3%) |
| $7,500 to $9,999 | 0 (0.0%) | 69 (5.5%) |
| $10,000 to $12,499 | 57 (4.3%) | 21 (1.7%) |
| $12,500 to $14,999 | 10 (0.7%) | 23 (1.8%) |
| $15,000 to $17,499 | 34 (2.5%) | 36 (2.9%) |
| $17,500 to $19,999 | 44 (3.3%) | 24 (1.9%) |
| $20,000 to $22,499 | 20 (1.5%) | 44 (3.5%) |
| $22,500 to $24,999 | 67 (5.0%) | 20 (1.6%) |
| $25,000 to $29,999 | 45 (3.4%) | 190 (15.0%) |
| $30,000 to $34,999 | 39 (2.9%) | 46 (3.6%) |
| $35,000 to $39,999 | 30 (2.2%) | 11 (0.9%) |
| $40,000 to $44,999 | 35 (2.6%) | 68 (5.4%) |
| $45,000 to $49,999 | 97 (7.2%) | 79 (6.2%) |
| $50,000 to $54,999 | 56 (4.2%) | 24 (1.9%) |
| $55,000 to $64,999 | 95 (7.1%) | 77 (6.1%) |
| $65,000 to $74,999 | 109 (8.1%) | 143 (11.3%) |
| $75,000 to $99,999 | 223 (16.6%) | 139 (11.0%) |
| $100,000+ | 286 (21.3%) | 90 (7.1%) |
| Total | 1,341 (100.0%) | 1,263 (100.0%) |
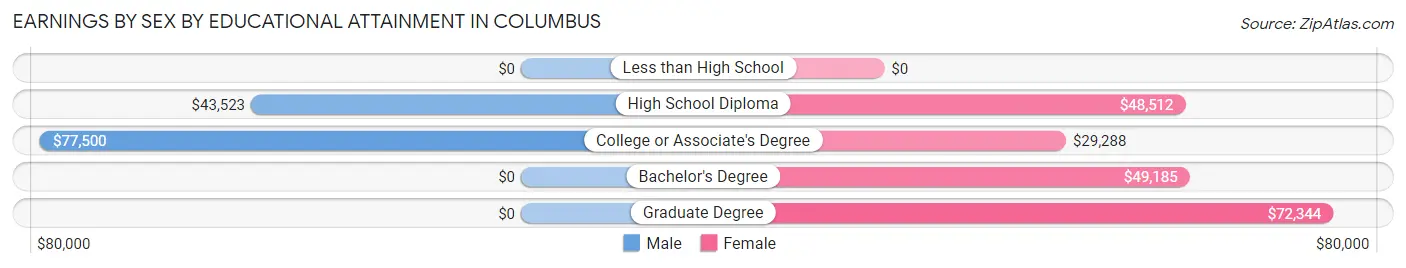
Earnings by Sex by Educational Attainment in Columbus
Average earnings in Columbus are $68,208 for men and $44,261 for women, a difference of 35.1%. Men with an educational attainment of college or associate's degree enjoy the highest average annual earnings of $77,500, while those with high school diploma education earn the least with $43,523. Women with an educational attainment of graduate degree earn the most with the average annual earnings of $72,344, while those with college or associate's degree education have the smallest earnings of $29,288.
| Educational Attainment | Male Income | Female Income |
| Less than High School | - | - |
| High School Diploma | $43,523 | $48,512 |
| College or Associate's Degree | $77,500 | $29,288 |
| Bachelor's Degree | - | - |
| Graduate Degree | - | - |
| Total | $68,208 | $44,261 |
Family Income in Columbus
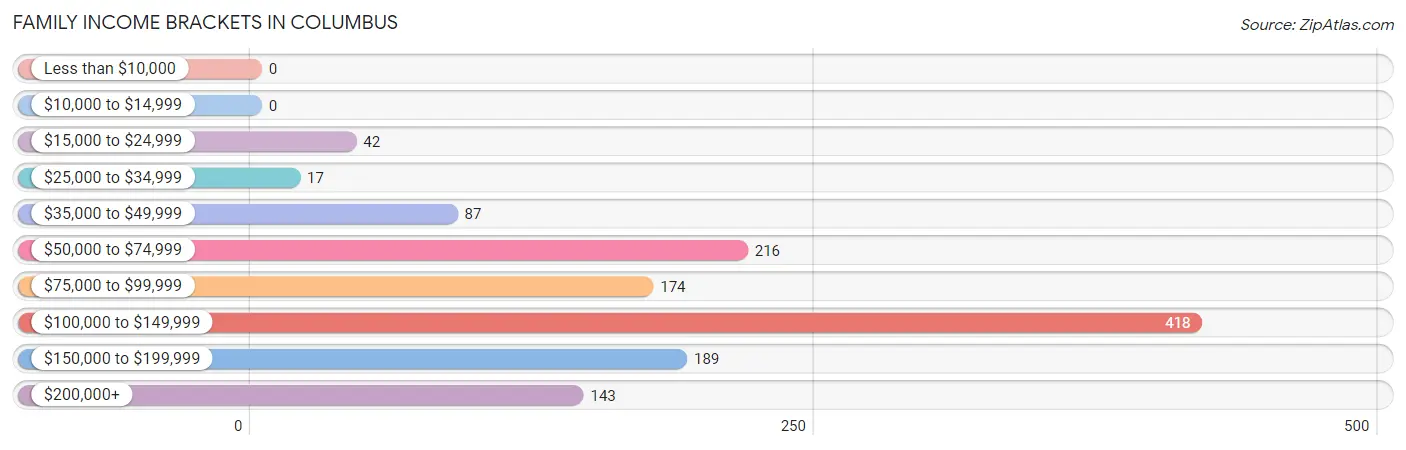
Family Income Brackets in Columbus
According to the Columbus family income data, there are 418 families falling into the $100,000 to $149,999 income range, which is the most common income bracket and makes up 32.5% of all families.
| Income Bracket | # Families | % Families |
| Less than $10,000 | 0 | 0.0% |
| $10,000 to $14,999 | 0 | 0.0% |
| $15,000 to $24,999 | 42 | 3.3% |
| $25,000 to $34,999 | 17 | 1.3% |
| $35,000 to $49,999 | 87 | 6.8% |
| $50,000 to $74,999 | 216 | 16.8% |
| $75,000 to $99,999 | 174 | 13.5% |
| $100,000 to $149,999 | 418 | 32.5% |
| $150,000 to $199,999 | 189 | 14.7% |
| $200,000+ | 143 | 11.1% |
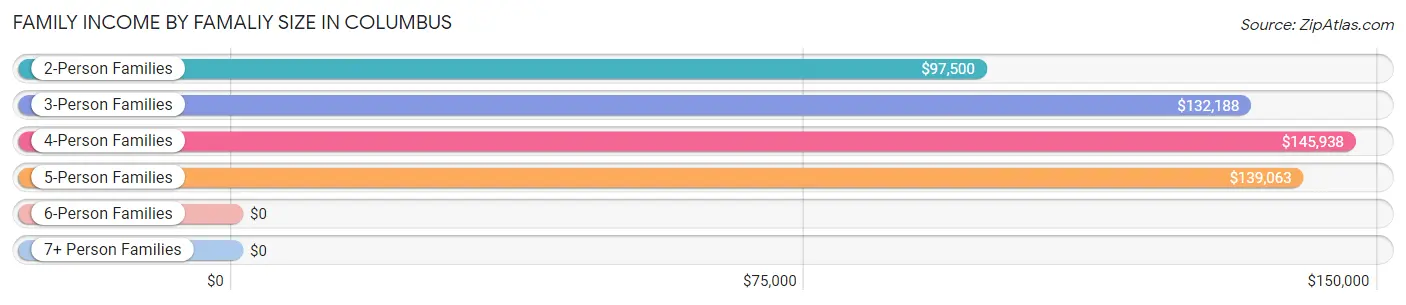
Family Income by Famaliy Size in Columbus
4-person families (157 | 12.2%) account for the highest median family income in Columbus with $145,938 per family, while 2-person families (814 | 63.3%) have the highest median income of $48,750 per family member.
| Income Bracket | # Families | Median Income |
| 2-Person Families | 814 (63.3%) | $97,500 |
| 3-Person Families | 212 (16.5%) | $132,188 |
| 4-Person Families | 157 (12.2%) | $145,938 |
| 5-Person Families | 59 (4.6%) | $139,063 |
| 6-Person Families | 44 (3.4%) | $0 |
| 7+ Person Families | 0 (0.0%) | $0 |
| Total | 1,286 (100.0%) | $123,929 |
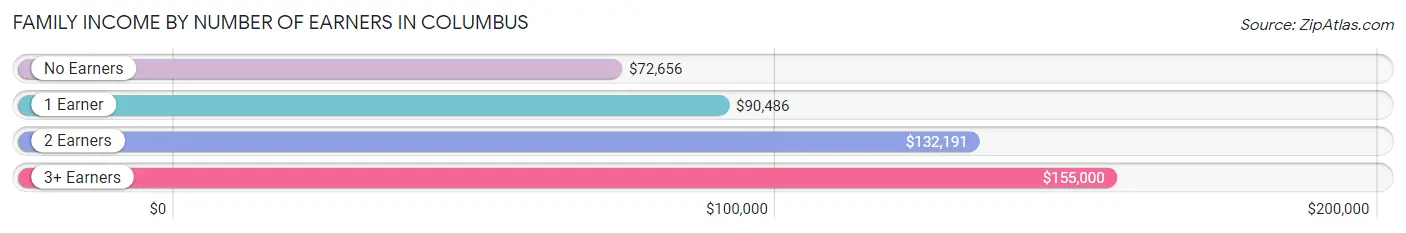
Family Income by Number of Earners in Columbus
The median family income in Columbus is $123,929, with families comprising 3+ earners (160) having the highest median family income of $155,000, while families with no earners (171) have the lowest median family income of $72,656, accounting for 12.4% and 13.3% of families, respectively.
| Number of Earners | # Families | Median Income |
| No Earners | 171 (13.3%) | $72,656 |
| 1 Earner | 355 (27.6%) | $90,486 |
| 2 Earners | 600 (46.7%) | $132,191 |
| 3+ Earners | 160 (12.4%) | $155,000 |
| Total | 1,286 (100.0%) | $123,929 |
Household Income in Columbus
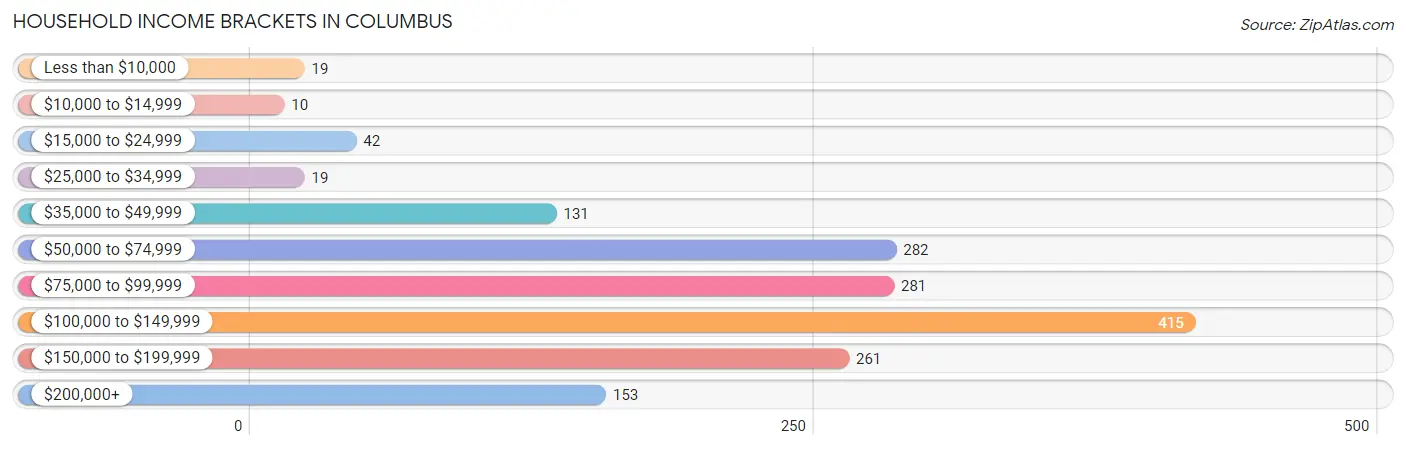
Household Income Brackets in Columbus
With 415 households falling in the category, the $100,000 to $149,999 income range is the most frequent in Columbus, accounting for 25.7% of all households. In contrast, only 10 households (0.6%) fall into the $10,000 to $14,999 income bracket, making it the least populous group.
| Income Bracket | # Households | % Households |
| Less than $10,000 | 19 | 1.2% |
| $10,000 to $14,999 | 10 | 0.6% |
| $15,000 to $24,999 | 42 | 2.6% |
| $25,000 to $34,999 | 19 | 1.2% |
| $35,000 to $49,999 | 131 | 8.1% |
| $50,000 to $74,999 | 282 | 17.5% |
| $75,000 to $99,999 | 281 | 17.4% |
| $100,000 to $149,999 | 415 | 25.7% |
| $150,000 to $199,999 | 261 | 16.2% |
| $200,000+ | 153 | 9.5% |
Household Income by Householder Age in Columbus
The median household income in Columbus is $103,906, with the highest median household income of $132,148 found in the 45 to 64 years age bracket for the primary householder. A total of 735 households (45.6%) fall into this category. Meanwhile, the 15 to 24 years age bracket for the primary householder has the lowest median household income of $0, with 115 households (7.1%) in this group.
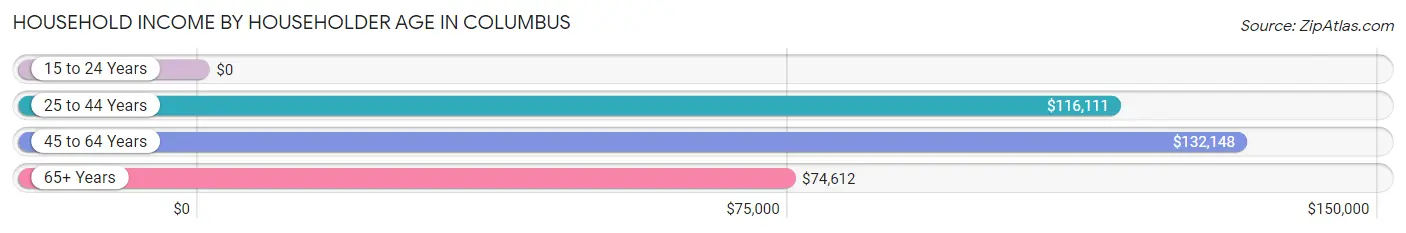
| Income Bracket | # Households | Median Income |
| 15 to 24 Years | 115 (7.1%) | $0 |
| 25 to 44 Years | 366 (22.7%) | $116,111 |
| 45 to 64 Years | 735 (45.6%) | $132,148 |
| 65+ Years | 397 (24.6%) | $74,612 |
| Total | 1,613 (100.0%) | $103,906 |
Poverty in Columbus
Income Below Poverty by Sex and Age in Columbus
With 3.1% poverty level for males and 3.7% for females among the residents of Columbus, 45 to 54 year old males and 45 to 54 year old females are the most vulnerable to poverty, with 26 males (11.6%) and 33 females (11.7%) in their respective age groups living below the poverty level.
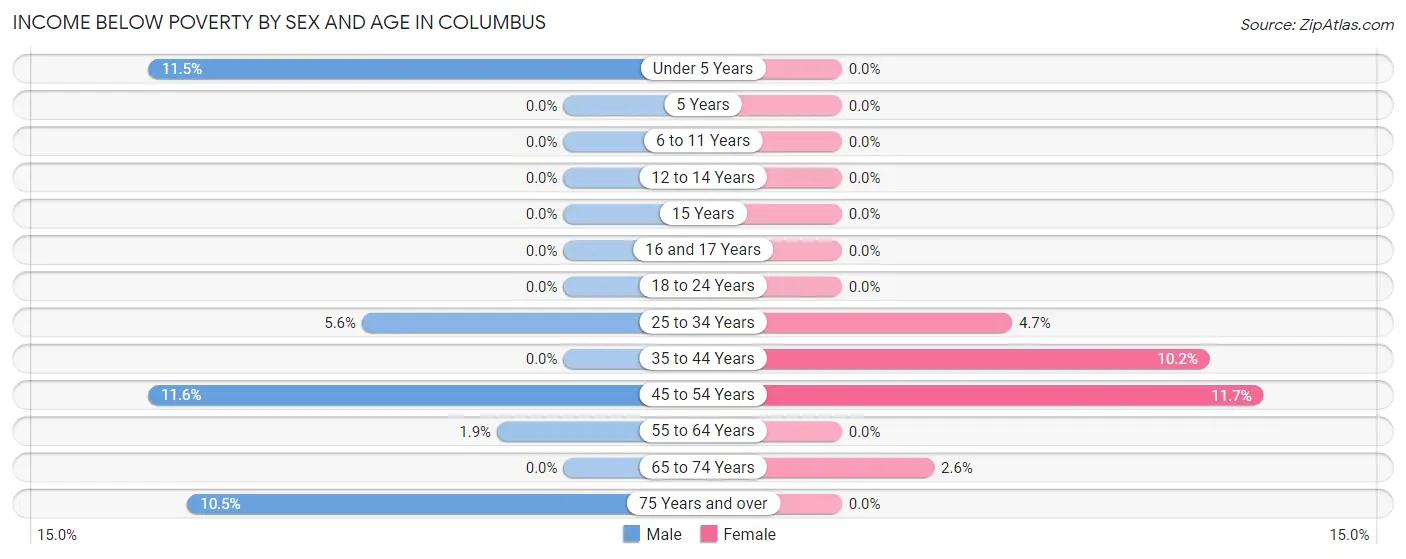
| Age Bracket | Male | Female |
| Under 5 Years | 12 (11.5%) | 0 (0.0%) |
| 5 Years | 0 (0.0%) | 0 (0.0%) |
| 6 to 11 Years | 0 (0.0%) | 0 (0.0%) |
| 12 to 14 Years | 0 (0.0%) | 0 (0.0%) |
| 15 Years | 0 (0.0%) | 0 (0.0%) |
| 16 and 17 Years | 0 (0.0%) | 0 (0.0%) |
| 18 to 24 Years | 0 (0.0%) | 0 (0.0%) |
| 25 to 34 Years | 11 (5.6%) | 11 (4.7%) |
| 35 to 44 Years | 0 (0.0%) | 21 (10.2%) |
| 45 to 54 Years | 26 (11.6%) | 33 (11.7%) |
| 55 to 64 Years | 10 (1.8%) | 0 (0.0%) |
| 65 to 74 Years | 0 (0.0%) | 7 (2.6%) |
| 75 Years and over | 9 (10.5%) | 0 (0.0%) |
| Total | 68 (3.1%) | 72 (3.7%) |
Income Above Poverty by Sex and Age in Columbus
According to the poverty statistics in Columbus, males aged 5 years and females aged under 5 years are the age groups that are most secure financially, with 100.0% of males and 100.0% of females in these age groups living above the poverty line.
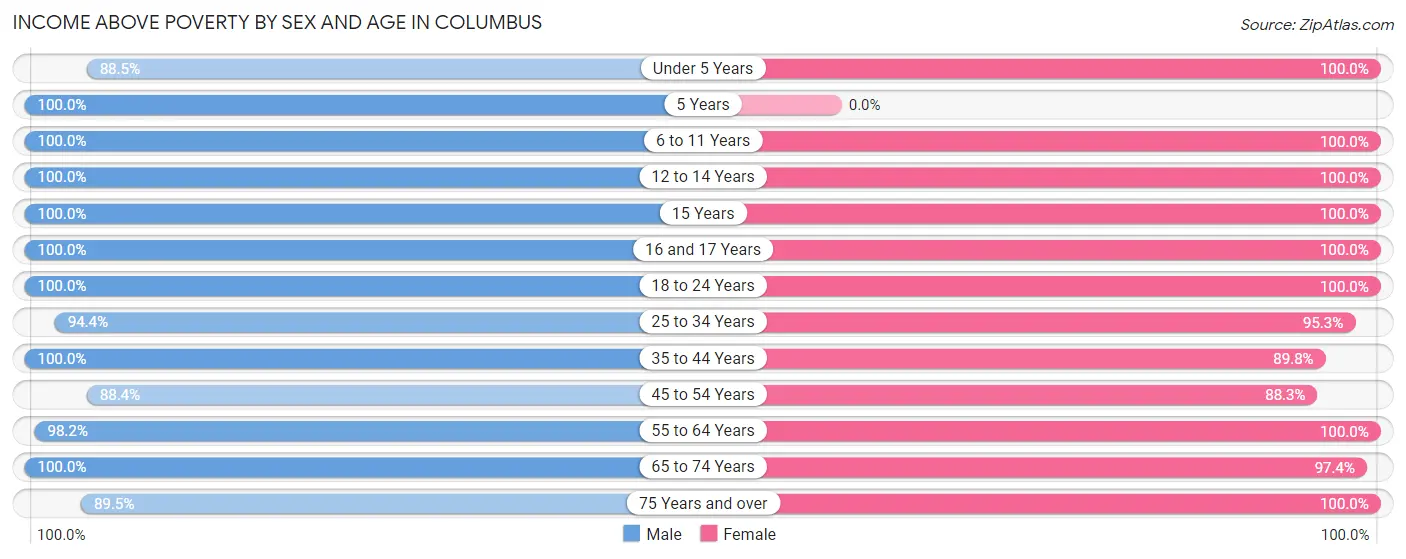
| Age Bracket | Male | Female |
| Under 5 Years | 92 (88.5%) | 73 (100.0%) |
| 5 Years | 10 (100.0%) | 0 (0.0%) |
| 6 to 11 Years | 103 (100.0%) | 135 (100.0%) |
| 12 to 14 Years | 55 (100.0%) | 47 (100.0%) |
| 15 Years | 70 (100.0%) | 33 (100.0%) |
| 16 and 17 Years | 46 (100.0%) | 51 (100.0%) |
| 18 to 24 Years | 195 (100.0%) | 169 (100.0%) |
| 25 to 34 Years | 185 (94.4%) | 221 (95.3%) |
| 35 to 44 Years | 251 (100.0%) | 184 (89.8%) |
| 45 to 54 Years | 199 (88.4%) | 248 (88.3%) |
| 55 to 64 Years | 532 (98.2%) | 380 (100.0%) |
| 65 to 74 Years | 296 (100.0%) | 265 (97.4%) |
| 75 Years and over | 77 (89.5%) | 81 (100.0%) |
| Total | 2,111 (96.9%) | 1,887 (96.3%) |
Income Below Poverty Among Married-Couple Families in Columbus
The poverty statistics for married-couple families in Columbus show that 2.4% or 24 of the total 998 families live below the poverty line. Families with no children have the highest poverty rate of 3.2%, comprising of 24 families. On the other hand, families with 1 or 2 children have the lowest poverty rate of 0.0%, which includes 0 families.
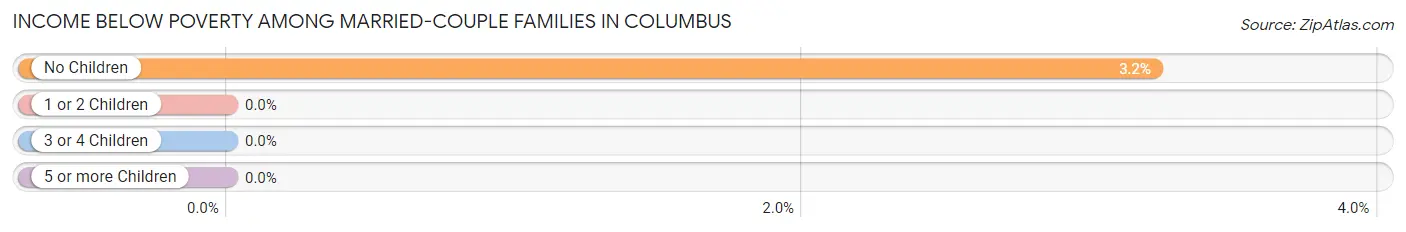
| Children | Above Poverty | Below Poverty |
| No Children | 722 (96.8%) | 24 (3.2%) |
| 1 or 2 Children | 202 (100.0%) | 0 (0.0%) |
| 3 or 4 Children | 50 (100.0%) | 0 (0.0%) |
| 5 or more Children | 0 (0.0%) | 0 (0.0%) |
| Total | 974 (97.6%) | 24 (2.4%) |
Income Below Poverty Among Single-Parent Households in Columbus
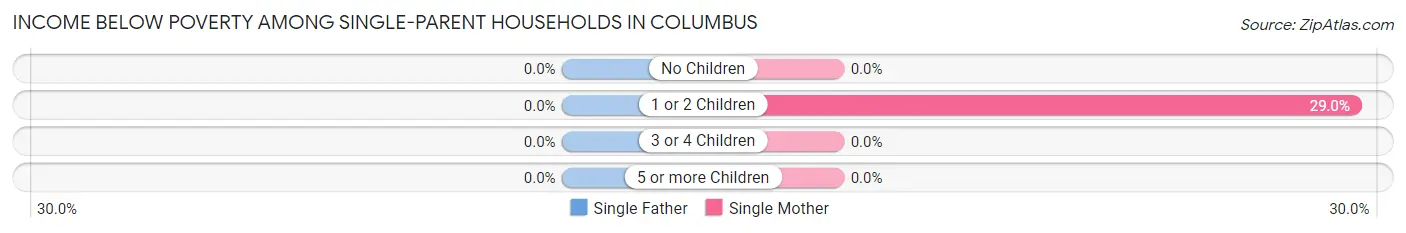
| Children | Single Father | Single Mother |
| No Children | 0 (0.0%) | 0 (0.0%) |
| 1 or 2 Children | 0 (0.0%) | 11 (28.9%) |
| 3 or 4 Children | 0 (0.0%) | 0 (0.0%) |
| 5 or more Children | 0 (0.0%) | 0 (0.0%) |
| Total | 0 (0.0%) | 11 (23.4%) |
Income Below Poverty Among Married-Couple vs Single-Parent Households in Columbus
The poverty data for Columbus shows that 24 of the married-couple family households (2.4%) and 11 of the single-parent households (3.8%) are living below the poverty level. Within the married-couple family households, those with no children have the highest poverty rate, with 24 households (3.2%) falling below the poverty line. Among the single-parent households, those with 1 or 2 children have the highest poverty rate, with 11 household (6.6%) living below poverty.
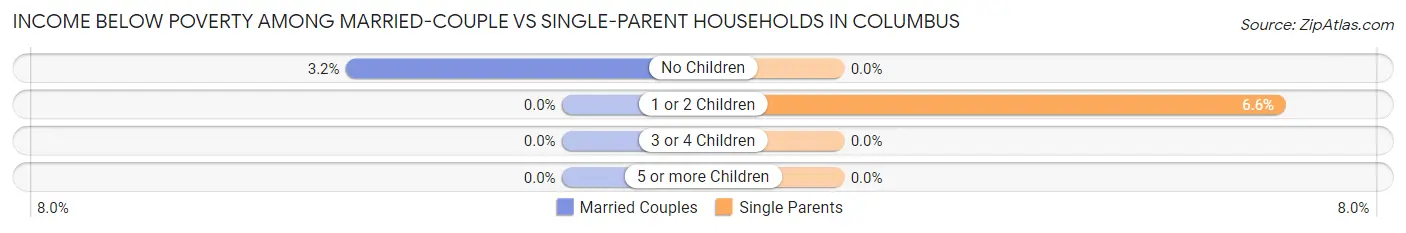
| Children | Married-Couple Families | Single-Parent Households |
| No Children | 24 (3.2%) | 0 (0.0%) |
| 1 or 2 Children | 0 (0.0%) | 11 (6.6%) |
| 3 or 4 Children | 0 (0.0%) | 0 (0.0%) |
| 5 or more Children | 0 (0.0%) | 0 (0.0%) |
| Total | 24 (2.4%) | 11 (3.8%) |
Race in Columbus
The most populous races in Columbus are White / Caucasian (3,821 | 91.4%), Asian (122 | 2.9%), and Two or more Races (119 | 2.9%).
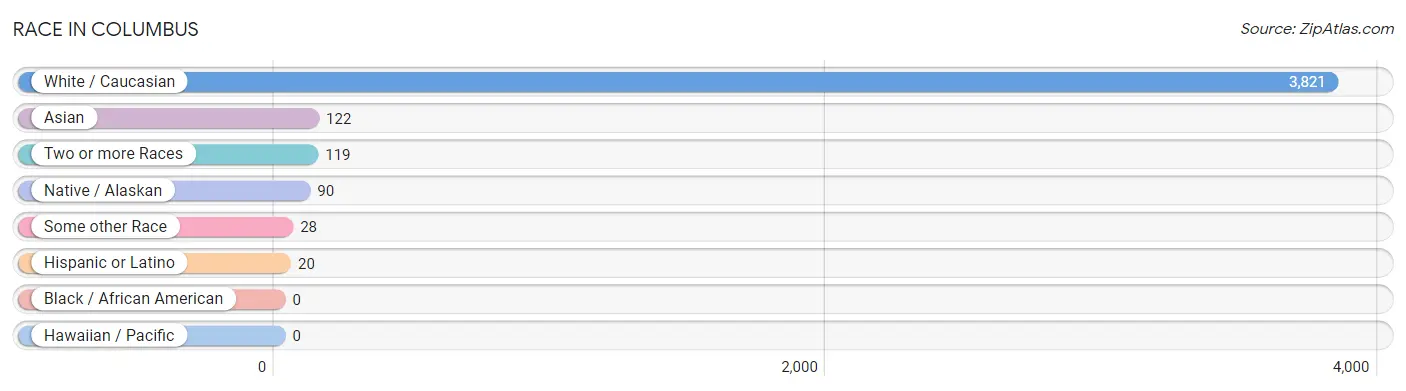
| Race | # Population | % Population |
| Asian | 122 | 2.9% |
| Black / African American | 0 | 0.0% |
| Hawaiian / Pacific | 0 | 0.0% |
| Hispanic or Latino | 20 | 0.5% |
| Native / Alaskan | 90 | 2.1% |
| White / Caucasian | 3,821 | 91.4% |
| Two or more Races | 119 | 2.9% |
| Some other Race | 28 | 0.7% |
| Total | 4,180 | 100.0% |
Ancestry in Columbus
The most populous ancestries reported in Columbus are German (964 | 23.1%), Norwegian (519 | 12.4%), Swedish (355 | 8.5%), Irish (310 | 7.4%), and American (306 | 7.3%), together accounting for 58.7% of all Columbus residents.
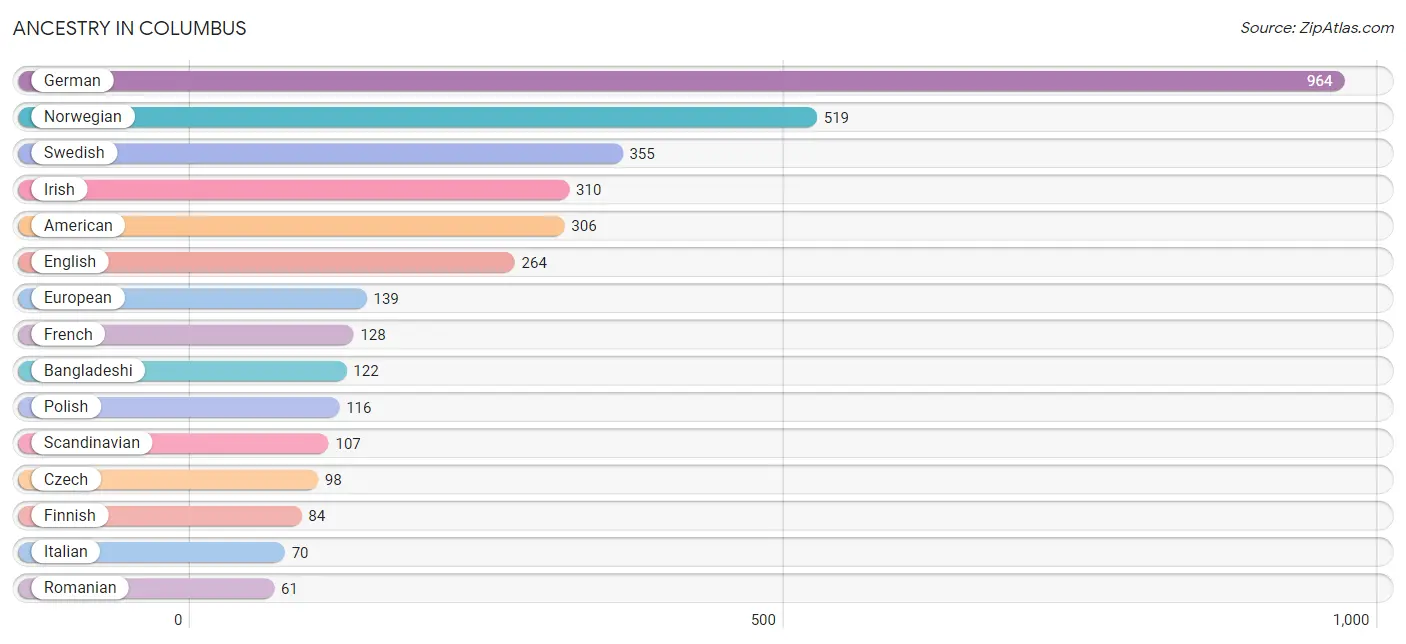
| Ancestry | # Population | % Population |
| American | 306 | 7.3% |
| Austrian | 46 | 1.1% |
| Bangladeshi | 122 | 2.9% |
| Bhutanese | 10 | 0.2% |
| Blackfeet | 18 | 0.4% |
| British | 12 | 0.3% |
| Chippewa | 52 | 1.2% |
| Czech | 98 | 2.3% |
| Danish | 52 | 1.2% |
| Dutch | 9 | 0.2% |
| English | 264 | 6.3% |
| European | 139 | 3.3% |
| Finnish | 84 | 2.0% |
| French | 128 | 3.1% |
| French Canadian | 58 | 1.4% |
| German | 964 | 23.1% |
| Hungarian | 17 | 0.4% |
| Irish | 310 | 7.4% |
| Italian | 70 | 1.7% |
| Lithuanian | 9 | 0.2% |
| Mexican | 9 | 0.2% |
| Northern European | 14 | 0.3% |
| Norwegian | 519 | 12.4% |
| Polish | 116 | 2.8% |
| Puerto Rican | 11 | 0.3% |
| Romanian | 61 | 1.5% |
| Russian | 10 | 0.2% |
| Scandinavian | 107 | 2.6% |
| Scotch-Irish | 10 | 0.2% |
| Scottish | 25 | 0.6% |
| Serbian | 7 | 0.2% |
| Sioux | 9 | 0.2% |
| Slavic | 9 | 0.2% |
| Slovene | 9 | 0.2% |
| Sri Lankan | 23 | 0.5% |
| Swedish | 355 | 8.5% |
| Swiss | 17 | 0.4% |
| Ukrainian | 25 | 0.6% | View All 38 Rows |
Immigrants in Columbus
The most numerous immigrant groups reported in Columbus came from Asia (34 | 0.8%), Laos (34 | 0.8%), South Eastern Asia (34 | 0.8%), Eastern Europe (25 | 0.6%), and Europe (25 | 0.6%), together accounting for 3.6% of all Columbus residents.
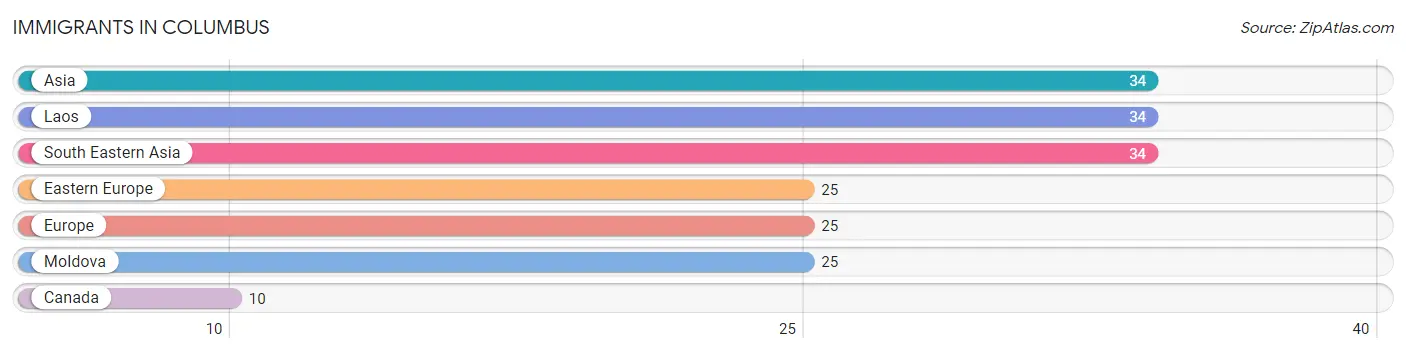
| Immigration Origin | # Population | % Population |
| Asia | 34 | 0.8% |
| Canada | 10 | 0.2% |
| Eastern Europe | 25 | 0.6% |
| Europe | 25 | 0.6% |
| Laos | 34 | 0.8% |
| Moldova | 25 | 0.6% |
| South Eastern Asia | 34 | 0.8% | View All 7 Rows |
Sex and Age in Columbus
Sex and Age in Columbus
The most populous age groups in Columbus are 55 to 59 Years (312 | 14.2%) for men and 60 to 64 Years (301 | 15.2%) for women.
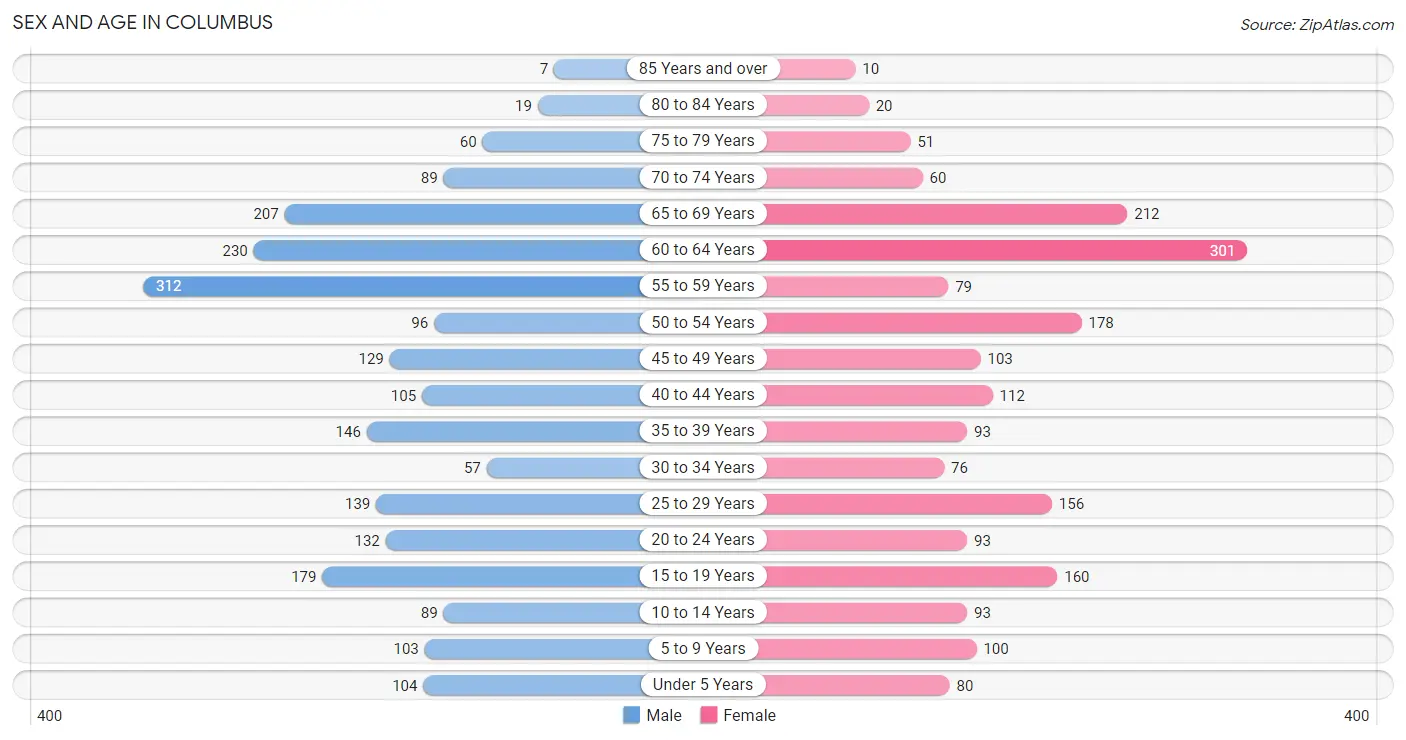
| Age Bracket | Male | Female |
| Under 5 Years | 104 (4.7%) | 80 (4.1%) |
| 5 to 9 Years | 103 (4.7%) | 100 (5.1%) |
| 10 to 14 Years | 89 (4.0%) | 93 (4.7%) |
| 15 to 19 Years | 179 (8.1%) | 160 (8.1%) |
| 20 to 24 Years | 132 (6.0%) | 93 (4.7%) |
| 25 to 29 Years | 139 (6.3%) | 156 (7.9%) |
| 30 to 34 Years | 57 (2.6%) | 76 (3.8%) |
| 35 to 39 Years | 146 (6.6%) | 93 (4.7%) |
| 40 to 44 Years | 105 (4.8%) | 112 (5.7%) |
| 45 to 49 Years | 129 (5.9%) | 103 (5.2%) |
| 50 to 54 Years | 96 (4.4%) | 178 (9.0%) |
| 55 to 59 Years | 312 (14.2%) | 79 (4.0%) |
| 60 to 64 Years | 230 (10.4%) | 301 (15.2%) |
| 65 to 69 Years | 207 (9.4%) | 212 (10.7%) |
| 70 to 74 Years | 89 (4.0%) | 60 (3.0%) |
| 75 to 79 Years | 60 (2.7%) | 51 (2.6%) |
| 80 to 84 Years | 19 (0.9%) | 20 (1.0%) |
| 85 Years and over | 7 (0.3%) | 10 (0.5%) |
| Total | 2,203 (100.0%) | 1,977 (100.0%) |
Families and Households in Columbus
Median Family Size in Columbus
The median family size in Columbus is 2.76 persons per family, with married-couple families (998 | 77.6%) accounting for the largest median family size of 2.78 persons per family. On the other hand, single female/mother families (47 | 3.6%) represent the smallest median family size with 2.43 persons per family.
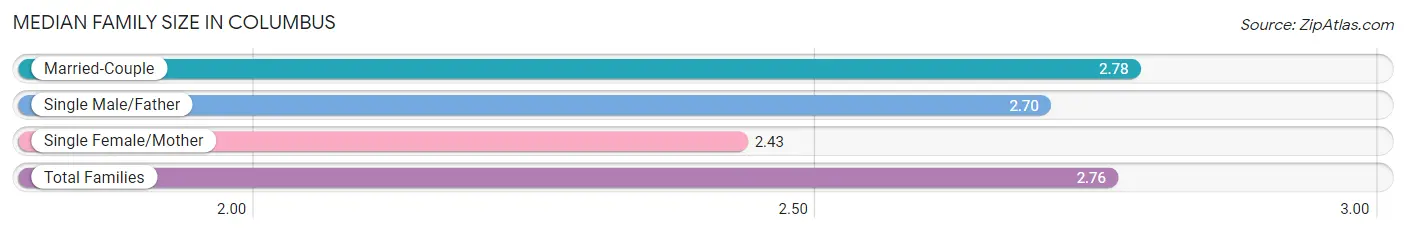
| Family Type | # Families | Family Size |
| Married-Couple | 998 (77.6%) | 2.78 |
| Single Male/Father | 241 (18.7%) | 2.70 |
| Single Female/Mother | 47 (3.6%) | 2.43 |
| Total Families | 1,286 (100.0%) | 2.76 |
Median Household Size in Columbus
The median household size in Columbus is 2.59 persons per household, with single male/father households (241 | 14.9%) accounting for the largest median household size of 3.13 persons per household. non-family households (327 | 20.3%) represent the smallest median household size with 1.56 persons per household.
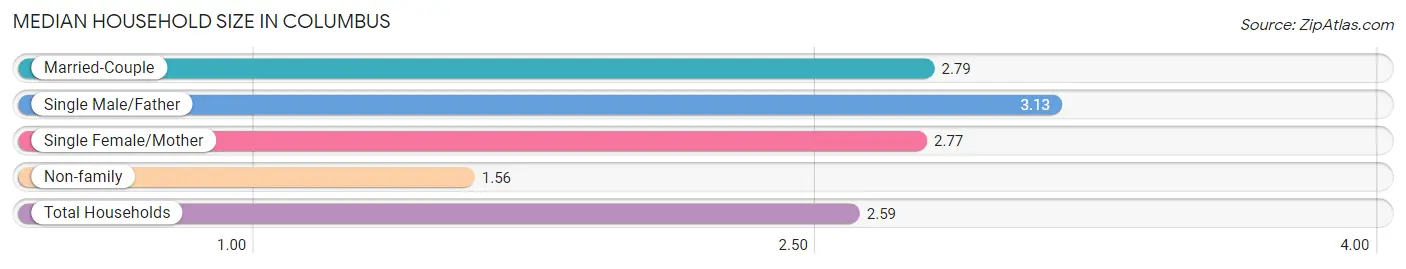
| Household Type | # Households | Household Size |
| Married-Couple | 998 (61.9%) | 2.79 |
| Single Male/Father | 241 (14.9%) | 3.13 |
| Single Female/Mother | 47 (2.9%) | 2.77 |
| Non-family | 327 (20.3%) | 1.56 |
| Total Households | 1,613 (100.0%) | 2.59 |
Household Size by Marriage Status in Columbus
Out of a total of 1,613 households in Columbus, 1,286 (79.7%) are family households, while 327 (20.3%) are nonfamily households. The most numerous type of family households are 2-person households, comprising 749, and the most common type of nonfamily households are 1-person households, comprising 214.
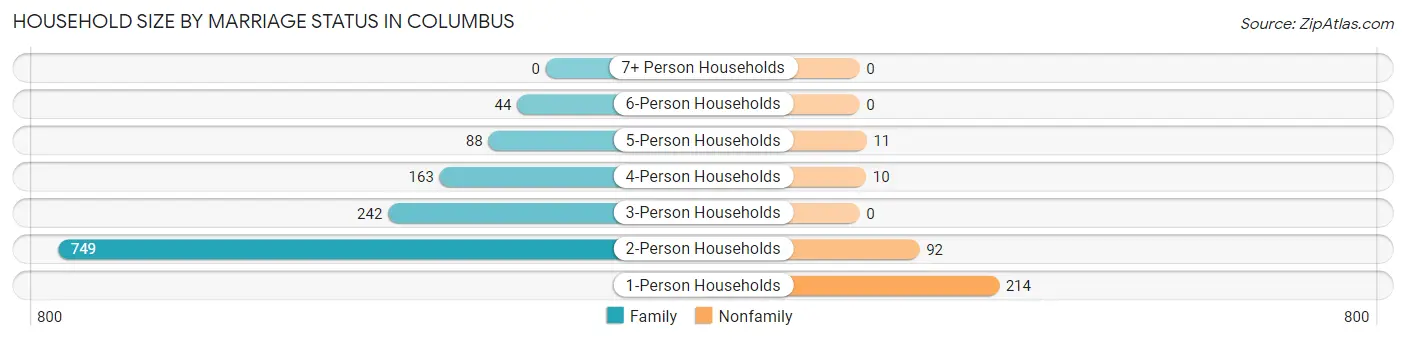
| Household Size | Family Households | Nonfamily Households |
| 1-Person Households | - | 214 (13.3%) |
| 2-Person Households | 749 (46.4%) | 92 (5.7%) |
| 3-Person Households | 242 (15.0%) | 0 (0.0%) |
| 4-Person Households | 163 (10.1%) | 10 (0.6%) |
| 5-Person Households | 88 (5.5%) | 11 (0.7%) |
| 6-Person Households | 44 (2.7%) | 0 (0.0%) |
| 7+ Person Households | 0 (0.0%) | 0 (0.0%) |
| Total | 1,286 (79.7%) | 327 (20.3%) |
Female Fertility in Columbus
Fertility by Age in Columbus
Average fertility rate in Columbus is 38.0 births per 1,000 women. Women in the age bracket of 20 to 34 years have the highest fertility rate with 65.0 births per 1,000 women. Women in the age bracket of 20 to 34 years acount for 65.6% of all women with births.
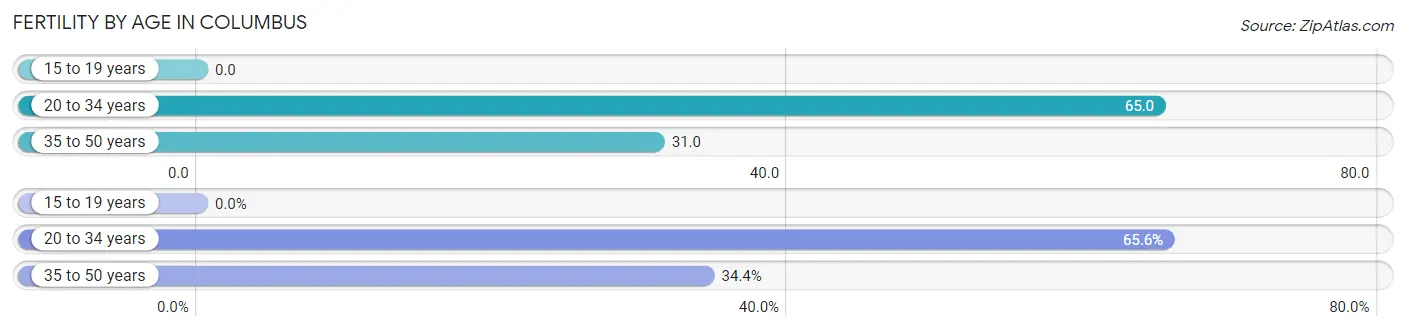
| Age Bracket | Women with Births | Births / 1,000 Women |
| 15 to 19 years | 0 (0.0%) | 0.0 |
| 20 to 34 years | 21 (65.6%) | 65.0 |
| 35 to 50 years | 11 (34.4%) | 31.0 |
| Total | 32 (100.0%) | 38.0 |
Fertility by Age by Marriage Status in Columbus
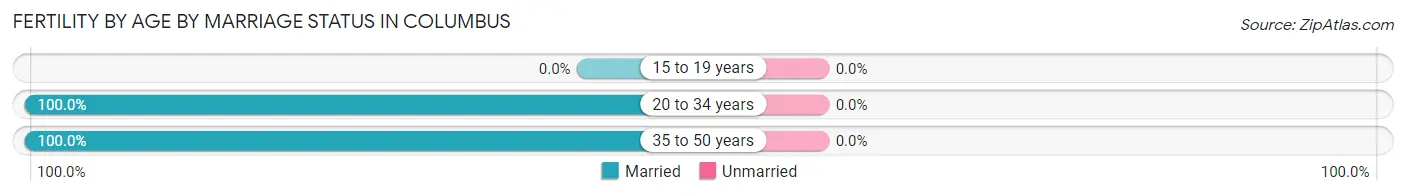
| Age Bracket | Married | Unmarried |
| 15 to 19 years | 0 (0.0%) | 0 (0.0%) |
| 20 to 34 years | 21 (100.0%) | 0 (0.0%) |
| 35 to 50 years | 11 (100.0%) | 0 (0.0%) |
| Total | 32 (100.0%) | 0 (0.0%) |
Fertility by Education in Columbus
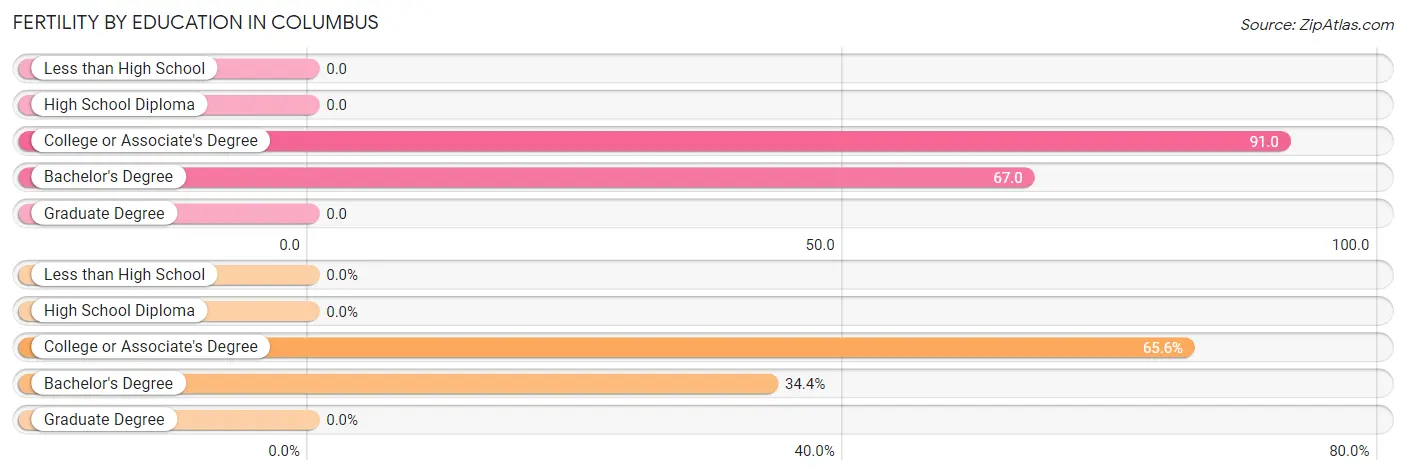
| Educational Attainment | Women with Births | Births / 1,000 Women |
| Less than High School | 0 (0.0%) | 0.0 |
| High School Diploma | 0 (0.0%) | 0.0 |
| College or Associate's Degree | 21 (65.6%) | 91.0 |
| Bachelor's Degree | 11 (34.4%) | 67.0 |
| Graduate Degree | 0 (0.0%) | 0.0 |
| Total | 32 (100.0%) | 38.0 |
Fertility by Education by Marriage Status in Columbus
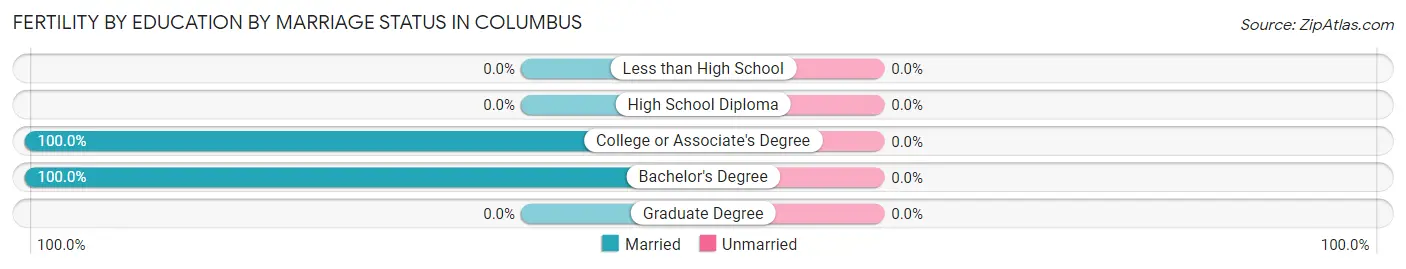
| Educational Attainment | Married | Unmarried |
| Less than High School | 0 (0.0%) | 0 (0.0%) |
| High School Diploma | 0 (0.0%) | 0 (0.0%) |
| College or Associate's Degree | 21 (100.0%) | 0 (0.0%) |
| Bachelor's Degree | 11 (100.0%) | 0 (0.0%) |
| Graduate Degree | 0 (0.0%) | 0 (0.0%) |
| Total | 32 (100.0%) | 0 (0.0%) |
Employment Characteristics in Columbus
Employment by Class of Employer in Columbus
Among the 2,422 employed individuals in Columbus, private company employees (1,728 | 71.4%), not-for-profit organizations (206 | 8.5%), and local government employees (194 | 8.0%) make up the most common classes of employment.
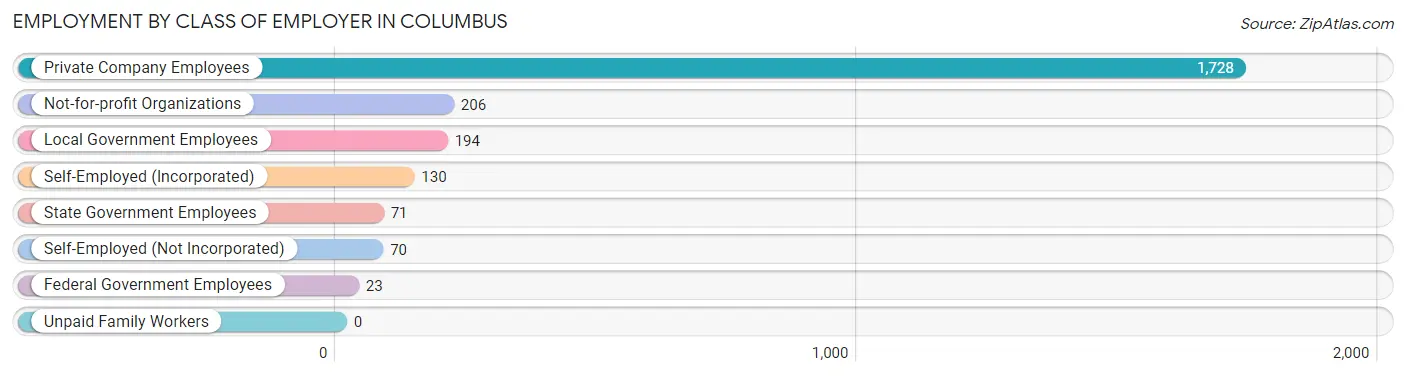
| Employer Class | # Employees | % Employees |
| Private Company Employees | 1,728 | 71.4% |
| Self-Employed (Incorporated) | 130 | 5.4% |
| Self-Employed (Not Incorporated) | 70 | 2.9% |
| Not-for-profit Organizations | 206 | 8.5% |
| Local Government Employees | 194 | 8.0% |
| State Government Employees | 71 | 2.9% |
| Federal Government Employees | 23 | 0.9% |
| Unpaid Family Workers | 0 | 0.0% |
| Total | 2,422 | 100.0% |
Employment Status by Age in Columbus
According to the labor force statistics for Columbus, out of the total population over 16 years of age (3,508), 70.9% or 2,487 individuals are in the labor force, with 2.1% or 52 of them unemployed. The age group with the highest labor force participation rate is 20 to 24 years, with 100.0% or 225 individuals in the labor force. Within the labor force, the 30 to 34 years age range has the highest percentage of unemployed individuals, with 7.1% or 9 of them being unemployed.
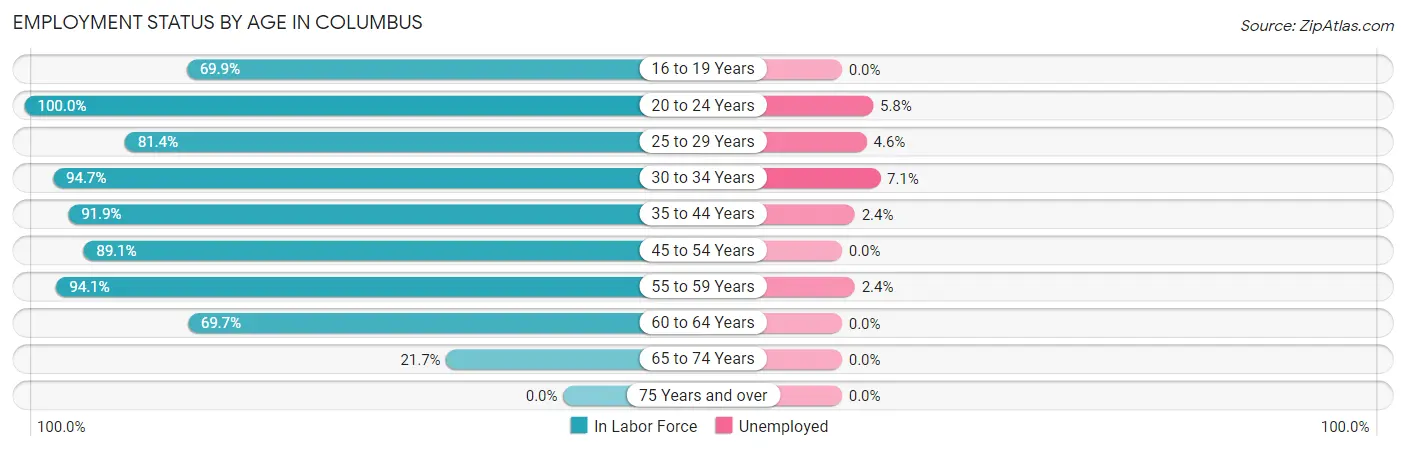
| Age Bracket | In Labor Force | Unemployed |
| 16 to 19 Years | 165 (69.9%) | 0 (0.0%) |
| 20 to 24 Years | 225 (100.0%) | 13 (5.8%) |
| 25 to 29 Years | 240 (81.4%) | 11 (4.6%) |
| 30 to 34 Years | 126 (94.7%) | 9 (7.1%) |
| 35 to 44 Years | 419 (91.9%) | 10 (2.4%) |
| 45 to 54 Years | 451 (89.1%) | 0 (0.0%) |
| 55 to 59 Years | 368 (94.1%) | 9 (2.4%) |
| 60 to 64 Years | 370 (69.7%) | 0 (0.0%) |
| 65 to 74 Years | 123 (21.7%) | 0 (0.0%) |
| 75 Years and over | 0 (0.0%) | 0 (0.0%) |
| Total | 2,487 (70.9%) | 52 (2.1%) |
Employment Status by Educational Attainment in Columbus
According to labor force statistics for Columbus, 85.4% of individuals (1,974) out of the total population between 25 and 64 years of age (2,312) are in the labor force, with 2.0% or 39 of them being unemployed. The group with the highest labor force participation rate are those with the educational attainment of college / associate degree, with 87.4% or 802 individuals in the labor force. Within the labor force, individuals with bachelor's degree or higher education have the highest percentage of unemployment, with 2.8% or 19 of them being unemployed.
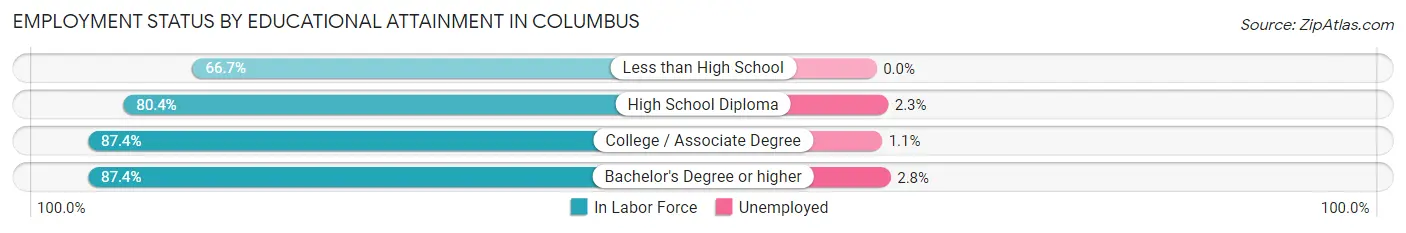
| Educational Attainment | In Labor Force | Unemployed |
| Less than High School | 16 (66.7%) | 0 (0.0%) |
| High School Diploma | 476 (80.4%) | 14 (2.3%) |
| College / Associate Degree | 802 (87.4%) | 10 (1.1%) |
| Bachelor's Degree or higher | 680 (87.4%) | 22 (2.8%) |
| Total | 1,974 (85.4%) | 46 (2.0%) |
Employment Occupations by Sex in Columbus
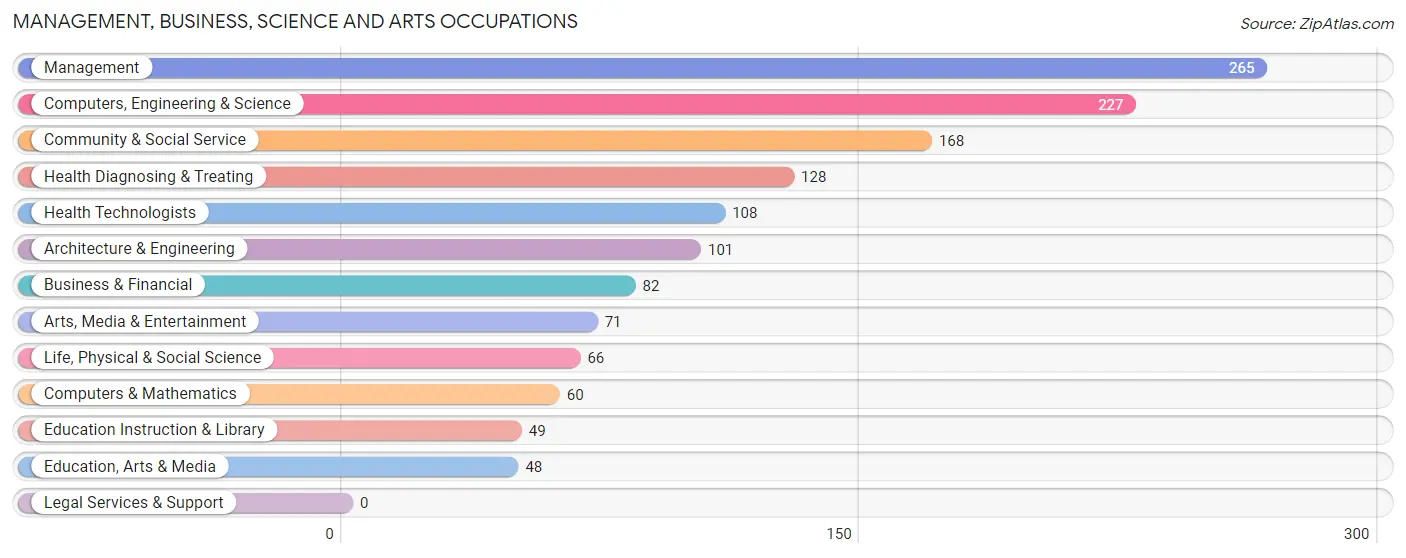
Management, Business, Science and Arts Occupations
The most common Management, Business, Science and Arts occupations in Columbus are Management (265 | 10.9%), Computers, Engineering & Science (227 | 9.3%), Community & Social Service (168 | 6.9%), Health Diagnosing & Treating (128 | 5.3%), and Health Technologists (108 | 4.4%).
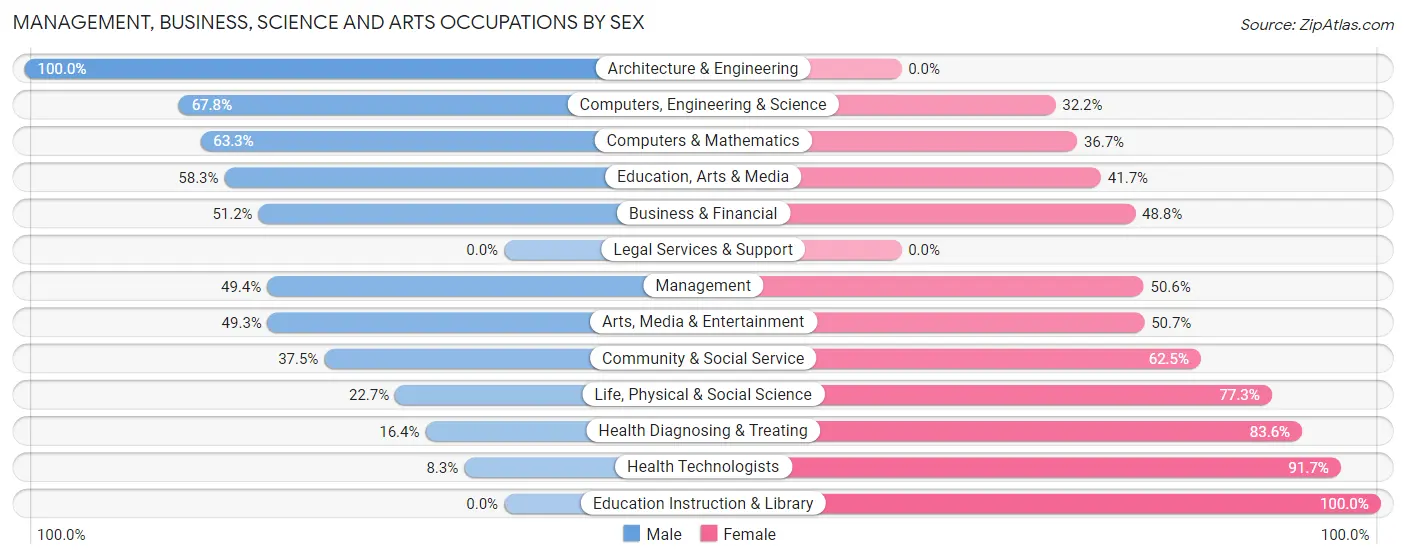
Management, Business, Science and Arts Occupations by Sex
Within the Management, Business, Science and Arts occupations in Columbus, the most male-oriented occupations are Architecture & Engineering (100.0%), Computers, Engineering & Science (67.8%), and Computers & Mathematics (63.3%), while the most female-oriented occupations are Education Instruction & Library (100.0%), Health Technologists (91.7%), and Health Diagnosing & Treating (83.6%).
| Occupation | Male | Female |
| Management | 131 (49.4%) | 134 (50.6%) |
| Business & Financial | 42 (51.2%) | 40 (48.8%) |
| Computers, Engineering & Science | 154 (67.8%) | 73 (32.2%) |
| Computers & Mathematics | 38 (63.3%) | 22 (36.7%) |
| Architecture & Engineering | 101 (100.0%) | 0 (0.0%) |
| Life, Physical & Social Science | 15 (22.7%) | 51 (77.3%) |
| Community & Social Service | 63 (37.5%) | 105 (62.5%) |
| Education, Arts & Media | 28 (58.3%) | 20 (41.7%) |
| Legal Services & Support | 0 (0.0%) | 0 (0.0%) |
| Education Instruction & Library | 0 (0.0%) | 49 (100.0%) |
| Arts, Media & Entertainment | 35 (49.3%) | 36 (50.7%) |
| Health Diagnosing & Treating | 21 (16.4%) | 107 (83.6%) |
| Health Technologists | 9 (8.3%) | 99 (91.7%) |
| Total (Category) | 411 (47.2%) | 459 (52.8%) |
| Total (Overall) | 1,268 (52.1%) | 1,167 (47.9%) |
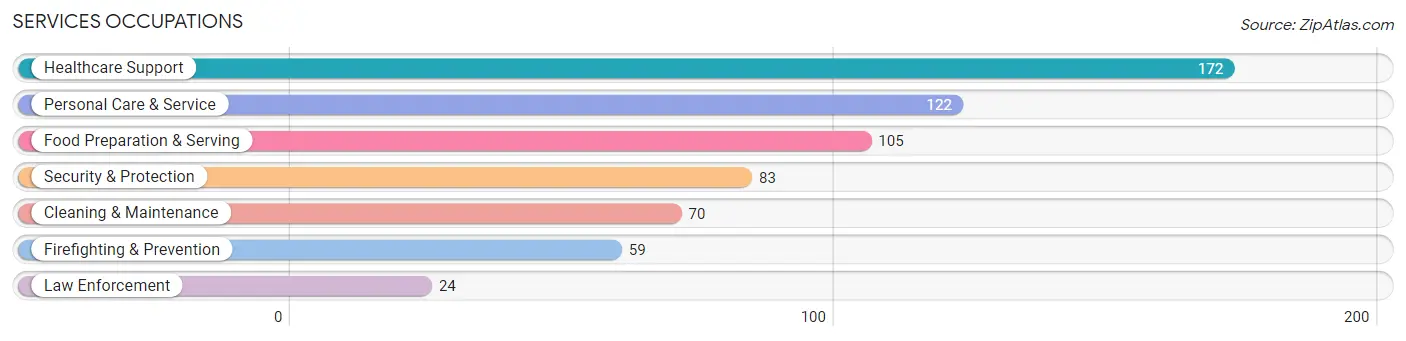
Services Occupations
The most common Services occupations in Columbus are Healthcare Support (172 | 7.1%), Personal Care & Service (122 | 5.0%), Food Preparation & Serving (105 | 4.3%), Security & Protection (83 | 3.4%), and Cleaning & Maintenance (70 | 2.9%).
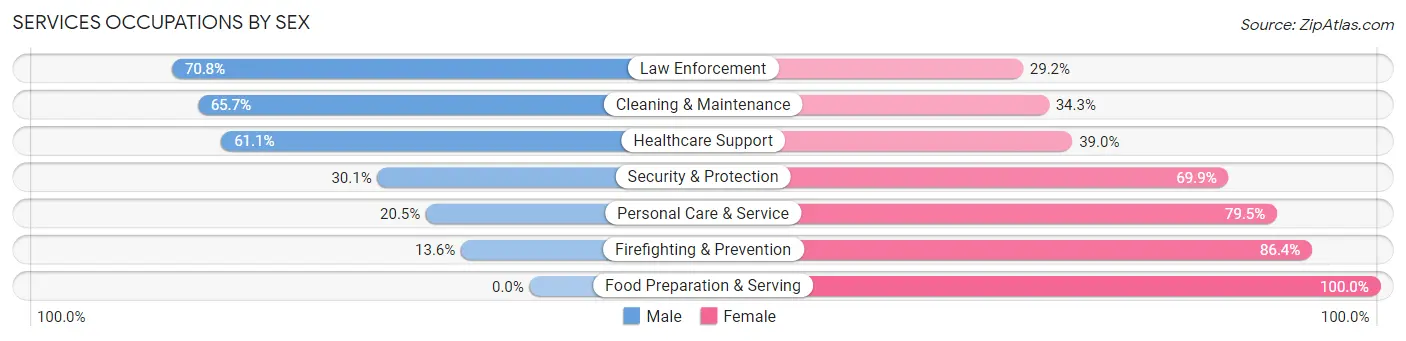
Services Occupations by Sex
Within the Services occupations in Columbus, the most male-oriented occupations are Law Enforcement (70.8%), Cleaning & Maintenance (65.7%), and Healthcare Support (61.1%), while the most female-oriented occupations are Food Preparation & Serving (100.0%), Firefighting & Prevention (86.4%), and Personal Care & Service (79.5%).
| Occupation | Male | Female |
| Healthcare Support | 105 (61.1%) | 67 (39.0%) |
| Security & Protection | 25 (30.1%) | 58 (69.9%) |
| Firefighting & Prevention | 8 (13.6%) | 51 (86.4%) |
| Law Enforcement | 17 (70.8%) | 7 (29.2%) |
| Food Preparation & Serving | 0 (0.0%) | 105 (100.0%) |
| Cleaning & Maintenance | 46 (65.7%) | 24 (34.3%) |
| Personal Care & Service | 25 (20.5%) | 97 (79.5%) |
| Total (Category) | 201 (36.4%) | 351 (63.6%) |
| Total (Overall) | 1,268 (52.1%) | 1,167 (47.9%) |
Sales and Office Occupations
The most common Sales and Office occupations in Columbus are Sales & Related (253 | 10.4%), and Office & Administration (201 | 8.3%).

Sales and Office Occupations by Sex
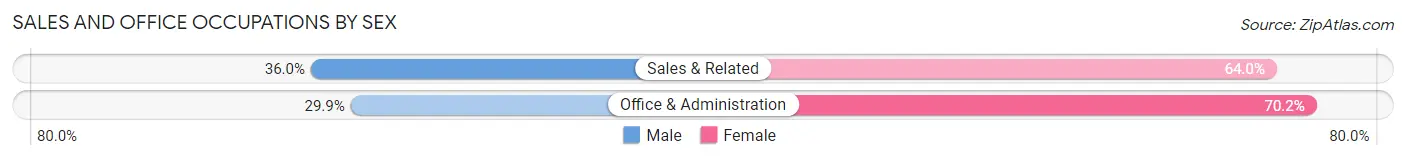
| Occupation | Male | Female |
| Sales & Related | 91 (36.0%) | 162 (64.0%) |
| Office & Administration | 60 (29.8%) | 141 (70.2%) |
| Total (Category) | 151 (33.3%) | 303 (66.7%) |
| Total (Overall) | 1,268 (52.1%) | 1,167 (47.9%) |
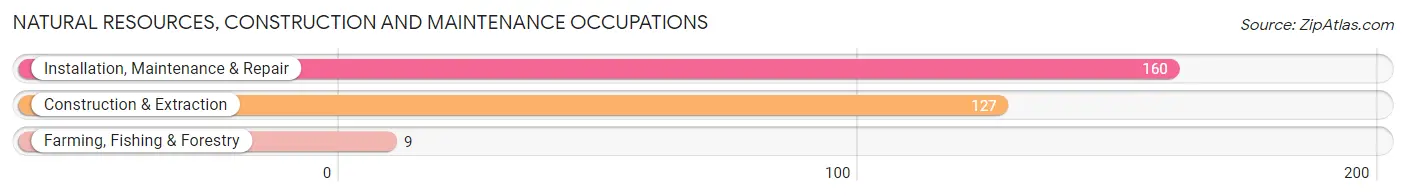
Natural Resources, Construction and Maintenance Occupations
The most common Natural Resources, Construction and Maintenance occupations in Columbus are Installation, Maintenance & Repair (160 | 6.6%), Construction & Extraction (127 | 5.2%), and Farming, Fishing & Forestry (9 | 0.4%).
Natural Resources, Construction and Maintenance Occupations by Sex
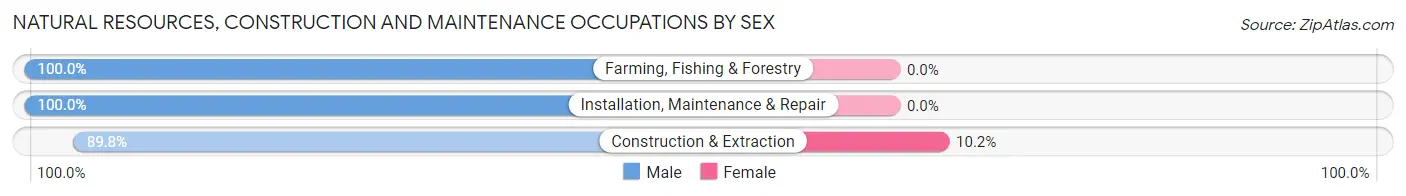
| Occupation | Male | Female |
| Farming, Fishing & Forestry | 9 (100.0%) | 0 (0.0%) |
| Construction & Extraction | 114 (89.8%) | 13 (10.2%) |
| Installation, Maintenance & Repair | 160 (100.0%) | 0 (0.0%) |
| Total (Category) | 283 (95.6%) | 13 (4.4%) |
| Total (Overall) | 1,268 (52.1%) | 1,167 (47.9%) |
Production, Transportation and Moving Occupations
The most common Production, Transportation and Moving occupations in Columbus are Production (110 | 4.5%), Material Moving (86 | 3.5%), and Transportation (67 | 2.8%).
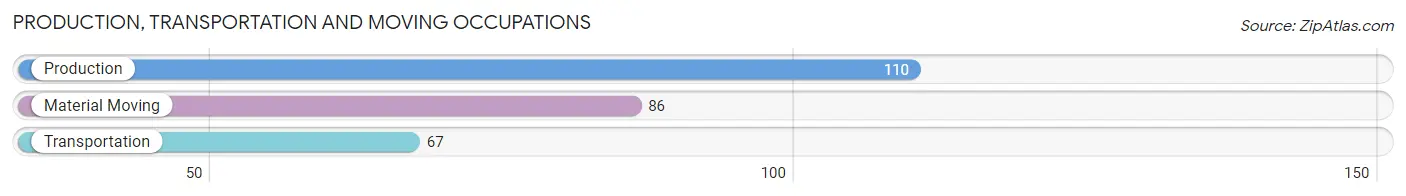
Production, Transportation and Moving Occupations by Sex
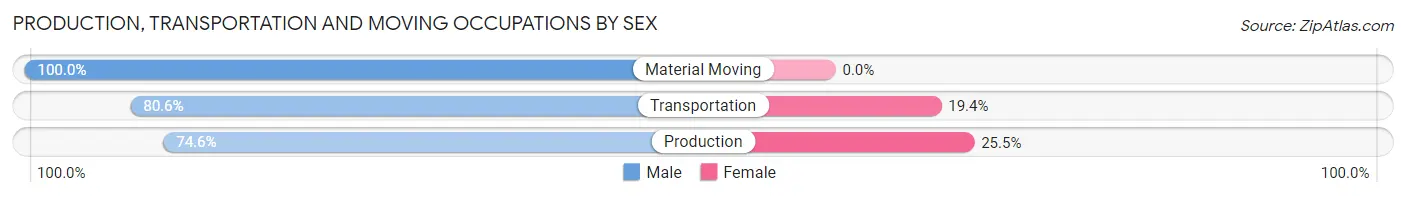
| Occupation | Male | Female |
| Production | 82 (74.6%) | 28 (25.5%) |
| Transportation | 54 (80.6%) | 13 (19.4%) |
| Material Moving | 86 (100.0%) | 0 (0.0%) |
| Total (Category) | 222 (84.4%) | 41 (15.6%) |
| Total (Overall) | 1,268 (52.1%) | 1,167 (47.9%) |
Employment Industries by Sex in Columbus
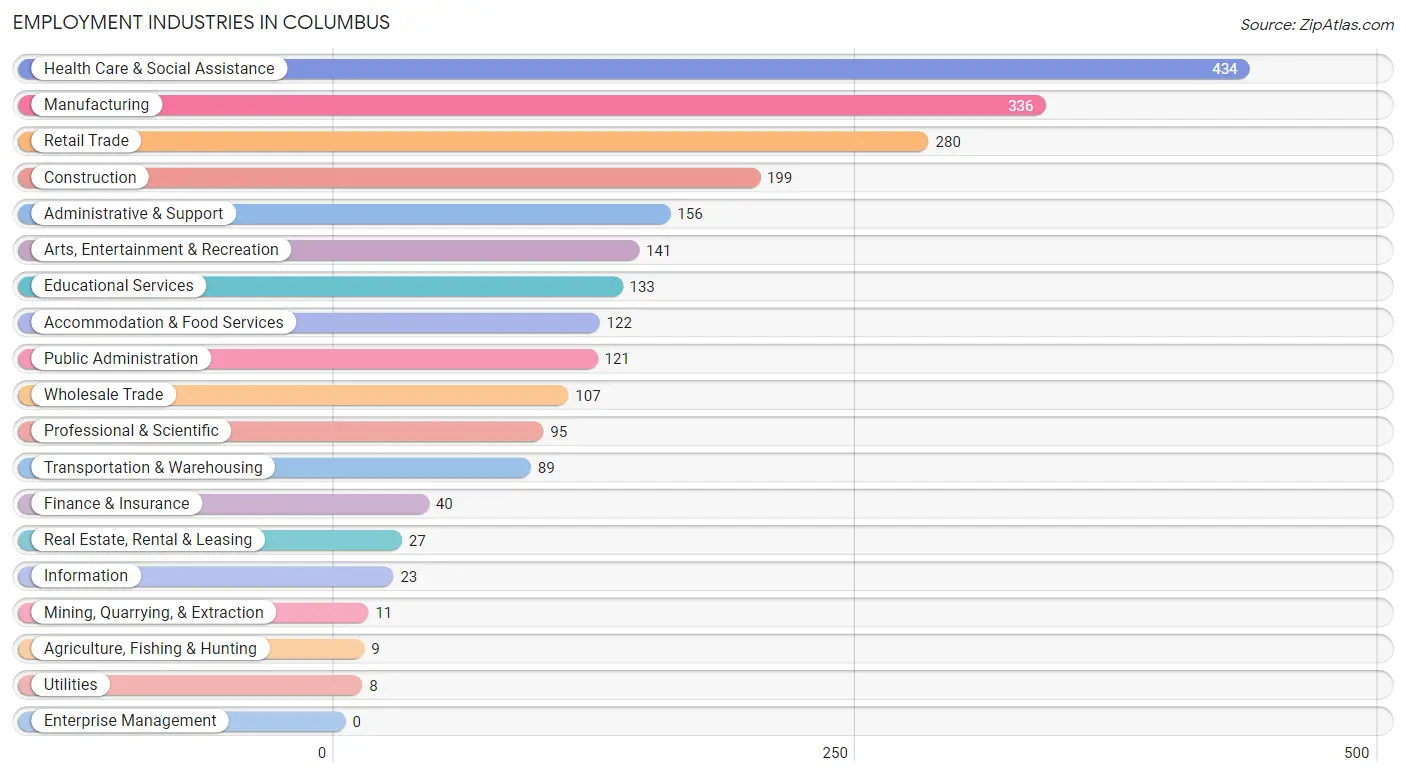
Employment Industries in Columbus
The major employment industries in Columbus include Health Care & Social Assistance (434 | 17.8%), Manufacturing (336 | 13.8%), Retail Trade (280 | 11.5%), Construction (199 | 8.2%), and Administrative & Support (156 | 6.4%).
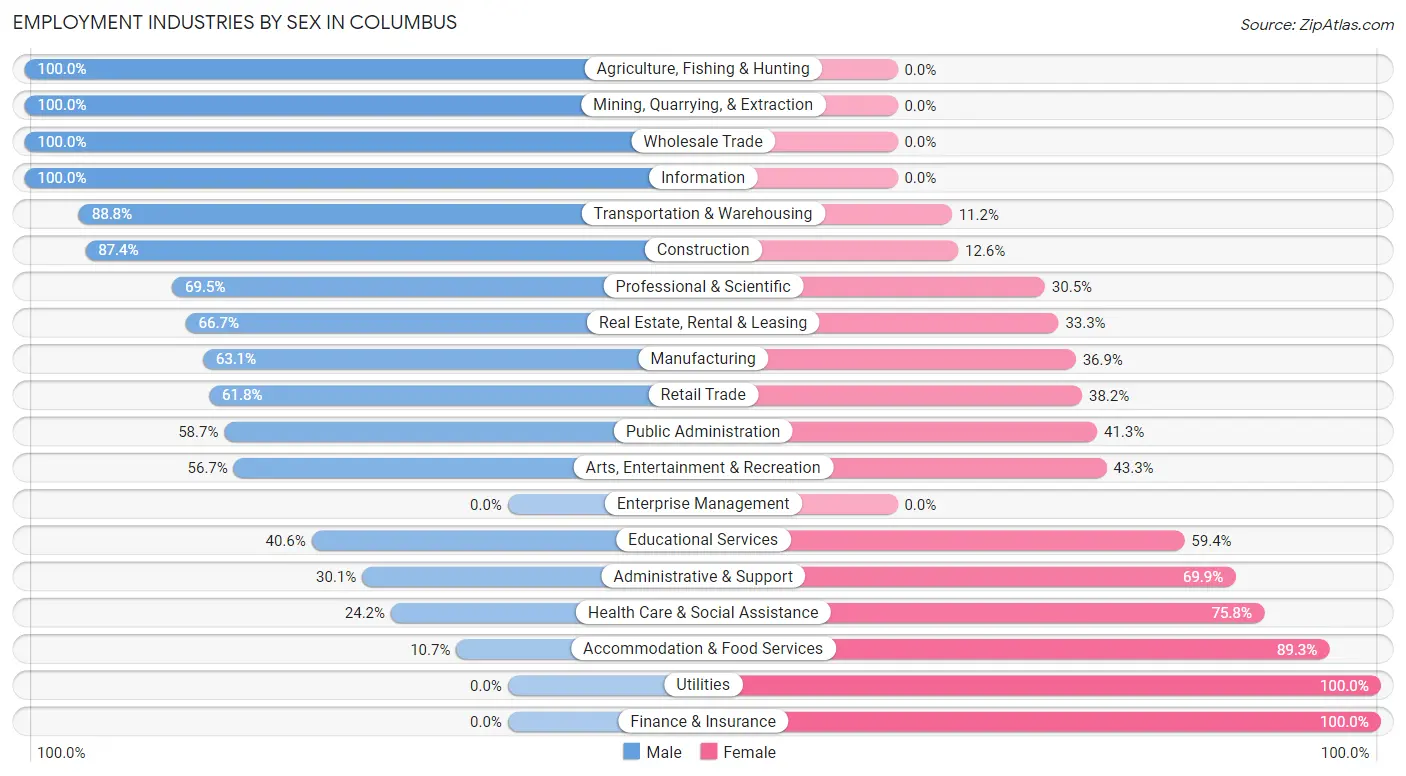
Employment Industries by Sex in Columbus
The Columbus industries that see more men than women are Agriculture, Fishing & Hunting (100.0%), Mining, Quarrying, & Extraction (100.0%), and Wholesale Trade (100.0%), whereas the industries that tend to have a higher number of women are Utilities (100.0%), Finance & Insurance (100.0%), and Accommodation & Food Services (89.3%).
| Industry | Male | Female |
| Agriculture, Fishing & Hunting | 9 (100.0%) | 0 (0.0%) |
| Mining, Quarrying, & Extraction | 11 (100.0%) | 0 (0.0%) |
| Construction | 174 (87.4%) | 25 (12.6%) |
| Manufacturing | 212 (63.1%) | 124 (36.9%) |
| Wholesale Trade | 107 (100.0%) | 0 (0.0%) |
| Retail Trade | 173 (61.8%) | 107 (38.2%) |
| Transportation & Warehousing | 79 (88.8%) | 10 (11.2%) |
| Utilities | 0 (0.0%) | 8 (100.0%) |
| Information | 23 (100.0%) | 0 (0.0%) |
| Finance & Insurance | 0 (0.0%) | 40 (100.0%) |
| Real Estate, Rental & Leasing | 18 (66.7%) | 9 (33.3%) |
| Professional & Scientific | 66 (69.5%) | 29 (30.5%) |
| Enterprise Management | 0 (0.0%) | 0 (0.0%) |
| Administrative & Support | 47 (30.1%) | 109 (69.9%) |
| Educational Services | 54 (40.6%) | 79 (59.4%) |
| Health Care & Social Assistance | 105 (24.2%) | 329 (75.8%) |
| Arts, Entertainment & Recreation | 80 (56.7%) | 61 (43.3%) |
| Accommodation & Food Services | 13 (10.7%) | 109 (89.3%) |
| Public Administration | 71 (58.7%) | 50 (41.3%) |
| Total | 1,268 (52.1%) | 1,167 (47.9%) |
Education in Columbus
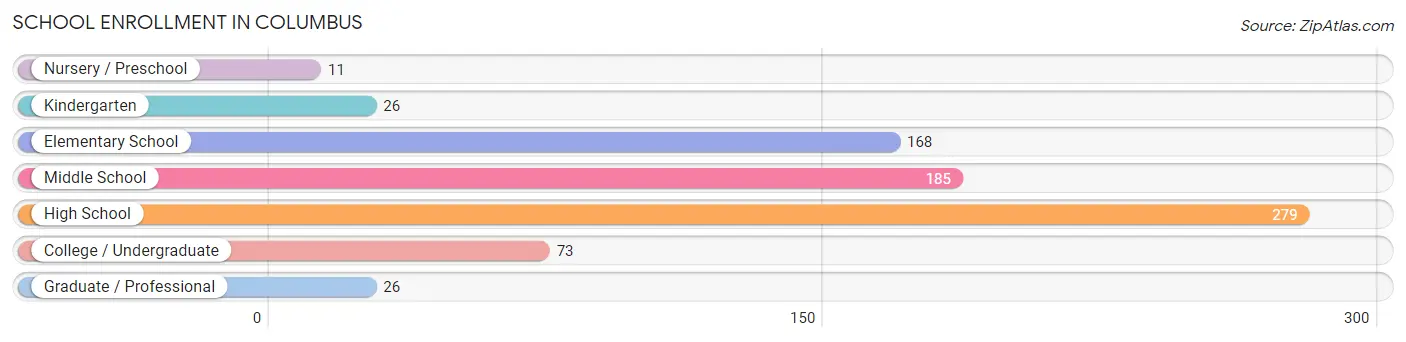
School Enrollment in Columbus
The most common levels of schooling among the 768 students in Columbus are high school (279 | 36.3%), middle school (185 | 24.1%), and elementary school (168 | 21.9%).
| School Level | # Students | % Students |
| Nursery / Preschool | 11 | 1.4% |
| Kindergarten | 26 | 3.4% |
| Elementary School | 168 | 21.9% |
| Middle School | 185 | 24.1% |
| High School | 279 | 36.3% |
| College / Undergraduate | 73 | 9.5% |
| Graduate / Professional | 26 | 3.4% |
| Total | 768 | 100.0% |
School Enrollment by Age by Funding Source in Columbus
Out of a total of 768 students who are enrolled in schools in Columbus, 33 (4.3%) attend a private institution, while the remaining 735 (95.7%) are enrolled in public schools. The age group of 10 to 14 year olds has the highest likelihood of being enrolled in private schools, with 20 (11.0% in the age bracket) enrolled. Conversely, the age group of 3 to 4 year olds has the lowest likelihood of being enrolled in a private school, with 11 (100.0% in the age bracket) attending a public institution.
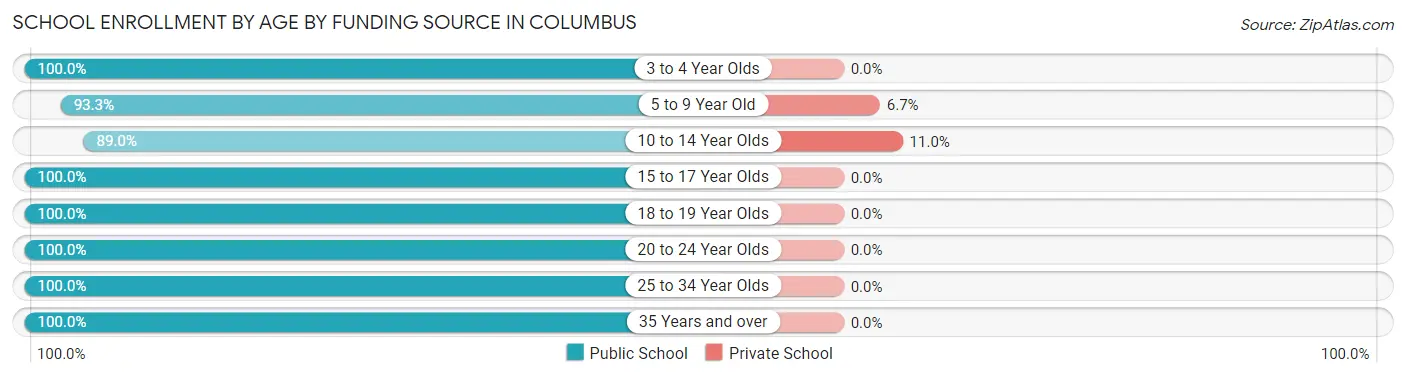
| Age Bracket | Public School | Private School |
| 3 to 4 Year Olds | 11 (100.0%) | 0 (0.0%) |
| 5 to 9 Year Old | 180 (93.3%) | 13 (6.7%) |
| 10 to 14 Year Olds | 162 (89.0%) | 20 (11.0%) |
| 15 to 17 Year Olds | 200 (100.0%) | 0 (0.0%) |
| 18 to 19 Year Olds | 112 (100.0%) | 0 (0.0%) |
| 20 to 24 Year Olds | 14 (100.0%) | 0 (0.0%) |
| 25 to 34 Year Olds | 36 (100.0%) | 0 (0.0%) |
| 35 Years and over | 20 (100.0%) | 0 (0.0%) |
| Total | 735 (95.7%) | 33 (4.3%) |
Educational Attainment by Field of Study in Columbus
Business (165 | 16.9%), science & technology (160 | 16.3%), education (84 | 8.6%), social sciences (82 | 8.4%), and engineering (79 | 8.1%) are the most common fields of study among 979 individuals in Columbus who have obtained a bachelor's degree or higher.
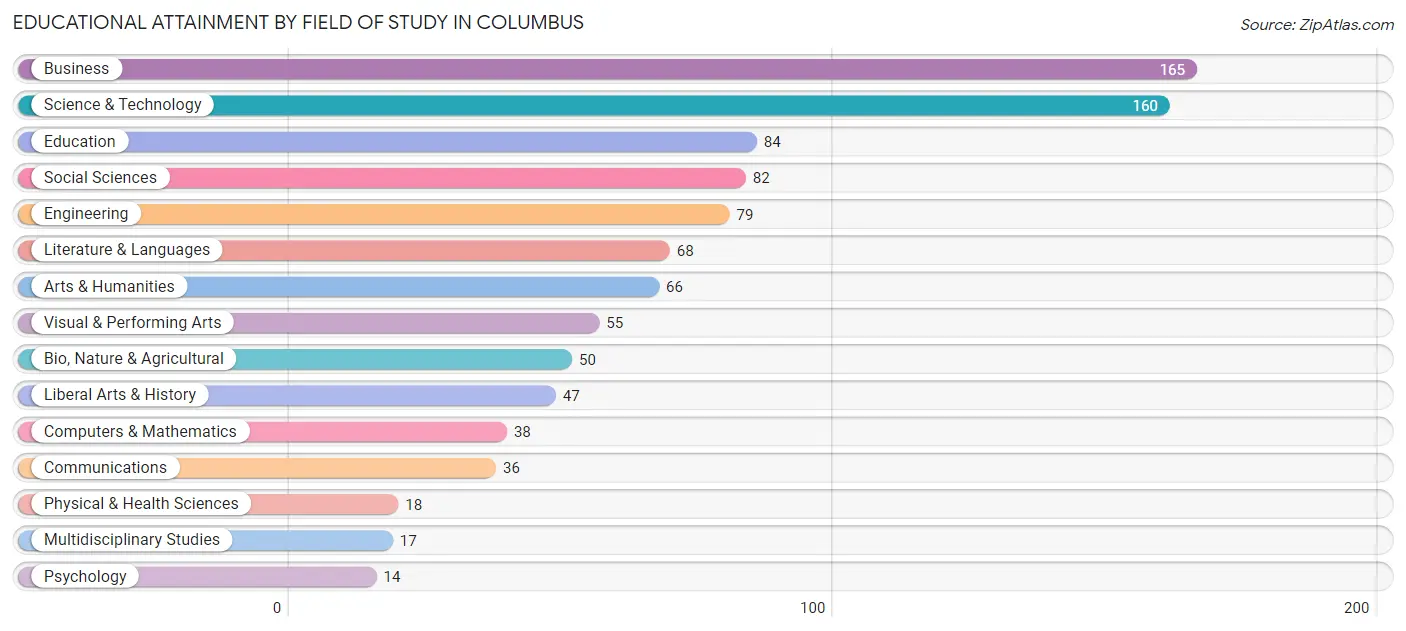
| Field of Study | # Graduates | % Graduates |
| Computers & Mathematics | 38 | 3.9% |
| Bio, Nature & Agricultural | 50 | 5.1% |
| Physical & Health Sciences | 18 | 1.8% |
| Psychology | 14 | 1.4% |
| Social Sciences | 82 | 8.4% |
| Engineering | 79 | 8.1% |
| Multidisciplinary Studies | 17 | 1.7% |
| Science & Technology | 160 | 16.3% |
| Business | 165 | 16.9% |
| Education | 84 | 8.6% |
| Literature & Languages | 68 | 7.0% |
| Liberal Arts & History | 47 | 4.8% |
| Visual & Performing Arts | 55 | 5.6% |
| Communications | 36 | 3.7% |
| Arts & Humanities | 66 | 6.7% |
| Total | 979 | 100.0% |
Transportation & Commute in Columbus
Vehicle Availability by Sex in Columbus
The most prevalent vehicle ownership categories in Columbus are males with 2 vehicles (487, accounting for 38.8%) and females with 2 vehicles (305, making up 41.7%).
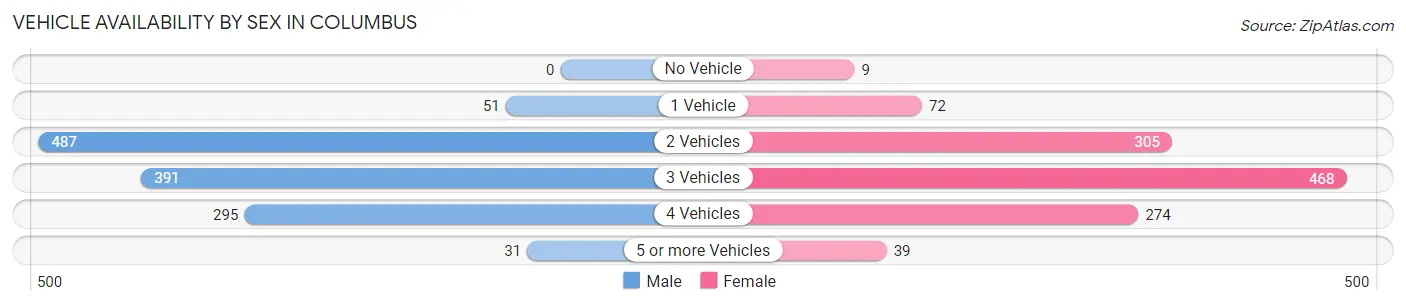
| Vehicles Available | Male | Female |
| No Vehicle | 0 (0.0%) | 9 (0.8%) |
| 1 Vehicle | 51 (4.1%) | 72 (6.2%) |
| 2 Vehicles | 487 (38.8%) | 305 (26.1%) |
| 3 Vehicles | 391 (31.2%) | 468 (40.1%) |
| 4 Vehicles | 295 (23.5%) | 274 (23.5%) |
| 5 or more Vehicles | 31 (2.5%) | 39 (3.3%) |
| Total | 1,255 (100.0%) | 1,167 (100.0%) |
Commute Time in Columbus
The most frequently occuring commute durations in Columbus are 30 to 34 minutes (687 commuters, 33.7%), 20 to 24 minutes (214 commuters, 10.5%), and 40 to 44 minutes (210 commuters, 10.3%).
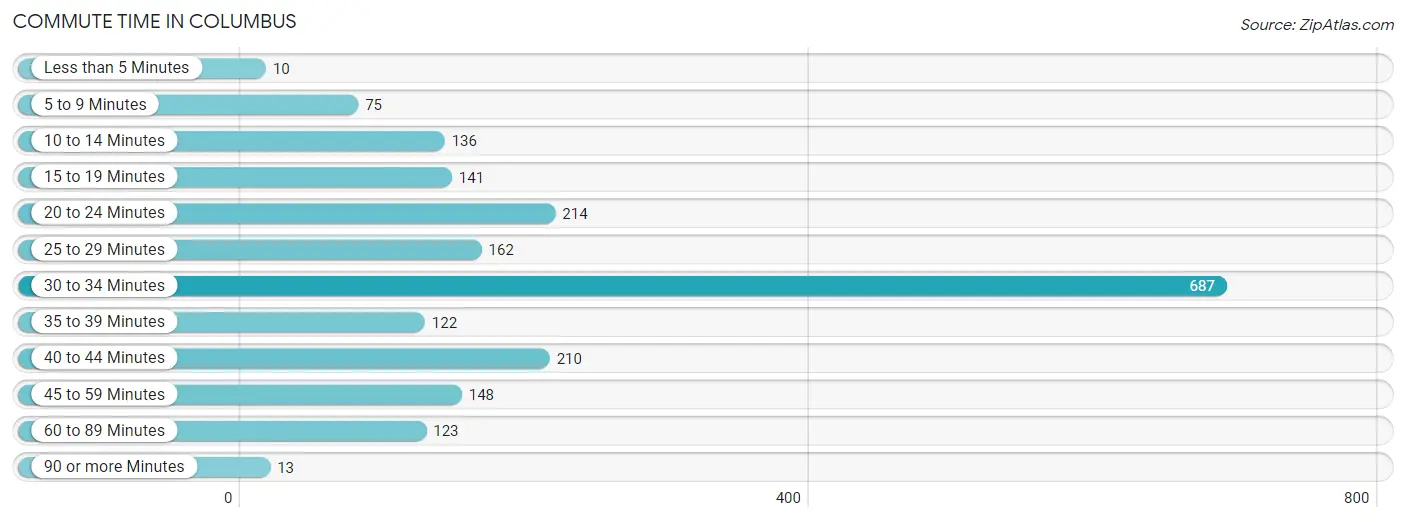
| Commute Time | # Commuters | % Commuters |
| Less than 5 Minutes | 10 | 0.5% |
| 5 to 9 Minutes | 75 | 3.7% |
| 10 to 14 Minutes | 136 | 6.7% |
| 15 to 19 Minutes | 141 | 6.9% |
| 20 to 24 Minutes | 214 | 10.5% |
| 25 to 29 Minutes | 162 | 7.9% |
| 30 to 34 Minutes | 687 | 33.7% |
| 35 to 39 Minutes | 122 | 6.0% |
| 40 to 44 Minutes | 210 | 10.3% |
| 45 to 59 Minutes | 148 | 7.2% |
| 60 to 89 Minutes | 123 | 6.0% |
| 90 or more Minutes | 13 | 0.6% |
Commute Time by Sex in Columbus
The most common commute times in Columbus are 30 to 34 minutes (425 commuters, 39.3%) for males and 30 to 34 minutes (262 commuters, 27.3%) for females.
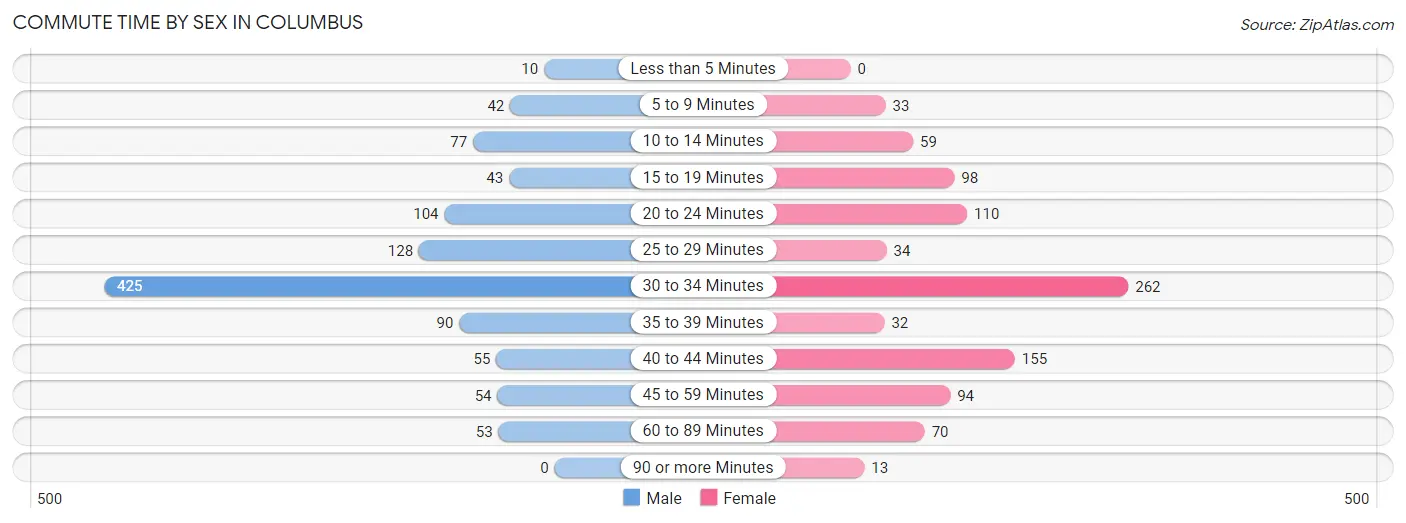
| Commute Time | Male | Female |
| Less than 5 Minutes | 10 (0.9%) | 0 (0.0%) |
| 5 to 9 Minutes | 42 (3.9%) | 33 (3.4%) |
| 10 to 14 Minutes | 77 (7.1%) | 59 (6.1%) |
| 15 to 19 Minutes | 43 (4.0%) | 98 (10.2%) |
| 20 to 24 Minutes | 104 (9.6%) | 110 (11.5%) |
| 25 to 29 Minutes | 128 (11.8%) | 34 (3.5%) |
| 30 to 34 Minutes | 425 (39.3%) | 262 (27.3%) |
| 35 to 39 Minutes | 90 (8.3%) | 32 (3.3%) |
| 40 to 44 Minutes | 55 (5.1%) | 155 (16.2%) |
| 45 to 59 Minutes | 54 (5.0%) | 94 (9.8%) |
| 60 to 89 Minutes | 53 (4.9%) | 70 (7.3%) |
| 90 or more Minutes | 0 (0.0%) | 13 (1.3%) |
Time of Departure to Work by Sex in Columbus
The most frequent times of departure to work in Columbus are 12:00 PM to 3:59 PM (212, 19.6%) for males and 7:30 AM to 7:59 AM (173, 18.0%) for females.
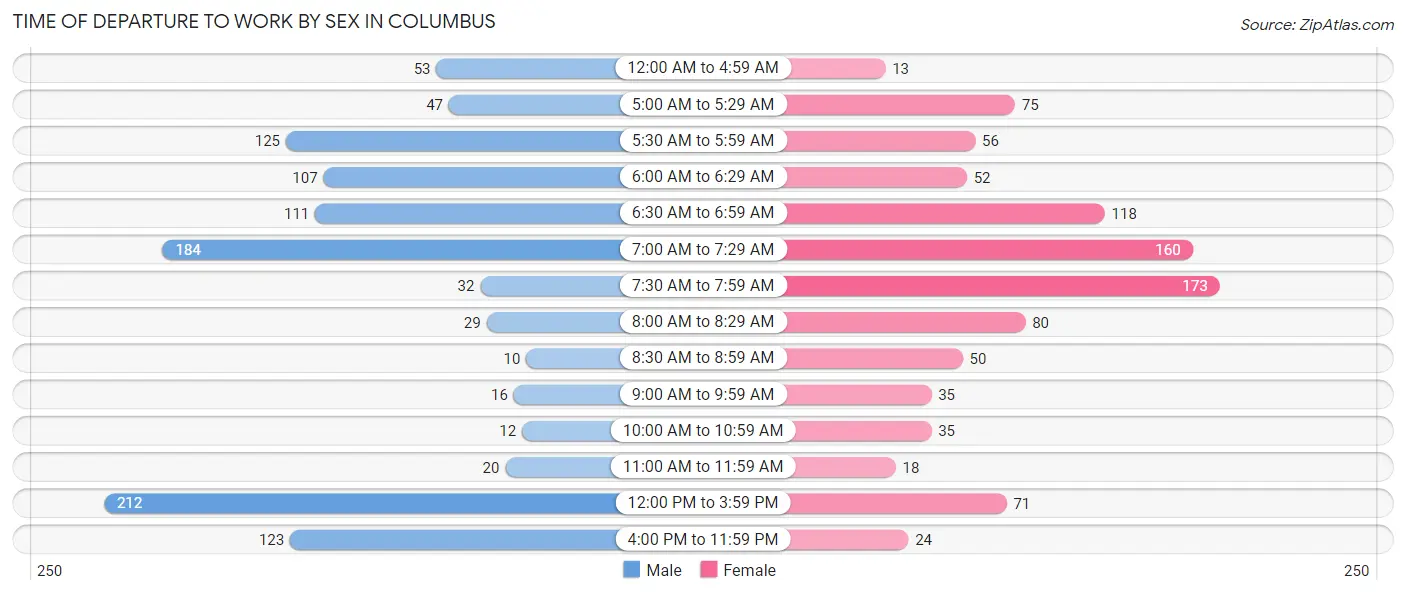
| Time of Departure | Male | Female |
| 12:00 AM to 4:59 AM | 53 (4.9%) | 13 (1.3%) |
| 5:00 AM to 5:29 AM | 47 (4.3%) | 75 (7.8%) |
| 5:30 AM to 5:59 AM | 125 (11.6%) | 56 (5.8%) |
| 6:00 AM to 6:29 AM | 107 (9.9%) | 52 (5.4%) |
| 6:30 AM to 6:59 AM | 111 (10.3%) | 118 (12.3%) |
| 7:00 AM to 7:29 AM | 184 (17.0%) | 160 (16.7%) |
| 7:30 AM to 7:59 AM | 32 (3.0%) | 173 (18.0%) |
| 8:00 AM to 8:29 AM | 29 (2.7%) | 80 (8.3%) |
| 8:30 AM to 8:59 AM | 10 (0.9%) | 50 (5.2%) |
| 9:00 AM to 9:59 AM | 16 (1.5%) | 35 (3.6%) |
| 10:00 AM to 10:59 AM | 12 (1.1%) | 35 (3.6%) |
| 11:00 AM to 11:59 AM | 20 (1.8%) | 18 (1.9%) |
| 12:00 PM to 3:59 PM | 212 (19.6%) | 71 (7.4%) |
| 4:00 PM to 11:59 PM | 123 (11.4%) | 24 (2.5%) |
| Total | 1,081 (100.0%) | 960 (100.0%) |
Housing Occupancy in Columbus
Occupancy by Ownership in Columbus
Of the total 1,613 dwellings in Columbus, owner-occupied units account for 1,398 (86.7%), while renter-occupied units make up 215 (13.3%).
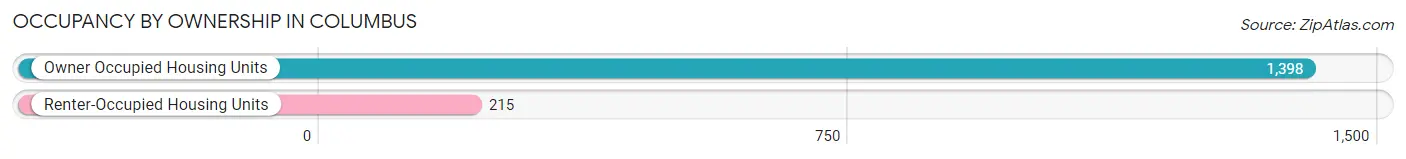
| Occupancy | # Housing Units | % Housing Units |
| Owner Occupied Housing Units | 1,398 | 86.7% |
| Renter-Occupied Housing Units | 215 | 13.3% |
| Total Occupied Housing Units | 1,613 | 100.0% |
Occupancy by Household Size in Columbus
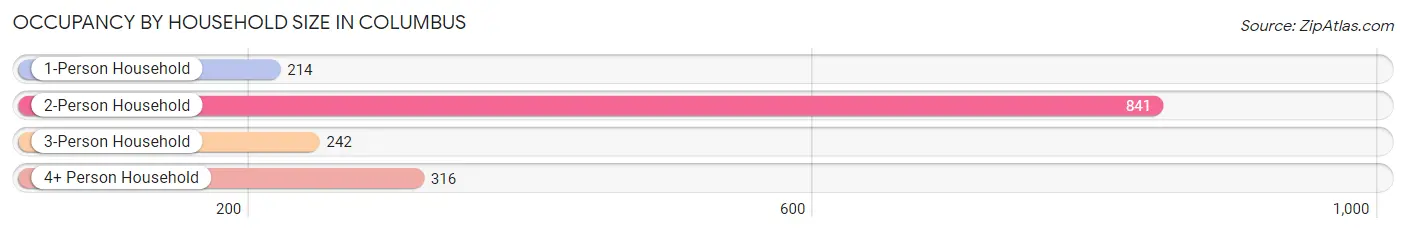
| Household Size | # Housing Units | % Housing Units |
| 1-Person Household | 214 | 13.3% |
| 2-Person Household | 841 | 52.1% |
| 3-Person Household | 242 | 15.0% |
| 4+ Person Household | 316 | 19.6% |
| Total Housing Units | 1,613 | 100.0% |
Occupancy by Ownership by Household Size in Columbus
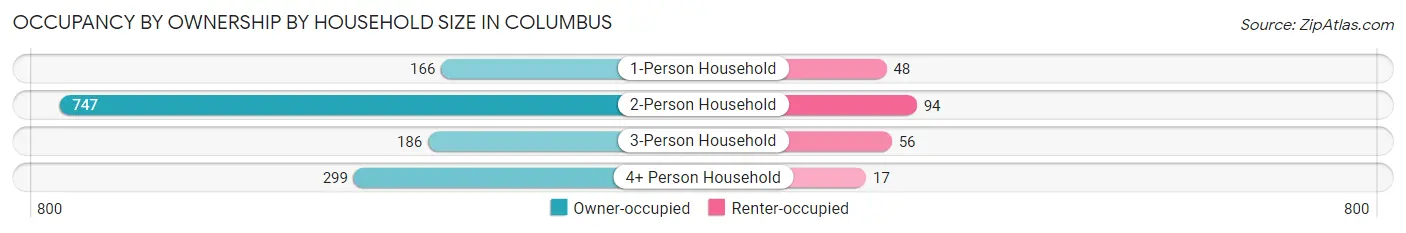
| Household Size | Owner-occupied | Renter-occupied |
| 1-Person Household | 166 (77.6%) | 48 (22.4%) |
| 2-Person Household | 747 (88.8%) | 94 (11.2%) |
| 3-Person Household | 186 (76.9%) | 56 (23.1%) |
| 4+ Person Household | 299 (94.6%) | 17 (5.4%) |
| Total Housing Units | 1,398 (86.7%) | 215 (13.3%) |
Occupancy by Educational Attainment in Columbus
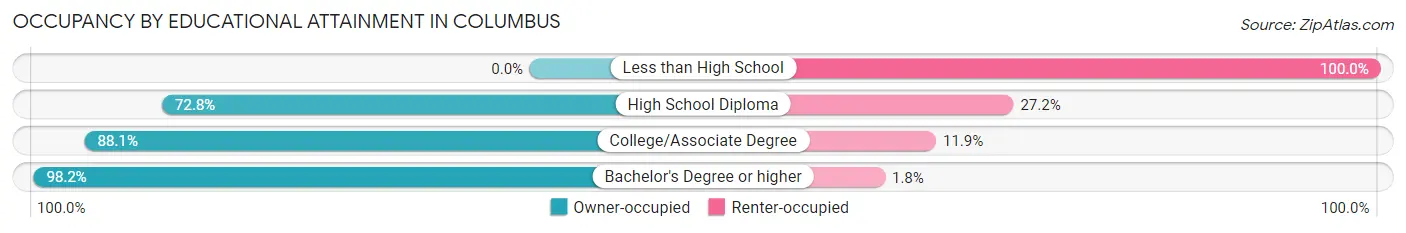
| Household Size | Owner-occupied | Renter-occupied |
| Less than High School | 0 (0.0%) | 11 (100.0%) |
| High School Diploma | 310 (72.8%) | 116 (27.2%) |
| College/Associate Degree | 586 (88.1%) | 79 (11.9%) |
| Bachelor's Degree or higher | 502 (98.2%) | 9 (1.8%) |
Occupancy by Age of Householder in Columbus
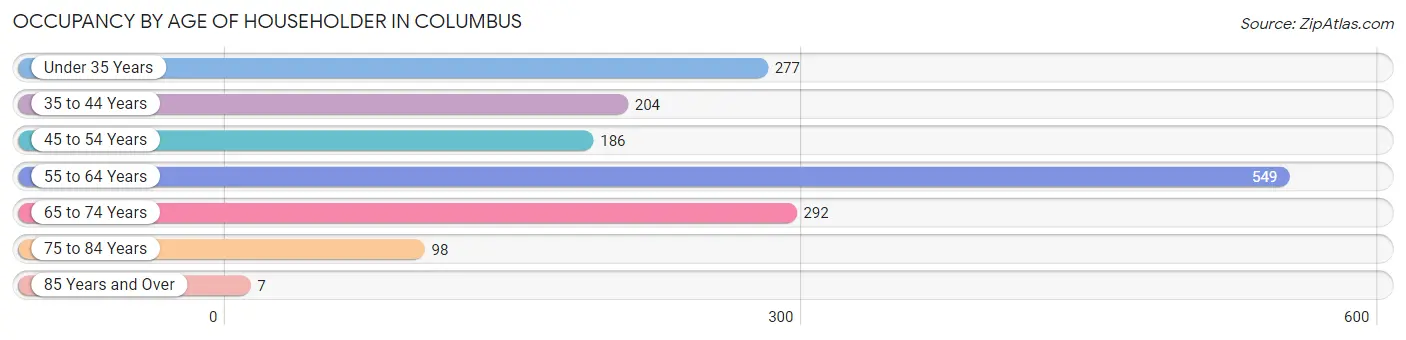
| Age Bracket | # Households | % Households |
| Under 35 Years | 277 | 17.2% |
| 35 to 44 Years | 204 | 12.7% |
| 45 to 54 Years | 186 | 11.5% |
| 55 to 64 Years | 549 | 34.0% |
| 65 to 74 Years | 292 | 18.1% |
| 75 to 84 Years | 98 | 6.1% |
| 85 Years and Over | 7 | 0.4% |
| Total | 1,613 | 100.0% |
Housing Finances in Columbus
Median Income by Occupancy in Columbus
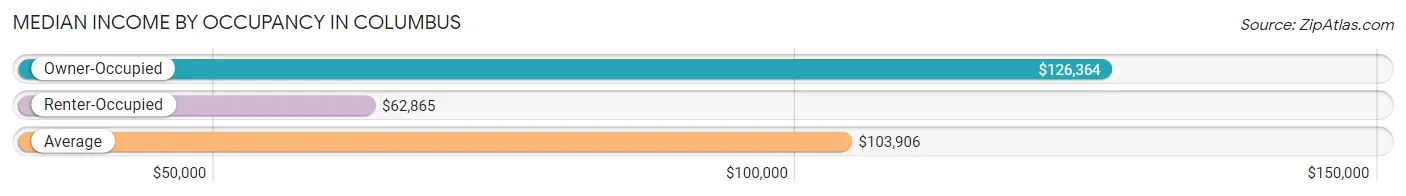
| Occupancy Type | # Households | Median Income |
| Owner-Occupied | 1,398 (86.7%) | $126,364 |
| Renter-Occupied | 215 (13.3%) | $62,865 |
| Average | 1,613 (100.0%) | $103,906 |
Occupancy by Householder Income Bracket in Columbus
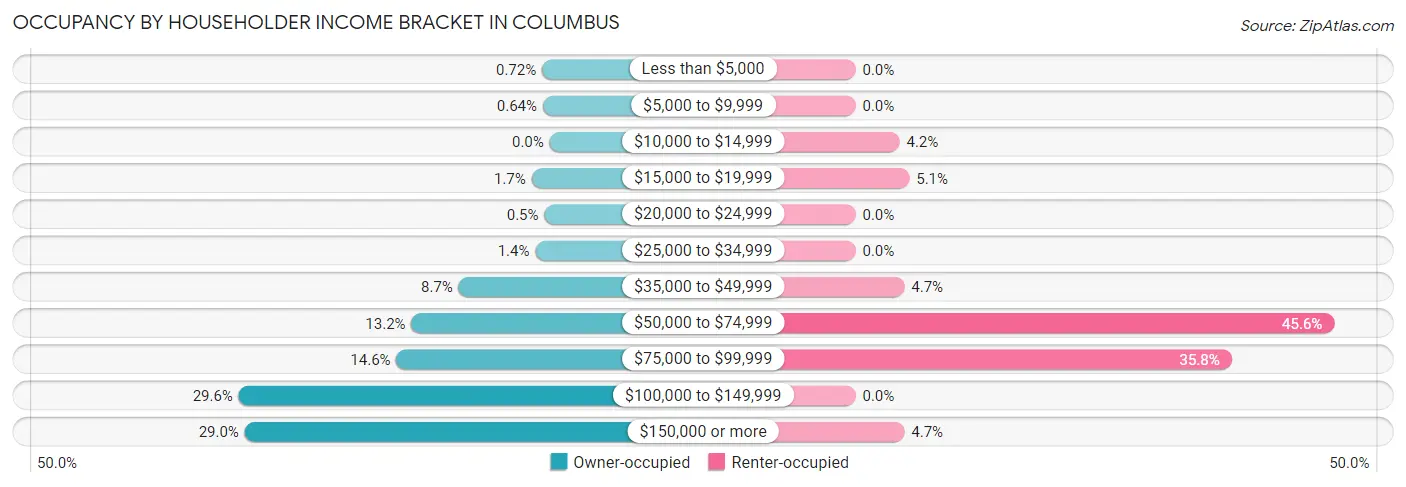
| Income Bracket | Owner-occupied | Renter-occupied |
| Less than $5,000 | 10 (0.7%) | 0 (0.0%) |
| $5,000 to $9,999 | 9 (0.6%) | 0 (0.0%) |
| $10,000 to $14,999 | 0 (0.0%) | 9 (4.2%) |
| $15,000 to $19,999 | 24 (1.7%) | 11 (5.1%) |
| $20,000 to $24,999 | 7 (0.5%) | 0 (0.0%) |
| $25,000 to $34,999 | 19 (1.4%) | 0 (0.0%) |
| $35,000 to $49,999 | 121 (8.7%) | 10 (4.6%) |
| $50,000 to $74,999 | 184 (13.2%) | 98 (45.6%) |
| $75,000 to $99,999 | 204 (14.6%) | 77 (35.8%) |
| $100,000 to $149,999 | 414 (29.6%) | 0 (0.0%) |
| $150,000 or more | 406 (29.0%) | 10 (4.6%) |
| Total | 1,398 (100.0%) | 215 (100.0%) |
Monthly Housing Cost Tiers in Columbus
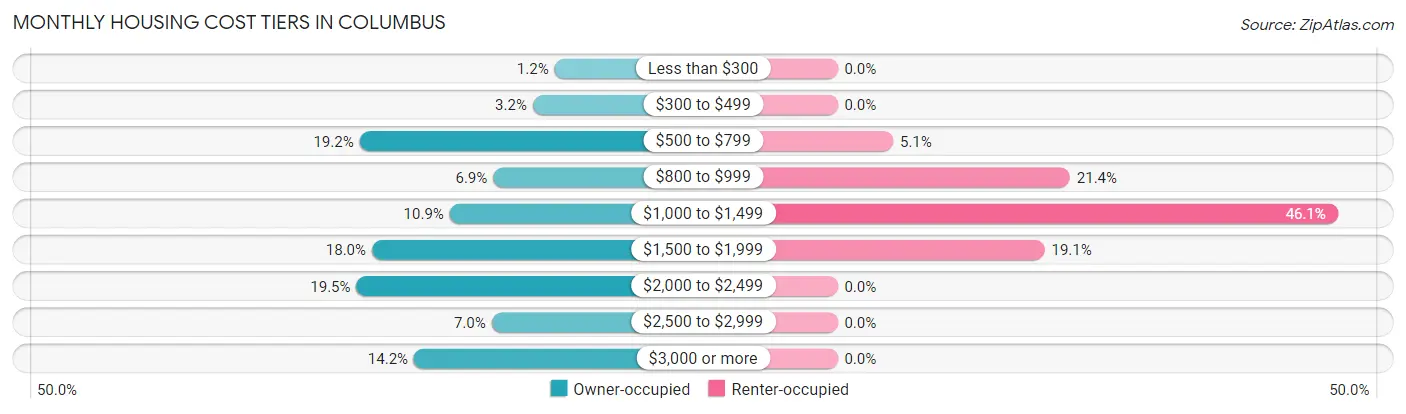
| Monthly Cost | Owner-occupied | Renter-occupied |
| Less than $300 | 17 (1.2%) | 0 (0.0%) |
| $300 to $499 | 45 (3.2%) | 0 (0.0%) |
| $500 to $799 | 268 (19.2%) | 11 (5.1%) |
| $800 to $999 | 96 (6.9%) | 46 (21.4%) |
| $1,000 to $1,499 | 152 (10.9%) | 99 (46.1%) |
| $1,500 to $1,999 | 252 (18.0%) | 41 (19.1%) |
| $2,000 to $2,499 | 272 (19.5%) | 0 (0.0%) |
| $2,500 to $2,999 | 98 (7.0%) | 0 (0.0%) |
| $3,000 or more | 198 (14.2%) | 0 (0.0%) |
| Total | 1,398 (100.0%) | 215 (100.0%) |
Physical Housing Characteristics in Columbus
Housing Structures in Columbus
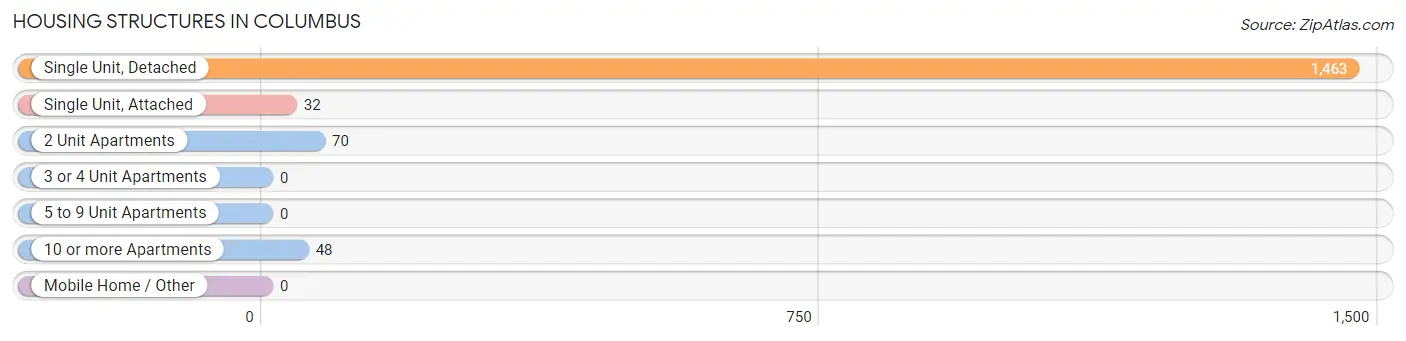
| Structure Type | # Housing Units | % Housing Units |
| Single Unit, Detached | 1,463 | 90.7% |
| Single Unit, Attached | 32 | 2.0% |
| 2 Unit Apartments | 70 | 4.3% |
| 3 or 4 Unit Apartments | 0 | 0.0% |
| 5 to 9 Unit Apartments | 0 | 0.0% |
| 10 or more Apartments | 48 | 3.0% |
| Mobile Home / Other | 0 | 0.0% |
| Total | 1,613 | 100.0% |
Housing Structures by Occupancy in Columbus
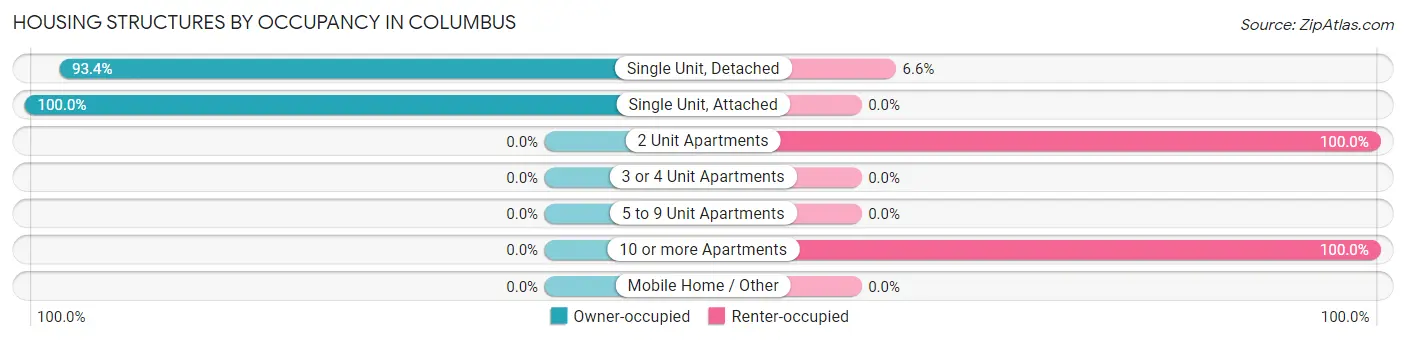
| Structure Type | Owner-occupied | Renter-occupied |
| Single Unit, Detached | 1,366 (93.4%) | 97 (6.6%) |
| Single Unit, Attached | 32 (100.0%) | 0 (0.0%) |
| 2 Unit Apartments | 0 (0.0%) | 70 (100.0%) |
| 3 or 4 Unit Apartments | 0 (0.0%) | 0 (0.0%) |
| 5 to 9 Unit Apartments | 0 (0.0%) | 0 (0.0%) |
| 10 or more Apartments | 0 (0.0%) | 48 (100.0%) |
| Mobile Home / Other | 0 (0.0%) | 0 (0.0%) |
| Total | 1,398 (86.7%) | 215 (13.3%) |
Housing Structures by Number of Rooms in Columbus
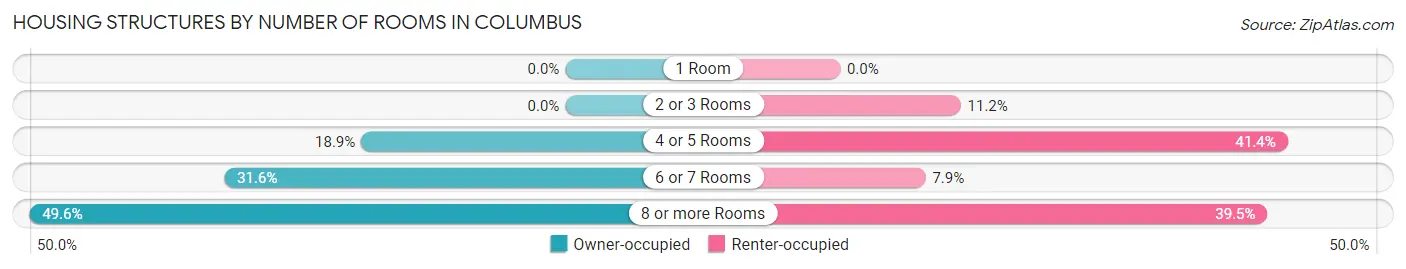
| Number of Rooms | Owner-occupied | Renter-occupied |
| 1 Room | 0 (0.0%) | 0 (0.0%) |
| 2 or 3 Rooms | 0 (0.0%) | 24 (11.2%) |
| 4 or 5 Rooms | 264 (18.9%) | 89 (41.4%) |
| 6 or 7 Rooms | 441 (31.6%) | 17 (7.9%) |
| 8 or more Rooms | 693 (49.6%) | 85 (39.5%) |
| Total | 1,398 (100.0%) | 215 (100.0%) |
Housing Structure by Heating Type in Columbus
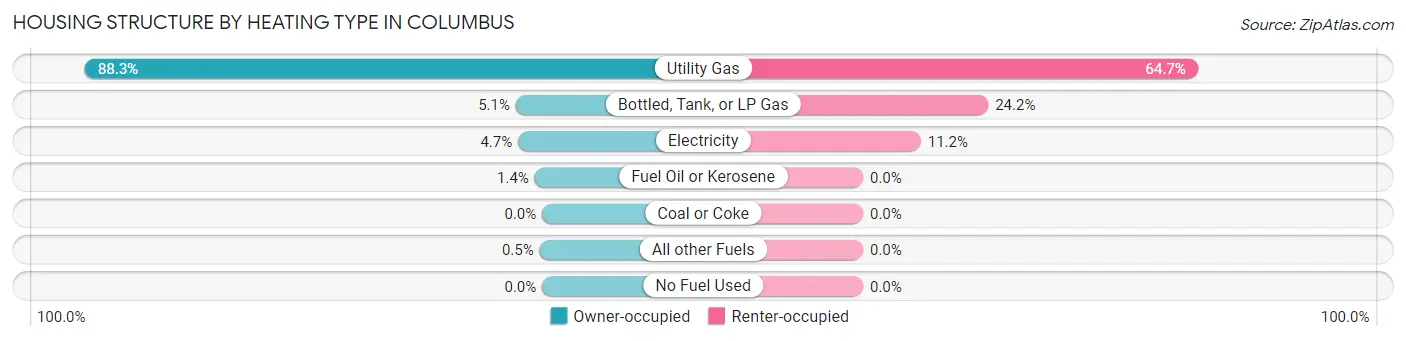
| Heating Type | Owner-occupied | Renter-occupied |
| Utility Gas | 1,235 (88.3%) | 139 (64.6%) |
| Bottled, Tank, or LP Gas | 71 (5.1%) | 52 (24.2%) |
| Electricity | 65 (4.6%) | 24 (11.2%) |
| Fuel Oil or Kerosene | 20 (1.4%) | 0 (0.0%) |
| Coal or Coke | 0 (0.0%) | 0 (0.0%) |
| All other Fuels | 7 (0.5%) | 0 (0.0%) |
| No Fuel Used | 0 (0.0%) | 0 (0.0%) |
| Total | 1,398 (100.0%) | 215 (100.0%) |
Household Vehicle Usage in Columbus
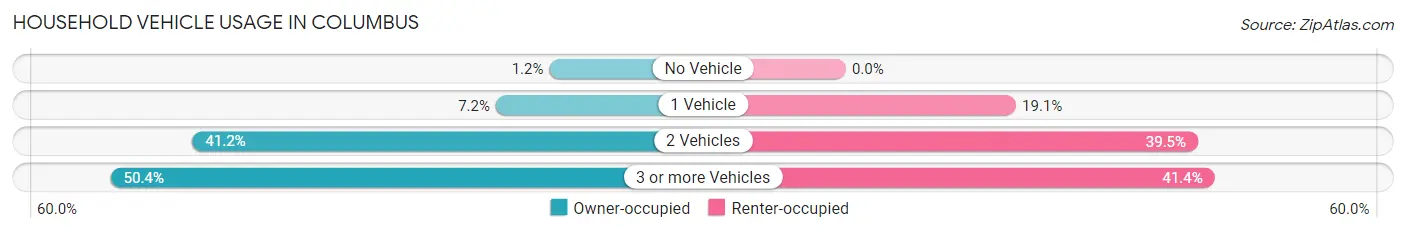
| Vehicles per Household | Owner-occupied | Renter-occupied |
| No Vehicle | 17 (1.2%) | 0 (0.0%) |
| 1 Vehicle | 101 (7.2%) | 41 (19.1%) |
| 2 Vehicles | 576 (41.2%) | 85 (39.5%) |
| 3 or more Vehicles | 704 (50.4%) | 89 (41.4%) |
| Total | 1,398 (100.0%) | 215 (100.0%) |
Real Estate & Mortgages in Columbus
Real Estate and Mortgage Overview in Columbus
| Characteristic | Without Mortgage | With Mortgage |
| Housing Units | 470 | 928 |
| Median Property Value | $381,600 | $403,100 |
| Median Household Income | $95,091 | $340 |
| Monthly Housing Costs | $717 | $198 |
| Real Estate Taxes | $4,422 | $0 |
Property Value by Mortgage Status in Columbus
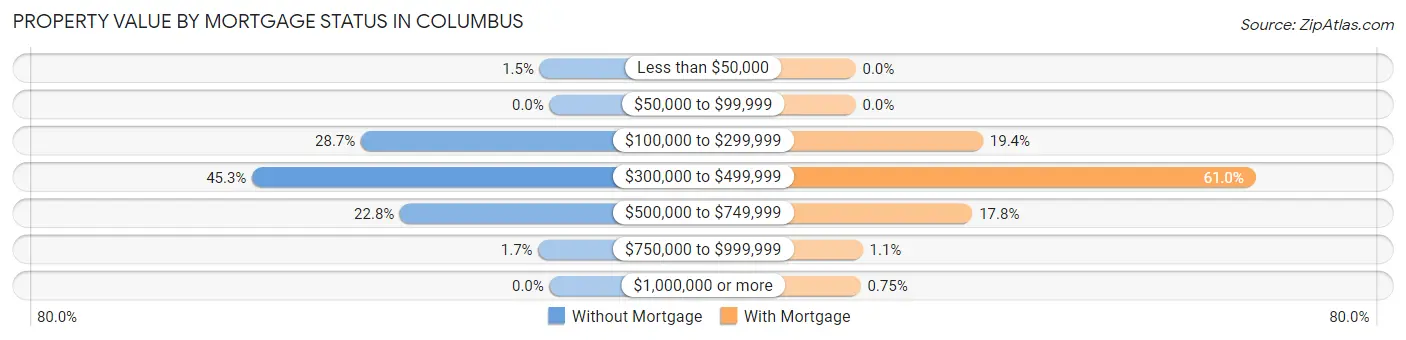
| Property Value | Without Mortgage | With Mortgage |
| Less than $50,000 | 7 (1.5%) | 0 (0.0%) |
| $50,000 to $99,999 | 0 (0.0%) | 0 (0.0%) |
| $100,000 to $299,999 | 135 (28.7%) | 180 (19.4%) |
| $300,000 to $499,999 | 213 (45.3%) | 566 (61.0%) |
| $500,000 to $749,999 | 107 (22.8%) | 165 (17.8%) |
| $750,000 to $999,999 | 8 (1.7%) | 10 (1.1%) |
| $1,000,000 or more | 0 (0.0%) | 7 (0.7%) |
| Total | 470 (100.0%) | 928 (100.0%) |
Household Income by Mortgage Status in Columbus
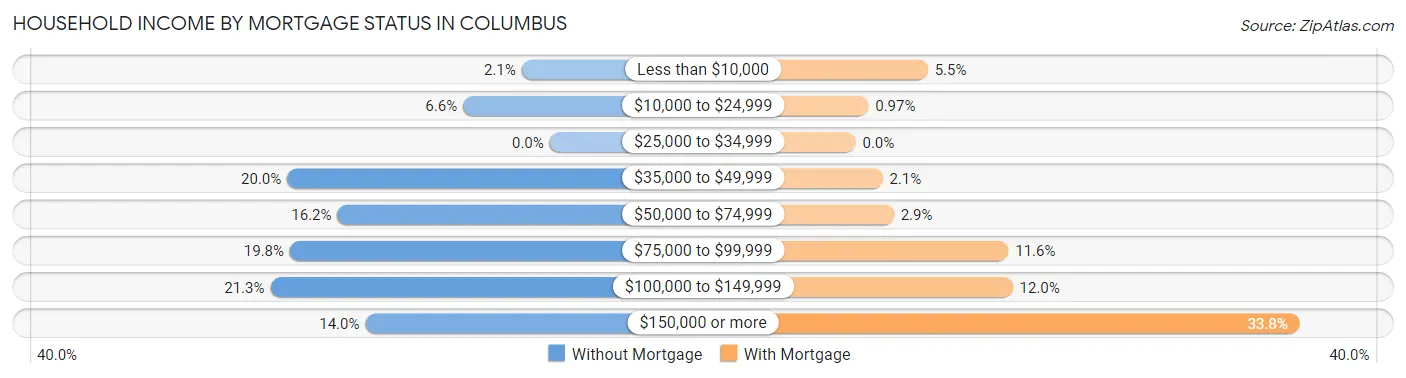
| Household Income | Without Mortgage | With Mortgage |
| Less than $10,000 | 10 (2.1%) | 51 (5.5%) |
| $10,000 to $24,999 | 31 (6.6%) | 9 (1.0%) |
| $25,000 to $34,999 | 0 (0.0%) | 0 (0.0%) |
| $35,000 to $49,999 | 94 (20.0%) | 19 (2.1%) |
| $50,000 to $74,999 | 76 (16.2%) | 27 (2.9%) |
| $75,000 to $99,999 | 93 (19.8%) | 108 (11.6%) |
| $100,000 to $149,999 | 100 (21.3%) | 111 (12.0%) |
| $150,000 or more | 66 (14.0%) | 314 (33.8%) |
| Total | 470 (100.0%) | 928 (100.0%) |
Property Value to Household Income Ratio in Columbus
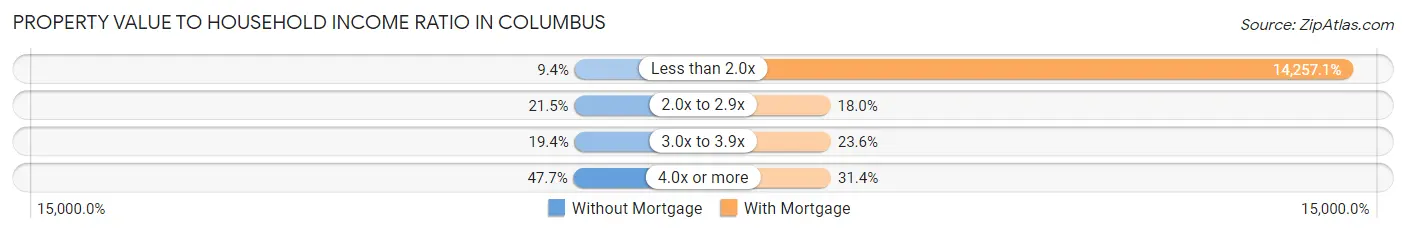
| Value-to-Income Ratio | Without Mortgage | With Mortgage |
| Less than 2.0x | 44 (9.4%) | 132,306 (14,257.1%) |
| 2.0x to 2.9x | 101 (21.5%) | 167 (18.0%) |
| 3.0x to 3.9x | 91 (19.4%) | 219 (23.6%) |
| 4.0x or more | 224 (47.7%) | 291 (31.4%) |
| Total | 470 (100.0%) | 928 (100.0%) |
Real Estate Taxes by Mortgage Status in Columbus
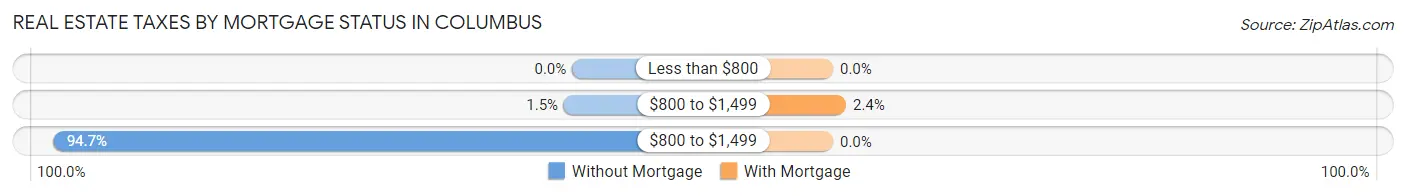
| Property Taxes | Without Mortgage | With Mortgage |
| Less than $800 | 0 (0.0%) | 0 (0.0%) |
| $800 to $1,499 | 7 (1.5%) | 22 (2.4%) |
| $800 to $1,499 | 445 (94.7%) | 0 (0.0%) |
| Total | 470 (100.0%) | 928 (100.0%) |
Health & Disability in Columbus
Health Insurance Coverage by Age in Columbus
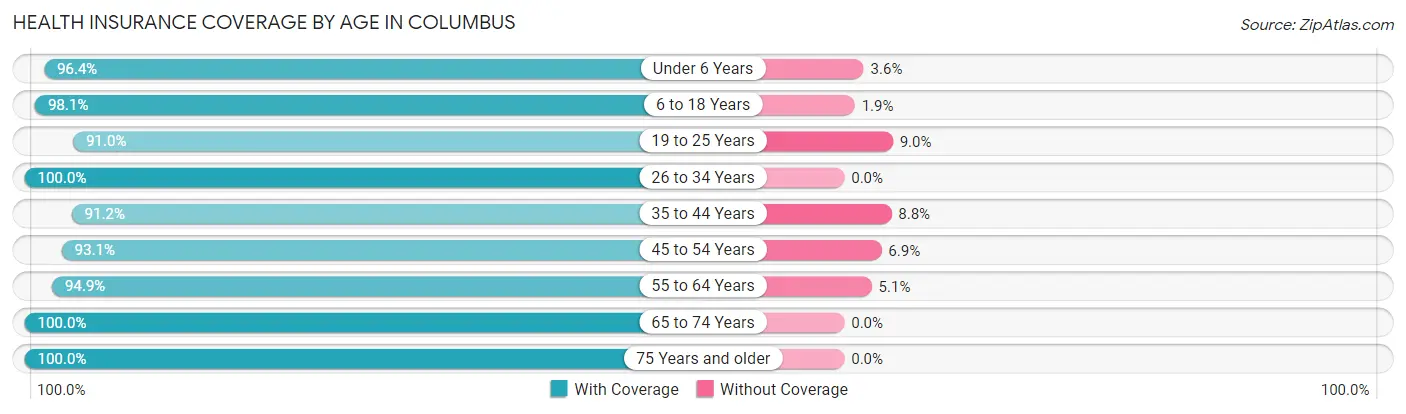
| Age Bracket | With Coverage | Without Coverage |
| Under 6 Years | 187 (96.4%) | 7 (3.6%) |
| 6 to 18 Years | 658 (98.1%) | 13 (1.9%) |
| 19 to 25 Years | 292 (91.0%) | 29 (9.0%) |
| 26 to 34 Years | 375 (100.0%) | 0 (0.0%) |
| 35 to 44 Years | 416 (91.2%) | 40 (8.8%) |
| 45 to 54 Years | 471 (93.1%) | 35 (6.9%) |
| 55 to 64 Years | 875 (94.9%) | 47 (5.1%) |
| 65 to 74 Years | 568 (100.0%) | 0 (0.0%) |
| 75 Years and older | 167 (100.0%) | 0 (0.0%) |
| Total | 4,009 (95.9%) | 171 (4.1%) |
Health Insurance Coverage by Citizenship Status in Columbus
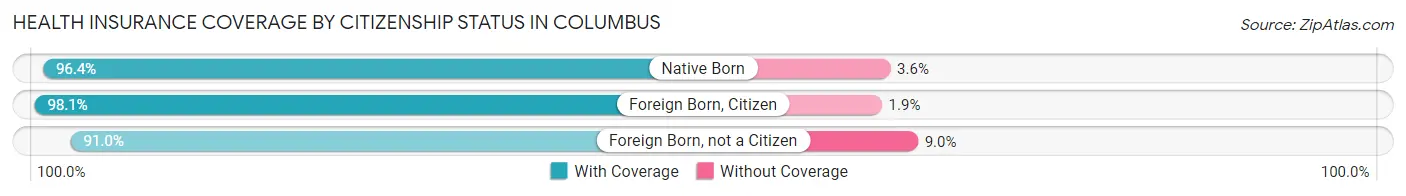
| Citizenship Status | With Coverage | Without Coverage |
| Native Born | 187 (96.4%) | 7 (3.6%) |
| Foreign Born, Citizen | 658 (98.1%) | 13 (1.9%) |
| Foreign Born, not a Citizen | 292 (91.0%) | 29 (9.0%) |
Health Insurance Coverage by Household Income in Columbus
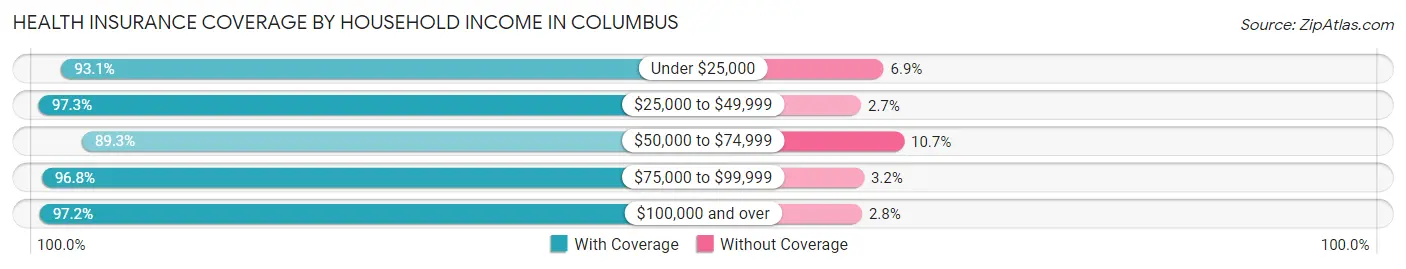
| Household Income | With Coverage | Without Coverage |
| Under $25,000 | 108 (93.1%) | 8 (6.9%) |
| $25,000 to $49,999 | 255 (97.3%) | 7 (2.7%) |
| $50,000 to $74,999 | 516 (89.3%) | 62 (10.7%) |
| $75,000 to $99,999 | 664 (96.8%) | 22 (3.2%) |
| $100,000 and over | 2,466 (97.2%) | 72 (2.8%) |
Public vs Private Health Insurance Coverage by Age in Columbus
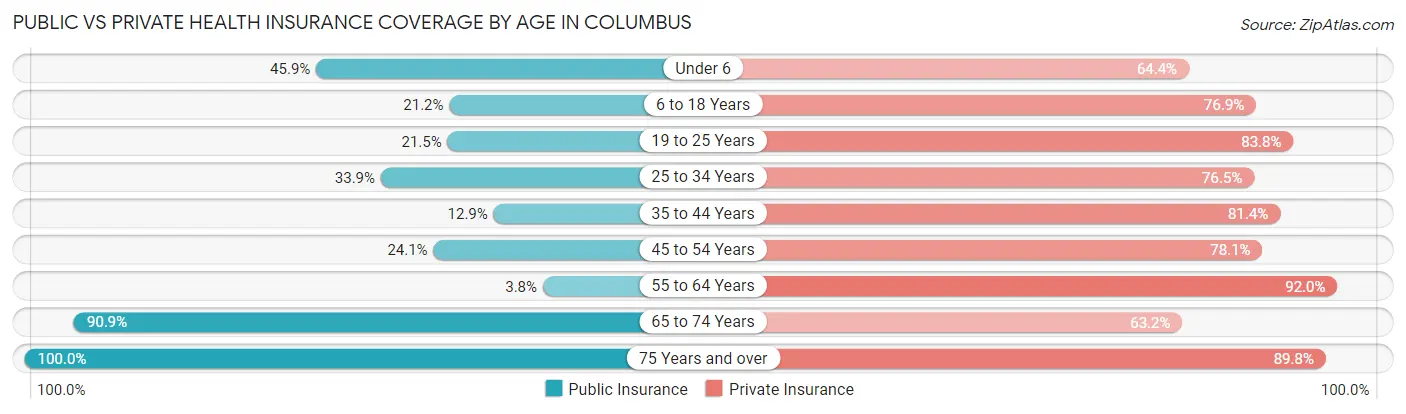
| Age Bracket | Public Insurance | Private Insurance |
| Under 6 | 89 (45.9%) | 125 (64.4%) |
| 6 to 18 Years | 142 (21.2%) | 516 (76.9%) |
| 19 to 25 Years | 69 (21.5%) | 269 (83.8%) |
| 25 to 34 Years | 127 (33.9%) | 287 (76.5%) |
| 35 to 44 Years | 59 (12.9%) | 371 (81.4%) |
| 45 to 54 Years | 122 (24.1%) | 395 (78.1%) |
| 55 to 64 Years | 35 (3.8%) | 848 (92.0%) |
| 65 to 74 Years | 516 (90.8%) | 359 (63.2%) |
| 75 Years and over | 167 (100.0%) | 150 (89.8%) |
| Total | 1,326 (31.7%) | 3,320 (79.4%) |
Disability Status by Sex by Age in Columbus
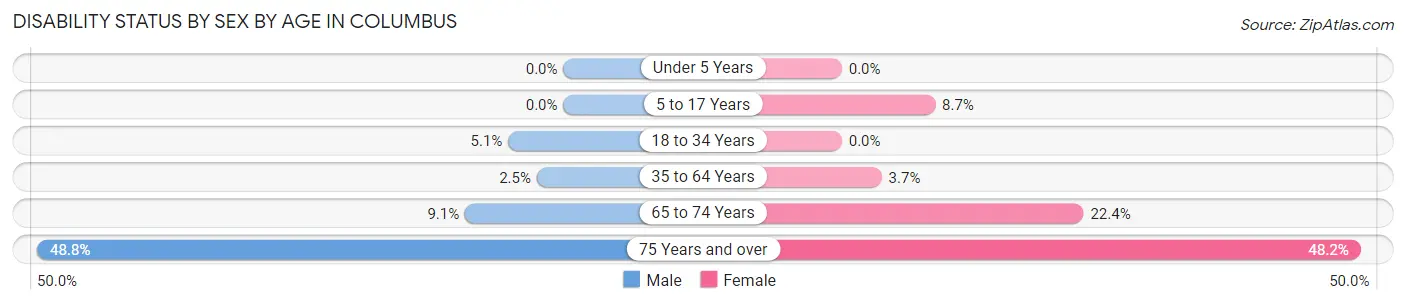
| Age Bracket | Male | Female |
| Under 5 Years | 0 (0.0%) | 0 (0.0%) |
| 5 to 17 Years | 0 (0.0%) | 24 (8.7%) |
| 18 to 34 Years | 20 (5.1%) | 0 (0.0%) |
| 35 to 64 Years | 25 (2.5%) | 32 (3.7%) |
| 65 to 74 Years | 27 (9.1%) | 61 (22.4%) |
| 75 Years and over | 42 (48.8%) | 39 (48.1%) |
Disability Class by Sex by Age in Columbus
Disability Class: Hearing Difficulty
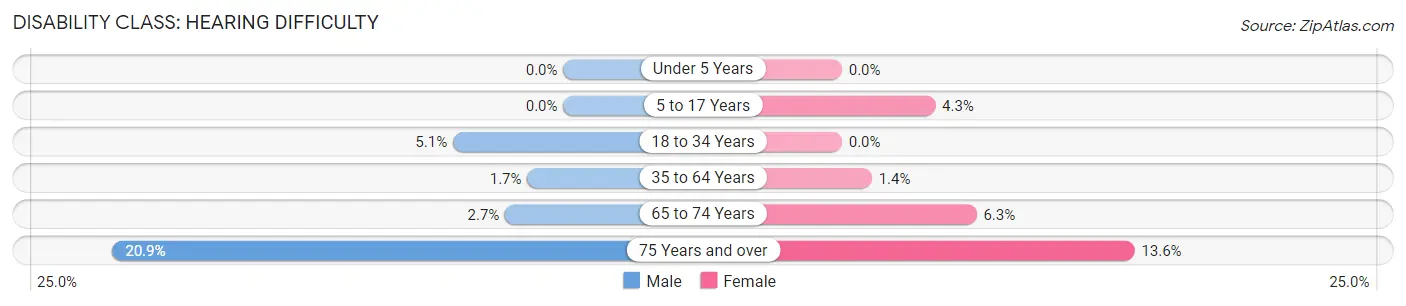
| Age Bracket | Male | Female |
| Under 5 Years | 0 (0.0%) | 0 (0.0%) |
| 5 to 17 Years | 0 (0.0%) | 12 (4.3%) |
| 18 to 34 Years | 20 (5.1%) | 0 (0.0%) |
| 35 to 64 Years | 17 (1.7%) | 12 (1.4%) |
| 65 to 74 Years | 8 (2.7%) | 17 (6.2%) |
| 75 Years and over | 18 (20.9%) | 11 (13.6%) |
Disability Class: Vision Difficulty
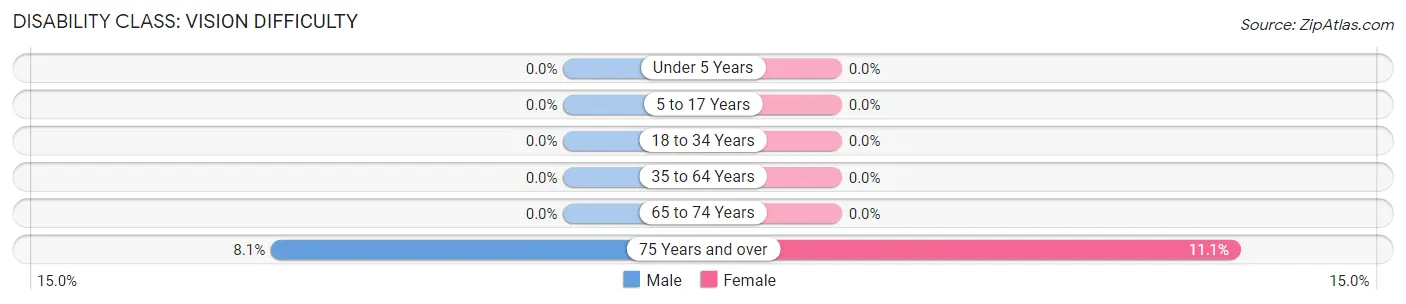
| Age Bracket | Male | Female |
| Under 5 Years | 0 (0.0%) | 0 (0.0%) |
| 5 to 17 Years | 0 (0.0%) | 0 (0.0%) |
| 18 to 34 Years | 0 (0.0%) | 0 (0.0%) |
| 35 to 64 Years | 0 (0.0%) | 0 (0.0%) |
| 65 to 74 Years | 0 (0.0%) | 0 (0.0%) |
| 75 Years and over | 7 (8.1%) | 9 (11.1%) |
Disability Class: Cognitive Difficulty
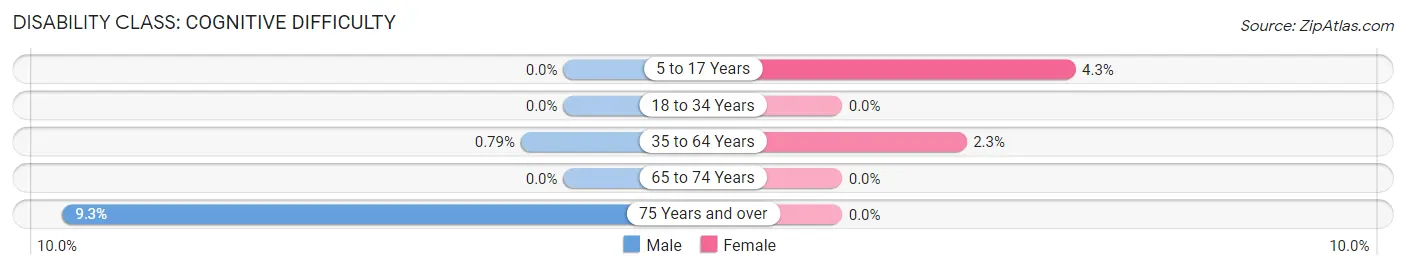
| Age Bracket | Male | Female |
| 5 to 17 Years | 0 (0.0%) | 12 (4.3%) |
| 18 to 34 Years | 0 (0.0%) | 0 (0.0%) |
| 35 to 64 Years | 8 (0.8%) | 20 (2.3%) |
| 65 to 74 Years | 0 (0.0%) | 0 (0.0%) |
| 75 Years and over | 8 (9.3%) | 0 (0.0%) |
Disability Class: Ambulatory Difficulty
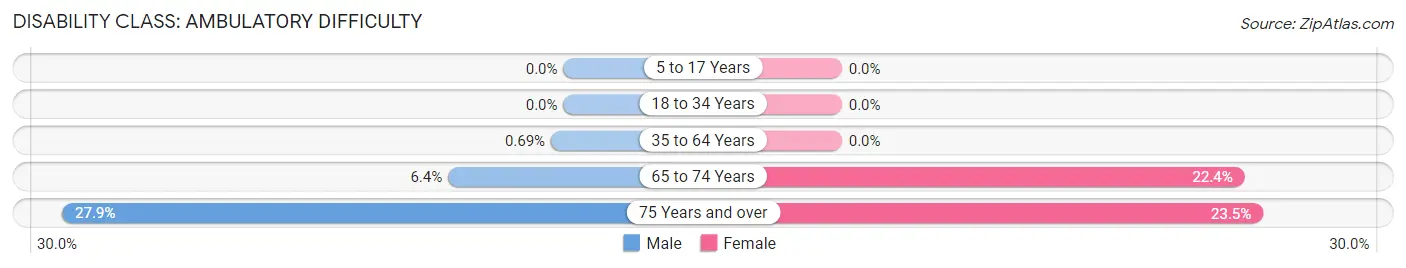
| Age Bracket | Male | Female |
| 5 to 17 Years | 0 (0.0%) | 0 (0.0%) |
| 18 to 34 Years | 0 (0.0%) | 0 (0.0%) |
| 35 to 64 Years | 7 (0.7%) | 0 (0.0%) |
| 65 to 74 Years | 19 (6.4%) | 61 (22.4%) |
| 75 Years and over | 24 (27.9%) | 19 (23.5%) |
Disability Class: Self-Care Difficulty
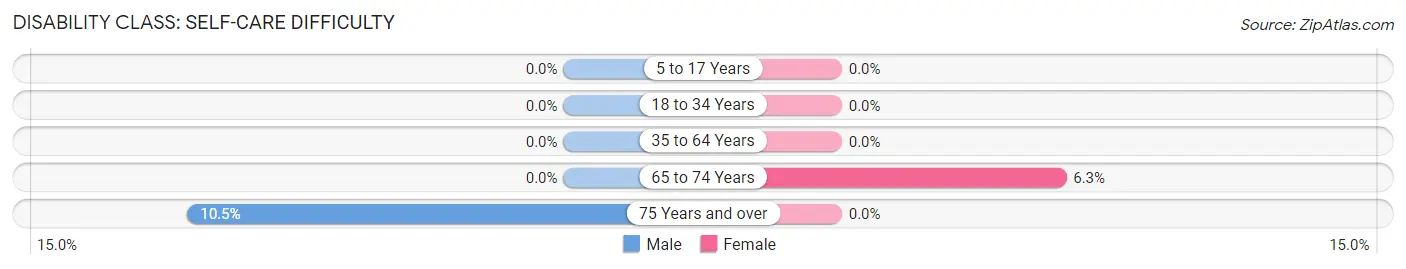
| Age Bracket | Male | Female |
| 5 to 17 Years | 0 (0.0%) | 0 (0.0%) |
| 18 to 34 Years | 0 (0.0%) | 0 (0.0%) |
| 35 to 64 Years | 0 (0.0%) | 0 (0.0%) |
| 65 to 74 Years | 0 (0.0%) | 17 (6.2%) |
| 75 Years and over | 9 (10.5%) | 0 (0.0%) |
Technology Access in Columbus
Computing Device Access in Columbus
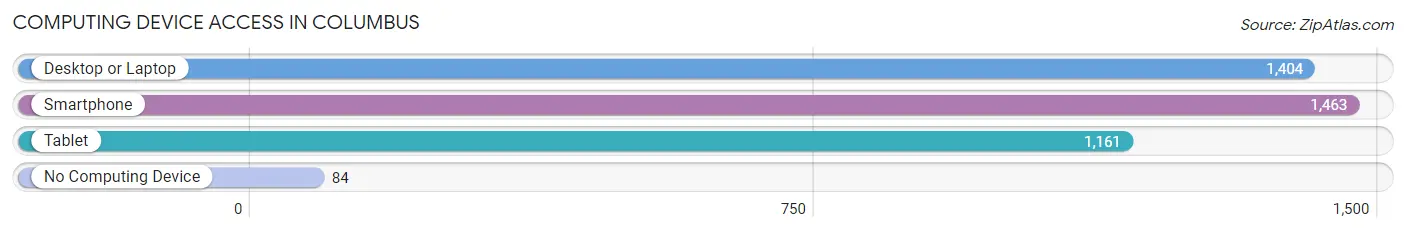
| Device Type | # Households | % Households |
| Desktop or Laptop | 1,404 | 87.0% |
| Smartphone | 1,463 | 90.7% |
| Tablet | 1,161 | 72.0% |
| No Computing Device | 84 | 5.2% |
| Total | 1,613 | 100.0% |
Internet Access in Columbus

| Internet Type | # Households | % Households |
| Dial-Up Internet | 0 | 0.0% |
| Broadband Home | 1,073 | 66.5% |
| Cellular Data Only | 283 | 17.5% |
| Satellite Internet | 178 | 11.0% |
| No Internet | 79 | 4.9% |
| Total | 1,613 | 100.0% |
Columbus Summary
Columbus, Minnesota is a small city located in Anoka County, Minnesota. It is situated on the banks of the Rum River, approximately 25 miles north of Minneapolis. The city has a population of approximately 5,000 people and is part of the Twin Cities metropolitan area.
History
The area that is now Columbus was first settled in 1855 by a group of Swedish immigrants. The city was named after Christopher Columbus, the Italian explorer who discovered the New World. The city was officially incorporated in 1876.
In the late 19th century, Columbus was a thriving agricultural community. The city was home to several grain mills, a sawmill, and a brickyard. The city also had a thriving lumber industry, which provided jobs for many of the city’s residents.
In the early 20th century, the city’s economy shifted from agriculture to manufacturing. The city was home to several factories, including a paper mill, a canning factory, and a furniture factory. The city also had a thriving retail sector, with several stores and restaurants.
Geography
Columbus is located in Anoka County, Minnesota. The city is situated on the banks of the Rum River, approximately 25 miles north of Minneapolis. The city has a total area of 4.2 square miles, all of which is land.
The city is located in a region of rolling hills and wooded areas. The city is surrounded by several lakes, including Lake George, Lake Elizabeth, and Lake Francis. The city is also home to several parks, including Rum River Park and Columbus Park.
Economy
The economy of Columbus is largely based on manufacturing and retail. The city is home to several factories, including a paper mill, a canning factory, and a furniture factory. The city also has a thriving retail sector, with several stores and restaurants.
The city is also home to several corporate headquarters, including the headquarters of the Anoka County Historical Society and the Anoka County Library System.
Demographics
As of the 2010 census, the population of Columbus was 5,000. The racial makeup of the city was 94.3% White, 1.2% African American, 0.3% Native American, 0.7% Asian, 0.1% Pacific Islander, 1.2% from other races, and 2.3% from two or more races. Hispanic or Latino of any race were 3.2% of the population.
The median income for a household in the city was $50,000, and the median income for a family was $60,000. The per capita income for the city was $25,000. About 8.3% of families and 10.2% of the population were below the poverty line, including 14.3% of those under age 18 and 6.2% of those age 65 or over.
Common Questions
What is Per Capita Income in Columbus?
Per Capita income in Columbus is $45,435.
What is the Median Family Income in Columbus?
Median Family Income in Columbus is $123,929.
What is the Median Household income in Columbus?
Median Household Income in Columbus is $103,906.
What is Income or Wage Gap in Columbus?
Income or Wage Gap in Columbus is 40.3%.
Women in Columbus earn 59.7 cents for every dollar earned by a man.
What is Inequality or Gini Index in Columbus?
Inequality or Gini Index in Columbus is 0.31.
What is the Total Population of Columbus?
Total Population of Columbus is 4,180.
What is the Total Male Population of Columbus?
Total Male Population of Columbus is 2,203.
What is the Total Female Population of Columbus?
Total Female Population of Columbus is 1,977.
What is the Ratio of Males per 100 Females in Columbus?
There are 111.43 Males per 100 Females in Columbus.
What is the Ratio of Females per 100 Males in Columbus?
There are 89.74 Females per 100 Males in Columbus.
What is the Median Population Age in Columbus?
Median Population Age in Columbus is 47.0 Years.
What is the Average Family Size in Columbus
Average Family Size in Columbus is 2.8 People.
What is the Average Household Size in Columbus
Average Household Size in Columbus is 2.6 People.
How Large is the Labor Force in Columbus?
There are 2,487 People in the Labor Forcein in Columbus.
What is the Percentage of People in the Labor Force in Columbus?
70.9% of People are in the Labor Force in Columbus.
What is the Unemployment Rate in Columbus?
Unemployment Rate in Columbus is 2.1%.