Zip Codes with the Highest Percentage of Population Employed in Agriculture, Fishing & Hunting in Michigan
RELATED REPORTS & OPTIONS
Agriculture, Fishing & Hunting
Michigan
Compare Zip Codes
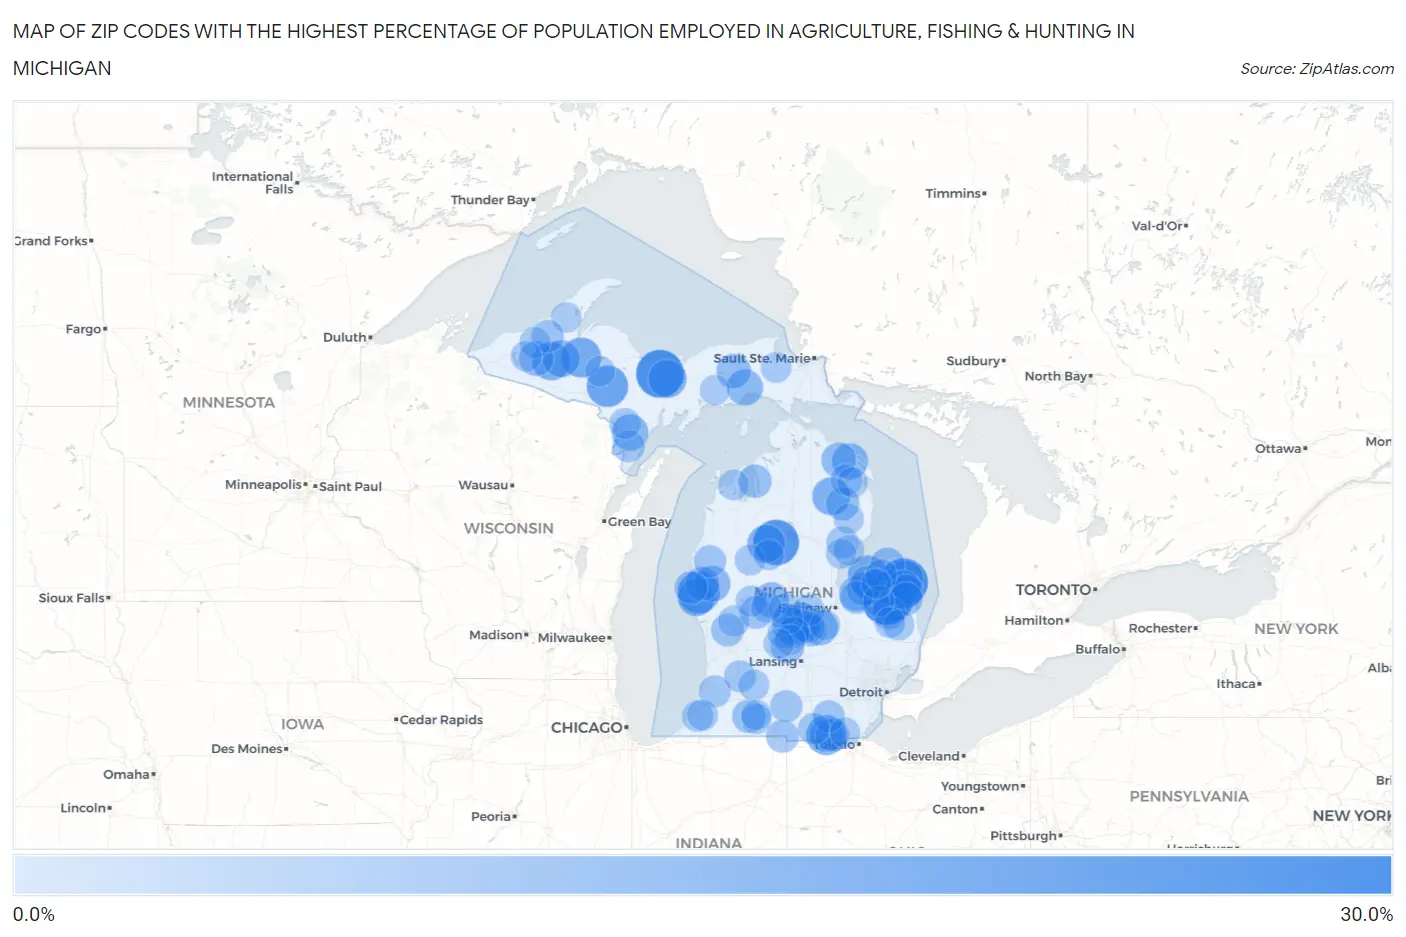
Map of Zip Codes with the Highest Percentage of Population Employed in Agriculture, Fishing & Hunting in Michigan
0.0%
30.0%
Zip Codes with the Highest Percentage of Population Employed in Agriculture, Fishing & Hunting in Michigan
| Zip Code | % Employed | vs State | vs National | |
| 1. | 48426 | 26.9% | 0.98%(+25.9)#1 | 1.2%(+25.7)#1,090 |
| 2. | 48470 | 25.7% | 0.98%(+24.8)#2 | 1.2%(+24.5)#1,184 |
| 3. | 49826 | 25.0% | 0.98%(+24.0)#3 | 1.2%(+23.8)#1,234 |
| 4. | 49632 | 22.8% | 0.98%(+21.8)#4 | 1.2%(+21.6)#1,470 |
| 5. | 49455 | 19.0% | 0.98%(+18.0)#5 | 1.2%(+17.8)#1,914 |
| 6. | 49815 | 18.4% | 0.98%(+17.4)#6 | 1.2%(+17.2)#2,003 |
| 7. | 48472 | 18.2% | 0.98%(+17.3)#7 | 1.2%(+17.0)#2,019 |
| 8. | 49919 | 16.7% | 0.98%(+15.7)#8 | 1.2%(+15.5)#2,291 |
| 9. | 49289 | 16.7% | 0.98%(+15.7)#9 | 1.2%(+15.5)#2,292 |
| 10. | 48720 | 16.1% | 0.98%(+15.2)#10 | 1.2%(+14.9)#2,392 |
| 11. | 49967 | 15.1% | 0.98%(+14.1)#11 | 1.2%(+13.9)#2,605 |
| 12. | 49816 | 14.8% | 0.98%(+13.8)#12 | 1.2%(+13.6)#2,694 |
| 13. | 48619 | 14.7% | 0.98%(+13.7)#13 | 1.2%(+13.5)#2,722 |
| 14. | 49657 | 14.5% | 0.98%(+13.5)#14 | 1.2%(+13.3)#2,759 |
| 15. | 48862 | 14.3% | 0.98%(+13.3)#15 | 1.2%(+13.1)#2,820 |
| 16. | 49446 | 13.9% | 0.98%(+13.0)#16 | 1.2%(+12.8)#2,900 |
| 17. | 49961 | 13.6% | 0.98%(+12.7)#17 | 1.2%(+12.4)#2,987 |
| 18. | 48441 | 13.6% | 0.98%(+12.6)#18 | 1.2%(+12.4)#3,004 |
| 19. | 49863 | 13.2% | 0.98%(+12.2)#19 | 1.2%(+12.0)#3,127 |
| 20. | 49827 | 12.8% | 0.98%(+11.9)#20 | 1.2%(+11.6)#3,217 |
| 21. | 49776 | 12.6% | 0.98%(+11.6)#21 | 1.2%(+11.4)#3,286 |
| 22. | 49459 | 12.5% | 0.98%(+11.5)#22 | 1.2%(+11.3)#3,321 |
| 23. | 48735 | 12.4% | 0.98%(+11.4)#23 | 1.2%(+11.2)#3,369 |
| 24. | 48649 | 12.2% | 0.98%(+11.3)#24 | 1.2%(+11.0)#3,418 |
| 25. | 48856 | 12.2% | 0.98%(+11.3)#25 | 1.2%(+11.0)#3,420 |
| 26. | 49310 | 12.1% | 0.98%(+11.1)#26 | 1.2%(+10.9)#3,459 |
| 27. | 48475 | 12.0% | 0.98%(+11.0)#27 | 1.2%(+10.8)#3,503 |
| 28. | 49743 | 11.4% | 0.98%(+10.4)#28 | 1.2%(+10.2)#3,721 |
| 29. | 48701 | 11.3% | 0.98%(+10.3)#29 | 1.2%(+10.1)#3,751 |
| 30. | 48445 | 11.3% | 0.98%(+10.3)#30 | 1.2%(+10.1)#3,763 |
| 31. | 49912 | 11.2% | 0.98%(+10.2)#31 | 1.2%(+10.0)#3,794 |
| 32. | 49853 | 11.1% | 0.98%(+10.1)#32 | 1.2%(+9.91)#3,826 |
| 33. | 48456 | 11.0% | 0.98%(+10.0)#33 | 1.2%(+9.81)#3,879 |
| 34. | 48874 | 10.9% | 0.98%(+9.91)#34 | 1.2%(+9.69)#3,919 |
| 35. | 49420 | 10.6% | 0.98%(+9.65)#35 | 1.2%(+9.43)#4,034 |
| 36. | 49279 | 10.4% | 0.98%(+9.43)#36 | 1.2%(+9.21)#4,126 |
| 37. | 48465 | 10.4% | 0.98%(+9.40)#37 | 1.2%(+9.19)#4,134 |
| 38. | 48767 | 10.2% | 0.98%(+9.24)#38 | 1.2%(+9.03)#4,207 |
| 39. | 48894 | 10.1% | 0.98%(+9.07)#39 | 1.2%(+8.85)#4,281 |
| 40. | 48759 | 10.0% | 0.98%(+9.04)#40 | 1.2%(+8.83)#4,292 |
| 41. | 49072 | 10.0% | 0.98%(+8.98)#41 | 1.2%(+8.76)#4,338 |
| 42. | 49648 | 9.9% | 0.98%(+8.91)#42 | 1.2%(+8.69)#4,372 |
| 43. | 49248 | 9.8% | 0.98%(+8.84)#43 | 1.2%(+8.62)#4,408 |
| 44. | 48728 | 9.8% | 0.98%(+8.84)#44 | 1.2%(+8.62)#4,409 |
| 45. | 48453 | 9.8% | 0.98%(+8.78)#45 | 1.2%(+8.56)#4,444 |
| 46. | 48427 | 9.6% | 0.98%(+8.62)#46 | 1.2%(+8.41)#4,514 |
| 47. | 49322 | 9.5% | 0.98%(+8.49)#47 | 1.2%(+8.27)#4,585 |
| 48. | 49436 | 9.5% | 0.98%(+8.49)#48 | 1.2%(+8.27)#4,587 |
| 49. | 49403 | 9.4% | 0.98%(+8.45)#49 | 1.2%(+8.23)#4,609 |
| 50. | 49255 | 9.3% | 0.98%(+8.31)#50 | 1.2%(+8.09)#4,681 |
| 51. | 49948 | 9.1% | 0.98%(+8.16)#51 | 1.2%(+7.94)#4,760 |
| 52. | 48831 | 9.1% | 0.98%(+8.08)#52 | 1.2%(+7.87)#4,799 |
| 53. | 48733 | 9.0% | 0.98%(+8.03)#53 | 1.2%(+7.81)#4,827 |
| 54. | 49410 | 8.8% | 0.98%(+7.82)#54 | 1.2%(+7.60)#4,944 |
| 55. | 49245 | 8.7% | 0.98%(+7.70)#55 | 1.2%(+7.48)#5,005 |
| 56. | 48770 | 8.7% | 0.98%(+7.69)#56 | 1.2%(+7.48)#5,012 |
| 57. | 49287 | 8.6% | 0.98%(+7.63)#57 | 1.2%(+7.42)#5,044 |
| 58. | 48845 | 8.6% | 0.98%(+7.58)#58 | 1.2%(+7.36)#5,077 |
| 59. | 48806 | 8.6% | 0.98%(+7.57)#59 | 1.2%(+7.35)#5,085 |
| 60. | 49887 | 8.5% | 0.98%(+7.50)#60 | 1.2%(+7.29)#5,122 |
| 61. | 48807 | 8.5% | 0.98%(+7.49)#61 | 1.2%(+7.27)#5,132 |
| 62. | 48877 | 8.3% | 0.98%(+7.36)#62 | 1.2%(+7.14)#5,193 |
| 63. | 49027 | 8.3% | 0.98%(+7.35)#63 | 1.2%(+7.13)#5,203 |
| 64. | 49070 | 8.3% | 0.98%(+7.29)#64 | 1.2%(+7.07)#5,244 |
| 65. | 48662 | 8.2% | 0.98%(+7.21)#65 | 1.2%(+6.99)#5,297 |
| 66. | 49247 | 8.1% | 0.98%(+7.16)#66 | 1.2%(+6.95)#5,316 |
| 67. | 48731 | 8.1% | 0.98%(+7.15)#67 | 1.2%(+6.94)#5,323 |
| 68. | 49753 | 8.1% | 0.98%(+7.10)#68 | 1.2%(+6.88)#5,360 |
| 69. | 48853 | 8.1% | 0.98%(+7.08)#69 | 1.2%(+6.86)#5,375 |
| 70. | 48889 | 7.7% | 0.98%(+6.75)#70 | 1.2%(+6.53)#5,599 |
| 71. | 49847 | 7.7% | 0.98%(+6.74)#71 | 1.2%(+6.53)#5,600 |
| 72. | 49126 | 7.7% | 0.98%(+6.71)#72 | 1.2%(+6.49)#5,614 |
| 73. | 49330 | 7.7% | 0.98%(+6.68)#73 | 1.2%(+6.46)#5,641 |
| 74. | 49336 | 7.6% | 0.98%(+6.65)#74 | 1.2%(+6.43)#5,663 |
| 75. | 49111 | 7.6% | 0.98%(+6.62)#75 | 1.2%(+6.40)#5,688 |
| 76. | 49960 | 7.6% | 0.98%(+6.59)#76 | 1.2%(+6.38)#5,700 |
| 77. | 48729 | 7.6% | 0.98%(+6.57)#77 | 1.2%(+6.35)#5,714 |
| 78. | 49060 | 7.4% | 0.98%(+6.41)#78 | 1.2%(+6.19)#5,828 |
| 79. | 48454 | 7.3% | 0.98%(+6.31)#79 | 1.2%(+6.10)#5,892 |
| 80. | 48765 | 7.3% | 0.98%(+6.28)#80 | 1.2%(+6.07)#5,919 |
| 81. | 49925 | 7.2% | 0.98%(+6.26)#81 | 1.2%(+6.05)#5,928 |
| 82. | 49728 | 7.2% | 0.98%(+6.23)#82 | 1.2%(+6.02)#5,944 |
| 83. | 48835 | 7.2% | 0.98%(+6.19)#83 | 1.2%(+5.97)#5,971 |
| 84. | 48886 | 7.2% | 0.98%(+6.18)#84 | 1.2%(+5.96)#5,981 |
| 85. | 48416 | 7.1% | 0.98%(+6.15)#85 | 1.2%(+5.94)#6,008 |
| 86. | 49653 | 7.1% | 0.98%(+6.11)#86 | 1.2%(+5.89)#6,029 |
| 87. | 49040 | 7.1% | 0.98%(+6.07)#87 | 1.2%(+5.85)#6,060 |
| 88. | 49655 | 7.0% | 0.98%(+6.03)#88 | 1.2%(+5.81)#6,087 |
| 89. | 49665 | 7.0% | 0.98%(+5.98)#89 | 1.2%(+5.76)#6,119 |
| 90. | 49744 | 7.0% | 0.98%(+5.97)#90 | 1.2%(+5.75)#6,128 |
| 91. | 48851 | 6.9% | 0.98%(+5.90)#91 | 1.2%(+5.68)#6,179 |
| 92. | 49276 | 6.8% | 0.98%(+5.84)#92 | 1.2%(+5.63)#6,220 |
| 93. | 48616 | 6.8% | 0.98%(+5.82)#93 | 1.2%(+5.60)#6,251 |
| 94. | 49955 | 6.8% | 0.98%(+5.80)#94 | 1.2%(+5.58)#6,270 |
| 95. | 49066 | 6.8% | 0.98%(+5.78)#95 | 1.2%(+5.56)#6,283 |
| 96. | 49879 | 6.8% | 0.98%(+5.77)#96 | 1.2%(+5.56)#6,287 |
| 97. | 49840 | 6.7% | 0.98%(+5.74)#97 | 1.2%(+5.53)#6,311 |
| 98. | 48754 | 6.7% | 0.98%(+5.72)#98 | 1.2%(+5.51)#6,331 |
| 99. | 48766 | 6.7% | 0.98%(+5.71)#99 | 1.2%(+5.49)#6,341 |
| 100. | 48737 | 6.7% | 0.98%(+5.70)#100 | 1.2%(+5.49)#6,345 |
Common Questions
What are the Top 10 Zip Codes with the Highest Percentage of Population Employed in Agriculture, Fishing & Hunting in Michigan?
Top 10 Zip Codes with the Highest Percentage of Population Employed in Agriculture, Fishing & Hunting in Michigan are:
What zip code has the Highest Percentage of Population Employed in Agriculture, Fishing & Hunting in Michigan?
48426 has the Highest Percentage of Population Employed in Agriculture, Fishing & Hunting in Michigan with 26.9%.
What is the Percentage of Population Employed in Agriculture, Fishing & Hunting in the State of Michigan?
Percentage of Population Employed in Agriculture, Fishing & Hunting in Michigan is 0.98%.
What is the Percentage of Population Employed in Agriculture, Fishing & Hunting in the United States?
Percentage of Population Employed in Agriculture, Fishing & Hunting in the United States is 1.2%.