Zip Codes with the Highest Percentage of Population Employed in Agriculture, Fishing & Hunting in Westland, MI
RELATED REPORTS & OPTIONS
Agriculture, Fishing & Hunting
Westland
Compare Zip Codes
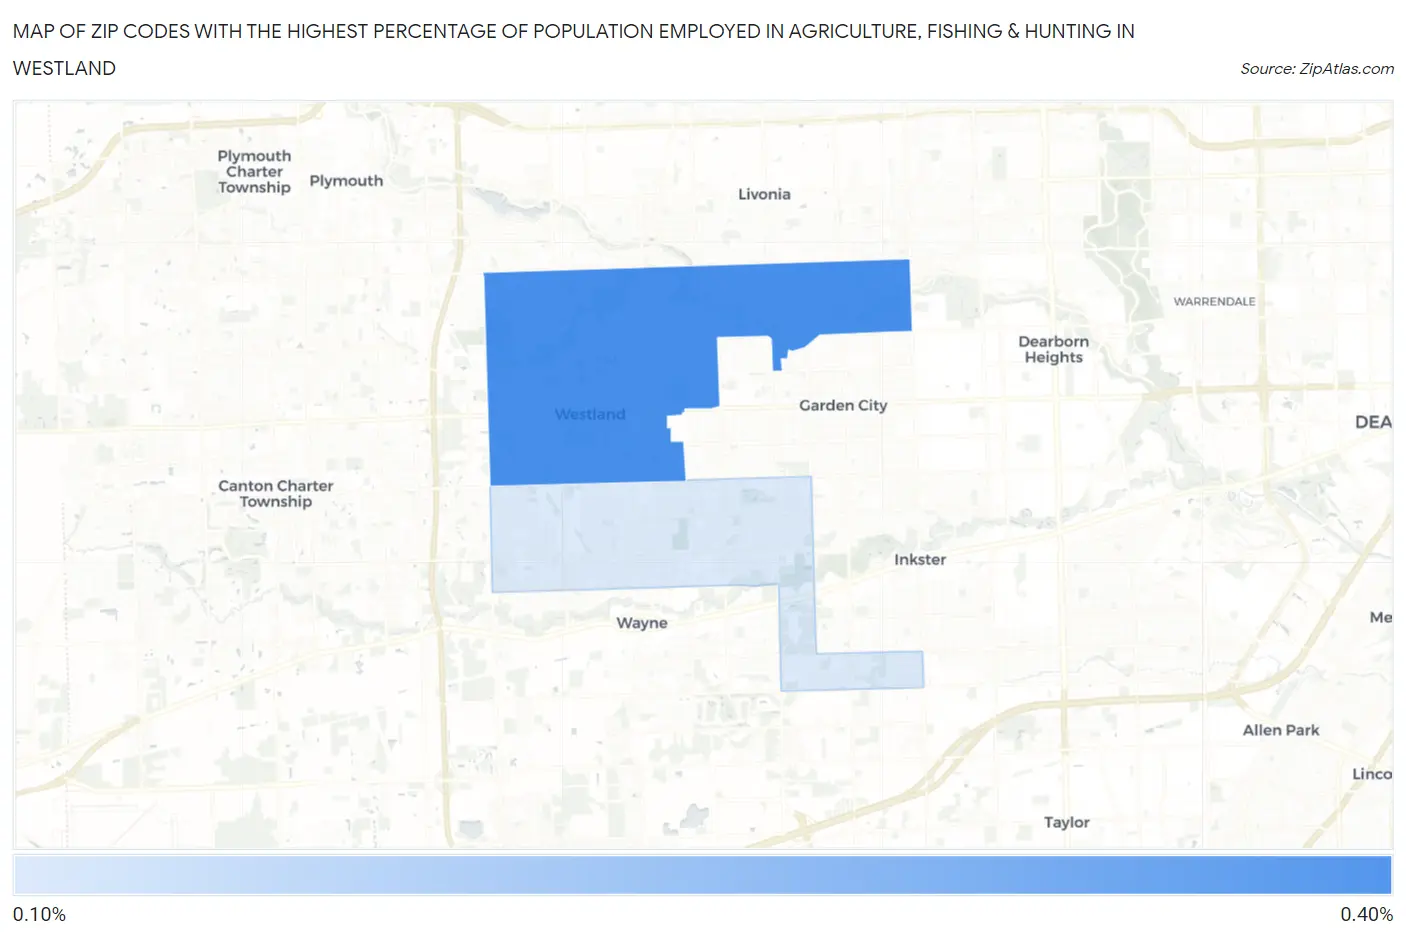
Map of Zip Codes with the Highest Percentage of Population Employed in Agriculture, Fishing & Hunting in Westland
0.13%
0.36%
Zip Codes with the Highest Percentage of Population Employed in Agriculture, Fishing & Hunting in Westland, MI
| Zip Code | % Employed | vs State | vs National | |
| 1. | 48185 | 0.36% | 0.98%(-0.624)#677 | 1.2%(-0.839)#20,547 |
| 2. | 48186 | 0.13% | 0.98%(-0.850)#781 | 1.2%(-1.07)#23,239 |
1
Common Questions
What are the Top Zip Codes with the Highest Percentage of Population Employed in Agriculture, Fishing & Hunting in Westland, MI?
Top Zip Codes with the Highest Percentage of Population Employed in Agriculture, Fishing & Hunting in Westland, MI are:
What zip code has the Highest Percentage of Population Employed in Agriculture, Fishing & Hunting in Westland, MI?
48185 has the Highest Percentage of Population Employed in Agriculture, Fishing & Hunting in Westland, MI with 0.36%.
What is the Percentage of Population Employed in Agriculture, Fishing & Hunting in Westland, MI?
Percentage of Population Employed in Agriculture, Fishing & Hunting in Westland is 0.26%.
What is the Percentage of Population Employed in Agriculture, Fishing & Hunting in Michigan?
Percentage of Population Employed in Agriculture, Fishing & Hunting in Michigan is 0.98%.
What is the Percentage of Population Employed in Agriculture, Fishing & Hunting in the United States?
Percentage of Population Employed in Agriculture, Fishing & Hunting in the United States is 1.2%.