Zip Codes with the Highest Percentage of Population Employed in Agriculture, Fishing & Hunting in Redford, MI
RELATED REPORTS & OPTIONS
Agriculture, Fishing & Hunting
Redford
Compare Zip Codes
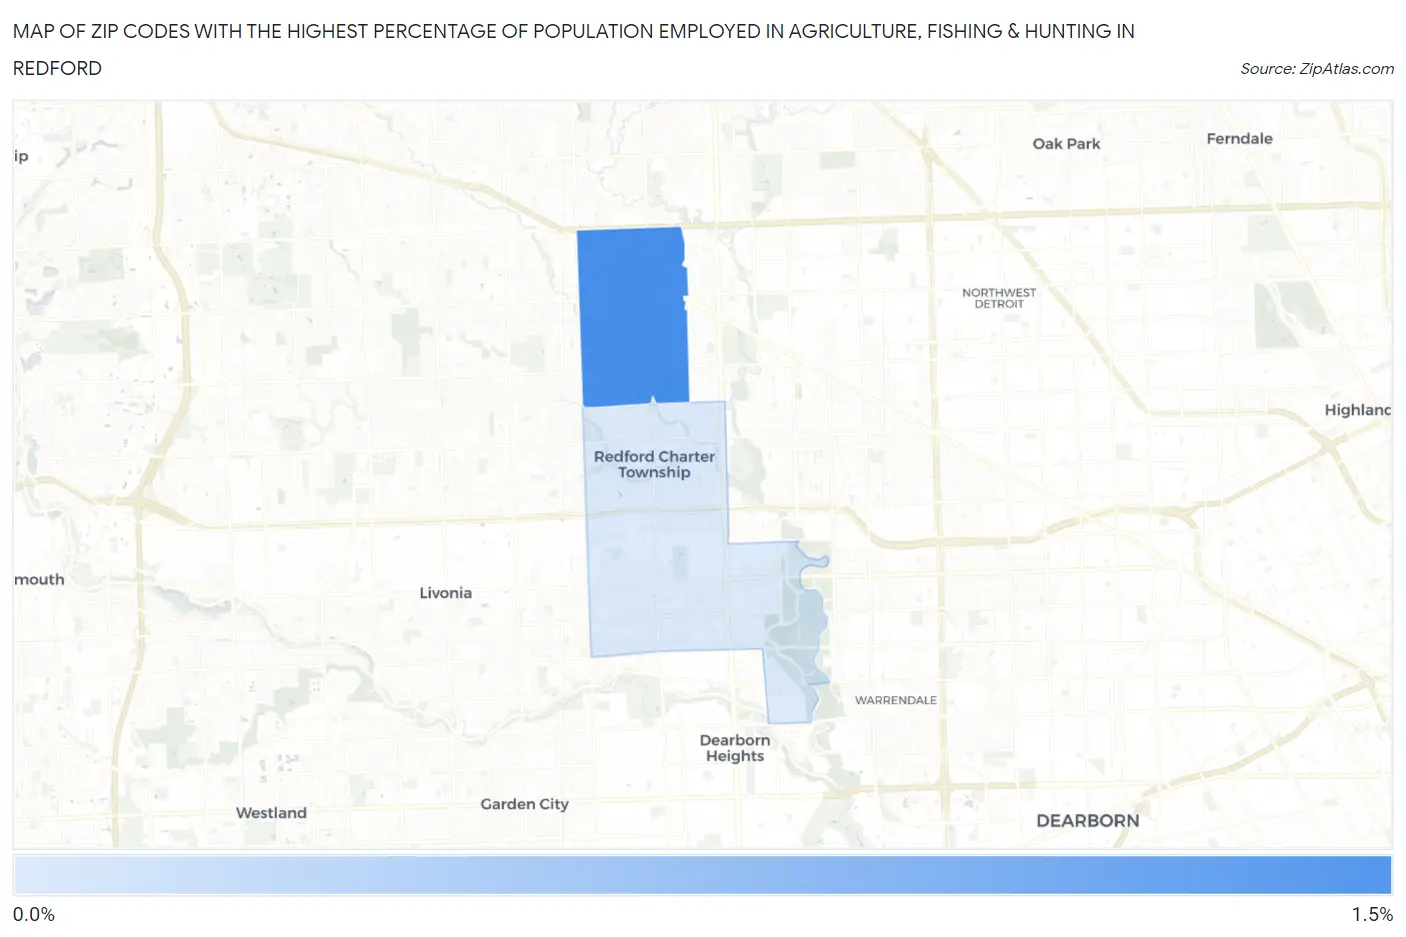
Map of Zip Codes with the Highest Percentage of Population Employed in Agriculture, Fishing & Hunting in Redford
0.24%
1.4%
Zip Codes with the Highest Percentage of Population Employed in Agriculture, Fishing & Hunting in Redford, MI
| Zip Code | % Employed | vs State | vs National | |
| 1. | 48240 | 1.4% | 0.98%(+0.405)#437 | 1.2%(+0.190)#14,683 |
| 2. | 48239 | 0.24% | 0.98%(-0.740)#728 | 1.2%(-0.955)#21,832 |
1
Common Questions
What are the Top Zip Codes with the Highest Percentage of Population Employed in Agriculture, Fishing & Hunting in Redford, MI?
Top Zip Codes with the Highest Percentage of Population Employed in Agriculture, Fishing & Hunting in Redford, MI are:
What zip code has the Highest Percentage of Population Employed in Agriculture, Fishing & Hunting in Redford, MI?
48240 has the Highest Percentage of Population Employed in Agriculture, Fishing & Hunting in Redford, MI with 1.4%.
What is the Percentage of Population Employed in Agriculture, Fishing & Hunting in Michigan?
Percentage of Population Employed in Agriculture, Fishing & Hunting in Michigan is 0.98%.
What is the Percentage of Population Employed in Agriculture, Fishing & Hunting in the United States?
Percentage of Population Employed in Agriculture, Fishing & Hunting in the United States is 1.2%.