Zip Codes with the Highest Percentage of Population Employed in Agriculture, Fishing & Hunting in Monroe, MI
RELATED REPORTS & OPTIONS
Agriculture, Fishing & Hunting
Monroe
Compare Zip Codes
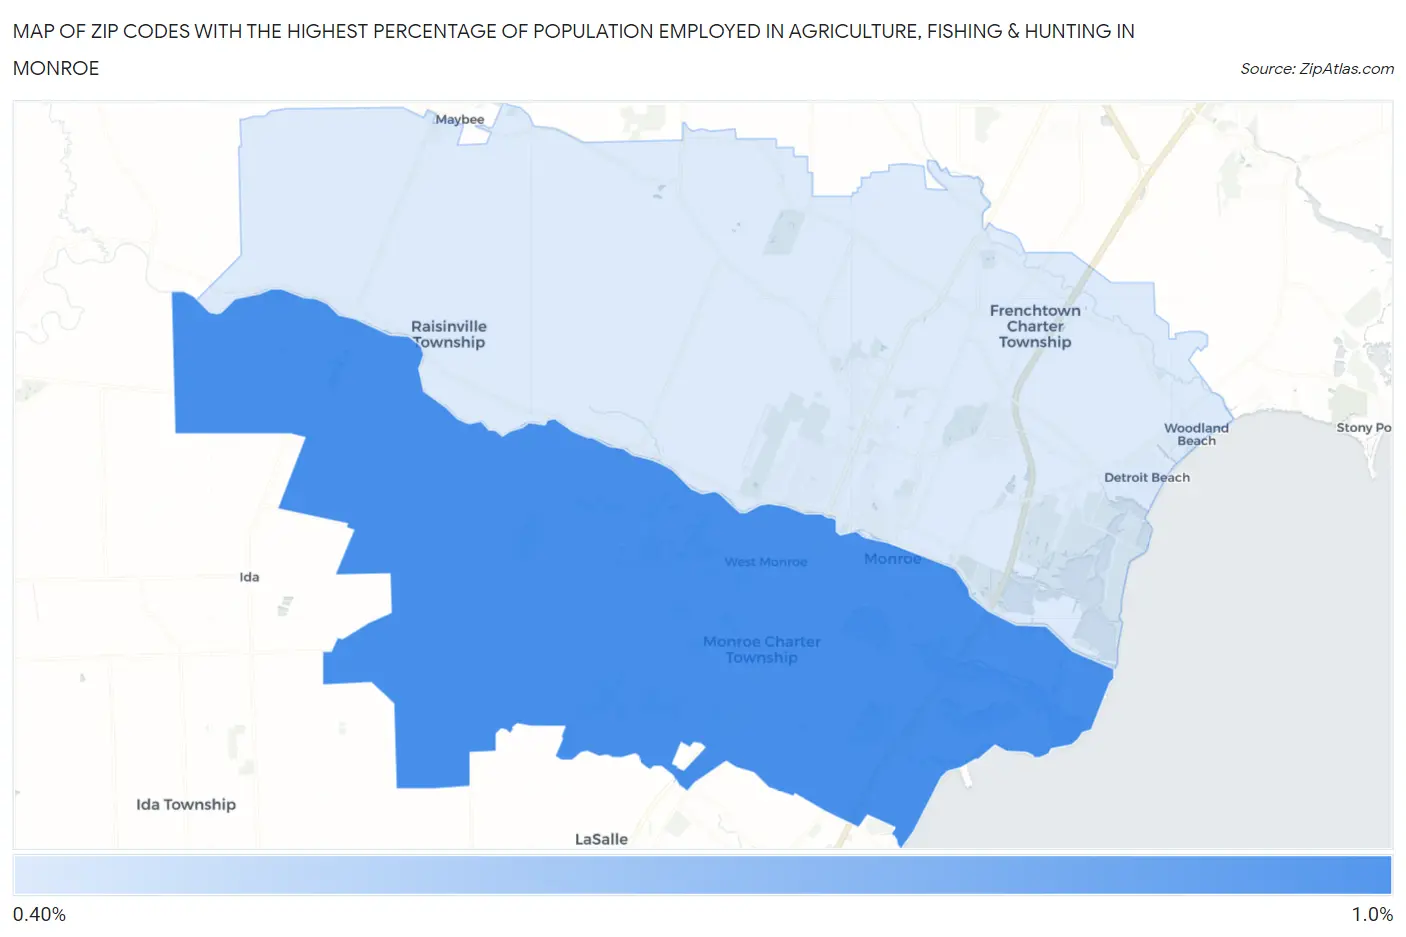
Map of Zip Codes with the Highest Percentage of Population Employed in Agriculture, Fishing & Hunting in Monroe
0.47%
0.83%
Zip Codes with the Highest Percentage of Population Employed in Agriculture, Fishing & Hunting in Monroe, MI
| Zip Code | % Employed | vs State | vs National | |
| 1. | 48161 | 0.83% | 0.98%(-0.157)#550 | 1.2%(-0.373)#17,093 |
| 2. | 48162 | 0.47% | 0.98%(-0.517)#649 | 1.2%(-0.732)#19,556 |
1
Common Questions
What are the Top Zip Codes with the Highest Percentage of Population Employed in Agriculture, Fishing & Hunting in Monroe, MI?
Top Zip Codes with the Highest Percentage of Population Employed in Agriculture, Fishing & Hunting in Monroe, MI are:
What zip code has the Highest Percentage of Population Employed in Agriculture, Fishing & Hunting in Monroe, MI?
48161 has the Highest Percentage of Population Employed in Agriculture, Fishing & Hunting in Monroe, MI with 0.83%.
What is the Percentage of Population Employed in Agriculture, Fishing & Hunting in Monroe, MI?
Percentage of Population Employed in Agriculture, Fishing & Hunting in Monroe is 0.58%.
What is the Percentage of Population Employed in Agriculture, Fishing & Hunting in Michigan?
Percentage of Population Employed in Agriculture, Fishing & Hunting in Michigan is 0.98%.
What is the Percentage of Population Employed in Agriculture, Fishing & Hunting in the United States?
Percentage of Population Employed in Agriculture, Fishing & Hunting in the United States is 1.2%.