Zip Codes with the Highest Percentage of Population Employed in Agriculture, Fishing & Hunting in Flint, MI
RELATED REPORTS & OPTIONS
Agriculture, Fishing & Hunting
Flint
Compare Zip Codes
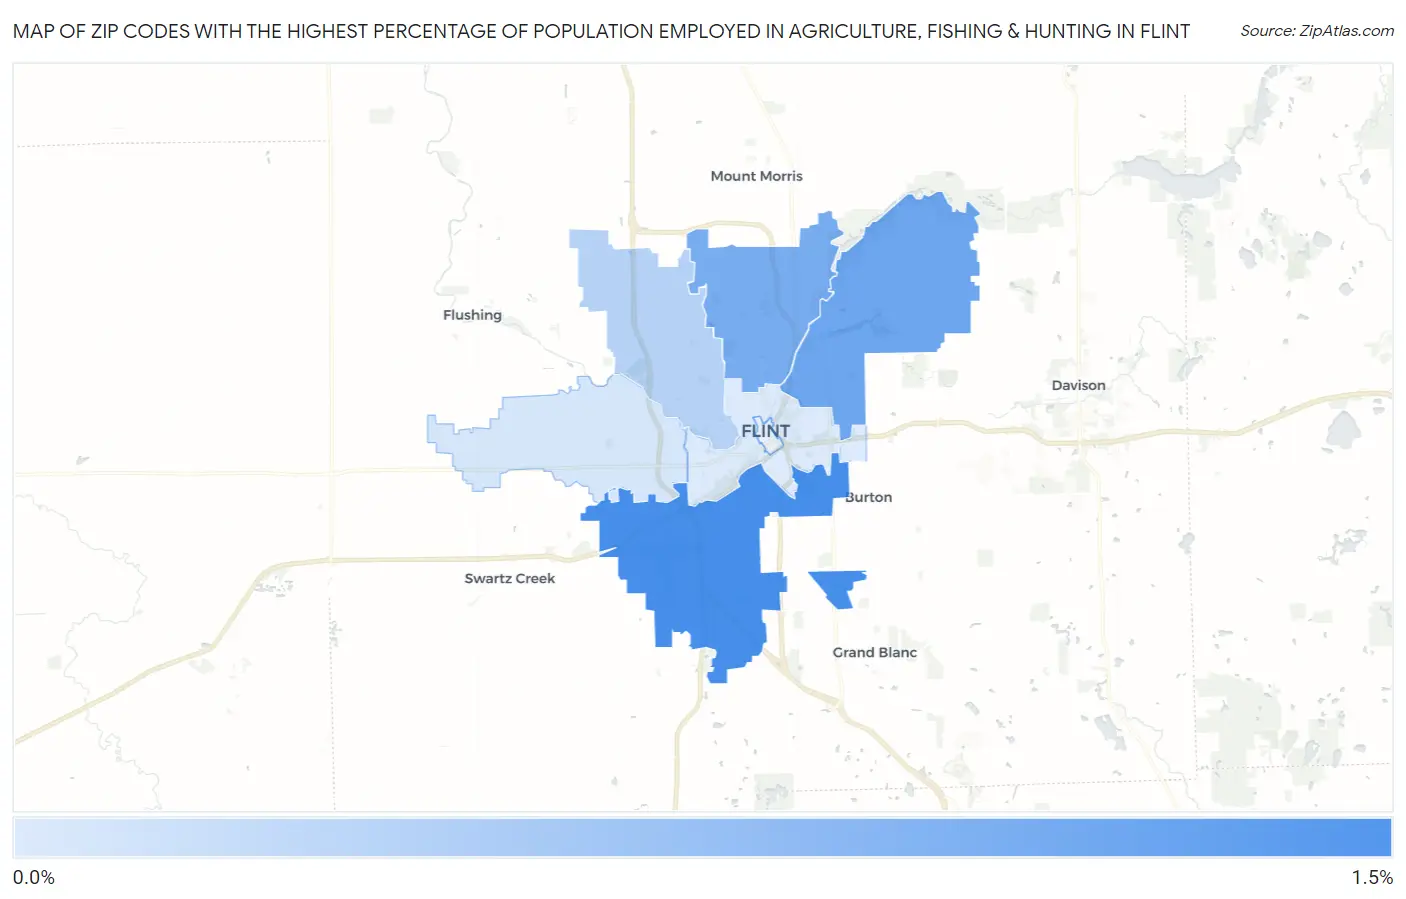
Map of Zip Codes with the Highest Percentage of Population Employed in Agriculture, Fishing & Hunting in Flint
0.073%
1.2%
Zip Codes with the Highest Percentage of Population Employed in Agriculture, Fishing & Hunting in Flint, MI
| Zip Code | % Employed | vs State | vs National | |
| 1. | 48507 | 1.2% | 0.98%(+0.247)#473 | 1.2%(+0.032)#15,286 |
| 2. | 48506 | 0.94% | 0.98%(-0.049)#527 | 1.2%(-0.264)#16,529 |
| 3. | 48505 | 0.86% | 0.98%(-0.124)#542 | 1.2%(-0.339)#16,920 |
| 4. | 48504 | 0.37% | 0.98%(-0.615)#674 | 1.2%(-0.831)#20,453 |
| 5. | 48532 | 0.12% | 0.98%(-0.865)#787 | 1.2%(-1.08)#23,426 |
| 6. | 48503 | 0.073% | 0.98%(-0.911)#800 | 1.2%(-1.13)#24,059 |
1
Common Questions
What are the Top 5 Zip Codes with the Highest Percentage of Population Employed in Agriculture, Fishing & Hunting in Flint, MI?
Top 5 Zip Codes with the Highest Percentage of Population Employed in Agriculture, Fishing & Hunting in Flint, MI are:
What zip code has the Highest Percentage of Population Employed in Agriculture, Fishing & Hunting in Flint, MI?
48507 has the Highest Percentage of Population Employed in Agriculture, Fishing & Hunting in Flint, MI with 1.2%.
What is the Percentage of Population Employed in Agriculture, Fishing & Hunting in Flint, MI?
Percentage of Population Employed in Agriculture, Fishing & Hunting in Flint is 0.78%.
What is the Percentage of Population Employed in Agriculture, Fishing & Hunting in Michigan?
Percentage of Population Employed in Agriculture, Fishing & Hunting in Michigan is 0.98%.
What is the Percentage of Population Employed in Agriculture, Fishing & Hunting in the United States?
Percentage of Population Employed in Agriculture, Fishing & Hunting in the United States is 1.2%.