Zip Codes with the Highest Percentage of Population Employed in Architecture & Engineering in Kokomo, IN
RELATED REPORTS & OPTIONS
Architecture & Engineering
Kokomo
Compare Zip Codes
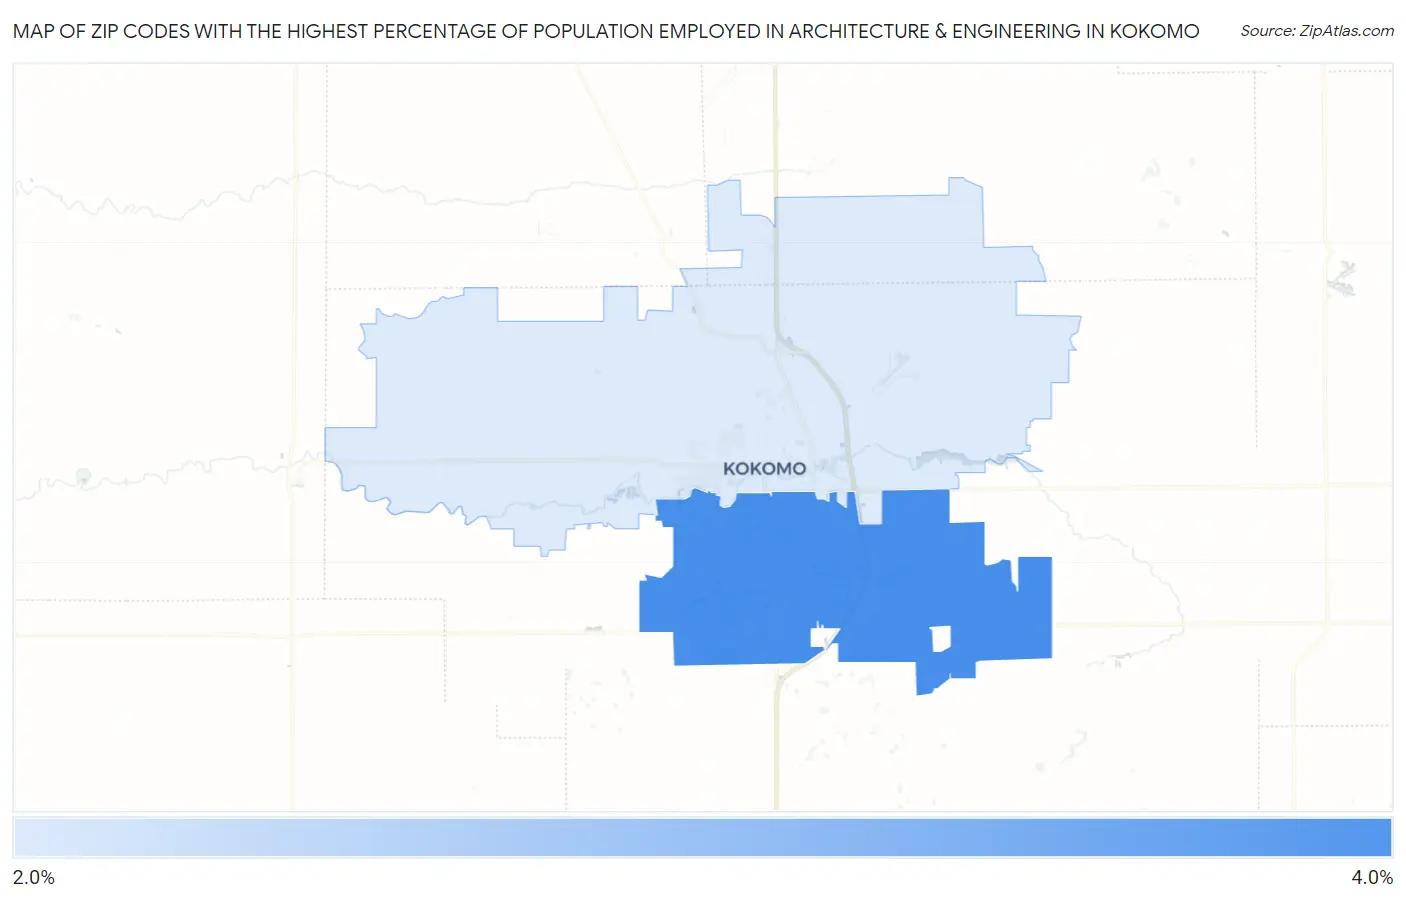
Map of Zip Codes with the Highest Percentage of Population Employed in Architecture & Engineering in Kokomo
2.5%
3.4%
Zip Codes with the Highest Percentage of Population Employed in Architecture & Engineering in Kokomo, IN
| Zip Code | % Employed | vs State | vs National | |
| 1. | 46902 | 3.4% | 2.2%(+1.14)#129 | 2.1%(+1.21)#4,036 |
| 2. | 46901 | 2.5% | 2.2%(+0.240)#213 | 2.1%(+0.313)#7,169 |
1
Common Questions
What are the Top Zip Codes with the Highest Percentage of Population Employed in Architecture & Engineering in Kokomo, IN?
Top Zip Codes with the Highest Percentage of Population Employed in Architecture & Engineering in Kokomo, IN are:
What zip code has the Highest Percentage of Population Employed in Architecture & Engineering in Kokomo, IN?
46902 has the Highest Percentage of Population Employed in Architecture & Engineering in Kokomo, IN with 3.4%.
What is the Percentage of Population Employed in Architecture & Engineering in Kokomo, IN?
Percentage of Population Employed in Architecture & Engineering in Kokomo is 2.6%.
What is the Percentage of Population Employed in Architecture & Engineering in Indiana?
Percentage of Population Employed in Architecture & Engineering in Indiana is 2.2%.
What is the Percentage of Population Employed in Architecture & Engineering in the United States?
Percentage of Population Employed in Architecture & Engineering in the United States is 2.1%.