Zip Codes with the Highest Percentage of Population Employed in Architecture & Engineering in Terre Haute, IN
RELATED REPORTS & OPTIONS
Architecture & Engineering
Terre Haute
Compare Zip Codes
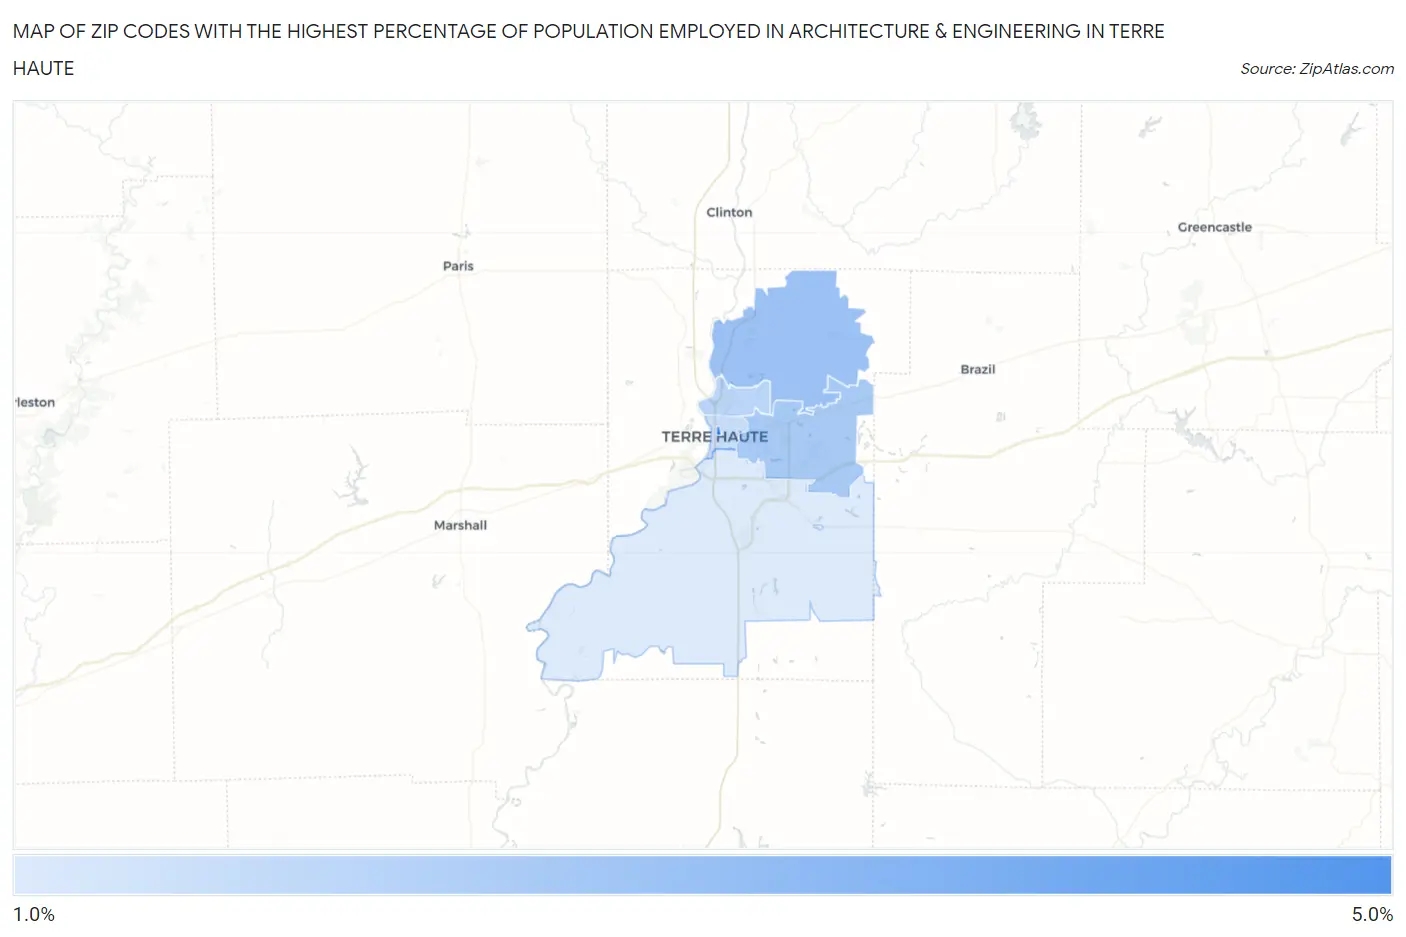
Map of Zip Codes with the Highest Percentage of Population Employed in Architecture & Engineering in Terre Haute
1.6%
4.5%
Zip Codes with the Highest Percentage of Population Employed in Architecture & Engineering in Terre Haute, IN
| Zip Code | % Employed | vs State | vs National | |
| 1. | 47809 | 4.5% | 2.2%(+2.23)#63 | 2.1%(+2.31)#2,188 |
| 2. | 47805 | 2.9% | 2.2%(+0.641)#172 | 2.1%(+0.713)#5,547 |
| 3. | 47803 | 2.6% | 2.2%(+0.417)#192 | 2.1%(+0.489)#6,413 |
| 4. | 47804 | 2.3% | 2.2%(+0.075)#238 | 2.1%(+0.148)#7,961 |
| 5. | 47807 | 2.0% | 2.2%(-0.200)#287 | 2.1%(-0.128)#9,479 |
| 6. | 47802 | 1.6% | 2.2%(-0.588)#349 | 2.1%(-0.516)#11,959 |
1
Common Questions
What are the Top 5 Zip Codes with the Highest Percentage of Population Employed in Architecture & Engineering in Terre Haute, IN?
Top 5 Zip Codes with the Highest Percentage of Population Employed in Architecture & Engineering in Terre Haute, IN are:
What zip code has the Highest Percentage of Population Employed in Architecture & Engineering in Terre Haute, IN?
47809 has the Highest Percentage of Population Employed in Architecture & Engineering in Terre Haute, IN with 4.5%.
What is the Percentage of Population Employed in Architecture & Engineering in Terre Haute, IN?
Percentage of Population Employed in Architecture & Engineering in Terre Haute is 2.1%.
What is the Percentage of Population Employed in Architecture & Engineering in Indiana?
Percentage of Population Employed in Architecture & Engineering in Indiana is 2.2%.
What is the Percentage of Population Employed in Architecture & Engineering in the United States?
Percentage of Population Employed in Architecture & Engineering in the United States is 2.1%.