Zip Codes with the Highest Percentage of Population Employed in Architecture & Engineering in Fishers, IN
RELATED REPORTS & OPTIONS
Architecture & Engineering
Fishers
Compare Zip Codes
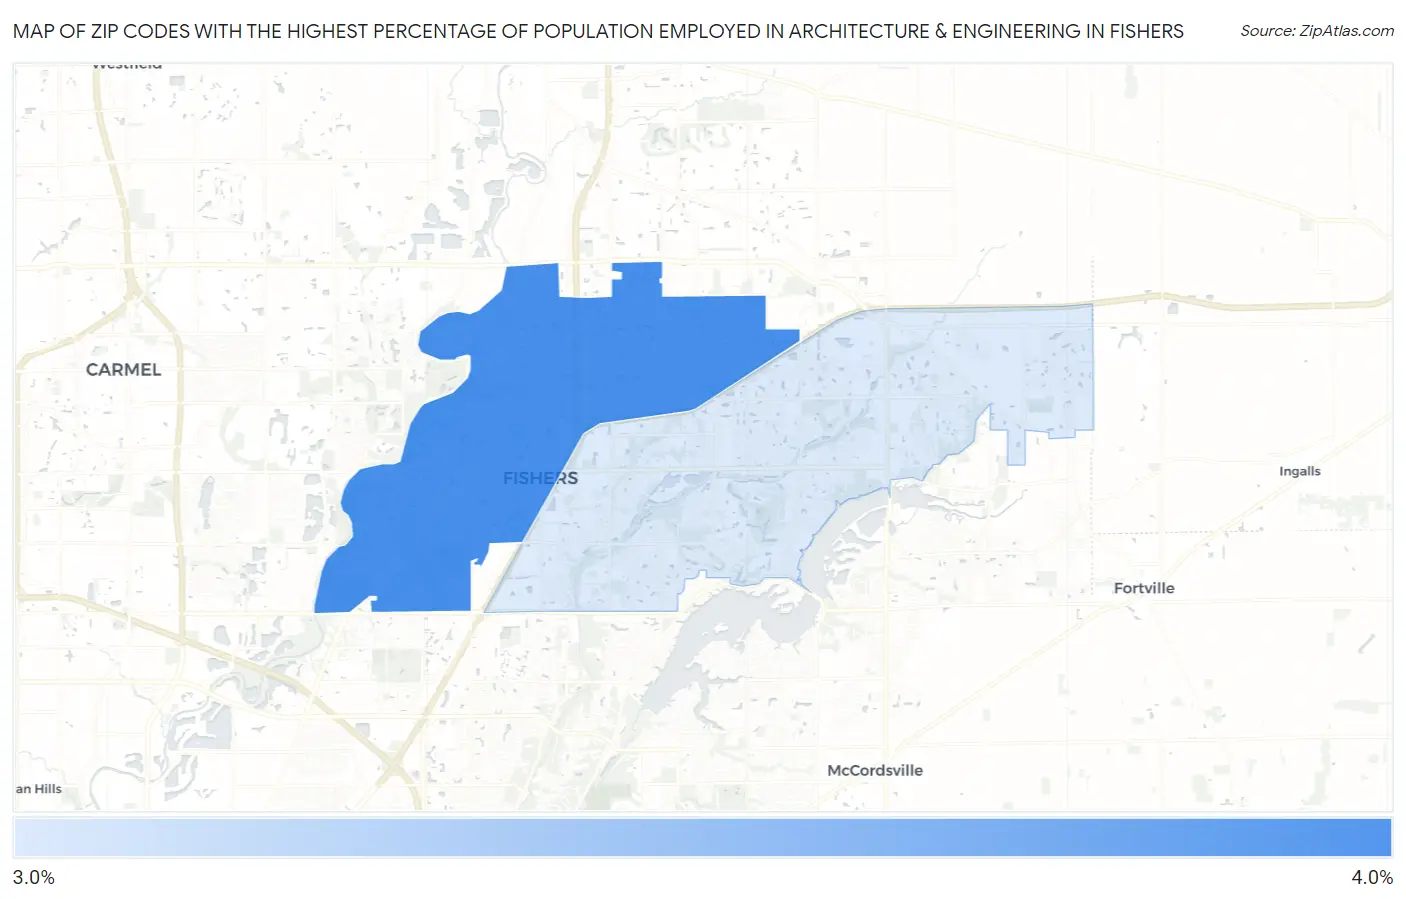
Map of Zip Codes with the Highest Percentage of Population Employed in Architecture & Engineering in Fishers
3.4%
3.8%
Zip Codes with the Highest Percentage of Population Employed in Architecture & Engineering in Fishers, IN
| Zip Code | % Employed | vs State | vs National | |
| 1. | 46038 | 3.8% | 2.2%(+1.55)#98 | 2.1%(+1.62)#3,159 |
| 2. | 46037 | 3.4% | 2.2%(+1.16)#128 | 2.1%(+1.23)#3,996 |
1
Common Questions
What are the Top Zip Codes with the Highest Percentage of Population Employed in Architecture & Engineering in Fishers, IN?
Top Zip Codes with the Highest Percentage of Population Employed in Architecture & Engineering in Fishers, IN are:
What zip code has the Highest Percentage of Population Employed in Architecture & Engineering in Fishers, IN?
46038 has the Highest Percentage of Population Employed in Architecture & Engineering in Fishers, IN with 3.8%.
What is the Percentage of Population Employed in Architecture & Engineering in Fishers, IN?
Percentage of Population Employed in Architecture & Engineering in Fishers is 3.2%.
What is the Percentage of Population Employed in Architecture & Engineering in Indiana?
Percentage of Population Employed in Architecture & Engineering in Indiana is 2.2%.
What is the Percentage of Population Employed in Architecture & Engineering in the United States?
Percentage of Population Employed in Architecture & Engineering in the United States is 2.1%.