Zip Codes with the Highest Percentage of Population Employed in Architecture & Engineering in Muncie, IN
RELATED REPORTS & OPTIONS
Architecture & Engineering
Muncie
Compare Zip Codes
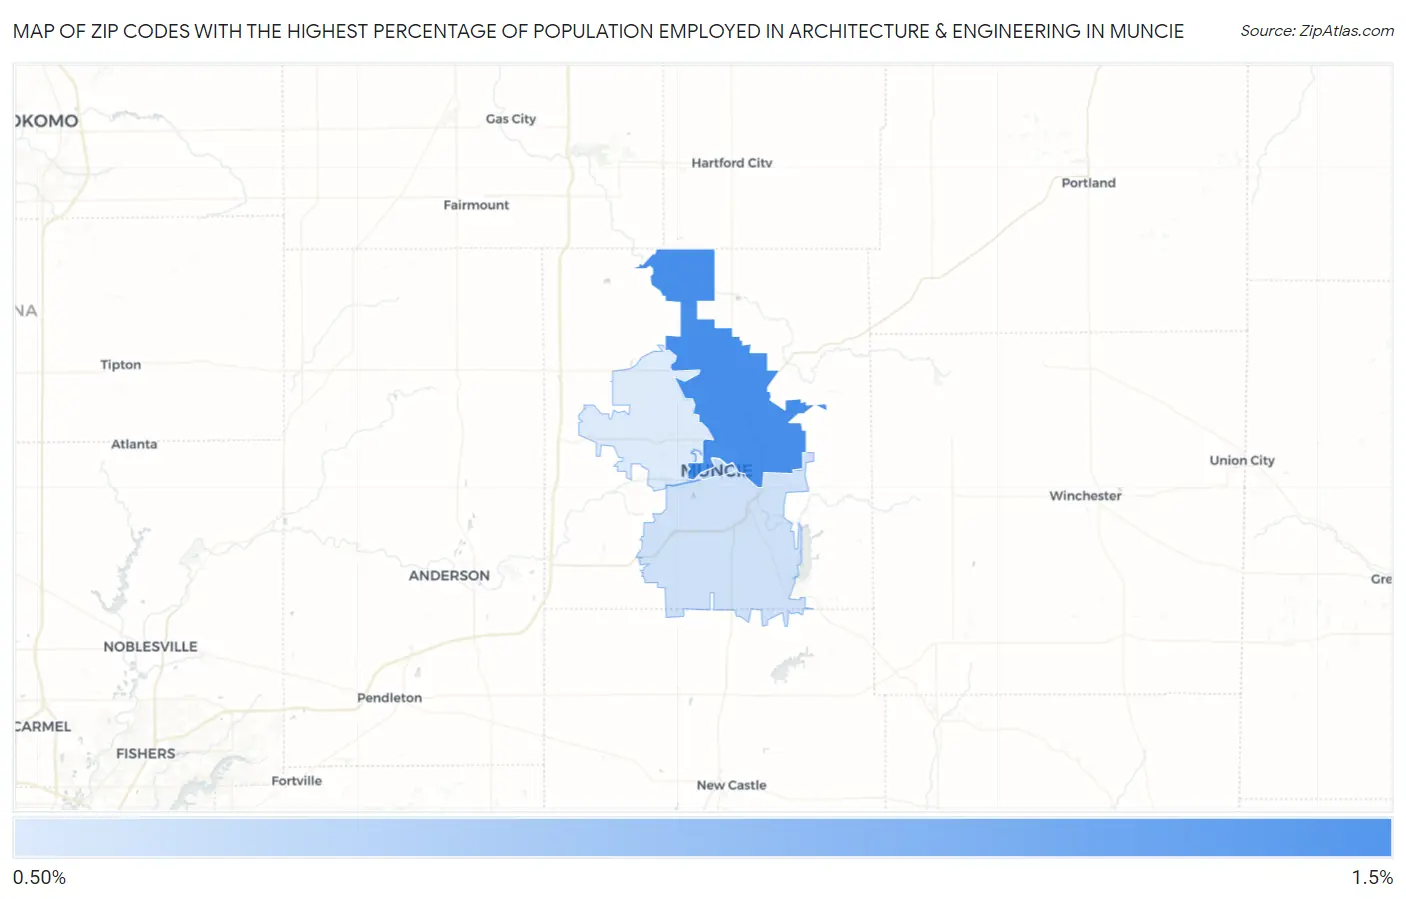
Map of Zip Codes with the Highest Percentage of Population Employed in Architecture & Engineering in Muncie
0.65%
1.3%
Zip Codes with the Highest Percentage of Population Employed in Architecture & Engineering in Muncie, IN
| Zip Code | % Employed | vs State | vs National | |
| 1. | 47303 | 1.3% | 2.2%(-0.874)#404 | 2.1%(-0.801)#13,973 |
| 2. | 47305 | 0.77% | 2.2%(-1.45)#510 | 2.1%(-1.38)#18,355 |
| 3. | 47302 | 0.72% | 2.2%(-1.51)#520 | 2.1%(-1.43)#18,783 |
| 4. | 47304 | 0.65% | 2.2%(-1.57)#526 | 2.1%(-1.50)#19,253 |
1
Common Questions
What are the Top 3 Zip Codes with the Highest Percentage of Population Employed in Architecture & Engineering in Muncie, IN?
Top 3 Zip Codes with the Highest Percentage of Population Employed in Architecture & Engineering in Muncie, IN are:
What zip code has the Highest Percentage of Population Employed in Architecture & Engineering in Muncie, IN?
47303 has the Highest Percentage of Population Employed in Architecture & Engineering in Muncie, IN with 1.3%.
What is the Percentage of Population Employed in Architecture & Engineering in Muncie, IN?
Percentage of Population Employed in Architecture & Engineering in Muncie is 0.95%.
What is the Percentage of Population Employed in Architecture & Engineering in Indiana?
Percentage of Population Employed in Architecture & Engineering in Indiana is 2.2%.
What is the Percentage of Population Employed in Architecture & Engineering in the United States?
Percentage of Population Employed in Architecture & Engineering in the United States is 2.1%.