Zip Codes with the Highest Percentage of Population Employed in Architecture & Engineering in Elkhart, IN
RELATED REPORTS & OPTIONS
Architecture & Engineering
Elkhart
Compare Zip Codes
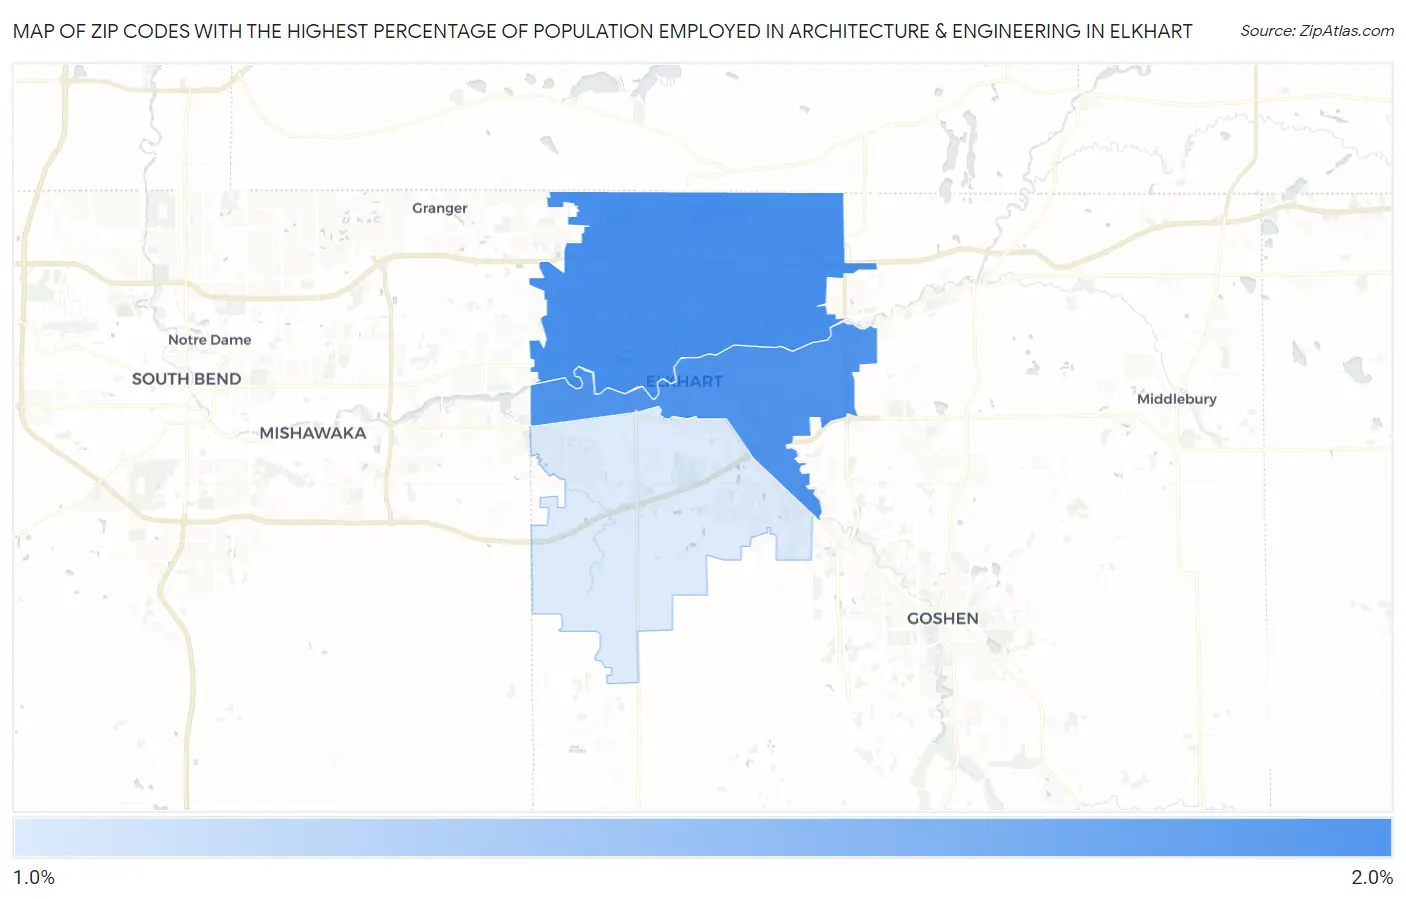
Map of Zip Codes with the Highest Percentage of Population Employed in Architecture & Engineering in Elkhart
1.6%
1.7%
Zip Codes with the Highest Percentage of Population Employed in Architecture & Engineering in Elkhart, IN
| Zip Code | % Employed | vs State | vs National | |
| 1. | 46514 | 1.7% | 2.2%(-0.497)#333 | 2.1%(-0.424)#11,323 |
| 2. | 46516 | 1.7% | 2.2%(-0.501)#335 | 2.1%(-0.429)#11,360 |
| 3. | 46517 | 1.6% | 2.2%(-0.584)#348 | 2.1%(-0.511)#11,928 |
1
Common Questions
What are the Top Zip Codes with the Highest Percentage of Population Employed in Architecture & Engineering in Elkhart, IN?
Top Zip Codes with the Highest Percentage of Population Employed in Architecture & Engineering in Elkhart, IN are:
What zip code has the Highest Percentage of Population Employed in Architecture & Engineering in Elkhart, IN?
46514 has the Highest Percentage of Population Employed in Architecture & Engineering in Elkhart, IN with 1.7%.
What is the Percentage of Population Employed in Architecture & Engineering in Elkhart, IN?
Percentage of Population Employed in Architecture & Engineering in Elkhart is 1.1%.
What is the Percentage of Population Employed in Architecture & Engineering in Indiana?
Percentage of Population Employed in Architecture & Engineering in Indiana is 2.2%.
What is the Percentage of Population Employed in Architecture & Engineering in the United States?
Percentage of Population Employed in Architecture & Engineering in the United States is 2.1%.