Freelandville, IN Map & Demographics
Freelandville Map
Freelandville Overview
$23,219
PER CAPITA INCOME
$73,333
AVG FAMILY INCOME
$56,250
AVG HOUSEHOLD INCOME
0.42
INEQUALITY / GINI INDEX
734
TOTAL POPULATION
363
MALE POPULATION
371
FEMALE POPULATION
97.84
MALES / 100 FEMALES
102.20
FEMALES / 100 MALES
38.1
MEDIAN AGE
3.4
AVG FAMILY SIZE
2.6
AVG HOUSEHOLD SIZE
251
LABOR FORCE [ PEOPLE ]
47.9%
PERCENT IN LABOR FORCE
3.6%
UNEMPLOYMENT RATE
Freelandville Zip Codes
Freelandville Area Codes
Income in Freelandville
Income Overview in Freelandville
Per Capita Income in Freelandville is $23,219, while median incomes of families and households are $73,333 and $56,250 respectively.
| Characteristic | Number | Measure |
| Per Capita Income | 734 | $23,219 |
| Median Family Income | 170 | $73,333 |
| Mean Family Income | 170 | $88,139 |
| Median Household Income | 262 | $56,250 |
| Mean Household Income | 262 | $63,489 |
| Income Deficit | 170 | $0 |
| Wage / Income Gap (%) | 734 | 0.00% |
| Wage / Income Gap ($) | 734 | 100.00¢ per $1 |
| Gini / Inequality Index | 734 | 0.42 |
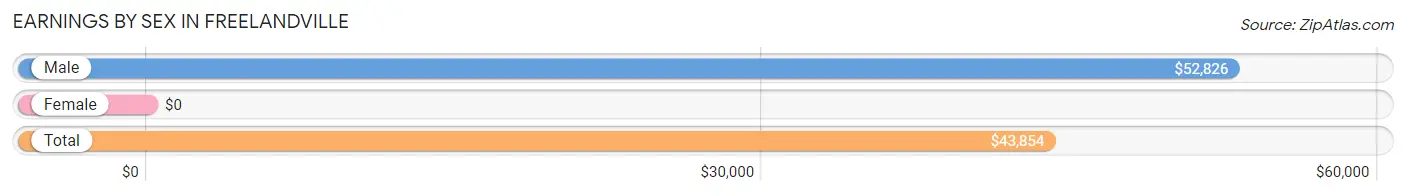
Earnings by Sex in Freelandville
| Sex | Number | Average Earnings |
| Male | 156 (56.9%) | $52,826 |
| Female | 118 (43.1%) | $0 |
| Total | 274 (100.0%) | $43,854 |
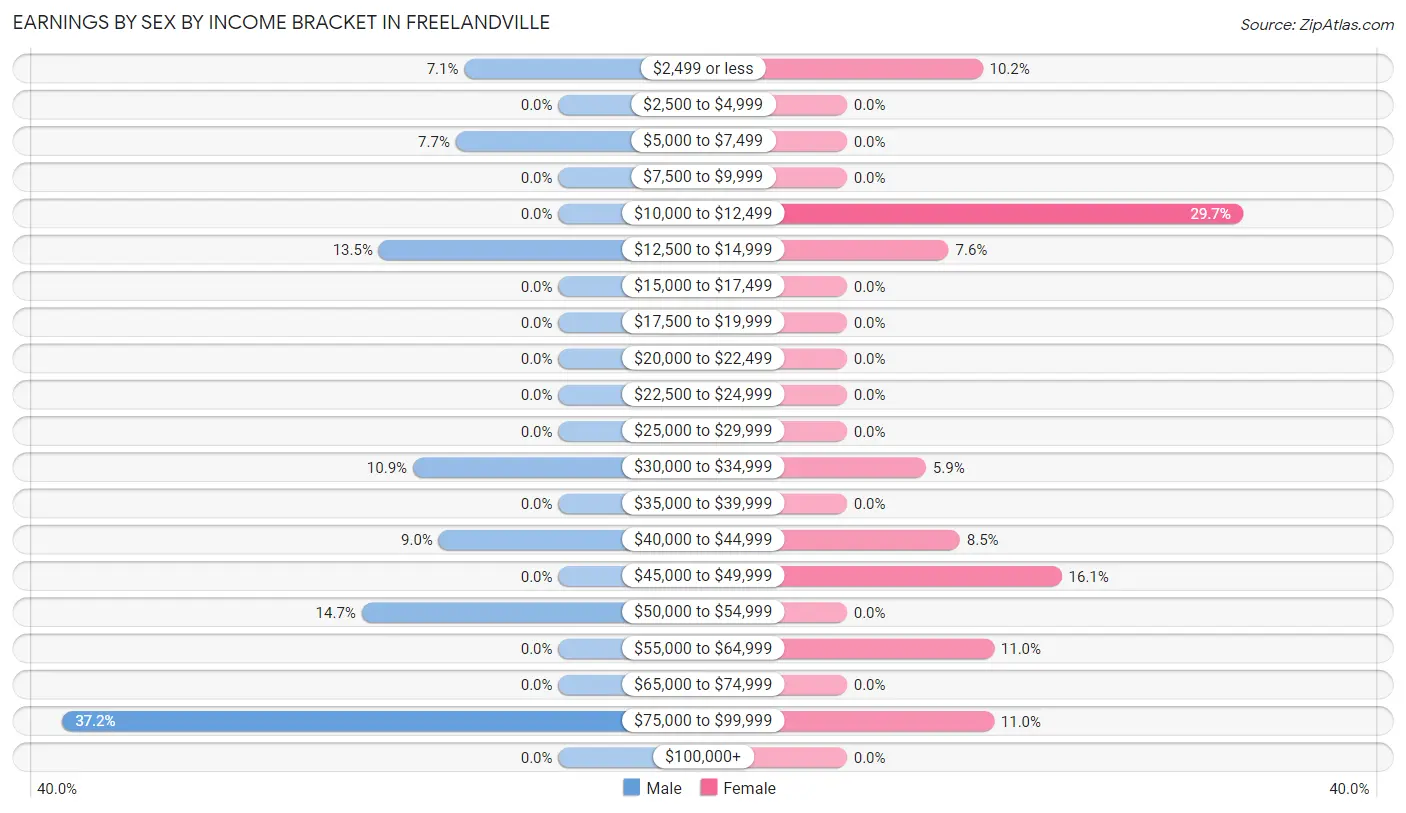
Earnings by Sex by Income Bracket in Freelandville
The most common earnings brackets in Freelandville are $75,000 to $99,999 for men (58 | 37.2%) and $10,000 to $12,499 for women (35 | 29.7%).
| Income | Male | Female |
| $2,499 or less | 11 (7.0%) | 12 (10.2%) |
| $2,500 to $4,999 | 0 (0.0%) | 0 (0.0%) |
| $5,000 to $7,499 | 12 (7.7%) | 0 (0.0%) |
| $7,500 to $9,999 | 0 (0.0%) | 0 (0.0%) |
| $10,000 to $12,499 | 0 (0.0%) | 35 (29.7%) |
| $12,500 to $14,999 | 21 (13.5%) | 9 (7.6%) |
| $15,000 to $17,499 | 0 (0.0%) | 0 (0.0%) |
| $17,500 to $19,999 | 0 (0.0%) | 0 (0.0%) |
| $20,000 to $22,499 | 0 (0.0%) | 0 (0.0%) |
| $22,500 to $24,999 | 0 (0.0%) | 0 (0.0%) |
| $25,000 to $29,999 | 0 (0.0%) | 0 (0.0%) |
| $30,000 to $34,999 | 17 (10.9%) | 7 (5.9%) |
| $35,000 to $39,999 | 0 (0.0%) | 0 (0.0%) |
| $40,000 to $44,999 | 14 (9.0%) | 10 (8.5%) |
| $45,000 to $49,999 | 0 (0.0%) | 19 (16.1%) |
| $50,000 to $54,999 | 23 (14.7%) | 0 (0.0%) |
| $55,000 to $64,999 | 0 (0.0%) | 13 (11.0%) |
| $65,000 to $74,999 | 0 (0.0%) | 0 (0.0%) |
| $75,000 to $99,999 | 58 (37.2%) | 13 (11.0%) |
| $100,000+ | 0 (0.0%) | 0 (0.0%) |
| Total | 156 (100.0%) | 118 (100.0%) |
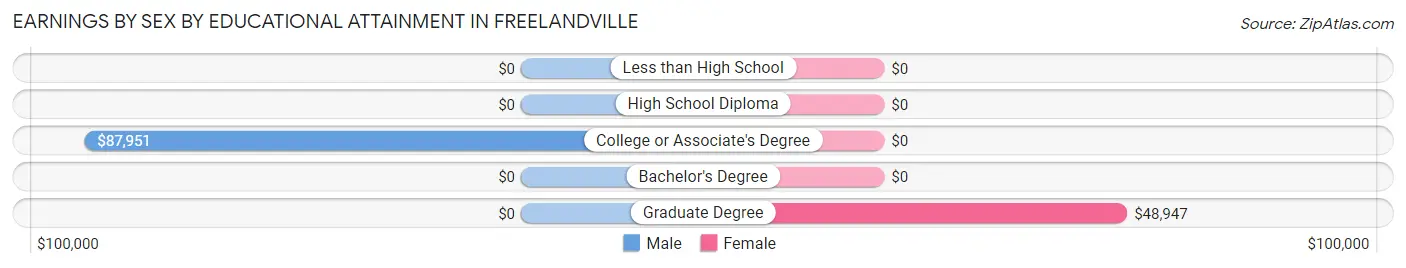
Earnings by Sex by Educational Attainment in Freelandville
Average earnings in Freelandville are $54,728 for men and $44,875 for women, a difference of 18.0%. Men with an educational attainment of college or associate's degree enjoy the highest average annual earnings of $87,951, while those with college or associate's degree education earn the least with $87,951. Women with an educational attainment of graduate degree earn the most with the average annual earnings of $48,947, while those with graduate degree education have the smallest earnings of $48,947.
| Educational Attainment | Male Income | Female Income |
| Less than High School | - | - |
| High School Diploma | - | - |
| College or Associate's Degree | $87,951 | $0 |
| Bachelor's Degree | - | - |
| Graduate Degree | - | - |
| Total | $54,728 | $44,875 |
Family Income in Freelandville
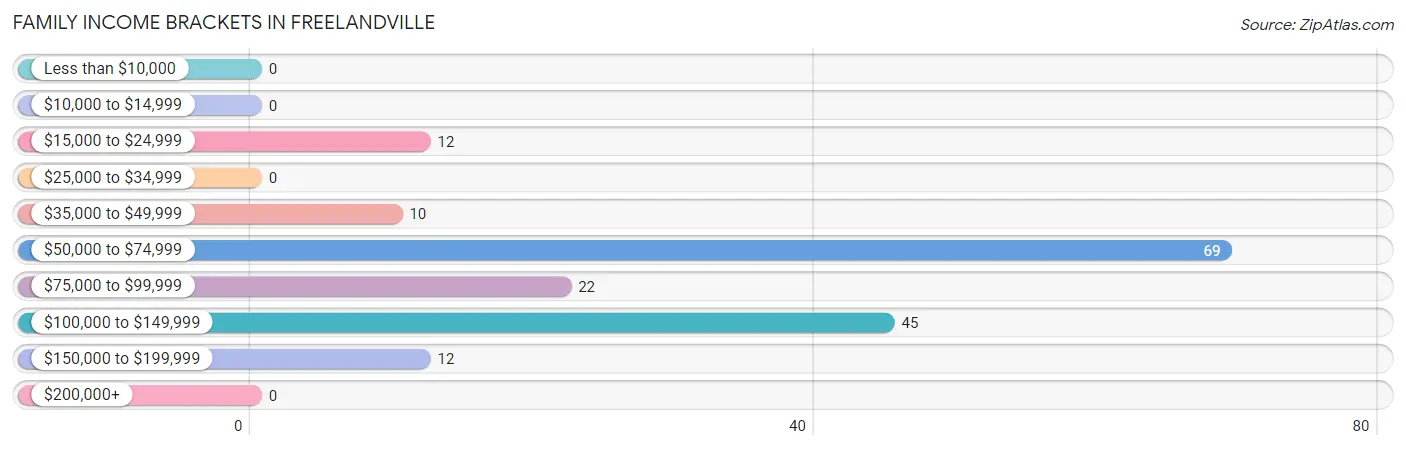
Family Income Brackets in Freelandville
According to the Freelandville family income data, there are 69 families falling into the $50,000 to $74,999 income range, which is the most common income bracket and makes up 40.6% of all families.
| Income Bracket | # Families | % Families |
| Less than $10,000 | 0 | 0.0% |
| $10,000 to $14,999 | 0 | 0.0% |
| $15,000 to $24,999 | 12 | 7.1% |
| $25,000 to $34,999 | 0 | 0.0% |
| $35,000 to $49,999 | 10 | 5.9% |
| $50,000 to $74,999 | 69 | 40.6% |
| $75,000 to $99,999 | 22 | 12.9% |
| $100,000 to $149,999 | 45 | 26.5% |
| $150,000 to $199,999 | 12 | 7.1% |
| $200,000+ | 0 | 0.0% |
Family Income by Famaliy Size in Freelandville
| Income Bracket | # Families | Median Income |
| 2-Person Families | 73 (42.9%) | $0 |
| 3-Person Families | 27 (15.9%) | $0 |
| 4-Person Families | 12 (7.1%) | $0 |
| 5-Person Families | 22 (12.9%) | $0 |
| 6-Person Families | 36 (21.2%) | $0 |
| 7+ Person Families | 0 (0.0%) | $0 |
| Total | 170 (100.0%) | $73,333 |
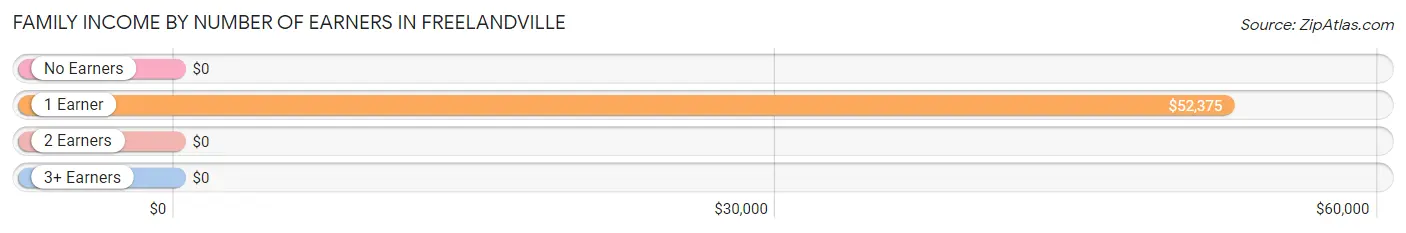
Family Income by Number of Earners in Freelandville
| Number of Earners | # Families | Median Income |
| No Earners | 8 (4.7%) | $0 |
| 1 Earner | 63 (37.1%) | $52,375 |
| 2 Earners | 87 (51.2%) | $0 |
| 3+ Earners | 12 (7.1%) | $0 |
| Total | 170 (100.0%) | $73,333 |
Household Income in Freelandville
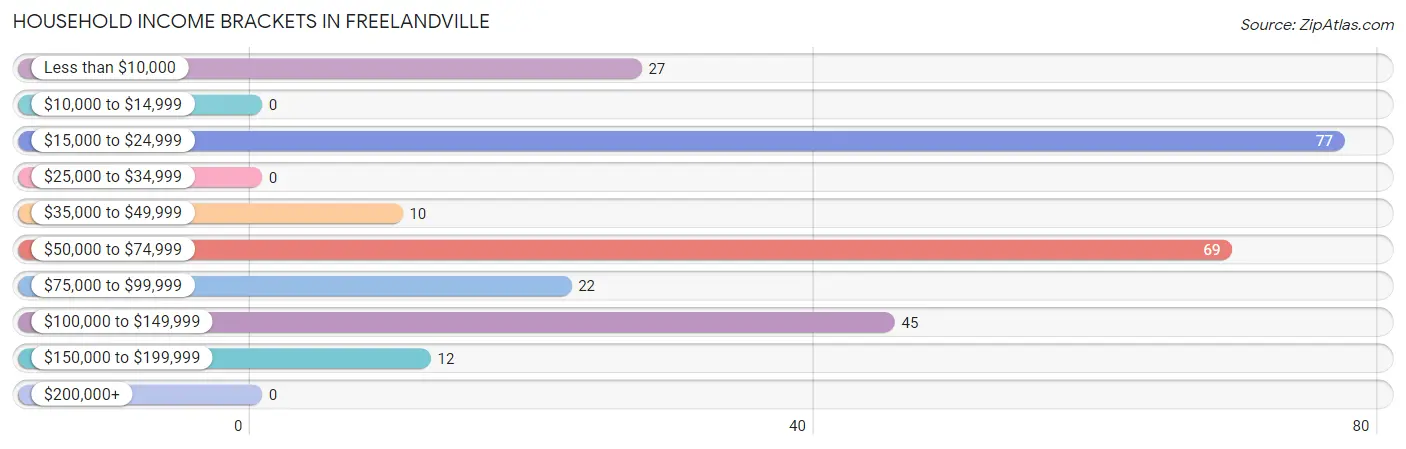
Household Income Brackets in Freelandville
With 77 households falling in the category, the $15,000 to $24,999 income range is the most frequent in Freelandville, accounting for 29.4% of all households.
| Income Bracket | # Households | % Households |
| Less than $10,000 | 27 | 10.3% |
| $10,000 to $14,999 | 0 | 0.0% |
| $15,000 to $24,999 | 77 | 29.4% |
| $25,000 to $34,999 | 0 | 0.0% |
| $35,000 to $49,999 | 10 | 3.8% |
| $50,000 to $74,999 | 69 | 26.3% |
| $75,000 to $99,999 | 22 | 8.4% |
| $100,000 to $149,999 | 45 | 17.2% |
| $150,000 to $199,999 | 12 | 4.6% |
| $200,000+ | 0 | 0.0% |
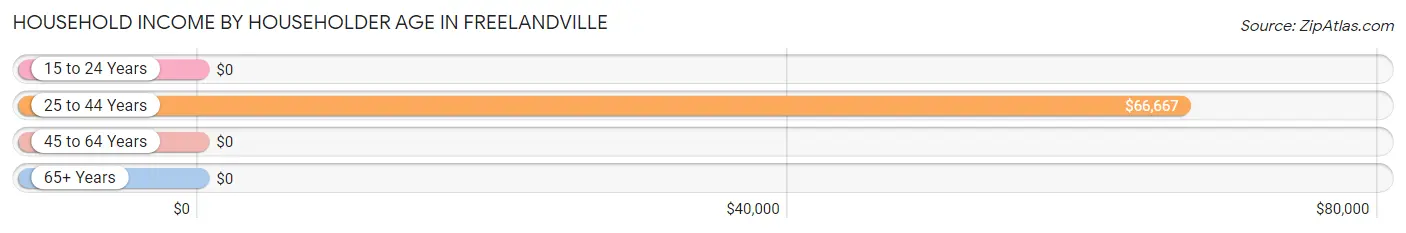
Household Income by Householder Age in Freelandville
The median household income in Freelandville is $56,250, with the highest median household income of $66,667 found in the 25 to 44 years age bracket for the primary householder. A total of 68 households (26.0%) fall into this category. Meanwhile, the 15 to 24 years age bracket for the primary householder has the lowest median household income of $0, with 14 households (5.3%) in this group.
| Income Bracket | # Households | Median Income |
| 15 to 24 Years | 14 (5.3%) | $0 |
| 25 to 44 Years | 68 (26.0%) | $66,667 |
| 45 to 64 Years | 67 (25.6%) | $0 |
| 65+ Years | 113 (43.1%) | $0 |
| Total | 262 (100.0%) | $56,250 |
Poverty in Freelandville
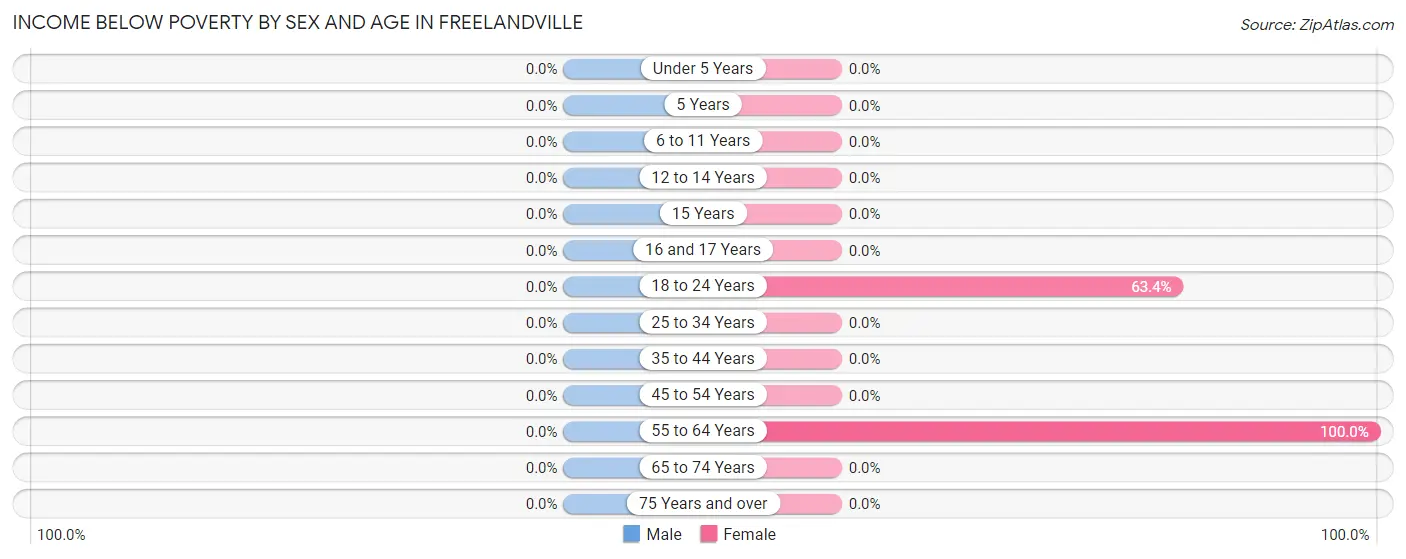
Income Below Poverty by Sex and Age in Freelandville
| Age Bracket | Male | Female |
| Under 5 Years | 0 (0.0%) | 0 (0.0%) |
| 5 Years | 0 (0.0%) | 0 (0.0%) |
| 6 to 11 Years | 0 (0.0%) | 0 (0.0%) |
| 12 to 14 Years | 0 (0.0%) | 0 (0.0%) |
| 15 Years | 0 (0.0%) | 0 (0.0%) |
| 16 and 17 Years | 0 (0.0%) | 0 (0.0%) |
| 18 to 24 Years | 0 (0.0%) | 26 (63.4%) |
| 25 to 34 Years | 0 (0.0%) | 0 (0.0%) |
| 35 to 44 Years | 0 (0.0%) | 0 (0.0%) |
| 45 to 54 Years | 0 (0.0%) | 0 (0.0%) |
| 55 to 64 Years | 0 (0.0%) | 27 (100.0%) |
| 65 to 74 Years | 0 (0.0%) | 0 (0.0%) |
| 75 Years and over | 0 (0.0%) | 0 (0.0%) |
| Total | 0 (0.0%) | 53 (15.3%) |
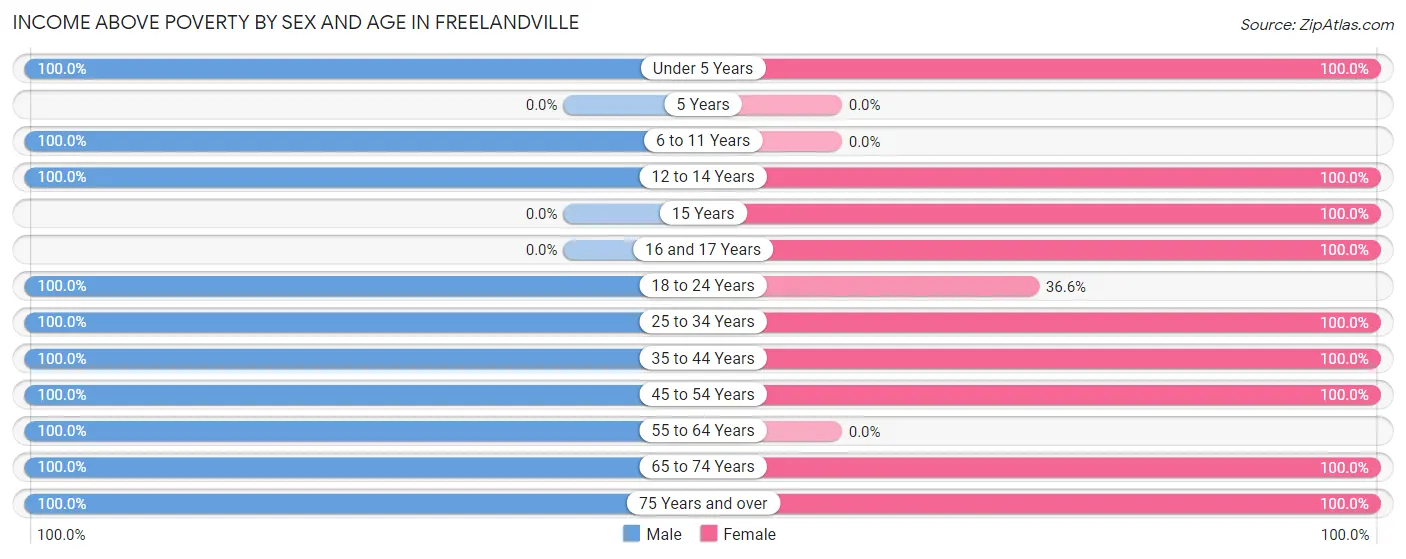
Income Above Poverty by Sex and Age in Freelandville
According to the poverty statistics in Freelandville, males aged under 5 years and females aged under 5 years are the age groups that are most secure financially, with 100.0% of males and 100.0% of females in these age groups living above the poverty line.
| Age Bracket | Male | Female |
| Under 5 Years | 7 (100.0%) | 31 (100.0%) |
| 5 Years | 0 (0.0%) | 0 (0.0%) |
| 6 to 11 Years | 72 (100.0%) | 0 (0.0%) |
| 12 to 14 Years | 46 (100.0%) | 26 (100.0%) |
| 15 Years | 0 (0.0%) | 28 (100.0%) |
| 16 and 17 Years | 0 (0.0%) | 12 (100.0%) |
| 18 to 24 Years | 35 (100.0%) | 15 (36.6%) |
| 25 to 34 Years | 17 (100.0%) | 28 (100.0%) |
| 35 to 44 Years | 45 (100.0%) | 27 (100.0%) |
| 45 to 54 Years | 20 (100.0%) | 32 (100.0%) |
| 55 to 64 Years | 56 (100.0%) | 0 (0.0%) |
| 65 to 74 Years | 41 (100.0%) | 32 (100.0%) |
| 75 Years and over | 8 (100.0%) | 62 (100.0%) |
| Total | 347 (100.0%) | 293 (84.7%) |
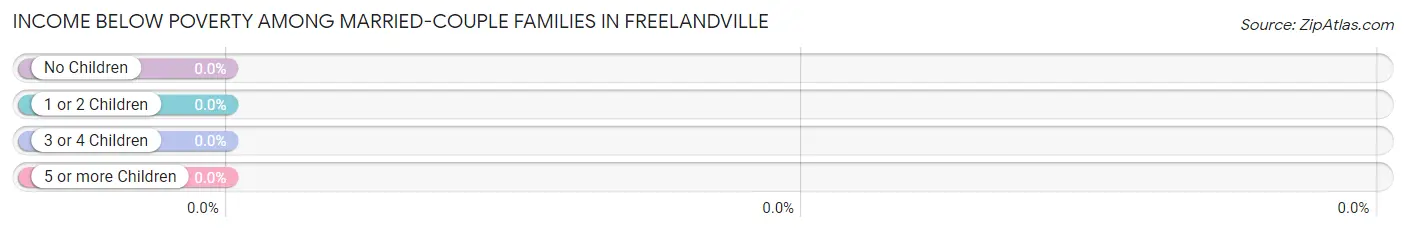
Income Below Poverty Among Married-Couple Families in Freelandville
| Children | Above Poverty | Below Poverty |
| No Children | 73 (100.0%) | 0 (0.0%) |
| 1 or 2 Children | 26 (100.0%) | 0 (0.0%) |
| 3 or 4 Children | 27 (100.0%) | 0 (0.0%) |
| 5 or more Children | 0 (0.0%) | 0 (0.0%) |
| Total | 126 (100.0%) | 0 (0.0%) |
Income Below Poverty Among Single-Parent Households in Freelandville
| Children | Single Father | Single Mother |
| No Children | 0 (0.0%) | 0 (0.0%) |
| 1 or 2 Children | 0 (0.0%) | 0 (0.0%) |
| 3 or 4 Children | 0 (0.0%) | 0 (0.0%) |
| 5 or more Children | 0 (0.0%) | 0 (0.0%) |
| Total | 0 (0.0%) | 0 (0.0%) |
Income Below Poverty Among Married-Couple vs Single-Parent Households in Freelandville
| Children | Married-Couple Families | Single-Parent Households |
| No Children | 0 (0.0%) | 0 (0.0%) |
| 1 or 2 Children | 0 (0.0%) | 0 (0.0%) |
| 3 or 4 Children | 0 (0.0%) | 0 (0.0%) |
| 5 or more Children | 0 (0.0%) | 0 (0.0%) |
| Total | 0 (0.0%) | 0 (0.0%) |
Race in Freelandville
The most populous races in Freelandville are White / Caucasian (604 | 82.3%), and Two or more Races (130 | 17.7%).
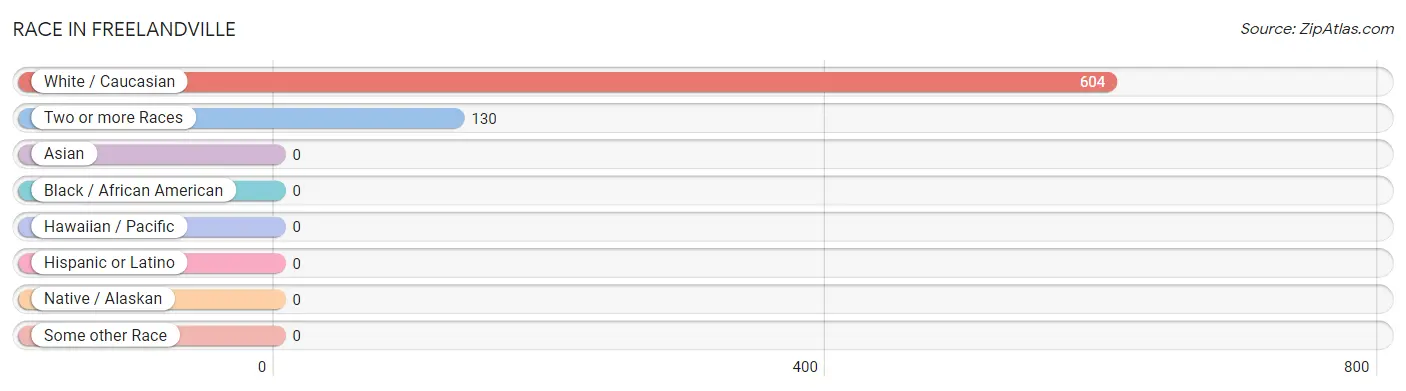
| Race | # Population | % Population |
| Asian | 0 | 0.0% |
| Black / African American | 0 | 0.0% |
| Hawaiian / Pacific | 0 | 0.0% |
| Hispanic or Latino | 0 | 0.0% |
| Native / Alaskan | 0 | 0.0% |
| White / Caucasian | 604 | 82.3% |
| Two or more Races | 130 | 17.7% |
| Some other Race | 0 | 0.0% |
| Total | 734 | 100.0% |
Ancestry in Freelandville
The most populous ancestries reported in Freelandville are German (205 | 27.9%), Irish (161 | 21.9%), American (92 | 12.5%), English (89 | 12.1%), and Slovak (27 | 3.7%), together accounting for 78.2% of all Freelandville residents.
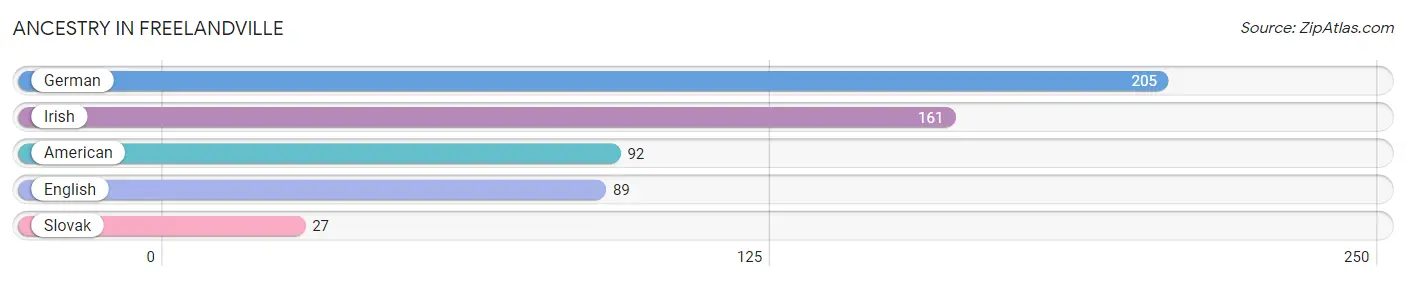
| Ancestry | # Population | % Population |
| American | 92 | 12.5% |
| English | 89 | 12.1% |
| German | 205 | 27.9% |
| Irish | 161 | 21.9% |
| Slovak | 27 | 3.7% | View All 5 Rows |
Immigrants in Freelandville

| Immigration Origin | # Population | % Population | View All 0 Rows |
Sex and Age in Freelandville
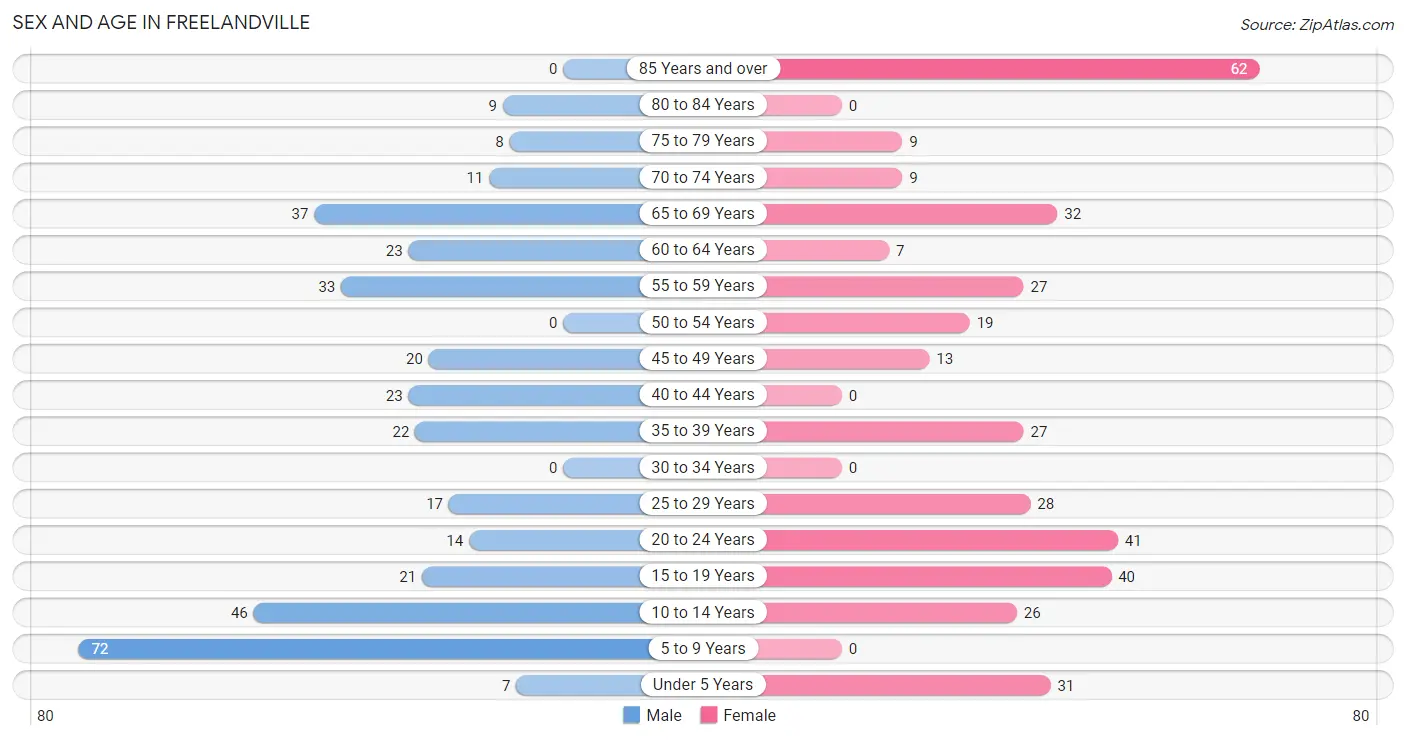
Sex and Age in Freelandville
The most populous age groups in Freelandville are 5 to 9 Years (72 | 19.8%) for men and 85 Years and over (62 | 16.7%) for women.
| Age Bracket | Male | Female |
| Under 5 Years | 7 (1.9%) | 31 (8.4%) |
| 5 to 9 Years | 72 (19.8%) | 0 (0.0%) |
| 10 to 14 Years | 46 (12.7%) | 26 (7.0%) |
| 15 to 19 Years | 21 (5.8%) | 40 (10.8%) |
| 20 to 24 Years | 14 (3.9%) | 41 (11.1%) |
| 25 to 29 Years | 17 (4.7%) | 28 (7.5%) |
| 30 to 34 Years | 0 (0.0%) | 0 (0.0%) |
| 35 to 39 Years | 22 (6.1%) | 27 (7.3%) |
| 40 to 44 Years | 23 (6.3%) | 0 (0.0%) |
| 45 to 49 Years | 20 (5.5%) | 13 (3.5%) |
| 50 to 54 Years | 0 (0.0%) | 19 (5.1%) |
| 55 to 59 Years | 33 (9.1%) | 27 (7.3%) |
| 60 to 64 Years | 23 (6.3%) | 7 (1.9%) |
| 65 to 69 Years | 37 (10.2%) | 32 (8.6%) |
| 70 to 74 Years | 11 (3.0%) | 9 (2.4%) |
| 75 to 79 Years | 8 (2.2%) | 9 (2.4%) |
| 80 to 84 Years | 9 (2.5%) | 0 (0.0%) |
| 85 Years and over | 0 (0.0%) | 62 (16.7%) |
| Total | 363 (100.0%) | 371 (100.0%) |
Families and Households in Freelandville
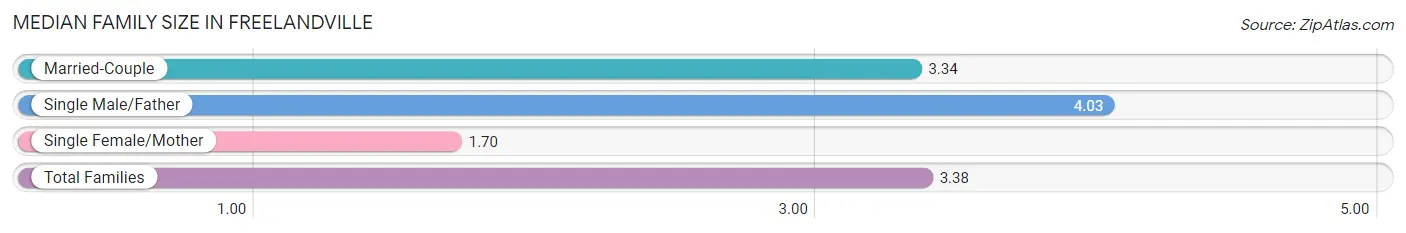
Median Family Size in Freelandville
The median family size in Freelandville is 3.38 persons per family, with single male/father families (34 | 20.0%) accounting for the largest median family size of 4.03 persons per family. On the other hand, single female/mother families (10 | 5.9%) represent the smallest median family size with 1.70 persons per family.
| Family Type | # Families | Family Size |
| Married-Couple | 126 (74.1%) | 3.34 |
| Single Male/Father | 34 (20.0%) | 4.03 |
| Single Female/Mother | 10 (5.9%) | 1.70 |
| Total Families | 170 (100.0%) | 3.38 |
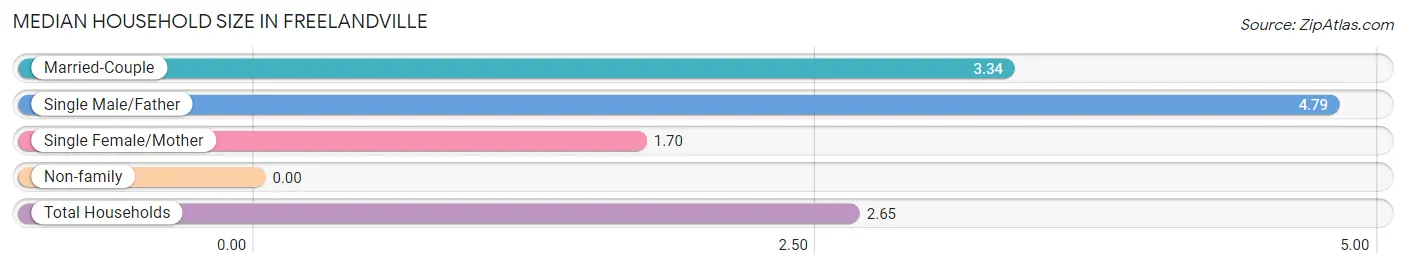
Median Household Size in Freelandville
| Household Type | # Households | Household Size |
| Married-Couple | 126 (48.1%) | 3.34 |
| Single Male/Father | 34 (13.0%) | 4.79 |
| Single Female/Mother | 10 (3.8%) | 1.70 |
| Non-family | 92 (35.1%) | - |
| Total Households | 262 (100.0%) | 2.65 |
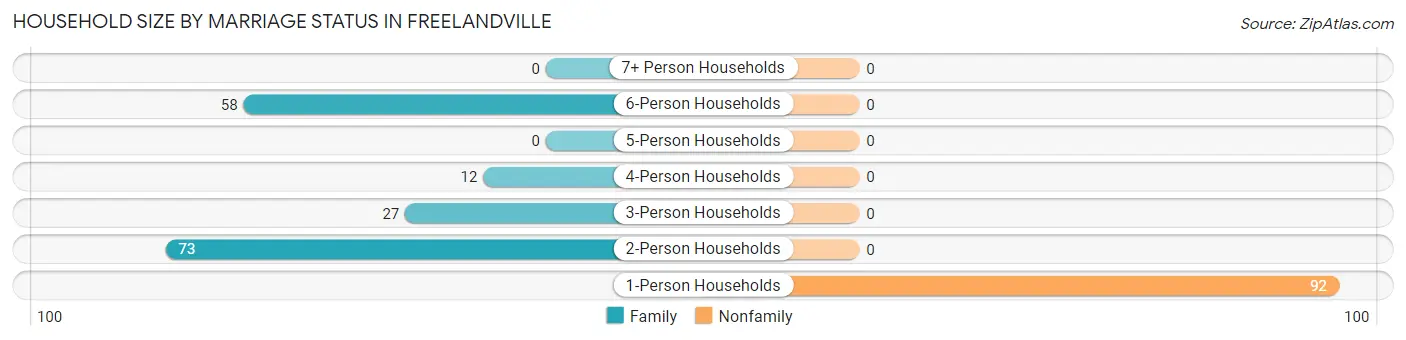
Household Size by Marriage Status in Freelandville
Out of a total of 262 households in Freelandville, 170 (64.9%) are family households, while 92 (35.1%) are nonfamily households. The most numerous type of family households are 2-person households, comprising 73, and the most common type of nonfamily households are 1-person households, comprising 92.
| Household Size | Family Households | Nonfamily Households |
| 1-Person Households | - | 92 (35.1%) |
| 2-Person Households | 73 (27.9%) | 0 (0.0%) |
| 3-Person Households | 27 (10.3%) | 0 (0.0%) |
| 4-Person Households | 12 (4.6%) | 0 (0.0%) |
| 5-Person Households | 0 (0.0%) | 0 (0.0%) |
| 6-Person Households | 58 (22.1%) | 0 (0.0%) |
| 7+ Person Households | 0 (0.0%) | 0 (0.0%) |
| Total | 170 (64.9%) | 92 (35.1%) |
Female Fertility in Freelandville
Fertility by Age in Freelandville
Average fertility rate in Freelandville is 168.0 births per 1,000 women. Women in the age bracket of 20 to 34 years have the highest fertility rate with 362.0 births per 1,000 women. Women in the age bracket of 20 to 34 years acount for 100.0% of all women with births.
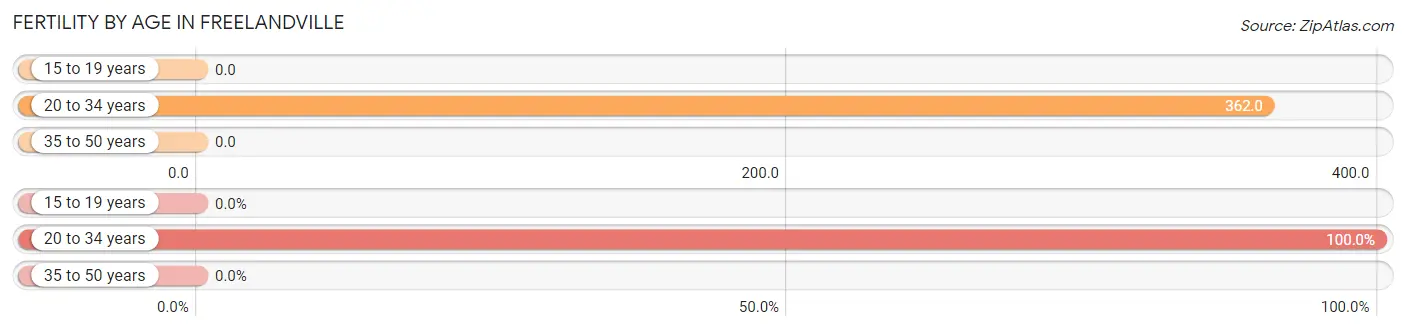
| Age Bracket | Women with Births | Births / 1,000 Women |
| 15 to 19 years | 0 (0.0%) | 0.0 |
| 20 to 34 years | 25 (100.0%) | 362.0 |
| 35 to 50 years | 0 (0.0%) | 0.0 |
| Total | 25 (100.0%) | 168.0 |
Fertility by Age by Marriage Status in Freelandville
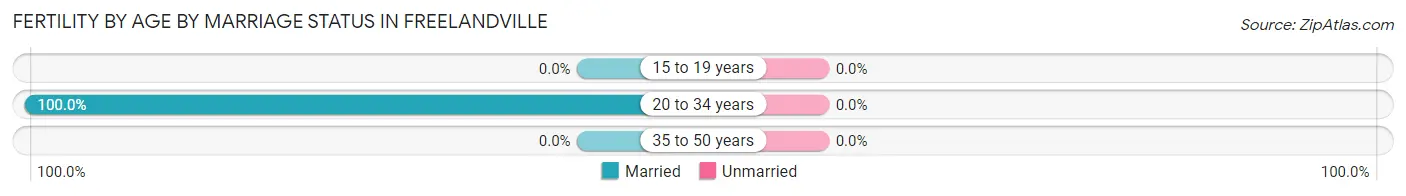
| Age Bracket | Married | Unmarried |
| 15 to 19 years | 0 (0.0%) | 0 (0.0%) |
| 20 to 34 years | 25 (100.0%) | 0 (0.0%) |
| 35 to 50 years | 0 (0.0%) | 0 (0.0%) |
| Total | 25 (100.0%) | 0 (0.0%) |
Fertility by Education in Freelandville
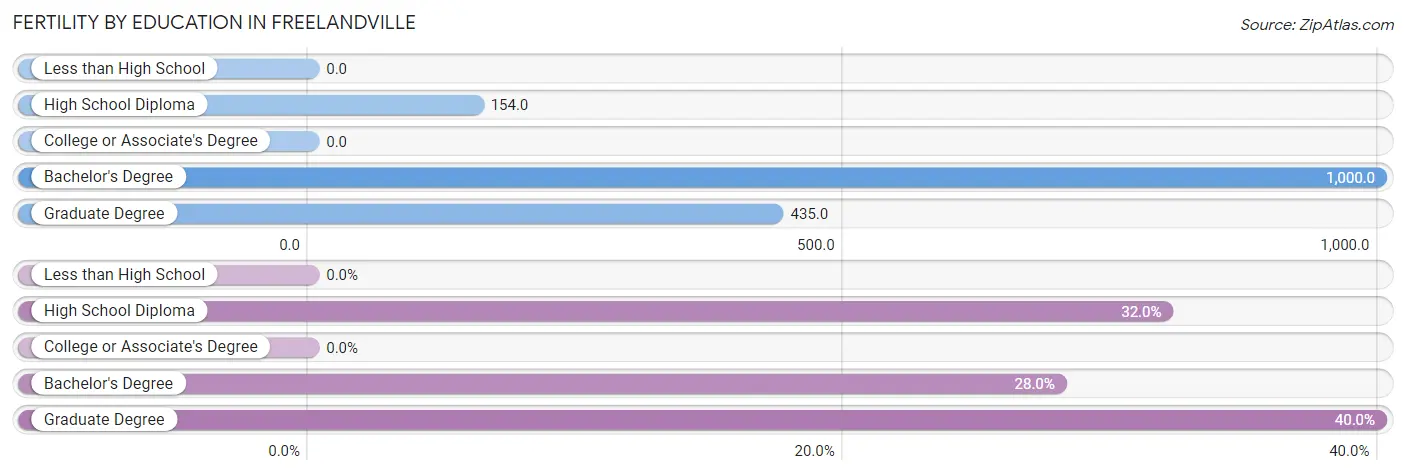
| Educational Attainment | Women with Births | Births / 1,000 Women |
| Less than High School | 0 (0.0%) | 0.0 |
| High School Diploma | 8 (32.0%) | 154.0 |
| College or Associate's Degree | 0 (0.0%) | 0.0 |
| Bachelor's Degree | 7 (28.0%) | 1,000.0 |
| Graduate Degree | 10 (40.0%) | 435.0 |
| Total | 25 (100.0%) | 168.0 |
Fertility by Education by Marriage Status in Freelandville
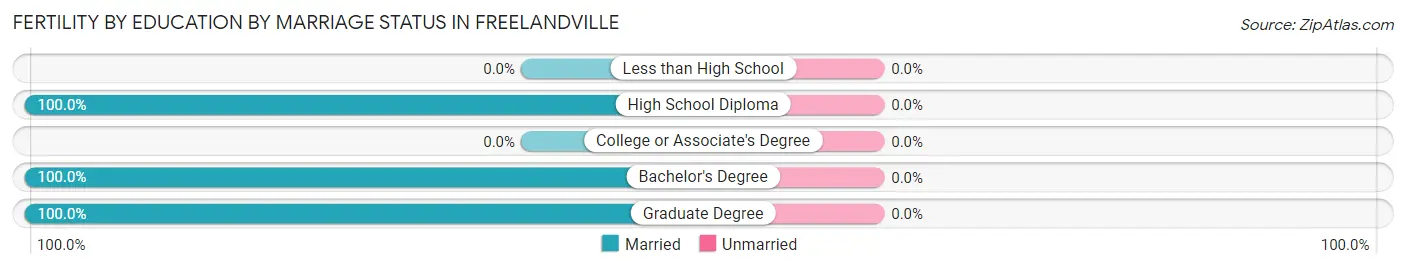
| Educational Attainment | Married | Unmarried |
| Less than High School | 0 (0.0%) | 0 (0.0%) |
| High School Diploma | 8 (100.0%) | 0 (0.0%) |
| College or Associate's Degree | 0 (0.0%) | 0 (0.0%) |
| Bachelor's Degree | 7 (100.0%) | 0 (0.0%) |
| Graduate Degree | 10 (100.0%) | 0 (0.0%) |
| Total | 25 (100.0%) | 0 (0.0%) |
Employment Characteristics in Freelandville
Employment by Class of Employer in Freelandville
Among the 230 employed individuals in Freelandville, private company employees (144 | 62.6%), not-for-profit organizations (46 | 20.0%), and federal government employees (33 | 14.3%) make up the most common classes of employment.
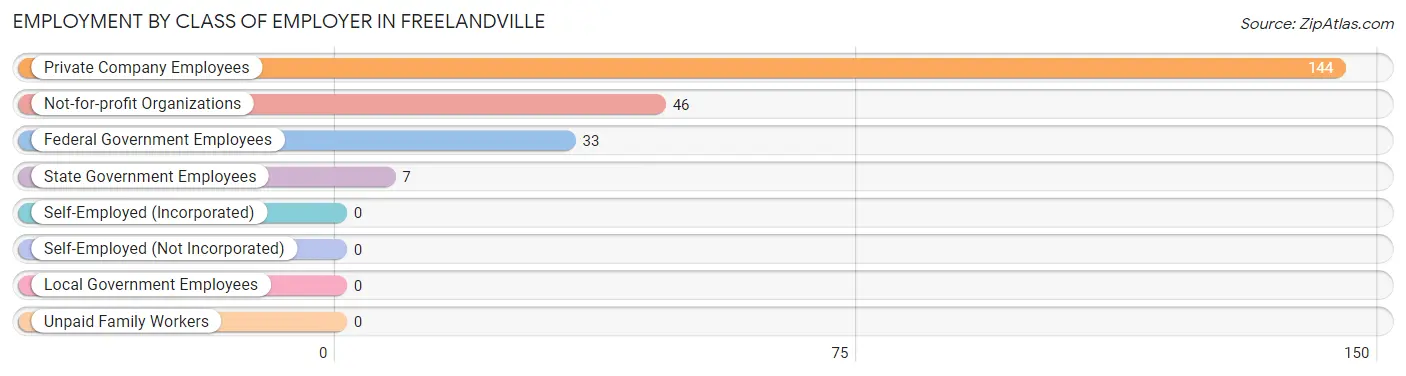
| Employer Class | # Employees | % Employees |
| Private Company Employees | 144 | 62.6% |
| Self-Employed (Incorporated) | 0 | 0.0% |
| Self-Employed (Not Incorporated) | 0 | 0.0% |
| Not-for-profit Organizations | 46 | 20.0% |
| Local Government Employees | 0 | 0.0% |
| State Government Employees | 7 | 3.0% |
| Federal Government Employees | 33 | 14.3% |
| Unpaid Family Workers | 0 | 0.0% |
| Total | 230 | 100.0% |
Employment Status by Age in Freelandville
According to the labor force statistics for Freelandville, out of the total population over 16 years of age (524), 47.9% or 251 individuals are in the labor force, with 3.6% or 9 of them unemployed. The age group with the highest labor force participation rate is 35 to 44 years, with 100.0% or 72 individuals in the labor force. Within the labor force, the 25 to 29 years age range has the highest percentage of unemployed individuals, with 32.1% or 9 of them being unemployed.
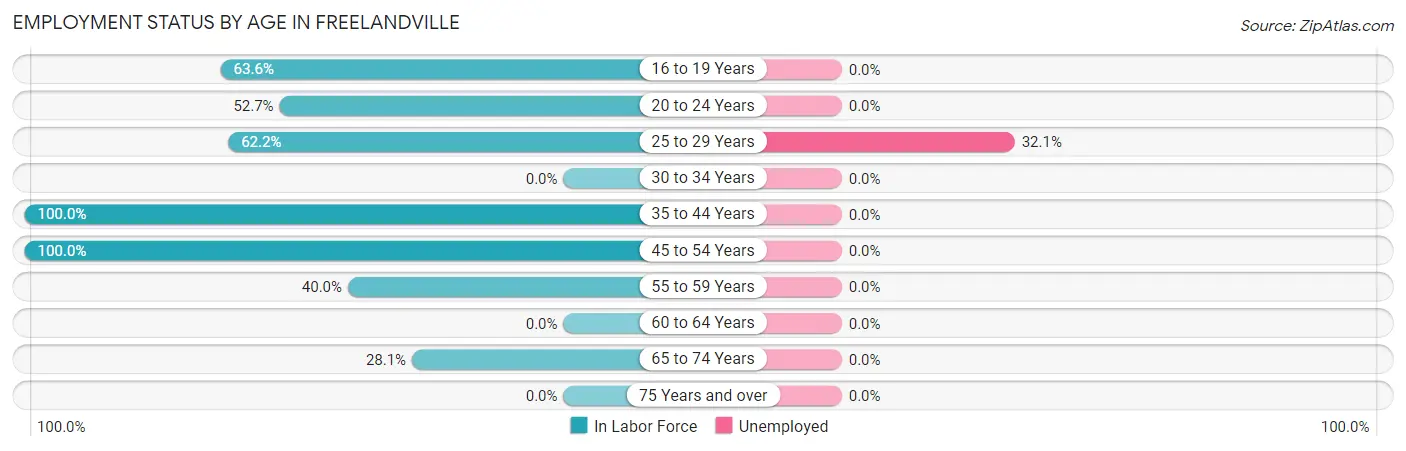
| Age Bracket | In Labor Force | Unemployed |
| 16 to 19 Years | 21 (63.6%) | 0 (0.0%) |
| 20 to 24 Years | 29 (52.7%) | 0 (0.0%) |
| 25 to 29 Years | 28 (62.2%) | 9 (32.1%) |
| 30 to 34 Years | 0 (0.0%) | 0 (0.0%) |
| 35 to 44 Years | 72 (100.0%) | 0 (0.0%) |
| 45 to 54 Years | 52 (100.0%) | 0 (0.0%) |
| 55 to 59 Years | 24 (40.0%) | 0 (0.0%) |
| 60 to 64 Years | 0 (0.0%) | 0 (0.0%) |
| 65 to 74 Years | 25 (28.1%) | 0 (0.0%) |
| 75 Years and over | 0 (0.0%) | 0 (0.0%) |
| Total | 251 (47.9%) | 9 (3.6%) |
Employment Status by Educational Attainment in Freelandville
According to labor force statistics for Freelandville, 68.0% of individuals (176) out of the total population between 25 and 64 years of age (259) are in the labor force, with 5.1% or 9 of them being unemployed. The group with the highest labor force participation rate are those with the educational attainment of bachelor's degree or higher, with 85.0% or 51 individuals in the labor force. Within the labor force, individuals with high school diploma education have the highest percentage of unemployment, with 23.1% or 9 of them being unemployed.
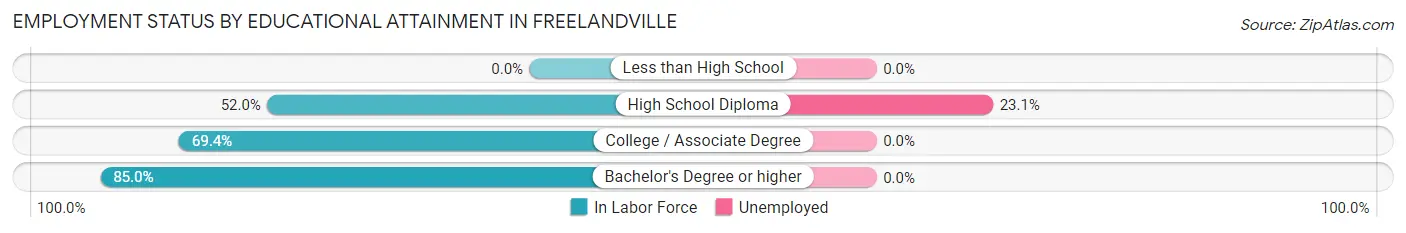
| Educational Attainment | In Labor Force | Unemployed |
| Less than High School | 0 (0.0%) | 0 (0.0%) |
| High School Diploma | 39 (52.0%) | 17 (23.1%) |
| College / Associate Degree | 86 (69.4%) | 0 (0.0%) |
| Bachelor's Degree or higher | 51 (85.0%) | 0 (0.0%) |
| Total | 176 (68.0%) | 13 (5.1%) |
Employment Occupations by Sex in Freelandville
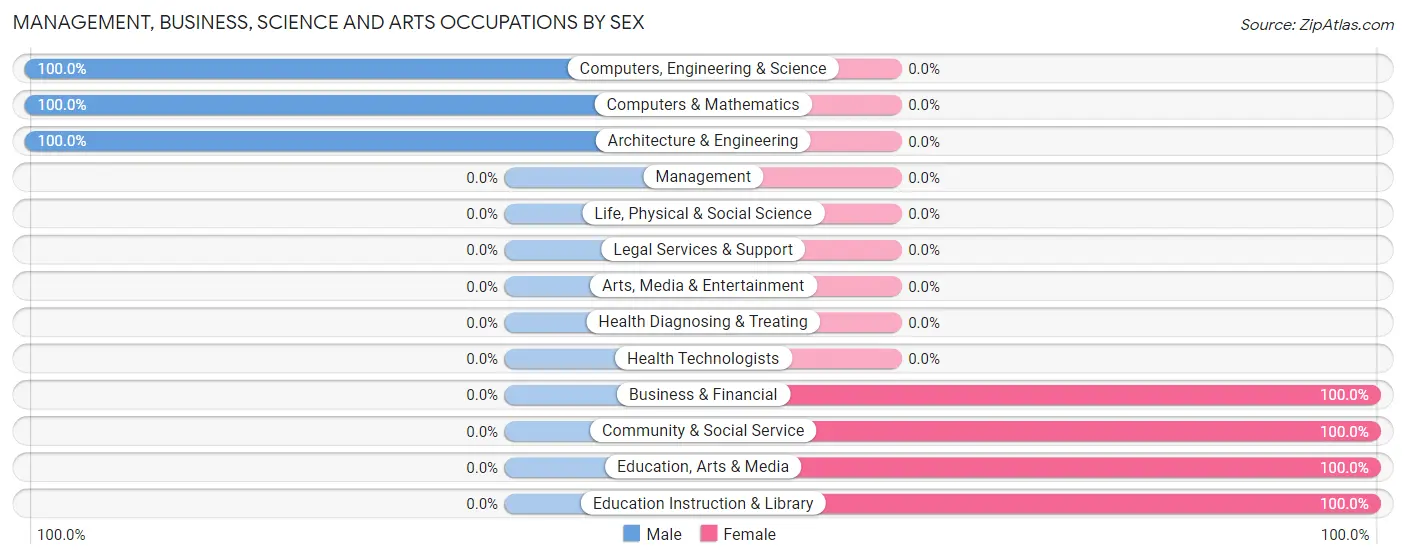
Management, Business, Science and Arts Occupations
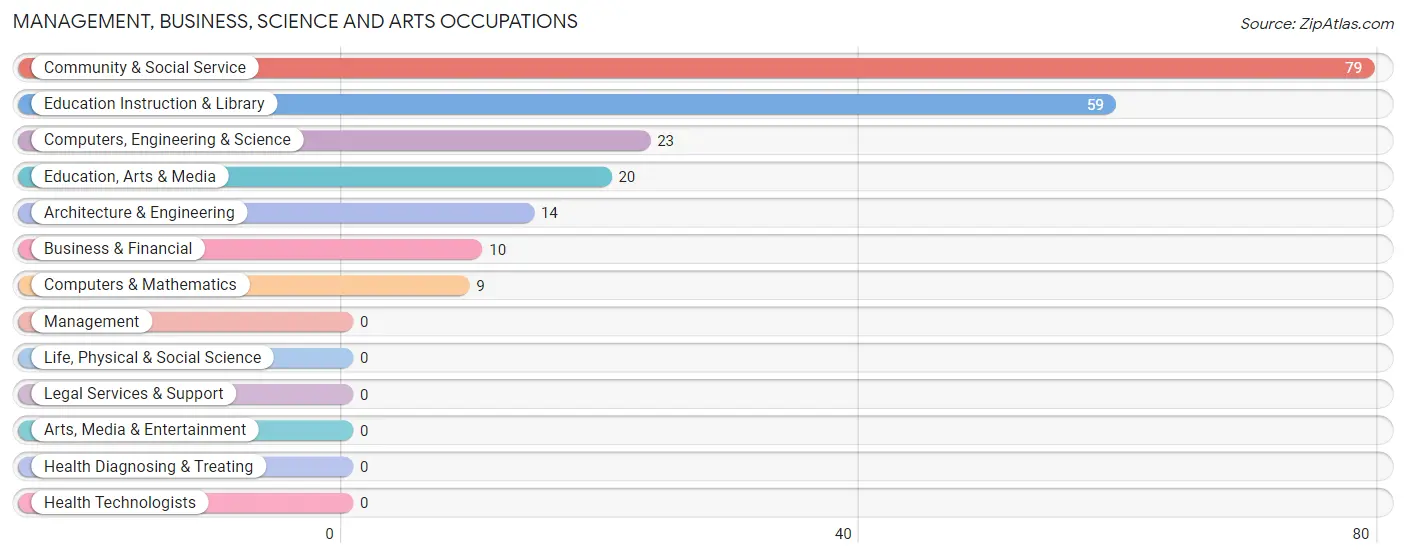
The most common Management, Business, Science and Arts occupations in Freelandville are Community & Social Service (79 | 32.6%), Education Instruction & Library (59 | 24.4%), Computers, Engineering & Science (23 | 9.5%), Education, Arts & Media (20 | 8.3%), and Architecture & Engineering (14 | 5.8%).
Management, Business, Science and Arts Occupations by Sex
Within the Management, Business, Science and Arts occupations in Freelandville, the most male-oriented occupations are Computers, Engineering & Science (100.0%), Computers & Mathematics (100.0%), and Architecture & Engineering (100.0%), while the most female-oriented occupations are Business & Financial (100.0%), Community & Social Service (100.0%), and Education, Arts & Media (100.0%).
| Occupation | Male | Female |
| Management | 0 (0.0%) | 0 (0.0%) |
| Business & Financial | 0 (0.0%) | 10 (100.0%) |
| Computers, Engineering & Science | 23 (100.0%) | 0 (0.0%) |
| Computers & Mathematics | 9 (100.0%) | 0 (0.0%) |
| Architecture & Engineering | 14 (100.0%) | 0 (0.0%) |
| Life, Physical & Social Science | 0 (0.0%) | 0 (0.0%) |
| Community & Social Service | 0 (0.0%) | 79 (100.0%) |
| Education, Arts & Media | 0 (0.0%) | 20 (100.0%) |
| Legal Services & Support | 0 (0.0%) | 0 (0.0%) |
| Education Instruction & Library | 0 (0.0%) | 59 (100.0%) |
| Arts, Media & Entertainment | 0 (0.0%) | 0 (0.0%) |
| Health Diagnosing & Treating | 0 (0.0%) | 0 (0.0%) |
| Health Technologists | 0 (0.0%) | 0 (0.0%) |
| Total (Category) | 23 (20.5%) | 89 (79.5%) |
| Total (Overall) | 145 (59.9%) | 97 (40.1%) |
Services Occupations
The most common Services occupations in Freelandville are , and Food Preparation & Serving (8 | 3.3%).
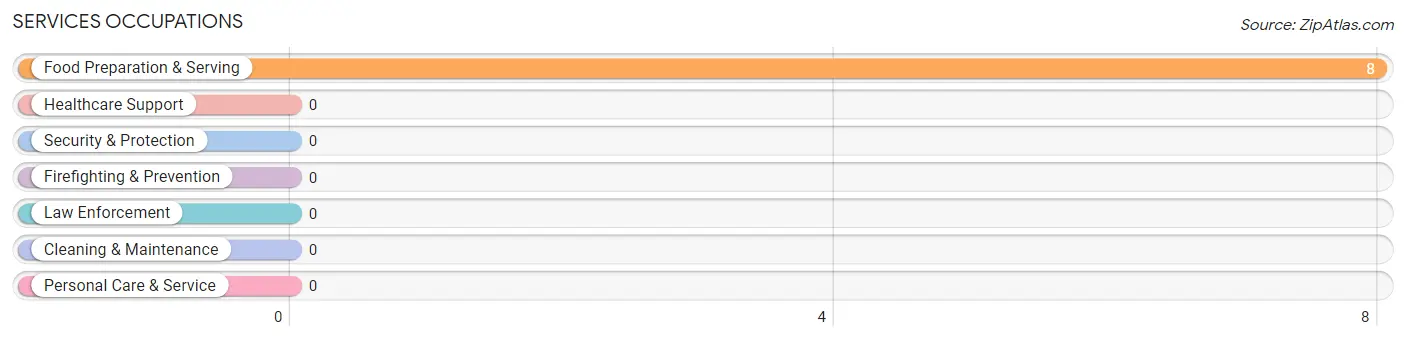
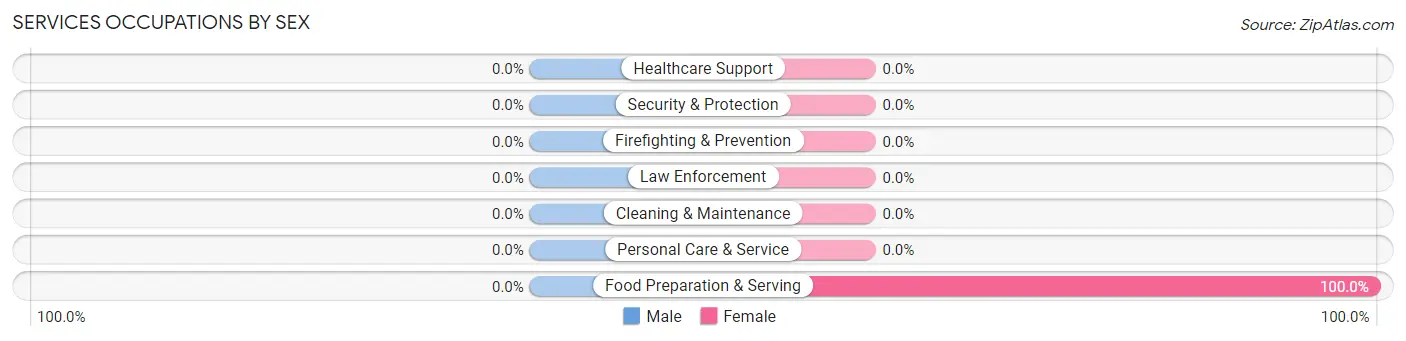
Services Occupations by Sex
| Occupation | Male | Female |
| Healthcare Support | 0 (0.0%) | 0 (0.0%) |
| Security & Protection | 0 (0.0%) | 0 (0.0%) |
| Firefighting & Prevention | 0 (0.0%) | 0 (0.0%) |
| Law Enforcement | 0 (0.0%) | 0 (0.0%) |
| Food Preparation & Serving | 0 (0.0%) | 8 (100.0%) |
| Cleaning & Maintenance | 0 (0.0%) | 0 (0.0%) |
| Personal Care & Service | 0 (0.0%) | 0 (0.0%) |
| Total (Category) | 0 (0.0%) | 8 (100.0%) |
| Total (Overall) | 145 (59.9%) | 97 (40.1%) |
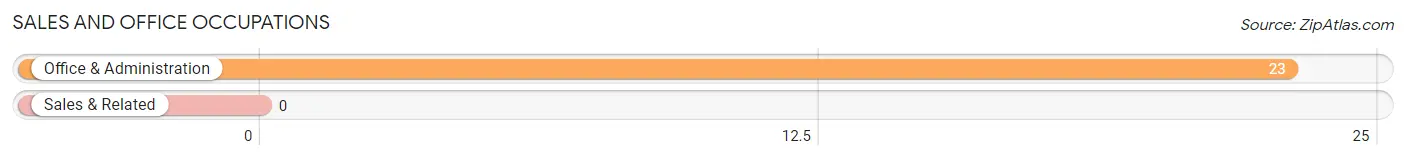
Sales and Office Occupations
The most common Sales and Office occupations in Freelandville are , and Office & Administration (23 | 9.5%).
Sales and Office Occupations by Sex

| Occupation | Male | Female |
| Sales & Related | 0 (0.0%) | 0 (0.0%) |
| Office & Administration | 23 (100.0%) | 0 (0.0%) |
| Total (Category) | 23 (100.0%) | 0 (0.0%) |
| Total (Overall) | 145 (59.9%) | 97 (40.1%) |
Natural Resources, Construction and Maintenance Occupations
The most common Natural Resources, Construction and Maintenance occupations in Freelandville are Installation, Maintenance & Repair (36 | 14.9%), Construction & Extraction (22 | 9.1%), and Farming, Fishing & Forestry (21 | 8.7%).

Natural Resources, Construction and Maintenance Occupations by Sex

| Occupation | Male | Female |
| Farming, Fishing & Forestry | 21 (100.0%) | 0 (0.0%) |
| Construction & Extraction | 22 (100.0%) | 0 (0.0%) |
| Installation, Maintenance & Repair | 36 (100.0%) | 0 (0.0%) |
| Total (Category) | 79 (100.0%) | 0 (0.0%) |
| Total (Overall) | 145 (59.9%) | 97 (40.1%) |
Production, Transportation and Moving Occupations
The most common Production, Transportation and Moving occupations in Freelandville are Material Moving (12 | 5.0%), and Transportation (8 | 3.3%).
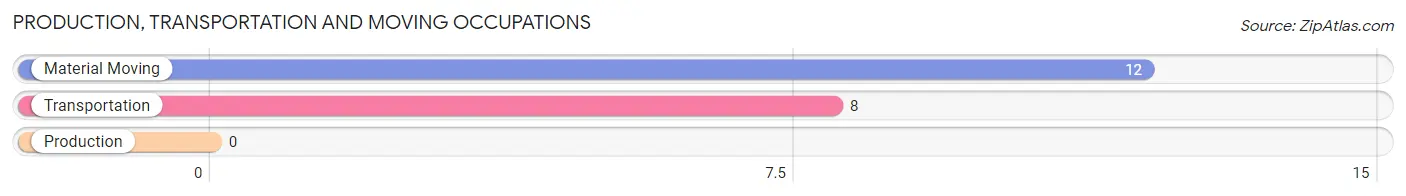
Production, Transportation and Moving Occupations by Sex
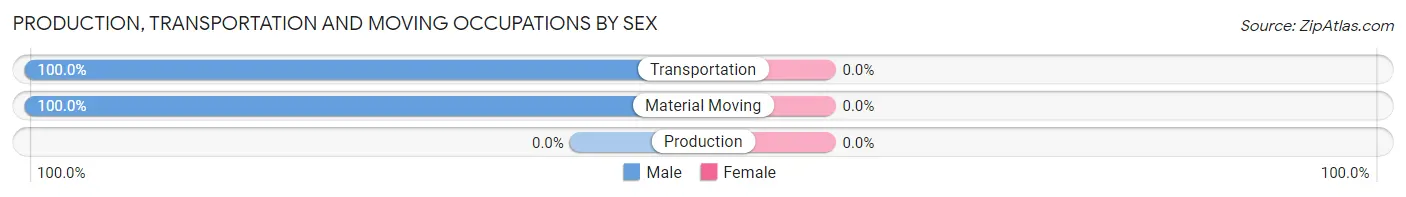
| Occupation | Male | Female |
| Production | 0 (0.0%) | 0 (0.0%) |
| Transportation | 8 (100.0%) | 0 (0.0%) |
| Material Moving | 12 (100.0%) | 0 (0.0%) |
| Total (Category) | 20 (100.0%) | 0 (0.0%) |
| Total (Overall) | 145 (59.9%) | 97 (40.1%) |
Employment Industries by Sex in Freelandville
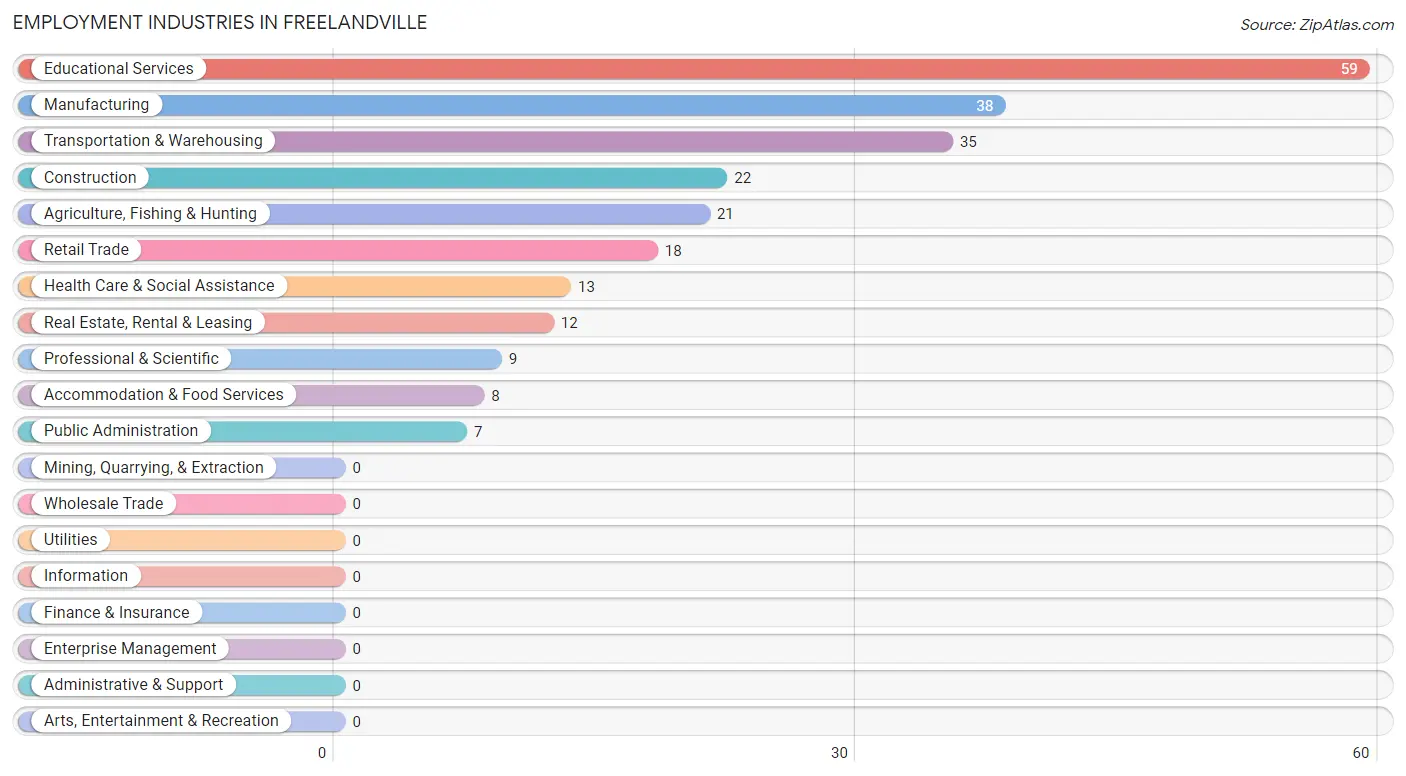
Employment Industries in Freelandville
The major employment industries in Freelandville include Educational Services (59 | 24.4%), Manufacturing (38 | 15.7%), Transportation & Warehousing (35 | 14.5%), Construction (22 | 9.1%), and Agriculture, Fishing & Hunting (21 | 8.7%).
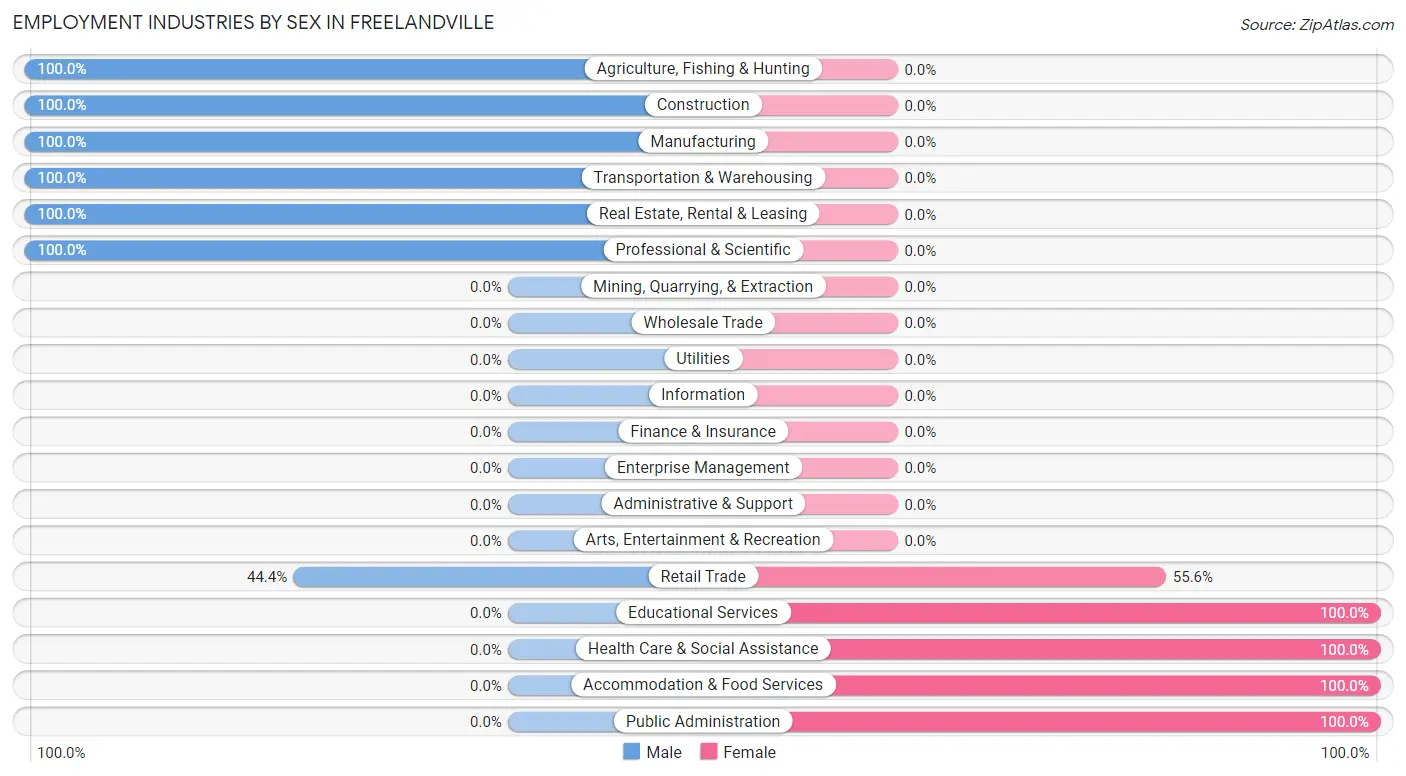
Employment Industries by Sex in Freelandville
The Freelandville industries that see more men than women are Agriculture, Fishing & Hunting (100.0%), Construction (100.0%), and Manufacturing (100.0%), whereas the industries that tend to have a higher number of women are Educational Services (100.0%), Health Care & Social Assistance (100.0%), and Accommodation & Food Services (100.0%).
| Industry | Male | Female |
| Agriculture, Fishing & Hunting | 21 (100.0%) | 0 (0.0%) |
| Mining, Quarrying, & Extraction | 0 (0.0%) | 0 (0.0%) |
| Construction | 22 (100.0%) | 0 (0.0%) |
| Manufacturing | 38 (100.0%) | 0 (0.0%) |
| Wholesale Trade | 0 (0.0%) | 0 (0.0%) |
| Retail Trade | 8 (44.4%) | 10 (55.6%) |
| Transportation & Warehousing | 35 (100.0%) | 0 (0.0%) |
| Utilities | 0 (0.0%) | 0 (0.0%) |
| Information | 0 (0.0%) | 0 (0.0%) |
| Finance & Insurance | 0 (0.0%) | 0 (0.0%) |
| Real Estate, Rental & Leasing | 12 (100.0%) | 0 (0.0%) |
| Professional & Scientific | 9 (100.0%) | 0 (0.0%) |
| Enterprise Management | 0 (0.0%) | 0 (0.0%) |
| Administrative & Support | 0 (0.0%) | 0 (0.0%) |
| Educational Services | 0 (0.0%) | 59 (100.0%) |
| Health Care & Social Assistance | 0 (0.0%) | 13 (100.0%) |
| Arts, Entertainment & Recreation | 0 (0.0%) | 0 (0.0%) |
| Accommodation & Food Services | 0 (0.0%) | 8 (100.0%) |
| Public Administration | 0 (0.0%) | 7 (100.0%) |
| Total | 145 (59.9%) | 97 (40.1%) |
Education in Freelandville
School Enrollment in Freelandville
The most common levels of schooling among the 231 students in Freelandville are high school (74 | 32.0%), middle school (49 | 21.2%), and elementary school (47 | 20.3%).
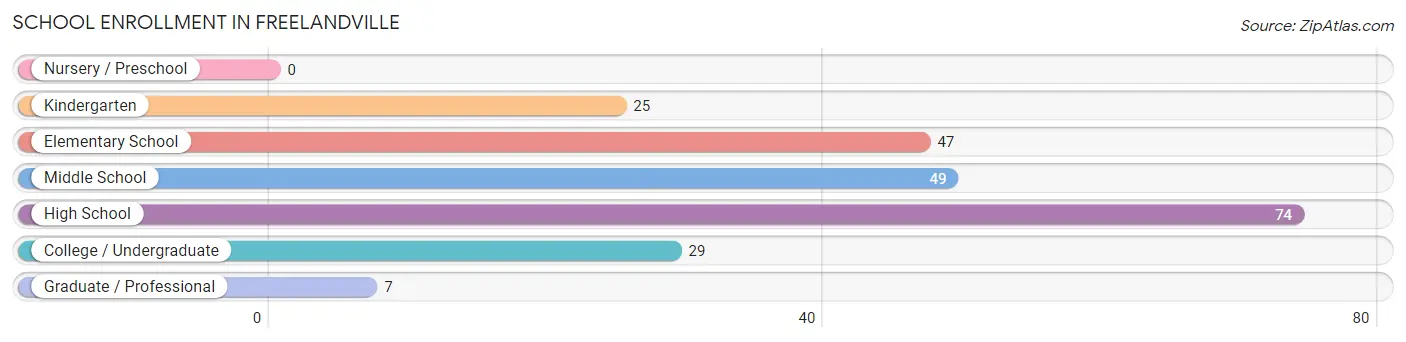
| School Level | # Students | % Students |
| Nursery / Preschool | 0 | 0.0% |
| Kindergarten | 25 | 10.8% |
| Elementary School | 47 | 20.3% |
| Middle School | 49 | 21.2% |
| High School | 74 | 32.0% |
| College / Undergraduate | 29 | 12.6% |
| Graduate / Professional | 7 | 3.0% |
| Total | 231 | 100.0% |
School Enrollment by Age by Funding Source in Freelandville
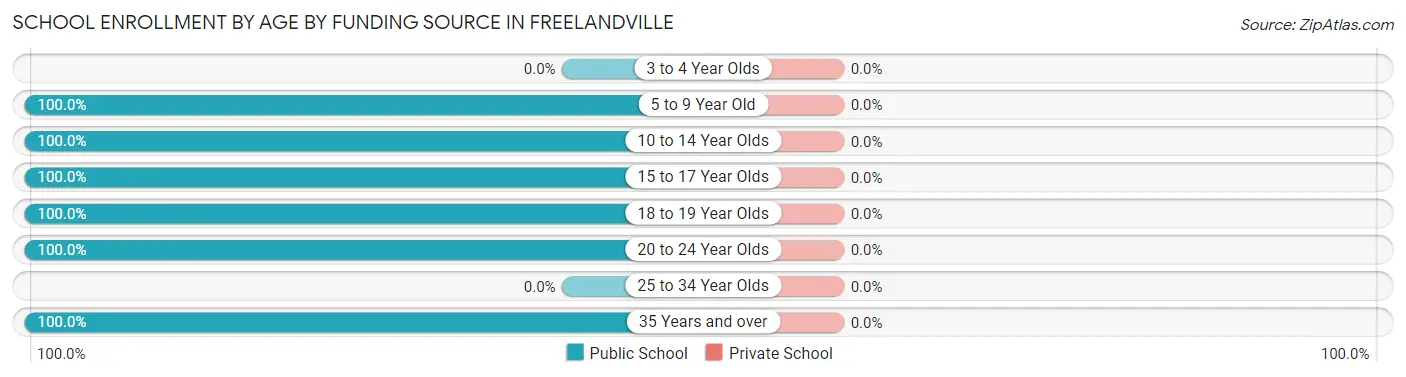
| Age Bracket | Public School | Private School |
| 3 to 4 Year Olds | 0 (0.0%) | 0 (0.0%) |
| 5 to 9 Year Old | 72 (100.0%) | 0 (0.0%) |
| 10 to 14 Year Olds | 72 (100.0%) | 0 (0.0%) |
| 15 to 17 Year Olds | 40 (100.0%) | 0 (0.0%) |
| 18 to 19 Year Olds | 21 (100.0%) | 0 (0.0%) |
| 20 to 24 Year Olds | 7 (100.0%) | 0 (0.0%) |
| 25 to 34 Year Olds | 0 (0.0%) | 0 (0.0%) |
| 35 Years and over | 19 (100.0%) | 0 (0.0%) |
| Total | 231 (100.0%) | 0 (0.0%) |
Educational Attainment by Field of Study in Freelandville
Education (45 | 48.9%), business (18 | 19.6%), social sciences (10 | 10.9%), science & technology (10 | 10.9%), and computers & mathematics (9 | 9.8%) are the most common fields of study among 92 individuals in Freelandville who have obtained a bachelor's degree or higher.
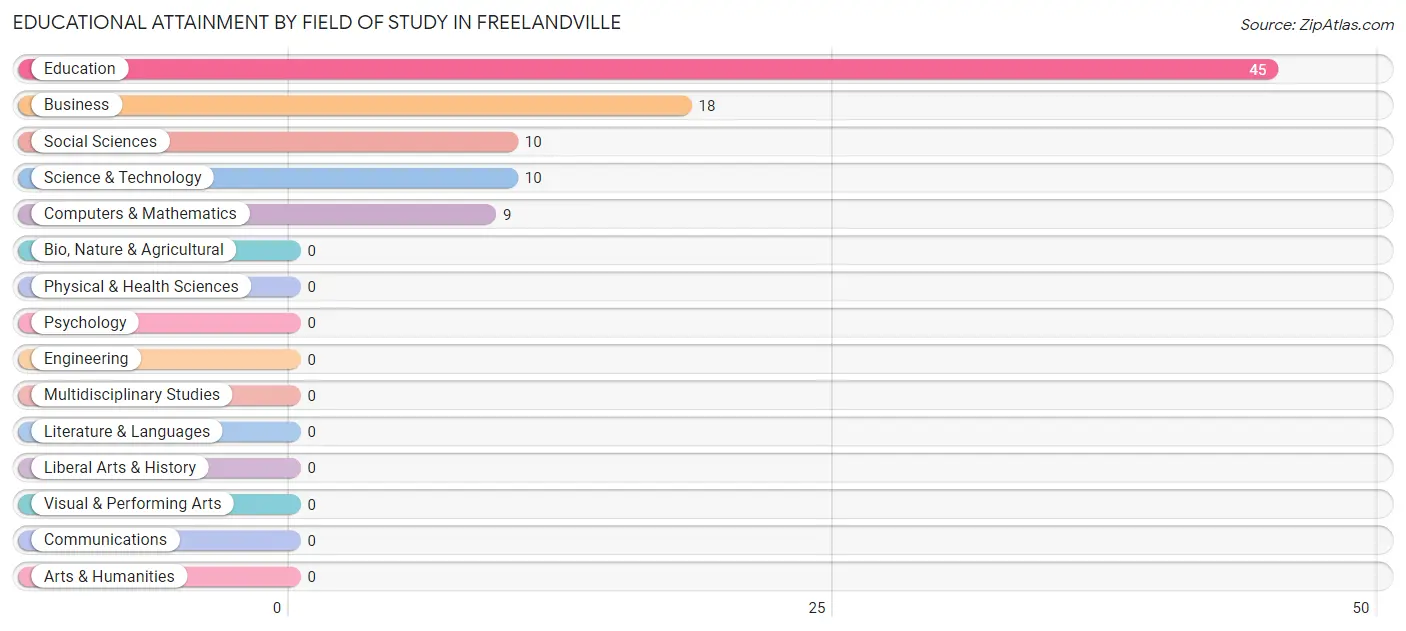
| Field of Study | # Graduates | % Graduates |
| Computers & Mathematics | 9 | 9.8% |
| Bio, Nature & Agricultural | 0 | 0.0% |
| Physical & Health Sciences | 0 | 0.0% |
| Psychology | 0 | 0.0% |
| Social Sciences | 10 | 10.9% |
| Engineering | 0 | 0.0% |
| Multidisciplinary Studies | 0 | 0.0% |
| Science & Technology | 10 | 10.9% |
| Business | 18 | 19.6% |
| Education | 45 | 48.9% |
| Literature & Languages | 0 | 0.0% |
| Liberal Arts & History | 0 | 0.0% |
| Visual & Performing Arts | 0 | 0.0% |
| Communications | 0 | 0.0% |
| Arts & Humanities | 0 | 0.0% |
| Total | 92 | 100.0% |
Transportation & Commute in Freelandville
Vehicle Availability by Sex in Freelandville
The most prevalent vehicle ownership categories in Freelandville are males with 2 vehicles (62, accounting for 46.6%) and females with 2 vehicles (47, making up 63.9%).
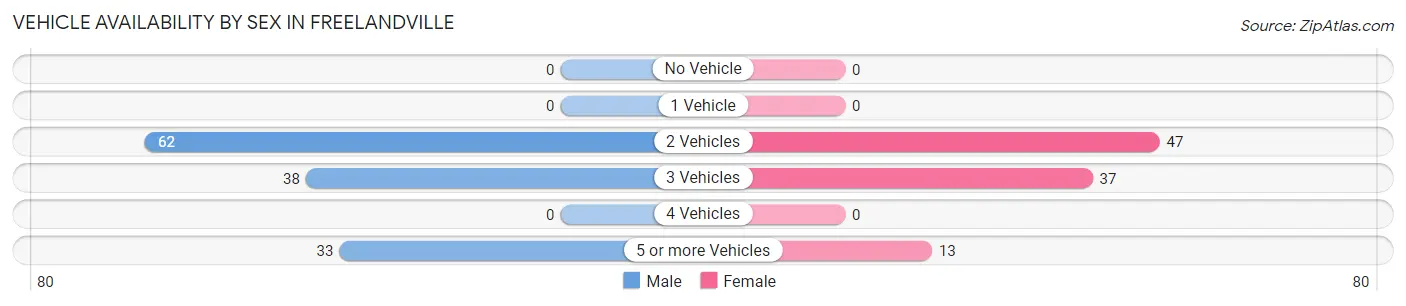
| Vehicles Available | Male | Female |
| No Vehicle | 0 (0.0%) | 0 (0.0%) |
| 1 Vehicle | 0 (0.0%) | 0 (0.0%) |
| 2 Vehicles | 62 (46.6%) | 47 (48.4%) |
| 3 Vehicles | 38 (28.6%) | 37 (38.1%) |
| 4 Vehicles | 0 (0.0%) | 0 (0.0%) |
| 5 or more Vehicles | 33 (24.8%) | 13 (13.4%) |
| Total | 133 (100.0%) | 97 (100.0%) |
Commute Time in Freelandville
The most frequently occuring commute durations in Freelandville are 10 to 14 minutes (50 commuters, 21.7%), 30 to 34 minutes (36 commuters, 15.7%), and less than 5 minutes (34 commuters, 14.8%).
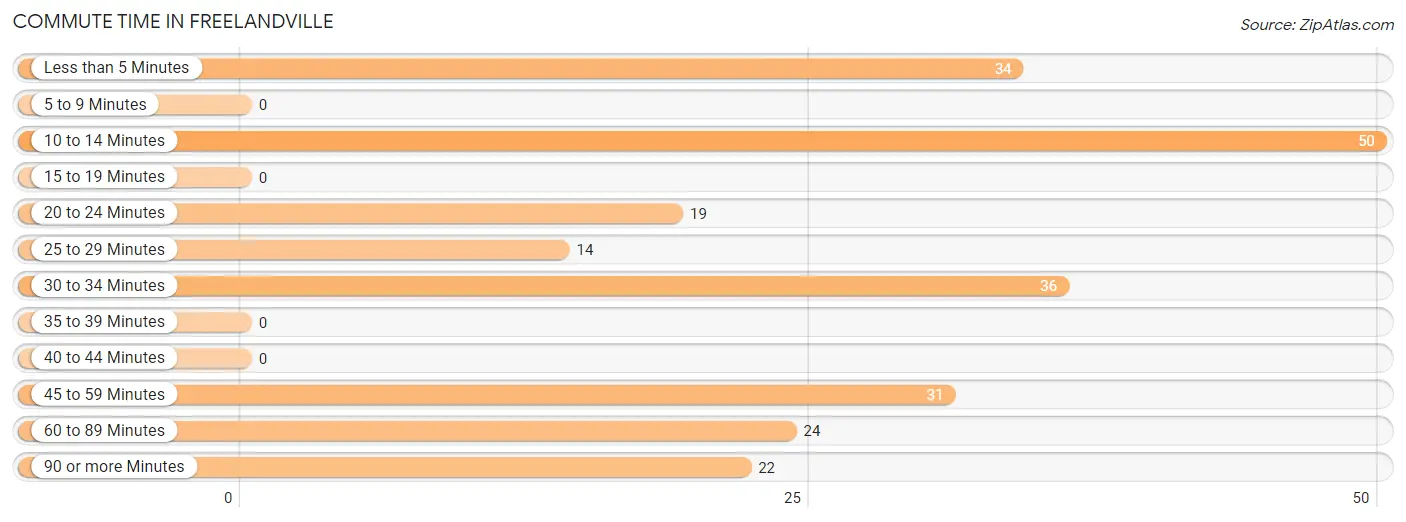
| Commute Time | # Commuters | % Commuters |
| Less than 5 Minutes | 34 | 14.8% |
| 5 to 9 Minutes | 0 | 0.0% |
| 10 to 14 Minutes | 50 | 21.7% |
| 15 to 19 Minutes | 0 | 0.0% |
| 20 to 24 Minutes | 19 | 8.3% |
| 25 to 29 Minutes | 14 | 6.1% |
| 30 to 34 Minutes | 36 | 15.7% |
| 35 to 39 Minutes | 0 | 0.0% |
| 40 to 44 Minutes | 0 | 0.0% |
| 45 to 59 Minutes | 31 | 13.5% |
| 60 to 89 Minutes | 24 | 10.4% |
| 90 or more Minutes | 22 | 9.6% |
Commute Time by Sex in Freelandville
The most common commute times in Freelandville are 60 to 89 minutes (24 commuters, 18.0%) for males and 10 to 14 minutes (27 commuters, 27.8%) for females.
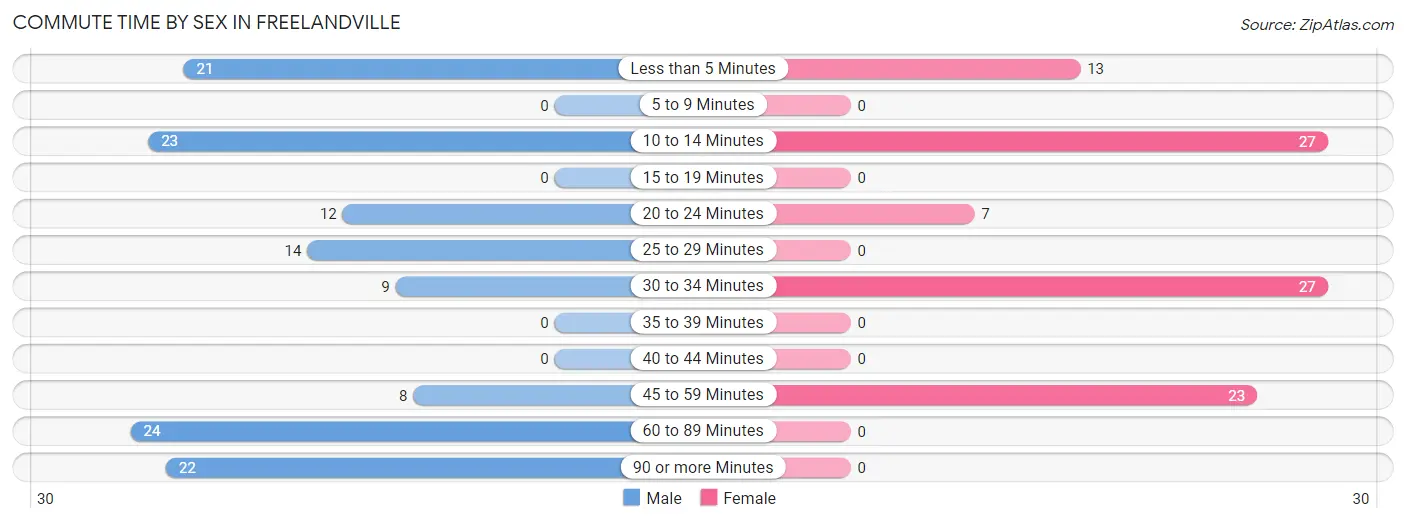
| Commute Time | Male | Female |
| Less than 5 Minutes | 21 (15.8%) | 13 (13.4%) |
| 5 to 9 Minutes | 0 (0.0%) | 0 (0.0%) |
| 10 to 14 Minutes | 23 (17.3%) | 27 (27.8%) |
| 15 to 19 Minutes | 0 (0.0%) | 0 (0.0%) |
| 20 to 24 Minutes | 12 (9.0%) | 7 (7.2%) |
| 25 to 29 Minutes | 14 (10.5%) | 0 (0.0%) |
| 30 to 34 Minutes | 9 (6.8%) | 27 (27.8%) |
| 35 to 39 Minutes | 0 (0.0%) | 0 (0.0%) |
| 40 to 44 Minutes | 0 (0.0%) | 0 (0.0%) |
| 45 to 59 Minutes | 8 (6.0%) | 23 (23.7%) |
| 60 to 89 Minutes | 24 (18.0%) | 0 (0.0%) |
| 90 or more Minutes | 22 (16.5%) | 0 (0.0%) |
Time of Departure to Work by Sex in Freelandville
The most frequent times of departure to work in Freelandville are 7:00 AM to 7:29 AM (37, 27.8%) for males and 7:30 AM to 7:59 AM (48, 49.5%) for females.
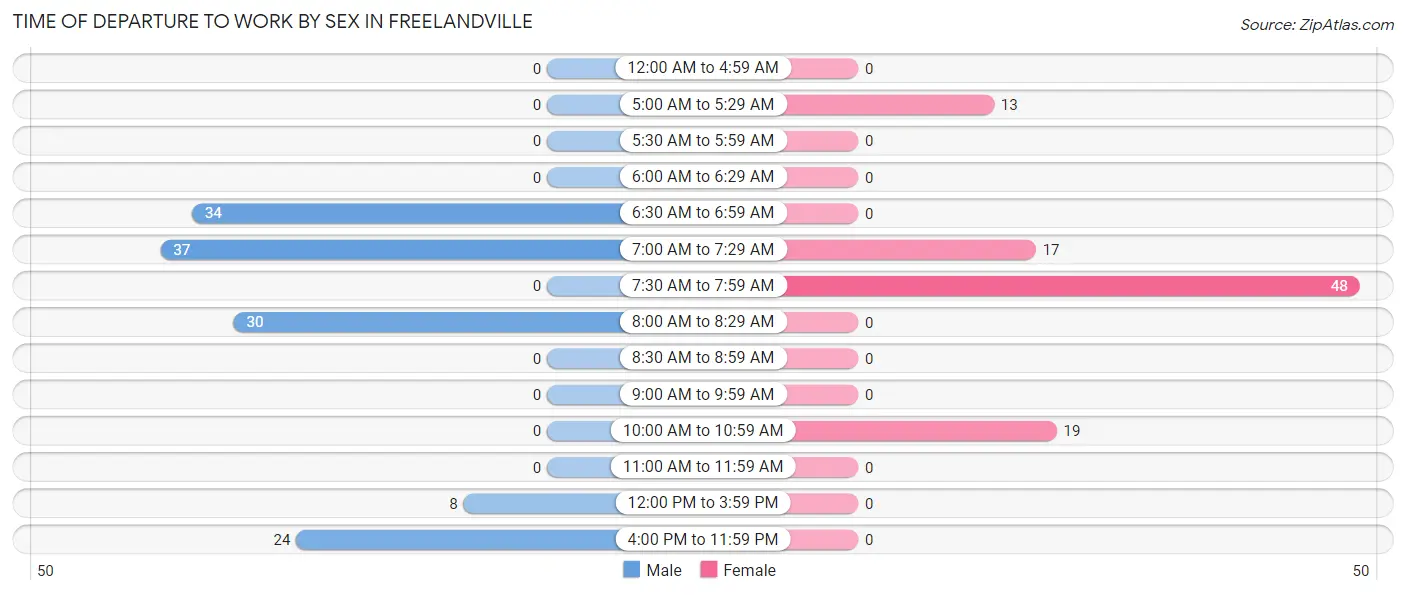
| Time of Departure | Male | Female |
| 12:00 AM to 4:59 AM | 0 (0.0%) | 0 (0.0%) |
| 5:00 AM to 5:29 AM | 0 (0.0%) | 13 (13.4%) |
| 5:30 AM to 5:59 AM | 0 (0.0%) | 0 (0.0%) |
| 6:00 AM to 6:29 AM | 0 (0.0%) | 0 (0.0%) |
| 6:30 AM to 6:59 AM | 34 (25.6%) | 0 (0.0%) |
| 7:00 AM to 7:29 AM | 37 (27.8%) | 17 (17.5%) |
| 7:30 AM to 7:59 AM | 0 (0.0%) | 48 (49.5%) |
| 8:00 AM to 8:29 AM | 30 (22.6%) | 0 (0.0%) |
| 8:30 AM to 8:59 AM | 0 (0.0%) | 0 (0.0%) |
| 9:00 AM to 9:59 AM | 0 (0.0%) | 0 (0.0%) |
| 10:00 AM to 10:59 AM | 0 (0.0%) | 19 (19.6%) |
| 11:00 AM to 11:59 AM | 0 (0.0%) | 0 (0.0%) |
| 12:00 PM to 3:59 PM | 8 (6.0%) | 0 (0.0%) |
| 4:00 PM to 11:59 PM | 24 (18.0%) | 0 (0.0%) |
| Total | 133 (100.0%) | 97 (100.0%) |
Housing Occupancy in Freelandville
Occupancy by Ownership in Freelandville
Of the total 262 dwellings in Freelandville, owner-occupied units account for 182 (69.5%), while renter-occupied units make up 80 (30.5%).
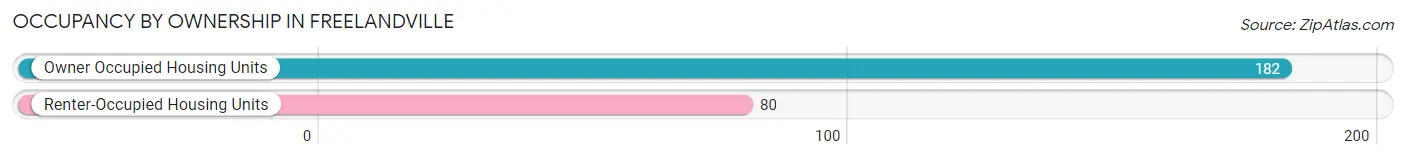
| Occupancy | # Housing Units | % Housing Units |
| Owner Occupied Housing Units | 182 | 69.5% |
| Renter-Occupied Housing Units | 80 | 30.5% |
| Total Occupied Housing Units | 262 | 100.0% |
Occupancy by Household Size in Freelandville
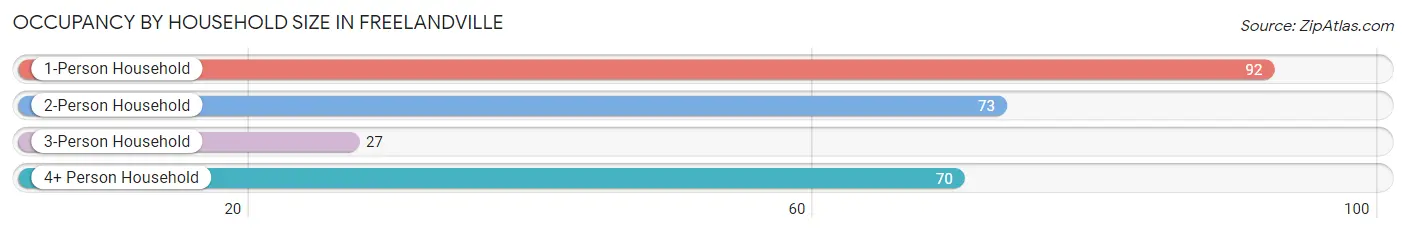
| Household Size | # Housing Units | % Housing Units |
| 1-Person Household | 92 | 35.1% |
| 2-Person Household | 73 | 27.9% |
| 3-Person Household | 27 | 10.3% |
| 4+ Person Household | 70 | 26.7% |
| Total Housing Units | 262 | 100.0% |
Occupancy by Ownership by Household Size in Freelandville
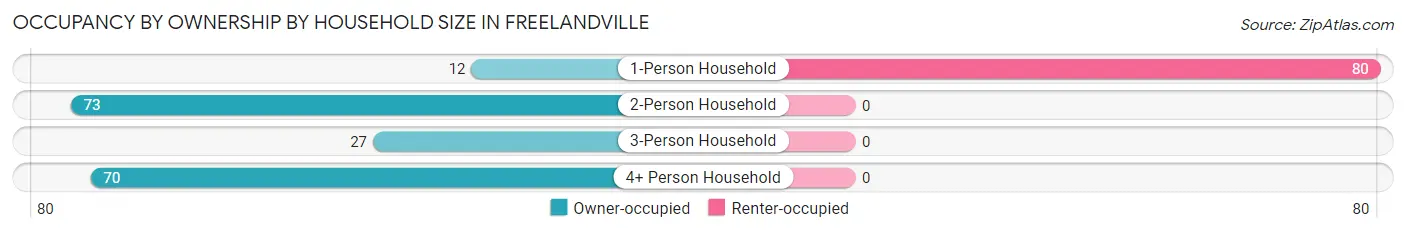
| Household Size | Owner-occupied | Renter-occupied |
| 1-Person Household | 12 (13.0%) | 80 (87.0%) |
| 2-Person Household | 73 (100.0%) | 0 (0.0%) |
| 3-Person Household | 27 (100.0%) | 0 (0.0%) |
| 4+ Person Household | 70 (100.0%) | 0 (0.0%) |
| Total Housing Units | 182 (69.5%) | 80 (30.5%) |
Occupancy by Educational Attainment in Freelandville
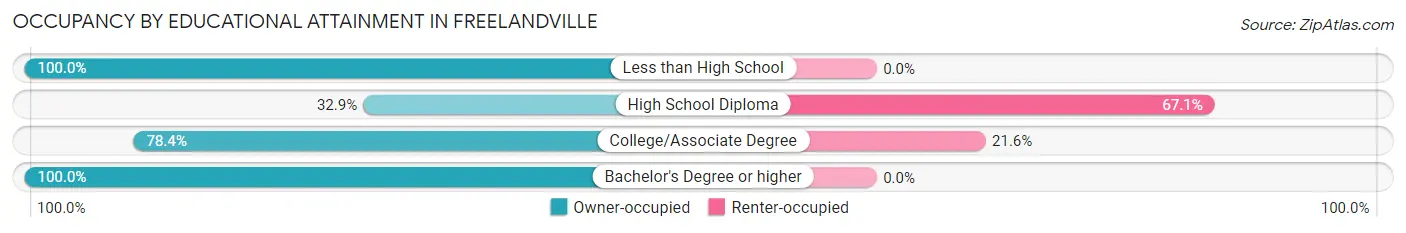
| Household Size | Owner-occupied | Renter-occupied |
| Less than High School | 12 (100.0%) | 0 (0.0%) |
| High School Diploma | 26 (32.9%) | 53 (67.1%) |
| College/Associate Degree | 98 (78.4%) | 27 (21.6%) |
| Bachelor's Degree or higher | 46 (100.0%) | 0 (0.0%) |
Occupancy by Age of Householder in Freelandville
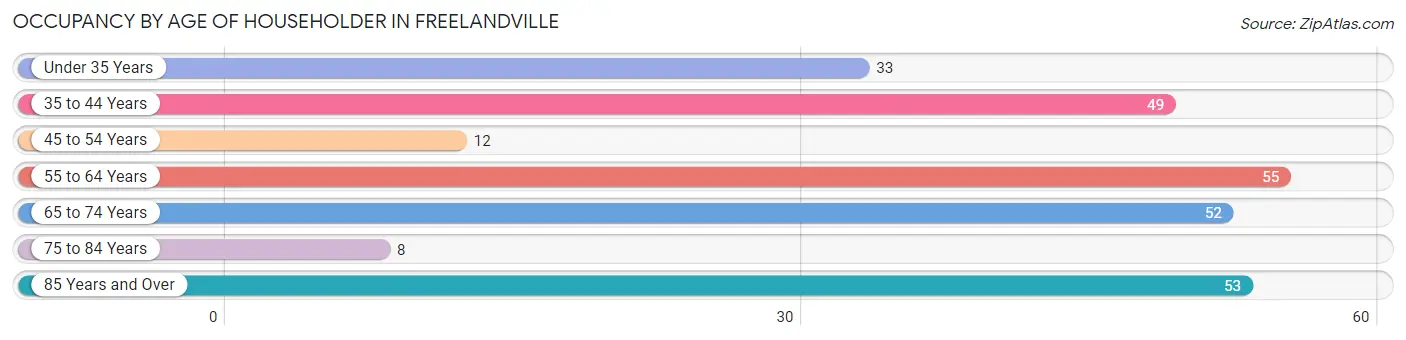
| Age Bracket | # Households | % Households |
| Under 35 Years | 33 | 12.6% |
| 35 to 44 Years | 49 | 18.7% |
| 45 to 54 Years | 12 | 4.6% |
| 55 to 64 Years | 55 | 21.0% |
| 65 to 74 Years | 52 | 19.9% |
| 75 to 84 Years | 8 | 3.0% |
| 85 Years and Over | 53 | 20.2% |
| Total | 262 | 100.0% |
Housing Finances in Freelandville
Median Income by Occupancy in Freelandville
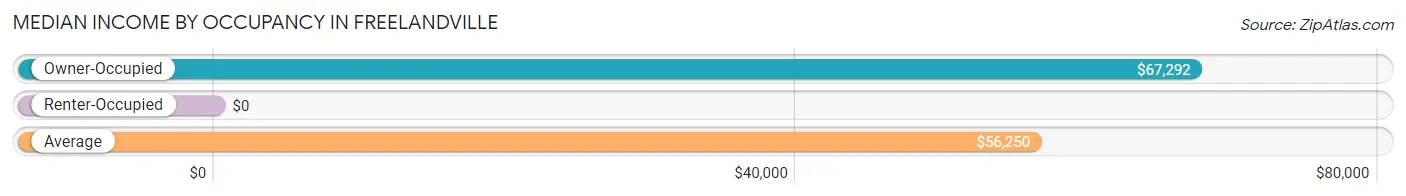
| Occupancy Type | # Households | Median Income |
| Owner-Occupied | 182 (69.5%) | $67,292 |
| Renter-Occupied | 80 (30.5%) | $0 |
| Average | 262 (100.0%) | $56,250 |
Occupancy by Householder Income Bracket in Freelandville
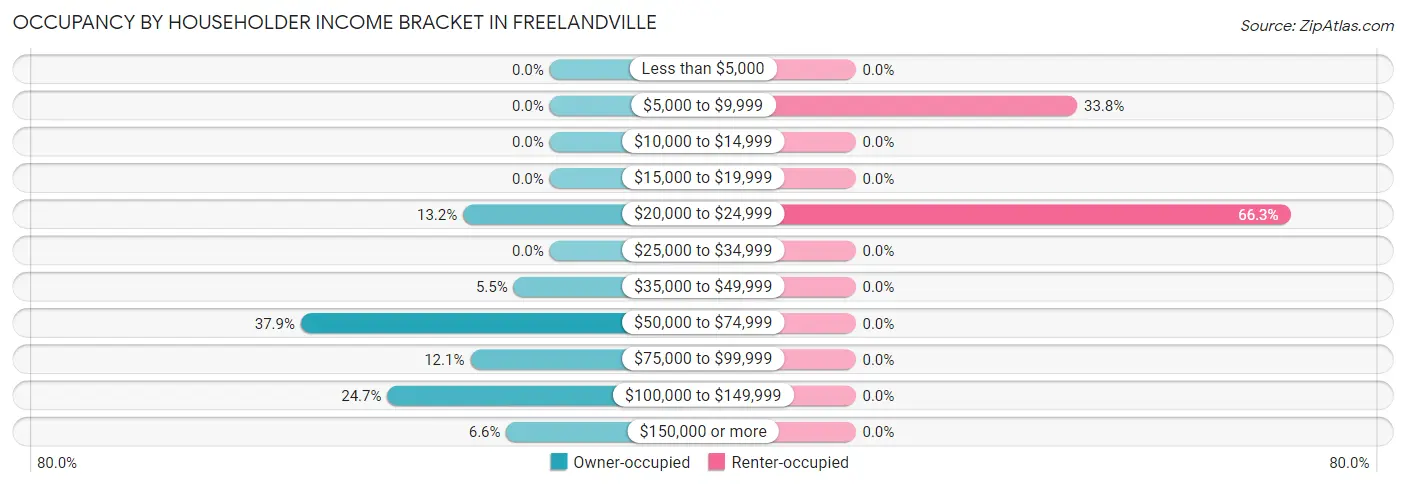
| Income Bracket | Owner-occupied | Renter-occupied |
| Less than $5,000 | 0 (0.0%) | 0 (0.0%) |
| $5,000 to $9,999 | 0 (0.0%) | 27 (33.8%) |
| $10,000 to $14,999 | 0 (0.0%) | 0 (0.0%) |
| $15,000 to $19,999 | 0 (0.0%) | 0 (0.0%) |
| $20,000 to $24,999 | 24 (13.2%) | 53 (66.2%) |
| $25,000 to $34,999 | 0 (0.0%) | 0 (0.0%) |
| $35,000 to $49,999 | 10 (5.5%) | 0 (0.0%) |
| $50,000 to $74,999 | 69 (37.9%) | 0 (0.0%) |
| $75,000 to $99,999 | 22 (12.1%) | 0 (0.0%) |
| $100,000 to $149,999 | 45 (24.7%) | 0 (0.0%) |
| $150,000 or more | 12 (6.6%) | 0 (0.0%) |
| Total | 182 (100.0%) | 80 (100.0%) |
Monthly Housing Cost Tiers in Freelandville
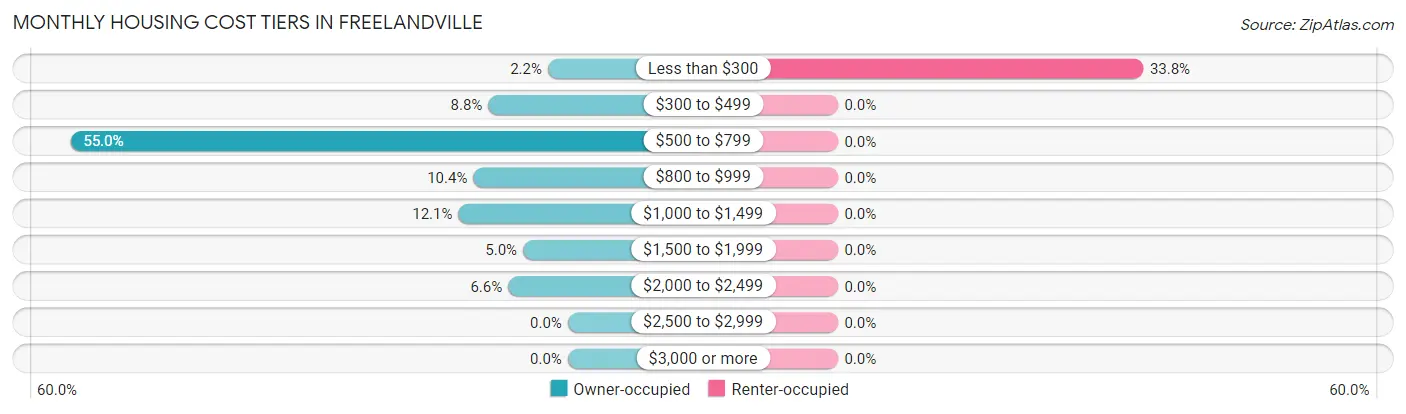
| Monthly Cost | Owner-occupied | Renter-occupied |
| Less than $300 | 4 (2.2%) | 27 (33.8%) |
| $300 to $499 | 16 (8.8%) | 0 (0.0%) |
| $500 to $799 | 100 (54.9%) | 0 (0.0%) |
| $800 to $999 | 19 (10.4%) | 0 (0.0%) |
| $1,000 to $1,499 | 22 (12.1%) | 0 (0.0%) |
| $1,500 to $1,999 | 9 (5.0%) | 0 (0.0%) |
| $2,000 to $2,499 | 12 (6.6%) | 0 (0.0%) |
| $2,500 to $2,999 | 0 (0.0%) | 0 (0.0%) |
| $3,000 or more | 0 (0.0%) | 0 (0.0%) |
| Total | 182 (100.0%) | 80 (100.0%) |
Physical Housing Characteristics in Freelandville
Housing Structures in Freelandville
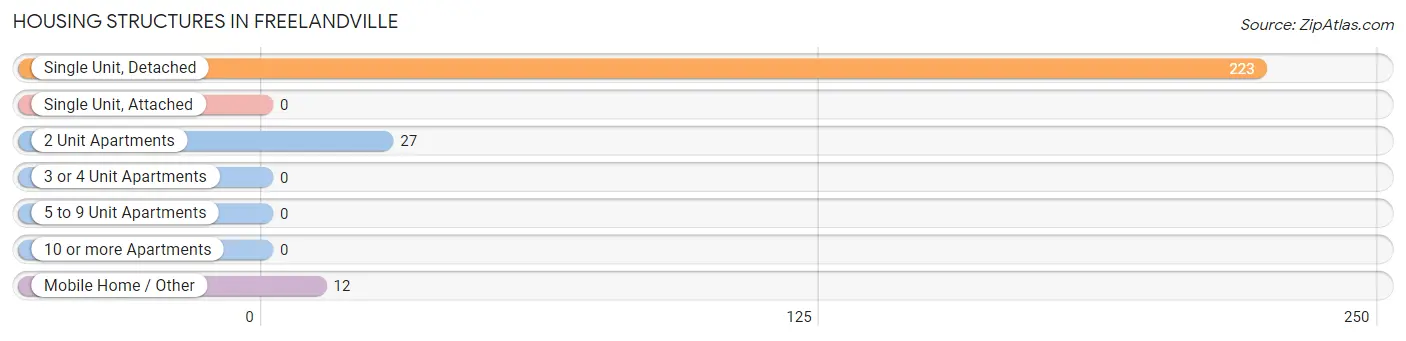
| Structure Type | # Housing Units | % Housing Units |
| Single Unit, Detached | 223 | 85.1% |
| Single Unit, Attached | 0 | 0.0% |
| 2 Unit Apartments | 27 | 10.3% |
| 3 or 4 Unit Apartments | 0 | 0.0% |
| 5 to 9 Unit Apartments | 0 | 0.0% |
| 10 or more Apartments | 0 | 0.0% |
| Mobile Home / Other | 12 | 4.6% |
| Total | 262 | 100.0% |
Housing Structures by Occupancy in Freelandville
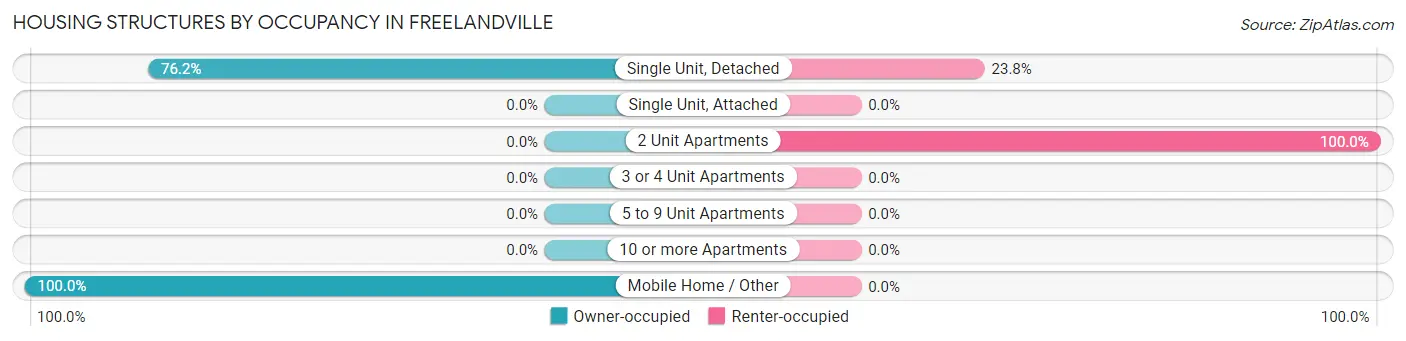
| Structure Type | Owner-occupied | Renter-occupied |
| Single Unit, Detached | 170 (76.2%) | 53 (23.8%) |
| Single Unit, Attached | 0 (0.0%) | 0 (0.0%) |
| 2 Unit Apartments | 0 (0.0%) | 27 (100.0%) |
| 3 or 4 Unit Apartments | 0 (0.0%) | 0 (0.0%) |
| 5 to 9 Unit Apartments | 0 (0.0%) | 0 (0.0%) |
| 10 or more Apartments | 0 (0.0%) | 0 (0.0%) |
| Mobile Home / Other | 12 (100.0%) | 0 (0.0%) |
| Total | 182 (69.5%) | 80 (30.5%) |
Housing Structures by Number of Rooms in Freelandville
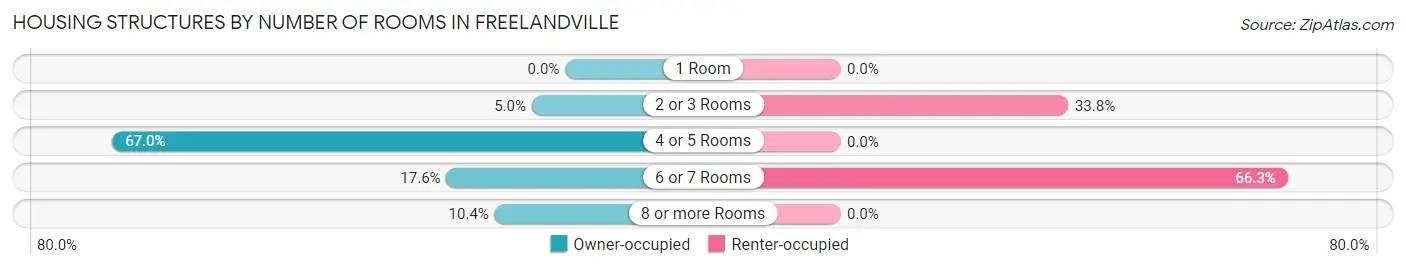
| Number of Rooms | Owner-occupied | Renter-occupied |
| 1 Room | 0 (0.0%) | 0 (0.0%) |
| 2 or 3 Rooms | 9 (5.0%) | 27 (33.8%) |
| 4 or 5 Rooms | 122 (67.0%) | 0 (0.0%) |
| 6 or 7 Rooms | 32 (17.6%) | 53 (66.2%) |
| 8 or more Rooms | 19 (10.4%) | 0 (0.0%) |
| Total | 182 (100.0%) | 80 (100.0%) |
Housing Structure by Heating Type in Freelandville
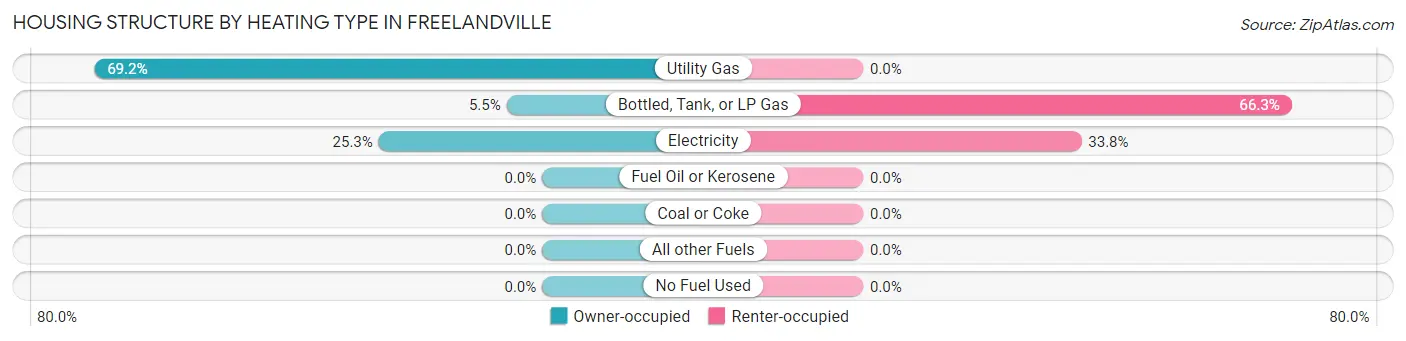
| Heating Type | Owner-occupied | Renter-occupied |
| Utility Gas | 126 (69.2%) | 0 (0.0%) |
| Bottled, Tank, or LP Gas | 10 (5.5%) | 53 (66.2%) |
| Electricity | 46 (25.3%) | 27 (33.8%) |
| Fuel Oil or Kerosene | 0 (0.0%) | 0 (0.0%) |
| Coal or Coke | 0 (0.0%) | 0 (0.0%) |
| All other Fuels | 0 (0.0%) | 0 (0.0%) |
| No Fuel Used | 0 (0.0%) | 0 (0.0%) |
| Total | 182 (100.0%) | 80 (100.0%) |
Household Vehicle Usage in Freelandville
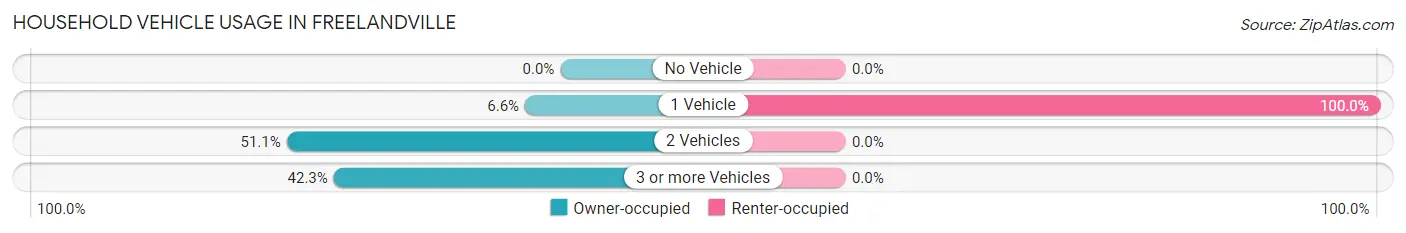
| Vehicles per Household | Owner-occupied | Renter-occupied |
| No Vehicle | 0 (0.0%) | 0 (0.0%) |
| 1 Vehicle | 12 (6.6%) | 80 (100.0%) |
| 2 Vehicles | 93 (51.1%) | 0 (0.0%) |
| 3 or more Vehicles | 77 (42.3%) | 0 (0.0%) |
| Total | 182 (100.0%) | 80 (100.0%) |
Real Estate & Mortgages in Freelandville
Real Estate and Mortgage Overview in Freelandville
| Characteristic | Without Mortgage | With Mortgage |
| Housing Units | 93 | 89 |
| Median Property Value | - | - |
| Median Household Income | $66,157 | $12 |
| Monthly Housing Costs | $607 | $0 |
| Real Estate Taxes | $536 | $0 |
Property Value by Mortgage Status in Freelandville
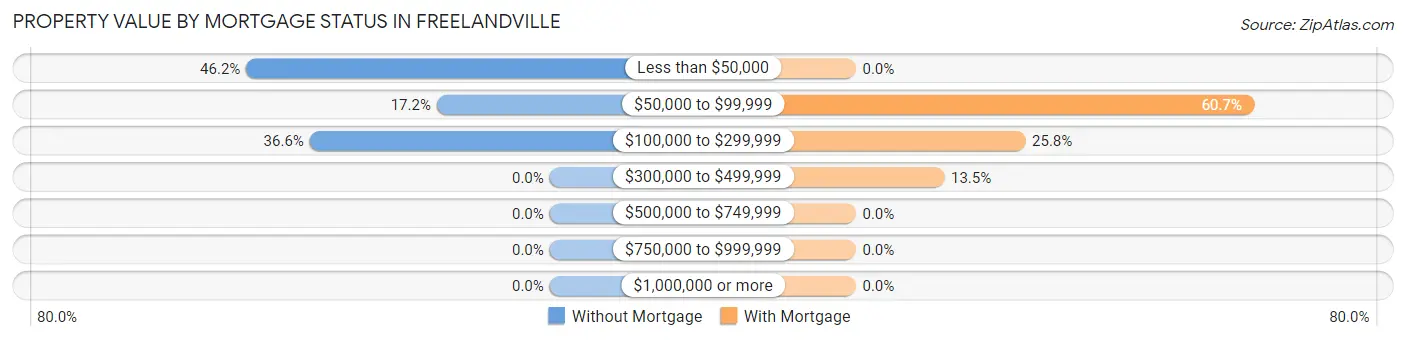
| Property Value | Without Mortgage | With Mortgage |
| Less than $50,000 | 43 (46.2%) | 0 (0.0%) |
| $50,000 to $99,999 | 16 (17.2%) | 54 (60.7%) |
| $100,000 to $299,999 | 34 (36.6%) | 23 (25.8%) |
| $300,000 to $499,999 | 0 (0.0%) | 12 (13.5%) |
| $500,000 to $749,999 | 0 (0.0%) | 0 (0.0%) |
| $750,000 to $999,999 | 0 (0.0%) | 0 (0.0%) |
| $1,000,000 or more | 0 (0.0%) | 0 (0.0%) |
| Total | 93 (100.0%) | 89 (100.0%) |
Household Income by Mortgage Status in Freelandville
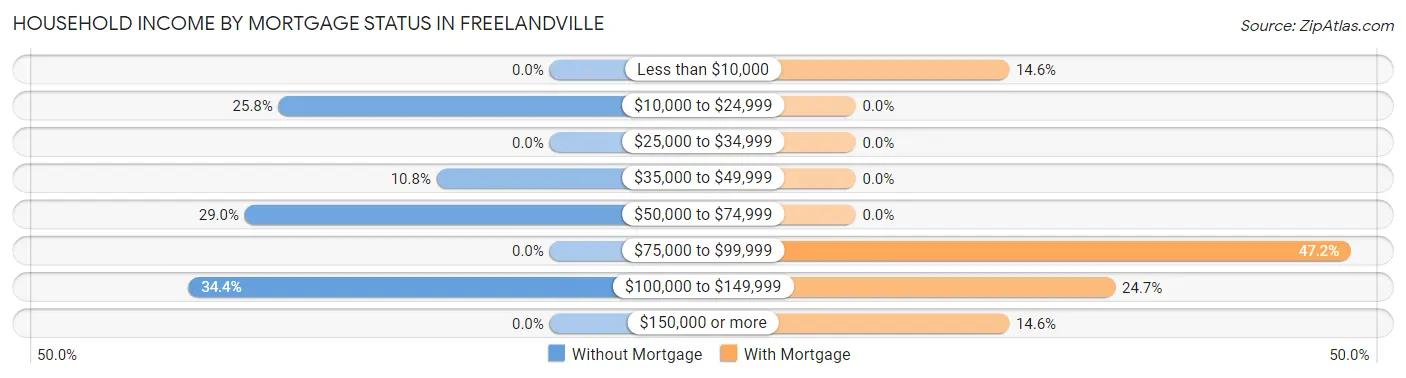
| Household Income | Without Mortgage | With Mortgage |
| Less than $10,000 | 0 (0.0%) | 13 (14.6%) |
| $10,000 to $24,999 | 24 (25.8%) | 0 (0.0%) |
| $25,000 to $34,999 | 0 (0.0%) | 0 (0.0%) |
| $35,000 to $49,999 | 10 (10.7%) | 0 (0.0%) |
| $50,000 to $74,999 | 27 (29.0%) | 0 (0.0%) |
| $75,000 to $99,999 | 0 (0.0%) | 42 (47.2%) |
| $100,000 to $149,999 | 32 (34.4%) | 22 (24.7%) |
| $150,000 or more | 0 (0.0%) | 13 (14.6%) |
| Total | 93 (100.0%) | 89 (100.0%) |
Property Value to Household Income Ratio in Freelandville
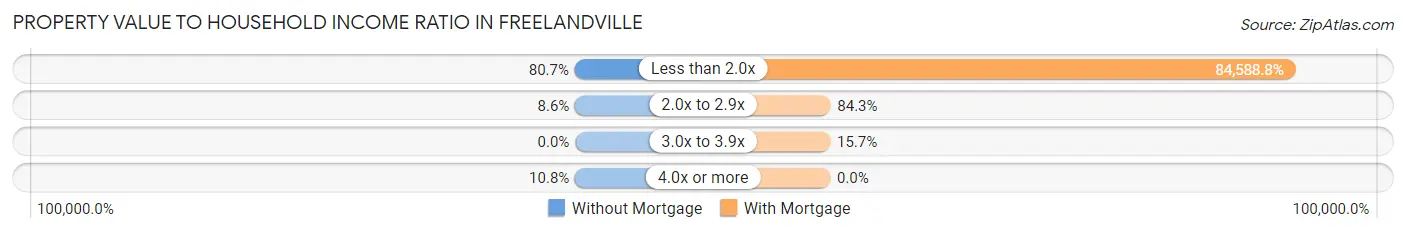
| Value-to-Income Ratio | Without Mortgage | With Mortgage |
| Less than 2.0x | 75 (80.6%) | 75,284 (84,588.8%) |
| 2.0x to 2.9x | 8 (8.6%) | 75 (84.3%) |
| 3.0x to 3.9x | 0 (0.0%) | 14 (15.7%) |
| 4.0x or more | 10 (10.7%) | 0 (0.0%) |
| Total | 93 (100.0%) | 89 (100.0%) |
Real Estate Taxes by Mortgage Status in Freelandville
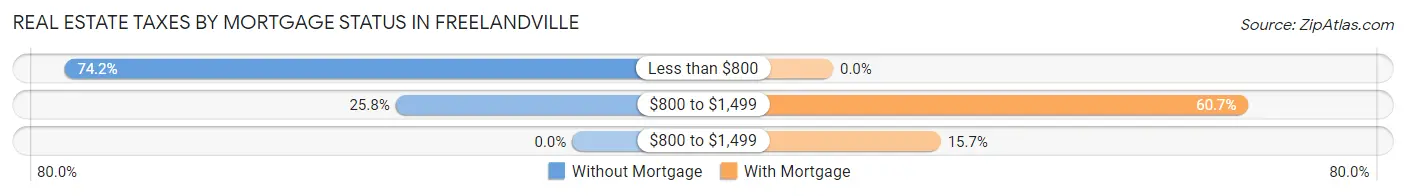
| Property Taxes | Without Mortgage | With Mortgage |
| Less than $800 | 69 (74.2%) | 0 (0.0%) |
| $800 to $1,499 | 24 (25.8%) | 54 (60.7%) |
| $800 to $1,499 | 0 (0.0%) | 14 (15.7%) |
| Total | 93 (100.0%) | 89 (100.0%) |
Health & Disability in Freelandville
Health Insurance Coverage by Age in Freelandville
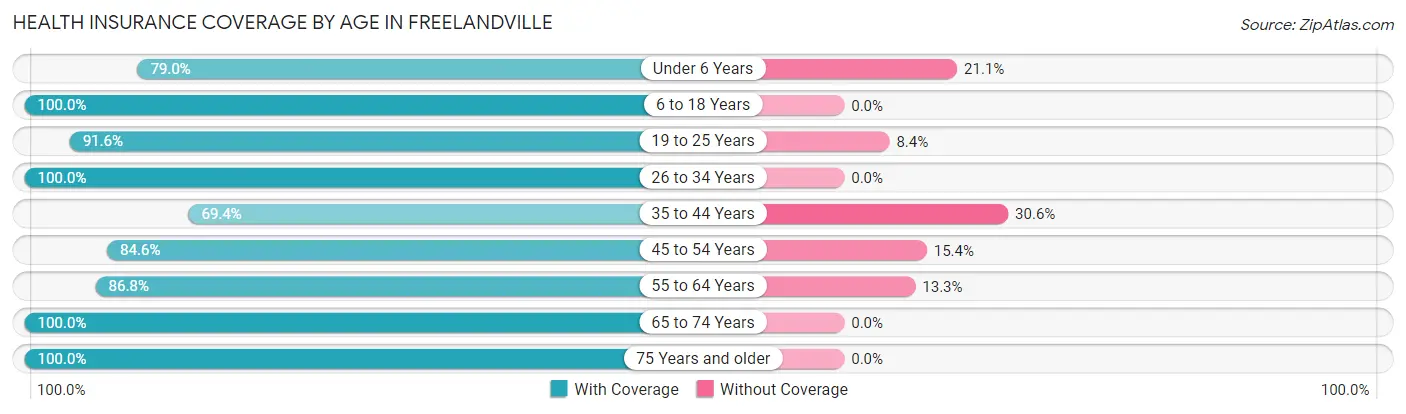
| Age Bracket | With Coverage | Without Coverage |
| Under 6 Years | 30 (78.9%) | 8 (21.0%) |
| 6 to 18 Years | 184 (100.0%) | 0 (0.0%) |
| 19 to 25 Years | 87 (91.6%) | 8 (8.4%) |
| 26 to 34 Years | 26 (100.0%) | 0 (0.0%) |
| 35 to 44 Years | 50 (69.4%) | 22 (30.6%) |
| 45 to 54 Years | 44 (84.6%) | 8 (15.4%) |
| 55 to 64 Years | 72 (86.8%) | 11 (13.3%) |
| 65 to 74 Years | 73 (100.0%) | 0 (0.0%) |
| 75 Years and older | 70 (100.0%) | 0 (0.0%) |
| Total | 636 (91.8%) | 57 (8.2%) |
Health Insurance Coverage by Citizenship Status in Freelandville
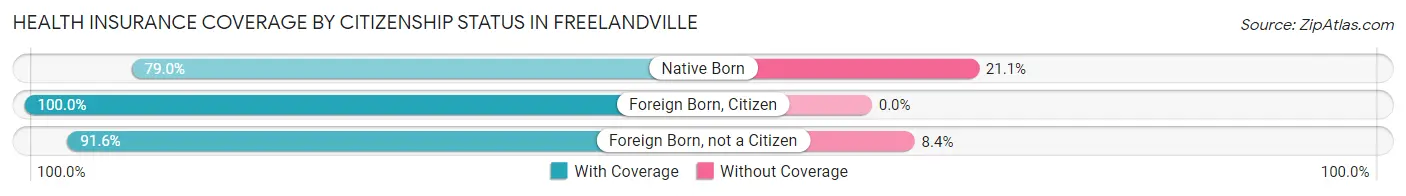
| Citizenship Status | With Coverage | Without Coverage |
| Native Born | 30 (78.9%) | 8 (21.0%) |
| Foreign Born, Citizen | 184 (100.0%) | 0 (0.0%) |
| Foreign Born, not a Citizen | 87 (91.6%) | 8 (8.4%) |
Health Insurance Coverage by Household Income in Freelandville
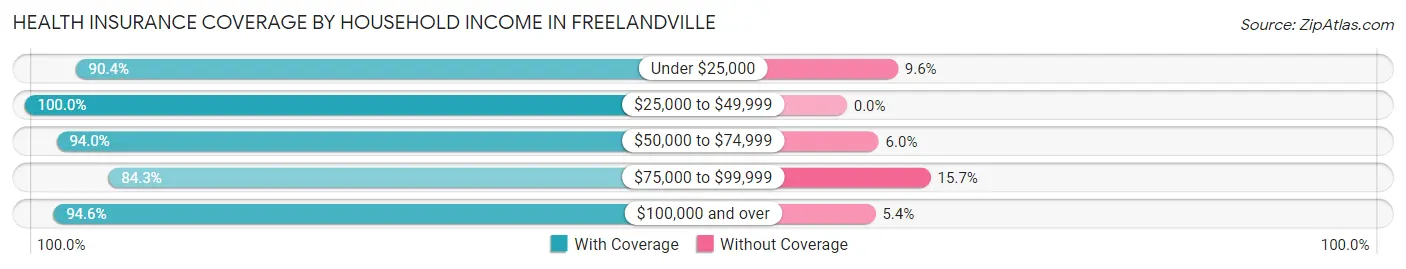
| Household Income | With Coverage | Without Coverage |
| Under $25,000 | 104 (90.4%) | 11 (9.6%) |
| $25,000 to $49,999 | 21 (100.0%) | 0 (0.0%) |
| $50,000 to $74,999 | 252 (94.0%) | 16 (6.0%) |
| $75,000 to $99,999 | 118 (84.3%) | 22 (15.7%) |
| $100,000 and over | 141 (94.6%) | 8 (5.4%) |
Public vs Private Health Insurance Coverage by Age in Freelandville
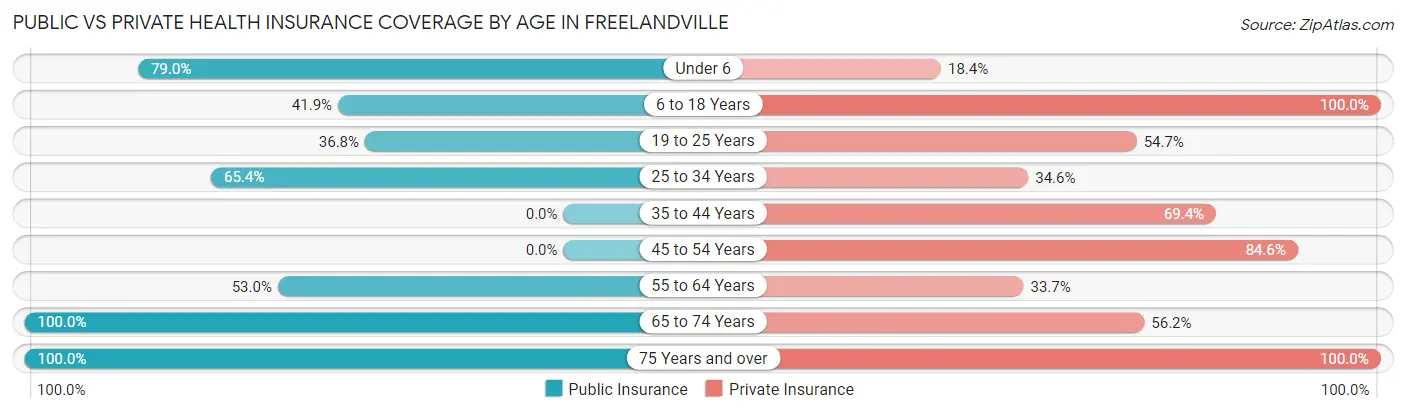
| Age Bracket | Public Insurance | Private Insurance |
| Under 6 | 30 (78.9%) | 7 (18.4%) |
| 6 to 18 Years | 77 (41.8%) | 184 (100.0%) |
| 19 to 25 Years | 35 (36.8%) | 52 (54.7%) |
| 25 to 34 Years | 17 (65.4%) | 9 (34.6%) |
| 35 to 44 Years | 0 (0.0%) | 50 (69.4%) |
| 45 to 54 Years | 0 (0.0%) | 44 (84.6%) |
| 55 to 64 Years | 44 (53.0%) | 28 (33.7%) |
| 65 to 74 Years | 73 (100.0%) | 41 (56.2%) |
| 75 Years and over | 70 (100.0%) | 70 (100.0%) |
| Total | 346 (49.9%) | 485 (70.0%) |
Disability Status by Sex by Age in Freelandville
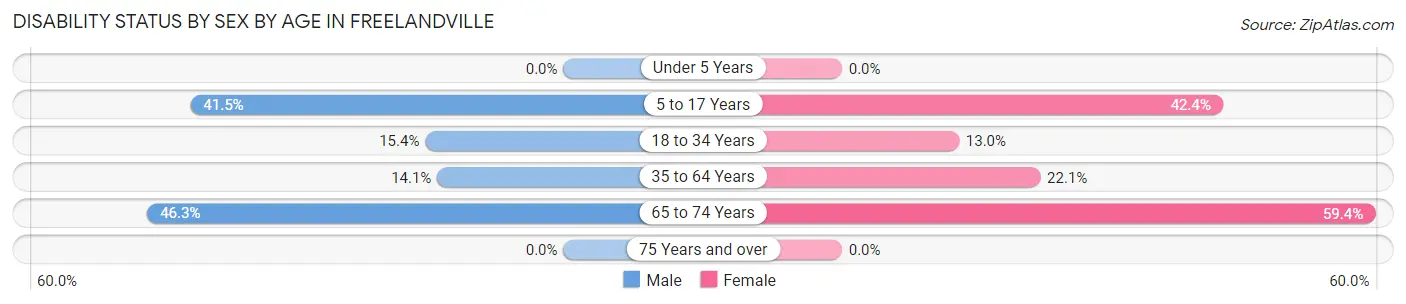
| Age Bracket | Male | Female |
| Under 5 Years | 0 (0.0%) | 0 (0.0%) |
| 5 to 17 Years | 49 (41.5%) | 28 (42.4%) |
| 18 to 34 Years | 8 (15.4%) | 9 (13.0%) |
| 35 to 64 Years | 17 (14.1%) | 19 (22.1%) |
| 65 to 74 Years | 19 (46.3%) | 19 (59.4%) |
| 75 Years and over | 0 (0.0%) | 0 (0.0%) |
Disability Class by Sex by Age in Freelandville
Disability Class: Hearing Difficulty
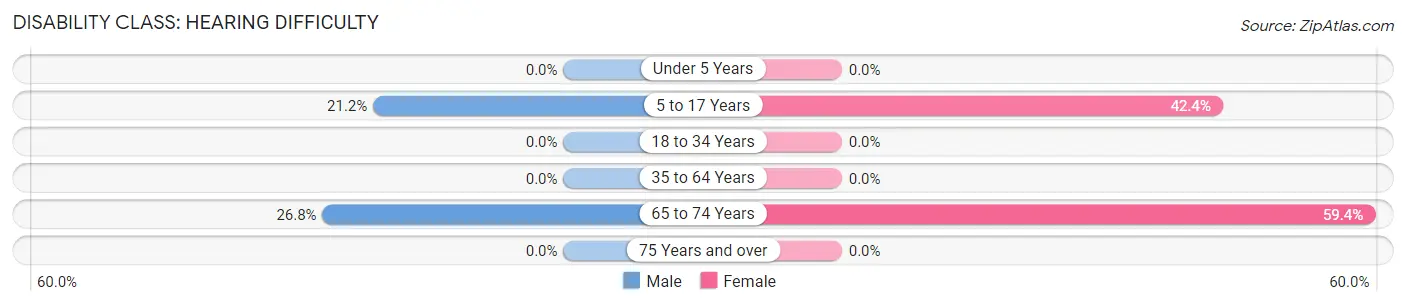
| Age Bracket | Male | Female |
| Under 5 Years | 0 (0.0%) | 0 (0.0%) |
| 5 to 17 Years | 25 (21.2%) | 28 (42.4%) |
| 18 to 34 Years | 0 (0.0%) | 0 (0.0%) |
| 35 to 64 Years | 0 (0.0%) | 0 (0.0%) |
| 65 to 74 Years | 11 (26.8%) | 19 (59.4%) |
| 75 Years and over | 0 (0.0%) | 0 (0.0%) |
Disability Class: Vision Difficulty
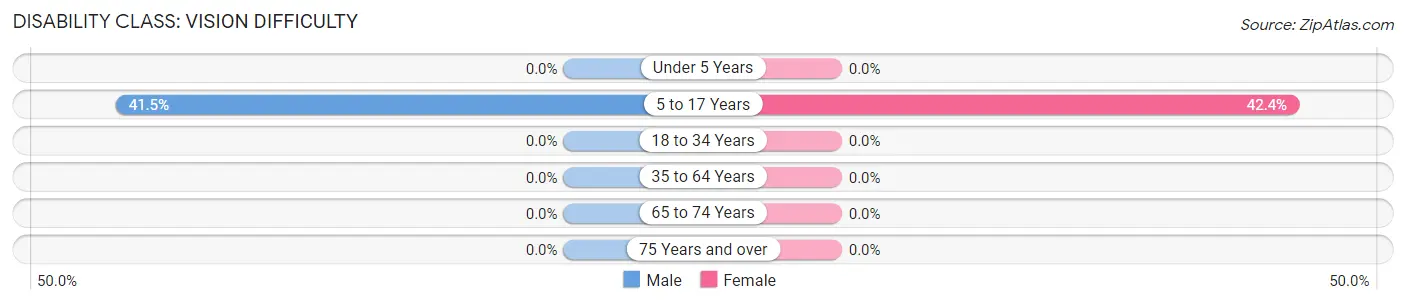
| Age Bracket | Male | Female |
| Under 5 Years | 0 (0.0%) | 0 (0.0%) |
| 5 to 17 Years | 49 (41.5%) | 28 (42.4%) |
| 18 to 34 Years | 0 (0.0%) | 0 (0.0%) |
| 35 to 64 Years | 0 (0.0%) | 0 (0.0%) |
| 65 to 74 Years | 0 (0.0%) | 0 (0.0%) |
| 75 Years and over | 0 (0.0%) | 0 (0.0%) |
Disability Class: Cognitive Difficulty
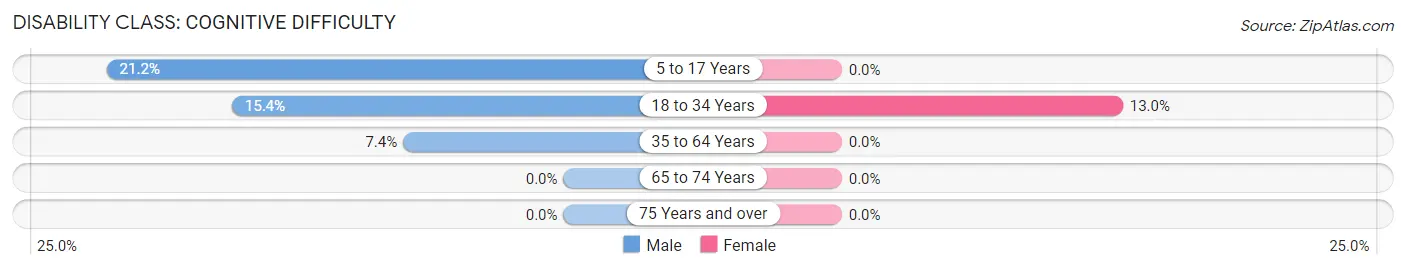
| Age Bracket | Male | Female |
| 5 to 17 Years | 25 (21.2%) | 0 (0.0%) |
| 18 to 34 Years | 8 (15.4%) | 9 (13.0%) |
| 35 to 64 Years | 9 (7.4%) | 0 (0.0%) |
| 65 to 74 Years | 0 (0.0%) | 0 (0.0%) |
| 75 Years and over | 0 (0.0%) | 0 (0.0%) |
Disability Class: Ambulatory Difficulty
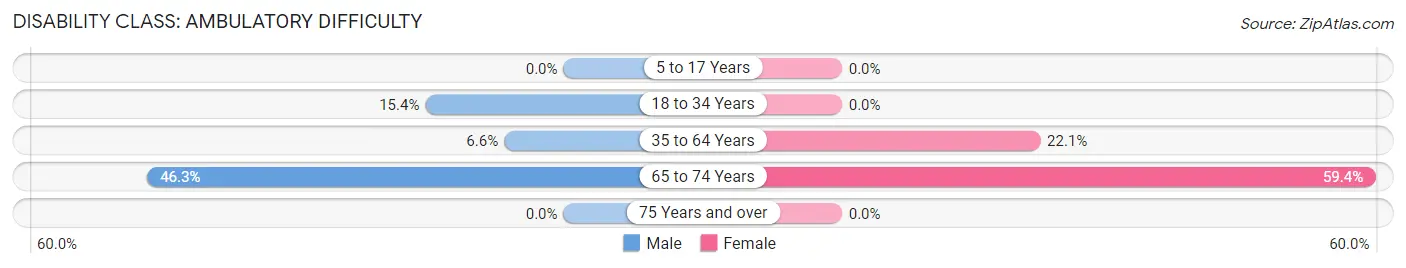
| Age Bracket | Male | Female |
| 5 to 17 Years | 0 (0.0%) | 0 (0.0%) |
| 18 to 34 Years | 8 (15.4%) | 0 (0.0%) |
| 35 to 64 Years | 8 (6.6%) | 19 (22.1%) |
| 65 to 74 Years | 19 (46.3%) | 19 (59.4%) |
| 75 Years and over | 0 (0.0%) | 0 (0.0%) |
Disability Class: Self-Care Difficulty
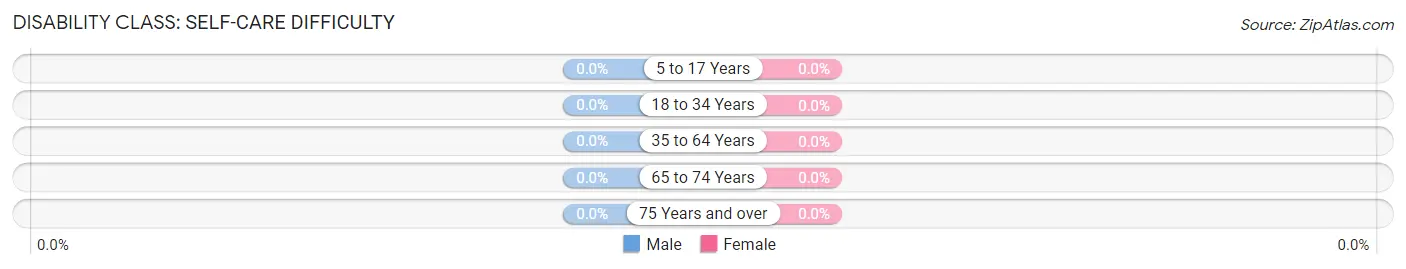
| Age Bracket | Male | Female |
| 5 to 17 Years | 0 (0.0%) | 0 (0.0%) |
| 18 to 34 Years | 0 (0.0%) | 0 (0.0%) |
| 35 to 64 Years | 0 (0.0%) | 0 (0.0%) |
| 65 to 74 Years | 0 (0.0%) | 0 (0.0%) |
| 75 Years and over | 0 (0.0%) | 0 (0.0%) |
Technology Access in Freelandville
Computing Device Access in Freelandville
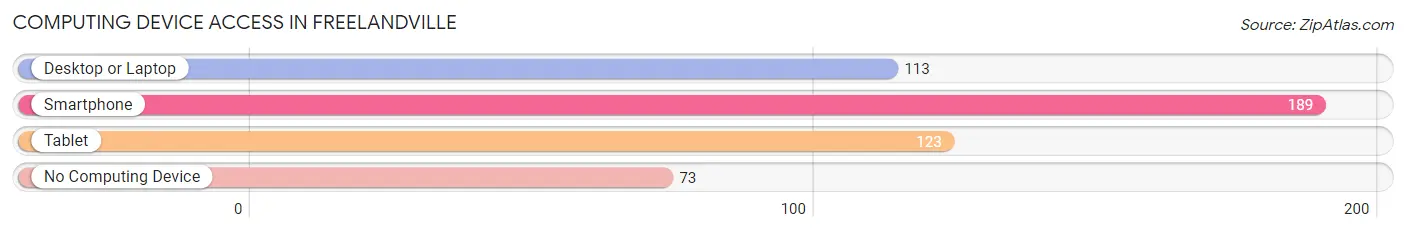
| Device Type | # Households | % Households |
| Desktop or Laptop | 113 | 43.1% |
| Smartphone | 189 | 72.1% |
| Tablet | 123 | 46.9% |
| No Computing Device | 73 | 27.9% |
| Total | 262 | 100.0% |
Internet Access in Freelandville
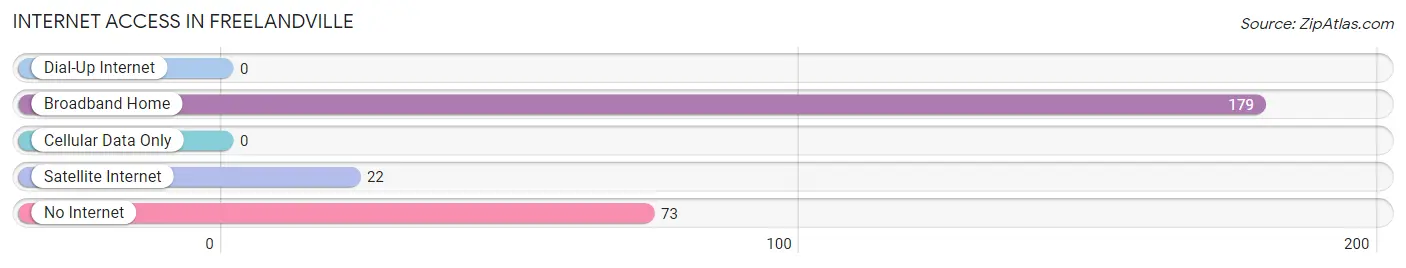
| Internet Type | # Households | % Households |
| Dial-Up Internet | 0 | 0.0% |
| Broadband Home | 179 | 68.3% |
| Cellular Data Only | 0 | 0.0% |
| Satellite Internet | 22 | 8.4% |
| No Internet | 73 | 27.9% |
| Total | 262 | 100.0% |
Freelandville Summary
Freelandville is a small town located in Knox County, Indiana, United States. It is situated in the northwest corner of the state, about 25 miles south of the Illinois border. The population was estimated to be 545 in the 2010 census.
History
Freelandville was founded in 1837 by a group of settlers from Ohio. The town was named after the Freeland family, who were among the first settlers. The town was originally a farming community, but it soon developed into a small industrial center. The first industry in Freelandville was a sawmill, which was built in 1845. The town also had a gristmill, a blacksmith shop, and a general store.
In the late 19th century, Freelandville became a popular tourist destination. The town was known for its mineral springs, which were believed to have healing properties. The springs attracted visitors from all over the country, and the town became known as the “Spa of the Midwest.”
In the early 20th century, Freelandville began to decline. The mineral springs dried up, and the town’s industries began to close. By the 1950s, the population had dropped to less than 500.
Geography
Freelandville is located in the northwest corner of Knox County, Indiana. It is situated on the banks of the White River, about 25 miles south of the Illinois border. The town is surrounded by rolling hills and farmland.
The climate in Freelandville is humid continental, with hot summers and cold winters. The average annual temperature is around 50 degrees Fahrenheit. The average annual precipitation is around 40 inches.
Economy
Freelandville’s economy is largely based on agriculture. The town is home to several farms, which produce corn, soybeans, and other crops. The town also has a few small businesses, including a grocery store, a hardware store, and a restaurant.
Demographics
According to the 2010 census, the population of Freelandville was 545. The racial makeup of the town was 97.3% White, 0.7% African American, 0.2% Native American, 0.2% Asian, and 1.6% from other races. The median household income was $37,500, and the median family income was $45,000.
Conclusion
Freelandville is a small town located in Knox County, Indiana. It was founded in 1837 and was once a popular tourist destination. Today, the town’s economy is largely based on agriculture, and the population is estimated to be 545. Freelandville is a quiet, rural community with a rich history and a bright future.
Common Questions
What is Per Capita Income in Freelandville?
Per Capita income in Freelandville is $23,219.
What is the Median Family Income in Freelandville?
Median Family Income in Freelandville is $73,333.
What is the Median Household income in Freelandville?
Median Household Income in Freelandville is $56,250.
What is Inequality or Gini Index in Freelandville?
Inequality or Gini Index in Freelandville is 0.42.
What is the Total Population of Freelandville?
Total Population of Freelandville is 734.
What is the Total Male Population of Freelandville?
Total Male Population of Freelandville is 363.
What is the Total Female Population of Freelandville?
Total Female Population of Freelandville is 371.
What is the Ratio of Males per 100 Females in Freelandville?
There are 97.84 Males per 100 Females in Freelandville.
What is the Ratio of Females per 100 Males in Freelandville?
There are 102.20 Females per 100 Males in Freelandville.
What is the Median Population Age in Freelandville?
Median Population Age in Freelandville is 38.1 Years.
What is the Average Family Size in Freelandville
Average Family Size in Freelandville is 3.4 People.
What is the Average Household Size in Freelandville
Average Household Size in Freelandville is 2.6 People.
How Large is the Labor Force in Freelandville?
There are 251 People in the Labor Forcein in Freelandville.
What is the Percentage of People in the Labor Force in Freelandville?
47.9% of People are in the Labor Force in Freelandville.
What is the Unemployment Rate in Freelandville?
Unemployment Rate in Freelandville is 3.6%.