Zip Codes with the Highest Percentage of Population Employed in Architecture & Engineering in Indiana
RELATED REPORTS & OPTIONS
Architecture & Engineering
Indiana
Compare Zip Codes
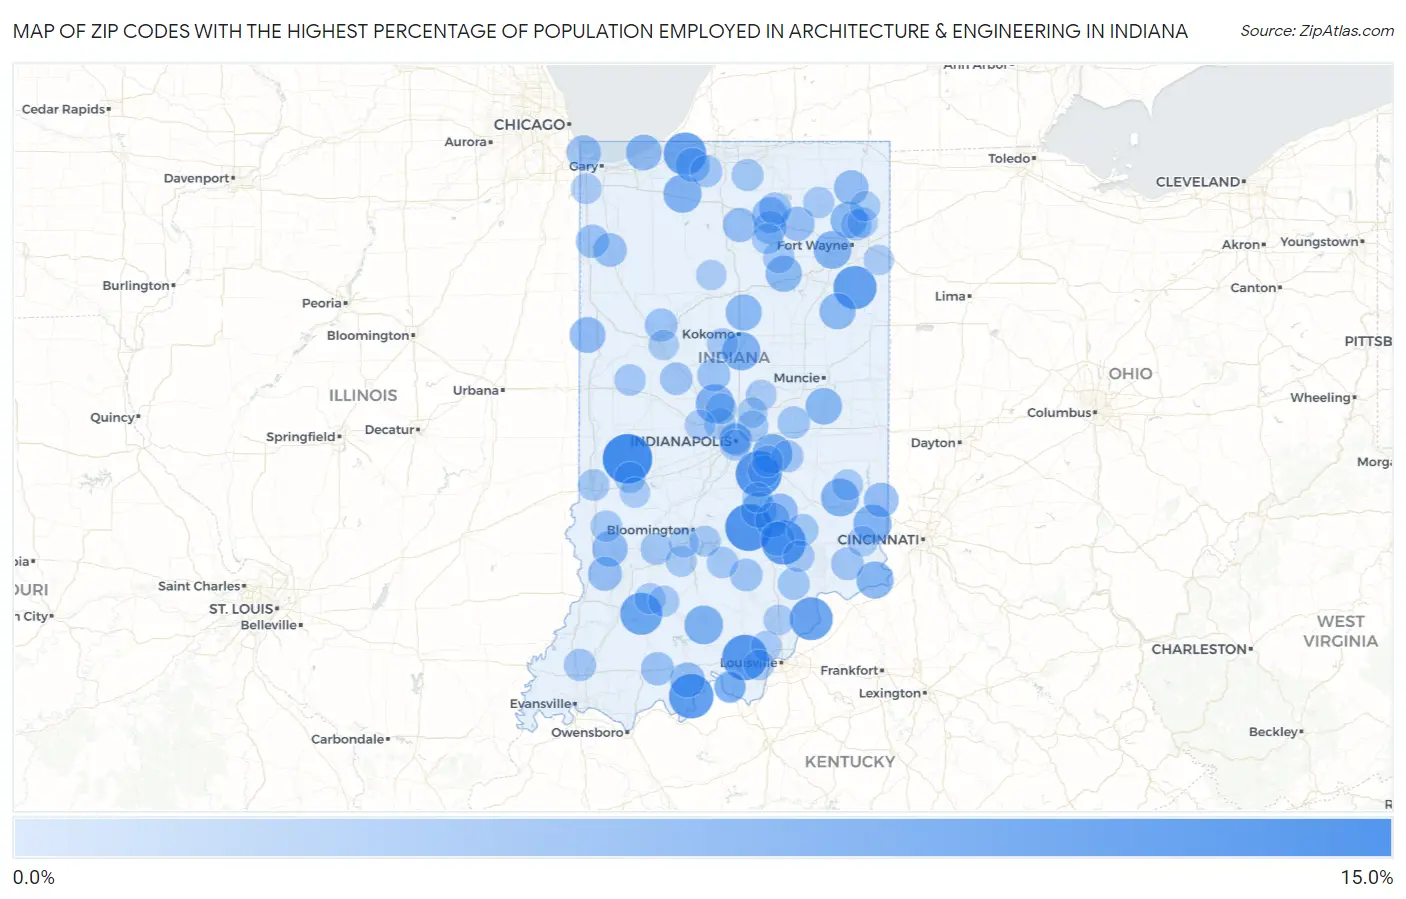
Map of Zip Codes with the Highest Percentage of Population Employed in Architecture & Engineering in Indiana
0.0%
15.0%
Zip Codes with the Highest Percentage of Population Employed in Architecture & Engineering in Indiana
| Zip Code | % Employed | vs State | vs National | |
| 1. | 47837 | 14.1% | 2.2%(+11.9)#1 | 2.1%(+11.9)#171 |
| 2. | 47201 | 12.7% | 2.2%(+10.4)#2 | 2.1%(+10.5)#211 |
| 3. | 46162 | 12.1% | 2.2%(+9.92)#3 | 2.1%(+9.99)#234 |
| 4. | 47114 | 12.0% | 2.2%(+9.73)#4 | 2.1%(+9.81)#244 |
| 5. | 47525 | 11.3% | 2.2%(+9.12)#5 | 2.1%(+9.19)#270 |
| 6. | 47273 | 11.1% | 2.2%(+8.92)#6 | 2.1%(+8.99)#281 |
| 7. | 46731 | 10.6% | 2.2%(+8.36)#7 | 2.1%(+8.43)#308 |
| 8. | 47162 | 10.4% | 2.2%(+8.20)#8 | 2.1%(+8.28)#317 |
| 9. | 46371 | 10.3% | 2.2%(+8.04)#9 | 2.1%(+8.11)#327 |
| 10. | 47519 | 10.0% | 2.2%(+7.81)#10 | 2.1%(+7.88)#336 |
| 11. | 46130 | 8.7% | 2.2%(+6.48)#11 | 2.1%(+6.56)#462 |
| 12. | 46075 | 8.2% | 2.2%(+5.95)#12 | 2.1%(+6.02)#542 |
| 13. | 47454 | 8.2% | 2.2%(+5.94)#13 | 2.1%(+6.01)#546 |
| 14. | 46068 | 8.0% | 2.2%(+5.73)#14 | 2.1%(+5.81)#582 |
| 15. | 47022 | 7.9% | 2.2%(+5.65)#15 | 2.1%(+5.73)#592 |
| 16. | 46532 | 7.9% | 2.2%(+5.64)#16 | 2.1%(+5.71)#593 |
| 17. | 47036 | 7.8% | 2.2%(+5.62)#17 | 2.1%(+5.69)#598 |
| 18. | 46814 | 7.6% | 2.2%(+5.40)#18 | 2.1%(+5.47)#634 |
| 19. | 47020 | 7.4% | 2.2%(+5.15)#19 | 2.1%(+5.22)#678 |
| 20. | 46748 | 7.1% | 2.2%(+4.83)#20 | 2.1%(+4.91)#736 |
| 21. | 47361 | 7.0% | 2.2%(+4.82)#21 | 2.1%(+4.89)#741 |
| 22. | 46990 | 6.9% | 2.2%(+4.67)#22 | 2.1%(+4.75)#775 |
| 23. | 46914 | 6.8% | 2.2%(+4.62)#23 | 2.1%(+4.69)#789 |
| 24. | 46781 | 6.8% | 2.2%(+4.61)#24 | 2.1%(+4.68)#790 |
| 25. | 47917 | 6.7% | 2.2%(+4.45)#25 | 2.1%(+4.52)#835 |
| 26. | 47280 | 6.6% | 2.2%(+4.38)#26 | 2.1%(+4.45)#852 |
| 27. | 46301 | 6.5% | 2.2%(+4.33)#27 | 2.1%(+4.40)#870 |
| 28. | 46582 | 6.5% | 2.2%(+4.31)#28 | 2.1%(+4.38)#877 |
| 29. | 47848 | 6.5% | 2.2%(+4.28)#29 | 2.1%(+4.35)#888 |
| 30. | 47246 | 6.4% | 2.2%(+4.21)#30 | 2.1%(+4.28)#919 |
| 31. | 47551 | 6.2% | 2.2%(+4.01)#31 | 2.1%(+4.08)#988 |
| 32. | 47203 | 6.1% | 2.2%(+3.93)#32 | 2.1%(+4.00)#1,019 |
| 33. | 47016 | 6.1% | 2.2%(+3.83)#33 | 2.1%(+3.90)#1,059 |
| 34. | 46730 | 6.0% | 2.2%(+3.79)#34 | 2.1%(+3.87)#1,074 |
| 35. | 47232 | 5.9% | 2.2%(+3.71)#35 | 2.1%(+3.78)#1,112 |
| 36. | 46570 | 5.9% | 2.2%(+3.69)#36 | 2.1%(+3.77)#1,120 |
| 37. | 46394 | 5.9% | 2.2%(+3.68)#37 | 2.1%(+3.75)#1,130 |
| 38. | 46365 | 5.9% | 2.2%(+3.65)#38 | 2.1%(+3.72)#1,151 |
| 39. | 46764 | 5.8% | 2.2%(+3.59)#39 | 2.1%(+3.67)#1,171 |
| 40. | 47535 | 5.8% | 2.2%(+3.56)#40 | 2.1%(+3.64)#1,182 |
| 41. | 47943 | 5.5% | 2.2%(+3.29)#41 | 2.1%(+3.36)#1,321 |
| 42. | 47532 | 5.3% | 2.2%(+3.10)#42 | 2.1%(+3.17)#1,433 |
| 43. | 46349 | 5.3% | 2.2%(+3.10)#43 | 2.1%(+3.17)#1,435 |
| 44. | 46580 | 5.3% | 2.2%(+3.09)#44 | 2.1%(+3.16)#1,442 |
| 45. | 46050 | 5.2% | 2.2%(+2.95)#45 | 2.1%(+3.03)#1,534 |
| 46. | 47920 | 5.2% | 2.2%(+2.95)#46 | 2.1%(+3.02)#1,545 |
| 47. | 47017 | 5.1% | 2.2%(+2.84)#47 | 2.1%(+2.91)#1,625 |
| 48. | 47220 | 5.0% | 2.2%(+2.78)#48 | 2.1%(+2.85)#1,653 |
| 49. | 46538 | 5.0% | 2.2%(+2.77)#49 | 2.1%(+2.84)#1,667 |
| 50. | 46035 | 4.9% | 2.2%(+2.68)#50 | 2.1%(+2.76)#1,730 |
| 51. | 46186 | 4.8% | 2.2%(+2.62)#51 | 2.1%(+2.70)#1,790 |
| 52. | 47648 | 4.8% | 2.2%(+2.57)#52 | 2.1%(+2.65)#1,837 |
| 53. | 47424 | 4.8% | 2.2%(+2.54)#53 | 2.1%(+2.61)#1,866 |
| 54. | 46161 | 4.7% | 2.2%(+2.50)#54 | 2.1%(+2.57)#1,903 |
| 55. | 46554 | 4.7% | 2.2%(+2.48)#55 | 2.1%(+2.56)#1,927 |
| 56. | 46573 | 4.7% | 2.2%(+2.45)#56 | 2.1%(+2.53)#1,962 |
| 57. | 47283 | 4.7% | 2.2%(+2.45)#57 | 2.1%(+2.52)#1,964 |
| 58. | 47230 | 4.6% | 2.2%(+2.42)#58 | 2.1%(+2.49)#1,989 |
| 59. | 46204 | 4.6% | 2.2%(+2.41)#59 | 2.1%(+2.48)#1,993 |
| 60. | 46110 | 4.6% | 2.2%(+2.35)#60 | 2.1%(+2.42)#2,041 |
| 61. | 47282 | 4.5% | 2.2%(+2.29)#61 | 2.1%(+2.36)#2,111 |
| 62. | 46962 | 4.5% | 2.2%(+2.24)#62 | 2.1%(+2.31)#2,176 |
| 63. | 47809 | 4.5% | 2.2%(+2.23)#63 | 2.1%(+2.31)#2,188 |
| 64. | 46202 | 4.4% | 2.2%(+2.22)#64 | 2.1%(+2.29)#2,197 |
| 65. | 46126 | 4.4% | 2.2%(+2.21)#65 | 2.1%(+2.28)#2,216 |
| 66. | 47264 | 4.4% | 2.2%(+2.20)#66 | 2.1%(+2.28)#2,221 |
| 67. | 47855 | 4.4% | 2.2%(+2.17)#67 | 2.1%(+2.24)#2,265 |
| 68. | 47994 | 4.4% | 2.2%(+2.16)#68 | 2.1%(+2.24)#2,276 |
| 69. | 46278 | 4.4% | 2.2%(+2.15)#69 | 2.1%(+2.22)#2,294 |
| 70. | 46216 | 4.4% | 2.2%(+2.14)#70 | 2.1%(+2.21)#2,308 |
| 71. | 47110 | 4.3% | 2.2%(+2.08)#71 | 2.1%(+2.15)#2,373 |
| 72. | 47857 | 4.3% | 2.2%(+2.03)#72 | 2.1%(+2.11)#2,420 |
| 73. | 46701 | 4.2% | 2.2%(+2.01)#73 | 2.1%(+2.08)#2,457 |
| 74. | 47024 | 4.2% | 2.2%(+2.00)#74 | 2.1%(+2.07)#2,466 |
| 75. | 46979 | 4.2% | 2.2%(+1.99)#75 | 2.1%(+2.07)#2,475 |
| 76. | 47553 | 4.2% | 2.2%(+1.95)#76 | 2.1%(+2.02)#2,521 |
| 77. | 46510 | 4.2% | 2.2%(+1.93)#77 | 2.1%(+2.01)#2,545 |
| 78. | 47581 | 4.2% | 2.2%(+1.93)#78 | 2.1%(+2.00)#2,555 |
| 79. | 47142 | 4.1% | 2.2%(+1.89)#79 | 2.1%(+1.96)#2,602 |
| 80. | 46077 | 4.1% | 2.2%(+1.88)#80 | 2.1%(+1.95)#2,614 |
| 81. | 46845 | 4.1% | 2.2%(+1.87)#81 | 2.1%(+1.94)#2,629 |
| 82. | 47462 | 4.1% | 2.2%(+1.85)#82 | 2.1%(+1.92)#2,659 |
| 83. | 47401 | 4.1% | 2.2%(+1.85)#83 | 2.1%(+1.92)#2,660 |
| 84. | 46060 | 4.0% | 2.2%(+1.79)#84 | 2.1%(+1.87)#2,744 |
| 85. | 46225 | 4.0% | 2.2%(+1.76)#85 | 2.1%(+1.83)#2,803 |
| 86. | 46373 | 3.9% | 2.2%(+1.72)#86 | 2.1%(+1.79)#2,867 |
| 87. | 47119 | 3.9% | 2.2%(+1.69)#87 | 2.1%(+1.76)#2,914 |
| 88. | 47136 | 3.9% | 2.2%(+1.69)#88 | 2.1%(+1.76)#2,919 |
| 89. | 47126 | 3.9% | 2.2%(+1.69)#89 | 2.1%(+1.76)#2,924 |
| 90. | 46167 | 3.9% | 2.2%(+1.68)#90 | 2.1%(+1.75)#2,933 |
| 91. | 46765 | 3.9% | 2.2%(+1.67)#91 | 2.1%(+1.74)#2,947 |
| 92. | 47905 | 3.9% | 2.2%(+1.67)#92 | 2.1%(+1.74)#2,955 |
| 93. | 47032 | 3.9% | 2.2%(+1.65)#93 | 2.1%(+1.72)#2,984 |
| 94. | 47840 | 3.8% | 2.2%(+1.59)#94 | 2.1%(+1.67)#3,063 |
| 95. | 46706 | 3.8% | 2.2%(+1.57)#95 | 2.1%(+1.64)#3,109 |
| 96. | 46773 | 3.8% | 2.2%(+1.57)#96 | 2.1%(+1.64)#3,111 |
| 97. | 46950 | 3.8% | 2.2%(+1.56)#97 | 2.1%(+1.63)#3,129 |
| 98. | 46038 | 3.8% | 2.2%(+1.55)#98 | 2.1%(+1.62)#3,159 |
| 99. | 47403 | 3.8% | 2.2%(+1.54)#99 | 2.1%(+1.61)#3,174 |
| 100. | 46124 | 3.8% | 2.2%(+1.53)#100 | 2.1%(+1.60)#3,192 |
Common Questions
What are the Top 10 Zip Codes with the Highest Percentage of Population Employed in Architecture & Engineering in Indiana?
Top 10 Zip Codes with the Highest Percentage of Population Employed in Architecture & Engineering in Indiana are:
What zip code has the Highest Percentage of Population Employed in Architecture & Engineering in Indiana?
47837 has the Highest Percentage of Population Employed in Architecture & Engineering in Indiana with 14.1%.
What is the Percentage of Population Employed in Architecture & Engineering in the State of Indiana?
Percentage of Population Employed in Architecture & Engineering in Indiana is 2.2%.
What is the Percentage of Population Employed in Architecture & Engineering in the United States?
Percentage of Population Employed in Architecture & Engineering in the United States is 2.1%.