Zip Codes with the Highest Percentage of Population Employed in Architecture & Engineering in Goshen, IN
RELATED REPORTS & OPTIONS
Architecture & Engineering
Goshen
Compare Zip Codes
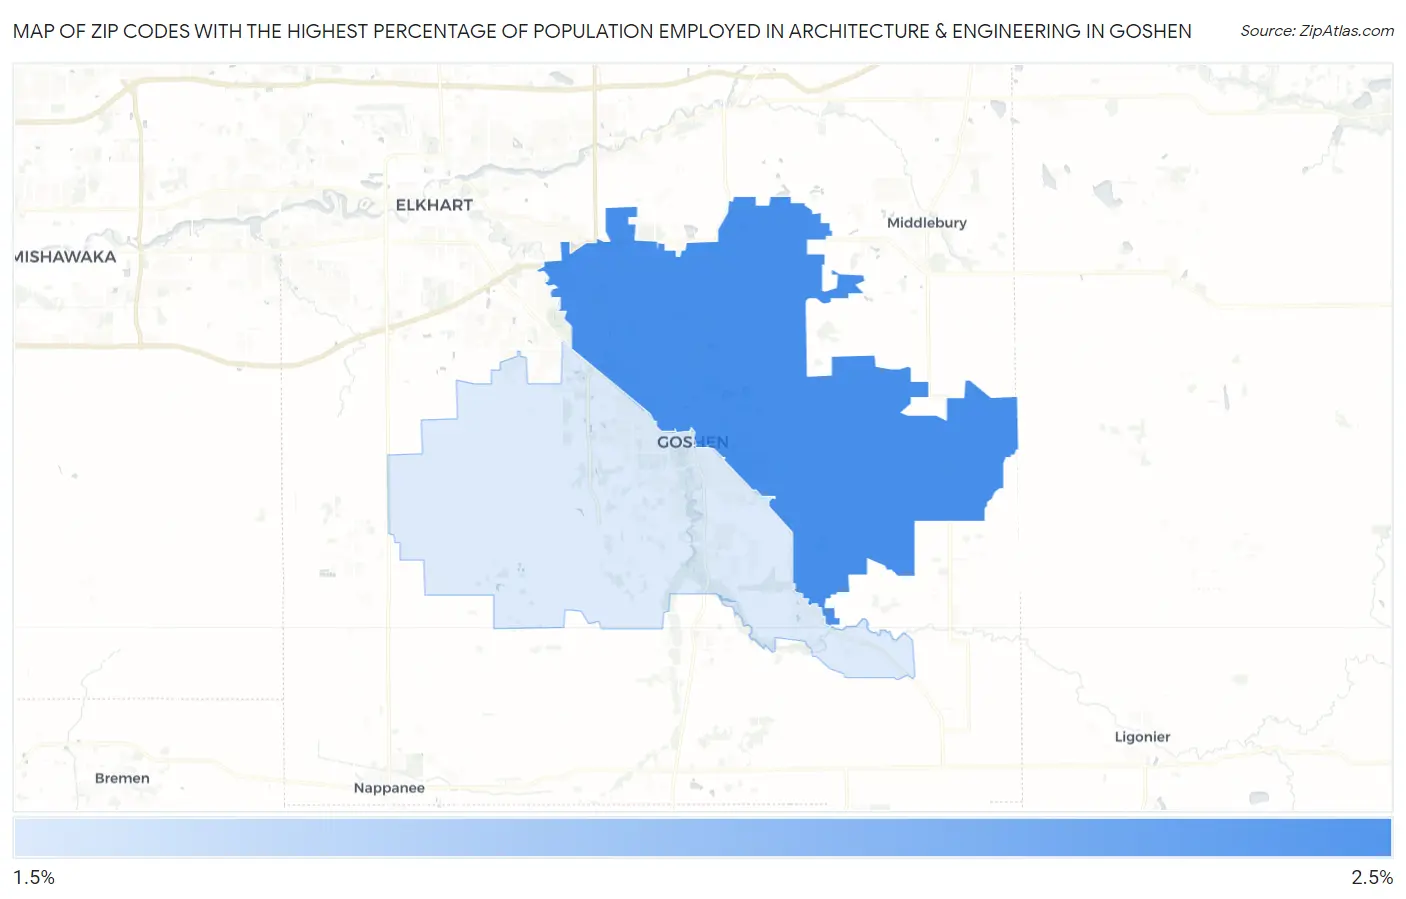
Map of Zip Codes with the Highest Percentage of Population Employed in Architecture & Engineering in Goshen
2.1%
2.3%
Zip Codes with the Highest Percentage of Population Employed in Architecture & Engineering in Goshen, IN
| Zip Code | % Employed | vs State | vs National | |
| 1. | 46528 | 2.3% | 2.2%(+0.117)#228 | 2.1%(+0.189)#7,769 |
| 2. | 46526 | 2.1% | 2.2%(-0.109)#273 | 2.1%(-0.036)#8,965 |
1
Common Questions
What are the Top Zip Codes with the Highest Percentage of Population Employed in Architecture & Engineering in Goshen, IN?
Top Zip Codes with the Highest Percentage of Population Employed in Architecture & Engineering in Goshen, IN are:
What zip code has the Highest Percentage of Population Employed in Architecture & Engineering in Goshen, IN?
46528 has the Highest Percentage of Population Employed in Architecture & Engineering in Goshen, IN with 2.3%.
What is the Percentage of Population Employed in Architecture & Engineering in Goshen, IN?
Percentage of Population Employed in Architecture & Engineering in Goshen is 2.5%.
What is the Percentage of Population Employed in Architecture & Engineering in Indiana?
Percentage of Population Employed in Architecture & Engineering in Indiana is 2.2%.
What is the Percentage of Population Employed in Architecture & Engineering in the United States?
Percentage of Population Employed in Architecture & Engineering in the United States is 2.1%.