Bright, IN Map & Demographics
Bright Map
Bright Overview
$39,650
PER CAPITA INCOME
$115,422
AVG FAMILY INCOME
$102,568
AVG HOUSEHOLD INCOME
43.8%
WAGE / INCOME GAP [ % ]
56.2¢/ $1
WAGE / INCOME GAP [ $ ]
0.32
INEQUALITY / GINI INDEX
5,858
TOTAL POPULATION
2,866
MALE POPULATION
2,992
FEMALE POPULATION
95.79
MALES / 100 FEMALES
104.40
FEMALES / 100 MALES
41.5
MEDIAN AGE
3.1
AVG FAMILY SIZE
2.7
AVG HOUSEHOLD SIZE
3,197
LABOR FORCE [ PEOPLE ]
69.2%
PERCENT IN LABOR FORCE
1.9%
UNEMPLOYMENT RATE
Income in Bright
Income Overview in Bright
Per Capita Income in Bright is $39,650, while median incomes of families and households are $115,422 and $102,568 respectively.
| Characteristic | Number | Measure |
| Per Capita Income | 5,858 | $39,650 |
| Median Family Income | 1,720 | $115,422 |
| Mean Family Income | 1,720 | $114,957 |
| Median Household Income | 2,188 | $102,568 |
| Mean Household Income | 2,188 | $105,524 |
| Income Deficit | 1,720 | $0 |
| Wage / Income Gap (%) | 5,858 | 43.82% |
| Wage / Income Gap ($) | 5,858 | 56.18¢ per $1 |
| Gini / Inequality Index | 5,858 | 0.32 |
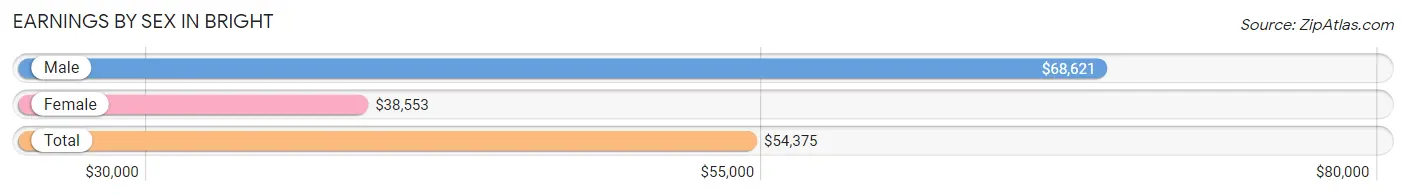
Earnings by Sex in Bright
Average Earnings in Bright are $54,375, $68,621 for men and $38,553 for women, a difference of 43.8%.
| Sex | Number | Average Earnings |
| Male | 1,780 (53.5%) | $68,621 |
| Female | 1,544 (46.5%) | $38,553 |
| Total | 3,324 (100.0%) | $54,375 |
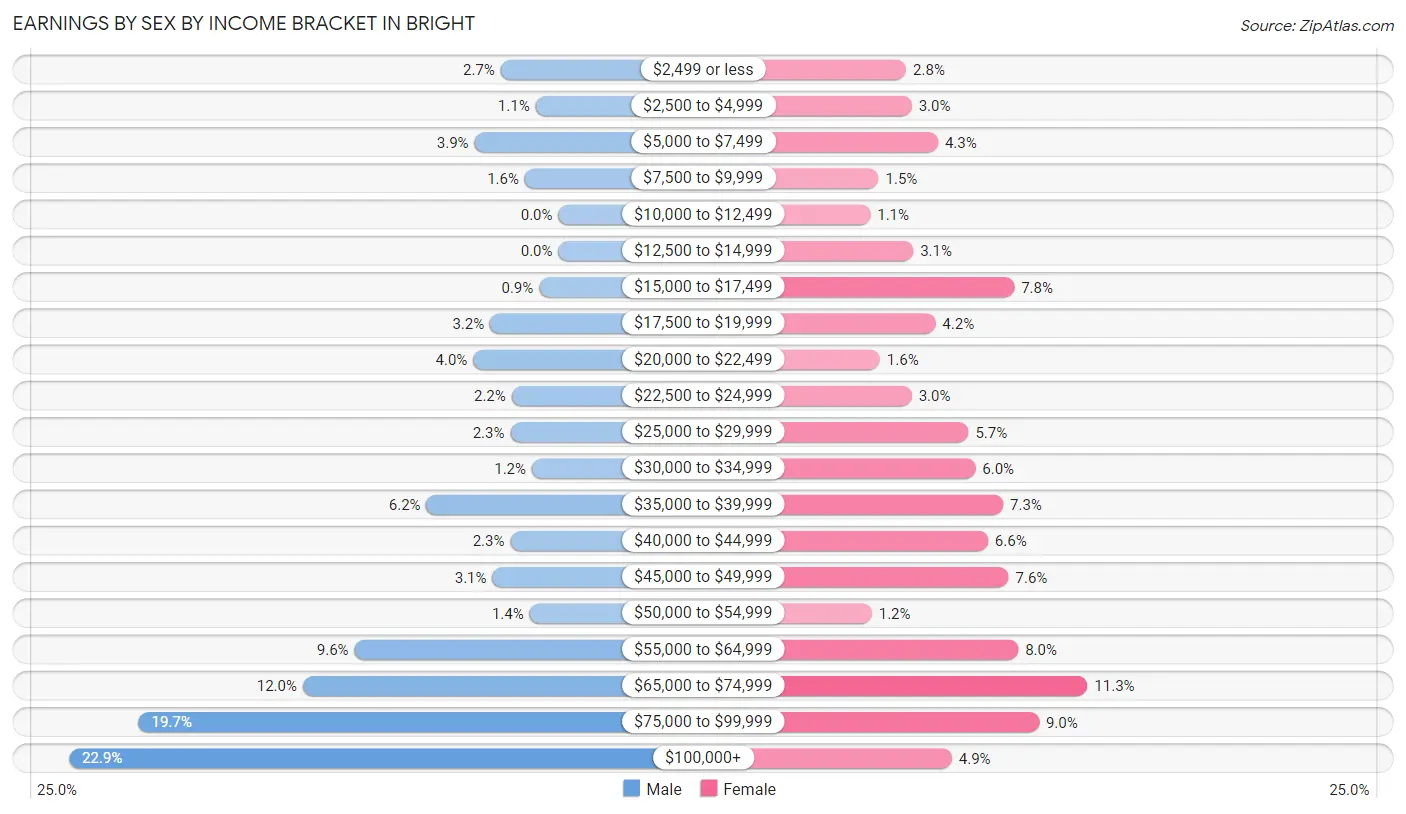
Earnings by Sex by Income Bracket in Bright
The most common earnings brackets in Bright are $100,000+ for men (408 | 22.9%) and $65,000 to $74,999 for women (174 | 11.3%).
| Income | Male | Female |
| $2,499 or less | 48 (2.7%) | 43 (2.8%) |
| $2,500 to $4,999 | 19 (1.1%) | 47 (3.0%) |
| $5,000 to $7,499 | 70 (3.9%) | 66 (4.3%) |
| $7,500 to $9,999 | 28 (1.6%) | 23 (1.5%) |
| $10,000 to $12,499 | 0 (0.0%) | 17 (1.1%) |
| $12,500 to $14,999 | 0 (0.0%) | 48 (3.1%) |
| $15,000 to $17,499 | 16 (0.9%) | 121 (7.8%) |
| $17,500 to $19,999 | 57 (3.2%) | 64 (4.2%) |
| $20,000 to $22,499 | 71 (4.0%) | 24 (1.5%) |
| $22,500 to $24,999 | 39 (2.2%) | 47 (3.0%) |
| $25,000 to $29,999 | 40 (2.2%) | 88 (5.7%) |
| $30,000 to $34,999 | 22 (1.2%) | 93 (6.0%) |
| $35,000 to $39,999 | 110 (6.2%) | 113 (7.3%) |
| $40,000 to $44,999 | 40 (2.2%) | 102 (6.6%) |
| $45,000 to $49,999 | 55 (3.1%) | 117 (7.6%) |
| $50,000 to $54,999 | 24 (1.3%) | 18 (1.2%) |
| $55,000 to $64,999 | 170 (9.6%) | 124 (8.0%) |
| $65,000 to $74,999 | 213 (12.0%) | 174 (11.3%) |
| $75,000 to $99,999 | 350 (19.7%) | 139 (9.0%) |
| $100,000+ | 408 (22.9%) | 76 (4.9%) |
| Total | 1,780 (100.0%) | 1,544 (100.0%) |
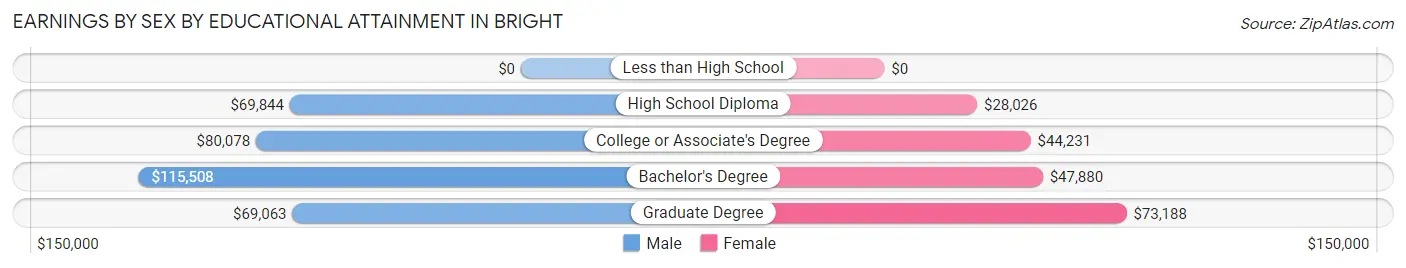
Earnings by Sex by Educational Attainment in Bright
Average earnings in Bright are $75,104 for men and $41,736 for women, a difference of 44.4%. Men with an educational attainment of bachelor's degree enjoy the highest average annual earnings of $115,508, while those with graduate degree education earn the least with $69,063. Women with an educational attainment of graduate degree earn the most with the average annual earnings of $73,188, while those with high school diploma education have the smallest earnings of $28,026.
| Educational Attainment | Male Income | Female Income |
| Less than High School | - | - |
| High School Diploma | $69,844 | $28,026 |
| College or Associate's Degree | $80,078 | $44,231 |
| Bachelor's Degree | $115,508 | $47,880 |
| Graduate Degree | $69,063 | $73,188 |
| Total | $75,104 | $41,736 |
Family Income in Bright
Family Income Brackets in Bright
According to the Bright family income data, there are 662 families falling into the $100,000 to $149,999 income range, which is the most common income bracket and makes up 38.5% of all families.
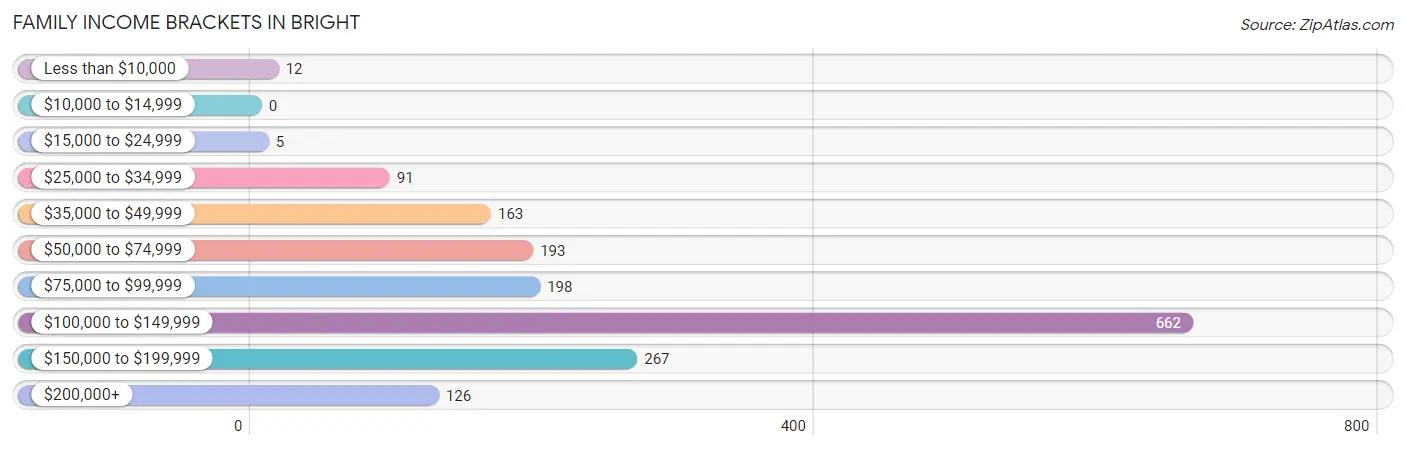
| Income Bracket | # Families | % Families |
| Less than $10,000 | 12 | 0.7% |
| $10,000 to $14,999 | 0 | 0.0% |
| $15,000 to $24,999 | 5 | 0.3% |
| $25,000 to $34,999 | 91 | 5.3% |
| $35,000 to $49,999 | 163 | 9.5% |
| $50,000 to $74,999 | 193 | 11.2% |
| $75,000 to $99,999 | 198 | 11.5% |
| $100,000 to $149,999 | 662 | 38.5% |
| $150,000 to $199,999 | 267 | 15.5% |
| $200,000+ | 126 | 7.3% |
Family Income by Famaliy Size in Bright
5-person families (122 | 7.1%) account for the highest median family income in Bright with $148,581 per family, while 2-person families (739 | 43.0%) have the highest median income of $48,703 per family member.
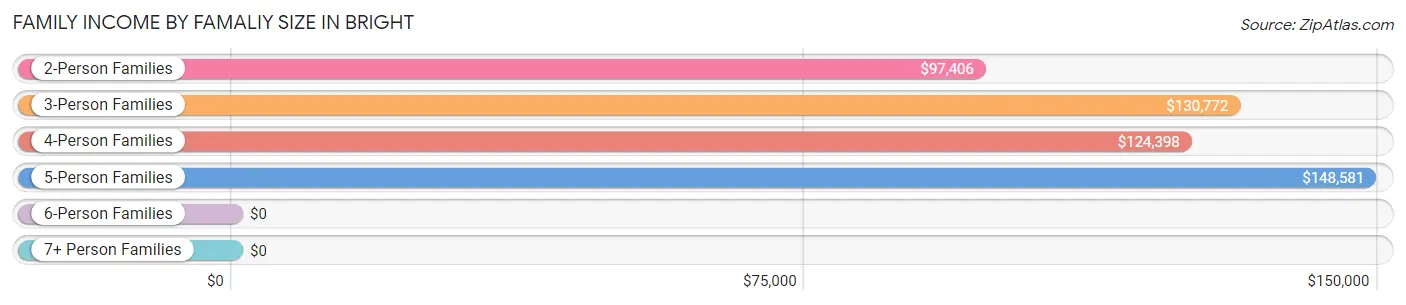
| Income Bracket | # Families | Median Income |
| 2-Person Families | 739 (43.0%) | $97,406 |
| 3-Person Families | 368 (21.4%) | $130,772 |
| 4-Person Families | 387 (22.5%) | $124,398 |
| 5-Person Families | 122 (7.1%) | $148,581 |
| 6-Person Families | 82 (4.8%) | $0 |
| 7+ Person Families | 22 (1.3%) | $0 |
| Total | 1,720 (100.0%) | $115,422 |
Family Income by Number of Earners in Bright
The median family income in Bright is $115,422, with families comprising 3+ earners (247) having the highest median family income of $166,523, while families with no earners (239) have the lowest median family income of $52,604, accounting for 14.4% and 13.9% of families, respectively.
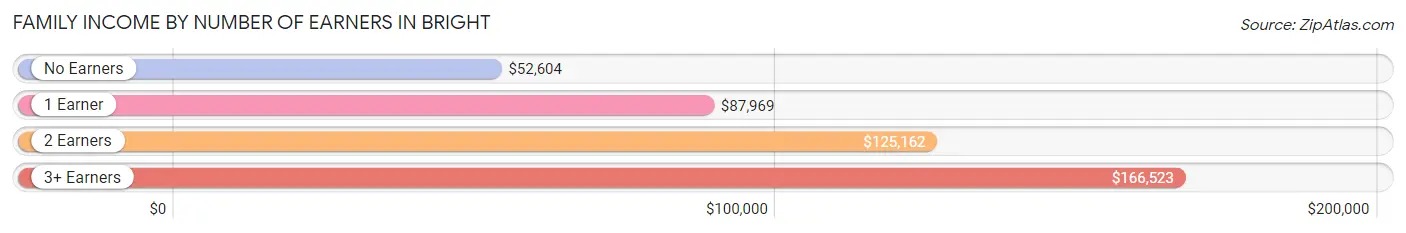
| Number of Earners | # Families | Median Income |
| No Earners | 239 (13.9%) | $52,604 |
| 1 Earner | 342 (19.9%) | $87,969 |
| 2 Earners | 892 (51.9%) | $125,162 |
| 3+ Earners | 247 (14.4%) | $166,523 |
| Total | 1,720 (100.0%) | $115,422 |
Household Income in Bright
Household Income Brackets in Bright
With 750 households falling in the category, the $100,000 to $149,999 income range is the most frequent in Bright, accounting for 34.3% of all households. In contrast, only 22 households (1.0%) fall into the $10,000 to $14,999 income bracket, making it the least populous group.
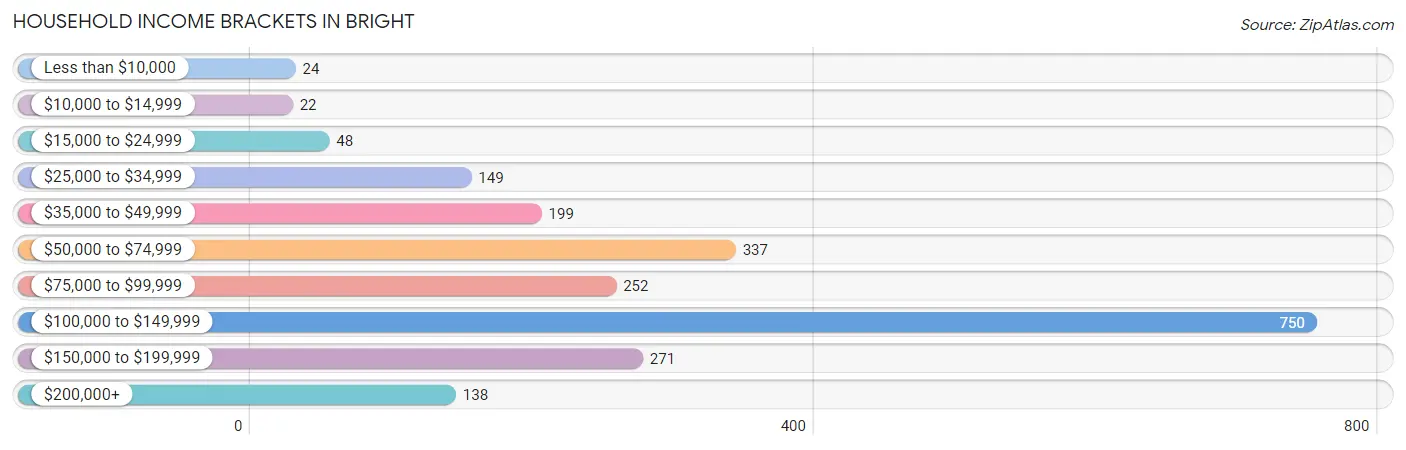
| Income Bracket | # Households | % Households |
| Less than $10,000 | 24 | 1.1% |
| $10,000 to $14,999 | 22 | 1.0% |
| $15,000 to $24,999 | 48 | 2.2% |
| $25,000 to $34,999 | 149 | 6.8% |
| $35,000 to $49,999 | 199 | 9.1% |
| $50,000 to $74,999 | 337 | 15.4% |
| $75,000 to $99,999 | 252 | 11.5% |
| $100,000 to $149,999 | 750 | 34.3% |
| $150,000 to $199,999 | 271 | 12.4% |
| $200,000+ | 138 | 6.3% |
Household Income by Householder Age in Bright
The median household income in Bright is $102,568, with the highest median household income of $126,510 found in the 25 to 44 years age bracket for the primary householder. A total of 711 households (32.5%) fall into this category. Meanwhile, the 15 to 24 years age bracket for the primary householder has the lowest median household income of $0, with 69 households (3.2%) in this group.
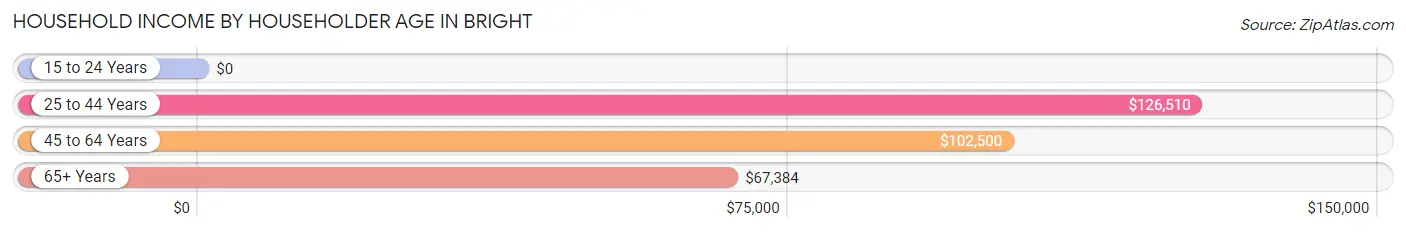
| Income Bracket | # Households | Median Income |
| 15 to 24 Years | 69 (3.2%) | $0 |
| 25 to 44 Years | 711 (32.5%) | $126,510 |
| 45 to 64 Years | 744 (34.0%) | $102,500 |
| 65+ Years | 664 (30.3%) | $67,384 |
| Total | 2,188 (100.0%) | $102,568 |
Poverty in Bright
Income Below Poverty by Sex and Age in Bright
With 1.0% poverty level for males and 1.5% for females among the residents of Bright, 75 year old and over males and 75 year old and over females are the most vulnerable to poverty, with 8 males (7.0%) and 12 females (6.1%) in their respective age groups living below the poverty level.
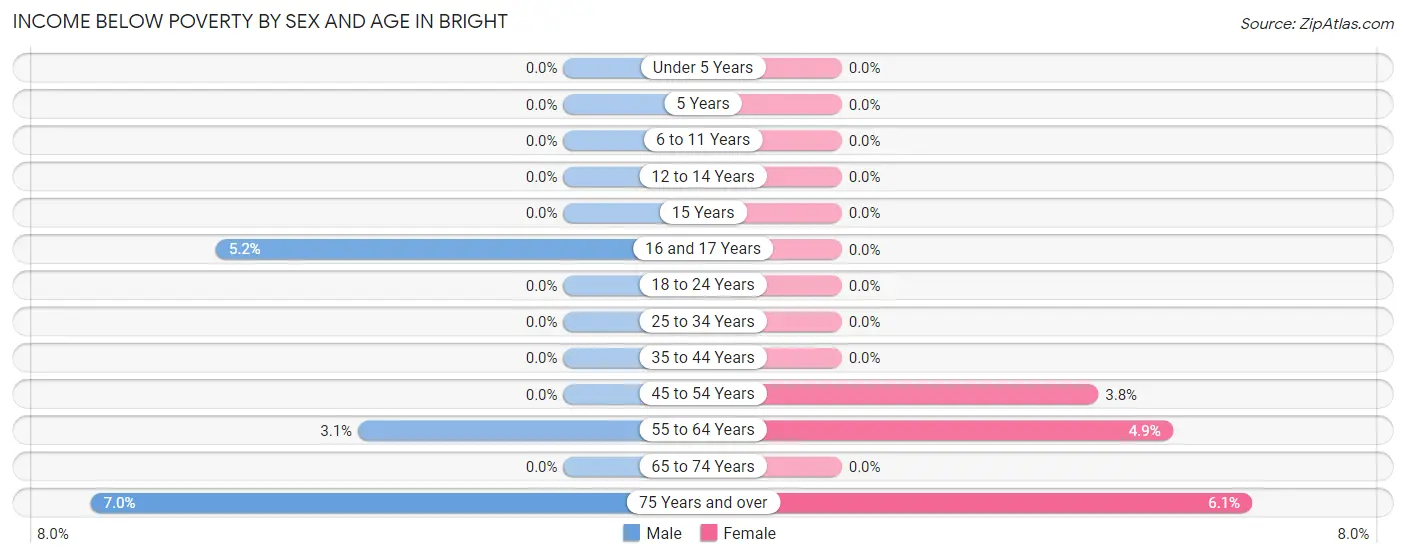
| Age Bracket | Male | Female |
| Under 5 Years | 0 (0.0%) | 0 (0.0%) |
| 5 Years | 0 (0.0%) | 0 (0.0%) |
| 6 to 11 Years | 0 (0.0%) | 0 (0.0%) |
| 12 to 14 Years | 0 (0.0%) | 0 (0.0%) |
| 15 Years | 0 (0.0%) | 0 (0.0%) |
| 16 and 17 Years | 8 (5.2%) | 0 (0.0%) |
| 18 to 24 Years | 0 (0.0%) | 0 (0.0%) |
| 25 to 34 Years | 0 (0.0%) | 0 (0.0%) |
| 35 to 44 Years | 0 (0.0%) | 0 (0.0%) |
| 45 to 54 Years | 0 (0.0%) | 12 (3.8%) |
| 55 to 64 Years | 12 (3.0%) | 21 (4.9%) |
| 65 to 74 Years | 0 (0.0%) | 0 (0.0%) |
| 75 Years and over | 8 (7.0%) | 12 (6.1%) |
| Total | 28 (1.0%) | 45 (1.5%) |
Income Above Poverty by Sex and Age in Bright
According to the poverty statistics in Bright, males aged under 5 years and females aged under 5 years are the age groups that are most secure financially, with 100.0% of males and 100.0% of females in these age groups living above the poverty line.
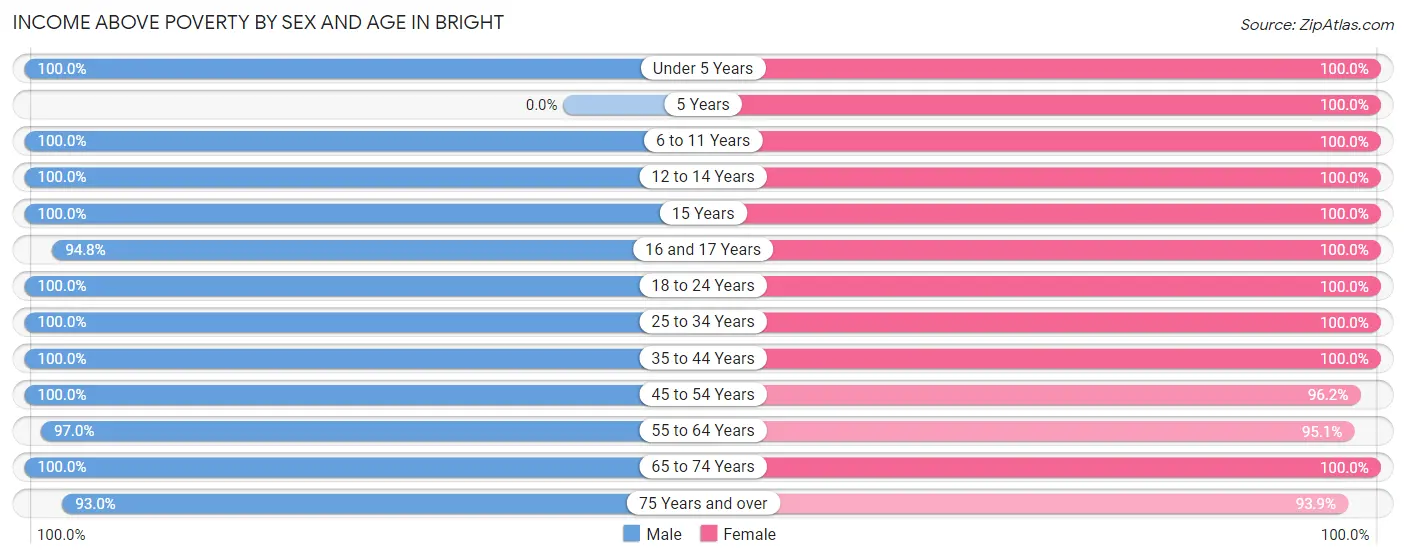
| Age Bracket | Male | Female |
| Under 5 Years | 194 (100.0%) | 96 (100.0%) |
| 5 Years | 0 (0.0%) | 51 (100.0%) |
| 6 to 11 Years | 170 (100.0%) | 234 (100.0%) |
| 12 to 14 Years | 149 (100.0%) | 155 (100.0%) |
| 15 Years | 77 (100.0%) | 105 (100.0%) |
| 16 and 17 Years | 147 (94.8%) | 49 (100.0%) |
| 18 to 24 Years | 344 (100.0%) | 195 (100.0%) |
| 25 to 34 Years | 200 (100.0%) | 213 (100.0%) |
| 35 to 44 Years | 317 (100.0%) | 540 (100.0%) |
| 45 to 54 Years | 379 (100.0%) | 303 (96.2%) |
| 55 to 64 Years | 381 (97.0%) | 407 (95.1%) |
| 65 to 74 Years | 374 (100.0%) | 407 (100.0%) |
| 75 Years and over | 106 (93.0%) | 185 (93.9%) |
| Total | 2,838 (99.0%) | 2,940 (98.5%) |
Income Below Poverty Among Married-Couple Families in Bright
The poverty statistics for married-couple families in Bright show that 0.8% or 12 of the total 1,545 families live below the poverty line. Families with no children have the highest poverty rate of 1.4%, comprising of 12 families. On the other hand, families with 1 or 2 children have the lowest poverty rate of 0.0%, which includes 0 families.
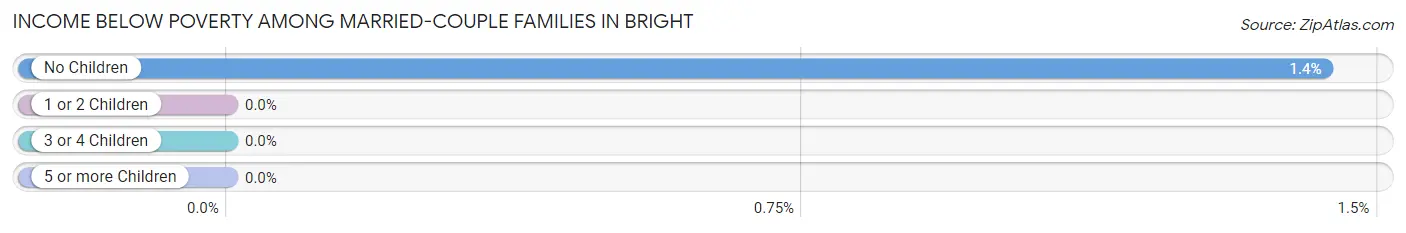
| Children | Above Poverty | Below Poverty |
| No Children | 826 (98.6%) | 12 (1.4%) |
| 1 or 2 Children | 594 (100.0%) | 0 (0.0%) |
| 3 or 4 Children | 113 (100.0%) | 0 (0.0%) |
| 5 or more Children | 0 (0.0%) | 0 (0.0%) |
| Total | 1,533 (99.2%) | 12 (0.8%) |
Income Below Poverty Among Single-Parent Households in Bright
| Children | Single Father | Single Mother |
| No Children | 0 (0.0%) | 0 (0.0%) |
| 1 or 2 Children | 0 (0.0%) | 0 (0.0%) |
| 3 or 4 Children | 0 (0.0%) | 0 (0.0%) |
| 5 or more Children | 0 (0.0%) | 0 (0.0%) |
| Total | 0 (0.0%) | 0 (0.0%) |
Income Below Poverty Among Married-Couple vs Single-Parent Households in Bright
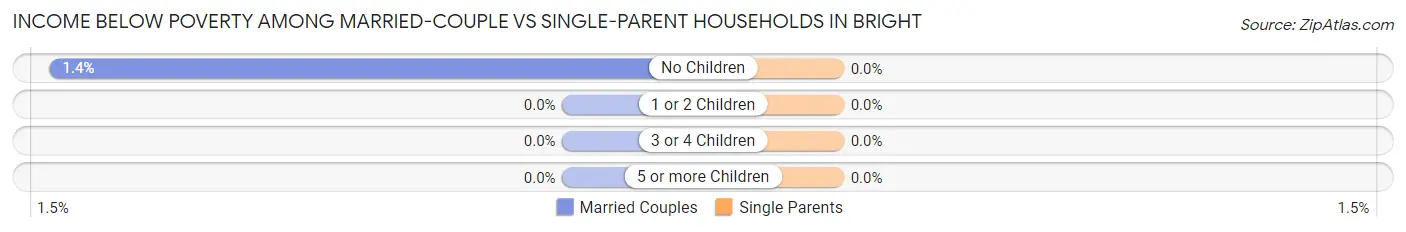
| Children | Married-Couple Families | Single-Parent Households |
| No Children | 12 (1.4%) | 0 (0.0%) |
| 1 or 2 Children | 0 (0.0%) | 0 (0.0%) |
| 3 or 4 Children | 0 (0.0%) | 0 (0.0%) |
| 5 or more Children | 0 (0.0%) | 0 (0.0%) |
| Total | 12 (0.8%) | 0 (0.0%) |
Race in Bright
The most populous races in Bright are White / Caucasian (5,569 | 95.1%), Asian (153 | 2.6%), and Hispanic or Latino (114 | 1.9%).
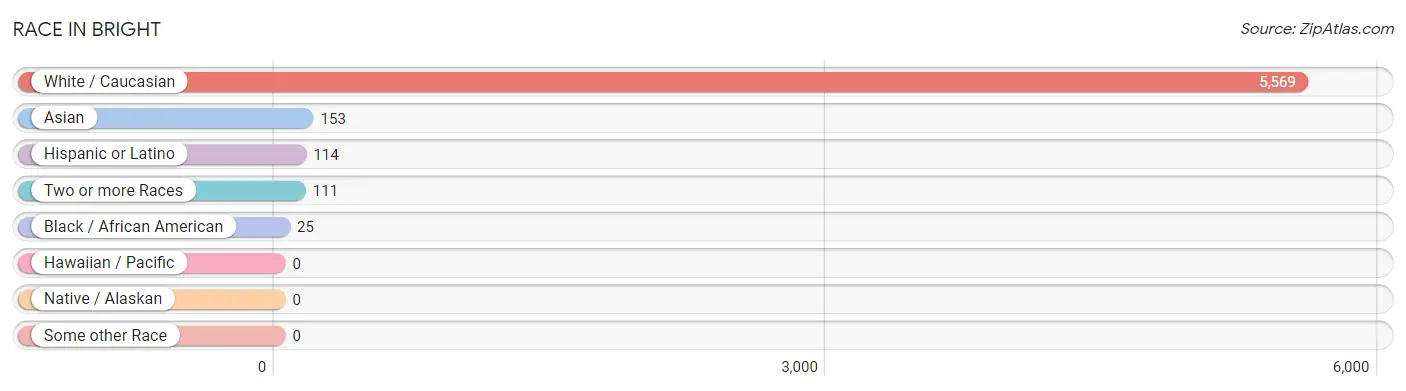
| Race | # Population | % Population |
| Asian | 153 | 2.6% |
| Black / African American | 25 | 0.4% |
| Hawaiian / Pacific | 0 | 0.0% |
| Hispanic or Latino | 114 | 1.9% |
| Native / Alaskan | 0 | 0.0% |
| White / Caucasian | 5,569 | 95.1% |
| Two or more Races | 111 | 1.9% |
| Some other Race | 0 | 0.0% |
| Total | 5,858 | 100.0% |
Ancestry in Bright
The most populous ancestries reported in Bright are German (2,546 | 43.5%), Irish (768 | 13.1%), American (751 | 12.8%), English (507 | 8.6%), and Dutch (206 | 3.5%), together accounting for 81.6% of all Bright residents.
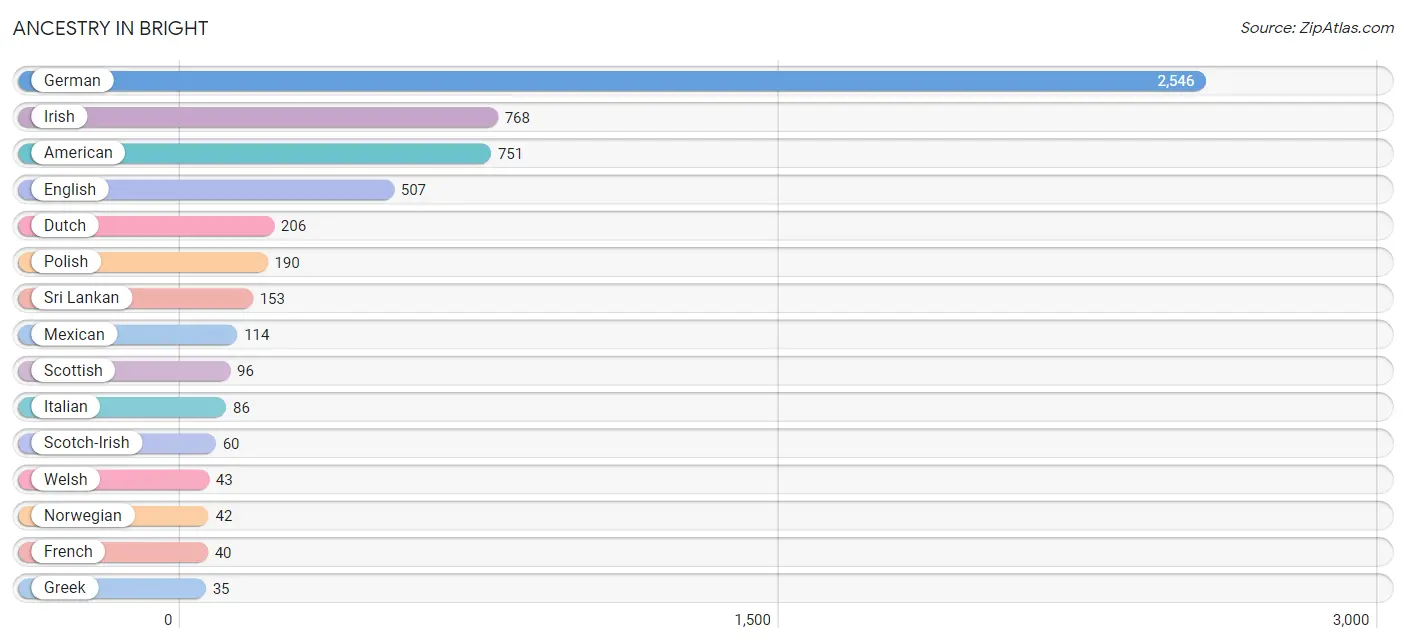
| Ancestry | # Population | % Population |
| American | 751 | 12.8% |
| British | 26 | 0.4% |
| Cherokee | 4 | 0.1% |
| Dutch | 206 | 3.5% |
| English | 507 | 8.6% |
| French | 40 | 0.7% |
| German | 2,546 | 43.5% |
| Greek | 35 | 0.6% |
| Hungarian | 18 | 0.3% |
| Irish | 768 | 13.1% |
| Italian | 86 | 1.5% |
| Mexican | 114 | 1.9% |
| Norwegian | 42 | 0.7% |
| Polish | 190 | 3.2% |
| Scandinavian | 10 | 0.2% |
| Scotch-Irish | 60 | 1.0% |
| Scottish | 96 | 1.6% |
| Sri Lankan | 153 | 2.6% |
| Welsh | 43 | 0.7% | View All 19 Rows |
Immigrants in Bright
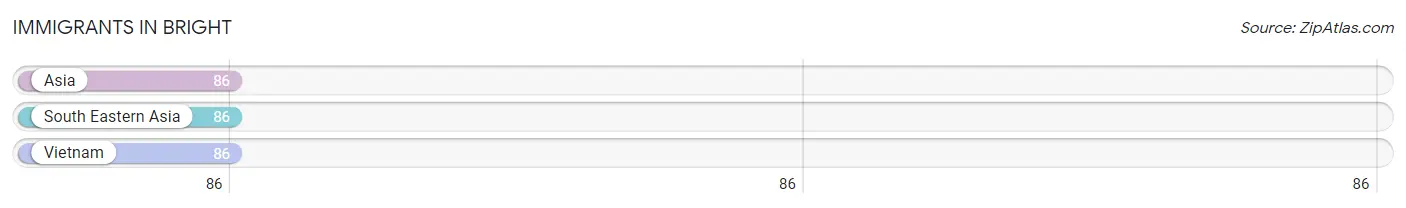
The most numerous immigrant groups reported in Bright came from Asia (86 | 1.5%), South Eastern Asia (86 | 1.5%), and Vietnam (86 | 1.5%), together accounting for 4.4% of all Bright residents.
| Immigration Origin | # Population | % Population |
| Asia | 86 | 1.5% |
| South Eastern Asia | 86 | 1.5% |
| Vietnam | 86 | 1.5% | View All 3 Rows |
Sex and Age in Bright
Sex and Age in Bright
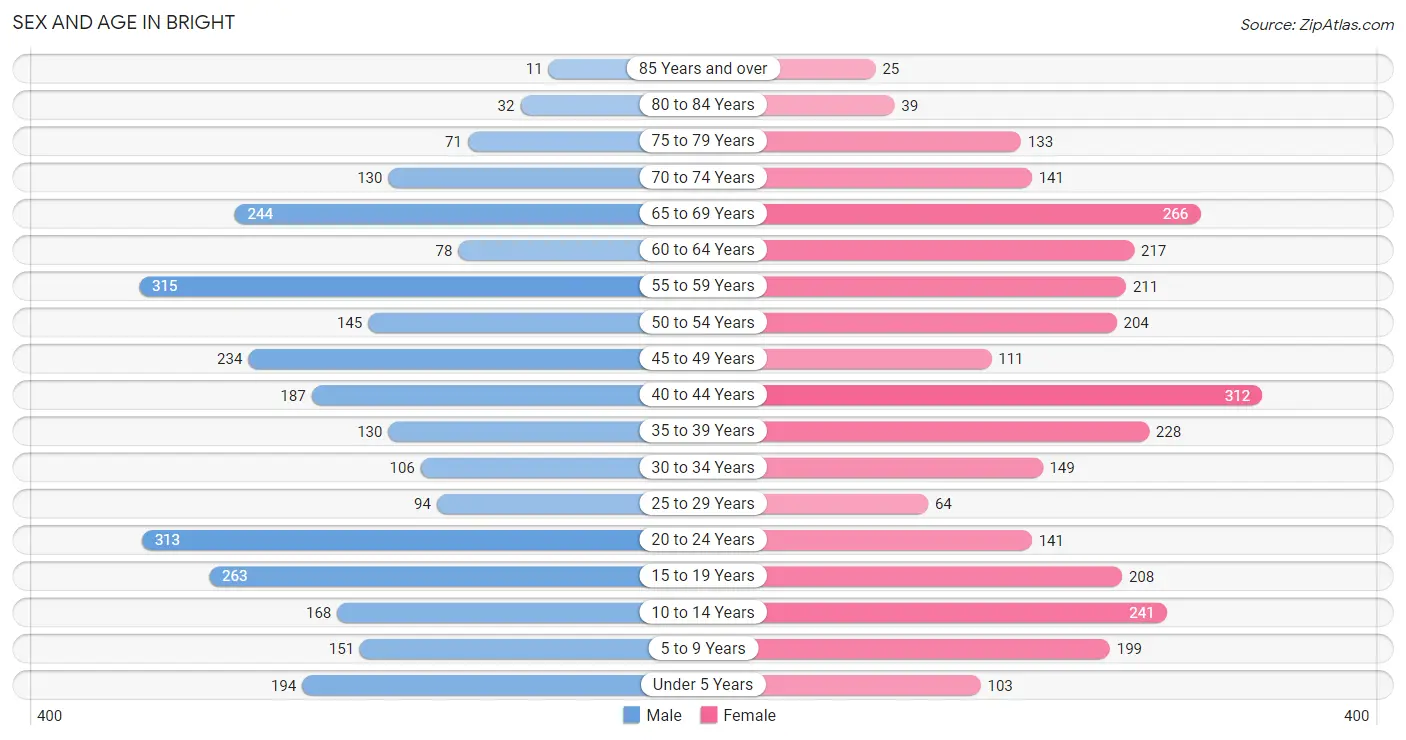
The most populous age groups in Bright are 55 to 59 Years (315 | 11.0%) for men and 40 to 44 Years (312 | 10.4%) for women.
| Age Bracket | Male | Female |
| Under 5 Years | 194 (6.8%) | 103 (3.4%) |
| 5 to 9 Years | 151 (5.3%) | 199 (6.7%) |
| 10 to 14 Years | 168 (5.9%) | 241 (8.1%) |
| 15 to 19 Years | 263 (9.2%) | 208 (7.0%) |
| 20 to 24 Years | 313 (10.9%) | 141 (4.7%) |
| 25 to 29 Years | 94 (3.3%) | 64 (2.1%) |
| 30 to 34 Years | 106 (3.7%) | 149 (5.0%) |
| 35 to 39 Years | 130 (4.5%) | 228 (7.6%) |
| 40 to 44 Years | 187 (6.5%) | 312 (10.4%) |
| 45 to 49 Years | 234 (8.2%) | 111 (3.7%) |
| 50 to 54 Years | 145 (5.1%) | 204 (6.8%) |
| 55 to 59 Years | 315 (11.0%) | 211 (7.0%) |
| 60 to 64 Years | 78 (2.7%) | 217 (7.2%) |
| 65 to 69 Years | 244 (8.5%) | 266 (8.9%) |
| 70 to 74 Years | 130 (4.5%) | 141 (4.7%) |
| 75 to 79 Years | 71 (2.5%) | 133 (4.4%) |
| 80 to 84 Years | 32 (1.1%) | 39 (1.3%) |
| 85 Years and over | 11 (0.4%) | 25 (0.8%) |
| Total | 2,866 (100.0%) | 2,992 (100.0%) |
Families and Households in Bright
Median Family Size in Bright
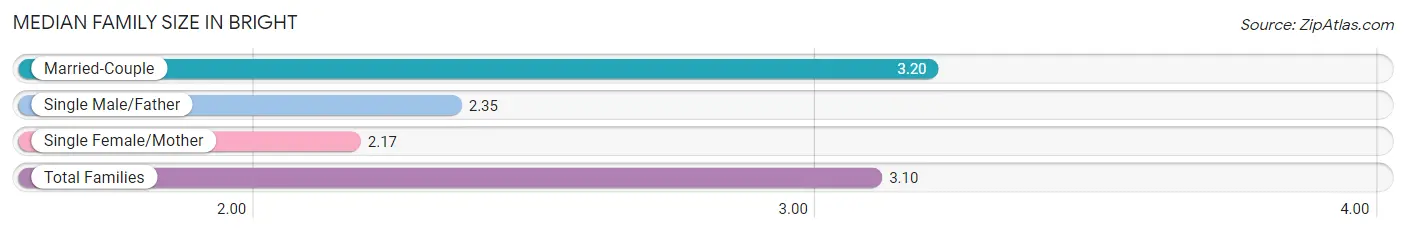
The median family size in Bright is 3.10 persons per family, with married-couple families (1,545 | 89.8%) accounting for the largest median family size of 3.2 persons per family. On the other hand, single female/mother families (120 | 7.0%) represent the smallest median family size with 2.17 persons per family.
| Family Type | # Families | Family Size |
| Married-Couple | 1,545 (89.8%) | 3.20 |
| Single Male/Father | 55 (3.2%) | 2.35 |
| Single Female/Mother | 120 (7.0%) | 2.17 |
| Total Families | 1,720 (100.0%) | 3.10 |
Median Household Size in Bright
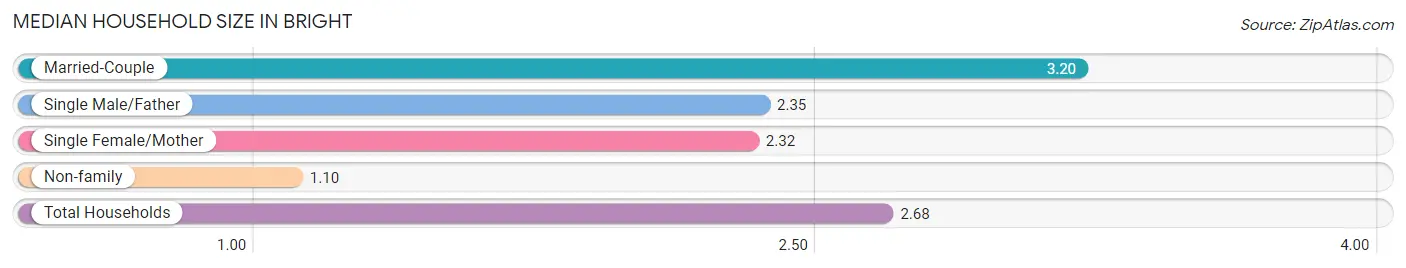
The median household size in Bright is 2.68 persons per household, with married-couple households (1,545 | 70.6%) accounting for the largest median household size of 3.2 persons per household. non-family households (468 | 21.4%) represent the smallest median household size with 1.10 persons per household.
| Household Type | # Households | Household Size |
| Married-Couple | 1,545 (70.6%) | 3.20 |
| Single Male/Father | 55 (2.5%) | 2.35 |
| Single Female/Mother | 120 (5.5%) | 2.32 |
| Non-family | 468 (21.4%) | 1.10 |
| Total Households | 2,188 (100.0%) | 2.68 |
Household Size by Marriage Status in Bright
Out of a total of 2,188 households in Bright, 1,720 (78.6%) are family households, while 468 (21.4%) are nonfamily households. The most numerous type of family households are 2-person households, comprising 739, and the most common type of nonfamily households are 1-person households, comprising 409.
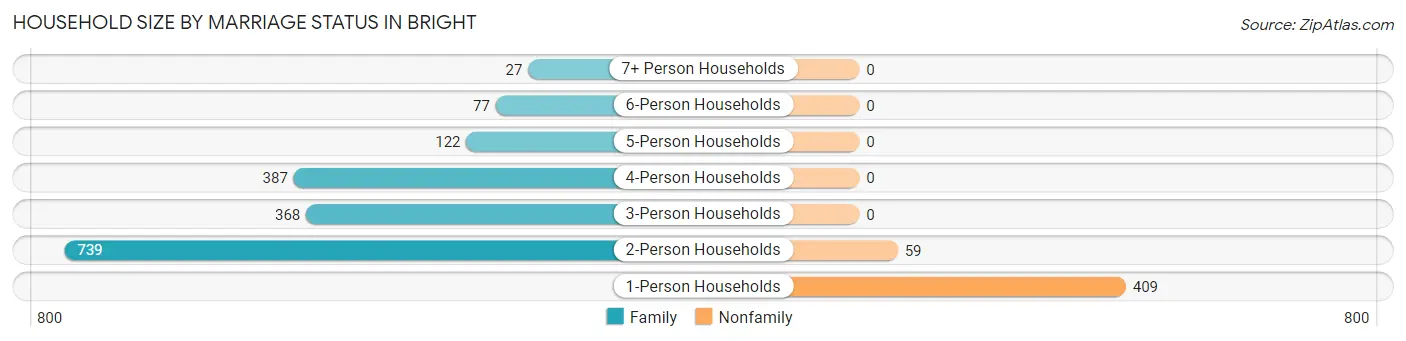
| Household Size | Family Households | Nonfamily Households |
| 1-Person Households | - | 409 (18.7%) |
| 2-Person Households | 739 (33.8%) | 59 (2.7%) |
| 3-Person Households | 368 (16.8%) | 0 (0.0%) |
| 4-Person Households | 387 (17.7%) | 0 (0.0%) |
| 5-Person Households | 122 (5.6%) | 0 (0.0%) |
| 6-Person Households | 77 (3.5%) | 0 (0.0%) |
| 7+ Person Households | 27 (1.2%) | 0 (0.0%) |
| Total | 1,720 (78.6%) | 468 (21.4%) |
Female Fertility in Bright
Fertility by Age in Bright
Average fertility rate in Bright is 40.0 births per 1,000 women. Women in the age bracket of 35 to 50 years have the highest fertility rate with 65.0 births per 1,000 women. Women in the age bracket of 35 to 50 years acount for 90.0% of all women with births.
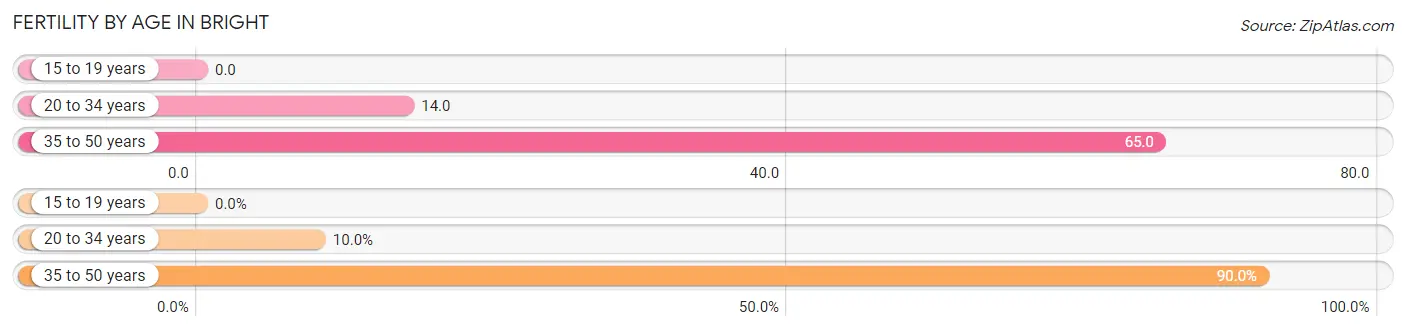
| Age Bracket | Women with Births | Births / 1,000 Women |
| 15 to 19 years | 0 (0.0%) | 0.0 |
| 20 to 34 years | 5 (10.0%) | 14.0 |
| 35 to 50 years | 45 (90.0%) | 65.0 |
| Total | 50 (100.0%) | 40.0 |
Fertility by Age by Marriage Status in Bright
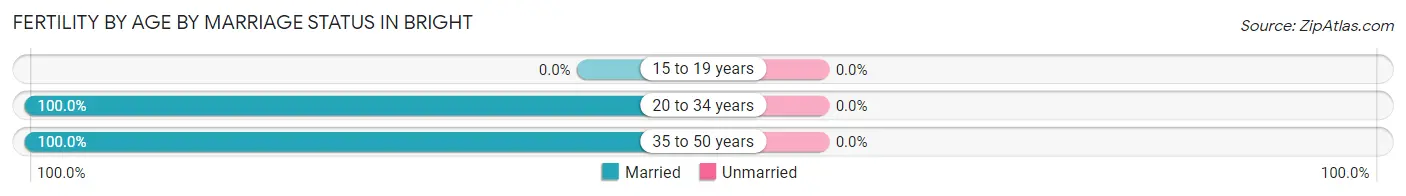
| Age Bracket | Married | Unmarried |
| 15 to 19 years | 0 (0.0%) | 0 (0.0%) |
| 20 to 34 years | 5 (100.0%) | 0 (0.0%) |
| 35 to 50 years | 45 (100.0%) | 0 (0.0%) |
| Total | 50 (100.0%) | 0 (0.0%) |
Fertility by Education in Bright
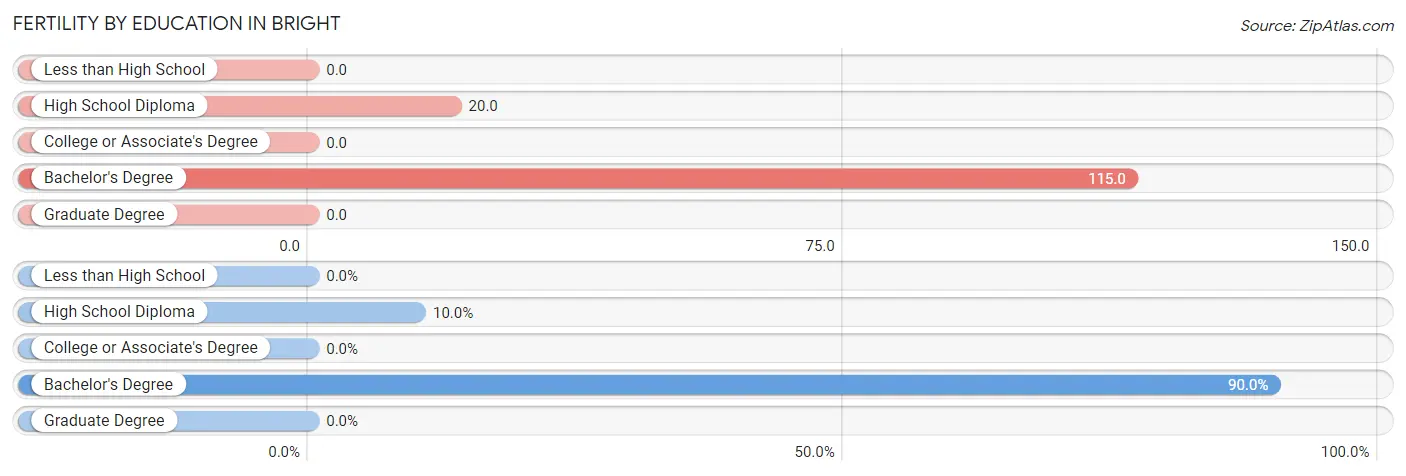
| Educational Attainment | Women with Births | Births / 1,000 Women |
| Less than High School | 0 (0.0%) | 0.0 |
| High School Diploma | 5 (10.0%) | 20.0 |
| College or Associate's Degree | 0 (0.0%) | 0.0 |
| Bachelor's Degree | 45 (90.0%) | 115.0 |
| Graduate Degree | 0 (0.0%) | 0.0 |
| Total | 50 (100.0%) | 40.0 |
Fertility by Education by Marriage Status in Bright
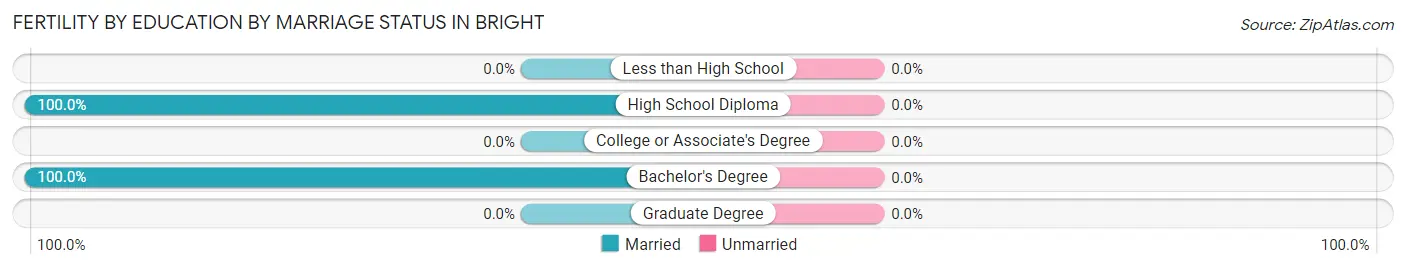
| Educational Attainment | Married | Unmarried |
| Less than High School | 0 (0.0%) | 0 (0.0%) |
| High School Diploma | 5 (100.0%) | 0 (0.0%) |
| College or Associate's Degree | 0 (0.0%) | 0 (0.0%) |
| Bachelor's Degree | 45 (100.0%) | 0 (0.0%) |
| Graduate Degree | 0 (0.0%) | 0 (0.0%) |
| Total | 50 (100.0%) | 0 (0.0%) |
Employment Characteristics in Bright
Employment by Class of Employer in Bright
Among the 3,115 employed individuals in Bright, private company employees (2,260 | 72.6%), not-for-profit organizations (367 | 11.8%), and local government employees (269 | 8.6%) make up the most common classes of employment.
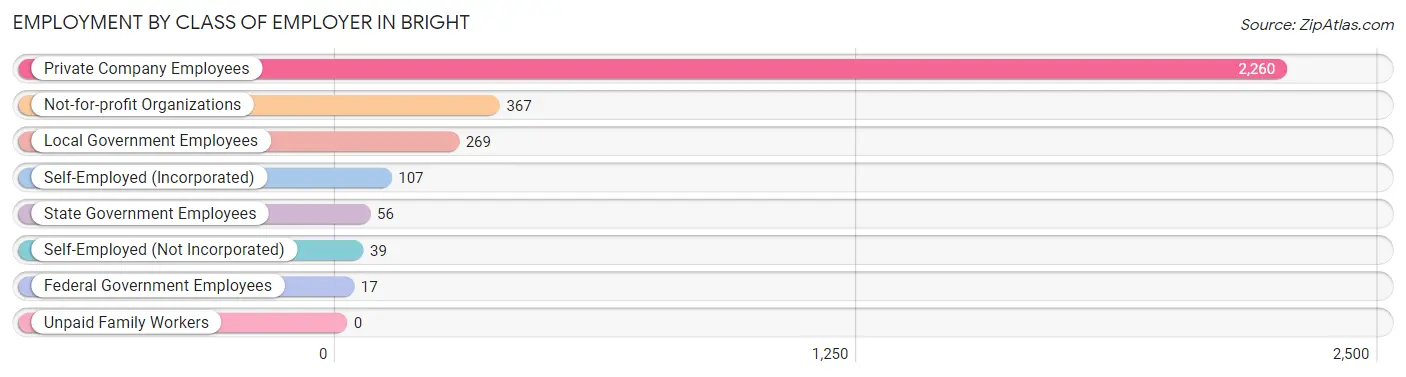
| Employer Class | # Employees | % Employees |
| Private Company Employees | 2,260 | 72.6% |
| Self-Employed (Incorporated) | 107 | 3.4% |
| Self-Employed (Not Incorporated) | 39 | 1.3% |
| Not-for-profit Organizations | 367 | 11.8% |
| Local Government Employees | 269 | 8.6% |
| State Government Employees | 56 | 1.8% |
| Federal Government Employees | 17 | 0.5% |
| Unpaid Family Workers | 0 | 0.0% |
| Total | 3,115 | 100.0% |
Employment Status by Age in Bright
According to the labor force statistics for Bright, out of the total population over 16 years of age (4,620), 69.2% or 3,197 individuals are in the labor force, with 1.9% or 61 of them unemployed. The age group with the highest labor force participation rate is 35 to 44 years, with 94.2% or 807 individuals in the labor force. Within the labor force, the 25 to 29 years age range has the highest percentage of unemployed individuals, with 12.9% or 18 of them being unemployed.
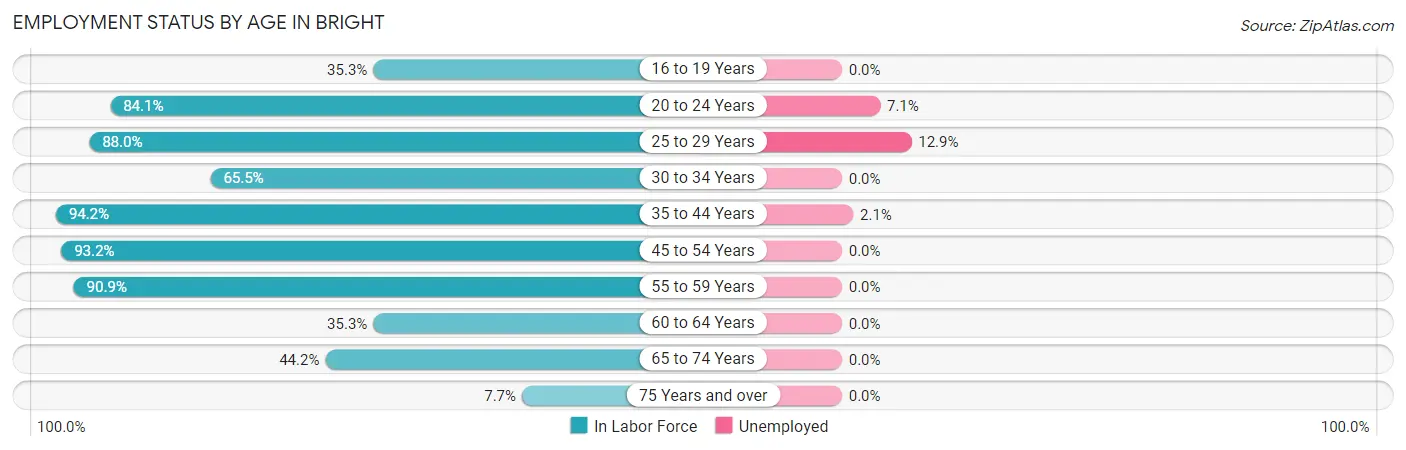
| Age Bracket | In Labor Force | Unemployed |
| 16 to 19 Years | 102 (35.3%) | 0 (0.0%) |
| 20 to 24 Years | 382 (84.1%) | 27 (7.1%) |
| 25 to 29 Years | 139 (88.0%) | 18 (12.9%) |
| 30 to 34 Years | 167 (65.5%) | 0 (0.0%) |
| 35 to 44 Years | 807 (94.2%) | 17 (2.1%) |
| 45 to 54 Years | 647 (93.2%) | 0 (0.0%) |
| 55 to 59 Years | 478 (90.9%) | 0 (0.0%) |
| 60 to 64 Years | 104 (35.3%) | 0 (0.0%) |
| 65 to 74 Years | 345 (44.2%) | 0 (0.0%) |
| 75 Years and over | 24 (7.7%) | 0 (0.0%) |
| Total | 3,197 (69.2%) | 61 (1.9%) |
Employment Status by Educational Attainment in Bright
According to labor force statistics for Bright, 84.1% of individuals (2,342) out of the total population between 25 and 64 years of age (2,785) are in the labor force, with 1.5% or 35 of them being unemployed. The group with the highest labor force participation rate are those with the educational attainment of bachelor's degree or higher, with 94.2% or 861 individuals in the labor force. Within the labor force, individuals with college / associate degree education have the highest percentage of unemployment, with 4.2% or 35 of them being unemployed.
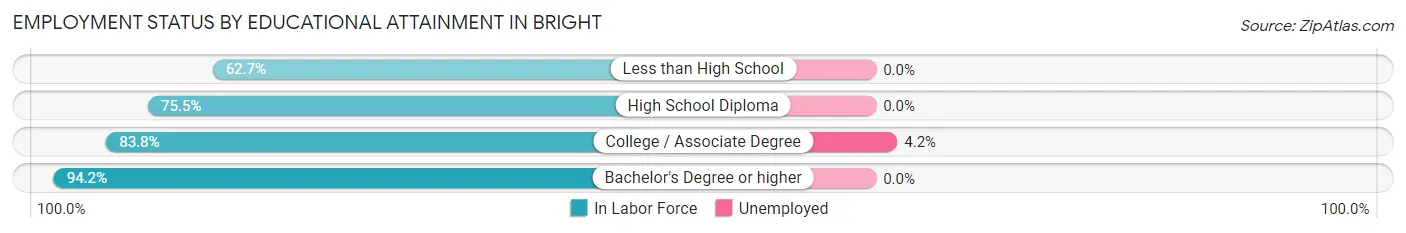
| Educational Attainment | In Labor Force | Unemployed |
| Less than High School | 74 (62.7%) | 0 (0.0%) |
| High School Diploma | 568 (75.5%) | 0 (0.0%) |
| College / Associate Degree | 839 (83.8%) | 42 (4.2%) |
| Bachelor's Degree or higher | 861 (94.2%) | 0 (0.0%) |
| Total | 2,342 (84.1%) | 42 (1.5%) |
Employment Occupations by Sex in Bright
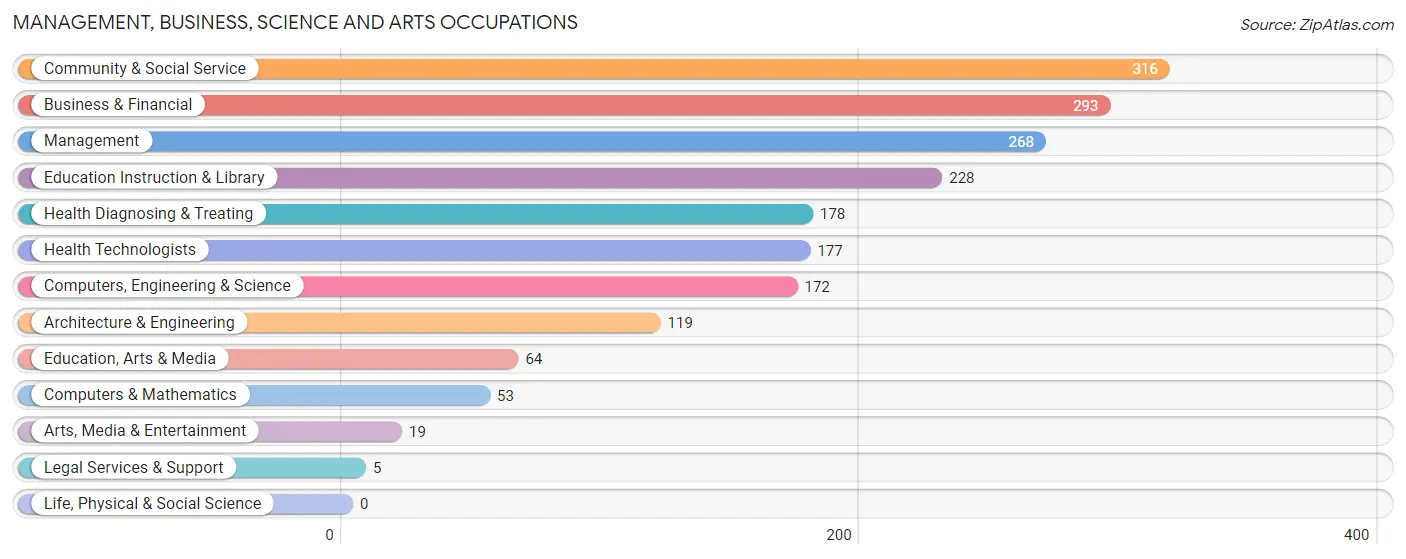
Management, Business, Science and Arts Occupations
The most common Management, Business, Science and Arts occupations in Bright are Community & Social Service (316 | 10.1%), Business & Financial (293 | 9.3%), Management (268 | 8.6%), Education Instruction & Library (228 | 7.3%), and Health Diagnosing & Treating (178 | 5.7%).
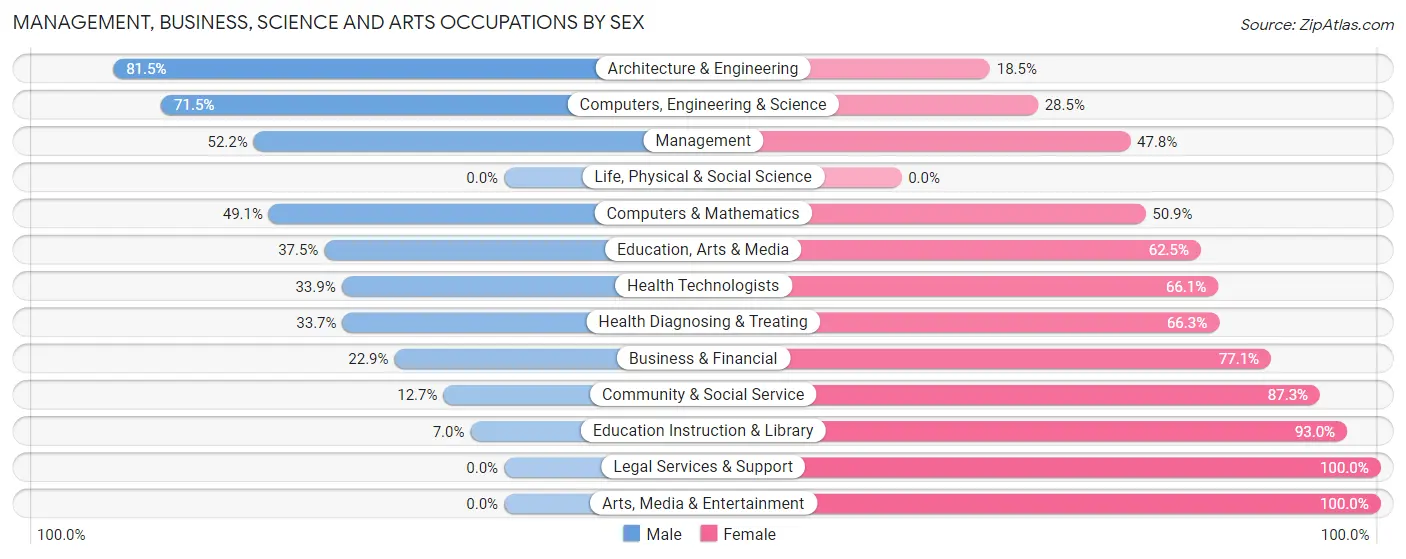
Management, Business, Science and Arts Occupations by Sex
Within the Management, Business, Science and Arts occupations in Bright, the most male-oriented occupations are Architecture & Engineering (81.5%), Computers, Engineering & Science (71.5%), and Management (52.2%), while the most female-oriented occupations are Legal Services & Support (100.0%), Arts, Media & Entertainment (100.0%), and Education Instruction & Library (93.0%).
| Occupation | Male | Female |
| Management | 140 (52.2%) | 128 (47.8%) |
| Business & Financial | 67 (22.9%) | 226 (77.1%) |
| Computers, Engineering & Science | 123 (71.5%) | 49 (28.5%) |
| Computers & Mathematics | 26 (49.1%) | 27 (50.9%) |
| Architecture & Engineering | 97 (81.5%) | 22 (18.5%) |
| Life, Physical & Social Science | 0 (0.0%) | 0 (0.0%) |
| Community & Social Service | 40 (12.7%) | 276 (87.3%) |
| Education, Arts & Media | 24 (37.5%) | 40 (62.5%) |
| Legal Services & Support | 0 (0.0%) | 5 (100.0%) |
| Education Instruction & Library | 16 (7.0%) | 212 (93.0%) |
| Arts, Media & Entertainment | 0 (0.0%) | 19 (100.0%) |
| Health Diagnosing & Treating | 60 (33.7%) | 118 (66.3%) |
| Health Technologists | 60 (33.9%) | 117 (66.1%) |
| Total (Category) | 430 (35.0%) | 797 (65.0%) |
| Total (Overall) | 1,687 (53.8%) | 1,446 (46.2%) |
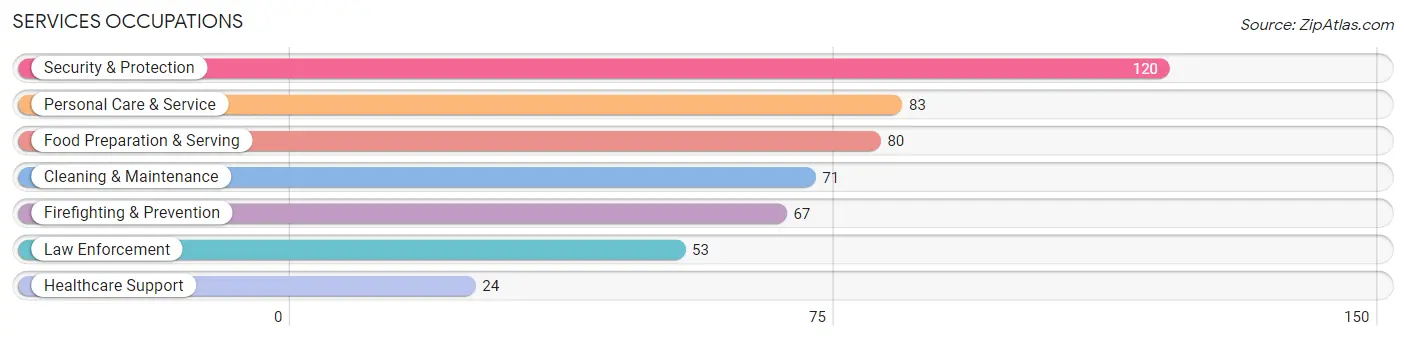
Services Occupations
The most common Services occupations in Bright are Security & Protection (120 | 3.8%), Personal Care & Service (83 | 2.6%), Food Preparation & Serving (80 | 2.5%), Cleaning & Maintenance (71 | 2.3%), and Firefighting & Prevention (67 | 2.1%).
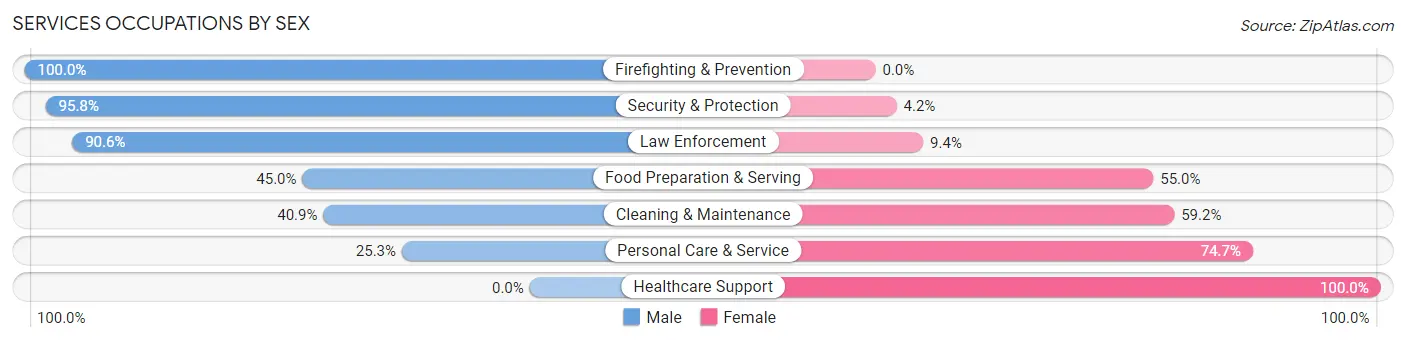
Services Occupations by Sex
Within the Services occupations in Bright, the most male-oriented occupations are Firefighting & Prevention (100.0%), Security & Protection (95.8%), and Law Enforcement (90.6%), while the most female-oriented occupations are Healthcare Support (100.0%), Personal Care & Service (74.7%), and Cleaning & Maintenance (59.2%).
| Occupation | Male | Female |
| Healthcare Support | 0 (0.0%) | 24 (100.0%) |
| Security & Protection | 115 (95.8%) | 5 (4.2%) |
| Firefighting & Prevention | 67 (100.0%) | 0 (0.0%) |
| Law Enforcement | 48 (90.6%) | 5 (9.4%) |
| Food Preparation & Serving | 36 (45.0%) | 44 (55.0%) |
| Cleaning & Maintenance | 29 (40.8%) | 42 (59.2%) |
| Personal Care & Service | 21 (25.3%) | 62 (74.7%) |
| Total (Category) | 201 (53.2%) | 177 (46.8%) |
| Total (Overall) | 1,687 (53.8%) | 1,446 (46.2%) |
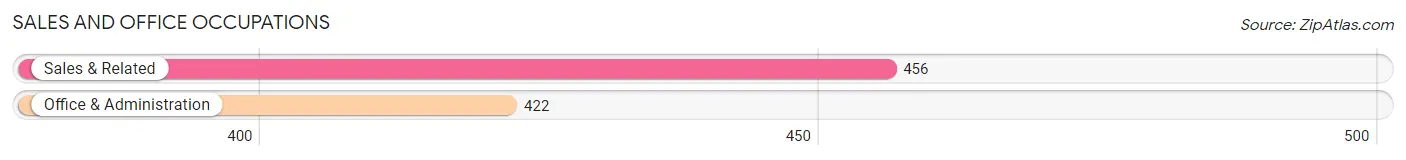
Sales and Office Occupations
The most common Sales and Office occupations in Bright are Sales & Related (456 | 14.5%), and Office & Administration (422 | 13.5%).
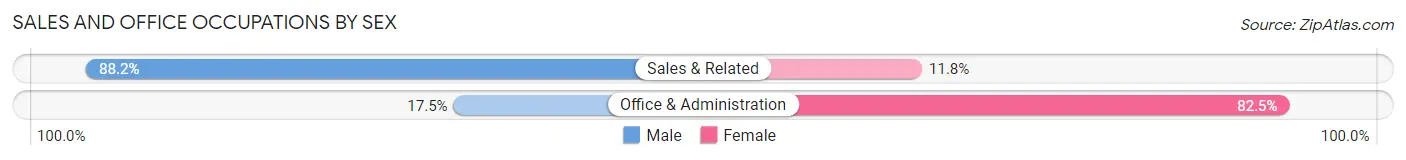
Sales and Office Occupations by Sex
| Occupation | Male | Female |
| Sales & Related | 402 (88.2%) | 54 (11.8%) |
| Office & Administration | 74 (17.5%) | 348 (82.5%) |
| Total (Category) | 476 (54.2%) | 402 (45.8%) |
| Total (Overall) | 1,687 (53.8%) | 1,446 (46.2%) |
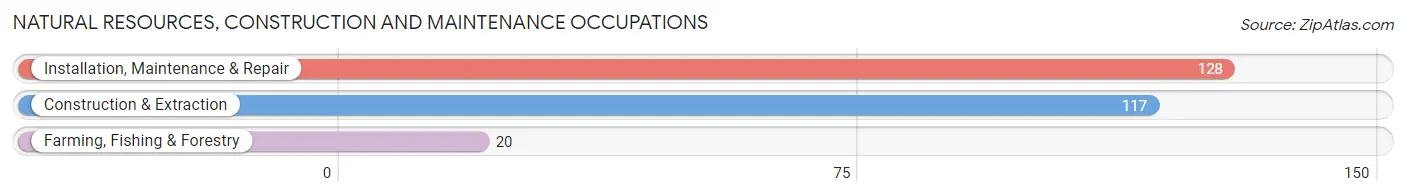
Natural Resources, Construction and Maintenance Occupations
The most common Natural Resources, Construction and Maintenance occupations in Bright are Installation, Maintenance & Repair (128 | 4.1%), Construction & Extraction (117 | 3.7%), and Farming, Fishing & Forestry (20 | 0.6%).
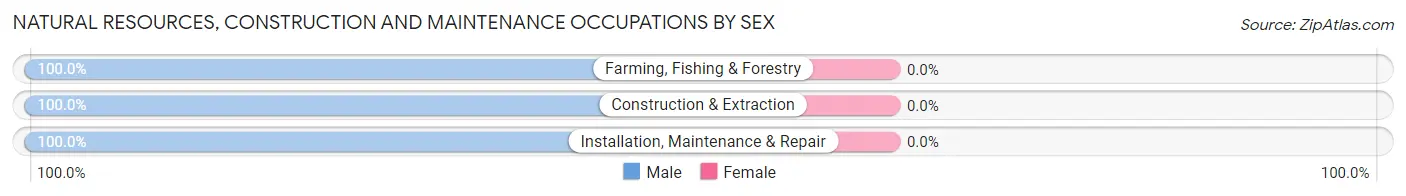
Natural Resources, Construction and Maintenance Occupations by Sex
| Occupation | Male | Female |
| Farming, Fishing & Forestry | 20 (100.0%) | 0 (0.0%) |
| Construction & Extraction | 117 (100.0%) | 0 (0.0%) |
| Installation, Maintenance & Repair | 128 (100.0%) | 0 (0.0%) |
| Total (Category) | 265 (100.0%) | 0 (0.0%) |
| Total (Overall) | 1,687 (53.8%) | 1,446 (46.2%) |
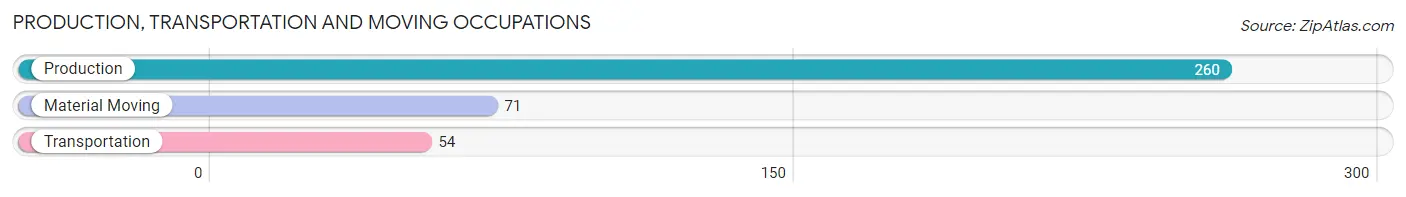
Production, Transportation and Moving Occupations
The most common Production, Transportation and Moving occupations in Bright are Production (260 | 8.3%), Material Moving (71 | 2.3%), and Transportation (54 | 1.7%).
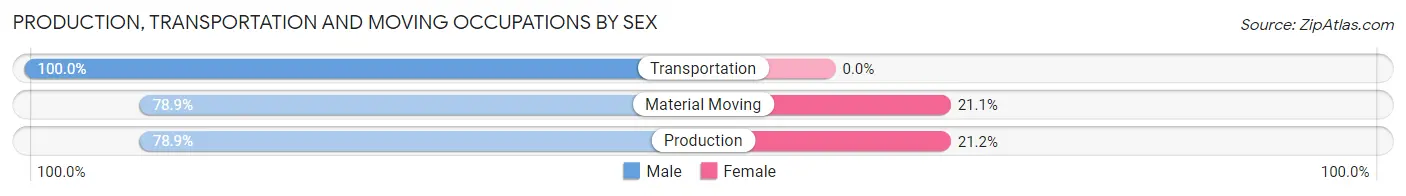
Production, Transportation and Moving Occupations by Sex
| Occupation | Male | Female |
| Production | 205 (78.8%) | 55 (21.1%) |
| Transportation | 54 (100.0%) | 0 (0.0%) |
| Material Moving | 56 (78.9%) | 15 (21.1%) |
| Total (Category) | 315 (81.8%) | 70 (18.2%) |
| Total (Overall) | 1,687 (53.8%) | 1,446 (46.2%) |
Employment Industries by Sex in Bright
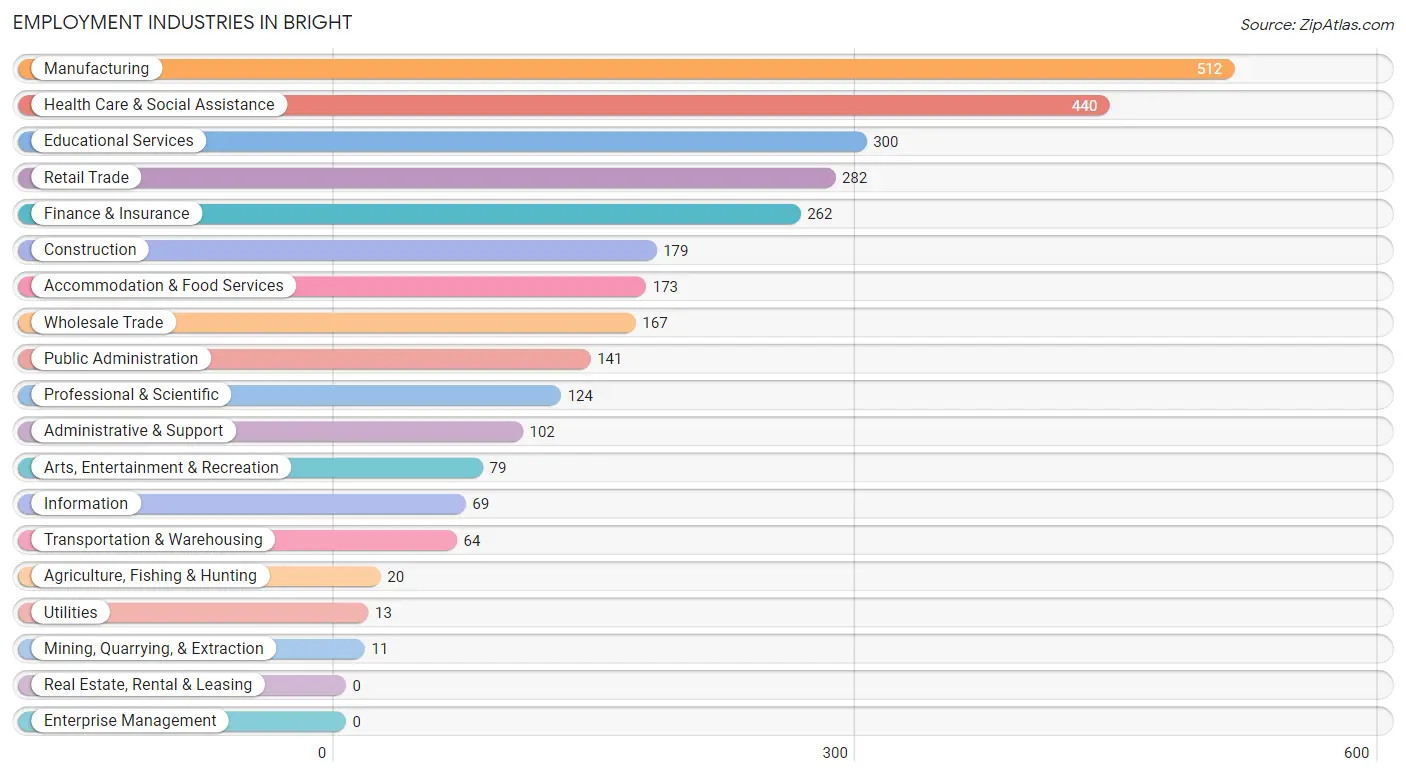
Employment Industries in Bright
The major employment industries in Bright include Manufacturing (512 | 16.3%), Health Care & Social Assistance (440 | 14.0%), Educational Services (300 | 9.6%), Retail Trade (282 | 9.0%), and Finance & Insurance (262 | 8.4%).
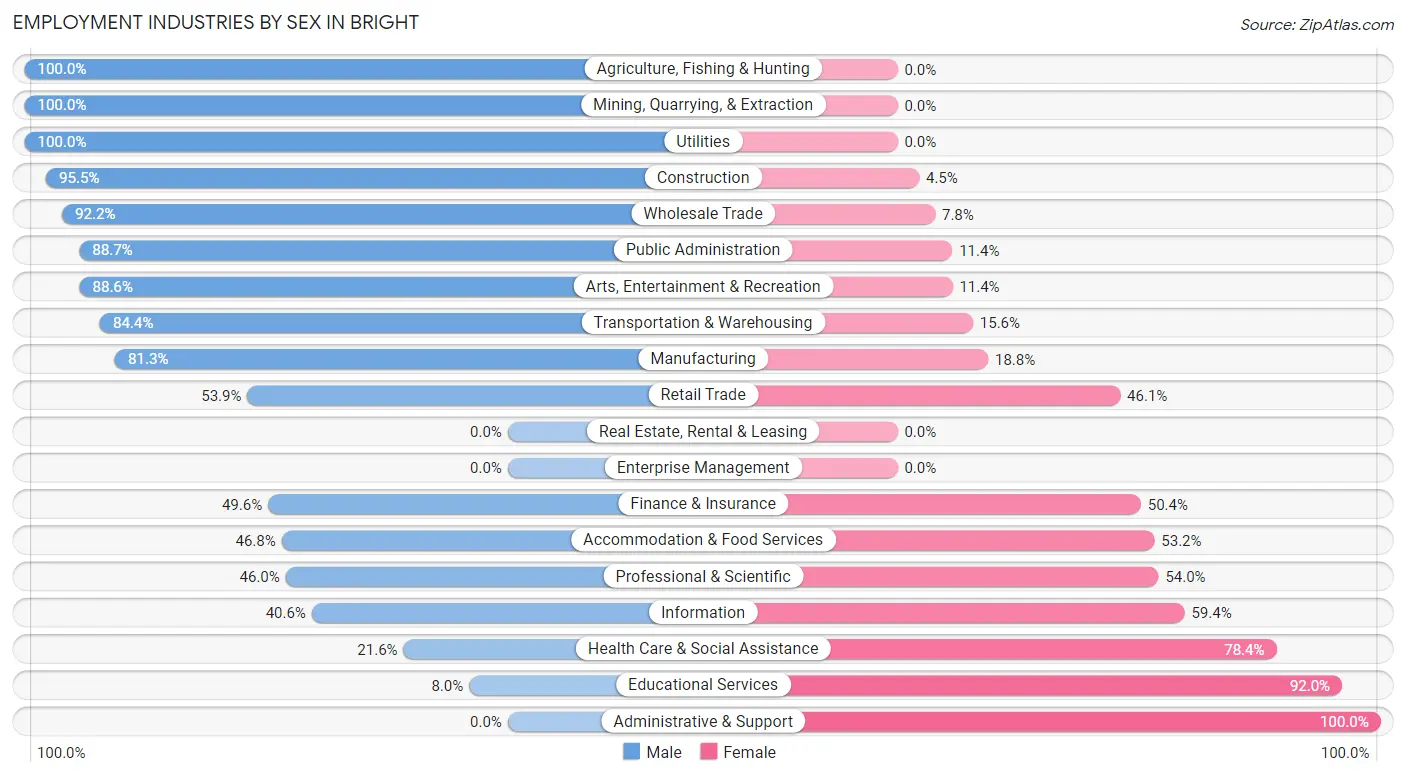
Employment Industries by Sex in Bright
The Bright industries that see more men than women are Agriculture, Fishing & Hunting (100.0%), Mining, Quarrying, & Extraction (100.0%), and Utilities (100.0%), whereas the industries that tend to have a higher number of women are Administrative & Support (100.0%), Educational Services (92.0%), and Health Care & Social Assistance (78.4%).
| Industry | Male | Female |
| Agriculture, Fishing & Hunting | 20 (100.0%) | 0 (0.0%) |
| Mining, Quarrying, & Extraction | 11 (100.0%) | 0 (0.0%) |
| Construction | 171 (95.5%) | 8 (4.5%) |
| Manufacturing | 416 (81.2%) | 96 (18.8%) |
| Wholesale Trade | 154 (92.2%) | 13 (7.8%) |
| Retail Trade | 152 (53.9%) | 130 (46.1%) |
| Transportation & Warehousing | 54 (84.4%) | 10 (15.6%) |
| Utilities | 13 (100.0%) | 0 (0.0%) |
| Information | 28 (40.6%) | 41 (59.4%) |
| Finance & Insurance | 130 (49.6%) | 132 (50.4%) |
| Real Estate, Rental & Leasing | 0 (0.0%) | 0 (0.0%) |
| Professional & Scientific | 57 (46.0%) | 67 (54.0%) |
| Enterprise Management | 0 (0.0%) | 0 (0.0%) |
| Administrative & Support | 0 (0.0%) | 102 (100.0%) |
| Educational Services | 24 (8.0%) | 276 (92.0%) |
| Health Care & Social Assistance | 95 (21.6%) | 345 (78.4%) |
| Arts, Entertainment & Recreation | 70 (88.6%) | 9 (11.4%) |
| Accommodation & Food Services | 81 (46.8%) | 92 (53.2%) |
| Public Administration | 125 (88.6%) | 16 (11.4%) |
| Total | 1,687 (53.8%) | 1,446 (46.2%) |
Education in Bright
School Enrollment in Bright
The most common levels of schooling among the 1,447 students in Bright are high school (486 | 33.6%), middle school (326 | 22.5%), and elementary school (272 | 18.8%).
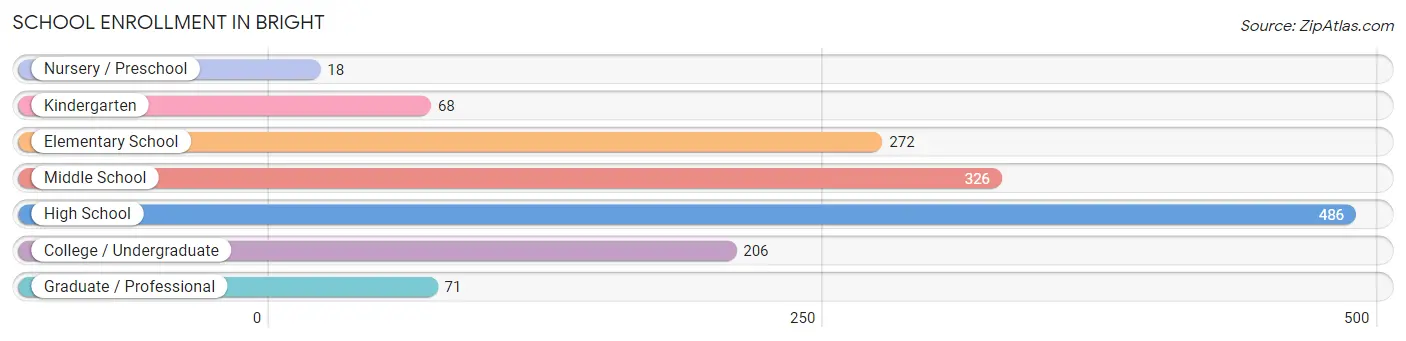
| School Level | # Students | % Students |
| Nursery / Preschool | 18 | 1.2% |
| Kindergarten | 68 | 4.7% |
| Elementary School | 272 | 18.8% |
| Middle School | 326 | 22.5% |
| High School | 486 | 33.6% |
| College / Undergraduate | 206 | 14.2% |
| Graduate / Professional | 71 | 4.9% |
| Total | 1,447 | 100.0% |
School Enrollment by Age by Funding Source in Bright
Out of a total of 1,447 students who are enrolled in schools in Bright, 208 (14.4%) attend a private institution, while the remaining 1,239 (85.6%) are enrolled in public schools. The age group of 3 to 4 year olds has the highest likelihood of being enrolled in private schools, with 17 (100.0% in the age bracket) enrolled. Conversely, the age group of 18 to 19 year olds has the lowest likelihood of being enrolled in a private school, with 42 (100.0% in the age bracket) attending a public institution.
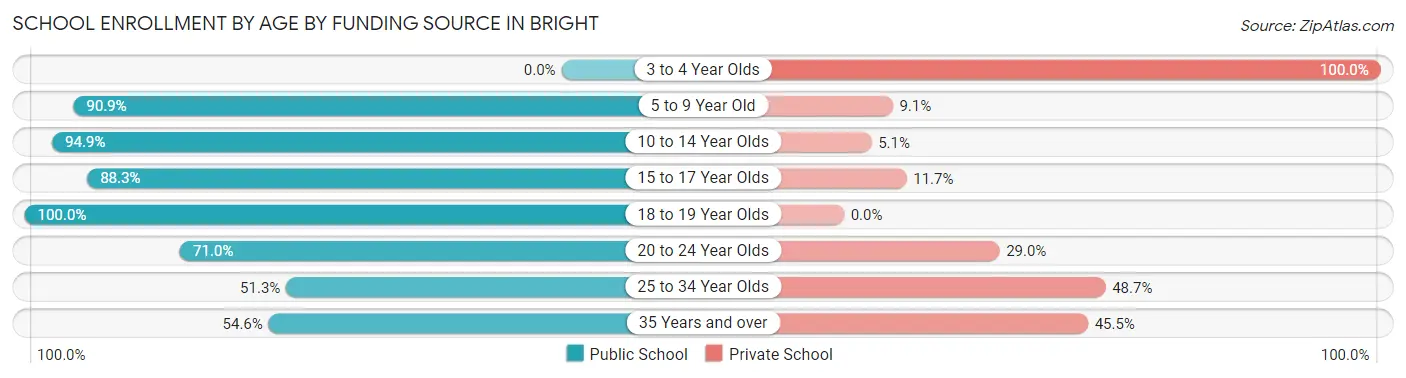
| Age Bracket | Public School | Private School |
| 3 to 4 Year Olds | 0 (0.0%) | 17 (100.0%) |
| 5 to 9 Year Old | 310 (90.9%) | 31 (9.1%) |
| 10 to 14 Year Olds | 388 (94.9%) | 21 (5.1%) |
| 15 to 17 Year Olds | 333 (88.3%) | 44 (11.7%) |
| 18 to 19 Year Olds | 42 (100.0%) | 0 (0.0%) |
| 20 to 24 Year Olds | 103 (71.0%) | 42 (29.0%) |
| 25 to 34 Year Olds | 20 (51.3%) | 19 (48.7%) |
| 35 Years and over | 42 (54.5%) | 35 (45.5%) |
| Total | 1,239 (85.6%) | 208 (14.4%) |
Educational Attainment by Field of Study in Bright
Education (301 | 22.5%), science & technology (284 | 21.2%), business (251 | 18.8%), computers & mathematics (126 | 9.4%), and bio, nature & agricultural (94 | 7.0%) are the most common fields of study among 1,337 individuals in Bright who have obtained a bachelor's degree or higher.
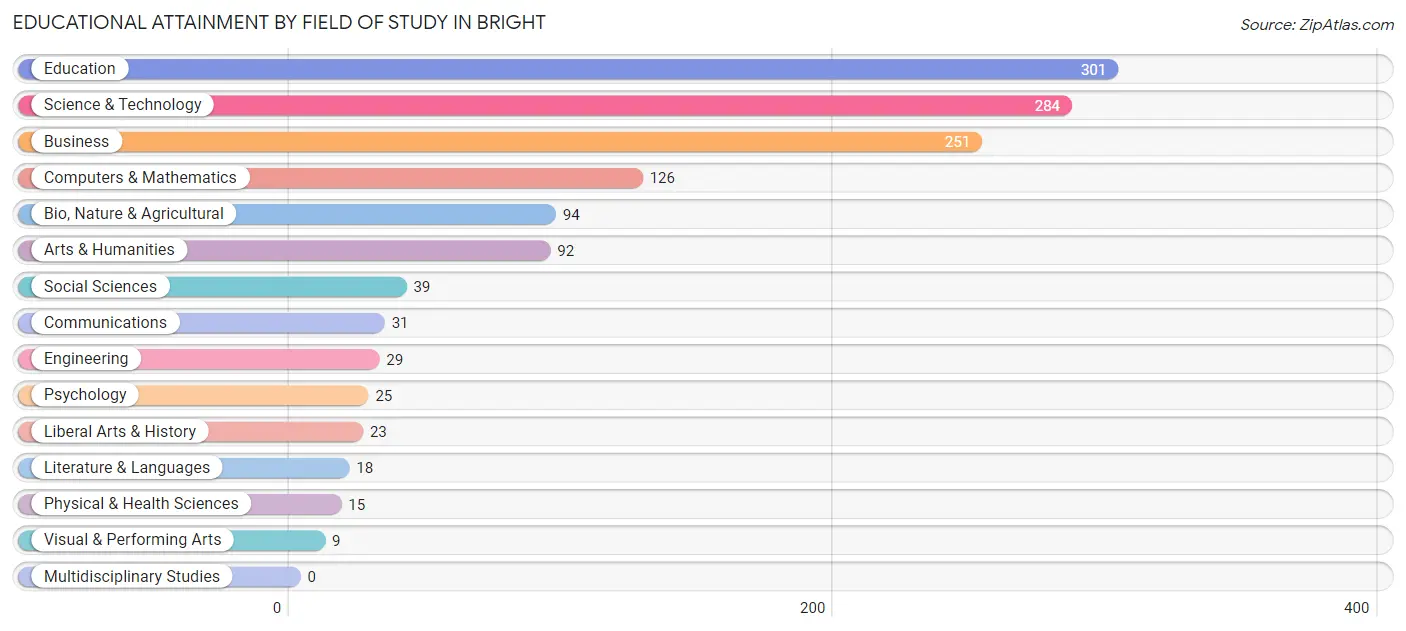
| Field of Study | # Graduates | % Graduates |
| Computers & Mathematics | 126 | 9.4% |
| Bio, Nature & Agricultural | 94 | 7.0% |
| Physical & Health Sciences | 15 | 1.1% |
| Psychology | 25 | 1.9% |
| Social Sciences | 39 | 2.9% |
| Engineering | 29 | 2.2% |
| Multidisciplinary Studies | 0 | 0.0% |
| Science & Technology | 284 | 21.2% |
| Business | 251 | 18.8% |
| Education | 301 | 22.5% |
| Literature & Languages | 18 | 1.3% |
| Liberal Arts & History | 23 | 1.7% |
| Visual & Performing Arts | 9 | 0.7% |
| Communications | 31 | 2.3% |
| Arts & Humanities | 92 | 6.9% |
| Total | 1,337 | 100.0% |
Transportation & Commute in Bright
Vehicle Availability by Sex in Bright
The most prevalent vehicle ownership categories in Bright are males with 2 vehicles (654, accounting for 39.1%) and females with 2 vehicles (529, making up 45.4%).
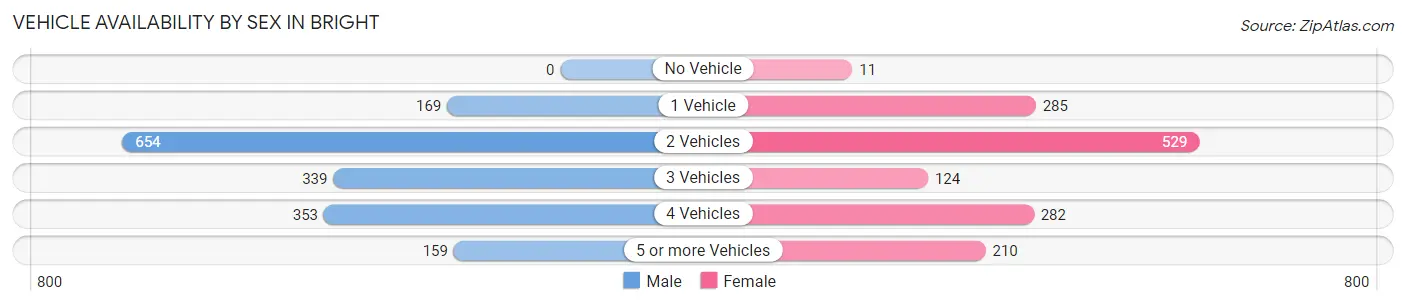
| Vehicles Available | Male | Female |
| No Vehicle | 0 (0.0%) | 11 (0.8%) |
| 1 Vehicle | 169 (10.1%) | 285 (19.8%) |
| 2 Vehicles | 654 (39.1%) | 529 (36.7%) |
| 3 Vehicles | 339 (20.3%) | 124 (8.6%) |
| 4 Vehicles | 353 (21.1%) | 282 (19.6%) |
| 5 or more Vehicles | 159 (9.5%) | 210 (14.6%) |
| Total | 1,674 (100.0%) | 1,441 (100.0%) |
Commute Time in Bright
The most frequently occuring commute durations in Bright are 45 to 59 minutes (551 commuters, 20.4%), 35 to 39 minutes (417 commuters, 15.4%), and 15 to 19 minutes (337 commuters, 12.4%).
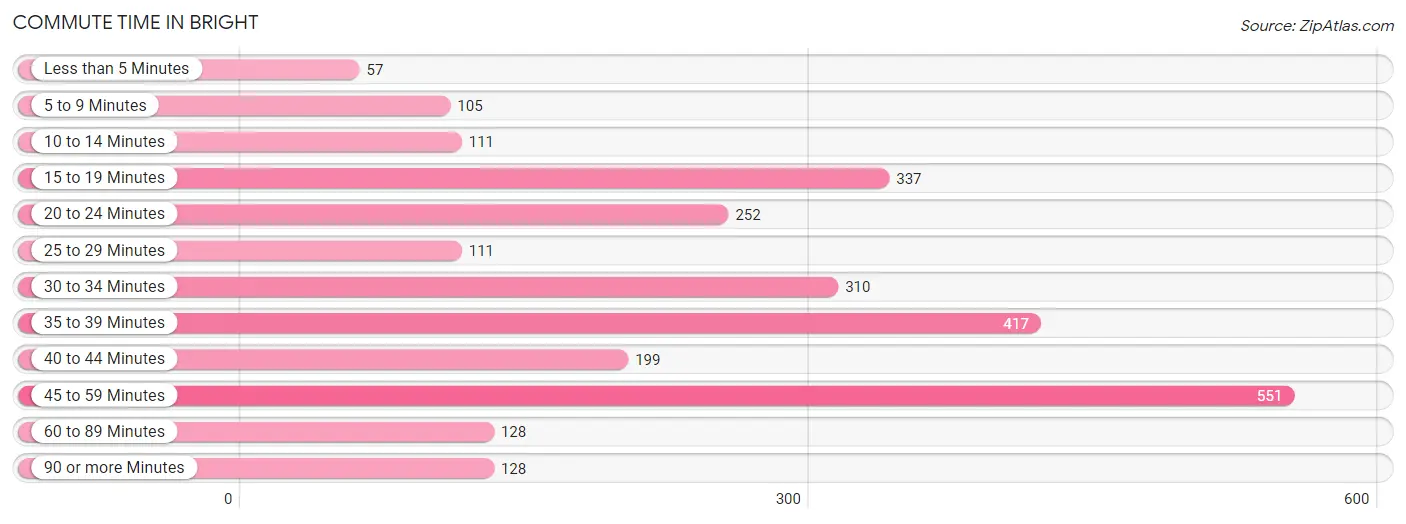
| Commute Time | # Commuters | % Commuters |
| Less than 5 Minutes | 57 | 2.1% |
| 5 to 9 Minutes | 105 | 3.9% |
| 10 to 14 Minutes | 111 | 4.1% |
| 15 to 19 Minutes | 337 | 12.4% |
| 20 to 24 Minutes | 252 | 9.3% |
| 25 to 29 Minutes | 111 | 4.1% |
| 30 to 34 Minutes | 310 | 11.5% |
| 35 to 39 Minutes | 417 | 15.4% |
| 40 to 44 Minutes | 199 | 7.3% |
| 45 to 59 Minutes | 551 | 20.4% |
| 60 to 89 Minutes | 128 | 4.7% |
| 90 or more Minutes | 128 | 4.7% |
Commute Time by Sex in Bright
The most common commute times in Bright are 45 to 59 minutes (267 commuters, 17.8%) for males and 45 to 59 minutes (284 commuters, 23.6%) for females.
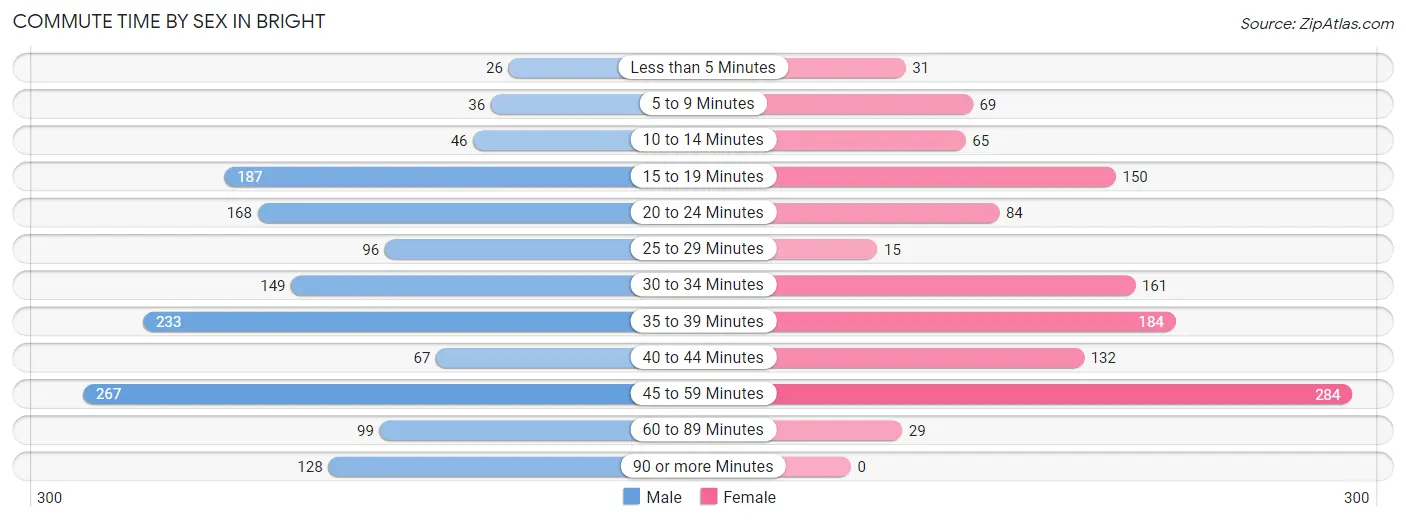
| Commute Time | Male | Female |
| Less than 5 Minutes | 26 (1.7%) | 31 (2.6%) |
| 5 to 9 Minutes | 36 (2.4%) | 69 (5.7%) |
| 10 to 14 Minutes | 46 (3.1%) | 65 (5.4%) |
| 15 to 19 Minutes | 187 (12.4%) | 150 (12.5%) |
| 20 to 24 Minutes | 168 (11.2%) | 84 (7.0%) |
| 25 to 29 Minutes | 96 (6.4%) | 15 (1.3%) |
| 30 to 34 Minutes | 149 (9.9%) | 161 (13.4%) |
| 35 to 39 Minutes | 233 (15.5%) | 184 (15.3%) |
| 40 to 44 Minutes | 67 (4.5%) | 132 (11.0%) |
| 45 to 59 Minutes | 267 (17.8%) | 284 (23.6%) |
| 60 to 89 Minutes | 99 (6.6%) | 29 (2.4%) |
| 90 or more Minutes | 128 (8.5%) | 0 (0.0%) |
Time of Departure to Work by Sex in Bright
The most frequent times of departure to work in Bright are 6:30 AM to 6:59 AM (268, 17.8%) for males and 6:30 AM to 6:59 AM (274, 22.8%) for females.
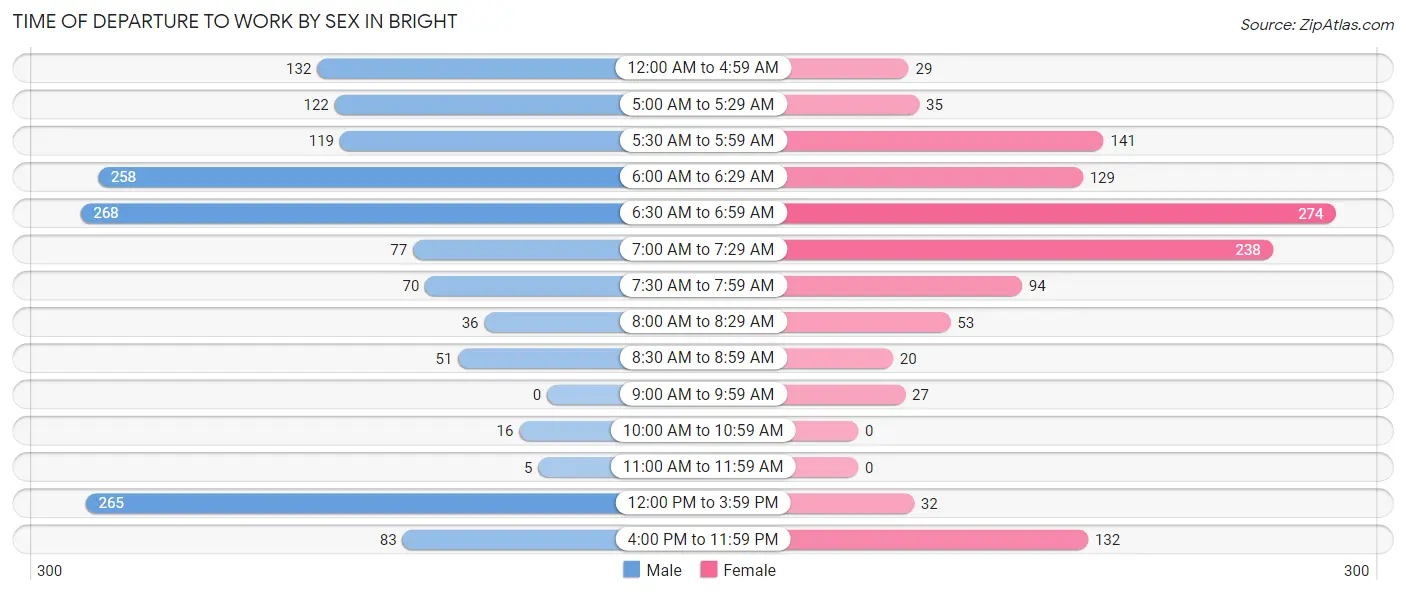
| Time of Departure | Male | Female |
| 12:00 AM to 4:59 AM | 132 (8.8%) | 29 (2.4%) |
| 5:00 AM to 5:29 AM | 122 (8.1%) | 35 (2.9%) |
| 5:30 AM to 5:59 AM | 119 (7.9%) | 141 (11.7%) |
| 6:00 AM to 6:29 AM | 258 (17.2%) | 129 (10.7%) |
| 6:30 AM to 6:59 AM | 268 (17.8%) | 274 (22.8%) |
| 7:00 AM to 7:29 AM | 77 (5.1%) | 238 (19.8%) |
| 7:30 AM to 7:59 AM | 70 (4.7%) | 94 (7.8%) |
| 8:00 AM to 8:29 AM | 36 (2.4%) | 53 (4.4%) |
| 8:30 AM to 8:59 AM | 51 (3.4%) | 20 (1.7%) |
| 9:00 AM to 9:59 AM | 0 (0.0%) | 27 (2.2%) |
| 10:00 AM to 10:59 AM | 16 (1.1%) | 0 (0.0%) |
| 11:00 AM to 11:59 AM | 5 (0.3%) | 0 (0.0%) |
| 12:00 PM to 3:59 PM | 265 (17.6%) | 32 (2.7%) |
| 4:00 PM to 11:59 PM | 83 (5.5%) | 132 (11.0%) |
| Total | 1,502 (100.0%) | 1,204 (100.0%) |
Housing Occupancy in Bright
Occupancy by Ownership in Bright
Of the total 2,188 dwellings in Bright, owner-occupied units account for 1,891 (86.4%), while renter-occupied units make up 297 (13.6%).
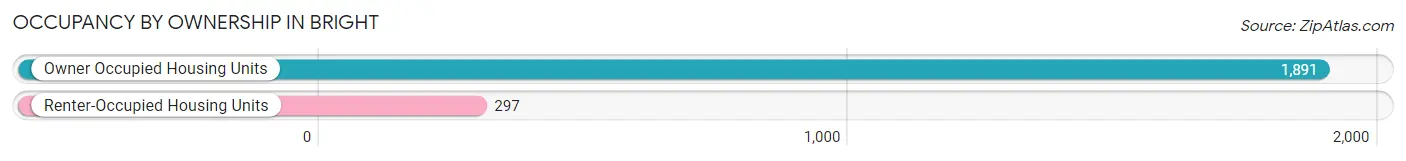
| Occupancy | # Housing Units | % Housing Units |
| Owner Occupied Housing Units | 1,891 | 86.4% |
| Renter-Occupied Housing Units | 297 | 13.6% |
| Total Occupied Housing Units | 2,188 | 100.0% |
Occupancy by Household Size in Bright
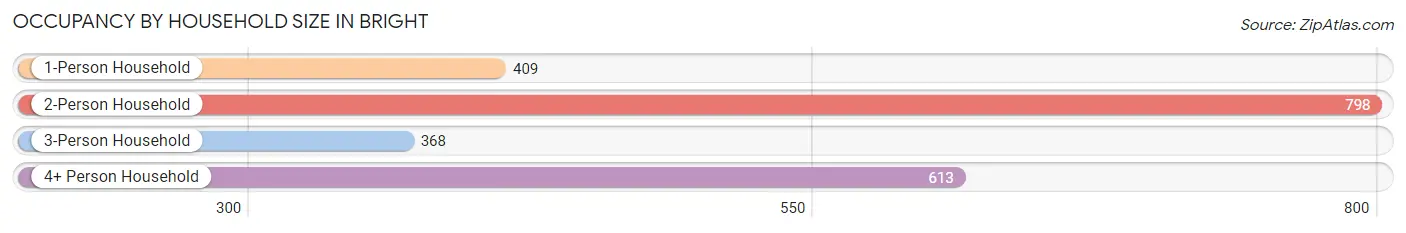
| Household Size | # Housing Units | % Housing Units |
| 1-Person Household | 409 | 18.7% |
| 2-Person Household | 798 | 36.5% |
| 3-Person Household | 368 | 16.8% |
| 4+ Person Household | 613 | 28.0% |
| Total Housing Units | 2,188 | 100.0% |
Occupancy by Ownership by Household Size in Bright
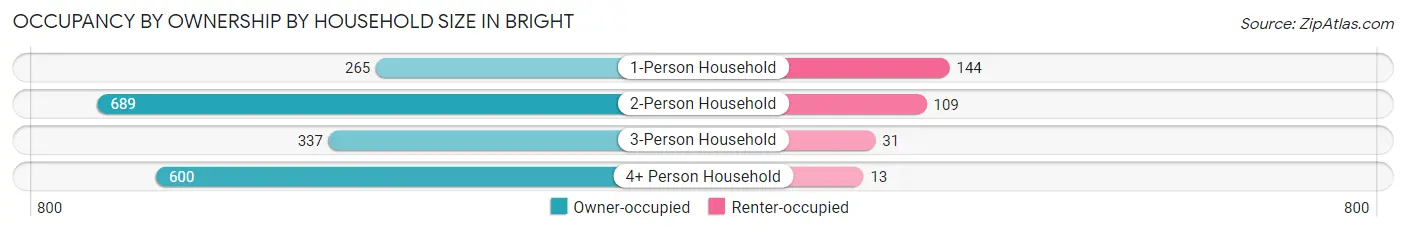
| Household Size | Owner-occupied | Renter-occupied |
| 1-Person Household | 265 (64.8%) | 144 (35.2%) |
| 2-Person Household | 689 (86.3%) | 109 (13.7%) |
| 3-Person Household | 337 (91.6%) | 31 (8.4%) |
| 4+ Person Household | 600 (97.9%) | 13 (2.1%) |
| Total Housing Units | 1,891 (86.4%) | 297 (13.6%) |
Occupancy by Educational Attainment in Bright
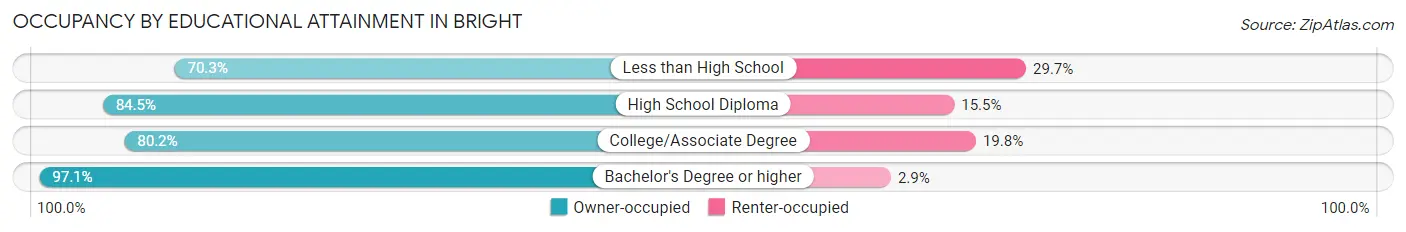
| Household Size | Owner-occupied | Renter-occupied |
| Less than High School | 78 (70.3%) | 33 (29.7%) |
| High School Diploma | 513 (84.5%) | 94 (15.5%) |
| College/Associate Degree | 604 (80.2%) | 149 (19.8%) |
| Bachelor's Degree or higher | 696 (97.1%) | 21 (2.9%) |
Occupancy by Age of Householder in Bright
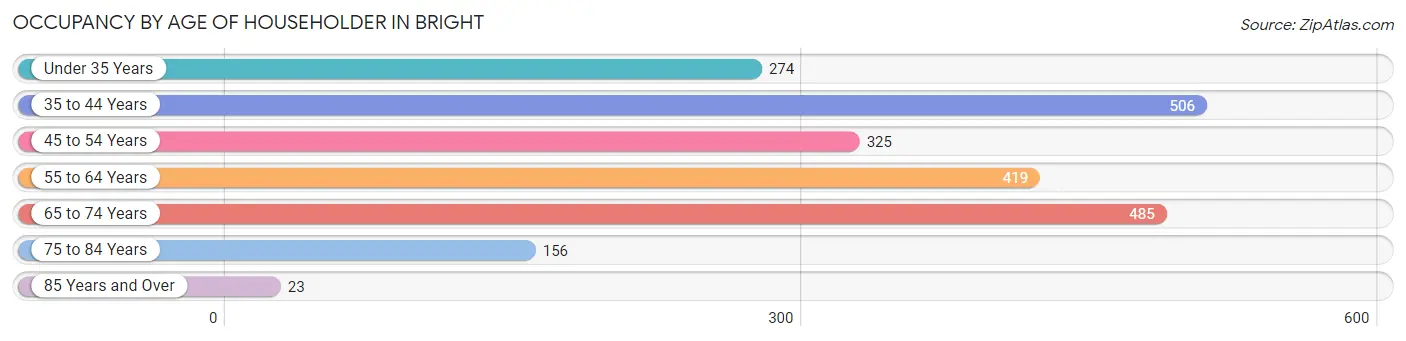
| Age Bracket | # Households | % Households |
| Under 35 Years | 274 | 12.5% |
| 35 to 44 Years | 506 | 23.1% |
| 45 to 54 Years | 325 | 14.8% |
| 55 to 64 Years | 419 | 19.2% |
| 65 to 74 Years | 485 | 22.2% |
| 75 to 84 Years | 156 | 7.1% |
| 85 Years and Over | 23 | 1.1% |
| Total | 2,188 | 100.0% |
Housing Finances in Bright
Median Income by Occupancy in Bright
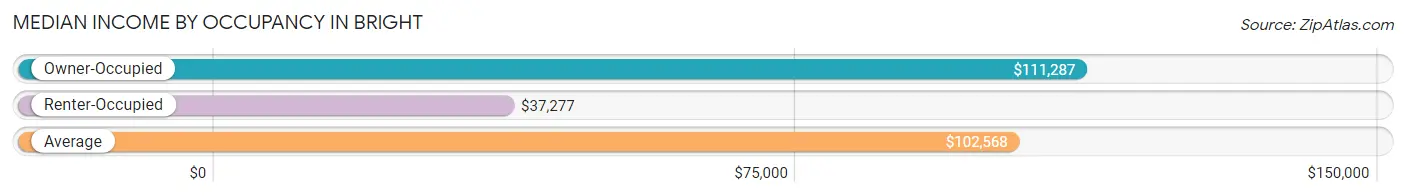
| Occupancy Type | # Households | Median Income |
| Owner-Occupied | 1,891 (86.4%) | $111,287 |
| Renter-Occupied | 297 (13.6%) | $37,277 |
| Average | 2,188 (100.0%) | $102,568 |
Occupancy by Householder Income Bracket in Bright
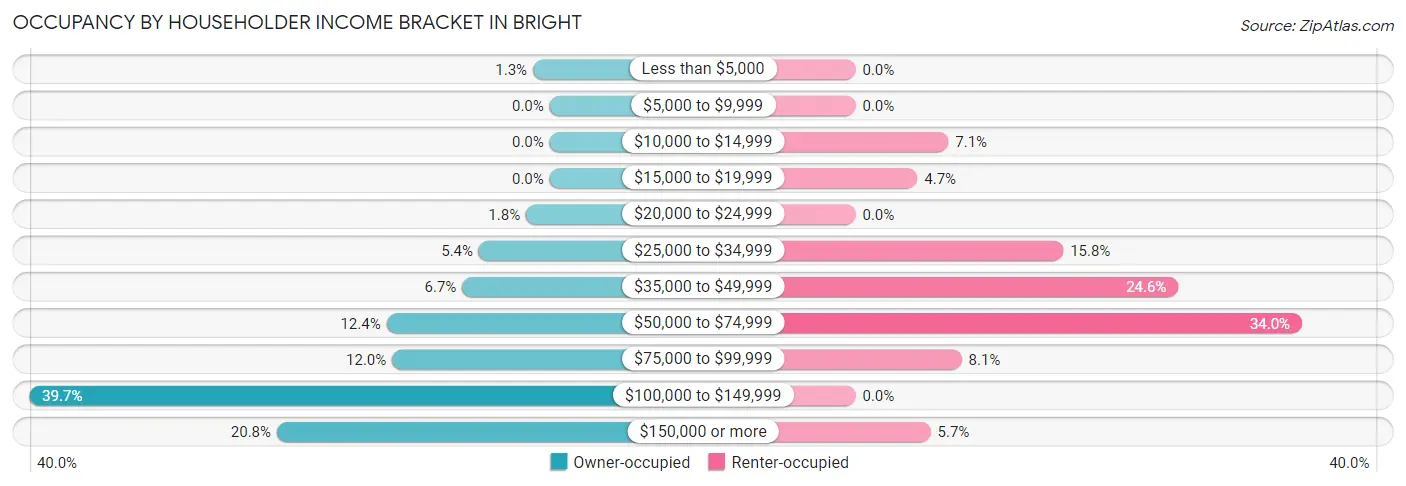
| Income Bracket | Owner-occupied | Renter-occupied |
| Less than $5,000 | 24 (1.3%) | 0 (0.0%) |
| $5,000 to $9,999 | 0 (0.0%) | 0 (0.0%) |
| $10,000 to $14,999 | 0 (0.0%) | 21 (7.1%) |
| $15,000 to $19,999 | 0 (0.0%) | 14 (4.7%) |
| $20,000 to $24,999 | 34 (1.8%) | 0 (0.0%) |
| $25,000 to $34,999 | 102 (5.4%) | 47 (15.8%) |
| $35,000 to $49,999 | 126 (6.7%) | 73 (24.6%) |
| $50,000 to $74,999 | 235 (12.4%) | 101 (34.0%) |
| $75,000 to $99,999 | 227 (12.0%) | 24 (8.1%) |
| $100,000 to $149,999 | 750 (39.7%) | 0 (0.0%) |
| $150,000 or more | 393 (20.8%) | 17 (5.7%) |
| Total | 1,891 (100.0%) | 297 (100.0%) |
Monthly Housing Cost Tiers in Bright
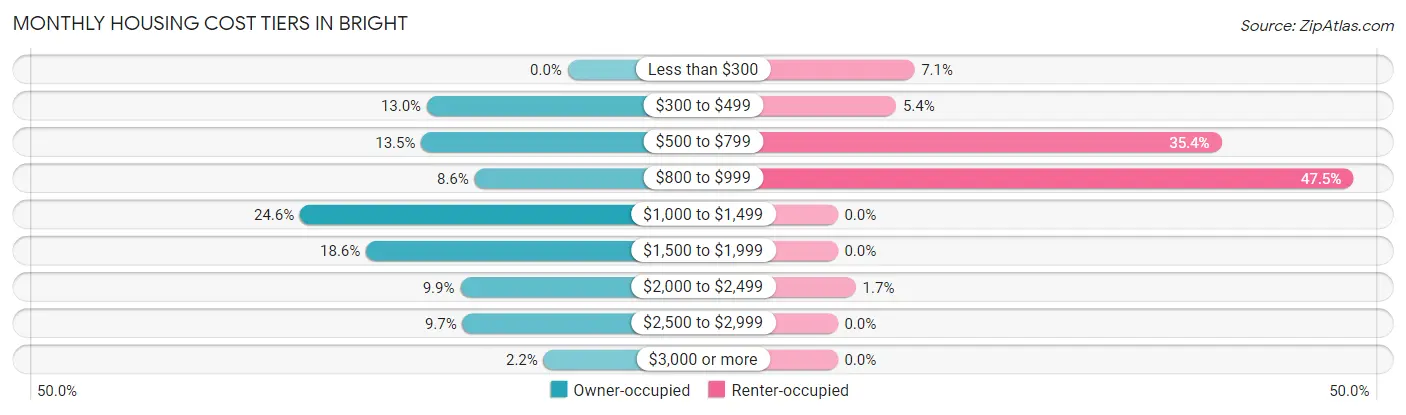
| Monthly Cost | Owner-occupied | Renter-occupied |
| Less than $300 | 0 (0.0%) | 21 (7.1%) |
| $300 to $499 | 245 (13.0%) | 16 (5.4%) |
| $500 to $799 | 255 (13.5%) | 105 (35.3%) |
| $800 to $999 | 162 (8.6%) | 141 (47.5%) |
| $1,000 to $1,499 | 466 (24.6%) | 0 (0.0%) |
| $1,500 to $1,999 | 351 (18.6%) | 0 (0.0%) |
| $2,000 to $2,499 | 187 (9.9%) | 5 (1.7%) |
| $2,500 to $2,999 | 183 (9.7%) | 0 (0.0%) |
| $3,000 or more | 42 (2.2%) | 0 (0.0%) |
| Total | 1,891 (100.0%) | 297 (100.0%) |
Physical Housing Characteristics in Bright
Housing Structures in Bright
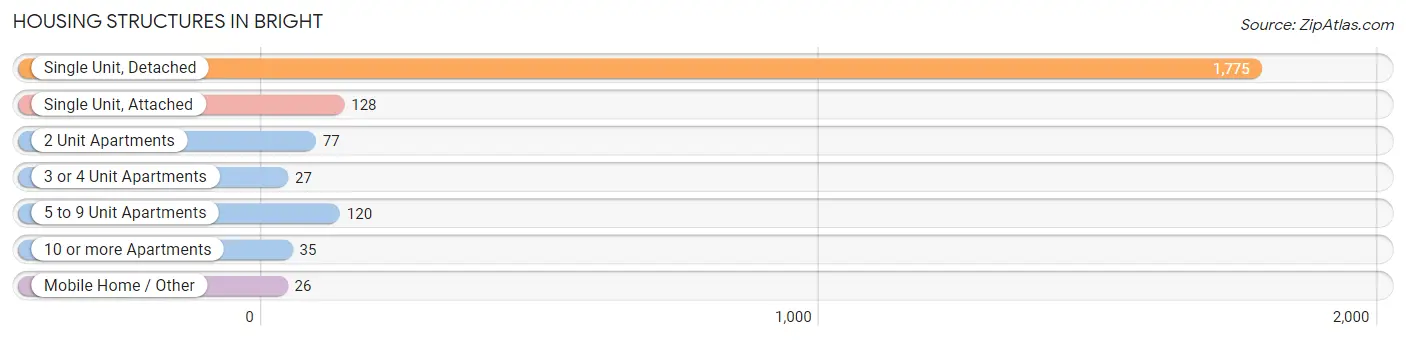
| Structure Type | # Housing Units | % Housing Units |
| Single Unit, Detached | 1,775 | 81.1% |
| Single Unit, Attached | 128 | 5.9% |
| 2 Unit Apartments | 77 | 3.5% |
| 3 or 4 Unit Apartments | 27 | 1.2% |
| 5 to 9 Unit Apartments | 120 | 5.5% |
| 10 or more Apartments | 35 | 1.6% |
| Mobile Home / Other | 26 | 1.2% |
| Total | 2,188 | 100.0% |
Housing Structures by Occupancy in Bright
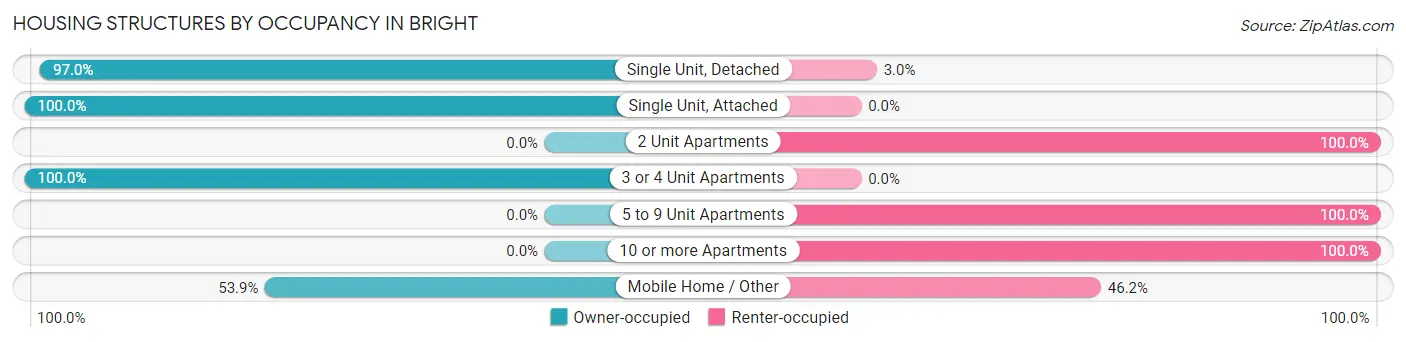
| Structure Type | Owner-occupied | Renter-occupied |
| Single Unit, Detached | 1,722 (97.0%) | 53 (3.0%) |
| Single Unit, Attached | 128 (100.0%) | 0 (0.0%) |
| 2 Unit Apartments | 0 (0.0%) | 77 (100.0%) |
| 3 or 4 Unit Apartments | 27 (100.0%) | 0 (0.0%) |
| 5 to 9 Unit Apartments | 0 (0.0%) | 120 (100.0%) |
| 10 or more Apartments | 0 (0.0%) | 35 (100.0%) |
| Mobile Home / Other | 14 (53.8%) | 12 (46.2%) |
| Total | 1,891 (86.4%) | 297 (13.6%) |
Housing Structures by Number of Rooms in Bright
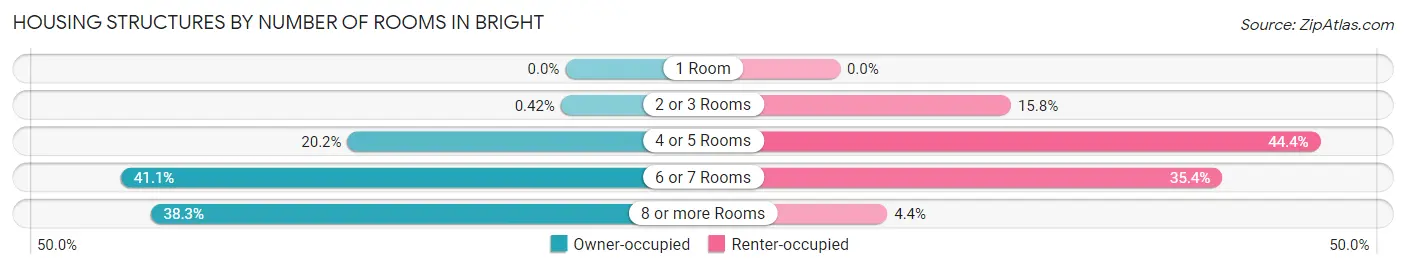
| Number of Rooms | Owner-occupied | Renter-occupied |
| 1 Room | 0 (0.0%) | 0 (0.0%) |
| 2 or 3 Rooms | 8 (0.4%) | 47 (15.8%) |
| 4 or 5 Rooms | 381 (20.2%) | 132 (44.4%) |
| 6 or 7 Rooms | 777 (41.1%) | 105 (35.3%) |
| 8 or more Rooms | 725 (38.3%) | 13 (4.4%) |
| Total | 1,891 (100.0%) | 297 (100.0%) |
Housing Structure by Heating Type in Bright
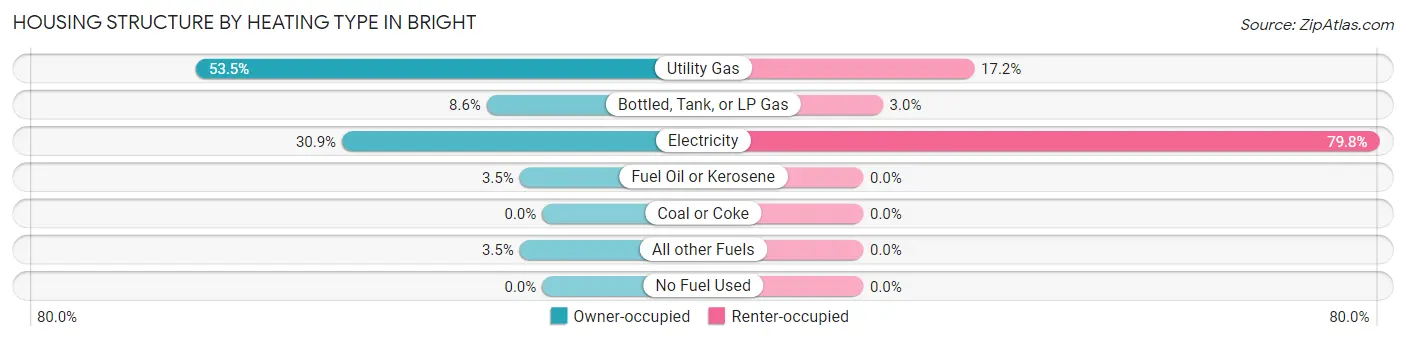
| Heating Type | Owner-occupied | Renter-occupied |
| Utility Gas | 1,012 (53.5%) | 51 (17.2%) |
| Bottled, Tank, or LP Gas | 162 (8.6%) | 9 (3.0%) |
| Electricity | 585 (30.9%) | 237 (79.8%) |
| Fuel Oil or Kerosene | 66 (3.5%) | 0 (0.0%) |
| Coal or Coke | 0 (0.0%) | 0 (0.0%) |
| All other Fuels | 66 (3.5%) | 0 (0.0%) |
| No Fuel Used | 0 (0.0%) | 0 (0.0%) |
| Total | 1,891 (100.0%) | 297 (100.0%) |
Household Vehicle Usage in Bright
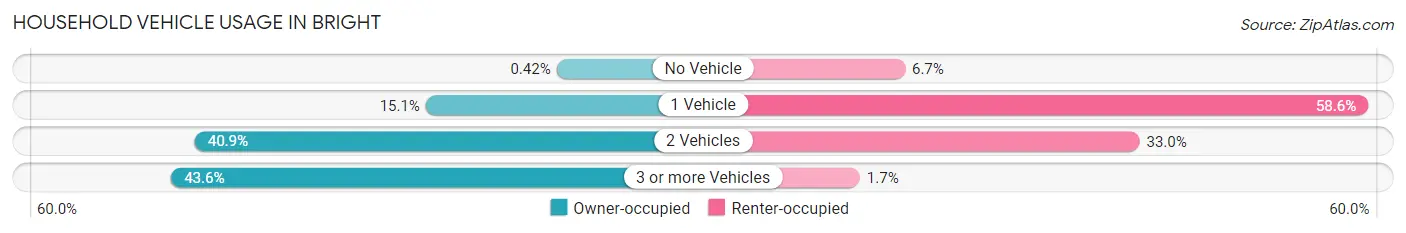
| Vehicles per Household | Owner-occupied | Renter-occupied |
| No Vehicle | 8 (0.4%) | 20 (6.7%) |
| 1 Vehicle | 285 (15.1%) | 174 (58.6%) |
| 2 Vehicles | 774 (40.9%) | 98 (33.0%) |
| 3 or more Vehicles | 824 (43.6%) | 5 (1.7%) |
| Total | 1,891 (100.0%) | 297 (100.0%) |
Real Estate & Mortgages in Bright
Real Estate and Mortgage Overview in Bright
| Characteristic | Without Mortgage | With Mortgage |
| Housing Units | 449 | 1,442 |
| Median Property Value | $232,800 | $227,000 |
| Median Household Income | $75,529 | $346 |
| Monthly Housing Costs | $493 | $42 |
| Real Estate Taxes | $1,668 | $56 |
Property Value by Mortgage Status in Bright
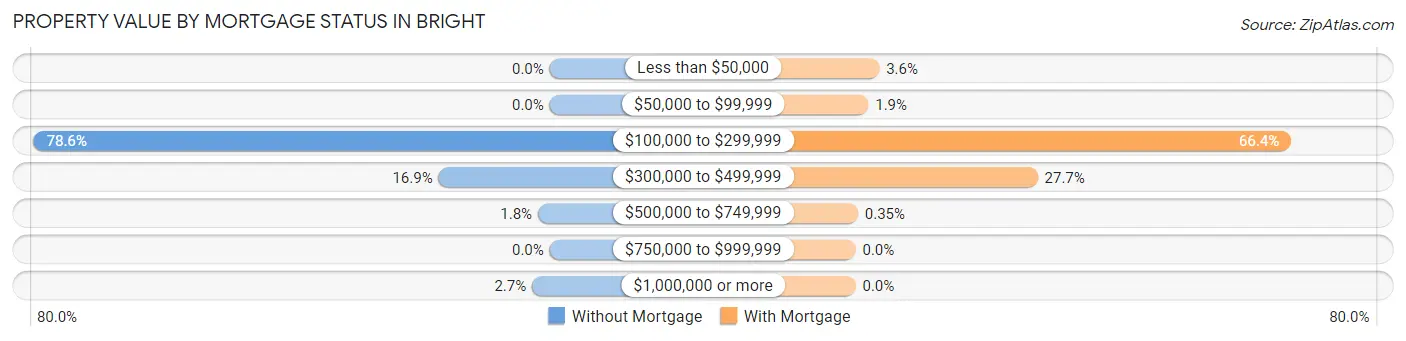
| Property Value | Without Mortgage | With Mortgage |
| Less than $50,000 | 0 (0.0%) | 52 (3.6%) |
| $50,000 to $99,999 | 0 (0.0%) | 28 (1.9%) |
| $100,000 to $299,999 | 353 (78.6%) | 957 (66.4%) |
| $300,000 to $499,999 | 76 (16.9%) | 400 (27.7%) |
| $500,000 to $749,999 | 8 (1.8%) | 5 (0.4%) |
| $750,000 to $999,999 | 0 (0.0%) | 0 (0.0%) |
| $1,000,000 or more | 12 (2.7%) | 0 (0.0%) |
| Total | 449 (100.0%) | 1,442 (100.0%) |
Household Income by Mortgage Status in Bright
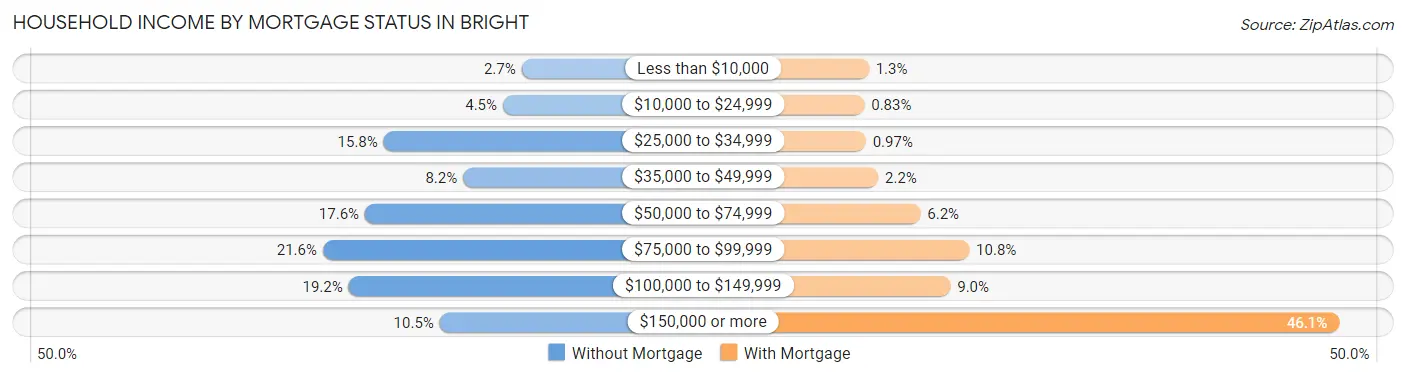
| Household Income | Without Mortgage | With Mortgage |
| Less than $10,000 | 12 (2.7%) | 18 (1.3%) |
| $10,000 to $24,999 | 20 (4.4%) | 12 (0.8%) |
| $25,000 to $34,999 | 71 (15.8%) | 14 (1.0%) |
| $35,000 to $49,999 | 37 (8.2%) | 31 (2.1%) |
| $50,000 to $74,999 | 79 (17.6%) | 89 (6.2%) |
| $75,000 to $99,999 | 97 (21.6%) | 156 (10.8%) |
| $100,000 to $149,999 | 86 (19.2%) | 130 (9.0%) |
| $150,000 or more | 47 (10.5%) | 664 (46.1%) |
| Total | 449 (100.0%) | 1,442 (100.0%) |
Property Value to Household Income Ratio in Bright
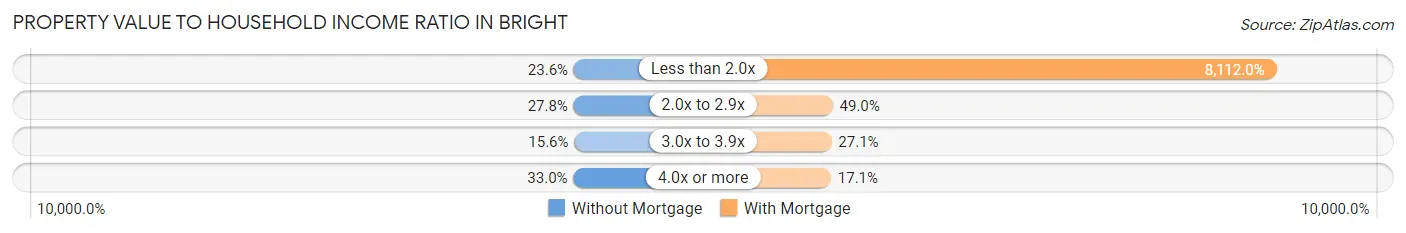
| Value-to-Income Ratio | Without Mortgage | With Mortgage |
| Less than 2.0x | 106 (23.6%) | 116,975 (8,112.0%) |
| 2.0x to 2.9x | 125 (27.8%) | 706 (49.0%) |
| 3.0x to 3.9x | 70 (15.6%) | 390 (27.1%) |
| 4.0x or more | 148 (33.0%) | 246 (17.1%) |
| Total | 449 (100.0%) | 1,442 (100.0%) |
Real Estate Taxes by Mortgage Status in Bright
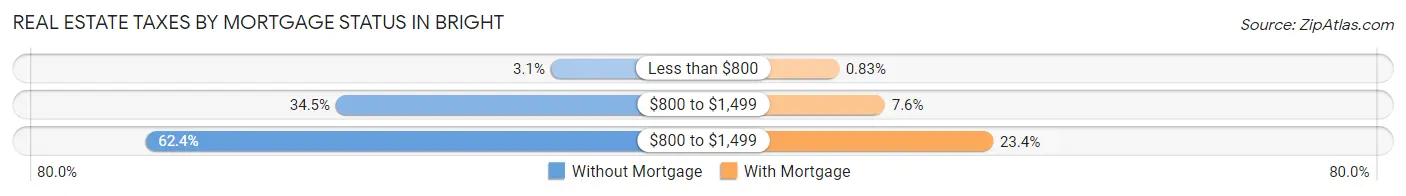
| Property Taxes | Without Mortgage | With Mortgage |
| Less than $800 | 14 (3.1%) | 12 (0.8%) |
| $800 to $1,499 | 155 (34.5%) | 109 (7.6%) |
| $800 to $1,499 | 280 (62.4%) | 337 (23.4%) |
| Total | 449 (100.0%) | 1,442 (100.0%) |
Health & Disability in Bright
Health Insurance Coverage by Age in Bright
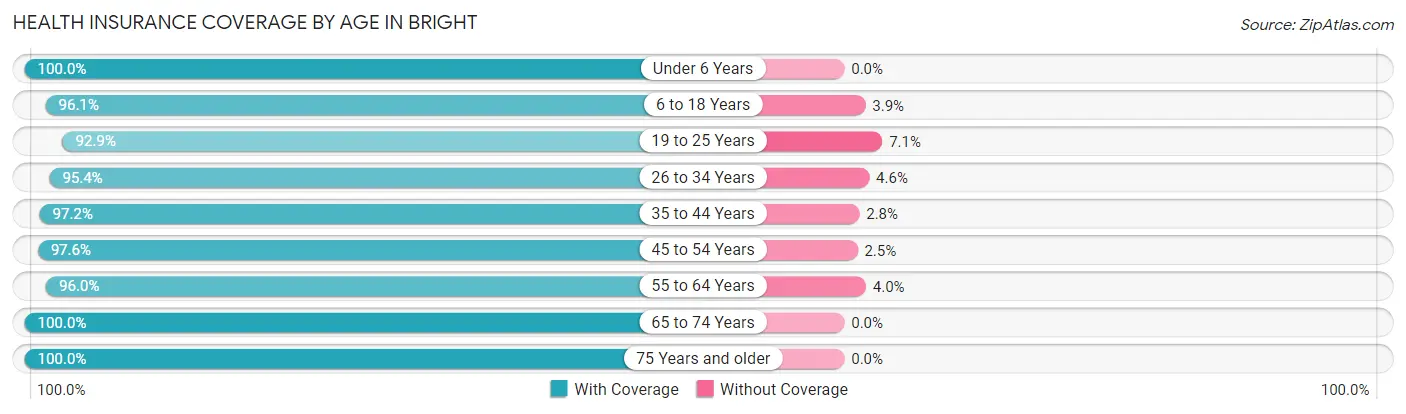
| Age Bracket | With Coverage | Without Coverage |
| Under 6 Years | 348 (100.0%) | 0 (0.0%) |
| 6 to 18 Years | 1,104 (96.1%) | 45 (3.9%) |
| 19 to 25 Years | 473 (92.9%) | 36 (7.1%) |
| 26 to 34 Years | 370 (95.4%) | 18 (4.6%) |
| 35 to 44 Years | 833 (97.2%) | 24 (2.8%) |
| 45 to 54 Years | 677 (97.6%) | 17 (2.5%) |
| 55 to 64 Years | 788 (96.0%) | 33 (4.0%) |
| 65 to 74 Years | 781 (100.0%) | 0 (0.0%) |
| 75 Years and older | 311 (100.0%) | 0 (0.0%) |
| Total | 5,685 (97.1%) | 173 (2.9%) |
Health Insurance Coverage by Citizenship Status in Bright
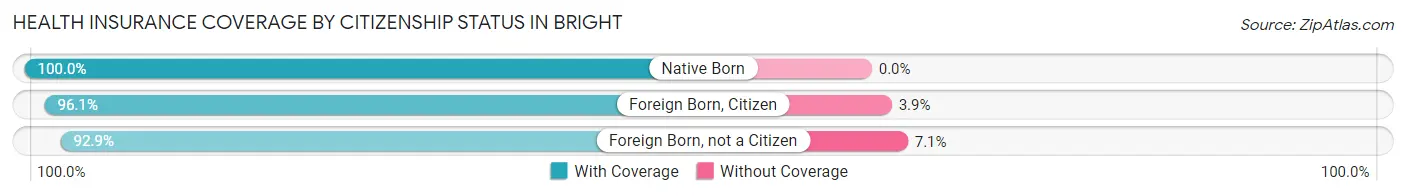
| Citizenship Status | With Coverage | Without Coverage |
| Native Born | 348 (100.0%) | 0 (0.0%) |
| Foreign Born, Citizen | 1,104 (96.1%) | 45 (3.9%) |
| Foreign Born, not a Citizen | 473 (92.9%) | 36 (7.1%) |
Health Insurance Coverage by Household Income in Bright
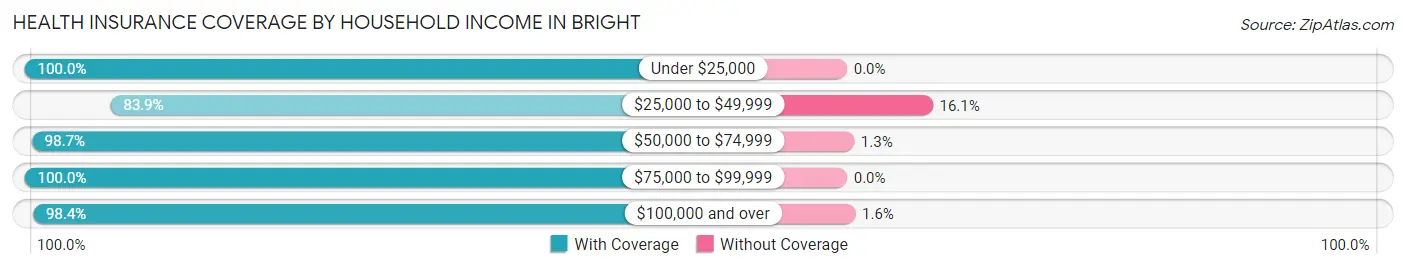
| Household Income | With Coverage | Without Coverage |
| Under $25,000 | 119 (100.0%) | 0 (0.0%) |
| $25,000 to $49,999 | 554 (83.9%) | 106 (16.1%) |
| $50,000 to $74,999 | 744 (98.7%) | 10 (1.3%) |
| $75,000 to $99,999 | 663 (100.0%) | 0 (0.0%) |
| $100,000 and over | 3,605 (98.4%) | 57 (1.6%) |
Public vs Private Health Insurance Coverage by Age in Bright
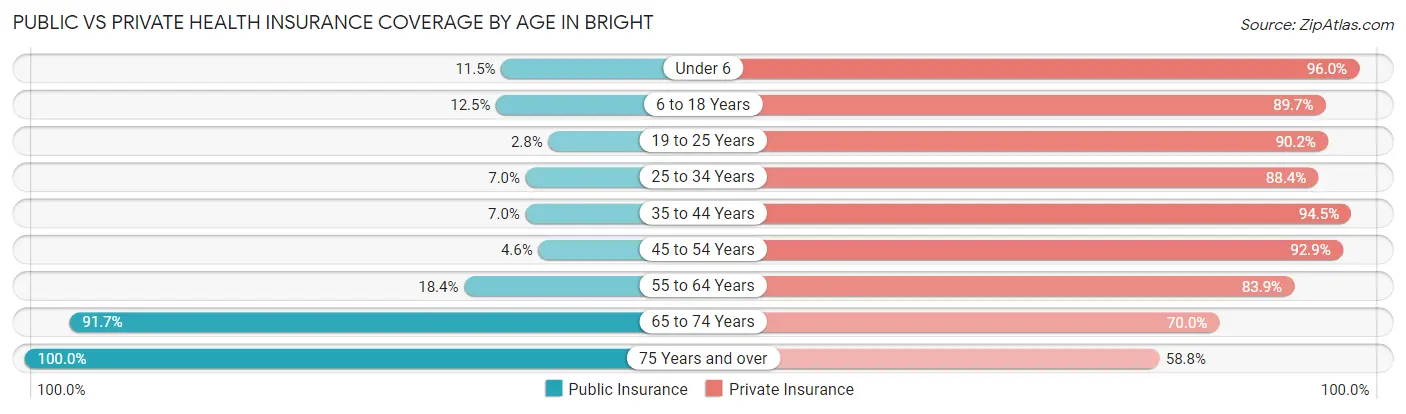
| Age Bracket | Public Insurance | Private Insurance |
| Under 6 | 40 (11.5%) | 334 (96.0%) |
| 6 to 18 Years | 143 (12.4%) | 1,031 (89.7%) |
| 19 to 25 Years | 14 (2.8%) | 459 (90.2%) |
| 25 to 34 Years | 27 (7.0%) | 343 (88.4%) |
| 35 to 44 Years | 60 (7.0%) | 810 (94.5%) |
| 45 to 54 Years | 32 (4.6%) | 645 (92.9%) |
| 55 to 64 Years | 151 (18.4%) | 689 (83.9%) |
| 65 to 74 Years | 716 (91.7%) | 547 (70.0%) |
| 75 Years and over | 311 (100.0%) | 183 (58.8%) |
| Total | 1,494 (25.5%) | 5,041 (86.1%) |
Disability Status by Sex by Age in Bright
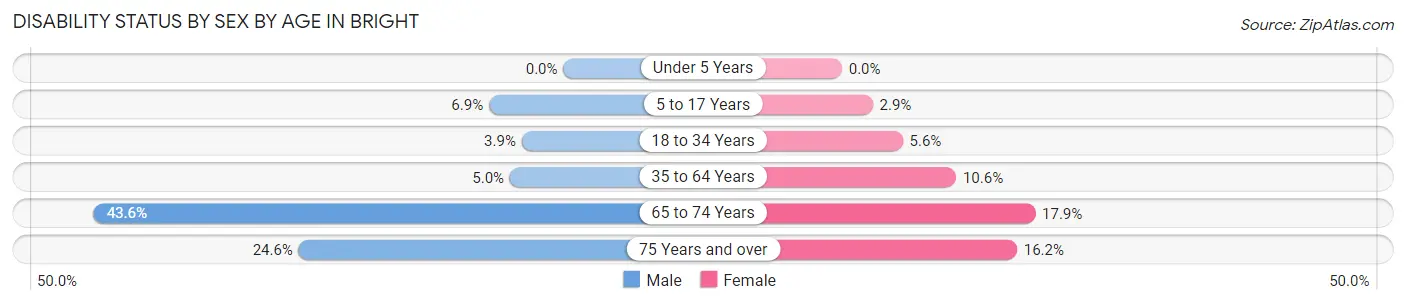
| Age Bracket | Male | Female |
| Under 5 Years | 0 (0.0%) | 0 (0.0%) |
| 5 to 17 Years | 38 (6.9%) | 17 (2.9%) |
| 18 to 34 Years | 21 (3.9%) | 23 (5.6%) |
| 35 to 64 Years | 54 (5.0%) | 136 (10.6%) |
| 65 to 74 Years | 163 (43.6%) | 73 (17.9%) |
| 75 Years and over | 28 (24.6%) | 32 (16.2%) |
Disability Class by Sex by Age in Bright
Disability Class: Hearing Difficulty
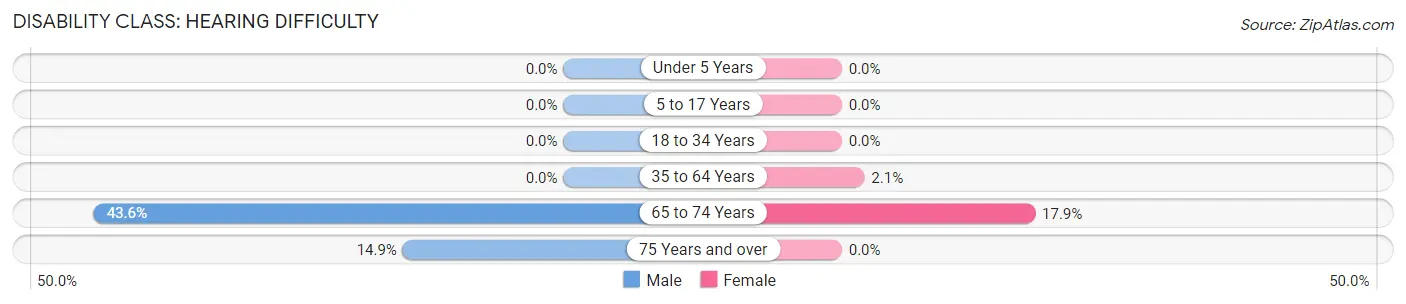
| Age Bracket | Male | Female |
| Under 5 Years | 0 (0.0%) | 0 (0.0%) |
| 5 to 17 Years | 0 (0.0%) | 0 (0.0%) |
| 18 to 34 Years | 0 (0.0%) | 0 (0.0%) |
| 35 to 64 Years | 0 (0.0%) | 27 (2.1%) |
| 65 to 74 Years | 163 (43.6%) | 73 (17.9%) |
| 75 Years and over | 17 (14.9%) | 0 (0.0%) |
Disability Class: Vision Difficulty
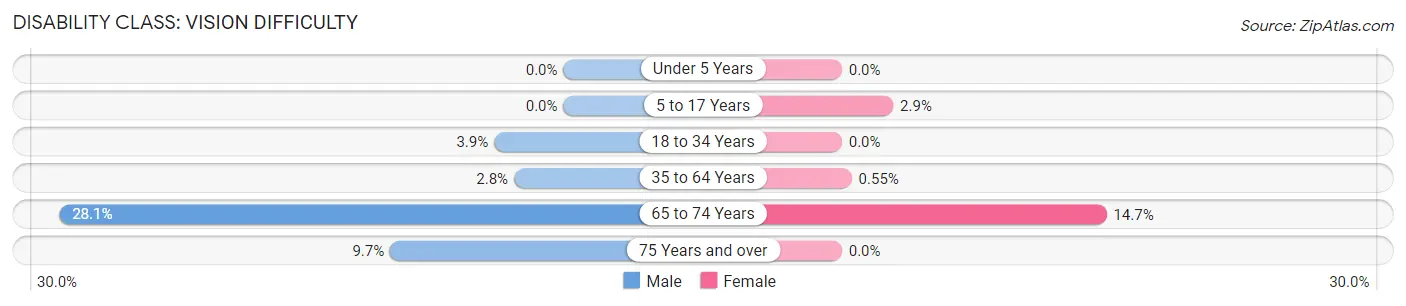
| Age Bracket | Male | Female |
| Under 5 Years | 0 (0.0%) | 0 (0.0%) |
| 5 to 17 Years | 0 (0.0%) | 17 (2.9%) |
| 18 to 34 Years | 21 (3.9%) | 0 (0.0%) |
| 35 to 64 Years | 30 (2.8%) | 7 (0.5%) |
| 65 to 74 Years | 105 (28.1%) | 60 (14.7%) |
| 75 Years and over | 11 (9.7%) | 0 (0.0%) |
Disability Class: Cognitive Difficulty
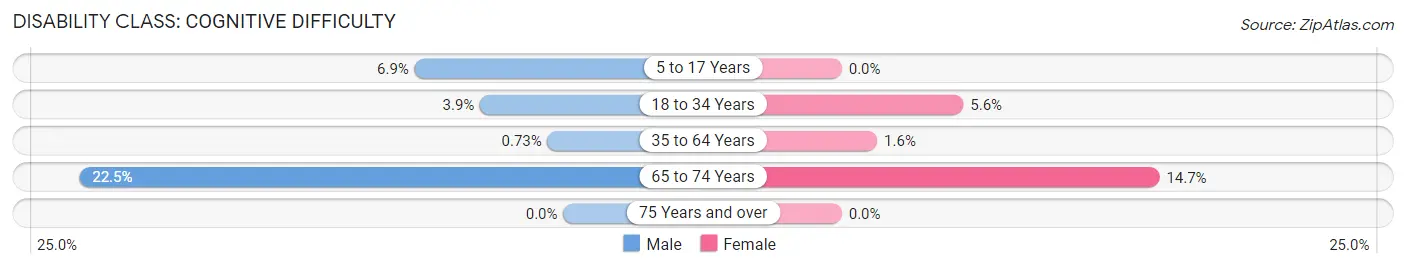
| Age Bracket | Male | Female |
| 5 to 17 Years | 38 (6.9%) | 0 (0.0%) |
| 18 to 34 Years | 21 (3.9%) | 23 (5.6%) |
| 35 to 64 Years | 8 (0.7%) | 21 (1.6%) |
| 65 to 74 Years | 84 (22.5%) | 60 (14.7%) |
| 75 Years and over | 0 (0.0%) | 0 (0.0%) |
Disability Class: Ambulatory Difficulty
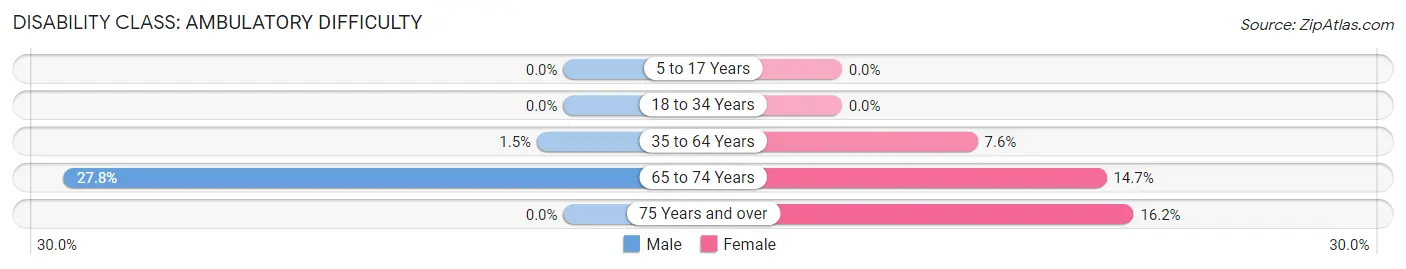
| Age Bracket | Male | Female |
| 5 to 17 Years | 0 (0.0%) | 0 (0.0%) |
| 18 to 34 Years | 0 (0.0%) | 0 (0.0%) |
| 35 to 64 Years | 16 (1.5%) | 97 (7.6%) |
| 65 to 74 Years | 104 (27.8%) | 60 (14.7%) |
| 75 Years and over | 0 (0.0%) | 32 (16.2%) |
Disability Class: Self-Care Difficulty
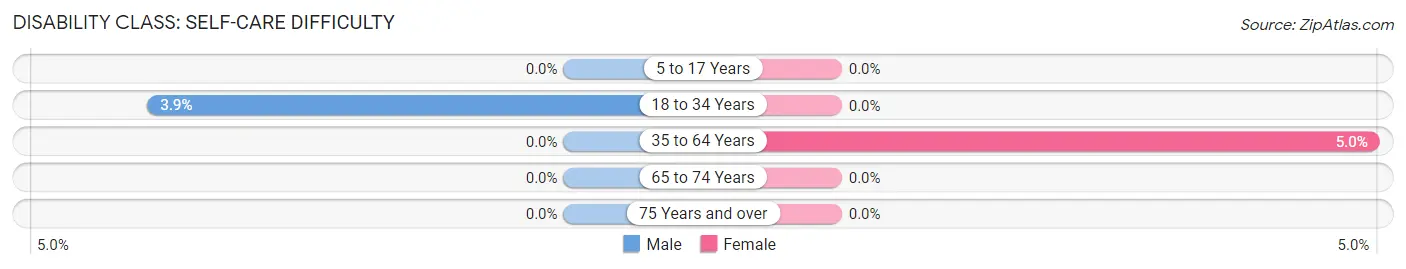
| Age Bracket | Male | Female |
| 5 to 17 Years | 0 (0.0%) | 0 (0.0%) |
| 18 to 34 Years | 21 (3.9%) | 0 (0.0%) |
| 35 to 64 Years | 0 (0.0%) | 64 (5.0%) |
| 65 to 74 Years | 0 (0.0%) | 0 (0.0%) |
| 75 Years and over | 0 (0.0%) | 0 (0.0%) |
Technology Access in Bright
Computing Device Access in Bright
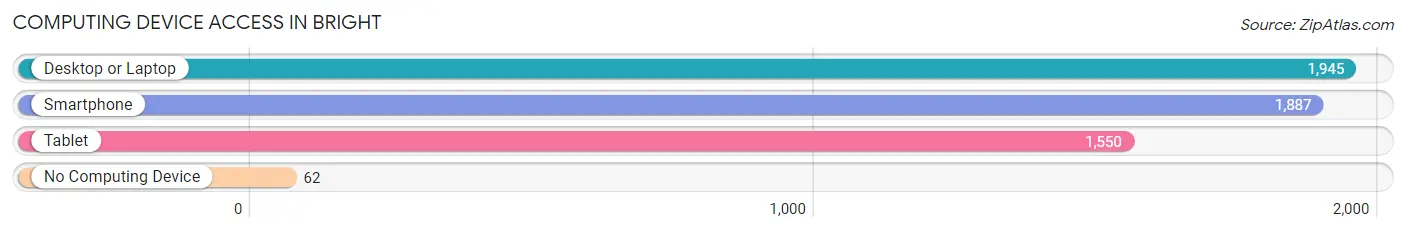
| Device Type | # Households | % Households |
| Desktop or Laptop | 1,945 | 88.9% |
| Smartphone | 1,887 | 86.2% |
| Tablet | 1,550 | 70.8% |
| No Computing Device | 62 | 2.8% |
| Total | 2,188 | 100.0% |
Internet Access in Bright
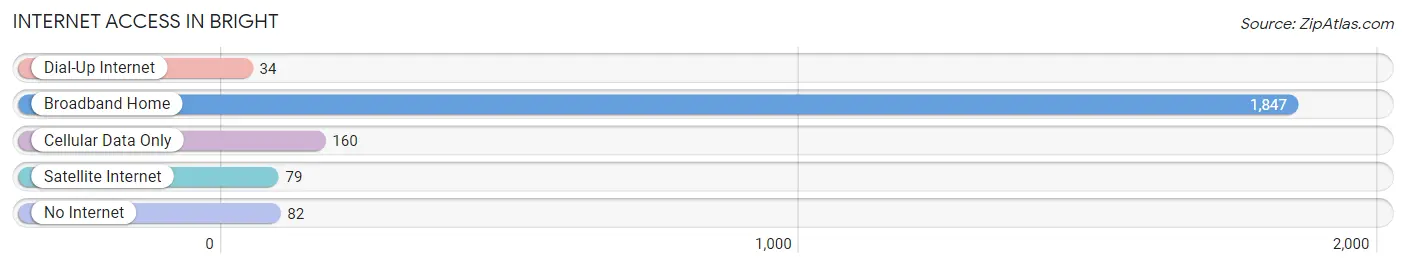
| Internet Type | # Households | % Households |
| Dial-Up Internet | 34 | 1.5% |
| Broadband Home | 1,847 | 84.4% |
| Cellular Data Only | 160 | 7.3% |
| Satellite Internet | 79 | 3.6% |
| No Internet | 82 | 3.7% |
| Total | 2,188 | 100.0% |
Bright Summary
History
Bright is a small town located in the foothills of the Great Dividing Range in Victoria, Australia. It is situated on the Ovens River, approximately 250 kilometres north-east of Melbourne. The area was first settled by Europeans in the mid-1800s, when gold was discovered in the area. The town was officially established in 1854 and named after William Bright, a local gold prospector.
The town quickly grew in size and importance, becoming a major centre for gold mining and timber production. It was also a popular tourist destination, with many visitors coming to enjoy the area’s natural beauty. The town’s population peaked in the late 19th century, but declined in the early 20th century as the gold rush ended and timber production declined.
In the late 20th century, Bright experienced a resurgence in popularity as a tourist destination. The town is now a popular destination for outdoor activities such as hiking, mountain biking, fishing, and skiing.
Geography
Bright is located in the foothills of the Great Dividing Range in Victoria, Australia. It is situated on the Ovens River, approximately 250 kilometres north-east of Melbourne. The town is surrounded by mountains, including Mount Buffalo, Mount Feathertop, and Mount Hotham.
The town is located in a temperate climate zone, with warm summers and cold winters. The average temperature in summer is around 25°C, while in winter it is around 10°C. The area receives an average of 800mm of rainfall per year.
The town is located in the Alpine Shire, which is part of the larger Alpine Valleys region. The region is known for its picturesque landscapes, including rolling hills, lush forests, and crystal-clear rivers.
Economy
Bright’s economy is largely based on tourism. The town is a popular destination for outdoor activities such as hiking, mountain biking, fishing, and skiing. The town is also home to a number of wineries, breweries, and distilleries, which attract visitors from all over the world.
The town is also home to a number of small businesses, including cafes, restaurants, and shops. The town is also home to a number of manufacturing businesses, including a furniture factory and a clothing factory.
Demographics
As of the 2016 census, Bright had a population of 2,845 people. The median age of the population was 44 years, with a gender split of 51.3% female and 48.7% male. The median weekly household income was $1,541, and the median monthly mortgage repayment was $1,845.
The majority of the population (86.2%) identified as Australian, while the remaining 13.8% identified as other nationalities. The most common other nationalities were English (3.2%), Irish (2.2%), and German (1.7%).
The majority of the population (90.2%) identified as Christian, while the remaining 9.8% identified as other religions. The most common other religions were Buddhism (2.2%), Hinduism (1.2%), and Islam (0.7%).
Common Questions
What is Per Capita Income in Bright?
Per Capita income in Bright is $39,650.
What is the Median Family Income in Bright?
Median Family Income in Bright is $115,422.
What is the Median Household income in Bright?
Median Household Income in Bright is $102,568.
What is Income or Wage Gap in Bright?
Income or Wage Gap in Bright is 43.8%.
Women in Bright earn 56.2 cents for every dollar earned by a man.
What is Inequality or Gini Index in Bright?
Inequality or Gini Index in Bright is 0.32.
What is the Total Population of Bright?
Total Population of Bright is 5,858.
What is the Total Male Population of Bright?
Total Male Population of Bright is 2,866.
What is the Total Female Population of Bright?
Total Female Population of Bright is 2,992.
What is the Ratio of Males per 100 Females in Bright?
There are 95.79 Males per 100 Females in Bright.
What is the Ratio of Females per 100 Males in Bright?
There are 104.40 Females per 100 Males in Bright.
What is the Median Population Age in Bright?
Median Population Age in Bright is 41.5 Years.
What is the Average Family Size in Bright
Average Family Size in Bright is 3.1 People.
What is the Average Household Size in Bright
Average Household Size in Bright is 2.7 People.
How Large is the Labor Force in Bright?
There are 3,197 People in the Labor Forcein in Bright.
What is the Percentage of People in the Labor Force in Bright?
69.2% of People are in the Labor Force in Bright.
What is the Unemployment Rate in Bright?
Unemployment Rate in Bright is 1.9%.