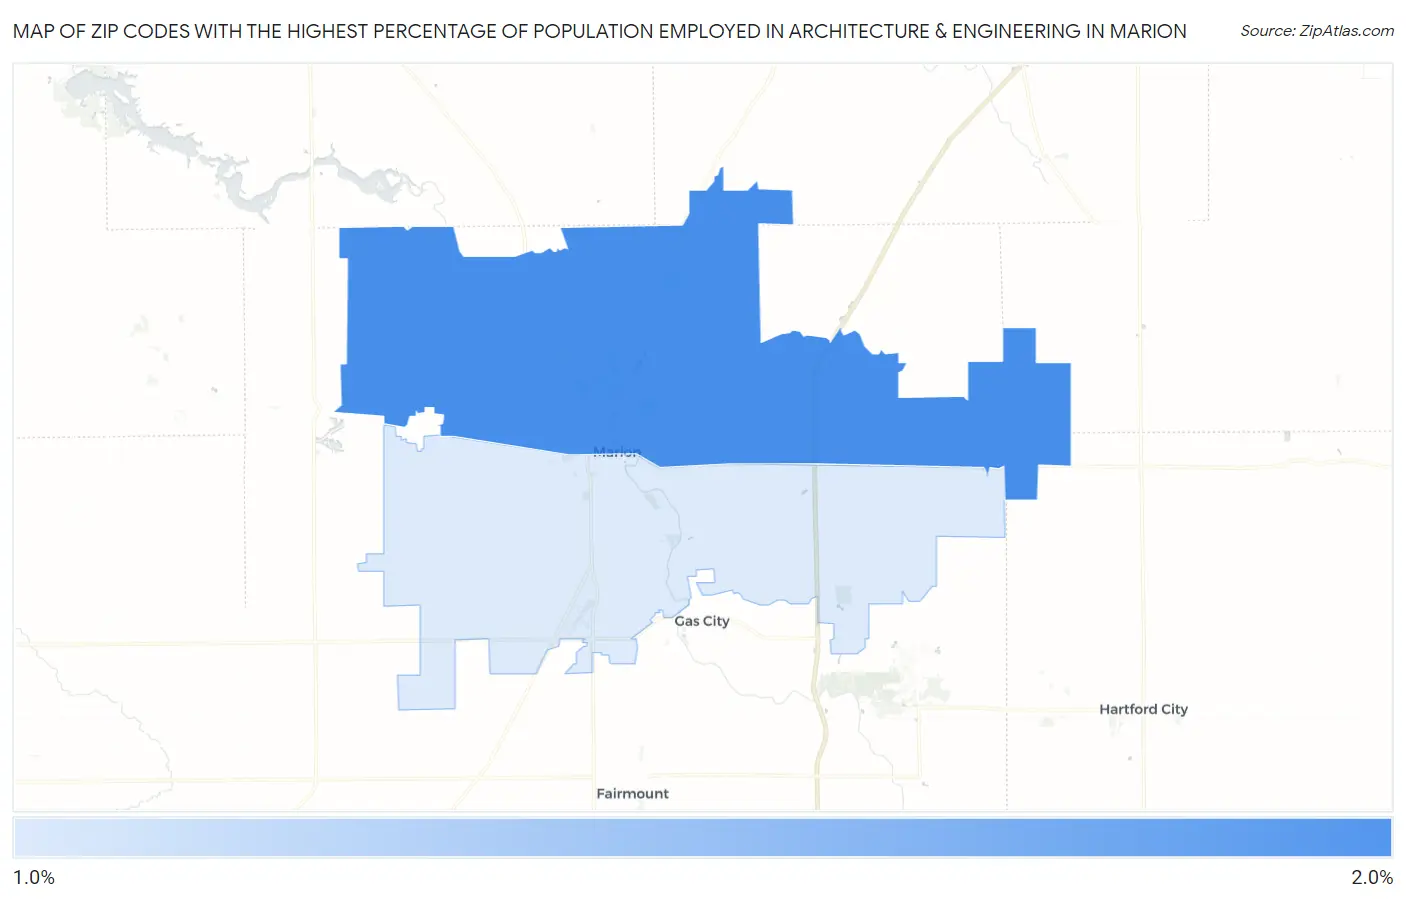
Zip Codes with the Highest Percentage of Population Employed in Architecture & Engineering in Marion, IN
RELATED REPORTS & OPTIONS
Architecture & Engineering
Marion
Compare Zip Codes
Map of Zip Codes with the Highest Percentage of Population Employed in Architecture & Engineering in Marion
1.4%
1.8%
Zip Codes with the Highest Percentage of Population Employed in Architecture & Engineering in Marion, IN
| Zip Code | % Employed | vs State | vs National | |
| 1. | 46952 | 1.8% | 2.2%(-0.439)#321 | 2.1%(-0.366)#10,926 |
| 2. | 46953 | 1.4% | 2.2%(-0.867)#401 | 2.1%(-0.794)#13,923 |
1
Common Questions
What are the Top Zip Codes with the Highest Percentage of Population Employed in Architecture & Engineering in Marion, IN?
Top Zip Codes with the Highest Percentage of Population Employed in Architecture & Engineering in Marion, IN are:
What zip code has the Highest Percentage of Population Employed in Architecture & Engineering in Marion, IN?
46952 has the Highest Percentage of Population Employed in Architecture & Engineering in Marion, IN with 1.8%.
What is the Percentage of Population Employed in Architecture & Engineering in Indiana?
Percentage of Population Employed in Architecture & Engineering in Indiana is 2.2%.
What is the Percentage of Population Employed in Architecture & Engineering in the United States?
Percentage of Population Employed in Architecture & Engineering in the United States is 2.1%.