Harrodsburg, IN Map & Demographics
Harrodsburg Map
Harrodsburg Overview
$37,816
PER CAPITA INCOME
$68,421
AVG FAMILY INCOME
0.46
INEQUALITY / GINI INDEX
371
TOTAL POPULATION
205
MALE POPULATION
166
FEMALE POPULATION
123.49
MALES / 100 FEMALES
80.98
FEMALES / 100 MALES
62.0
MEDIAN AGE
2.2
AVG FAMILY SIZE
1.9
AVG HOUSEHOLD SIZE
193
LABOR FORCE [ PEOPLE ]
53.8%
PERCENT IN LABOR FORCE
Harrodsburg Zip Codes
Harrodsburg Area Codes
Income in Harrodsburg
Income Overview in Harrodsburg
| Characteristic | Number | Measure |
| Per Capita Income | 371 | $37,816 |
| Median Family Income | 142 | $68,421 |
| Mean Family Income | 142 | $81,457 |
| Median Household Income | 192 | $0 |
| Mean Household Income | 192 | $72,930 |
| Income Deficit | 142 | $0 |
| Wage / Income Gap (%) | 371 | 0.00% |
| Wage / Income Gap ($) | 371 | 100.00¢ per $1 |
| Gini / Inequality Index | 371 | 0.46 |
Earnings by Sex in Harrodsburg
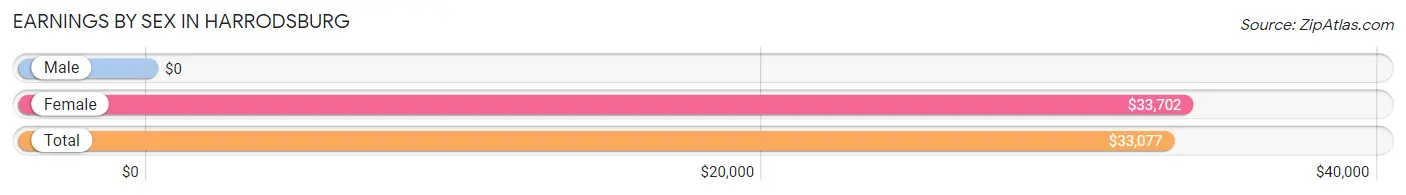
| Sex | Number | Average Earnings |
| Male | 123 (60.9%) | $0 |
| Female | 79 (39.1%) | $33,702 |
| Total | 202 (100.0%) | $33,077 |
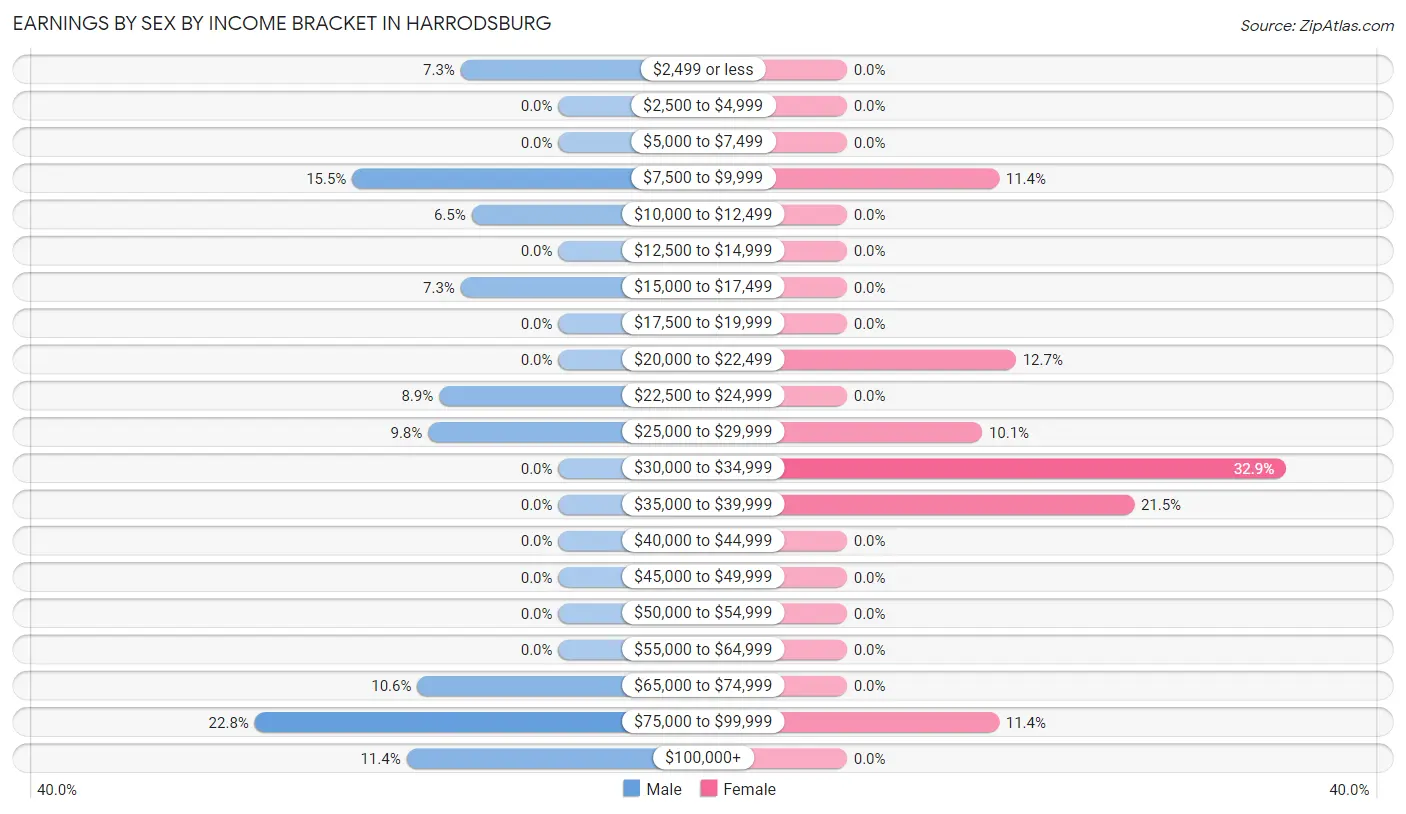
Earnings by Sex by Income Bracket in Harrodsburg
The most common earnings brackets in Harrodsburg are $75,000 to $99,999 for men (28 | 22.8%) and $30,000 to $34,999 for women (26 | 32.9%).
| Income | Male | Female |
| $2,499 or less | 9 (7.3%) | 0 (0.0%) |
| $2,500 to $4,999 | 0 (0.0%) | 0 (0.0%) |
| $5,000 to $7,499 | 0 (0.0%) | 0 (0.0%) |
| $7,500 to $9,999 | 19 (15.4%) | 9 (11.4%) |
| $10,000 to $12,499 | 8 (6.5%) | 0 (0.0%) |
| $12,500 to $14,999 | 0 (0.0%) | 0 (0.0%) |
| $15,000 to $17,499 | 9 (7.3%) | 0 (0.0%) |
| $17,500 to $19,999 | 0 (0.0%) | 0 (0.0%) |
| $20,000 to $22,499 | 0 (0.0%) | 10 (12.7%) |
| $22,500 to $24,999 | 11 (8.9%) | 0 (0.0%) |
| $25,000 to $29,999 | 12 (9.8%) | 8 (10.1%) |
| $30,000 to $34,999 | 0 (0.0%) | 26 (32.9%) |
| $35,000 to $39,999 | 0 (0.0%) | 17 (21.5%) |
| $40,000 to $44,999 | 0 (0.0%) | 0 (0.0%) |
| $45,000 to $49,999 | 0 (0.0%) | 0 (0.0%) |
| $50,000 to $54,999 | 0 (0.0%) | 0 (0.0%) |
| $55,000 to $64,999 | 0 (0.0%) | 0 (0.0%) |
| $65,000 to $74,999 | 13 (10.6%) | 0 (0.0%) |
| $75,000 to $99,999 | 28 (22.8%) | 9 (11.4%) |
| $100,000+ | 14 (11.4%) | 0 (0.0%) |
| Total | 123 (100.0%) | 79 (100.0%) |
Earnings by Sex by Educational Attainment in Harrodsburg
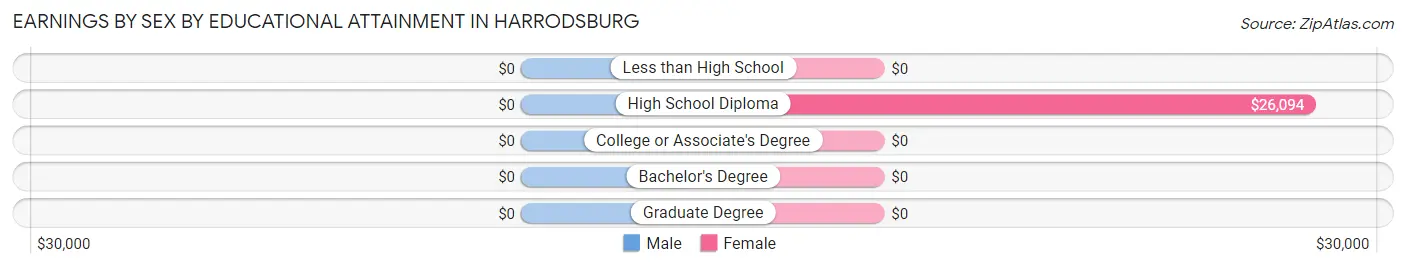
| Educational Attainment | Male Income | Female Income |
| Less than High School | - | - |
| High School Diploma | - | - |
| College or Associate's Degree | - | - |
| Bachelor's Degree | - | - |
| Graduate Degree | - | - |
| Total | - | - |
Family Income in Harrodsburg
Family Income Brackets in Harrodsburg
According to the Harrodsburg family income data, there are 37 families falling into the $10,000 to $14,999 income range, which is the most common income bracket and makes up 26.1% of all families.
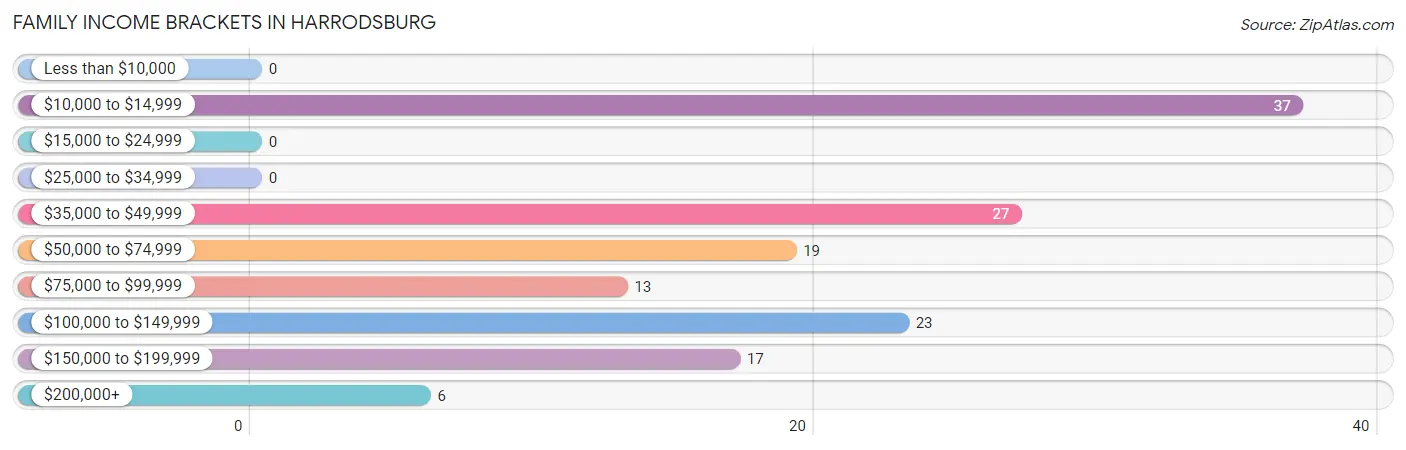
| Income Bracket | # Families | % Families |
| Less than $10,000 | 0 | 0.0% |
| $10,000 to $14,999 | 37 | 26.1% |
| $15,000 to $24,999 | 0 | 0.0% |
| $25,000 to $34,999 | 0 | 0.0% |
| $35,000 to $49,999 | 27 | 19.0% |
| $50,000 to $74,999 | 19 | 13.4% |
| $75,000 to $99,999 | 13 | 9.2% |
| $100,000 to $149,999 | 23 | 16.2% |
| $150,000 to $199,999 | 17 | 12.0% |
| $200,000+ | 6 | 4.2% |
Family Income by Famaliy Size in Harrodsburg
2-person families (126 | 88.7%) account for the highest median family income in Harrodsburg with $68,684 per family, while 2-person families (126 | 88.7%) have the highest median income of $34,342 per family member.
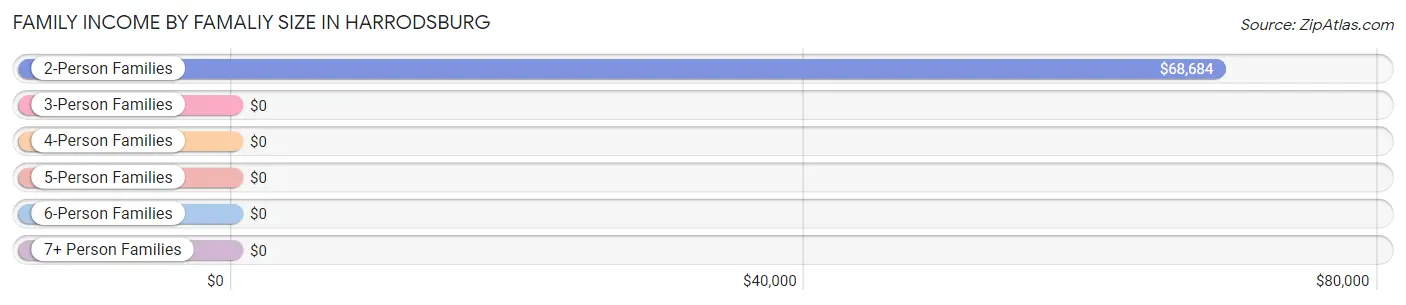
| Income Bracket | # Families | Median Income |
| 2-Person Families | 126 (88.7%) | $68,684 |
| 3-Person Families | 10 (7.0%) | $0 |
| 4-Person Families | 6 (4.2%) | $0 |
| 5-Person Families | 0 (0.0%) | $0 |
| 6-Person Families | 0 (0.0%) | $0 |
| 7+ Person Families | 0 (0.0%) | $0 |
| Total | 142 (100.0%) | $68,421 |
Family Income by Number of Earners in Harrodsburg
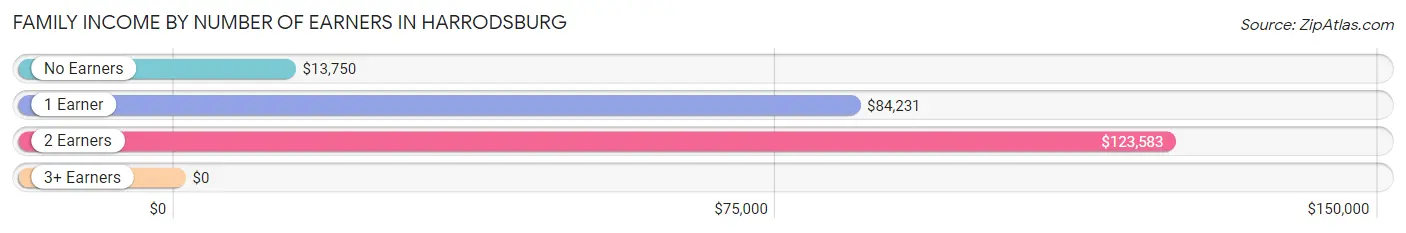
| Number of Earners | # Families | Median Income |
| No Earners | 45 (31.7%) | $13,750 |
| 1 Earner | 36 (25.4%) | $84,231 |
| 2 Earners | 51 (35.9%) | $123,583 |
| 3+ Earners | 10 (7.0%) | $0 |
| Total | 142 (100.0%) | $68,421 |
Household Income in Harrodsburg
Household Income Brackets in Harrodsburg
With 37 households falling in the category, the $10,000 to $14,999 income range is the most frequent in Harrodsburg, accounting for 19.3% of all households.
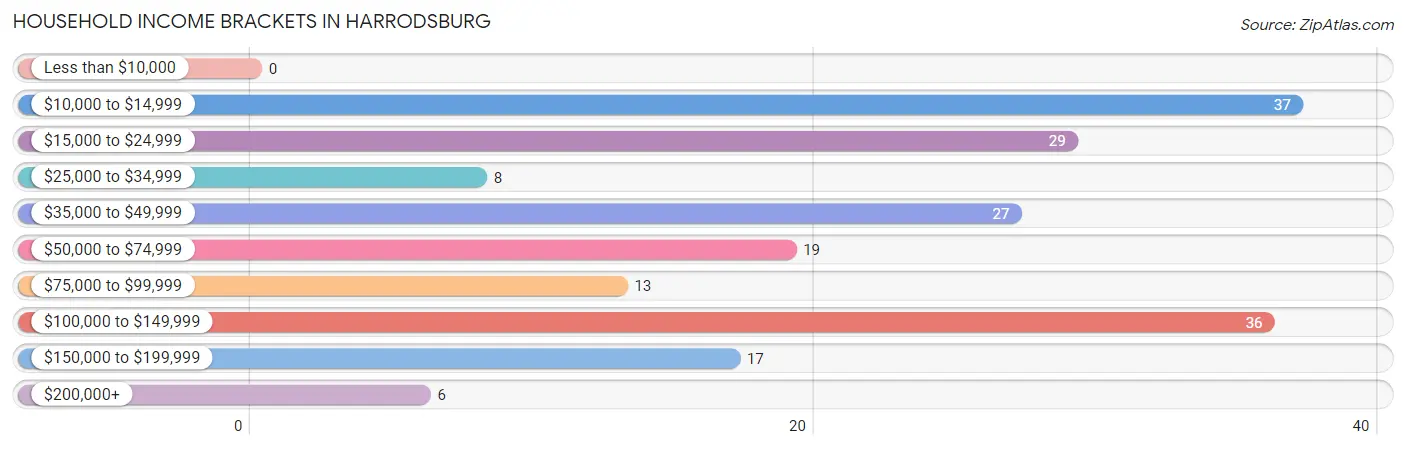
| Income Bracket | # Households | % Households |
| Less than $10,000 | 0 | 0.0% |
| $10,000 to $14,999 | 37 | 19.3% |
| $15,000 to $24,999 | 29 | 15.1% |
| $25,000 to $34,999 | 8 | 4.2% |
| $35,000 to $49,999 | 27 | 14.1% |
| $50,000 to $74,999 | 19 | 9.9% |
| $75,000 to $99,999 | 13 | 6.8% |
| $100,000 to $149,999 | 36 | 18.8% |
| $150,000 to $199,999 | 17 | 8.9% |
| $200,000+ | 6 | 3.1% |
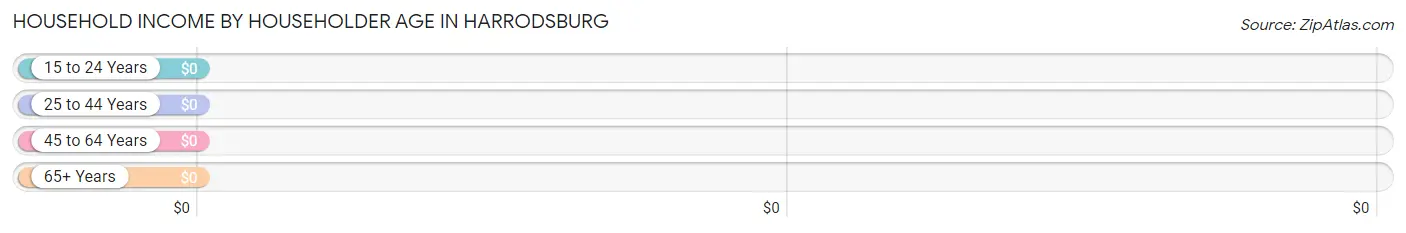
Household Income by Householder Age in Harrodsburg
| Income Bracket | # Households | Median Income |
| 15 to 24 Years | 0 (0.0%) | $0 |
| 25 to 44 Years | 28 (14.6%) | $0 |
| 45 to 64 Years | 87 (45.3%) | $0 |
| 65+ Years | 77 (40.1%) | $0 |
| Total | 192 (100.0%) | $0 |
Poverty in Harrodsburg
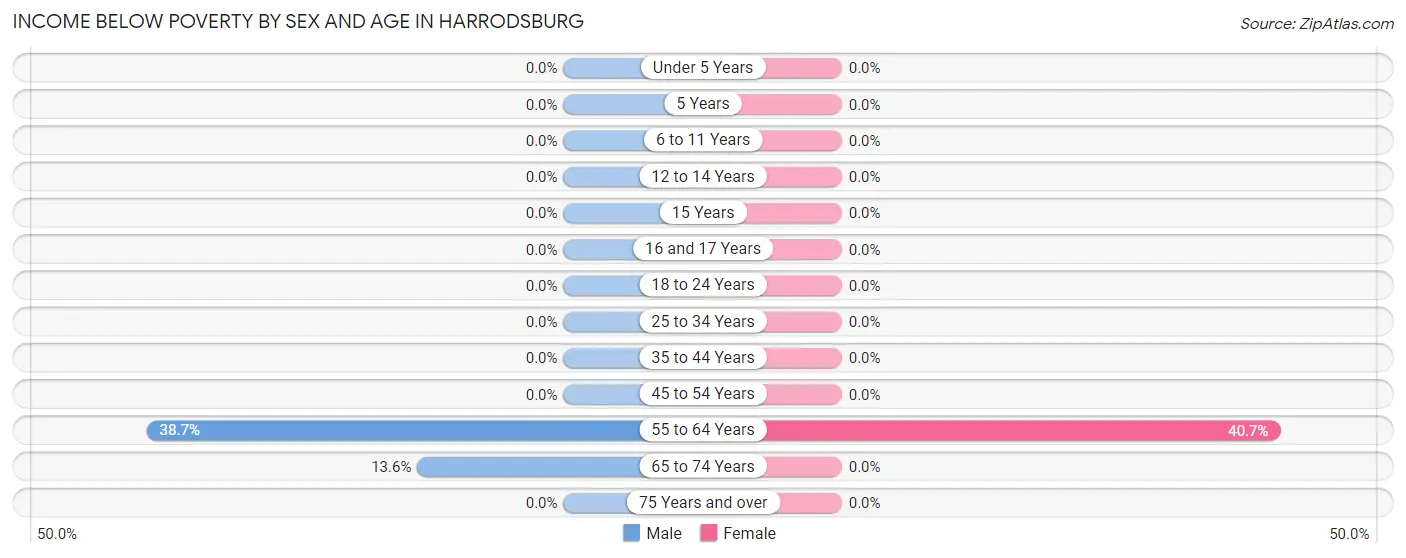
Income Below Poverty by Sex and Age in Harrodsburg
With 18.0% poverty level for males and 21.1% for females among the residents of Harrodsburg, 55 to 64 year old males and 55 to 64 year old females are the most vulnerable to poverty, with 29 males (38.7%) and 35 females (40.7%) in their respective age groups living below the poverty level.
| Age Bracket | Male | Female |
| Under 5 Years | 0 (0.0%) | 0 (0.0%) |
| 5 Years | 0 (0.0%) | 0 (0.0%) |
| 6 to 11 Years | 0 (0.0%) | 0 (0.0%) |
| 12 to 14 Years | 0 (0.0%) | 0 (0.0%) |
| 15 Years | 0 (0.0%) | 0 (0.0%) |
| 16 and 17 Years | 0 (0.0%) | 0 (0.0%) |
| 18 to 24 Years | 0 (0.0%) | 0 (0.0%) |
| 25 to 34 Years | 0 (0.0%) | 0 (0.0%) |
| 35 to 44 Years | 0 (0.0%) | 0 (0.0%) |
| 45 to 54 Years | 0 (0.0%) | 0 (0.0%) |
| 55 to 64 Years | 29 (38.7%) | 35 (40.7%) |
| 65 to 74 Years | 8 (13.6%) | 0 (0.0%) |
| 75 Years and over | 0 (0.0%) | 0 (0.0%) |
| Total | 37 (18.0%) | 35 (21.1%) |
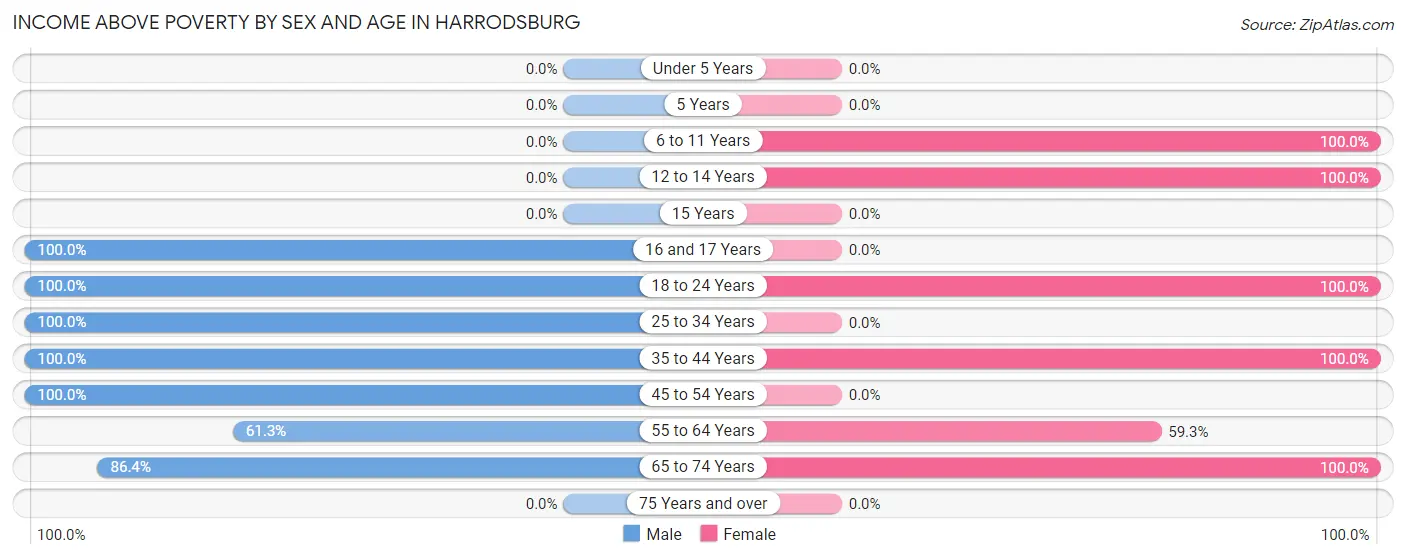
Income Above Poverty by Sex and Age in Harrodsburg
According to the poverty statistics in Harrodsburg, males aged 16 and 17 years and females aged 6 to 11 years are the age groups that are most secure financially, with 100.0% of males and 100.0% of females in these age groups living above the poverty line.
| Age Bracket | Male | Female |
| Under 5 Years | 0 (0.0%) | 0 (0.0%) |
| 5 Years | 0 (0.0%) | 0 (0.0%) |
| 6 to 11 Years | 0 (0.0%) | 6 (100.0%) |
| 12 to 14 Years | 0 (0.0%) | 6 (100.0%) |
| 15 Years | 0 (0.0%) | 0 (0.0%) |
| 16 and 17 Years | 16 (100.0%) | 0 (0.0%) |
| 18 to 24 Years | 9 (100.0%) | 17 (100.0%) |
| 25 to 34 Years | 28 (100.0%) | 0 (0.0%) |
| 35 to 44 Years | 12 (100.0%) | 7 (100.0%) |
| 45 to 54 Years | 6 (100.0%) | 0 (0.0%) |
| 55 to 64 Years | 46 (61.3%) | 51 (59.3%) |
| 65 to 74 Years | 51 (86.4%) | 44 (100.0%) |
| 75 Years and over | 0 (0.0%) | 0 (0.0%) |
| Total | 168 (82.0%) | 131 (78.9%) |
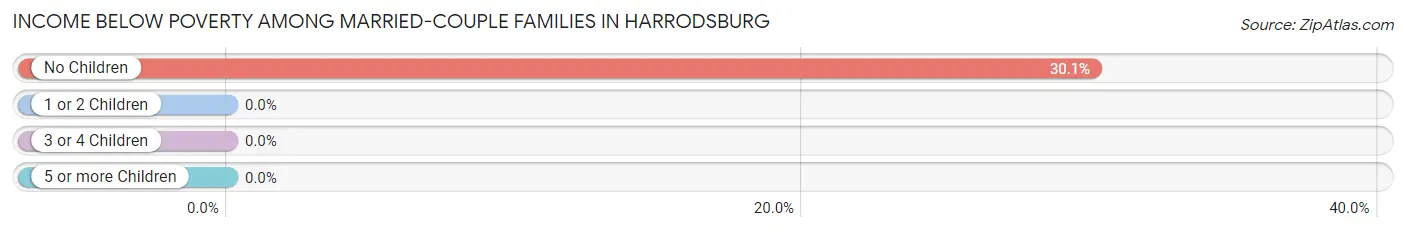
Income Below Poverty Among Married-Couple Families in Harrodsburg
The poverty statistics for married-couple families in Harrodsburg show that 28.7% or 37 of the total 129 families live below the poverty line. Families with no children have the highest poverty rate of 30.1%, comprising of 37 families. On the other hand, families with 1 or 2 children have the lowest poverty rate of 0.0%, which includes 0 families.
| Children | Above Poverty | Below Poverty |
| No Children | 86 (69.9%) | 37 (30.1%) |
| 1 or 2 Children | 6 (100.0%) | 0 (0.0%) |
| 3 or 4 Children | 0 (0.0%) | 0 (0.0%) |
| 5 or more Children | 0 (0.0%) | 0 (0.0%) |
| Total | 92 (71.3%) | 37 (28.7%) |
Income Below Poverty Among Single-Parent Households in Harrodsburg
| Children | Single Father | Single Mother |
| No Children | 0 (0.0%) | 0 (0.0%) |
| 1 or 2 Children | 0 (0.0%) | 0 (0.0%) |
| 3 or 4 Children | 0 (0.0%) | 0 (0.0%) |
| 5 or more Children | 0 (0.0%) | 0 (0.0%) |
| Total | 0 (0.0%) | 0 (0.0%) |
Income Below Poverty Among Married-Couple vs Single-Parent Households in Harrodsburg
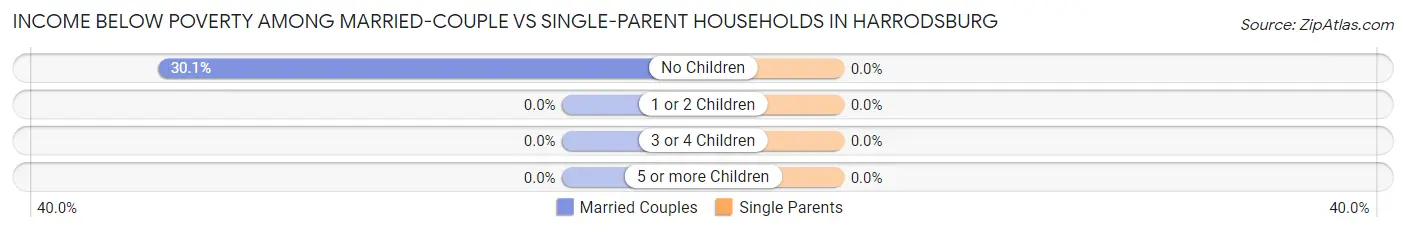
| Children | Married-Couple Families | Single-Parent Households |
| No Children | 37 (30.1%) | 0 (0.0%) |
| 1 or 2 Children | 0 (0.0%) | 0 (0.0%) |
| 3 or 4 Children | 0 (0.0%) | 0 (0.0%) |
| 5 or more Children | 0 (0.0%) | 0 (0.0%) |
| Total | 37 (28.7%) | 0 (0.0%) |
Race in Harrodsburg
The most populous races in Harrodsburg are White / Caucasian (341 | 91.9%), and Some other Race (30 | 8.1%).
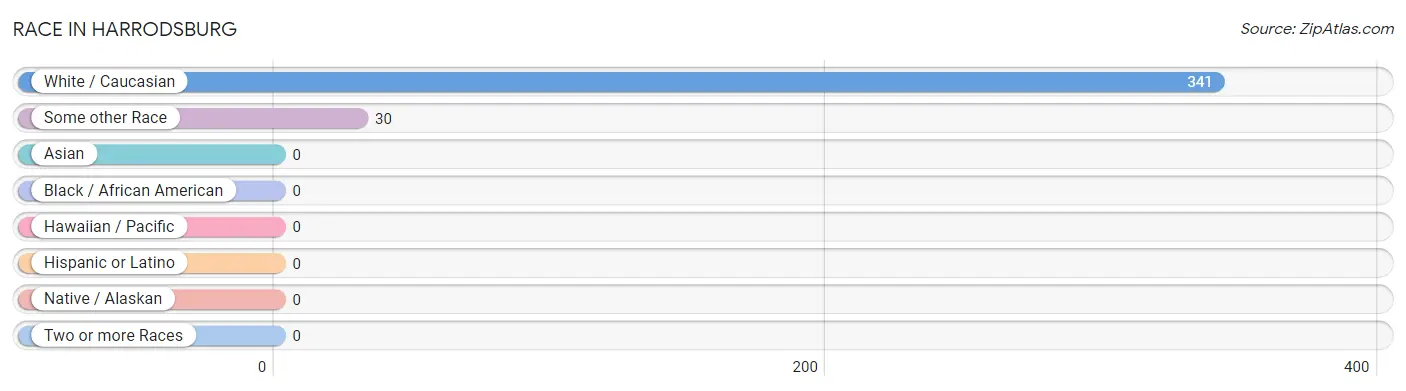
| Race | # Population | % Population |
| Asian | 0 | 0.0% |
| Black / African American | 0 | 0.0% |
| Hawaiian / Pacific | 0 | 0.0% |
| Hispanic or Latino | 0 | 0.0% |
| Native / Alaskan | 0 | 0.0% |
| White / Caucasian | 341 | 91.9% |
| Two or more Races | 0 | 0.0% |
| Some other Race | 30 | 8.1% |
| Total | 371 | 100.0% |
Ancestry in Harrodsburg
The most populous ancestries reported in Harrodsburg are American (107 | 28.8%), German (94 | 25.3%), English (69 | 18.6%), Irish (55 | 14.8%), and Scandinavian (29 | 7.8%), together accounting for 95.4% of all Harrodsburg residents.
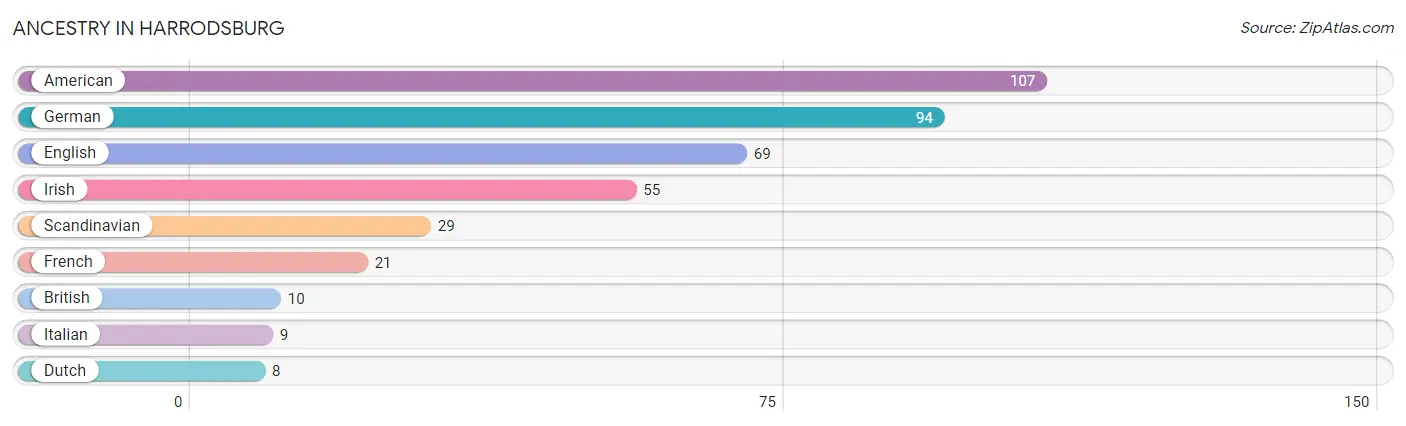
| Ancestry | # Population | % Population |
| American | 107 | 28.8% |
| British | 10 | 2.7% |
| Dutch | 8 | 2.2% |
| English | 69 | 18.6% |
| French | 21 | 5.7% |
| German | 94 | 25.3% |
| Irish | 55 | 14.8% |
| Italian | 9 | 2.4% |
| Scandinavian | 29 | 7.8% | View All 9 Rows |
Immigrants in Harrodsburg

| Immigration Origin | # Population | % Population | View All 0 Rows |
Sex and Age in Harrodsburg
Sex and Age in Harrodsburg
The most populous age groups in Harrodsburg are 60 to 64 Years (56 | 27.3%) for men and 55 to 59 Years (51 | 30.7%) for women.
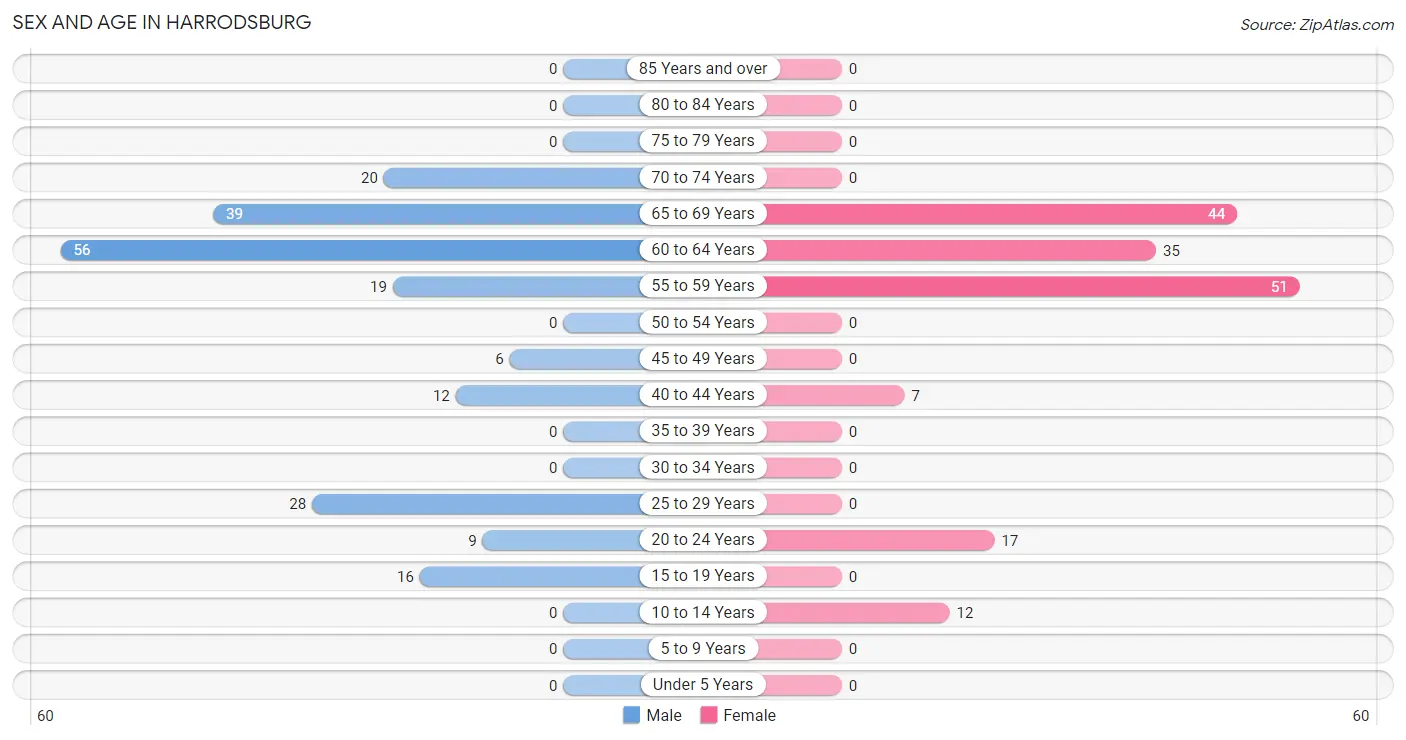
| Age Bracket | Male | Female |
| Under 5 Years | 0 (0.0%) | 0 (0.0%) |
| 5 to 9 Years | 0 (0.0%) | 0 (0.0%) |
| 10 to 14 Years | 0 (0.0%) | 12 (7.2%) |
| 15 to 19 Years | 16 (7.8%) | 0 (0.0%) |
| 20 to 24 Years | 9 (4.4%) | 17 (10.2%) |
| 25 to 29 Years | 28 (13.7%) | 0 (0.0%) |
| 30 to 34 Years | 0 (0.0%) | 0 (0.0%) |
| 35 to 39 Years | 0 (0.0%) | 0 (0.0%) |
| 40 to 44 Years | 12 (5.9%) | 7 (4.2%) |
| 45 to 49 Years | 6 (2.9%) | 0 (0.0%) |
| 50 to 54 Years | 0 (0.0%) | 0 (0.0%) |
| 55 to 59 Years | 19 (9.3%) | 51 (30.7%) |
| 60 to 64 Years | 56 (27.3%) | 35 (21.1%) |
| 65 to 69 Years | 39 (19.0%) | 44 (26.5%) |
| 70 to 74 Years | 20 (9.8%) | 0 (0.0%) |
| 75 to 79 Years | 0 (0.0%) | 0 (0.0%) |
| 80 to 84 Years | 0 (0.0%) | 0 (0.0%) |
| 85 Years and over | 0 (0.0%) | 0 (0.0%) |
| Total | 205 (100.0%) | 166 (100.0%) |
Families and Households in Harrodsburg
Median Family Size in Harrodsburg
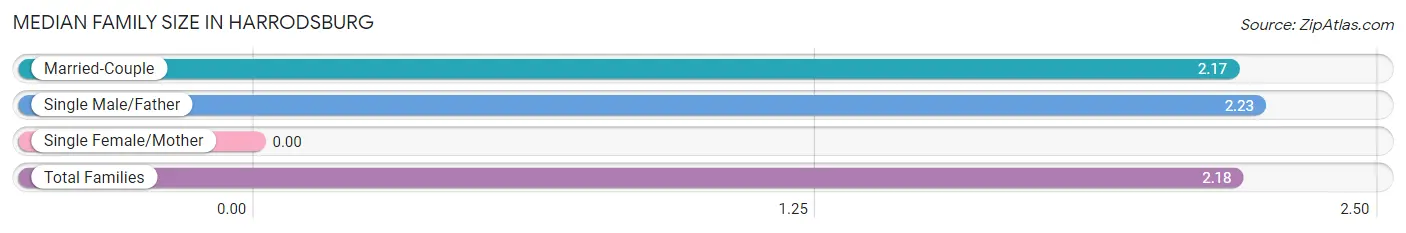
| Family Type | # Families | Family Size |
| Married-Couple | 129 (90.8%) | 2.17 |
| Single Male/Father | 13 (9.1%) | 2.23 |
| Single Female/Mother | 0 (0.0%) | - |
| Total Families | 142 (100.0%) | 2.18 |
Median Household Size in Harrodsburg
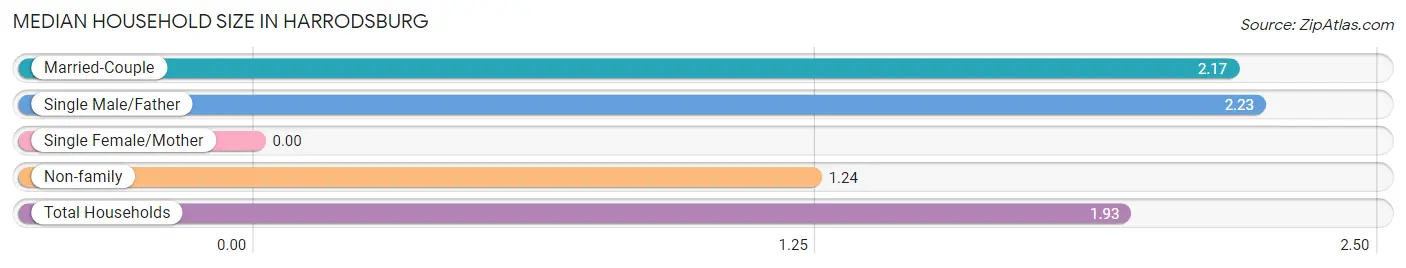
| Household Type | # Households | Household Size |
| Married-Couple | 129 (67.2%) | 2.17 |
| Single Male/Father | 13 (6.8%) | 2.23 |
| Single Female/Mother | 0 (0.0%) | - |
| Non-family | 50 (26.0%) | 1.24 |
| Total Households | 192 (100.0%) | 1.93 |
Household Size by Marriage Status in Harrodsburg
Out of a total of 192 households in Harrodsburg, 142 (74.0%) are family households, while 50 (26.0%) are nonfamily households. The most numerous type of family households are 2-person households, comprising 126, and the most common type of nonfamily households are 1-person households, comprising 37.
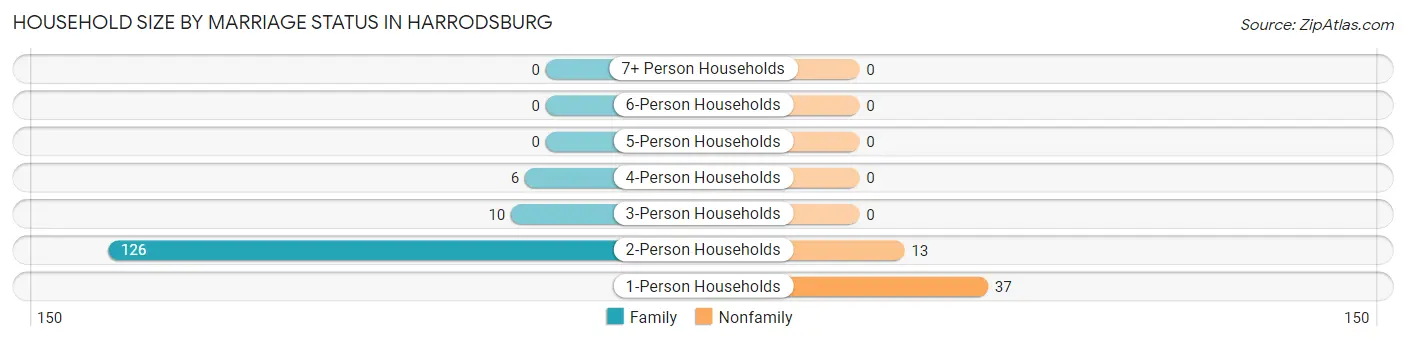
| Household Size | Family Households | Nonfamily Households |
| 1-Person Households | - | 37 (19.3%) |
| 2-Person Households | 126 (65.6%) | 13 (6.8%) |
| 3-Person Households | 10 (5.2%) | 0 (0.0%) |
| 4-Person Households | 6 (3.1%) | 0 (0.0%) |
| 5-Person Households | 0 (0.0%) | 0 (0.0%) |
| 6-Person Households | 0 (0.0%) | 0 (0.0%) |
| 7+ Person Households | 0 (0.0%) | 0 (0.0%) |
| Total | 142 (74.0%) | 50 (26.0%) |
Female Fertility in Harrodsburg
Fertility by Age in Harrodsburg
| Age Bracket | Women with Births | Births / 1,000 Women |
| 15 to 19 years | 0 (0.0%) | 0.0 |
| 20 to 34 years | 0 (0.0%) | 0.0 |
| 35 to 50 years | 0 (0.0%) | 0.0 |
| Total | 0 (0.0%) | 0.0 |
Fertility by Age by Marriage Status in Harrodsburg
| Age Bracket | Married | Unmarried |
| 15 to 19 years | 0 (0.0%) | 0 (0.0%) |
| 20 to 34 years | 0 (0.0%) | 0 (0.0%) |
| 35 to 50 years | 0 (0.0%) | 0 (0.0%) |
| Total | 0 (0.0%) | 0 (0.0%) |
Fertility by Education in Harrodsburg
| Educational Attainment | Women with Births | Births / 1,000 Women |
| Less than High School | 0 (0.0%) | 0.0 |
| High School Diploma | 0 (0.0%) | 0.0 |
| College or Associate's Degree | 0 (0.0%) | 0.0 |
| Bachelor's Degree | 0 (0.0%) | 0.0 |
| Graduate Degree | 0 (0.0%) | 0.0 |
| Total | 0 (0.0%) | 0.0 |
Fertility by Education by Marriage Status in Harrodsburg
| Educational Attainment | Married | Unmarried |
| Less than High School | 0 (0.0%) | 0 (0.0%) |
| High School Diploma | 0 (0.0%) | 0 (0.0%) |
| College or Associate's Degree | 0 (0.0%) | 0 (0.0%) |
| Bachelor's Degree | 0 (0.0%) | 0 (0.0%) |
| Graduate Degree | 0 (0.0%) | 0 (0.0%) |
| Total | 0 (0.0%) | 0 (0.0%) |
Employment Characteristics in Harrodsburg
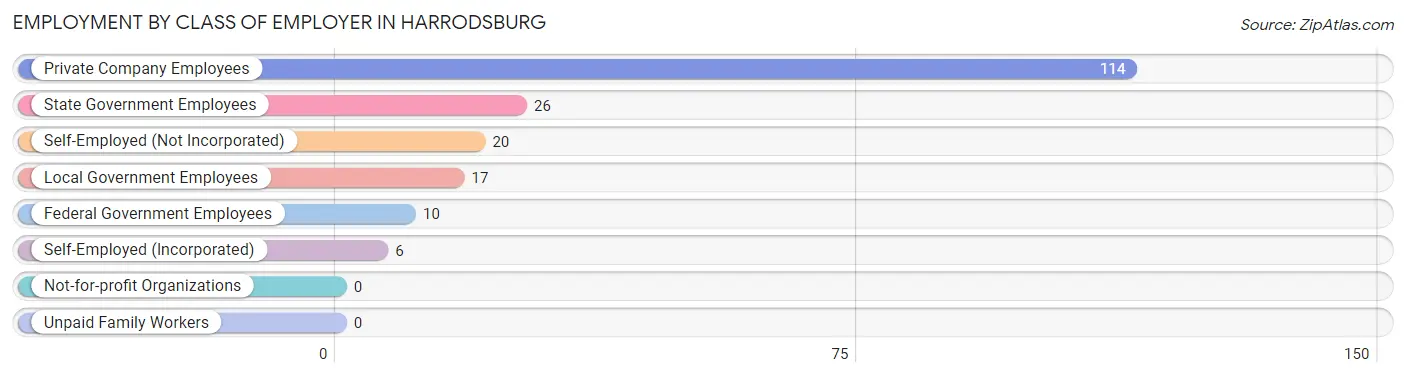
Employment by Class of Employer in Harrodsburg
Among the 193 employed individuals in Harrodsburg, private company employees (114 | 59.1%), state government employees (26 | 13.5%), and self-employed (not incorporated) (20 | 10.4%) make up the most common classes of employment.
| Employer Class | # Employees | % Employees |
| Private Company Employees | 114 | 59.1% |
| Self-Employed (Incorporated) | 6 | 3.1% |
| Self-Employed (Not Incorporated) | 20 | 10.4% |
| Not-for-profit Organizations | 0 | 0.0% |
| Local Government Employees | 17 | 8.8% |
| State Government Employees | 26 | 13.5% |
| Federal Government Employees | 10 | 5.2% |
| Unpaid Family Workers | 0 | 0.0% |
| Total | 193 | 100.0% |
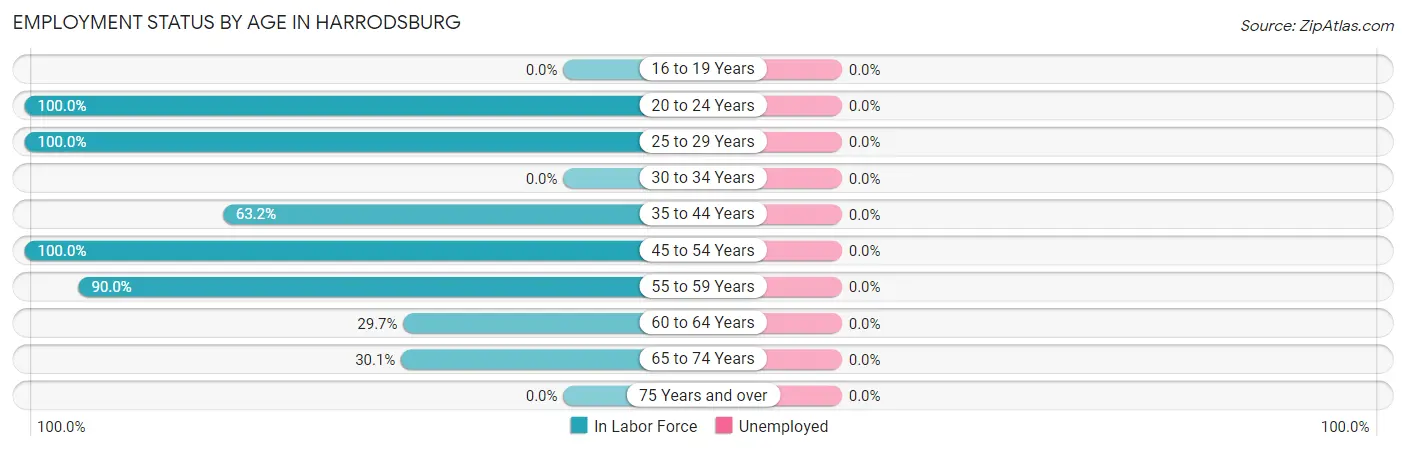
Employment Status by Age in Harrodsburg
| Age Bracket | In Labor Force | Unemployed |
| 16 to 19 Years | 0 (0.0%) | 0 (0.0%) |
| 20 to 24 Years | 26 (100.0%) | 0 (0.0%) |
| 25 to 29 Years | 28 (100.0%) | 0 (0.0%) |
| 30 to 34 Years | 0 (0.0%) | 0 (0.0%) |
| 35 to 44 Years | 12 (63.2%) | 0 (0.0%) |
| 45 to 54 Years | 6 (100.0%) | 0 (0.0%) |
| 55 to 59 Years | 63 (90.0%) | 0 (0.0%) |
| 60 to 64 Years | 27 (29.7%) | 0 (0.0%) |
| 65 to 74 Years | 31 (30.1%) | 0 (0.0%) |
| 75 Years and over | 0 (0.0%) | 0 (0.0%) |
| Total | 193 (53.8%) | 0 (0.0%) |
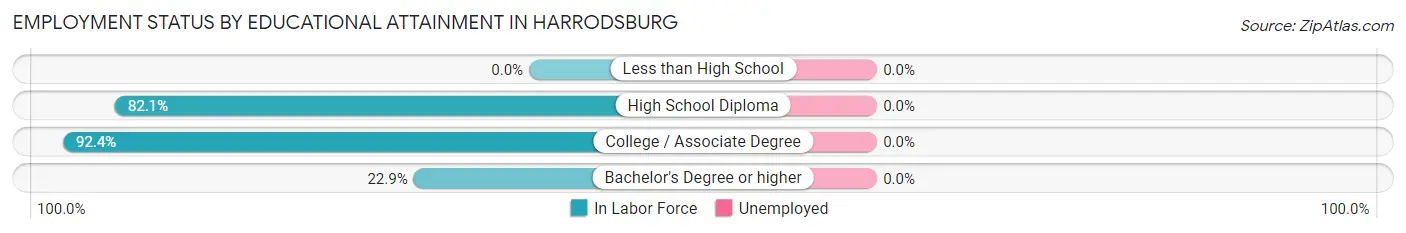
Employment Status by Educational Attainment in Harrodsburg
| Educational Attainment | In Labor Force | Unemployed |
| Less than High School | 0 (0.0%) | 0 (0.0%) |
| High School Diploma | 32 (82.1%) | 0 (0.0%) |
| College / Associate Degree | 85 (92.4%) | 0 (0.0%) |
| Bachelor's Degree or higher | 19 (22.9%) | 0 (0.0%) |
| Total | 136 (63.6%) | 0 (0.0%) |
Employment Occupations by Sex in Harrodsburg
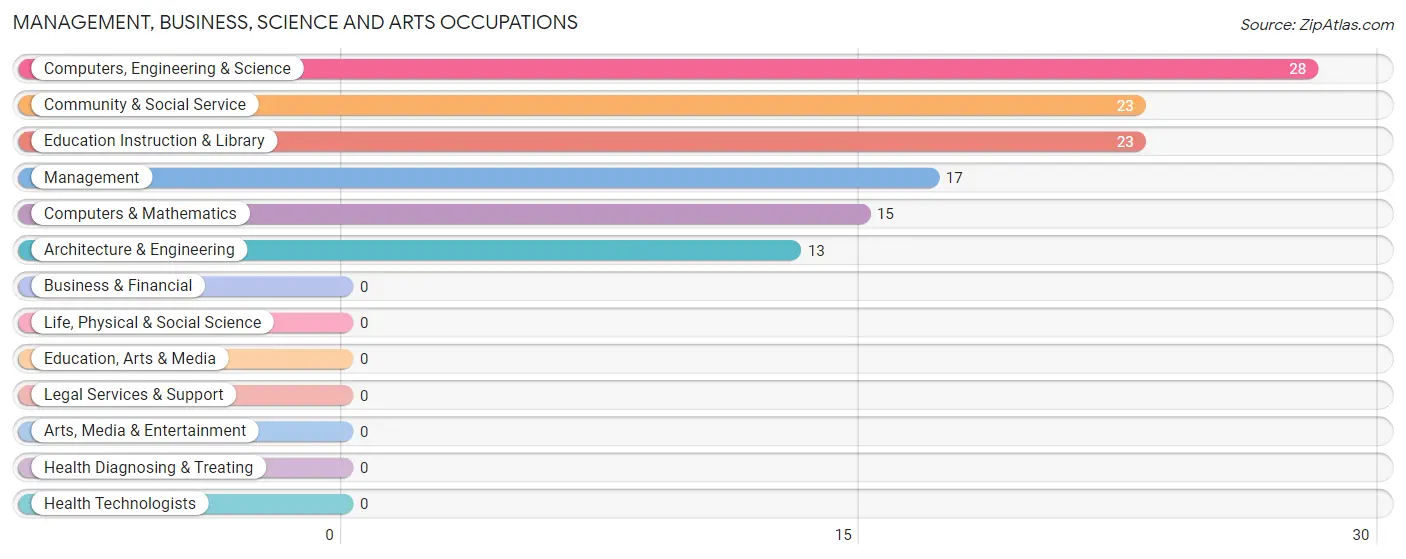
Management, Business, Science and Arts Occupations
The most common Management, Business, Science and Arts occupations in Harrodsburg are Computers, Engineering & Science (28 | 14.5%), Community & Social Service (23 | 11.9%), Education Instruction & Library (23 | 11.9%), Management (17 | 8.8%), and Computers & Mathematics (15 | 7.8%).
Management, Business, Science and Arts Occupations by Sex
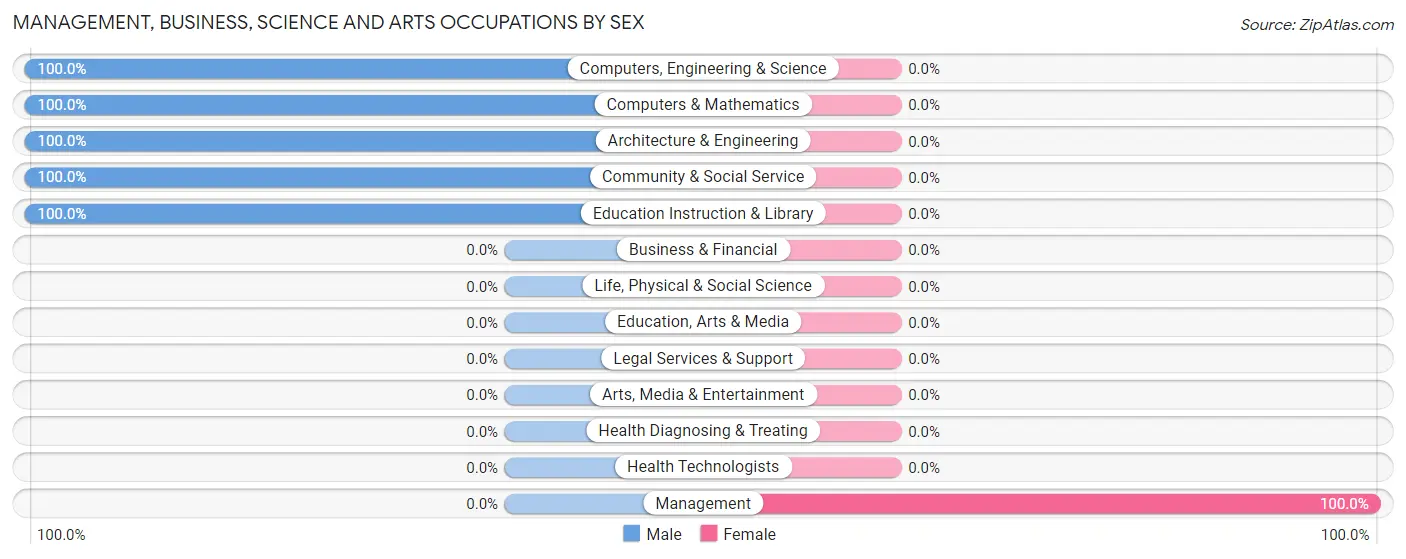
| Occupation | Male | Female |
| Management | 0 (0.0%) | 17 (100.0%) |
| Business & Financial | 0 (0.0%) | 0 (0.0%) |
| Computers, Engineering & Science | 28 (100.0%) | 0 (0.0%) |
| Computers & Mathematics | 15 (100.0%) | 0 (0.0%) |
| Architecture & Engineering | 13 (100.0%) | 0 (0.0%) |
| Life, Physical & Social Science | 0 (0.0%) | 0 (0.0%) |
| Community & Social Service | 23 (100.0%) | 0 (0.0%) |
| Education, Arts & Media | 0 (0.0%) | 0 (0.0%) |
| Legal Services & Support | 0 (0.0%) | 0 (0.0%) |
| Education Instruction & Library | 23 (100.0%) | 0 (0.0%) |
| Arts, Media & Entertainment | 0 (0.0%) | 0 (0.0%) |
| Health Diagnosing & Treating | 0 (0.0%) | 0 (0.0%) |
| Health Technologists | 0 (0.0%) | 0 (0.0%) |
| Total (Category) | 51 (75.0%) | 17 (25.0%) |
| Total (Overall) | 123 (63.7%) | 70 (36.3%) |
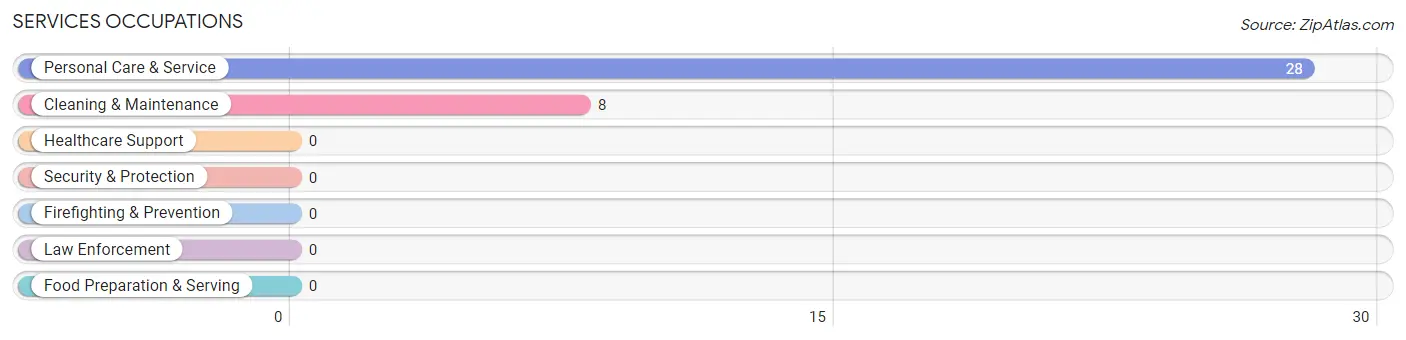
Services Occupations
The most common Services occupations in Harrodsburg are Personal Care & Service (28 | 14.5%), and Cleaning & Maintenance (8 | 4.2%).
Services Occupations by Sex
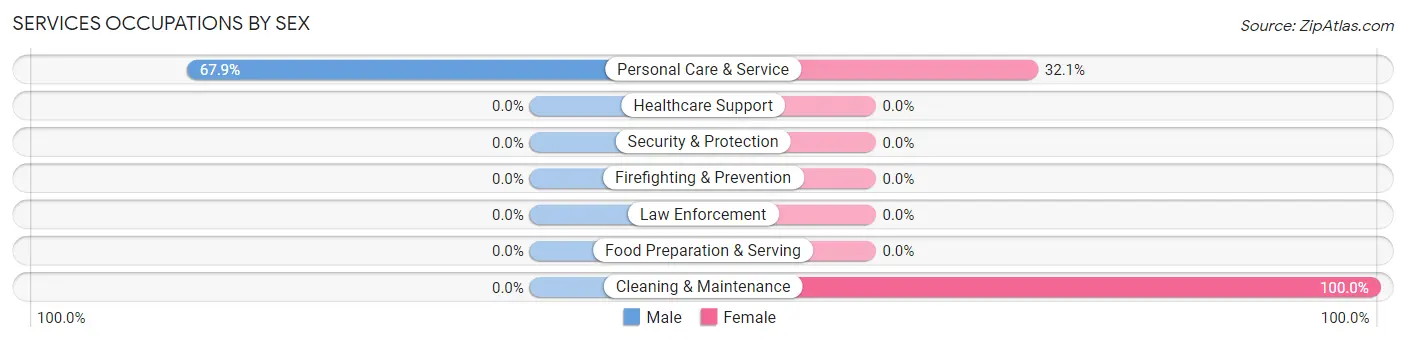
| Occupation | Male | Female |
| Healthcare Support | 0 (0.0%) | 0 (0.0%) |
| Security & Protection | 0 (0.0%) | 0 (0.0%) |
| Firefighting & Prevention | 0 (0.0%) | 0 (0.0%) |
| Law Enforcement | 0 (0.0%) | 0 (0.0%) |
| Food Preparation & Serving | 0 (0.0%) | 0 (0.0%) |
| Cleaning & Maintenance | 0 (0.0%) | 8 (100.0%) |
| Personal Care & Service | 19 (67.9%) | 9 (32.1%) |
| Total (Category) | 19 (52.8%) | 17 (47.2%) |
| Total (Overall) | 123 (63.7%) | 70 (36.3%) |
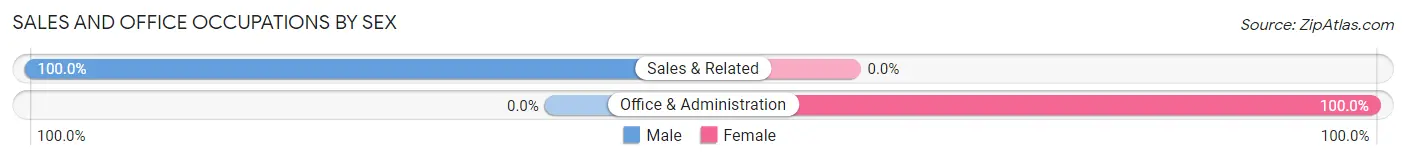
Sales and Office Occupations
The most common Sales and Office occupations in Harrodsburg are Office & Administration (36 | 18.6%), and Sales & Related (19 | 9.8%).
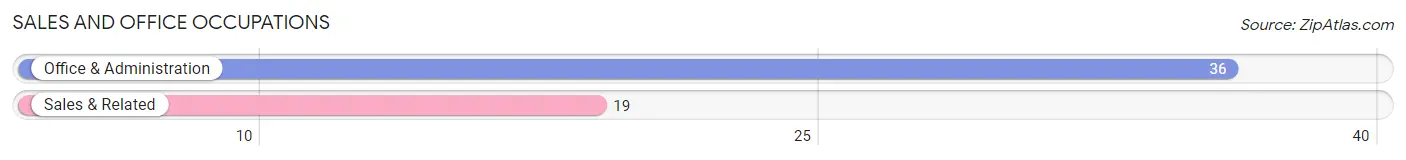
Sales and Office Occupations by Sex
| Occupation | Male | Female |
| Sales & Related | 19 (100.0%) | 0 (0.0%) |
| Office & Administration | 0 (0.0%) | 36 (100.0%) |
| Total (Category) | 19 (34.5%) | 36 (65.4%) |
| Total (Overall) | 123 (63.7%) | 70 (36.3%) |
Natural Resources, Construction and Maintenance Occupations
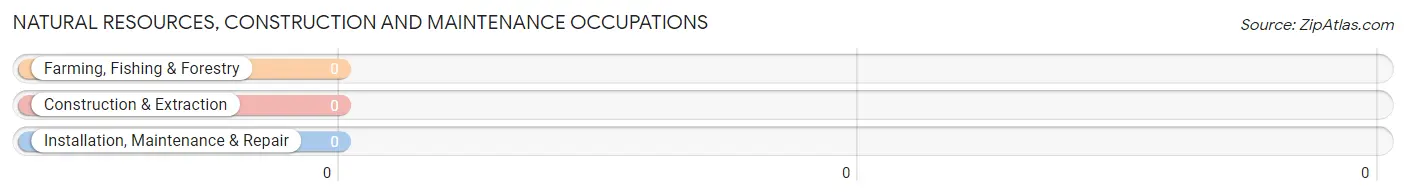
Natural Resources, Construction and Maintenance Occupations by Sex
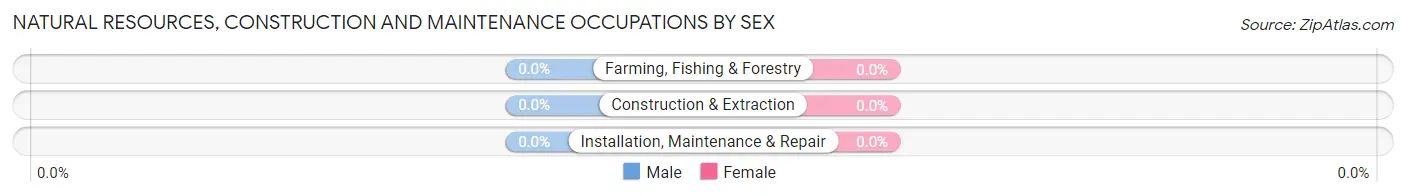
| Occupation | Male | Female |
| Farming, Fishing & Forestry | 0 (0.0%) | 0 (0.0%) |
| Construction & Extraction | 0 (0.0%) | 0 (0.0%) |
| Installation, Maintenance & Repair | 0 (0.0%) | 0 (0.0%) |
| Total (Category) | 0 (0.0%) | 0 (0.0%) |
| Total (Overall) | 123 (63.7%) | 70 (36.3%) |
Production, Transportation and Moving Occupations
The most common Production, Transportation and Moving occupations in Harrodsburg are Production (25 | 13.0%), and Material Moving (9 | 4.7%).
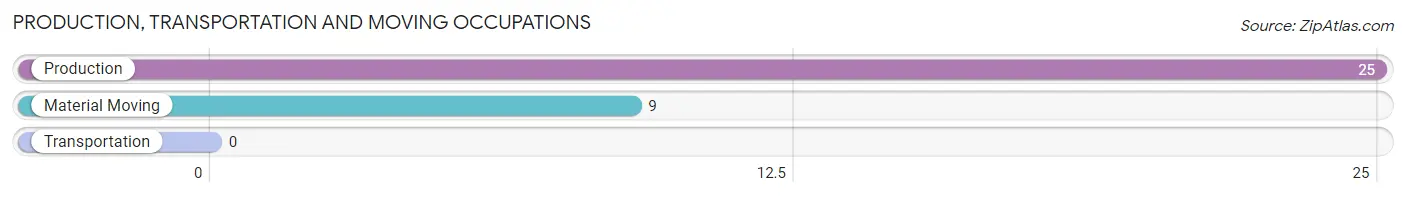
Production, Transportation and Moving Occupations by Sex
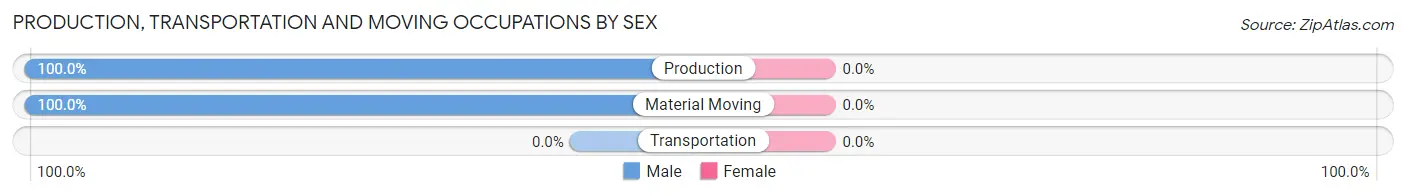
| Occupation | Male | Female |
| Production | 25 (100.0%) | 0 (0.0%) |
| Transportation | 0 (0.0%) | 0 (0.0%) |
| Material Moving | 9 (100.0%) | 0 (0.0%) |
| Total (Category) | 34 (100.0%) | 0 (0.0%) |
| Total (Overall) | 123 (63.7%) | 70 (36.3%) |
Employment Industries by Sex in Harrodsburg
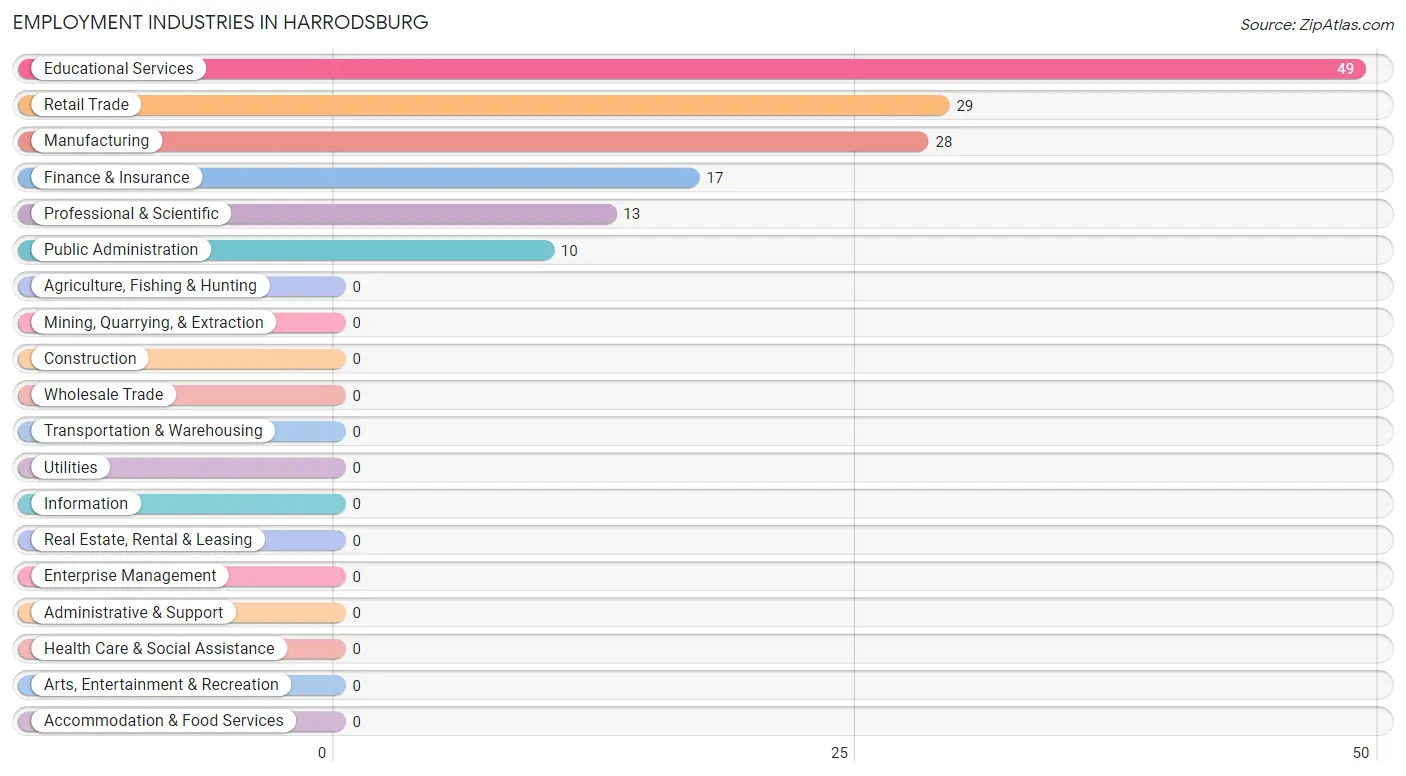
Employment Industries in Harrodsburg
The major employment industries in Harrodsburg include Educational Services (49 | 25.4%), Retail Trade (29 | 15.0%), Manufacturing (28 | 14.5%), Finance & Insurance (17 | 8.8%), and Professional & Scientific (13 | 6.7%).
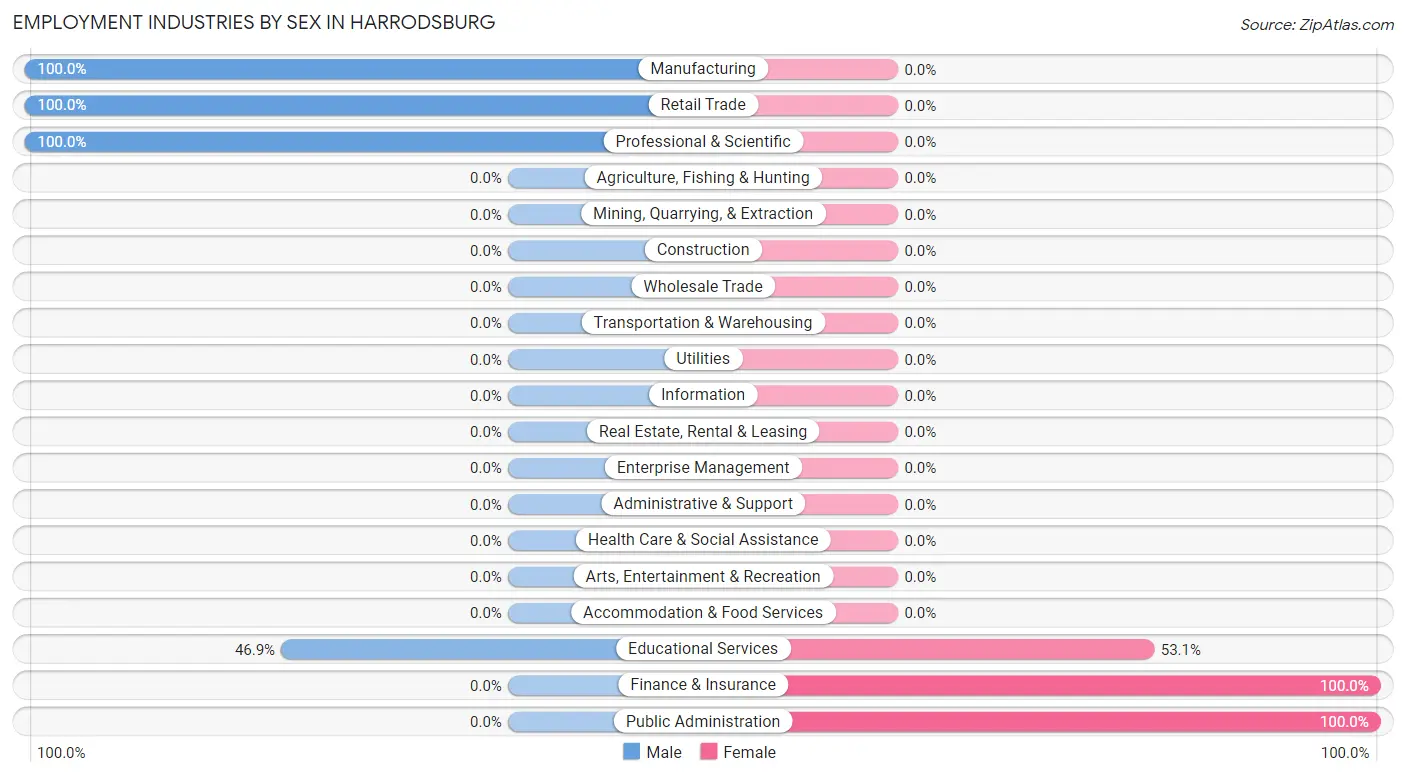
Employment Industries by Sex in Harrodsburg
The Harrodsburg industries that see more men than women are Manufacturing (100.0%), Retail Trade (100.0%), and Professional & Scientific (100.0%), whereas the industries that tend to have a higher number of women are Finance & Insurance (100.0%), Public Administration (100.0%), and Educational Services (53.1%).
| Industry | Male | Female |
| Agriculture, Fishing & Hunting | 0 (0.0%) | 0 (0.0%) |
| Mining, Quarrying, & Extraction | 0 (0.0%) | 0 (0.0%) |
| Construction | 0 (0.0%) | 0 (0.0%) |
| Manufacturing | 28 (100.0%) | 0 (0.0%) |
| Wholesale Trade | 0 (0.0%) | 0 (0.0%) |
| Retail Trade | 29 (100.0%) | 0 (0.0%) |
| Transportation & Warehousing | 0 (0.0%) | 0 (0.0%) |
| Utilities | 0 (0.0%) | 0 (0.0%) |
| Information | 0 (0.0%) | 0 (0.0%) |
| Finance & Insurance | 0 (0.0%) | 17 (100.0%) |
| Real Estate, Rental & Leasing | 0 (0.0%) | 0 (0.0%) |
| Professional & Scientific | 13 (100.0%) | 0 (0.0%) |
| Enterprise Management | 0 (0.0%) | 0 (0.0%) |
| Administrative & Support | 0 (0.0%) | 0 (0.0%) |
| Educational Services | 23 (46.9%) | 26 (53.1%) |
| Health Care & Social Assistance | 0 (0.0%) | 0 (0.0%) |
| Arts, Entertainment & Recreation | 0 (0.0%) | 0 (0.0%) |
| Accommodation & Food Services | 0 (0.0%) | 0 (0.0%) |
| Public Administration | 0 (0.0%) | 10 (100.0%) |
| Total | 123 (63.7%) | 70 (36.3%) |
Education in Harrodsburg
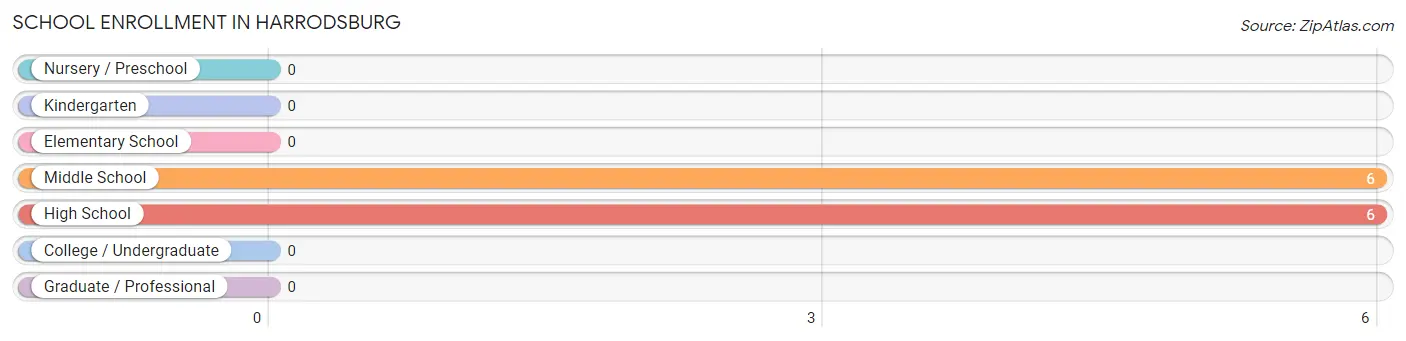
School Enrollment in Harrodsburg
The most common levels of schooling among the 12 students in Harrodsburg are middle school (6 | 50.0%), and high school (6 | 50.0%).
| School Level | # Students | % Students |
| Nursery / Preschool | 0 | 0.0% |
| Kindergarten | 0 | 0.0% |
| Elementary School | 0 | 0.0% |
| Middle School | 6 | 50.0% |
| High School | 6 | 50.0% |
| College / Undergraduate | 0 | 0.0% |
| Graduate / Professional | 0 | 0.0% |
| Total | 12 | 100.0% |
School Enrollment by Age by Funding Source in Harrodsburg
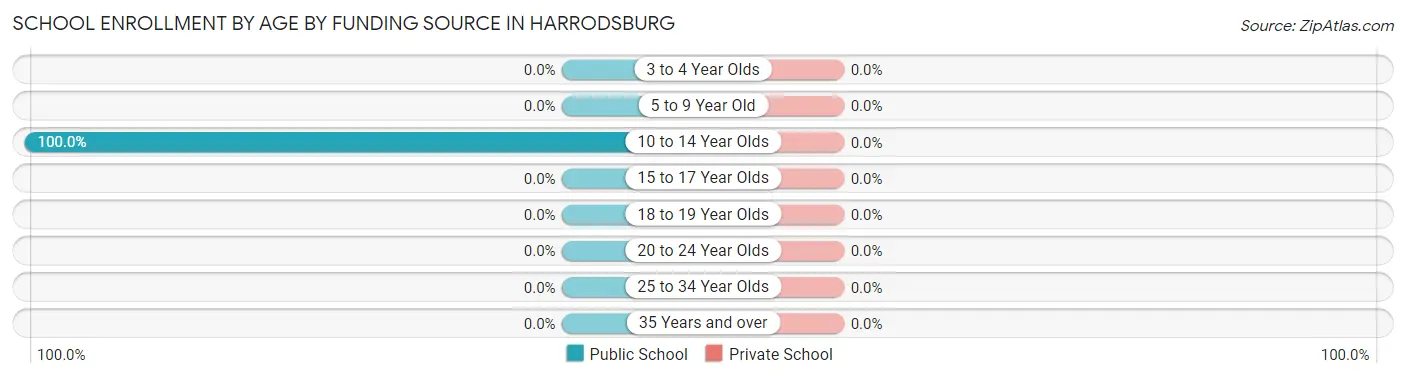
| Age Bracket | Public School | Private School |
| 3 to 4 Year Olds | 0 (0.0%) | 0 (0.0%) |
| 5 to 9 Year Old | 0 (0.0%) | 0 (0.0%) |
| 10 to 14 Year Olds | 12 (100.0%) | 0 (0.0%) |
| 15 to 17 Year Olds | 0 (0.0%) | 0 (0.0%) |
| 18 to 19 Year Olds | 0 (0.0%) | 0 (0.0%) |
| 20 to 24 Year Olds | 0 (0.0%) | 0 (0.0%) |
| 25 to 34 Year Olds | 0 (0.0%) | 0 (0.0%) |
| 35 Years and over | 0 (0.0%) | 0 (0.0%) |
| Total | 12 (100.0%) | 0 (0.0%) |
Educational Attainment by Field of Study in Harrodsburg
Literature & languages (37 | 27.6%), liberal arts & history (36 | 26.9%), social sciences (18 | 13.4%), business (17 | 12.7%), and engineering (13 | 9.7%) are the most common fields of study among 134 individuals in Harrodsburg who have obtained a bachelor's degree or higher.
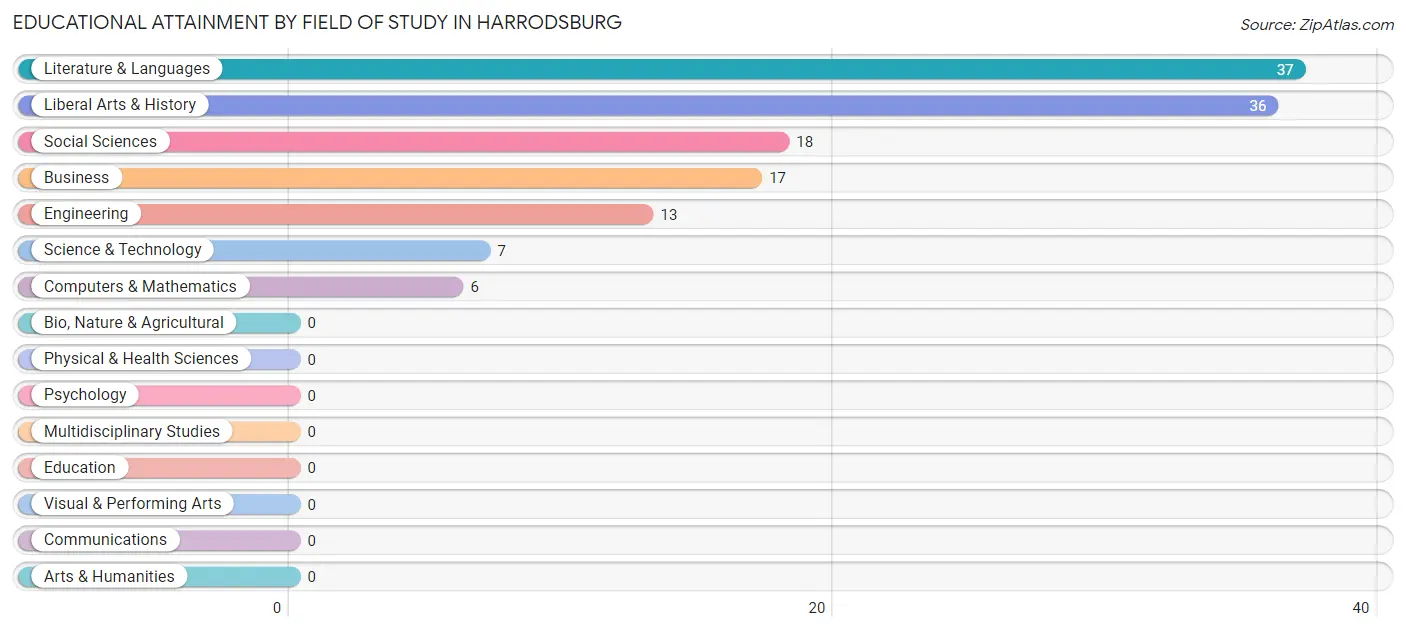
| Field of Study | # Graduates | % Graduates |
| Computers & Mathematics | 6 | 4.5% |
| Bio, Nature & Agricultural | 0 | 0.0% |
| Physical & Health Sciences | 0 | 0.0% |
| Psychology | 0 | 0.0% |
| Social Sciences | 18 | 13.4% |
| Engineering | 13 | 9.7% |
| Multidisciplinary Studies | 0 | 0.0% |
| Science & Technology | 7 | 5.2% |
| Business | 17 | 12.7% |
| Education | 0 | 0.0% |
| Literature & Languages | 37 | 27.6% |
| Liberal Arts & History | 36 | 26.9% |
| Visual & Performing Arts | 0 | 0.0% |
| Communications | 0 | 0.0% |
| Arts & Humanities | 0 | 0.0% |
| Total | 134 | 100.0% |
Transportation & Commute in Harrodsburg
Vehicle Availability by Sex in Harrodsburg
The most prevalent vehicle ownership categories in Harrodsburg are males with 3 vehicles (66, accounting for 53.7%) and females with 3 vehicles (27, making up 94.3%).
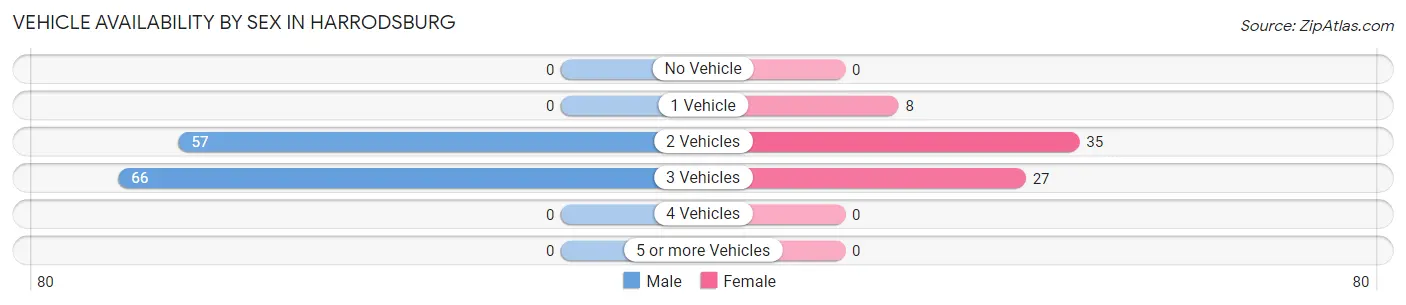
| Vehicles Available | Male | Female |
| No Vehicle | 0 (0.0%) | 0 (0.0%) |
| 1 Vehicle | 0 (0.0%) | 8 (11.4%) |
| 2 Vehicles | 57 (46.3%) | 35 (50.0%) |
| 3 Vehicles | 66 (53.7%) | 27 (38.6%) |
| 4 Vehicles | 0 (0.0%) | 0 (0.0%) |
| 5 or more Vehicles | 0 (0.0%) | 0 (0.0%) |
| Total | 123 (100.0%) | 70 (100.0%) |
Commute Time in Harrodsburg
The most frequently occuring commute durations in Harrodsburg are 20 to 24 minutes (74 commuters, 38.3%), 15 to 19 minutes (54 commuters, 28.0%), and 60 to 89 minutes (29 commuters, 15.0%).
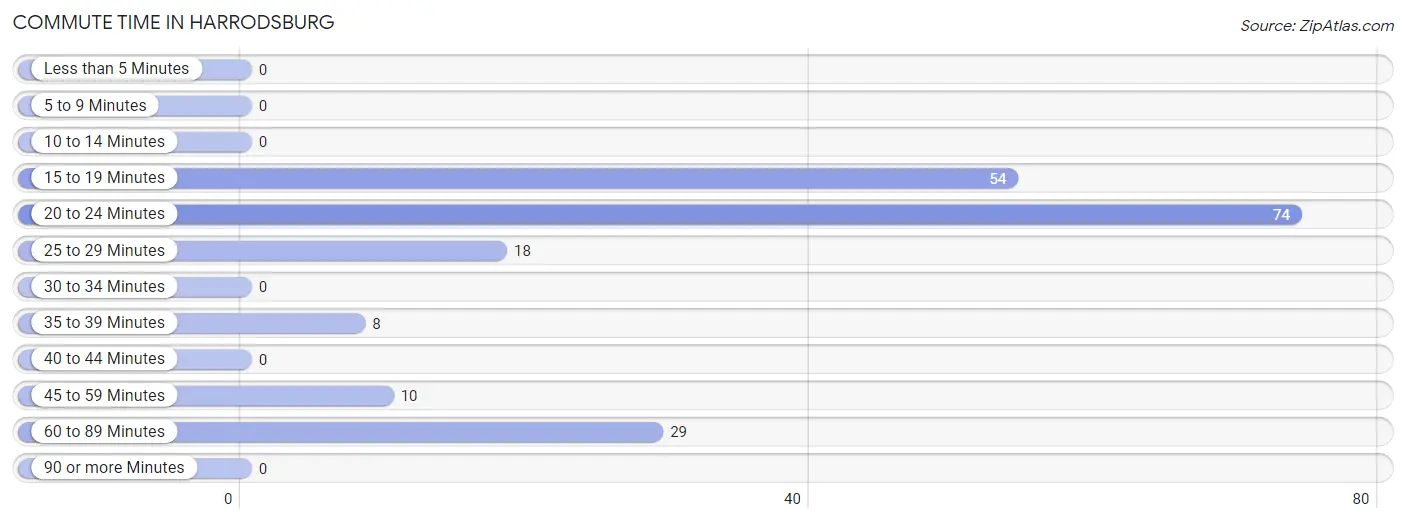
| Commute Time | # Commuters | % Commuters |
| Less than 5 Minutes | 0 | 0.0% |
| 5 to 9 Minutes | 0 | 0.0% |
| 10 to 14 Minutes | 0 | 0.0% |
| 15 to 19 Minutes | 54 | 28.0% |
| 20 to 24 Minutes | 74 | 38.3% |
| 25 to 29 Minutes | 18 | 9.3% |
| 30 to 34 Minutes | 0 | 0.0% |
| 35 to 39 Minutes | 8 | 4.2% |
| 40 to 44 Minutes | 0 | 0.0% |
| 45 to 59 Minutes | 10 | 5.2% |
| 60 to 89 Minutes | 29 | 15.0% |
| 90 or more Minutes | 0 | 0.0% |
Commute Time by Sex in Harrodsburg
The most common commute times in Harrodsburg are 20 to 24 minutes (57 commuters, 46.3%) for males and 25 to 29 minutes (18 commuters, 25.7%) for females.
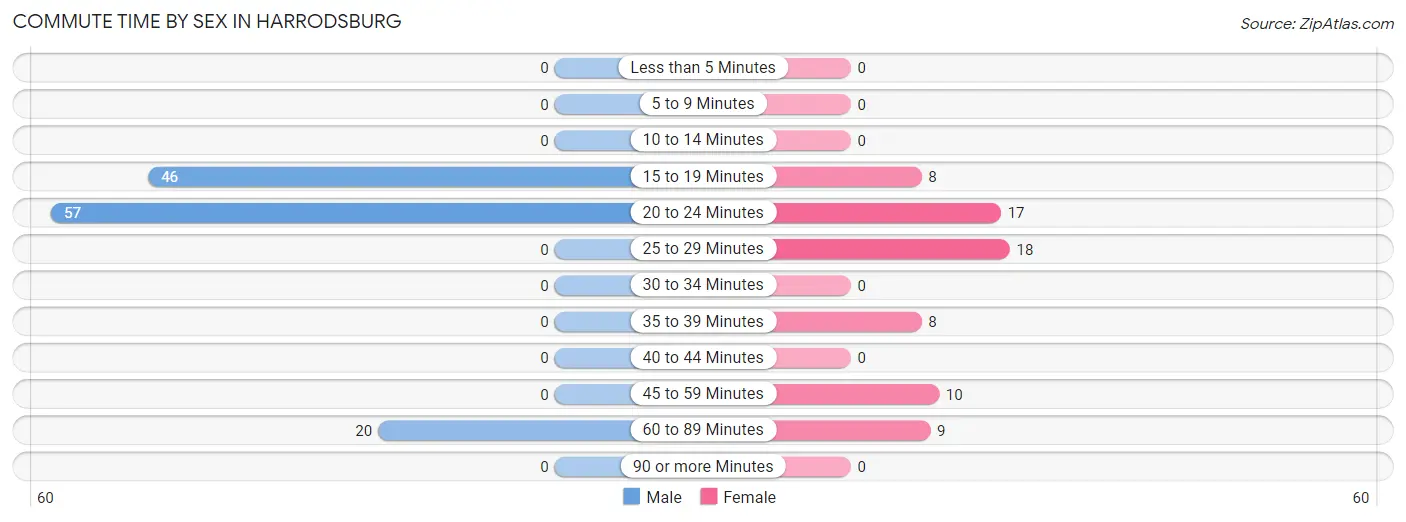
| Commute Time | Male | Female |
| Less than 5 Minutes | 0 (0.0%) | 0 (0.0%) |
| 5 to 9 Minutes | 0 (0.0%) | 0 (0.0%) |
| 10 to 14 Minutes | 0 (0.0%) | 0 (0.0%) |
| 15 to 19 Minutes | 46 (37.4%) | 8 (11.4%) |
| 20 to 24 Minutes | 57 (46.3%) | 17 (24.3%) |
| 25 to 29 Minutes | 0 (0.0%) | 18 (25.7%) |
| 30 to 34 Minutes | 0 (0.0%) | 0 (0.0%) |
| 35 to 39 Minutes | 0 (0.0%) | 8 (11.4%) |
| 40 to 44 Minutes | 0 (0.0%) | 0 (0.0%) |
| 45 to 59 Minutes | 0 (0.0%) | 10 (14.3%) |
| 60 to 89 Minutes | 20 (16.3%) | 9 (12.9%) |
| 90 or more Minutes | 0 (0.0%) | 0 (0.0%) |
Time of Departure to Work by Sex in Harrodsburg
The most frequent times of departure to work in Harrodsburg are 6:30 AM to 6:59 AM (28, 22.8%) for males and 7:30 AM to 7:59 AM (18, 25.7%) for females.
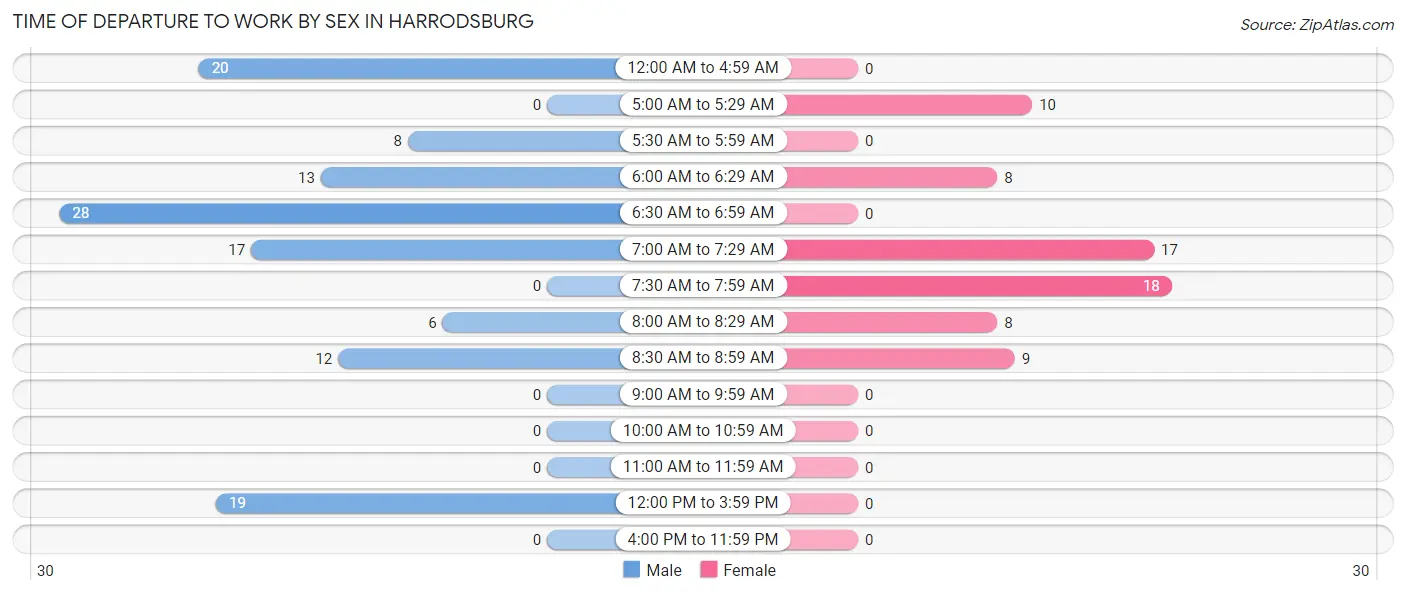
| Time of Departure | Male | Female |
| 12:00 AM to 4:59 AM | 20 (16.3%) | 0 (0.0%) |
| 5:00 AM to 5:29 AM | 0 (0.0%) | 10 (14.3%) |
| 5:30 AM to 5:59 AM | 8 (6.5%) | 0 (0.0%) |
| 6:00 AM to 6:29 AM | 13 (10.6%) | 8 (11.4%) |
| 6:30 AM to 6:59 AM | 28 (22.8%) | 0 (0.0%) |
| 7:00 AM to 7:29 AM | 17 (13.8%) | 17 (24.3%) |
| 7:30 AM to 7:59 AM | 0 (0.0%) | 18 (25.7%) |
| 8:00 AM to 8:29 AM | 6 (4.9%) | 8 (11.4%) |
| 8:30 AM to 8:59 AM | 12 (9.8%) | 9 (12.9%) |
| 9:00 AM to 9:59 AM | 0 (0.0%) | 0 (0.0%) |
| 10:00 AM to 10:59 AM | 0 (0.0%) | 0 (0.0%) |
| 11:00 AM to 11:59 AM | 0 (0.0%) | 0 (0.0%) |
| 12:00 PM to 3:59 PM | 19 (15.4%) | 0 (0.0%) |
| 4:00 PM to 11:59 PM | 0 (0.0%) | 0 (0.0%) |
| Total | 123 (100.0%) | 70 (100.0%) |
Housing Occupancy in Harrodsburg
Occupancy by Ownership in Harrodsburg
Of the total 192 dwellings in Harrodsburg, owner-occupied units account for 192 (100.0%), while renter-occupied units make up 0 (0.0%).
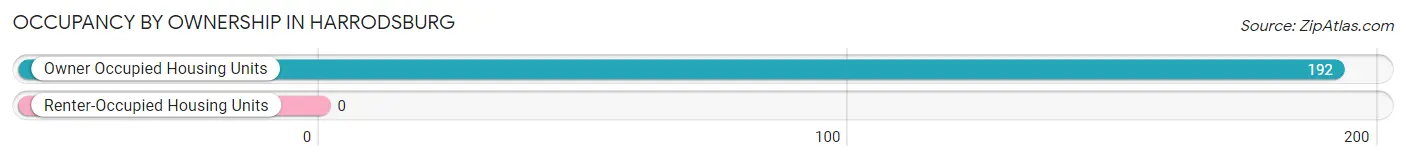
| Occupancy | # Housing Units | % Housing Units |
| Owner Occupied Housing Units | 192 | 100.0% |
| Renter-Occupied Housing Units | 0 | 0.0% |
| Total Occupied Housing Units | 192 | 100.0% |
Occupancy by Household Size in Harrodsburg
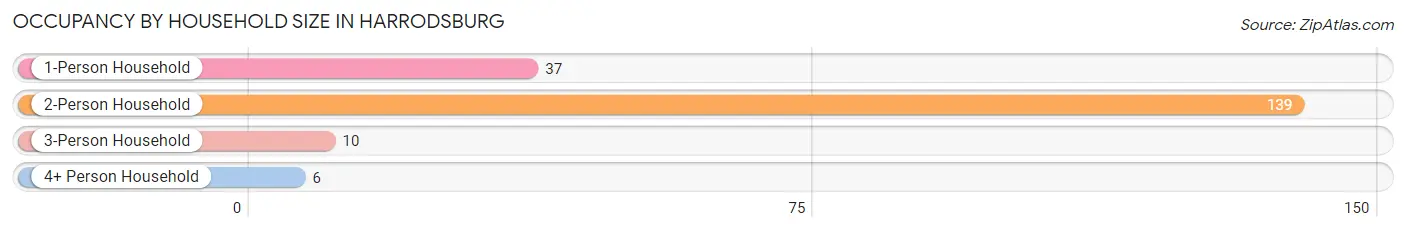
| Household Size | # Housing Units | % Housing Units |
| 1-Person Household | 37 | 19.3% |
| 2-Person Household | 139 | 72.4% |
| 3-Person Household | 10 | 5.2% |
| 4+ Person Household | 6 | 3.1% |
| Total Housing Units | 192 | 100.0% |
Occupancy by Ownership by Household Size in Harrodsburg
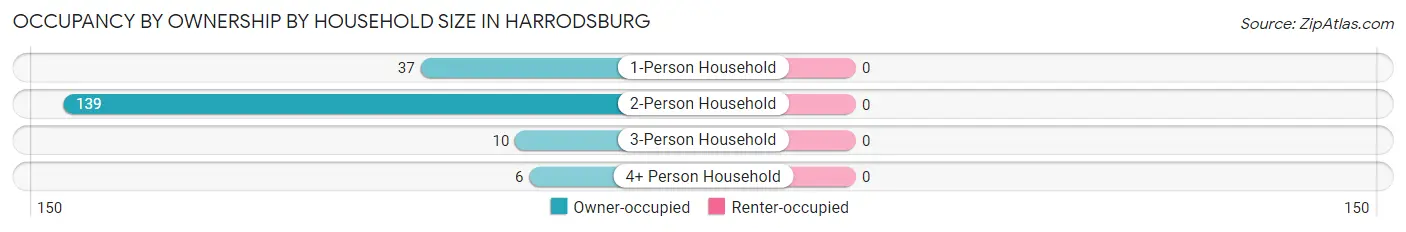
| Household Size | Owner-occupied | Renter-occupied |
| 1-Person Household | 37 (100.0%) | 0 (0.0%) |
| 2-Person Household | 139 (100.0%) | 0 (0.0%) |
| 3-Person Household | 10 (100.0%) | 0 (0.0%) |
| 4+ Person Household | 6 (100.0%) | 0 (0.0%) |
| Total Housing Units | 192 (100.0%) | 0 (0.0%) |
Occupancy by Educational Attainment in Harrodsburg
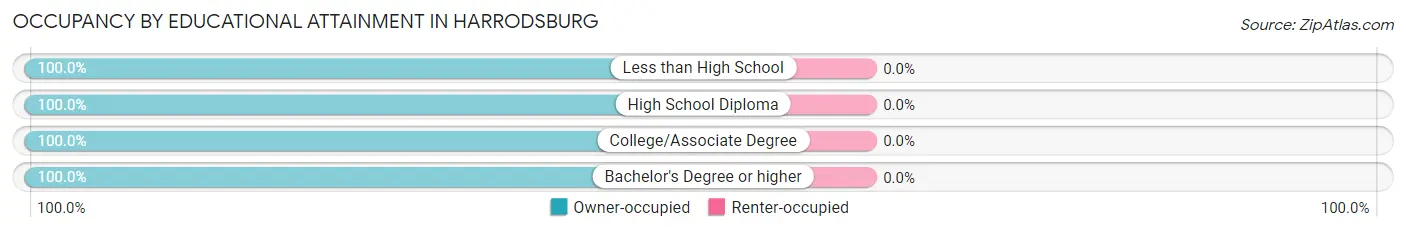
| Household Size | Owner-occupied | Renter-occupied |
| Less than High School | 8 (100.0%) | 0 (0.0%) |
| High School Diploma | 37 (100.0%) | 0 (0.0%) |
| College/Associate Degree | 64 (100.0%) | 0 (0.0%) |
| Bachelor's Degree or higher | 83 (100.0%) | 0 (0.0%) |
Occupancy by Age of Householder in Harrodsburg
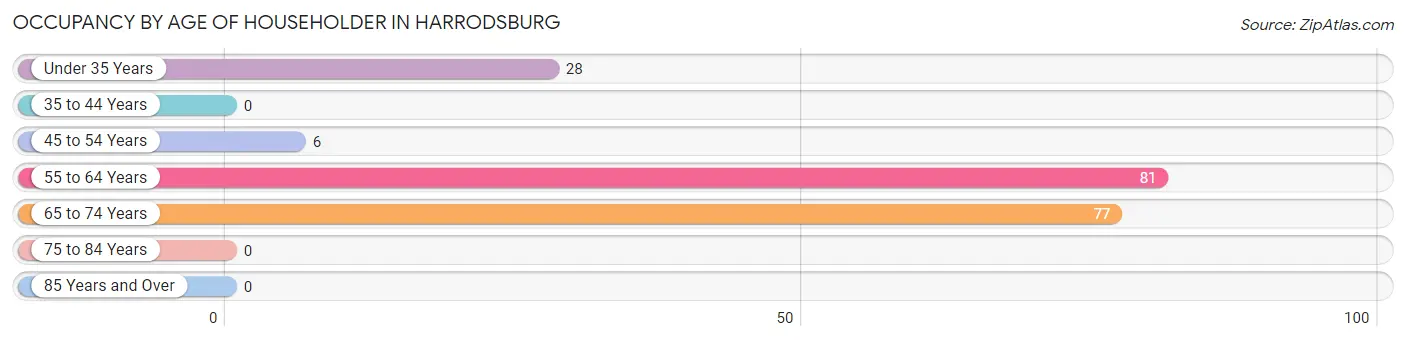
| Age Bracket | # Households | % Households |
| Under 35 Years | 28 | 14.6% |
| 35 to 44 Years | 0 | 0.0% |
| 45 to 54 Years | 6 | 3.1% |
| 55 to 64 Years | 81 | 42.2% |
| 65 to 74 Years | 77 | 40.1% |
| 75 to 84 Years | 0 | 0.0% |
| 85 Years and Over | 0 | 0.0% |
| Total | 192 | 100.0% |
Housing Finances in Harrodsburg
Median Income by Occupancy in Harrodsburg
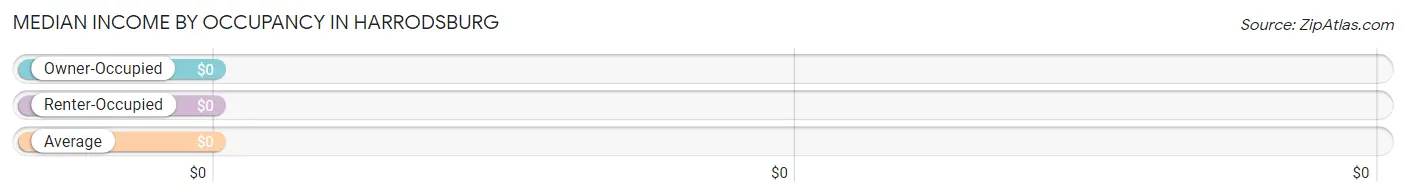
| Occupancy Type | # Households | Median Income |
| Owner-Occupied | 192 (100.0%) | $0 |
| Renter-Occupied | 0 (0.0%) | $0 |
| Average | 192 (100.0%) | $0 |
Occupancy by Householder Income Bracket in Harrodsburg
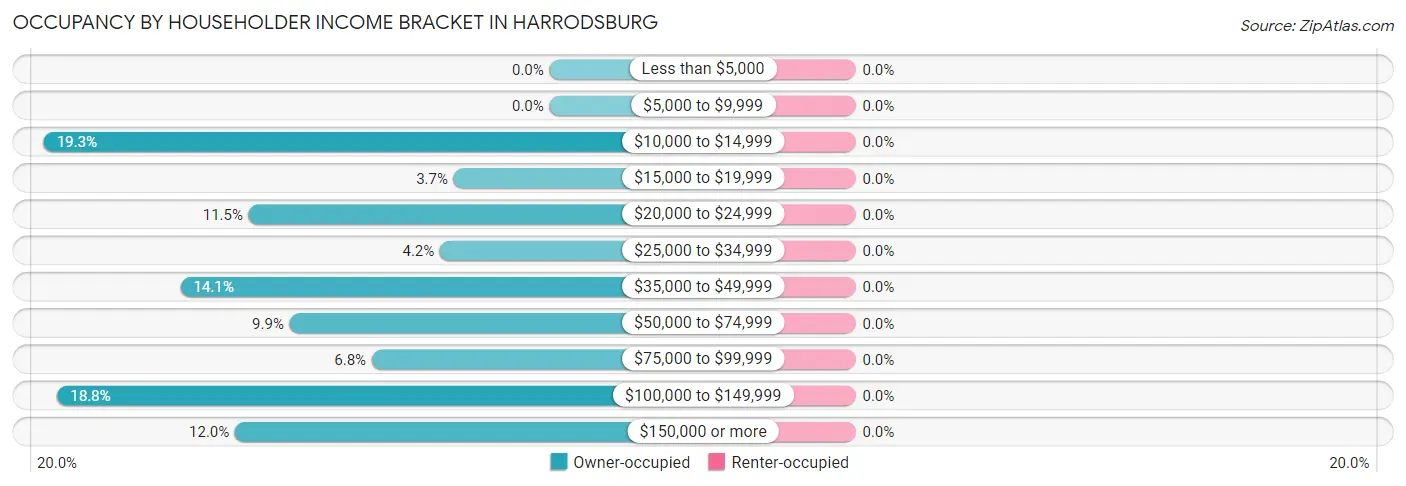
| Income Bracket | Owner-occupied | Renter-occupied |
| Less than $5,000 | 0 (0.0%) | 0 (0.0%) |
| $5,000 to $9,999 | 0 (0.0%) | 0 (0.0%) |
| $10,000 to $14,999 | 37 (19.3%) | 0 (0.0%) |
| $15,000 to $19,999 | 7 (3.6%) | 0 (0.0%) |
| $20,000 to $24,999 | 22 (11.5%) | 0 (0.0%) |
| $25,000 to $34,999 | 8 (4.2%) | 0 (0.0%) |
| $35,000 to $49,999 | 27 (14.1%) | 0 (0.0%) |
| $50,000 to $74,999 | 19 (9.9%) | 0 (0.0%) |
| $75,000 to $99,999 | 13 (6.8%) | 0 (0.0%) |
| $100,000 to $149,999 | 36 (18.8%) | 0 (0.0%) |
| $150,000 or more | 23 (12.0%) | 0 (0.0%) |
| Total | 192 (100.0%) | 0 (0.0%) |
Monthly Housing Cost Tiers in Harrodsburg
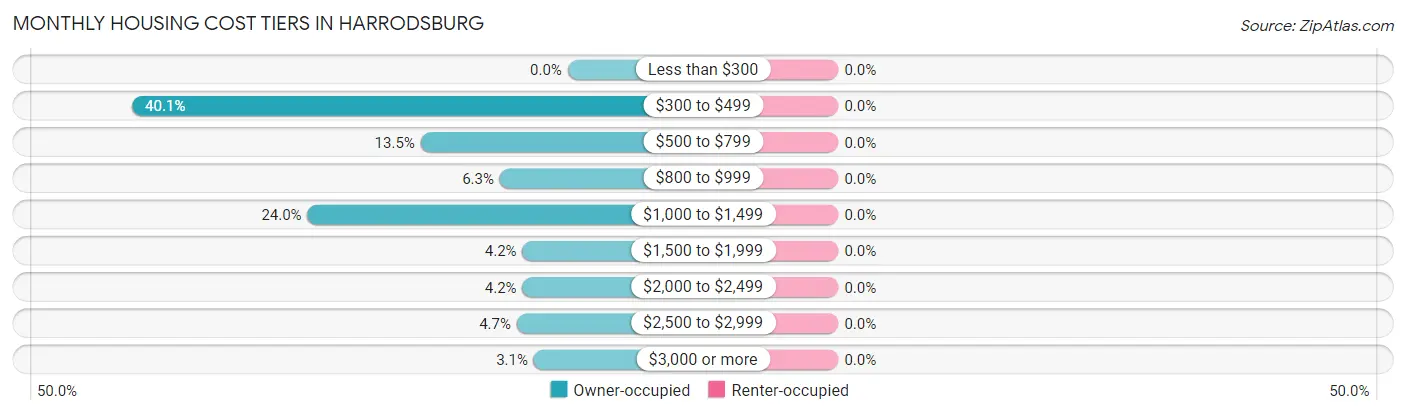
| Monthly Cost | Owner-occupied | Renter-occupied |
| Less than $300 | 0 (0.0%) | 0 (0.0%) |
| $300 to $499 | 77 (40.1%) | 0 (0.0%) |
| $500 to $799 | 26 (13.5%) | 0 (0.0%) |
| $800 to $999 | 12 (6.2%) | 0 (0.0%) |
| $1,000 to $1,499 | 46 (24.0%) | 0 (0.0%) |
| $1,500 to $1,999 | 8 (4.2%) | 0 (0.0%) |
| $2,000 to $2,499 | 8 (4.2%) | 0 (0.0%) |
| $2,500 to $2,999 | 9 (4.7%) | 0 (0.0%) |
| $3,000 or more | 6 (3.1%) | 0 (0.0%) |
| Total | 192 (100.0%) | 0 (0.0%) |
Physical Housing Characteristics in Harrodsburg
Housing Structures in Harrodsburg
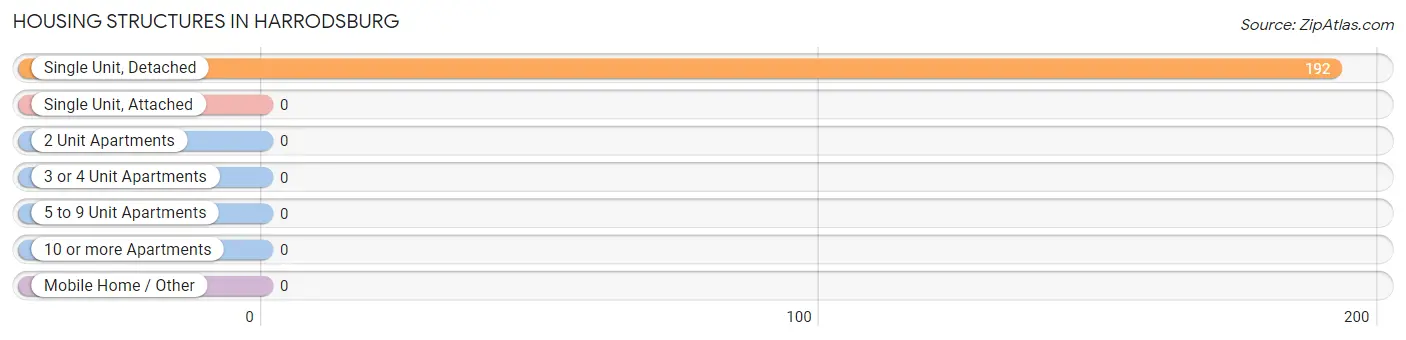
| Structure Type | # Housing Units | % Housing Units |
| Single Unit, Detached | 192 | 100.0% |
| Single Unit, Attached | 0 | 0.0% |
| 2 Unit Apartments | 0 | 0.0% |
| 3 or 4 Unit Apartments | 0 | 0.0% |
| 5 to 9 Unit Apartments | 0 | 0.0% |
| 10 or more Apartments | 0 | 0.0% |
| Mobile Home / Other | 0 | 0.0% |
| Total | 192 | 100.0% |
Housing Structures by Occupancy in Harrodsburg
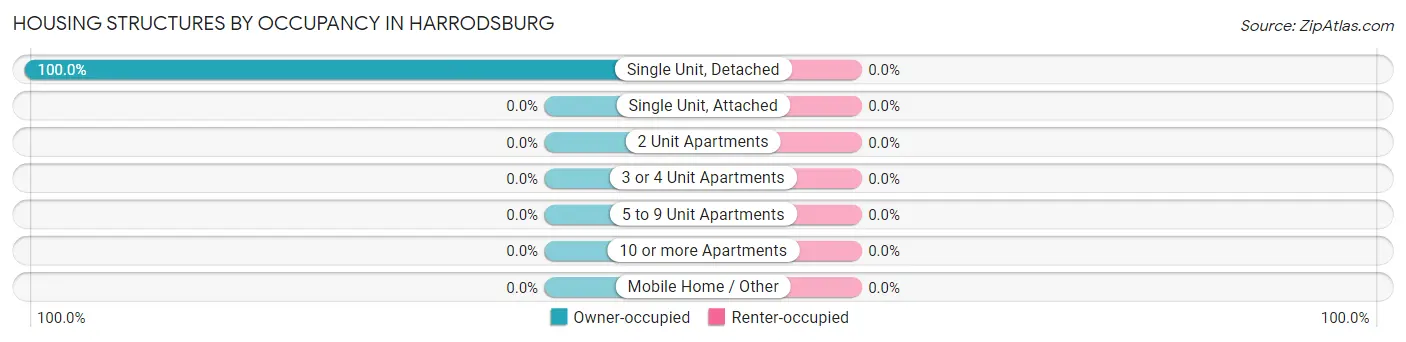
| Structure Type | Owner-occupied | Renter-occupied |
| Single Unit, Detached | 192 (100.0%) | 0 (0.0%) |
| Single Unit, Attached | 0 (0.0%) | 0 (0.0%) |
| 2 Unit Apartments | 0 (0.0%) | 0 (0.0%) |
| 3 or 4 Unit Apartments | 0 (0.0%) | 0 (0.0%) |
| 5 to 9 Unit Apartments | 0 (0.0%) | 0 (0.0%) |
| 10 or more Apartments | 0 (0.0%) | 0 (0.0%) |
| Mobile Home / Other | 0 (0.0%) | 0 (0.0%) |
| Total | 192 (100.0%) | 0 (0.0%) |
Housing Structures by Number of Rooms in Harrodsburg
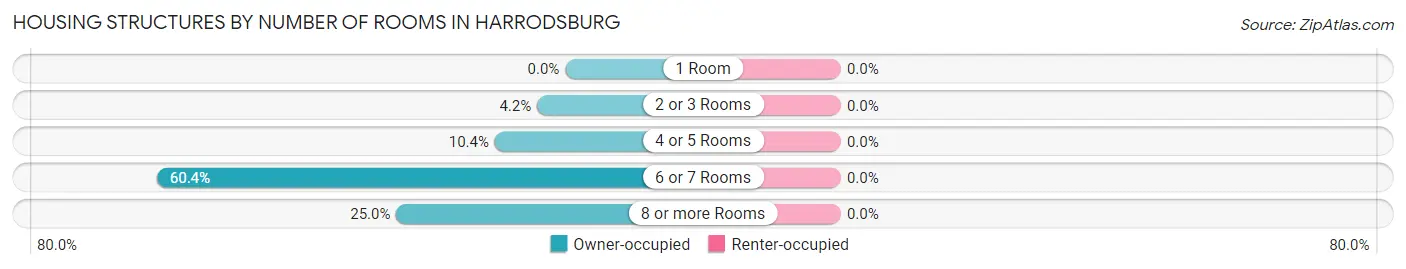
| Number of Rooms | Owner-occupied | Renter-occupied |
| 1 Room | 0 (0.0%) | 0 (0.0%) |
| 2 or 3 Rooms | 8 (4.2%) | 0 (0.0%) |
| 4 or 5 Rooms | 20 (10.4%) | 0 (0.0%) |
| 6 or 7 Rooms | 116 (60.4%) | 0 (0.0%) |
| 8 or more Rooms | 48 (25.0%) | 0 (0.0%) |
| Total | 192 (100.0%) | 0 (0.0%) |
Housing Structure by Heating Type in Harrodsburg
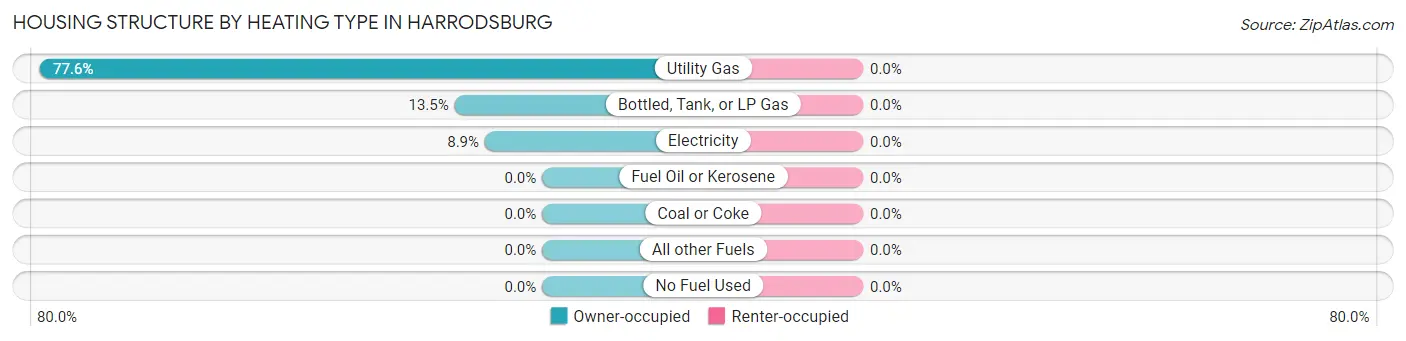
| Heating Type | Owner-occupied | Renter-occupied |
| Utility Gas | 149 (77.6%) | 0 (0.0%) |
| Bottled, Tank, or LP Gas | 26 (13.5%) | 0 (0.0%) |
| Electricity | 17 (8.8%) | 0 (0.0%) |
| Fuel Oil or Kerosene | 0 (0.0%) | 0 (0.0%) |
| Coal or Coke | 0 (0.0%) | 0 (0.0%) |
| All other Fuels | 0 (0.0%) | 0 (0.0%) |
| No Fuel Used | 0 (0.0%) | 0 (0.0%) |
| Total | 192 (100.0%) | 0 (0.0%) |
Household Vehicle Usage in Harrodsburg
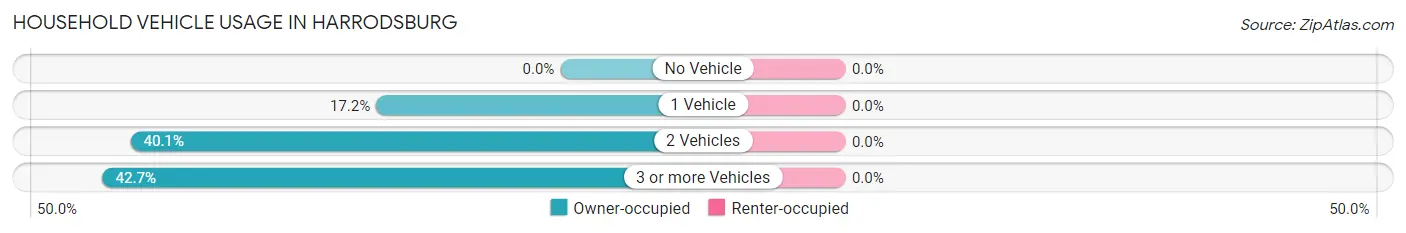
| Vehicles per Household | Owner-occupied | Renter-occupied |
| No Vehicle | 0 (0.0%) | 0 (0.0%) |
| 1 Vehicle | 33 (17.2%) | 0 (0.0%) |
| 2 Vehicles | 77 (40.1%) | 0 (0.0%) |
| 3 or more Vehicles | 82 (42.7%) | 0 (0.0%) |
| Total | 192 (100.0%) | 0 (0.0%) |
Real Estate & Mortgages in Harrodsburg
Real Estate and Mortgage Overview in Harrodsburg
| Characteristic | Without Mortgage | With Mortgage |
| Housing Units | 103 | 89 |
| Median Property Value | $158,500 | $290,200 |
| Median Household Income | $37,083 | $23 |
| Monthly Housing Costs | $386 | $6 |
| Real Estate Taxes | $865 | $0 |
Property Value by Mortgage Status in Harrodsburg
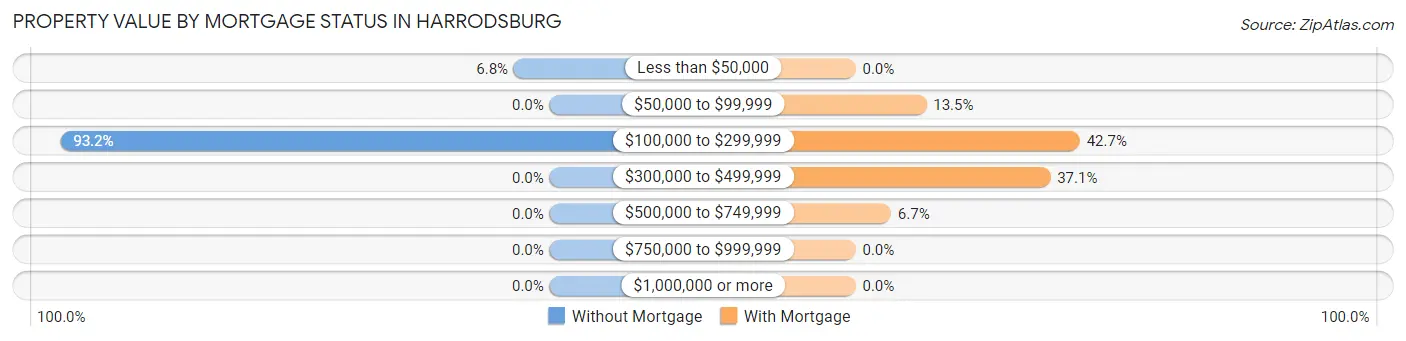
| Property Value | Without Mortgage | With Mortgage |
| Less than $50,000 | 7 (6.8%) | 0 (0.0%) |
| $50,000 to $99,999 | 0 (0.0%) | 12 (13.5%) |
| $100,000 to $299,999 | 96 (93.2%) | 38 (42.7%) |
| $300,000 to $499,999 | 0 (0.0%) | 33 (37.1%) |
| $500,000 to $749,999 | 0 (0.0%) | 6 (6.7%) |
| $750,000 to $999,999 | 0 (0.0%) | 0 (0.0%) |
| $1,000,000 or more | 0 (0.0%) | 0 (0.0%) |
| Total | 103 (100.0%) | 89 (100.0%) |
Household Income by Mortgage Status in Harrodsburg
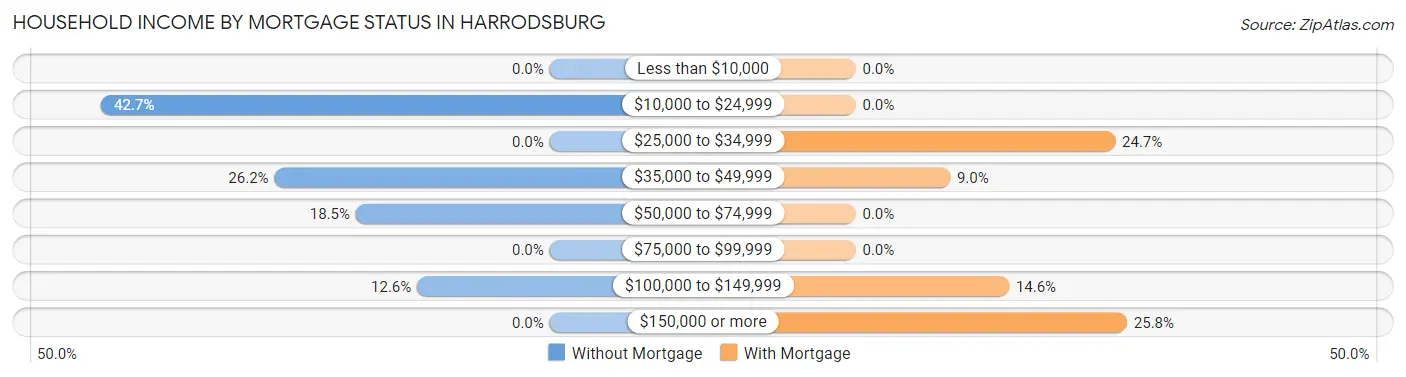
| Household Income | Without Mortgage | With Mortgage |
| Less than $10,000 | 0 (0.0%) | 0 (0.0%) |
| $10,000 to $24,999 | 44 (42.7%) | 0 (0.0%) |
| $25,000 to $34,999 | 0 (0.0%) | 22 (24.7%) |
| $35,000 to $49,999 | 27 (26.2%) | 8 (9.0%) |
| $50,000 to $74,999 | 19 (18.4%) | 0 (0.0%) |
| $75,000 to $99,999 | 0 (0.0%) | 0 (0.0%) |
| $100,000 to $149,999 | 13 (12.6%) | 13 (14.6%) |
| $150,000 or more | 0 (0.0%) | 23 (25.8%) |
| Total | 103 (100.0%) | 89 (100.0%) |
Property Value to Household Income Ratio in Harrodsburg
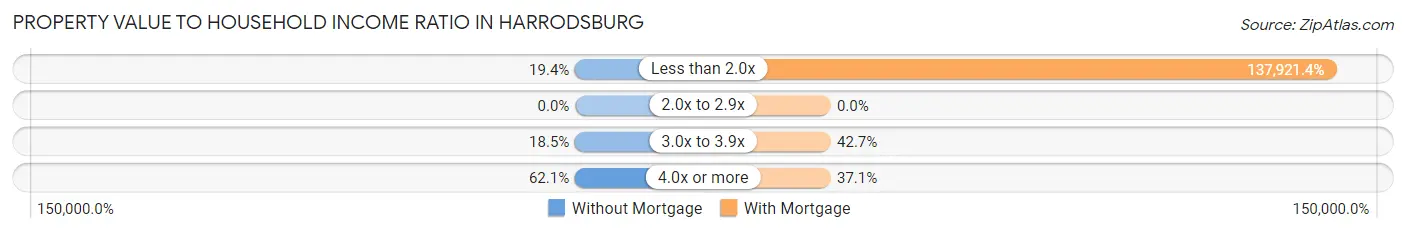
| Value-to-Income Ratio | Without Mortgage | With Mortgage |
| Less than 2.0x | 20 (19.4%) | 122,750 (137,921.4%) |
| 2.0x to 2.9x | 0 (0.0%) | 0 (0.0%) |
| 3.0x to 3.9x | 19 (18.4%) | 38 (42.7%) |
| 4.0x or more | 64 (62.1%) | 33 (37.1%) |
| Total | 103 (100.0%) | 89 (100.0%) |
Real Estate Taxes by Mortgage Status in Harrodsburg
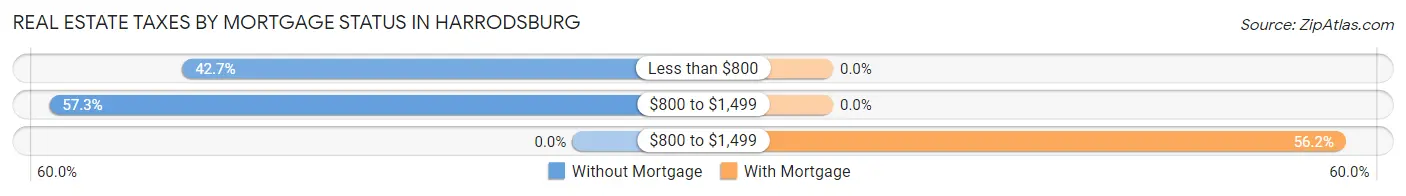
| Property Taxes | Without Mortgage | With Mortgage |
| Less than $800 | 44 (42.7%) | 0 (0.0%) |
| $800 to $1,499 | 59 (57.3%) | 0 (0.0%) |
| $800 to $1,499 | 0 (0.0%) | 50 (56.2%) |
| Total | 103 (100.0%) | 89 (100.0%) |
Health & Disability in Harrodsburg
Health Insurance Coverage by Age in Harrodsburg
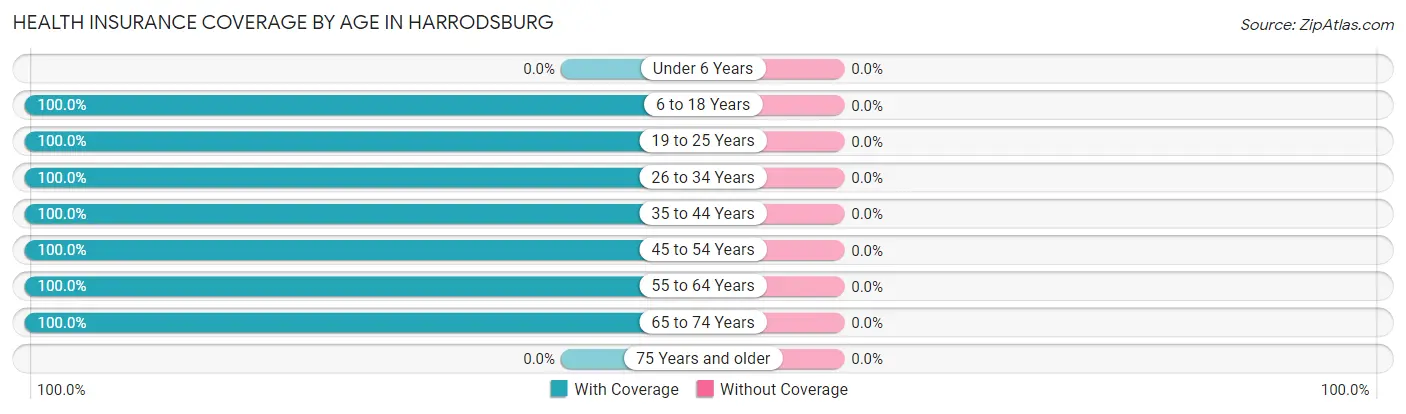
| Age Bracket | With Coverage | Without Coverage |
| Under 6 Years | 0 (0.0%) | 0 (0.0%) |
| 6 to 18 Years | 28 (100.0%) | 0 (0.0%) |
| 19 to 25 Years | 26 (100.0%) | 0 (0.0%) |
| 26 to 34 Years | 28 (100.0%) | 0 (0.0%) |
| 35 to 44 Years | 19 (100.0%) | 0 (0.0%) |
| 45 to 54 Years | 6 (100.0%) | 0 (0.0%) |
| 55 to 64 Years | 161 (100.0%) | 0 (0.0%) |
| 65 to 74 Years | 103 (100.0%) | 0 (0.0%) |
| 75 Years and older | 0 (0.0%) | 0 (0.0%) |
| Total | 371 (100.0%) | 0 (0.0%) |
Health Insurance Coverage by Citizenship Status in Harrodsburg
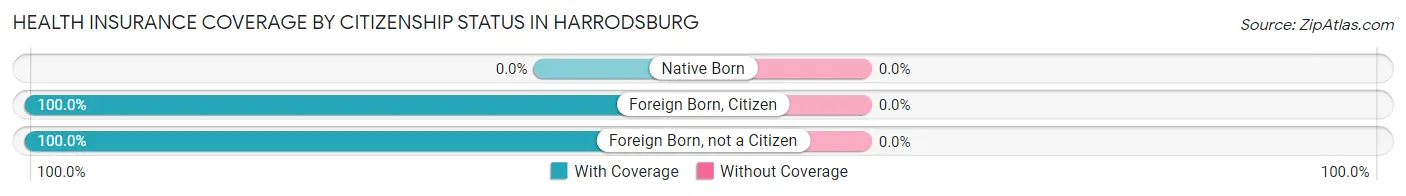
| Citizenship Status | With Coverage | Without Coverage |
| Native Born | 0 (0.0%) | 0 (0.0%) |
| Foreign Born, Citizen | 28 (100.0%) | 0 (0.0%) |
| Foreign Born, not a Citizen | 26 (100.0%) | 0 (0.0%) |
Health Insurance Coverage by Household Income in Harrodsburg
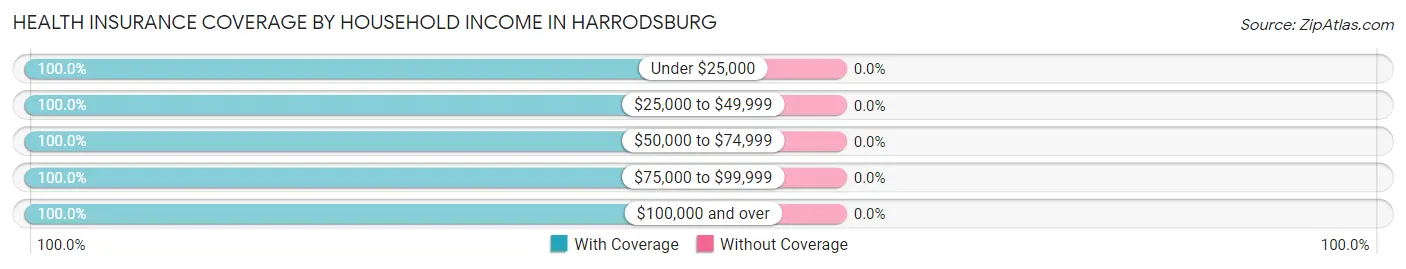
| Household Income | With Coverage | Without Coverage |
| Under $25,000 | 101 (100.0%) | 0 (0.0%) |
| $25,000 to $49,999 | 72 (100.0%) | 0 (0.0%) |
| $50,000 to $74,999 | 37 (100.0%) | 0 (0.0%) |
| $75,000 to $99,999 | 29 (100.0%) | 0 (0.0%) |
| $100,000 and over | 132 (100.0%) | 0 (0.0%) |
Public vs Private Health Insurance Coverage by Age in Harrodsburg
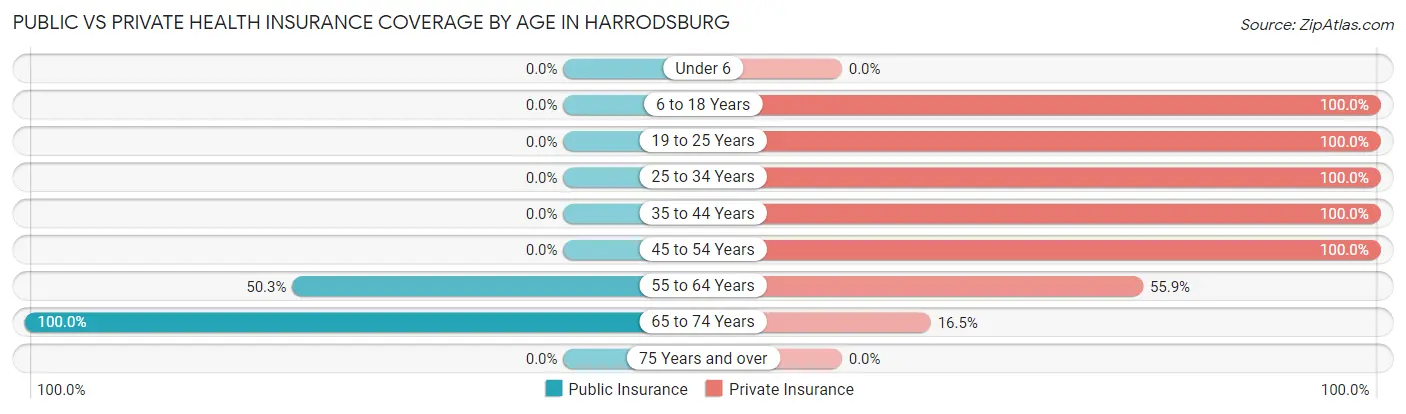
| Age Bracket | Public Insurance | Private Insurance |
| Under 6 | 0 (0.0%) | 0 (0.0%) |
| 6 to 18 Years | 0 (0.0%) | 28 (100.0%) |
| 19 to 25 Years | 0 (0.0%) | 26 (100.0%) |
| 25 to 34 Years | 0 (0.0%) | 28 (100.0%) |
| 35 to 44 Years | 0 (0.0%) | 19 (100.0%) |
| 45 to 54 Years | 0 (0.0%) | 6 (100.0%) |
| 55 to 64 Years | 81 (50.3%) | 90 (55.9%) |
| 65 to 74 Years | 103 (100.0%) | 17 (16.5%) |
| 75 Years and over | 0 (0.0%) | 0 (0.0%) |
| Total | 184 (49.6%) | 214 (57.7%) |
Disability Status by Sex by Age in Harrodsburg
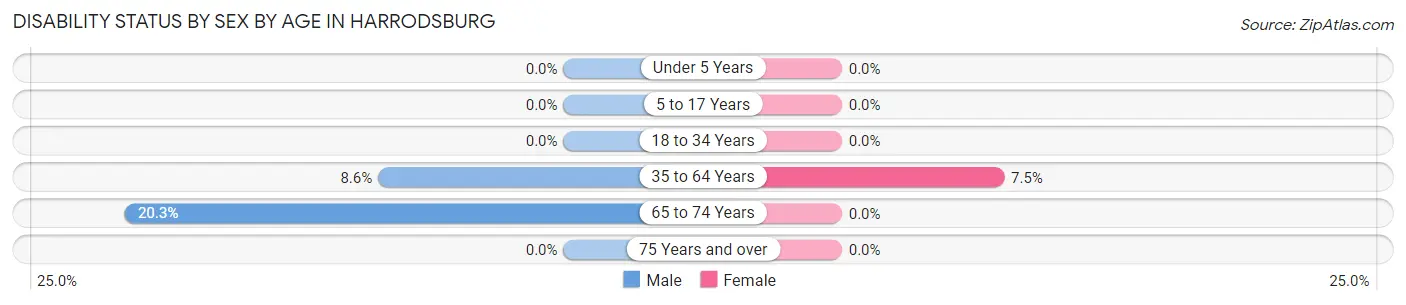
| Age Bracket | Male | Female |
| Under 5 Years | 0 (0.0%) | 0 (0.0%) |
| 5 to 17 Years | 0 (0.0%) | 0 (0.0%) |
| 18 to 34 Years | 0 (0.0%) | 0 (0.0%) |
| 35 to 64 Years | 8 (8.6%) | 7 (7.5%) |
| 65 to 74 Years | 12 (20.3%) | 0 (0.0%) |
| 75 Years and over | 0 (0.0%) | 0 (0.0%) |
Disability Class by Sex by Age in Harrodsburg
Disability Class: Hearing Difficulty
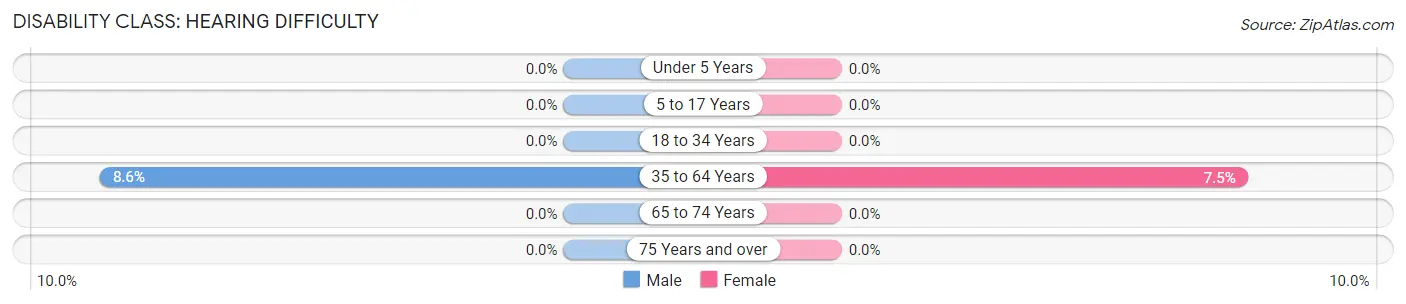
| Age Bracket | Male | Female |
| Under 5 Years | 0 (0.0%) | 0 (0.0%) |
| 5 to 17 Years | 0 (0.0%) | 0 (0.0%) |
| 18 to 34 Years | 0 (0.0%) | 0 (0.0%) |
| 35 to 64 Years | 8 (8.6%) | 7 (7.5%) |
| 65 to 74 Years | 0 (0.0%) | 0 (0.0%) |
| 75 Years and over | 0 (0.0%) | 0 (0.0%) |
Disability Class: Vision Difficulty
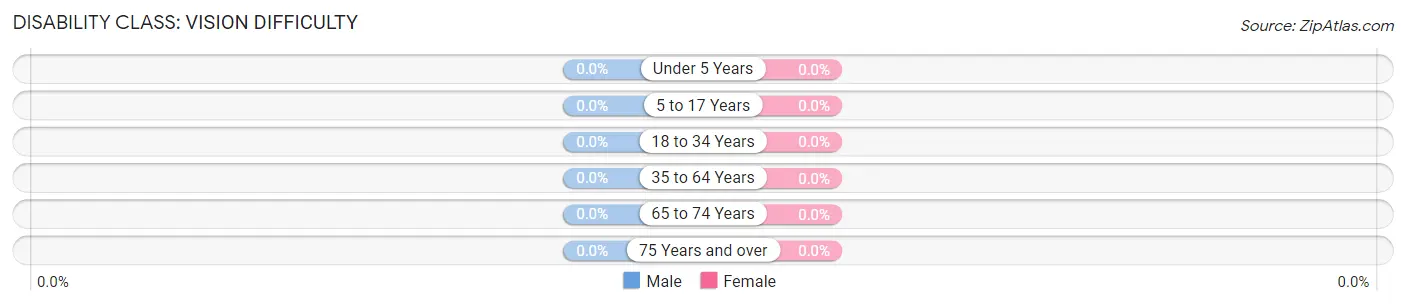
| Age Bracket | Male | Female |
| Under 5 Years | 0 (0.0%) | 0 (0.0%) |
| 5 to 17 Years | 0 (0.0%) | 0 (0.0%) |
| 18 to 34 Years | 0 (0.0%) | 0 (0.0%) |
| 35 to 64 Years | 0 (0.0%) | 0 (0.0%) |
| 65 to 74 Years | 0 (0.0%) | 0 (0.0%) |
| 75 Years and over | 0 (0.0%) | 0 (0.0%) |
Disability Class: Cognitive Difficulty
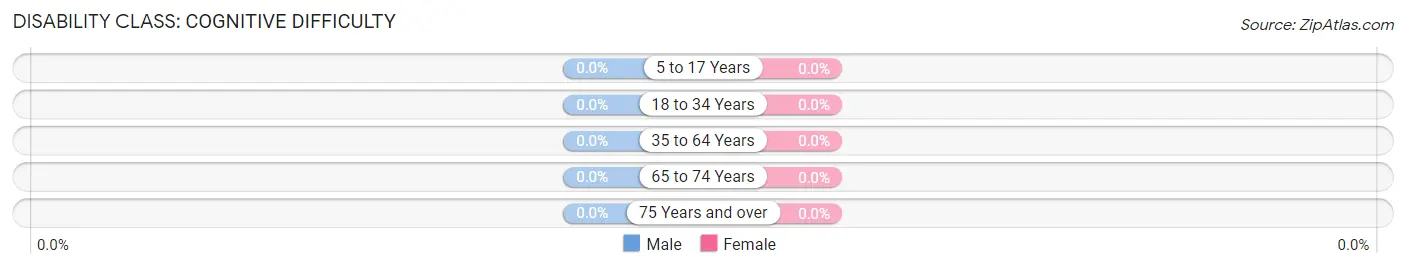
| Age Bracket | Male | Female |
| 5 to 17 Years | 0 (0.0%) | 0 (0.0%) |
| 18 to 34 Years | 0 (0.0%) | 0 (0.0%) |
| 35 to 64 Years | 0 (0.0%) | 0 (0.0%) |
| 65 to 74 Years | 0 (0.0%) | 0 (0.0%) |
| 75 Years and over | 0 (0.0%) | 0 (0.0%) |
Disability Class: Ambulatory Difficulty
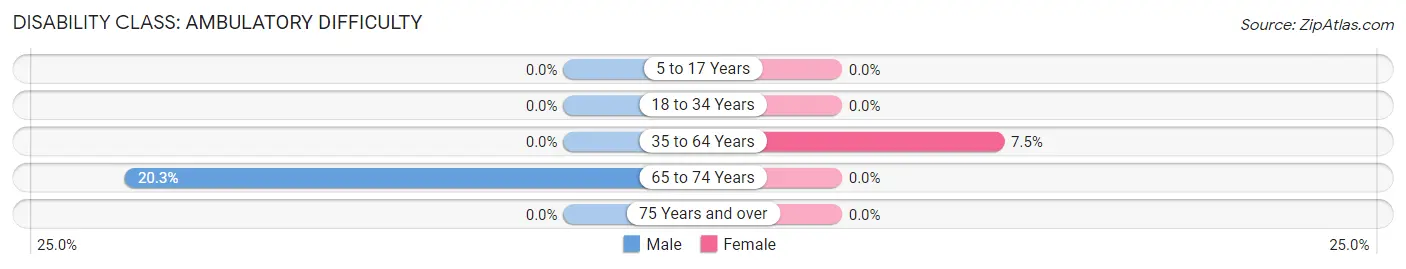
| Age Bracket | Male | Female |
| 5 to 17 Years | 0 (0.0%) | 0 (0.0%) |
| 18 to 34 Years | 0 (0.0%) | 0 (0.0%) |
| 35 to 64 Years | 0 (0.0%) | 7 (7.5%) |
| 65 to 74 Years | 12 (20.3%) | 0 (0.0%) |
| 75 Years and over | 0 (0.0%) | 0 (0.0%) |
Disability Class: Self-Care Difficulty
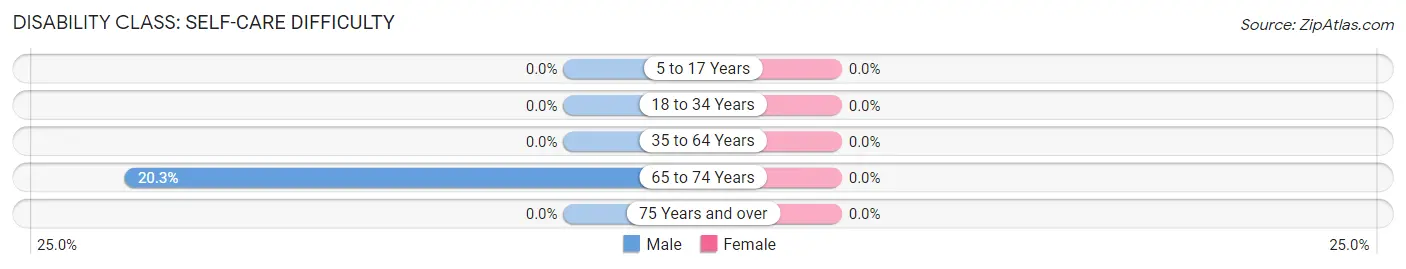
| Age Bracket | Male | Female |
| 5 to 17 Years | 0 (0.0%) | 0 (0.0%) |
| 18 to 34 Years | 0 (0.0%) | 0 (0.0%) |
| 35 to 64 Years | 0 (0.0%) | 0 (0.0%) |
| 65 to 74 Years | 12 (20.3%) | 0 (0.0%) |
| 75 Years and over | 0 (0.0%) | 0 (0.0%) |
Technology Access in Harrodsburg
Computing Device Access in Harrodsburg
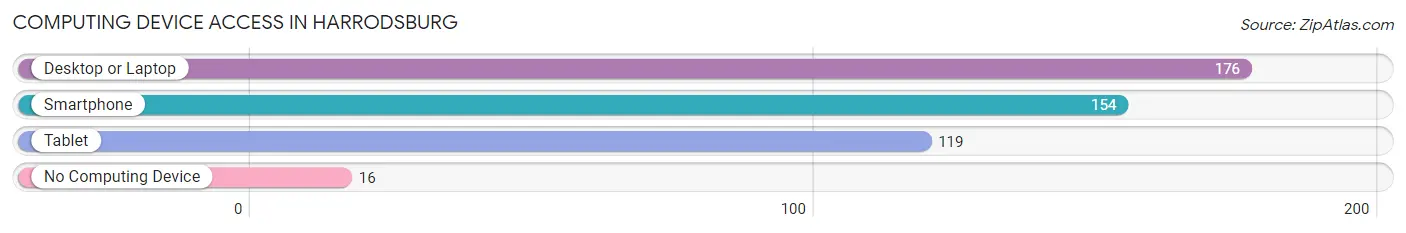
| Device Type | # Households | % Households |
| Desktop or Laptop | 176 | 91.7% |
| Smartphone | 154 | 80.2% |
| Tablet | 119 | 62.0% |
| No Computing Device | 16 | 8.3% |
| Total | 192 | 100.0% |
Internet Access in Harrodsburg
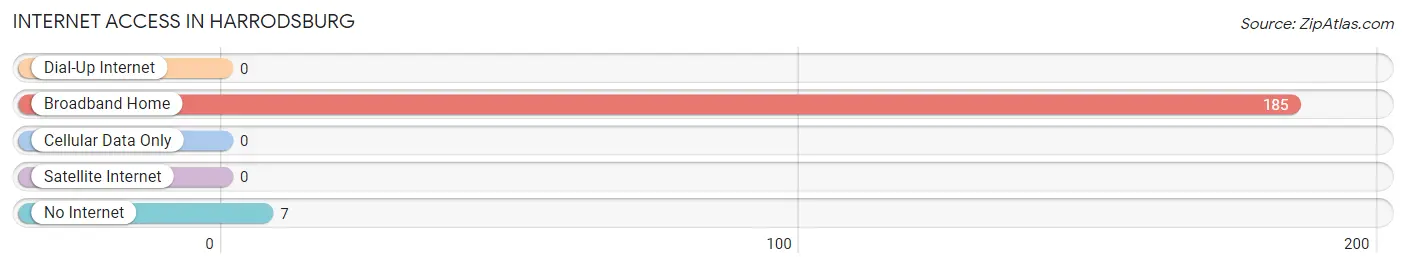
| Internet Type | # Households | % Households |
| Dial-Up Internet | 0 | 0.0% |
| Broadband Home | 185 | 96.4% |
| Cellular Data Only | 0 | 0.0% |
| Satellite Internet | 0 | 0.0% |
| No Internet | 7 | 3.6% |
| Total | 192 | 100.0% |
Harrodsburg Summary
Harrodsburg, Indiana is a small town located in the southwestern part of the state, in the Wabash Valley region. It is the county seat of Sullivan County and is situated along the Wabash River. The town was founded in 1818 and is the oldest town in the state. It is also the only town in the state to have been founded by a Revolutionary War veteran.
History
Harrodsburg was founded in 1818 by Revolutionary War veteran, Colonel William Harrod. Harrod had served in the Continental Army and was awarded a land grant for his service. He chose the site of Harrodsburg as the location for his new town, which he named after himself. The town was laid out in a grid pattern and was the first town in the state to be platted.
Harrodsburg was an important stop on the Wabash and Erie Canal, which was built in the early 1800s. The canal connected the Wabash River to Lake Erie and was a major transportation route for goods and people. The town was also a stop on the Underground Railroad, which was used by escaped slaves to travel to freedom in the North.
Harrodsburg was an important center of commerce in the early days of the state. It was home to several mills, including a flour mill, a sawmill, and a woolen mill. The town also had a number of stores, including a general store, a drug store, and a hardware store.
Geography
Harrodsburg is located in the southwestern part of the state, in the Wabash Valley region. It is situated along the Wabash River, which is the longest river in the state. The town is surrounded by rolling hills and farmland. The climate is humid continental, with hot summers and cold winters.
Economy
Harrodsburg’s economy is largely based on agriculture. The town is home to several farms, which produce corn, soybeans, wheat, and other crops. The town also has a number of small businesses, including restaurants, retail stores, and service providers.
Demographics
As of the 2010 census, the population of Harrodsburg was 1,845. The town is predominantly white, with a small African American population. The median household income is $37,500, and the median home value is $90,000. The town has a low unemployment rate of 4.2%.
Conclusion
Harrodsburg, Indiana is a small town with a rich history. It was founded in 1818 by a Revolutionary War veteran and was an important stop on the Wabash and Erie Canal. The town is situated along the Wabash River and is surrounded by rolling hills and farmland. The economy is largely based on agriculture, and the town has a low unemployment rate. Harrodsburg is predominantly white, with a small African American population.
Common Questions
What is Per Capita Income in Harrodsburg?
Per Capita income in Harrodsburg is $37,816.
What is the Median Family Income in Harrodsburg?
Median Family Income in Harrodsburg is $68,421.
What is Inequality or Gini Index in Harrodsburg?
Inequality or Gini Index in Harrodsburg is 0.46.
What is the Total Population of Harrodsburg?
Total Population of Harrodsburg is 371.
What is the Total Male Population of Harrodsburg?
Total Male Population of Harrodsburg is 205.
What is the Total Female Population of Harrodsburg?
Total Female Population of Harrodsburg is 166.
What is the Ratio of Males per 100 Females in Harrodsburg?
There are 123.49 Males per 100 Females in Harrodsburg.
What is the Ratio of Females per 100 Males in Harrodsburg?
There are 80.98 Females per 100 Males in Harrodsburg.
What is the Median Population Age in Harrodsburg?
Median Population Age in Harrodsburg is 62.0 Years.
What is the Average Family Size in Harrodsburg
Average Family Size in Harrodsburg is 2.2 People.
What is the Average Household Size in Harrodsburg
Average Household Size in Harrodsburg is 1.9 People.
How Large is the Labor Force in Harrodsburg?
There are 193 People in the Labor Forcein in Harrodsburg.
What is the Percentage of People in the Labor Force in Harrodsburg?
53.8% of People are in the Labor Force in Harrodsburg.