Hayden, IN Map & Demographics
Hayden Map
Hayden Overview
$31,837
PER CAPITA INCOME
$124,628
AVG FAMILY INCOME
$124,309
AVG HOUSEHOLD INCOME
22.0%
WAGE / INCOME GAP [ % ]
78.0¢/ $1
WAGE / INCOME GAP [ $ ]
0.23
INEQUALITY / GINI INDEX
875
TOTAL POPULATION
405
MALE POPULATION
470
FEMALE POPULATION
86.17
MALES / 100 FEMALES
116.05
FEMALES / 100 MALES
34.6
MEDIAN AGE
4.6
AVG FAMILY SIZE
4.4
AVG HOUSEHOLD SIZE
445
LABOR FORCE [ PEOPLE ]
82.3%
PERCENT IN LABOR FORCE
Hayden Area Codes
Income in Hayden
Income Overview in Hayden
Per Capita Income in Hayden is $31,837, while median incomes of families and households are $124,628 and $124,309 respectively.
| Characteristic | Number | Measure |
| Per Capita Income | 875 | $31,837 |
| Median Family Income | 188 | $124,628 |
| Mean Family Income | 188 | $132,897 |
| Median Household Income | 200 | $124,309 |
| Mean Household Income | 200 | $127,306 |
| Income Deficit | 188 | $0 |
| Wage / Income Gap (%) | 875 | 22.00% |
| Wage / Income Gap ($) | 875 | 78.00¢ per $1 |
| Gini / Inequality Index | 875 | 0.23 |
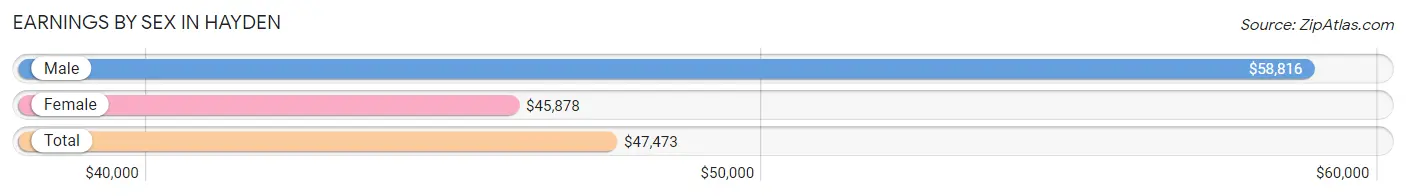
Earnings by Sex in Hayden
Average Earnings in Hayden are $47,473, $58,816 for men and $45,878 for women, a difference of 22.0%.
| Sex | Number | Average Earnings |
| Male | 260 (53.2%) | $58,816 |
| Female | 229 (46.8%) | $45,878 |
| Total | 489 (100.0%) | $47,473 |
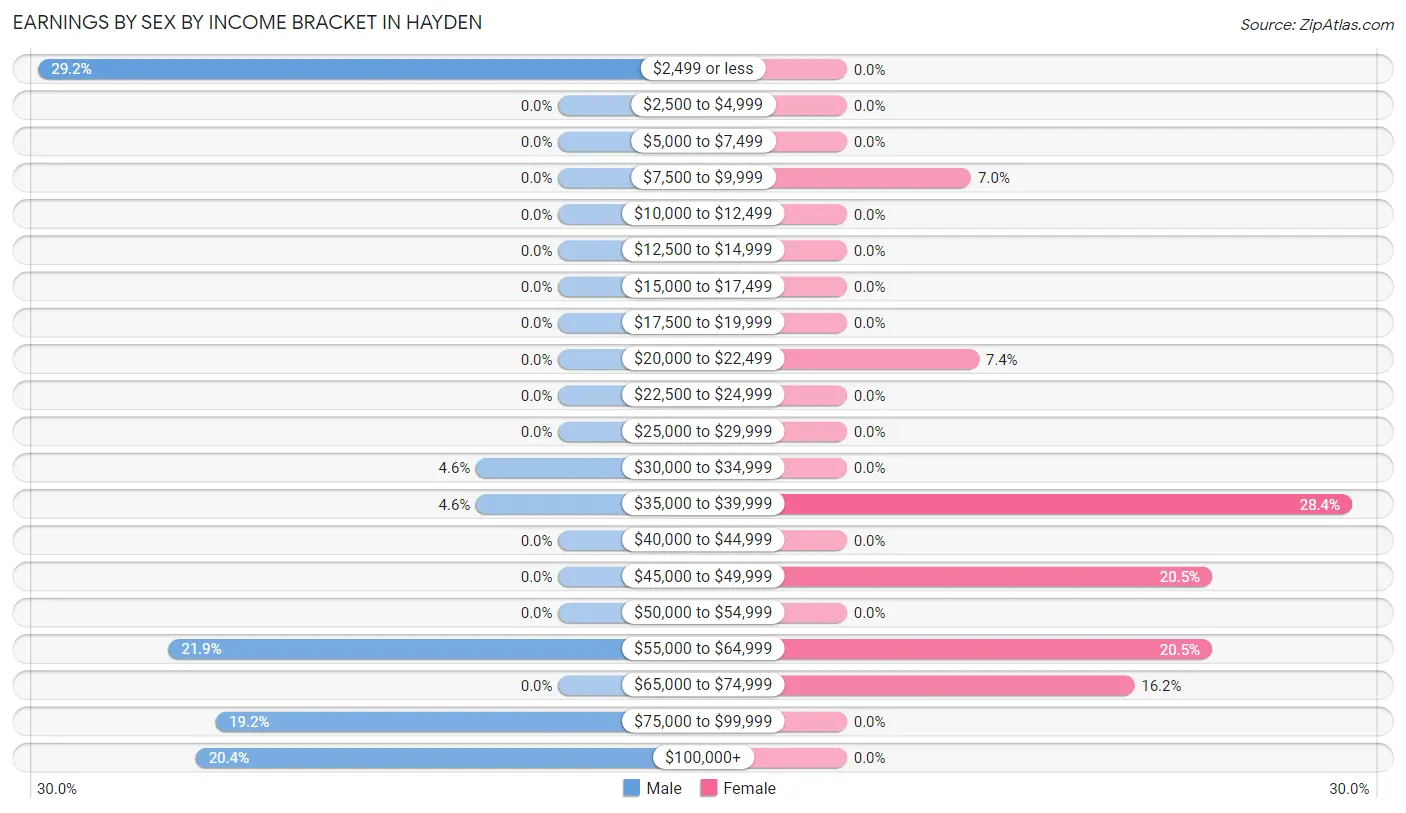
Earnings by Sex by Income Bracket in Hayden
The most common earnings brackets in Hayden are $2,499 or less for men (76 | 29.2%) and $35,000 to $39,999 for women (65 | 28.4%).
| Income | Male | Female |
| $2,499 or less | 76 (29.2%) | 0 (0.0%) |
| $2,500 to $4,999 | 0 (0.0%) | 0 (0.0%) |
| $5,000 to $7,499 | 0 (0.0%) | 0 (0.0%) |
| $7,500 to $9,999 | 0 (0.0%) | 16 (7.0%) |
| $10,000 to $12,499 | 0 (0.0%) | 0 (0.0%) |
| $12,500 to $14,999 | 0 (0.0%) | 0 (0.0%) |
| $15,000 to $17,499 | 0 (0.0%) | 0 (0.0%) |
| $17,500 to $19,999 | 0 (0.0%) | 0 (0.0%) |
| $20,000 to $22,499 | 0 (0.0%) | 17 (7.4%) |
| $22,500 to $24,999 | 0 (0.0%) | 0 (0.0%) |
| $25,000 to $29,999 | 0 (0.0%) | 0 (0.0%) |
| $30,000 to $34,999 | 12 (4.6%) | 0 (0.0%) |
| $35,000 to $39,999 | 12 (4.6%) | 65 (28.4%) |
| $40,000 to $44,999 | 0 (0.0%) | 0 (0.0%) |
| $45,000 to $49,999 | 0 (0.0%) | 47 (20.5%) |
| $50,000 to $54,999 | 0 (0.0%) | 0 (0.0%) |
| $55,000 to $64,999 | 57 (21.9%) | 47 (20.5%) |
| $65,000 to $74,999 | 0 (0.0%) | 37 (16.2%) |
| $75,000 to $99,999 | 50 (19.2%) | 0 (0.0%) |
| $100,000+ | 53 (20.4%) | 0 (0.0%) |
| Total | 260 (100.0%) | 229 (100.0%) |
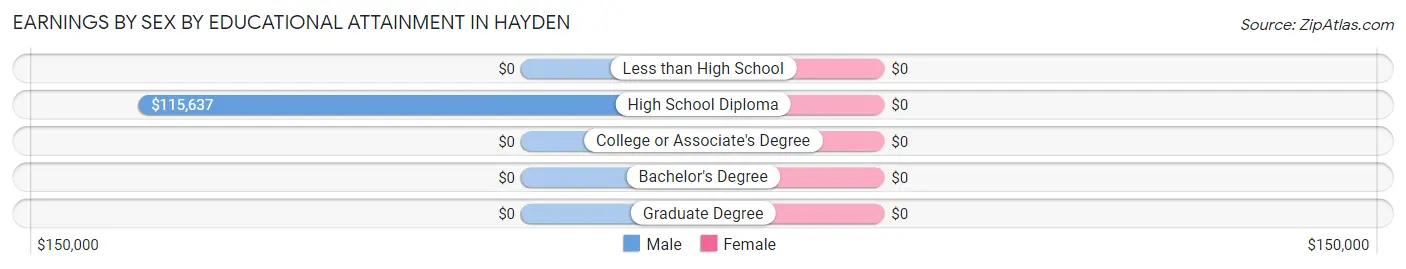
Earnings by Sex by Educational Attainment in Hayden
| Educational Attainment | Male Income | Female Income |
| Less than High School | - | - |
| High School Diploma | $115,637 | $0 |
| College or Associate's Degree | - | - |
| Bachelor's Degree | - | - |
| Graduate Degree | - | - |
| Total | $90,550 | $45,878 |
Family Income in Hayden
Family Income Brackets in Hayden
According to the Hayden family income data, there are 97 families falling into the $100,000 to $149,999 income range, which is the most common income bracket and makes up 51.6% of all families.
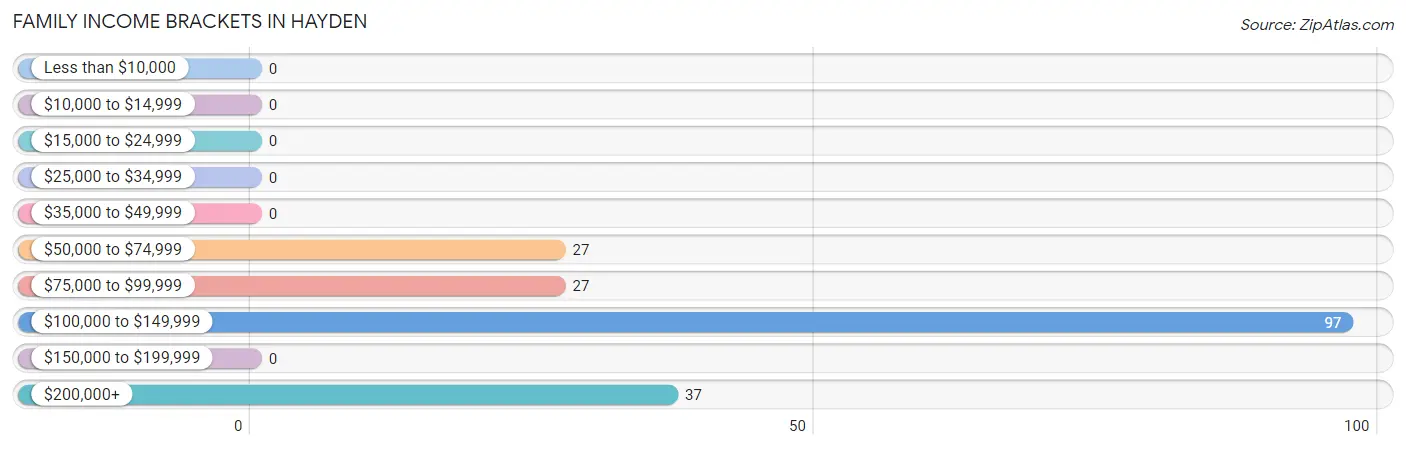
| Income Bracket | # Families | % Families |
| Less than $10,000 | 0 | 0.0% |
| $10,000 to $14,999 | 0 | 0.0% |
| $15,000 to $24,999 | 0 | 0.0% |
| $25,000 to $34,999 | 0 | 0.0% |
| $35,000 to $49,999 | 0 | 0.0% |
| $50,000 to $74,999 | 27 | 14.4% |
| $75,000 to $99,999 | 27 | 14.4% |
| $100,000 to $149,999 | 97 | 51.6% |
| $150,000 to $199,999 | 0 | 0.0% |
| $200,000+ | 37 | 19.7% |
Family Income by Famaliy Size in Hayden
2-person families (54 | 28.7%) account for the highest median family income in Hayden with $72,500 per family, while 2-person families (54 | 28.7%) have the highest median income of $36,250 per family member.
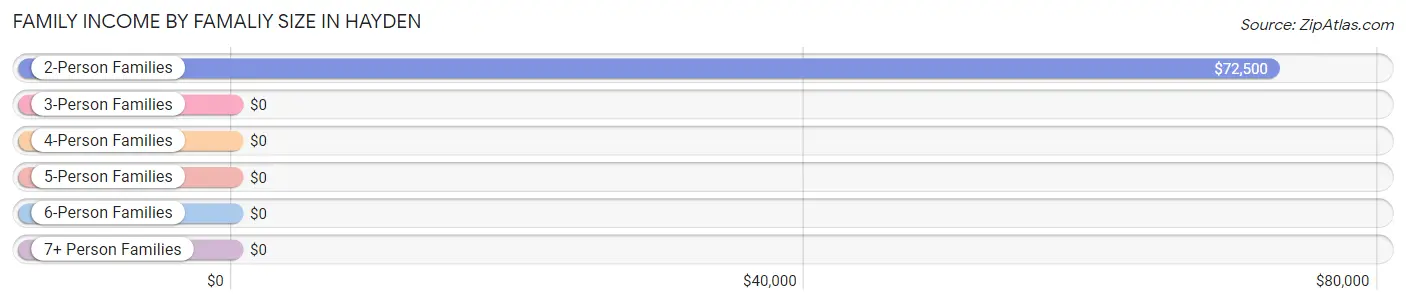
| Income Bracket | # Families | Median Income |
| 2-Person Families | 54 (28.7%) | $72,500 |
| 3-Person Families | 0 (0.0%) | $0 |
| 4-Person Families | 50 (26.6%) | $0 |
| 5-Person Families | 47 (25.0%) | $0 |
| 6-Person Families | 0 (0.0%) | $0 |
| 7+ Person Families | 37 (19.7%) | $0 |
| Total | 188 (100.0%) | $124,628 |
Family Income by Number of Earners in Hayden
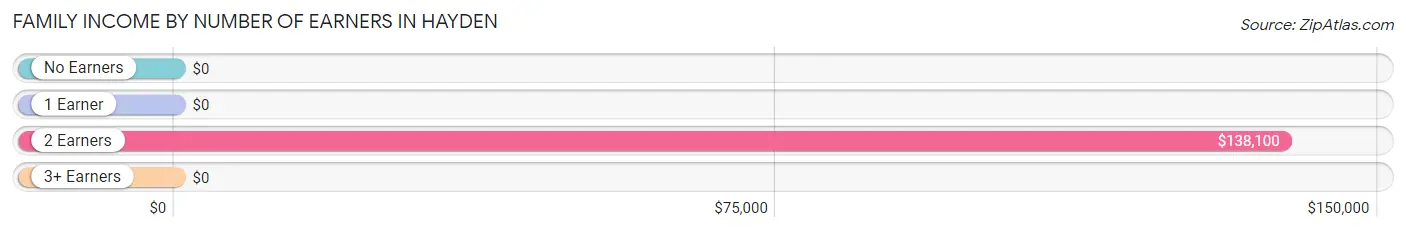
| Number of Earners | # Families | Median Income |
| No Earners | 28 (14.9%) | $0 |
| 1 Earner | 0 (0.0%) | $0 |
| 2 Earners | 76 (40.4%) | $138,100 |
| 3+ Earners | 84 (44.7%) | $0 |
| Total | 188 (100.0%) | $124,628 |
Household Income in Hayden
Household Income Brackets in Hayden
With 97 households falling in the category, the $100,000 to $149,999 income range is the most frequent in Hayden, accounting for 48.5% of all households.
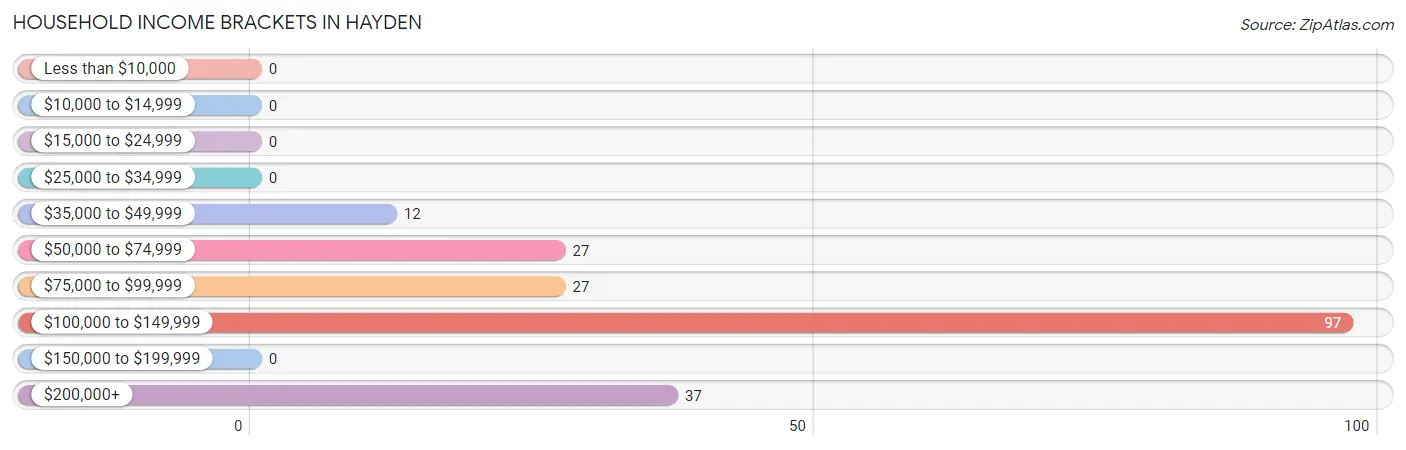
| Income Bracket | # Households | % Households |
| Less than $10,000 | 0 | 0.0% |
| $10,000 to $14,999 | 0 | 0.0% |
| $15,000 to $24,999 | 0 | 0.0% |
| $25,000 to $34,999 | 0 | 0.0% |
| $35,000 to $49,999 | 12 | 6.0% |
| $50,000 to $74,999 | 27 | 13.5% |
| $75,000 to $99,999 | 27 | 13.5% |
| $100,000 to $149,999 | 97 | 48.5% |
| $150,000 to $199,999 | 0 | 0.0% |
| $200,000+ | 37 | 18.5% |
Household Income by Householder Age in Hayden
| Income Bracket | # Households | Median Income |
| 15 to 24 Years | 0 (0.0%) | $0 |
| 25 to 44 Years | 97 (48.5%) | $0 |
| 45 to 64 Years | 75 (37.5%) | $0 |
| 65+ Years | 28 (14.0%) | $0 |
| Total | 200 (100.0%) | $124,309 |
Poverty in Hayden
Income Below Poverty by Sex and Age in Hayden
| Age Bracket | Male | Female |
| Under 5 Years | 0 (0.0%) | 0 (0.0%) |
| 5 Years | 0 (0.0%) | 0 (0.0%) |
| 6 to 11 Years | 0 (0.0%) | 0 (0.0%) |
| 12 to 14 Years | 0 (0.0%) | 0 (0.0%) |
| 15 Years | 0 (0.0%) | 0 (0.0%) |
| 16 and 17 Years | 0 (0.0%) | 0 (0.0%) |
| 18 to 24 Years | 0 (0.0%) | 0 (0.0%) |
| 25 to 34 Years | 0 (0.0%) | 0 (0.0%) |
| 35 to 44 Years | 0 (0.0%) | 0 (0.0%) |
| 45 to 54 Years | 0 (0.0%) | 0 (0.0%) |
| 55 to 64 Years | 0 (0.0%) | 0 (0.0%) |
| 65 to 74 Years | 0 (0.0%) | 0 (0.0%) |
| 75 Years and over | 0 (0.0%) | 0 (0.0%) |
| Total | 0 (0.0%) | 0 (0.0%) |
Income Above Poverty by Sex and Age in Hayden
According to the poverty statistics in Hayden, males aged 5 years and females aged 6 to 11 years are the age groups that are most secure financially, with 100.0% of males and 100.0% of females in these age groups living above the poverty line.
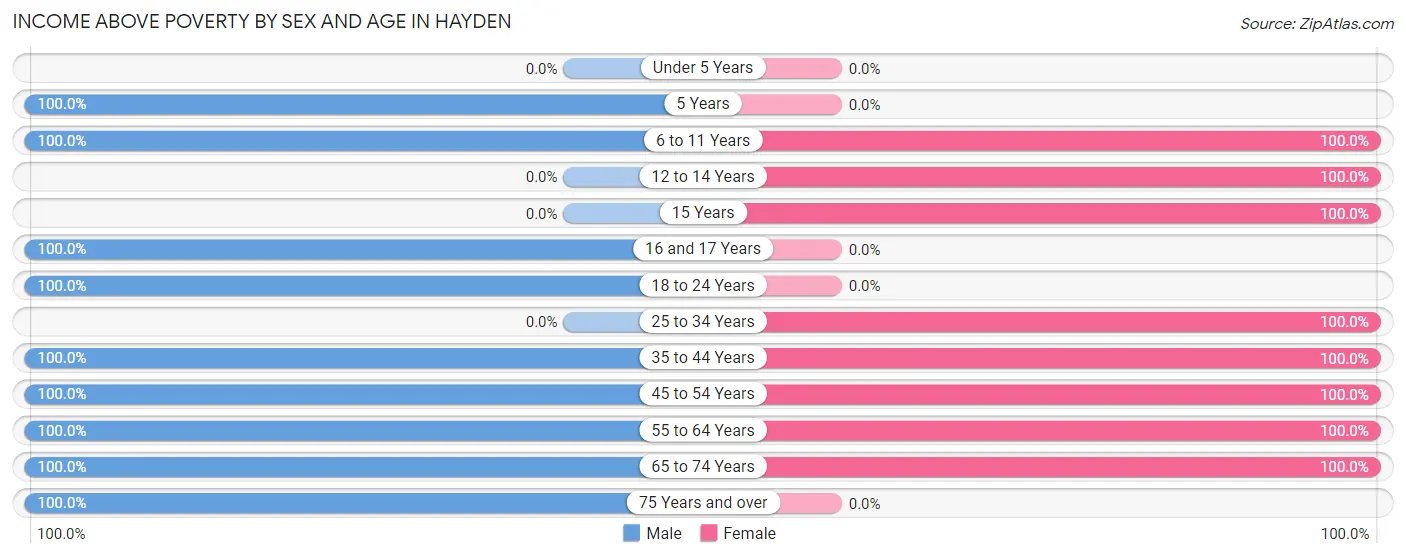
| Age Bracket | Male | Female |
| Under 5 Years | 0 (0.0%) | 0 (0.0%) |
| 5 Years | 39 (100.0%) | 0 (0.0%) |
| 6 to 11 Years | 80 (100.0%) | 40 (100.0%) |
| 12 to 14 Years | 0 (0.0%) | 80 (100.0%) |
| 15 Years | 0 (0.0%) | 95 (100.0%) |
| 16 and 17 Years | 44 (100.0%) | 0 (0.0%) |
| 18 to 24 Years | 32 (100.0%) | 0 (0.0%) |
| 25 to 34 Years | 0 (0.0%) | 47 (100.0%) |
| 35 to 44 Years | 50 (100.0%) | 112 (100.0%) |
| 45 to 54 Years | 81 (100.0%) | 33 (100.0%) |
| 55 to 64 Years | 53 (100.0%) | 37 (100.0%) |
| 65 to 74 Years | 13 (100.0%) | 26 (100.0%) |
| 75 Years and over | 13 (100.0%) | 0 (0.0%) |
| Total | 405 (100.0%) | 470 (100.0%) |
Income Below Poverty Among Married-Couple Families in Hayden
| Children | Above Poverty | Below Poverty |
| No Children | 54 (100.0%) | 0 (0.0%) |
| 1 or 2 Children | 97 (100.0%) | 0 (0.0%) |
| 3 or 4 Children | 0 (0.0%) | 0 (0.0%) |
| 5 or more Children | 37 (100.0%) | 0 (0.0%) |
| Total | 188 (100.0%) | 0 (0.0%) |
Income Below Poverty Among Single-Parent Households in Hayden
| Children | Single Father | Single Mother |
| No Children | 0 (0.0%) | 0 (0.0%) |
| 1 or 2 Children | 0 (0.0%) | 0 (0.0%) |
| 3 or 4 Children | 0 (0.0%) | 0 (0.0%) |
| 5 or more Children | 0 (0.0%) | 0 (0.0%) |
| Total | 0 (0.0%) | 0 (0.0%) |
Income Below Poverty Among Married-Couple vs Single-Parent Households in Hayden
| Children | Married-Couple Families | Single-Parent Households |
| No Children | 0 (0.0%) | 0 (0.0%) |
| 1 or 2 Children | 0 (0.0%) | 0 (0.0%) |
| 3 or 4 Children | 0 (0.0%) | 0 (0.0%) |
| 5 or more Children | 0 (0.0%) | 0 (0.0%) |
| Total | 0 (0.0%) | 0 (0.0%) |
Race in Hayden
The most populous races in Hayden are , and White / Caucasian (875 | 100.0%).
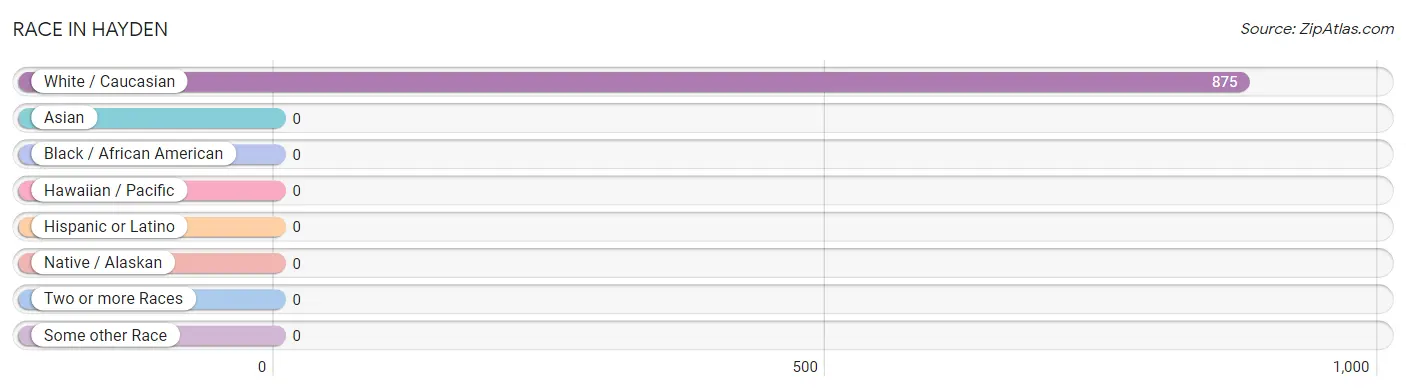
| Race | # Population | % Population |
| Asian | 0 | 0.0% |
| Black / African American | 0 | 0.0% |
| Hawaiian / Pacific | 0 | 0.0% |
| Hispanic or Latino | 0 | 0.0% |
| Native / Alaskan | 0 | 0.0% |
| White / Caucasian | 875 | 100.0% |
| Two or more Races | 0 | 0.0% |
| Some other Race | 0 | 0.0% |
| Total | 875 | 100.0% |
Ancestry in Hayden
The most populous ancestries reported in Hayden are American (210 | 24.0%), Irish (175 | 20.0%), German (142 | 16.2%), Italian (50 | 5.7%), and English (36 | 4.1%), together accounting for 70.1% of all Hayden residents.
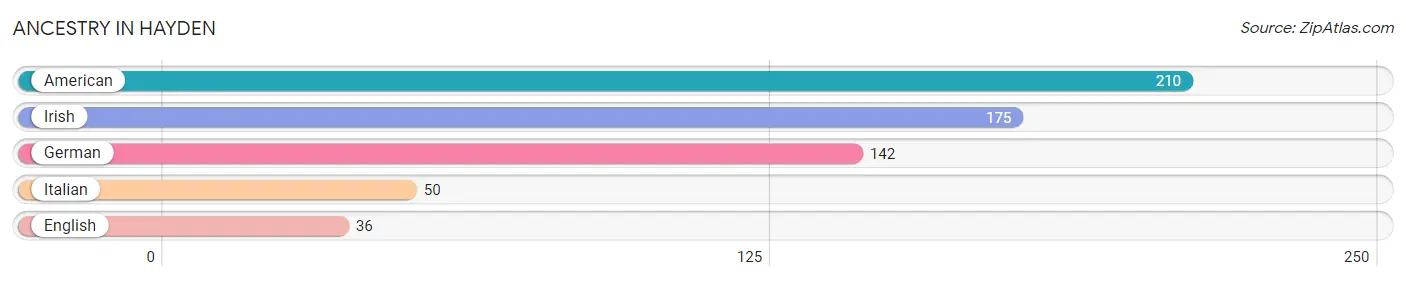
| Ancestry | # Population | % Population |
| American | 210 | 24.0% |
| English | 36 | 4.1% |
| German | 142 | 16.2% |
| Irish | 175 | 20.0% |
| Italian | 50 | 5.7% | View All 5 Rows |
Immigrants in Hayden
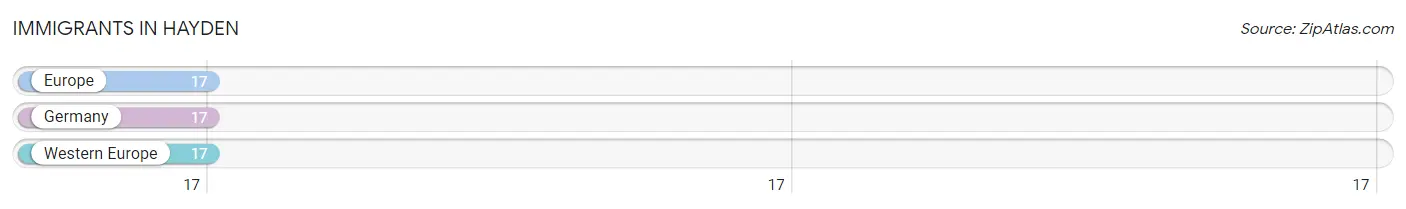
The most numerous immigrant groups reported in Hayden came from Europe (17 | 1.9%), Germany (17 | 1.9%), and Western Europe (17 | 1.9%), together accounting for 5.8% of all Hayden residents.
| Immigration Origin | # Population | % Population |
| Europe | 17 | 1.9% |
| Germany | 17 | 1.9% |
| Western Europe | 17 | 1.9% | View All 3 Rows |
Sex and Age in Hayden
Sex and Age in Hayden
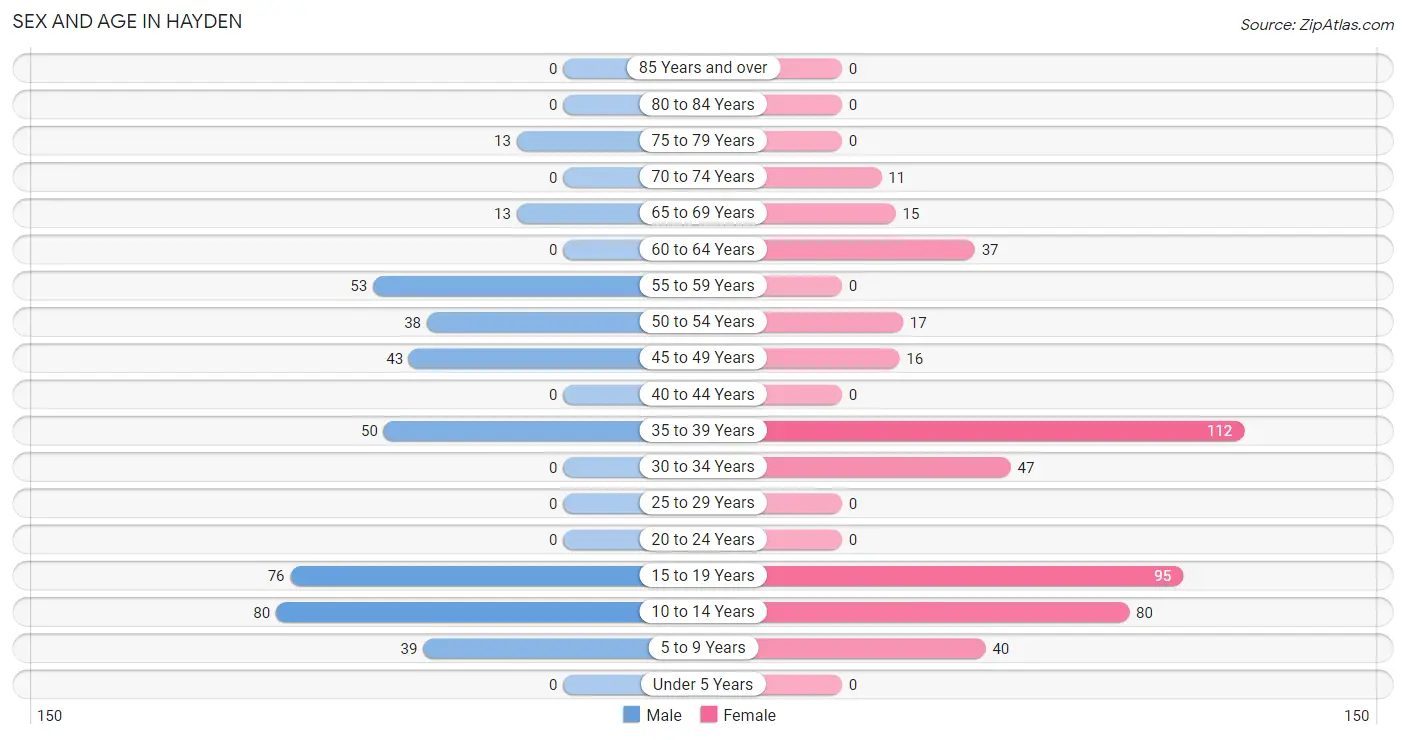
The most populous age groups in Hayden are 10 to 14 Years (80 | 19.8%) for men and 35 to 39 Years (112 | 23.8%) for women.
| Age Bracket | Male | Female |
| Under 5 Years | 0 (0.0%) | 0 (0.0%) |
| 5 to 9 Years | 39 (9.6%) | 40 (8.5%) |
| 10 to 14 Years | 80 (19.8%) | 80 (17.0%) |
| 15 to 19 Years | 76 (18.8%) | 95 (20.2%) |
| 20 to 24 Years | 0 (0.0%) | 0 (0.0%) |
| 25 to 29 Years | 0 (0.0%) | 0 (0.0%) |
| 30 to 34 Years | 0 (0.0%) | 47 (10.0%) |
| 35 to 39 Years | 50 (12.3%) | 112 (23.8%) |
| 40 to 44 Years | 0 (0.0%) | 0 (0.0%) |
| 45 to 49 Years | 43 (10.6%) | 16 (3.4%) |
| 50 to 54 Years | 38 (9.4%) | 17 (3.6%) |
| 55 to 59 Years | 53 (13.1%) | 0 (0.0%) |
| 60 to 64 Years | 0 (0.0%) | 37 (7.9%) |
| 65 to 69 Years | 13 (3.2%) | 15 (3.2%) |
| 70 to 74 Years | 0 (0.0%) | 11 (2.3%) |
| 75 to 79 Years | 13 (3.2%) | 0 (0.0%) |
| 80 to 84 Years | 0 (0.0%) | 0 (0.0%) |
| 85 Years and over | 0 (0.0%) | 0 (0.0%) |
| Total | 405 (100.0%) | 470 (100.0%) |
Families and Households in Hayden
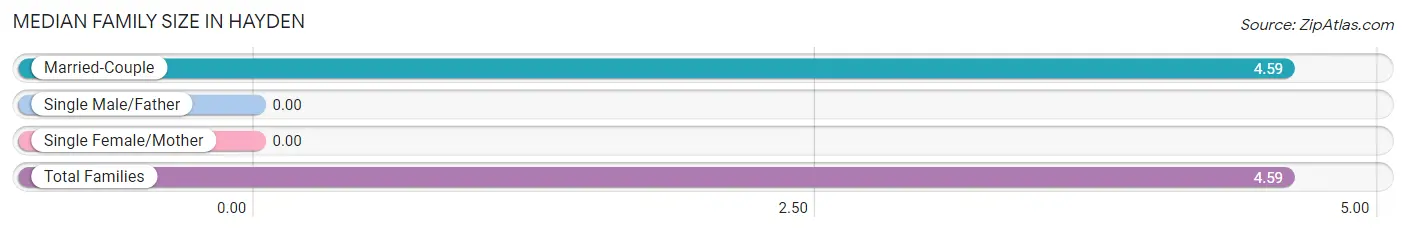
Median Family Size in Hayden
| Family Type | # Families | Family Size |
| Married-Couple | 188 (100.0%) | 4.59 |
| Single Male/Father | 0 (0.0%) | - |
| Single Female/Mother | 0 (0.0%) | - |
| Total Families | 188 (100.0%) | 4.59 |
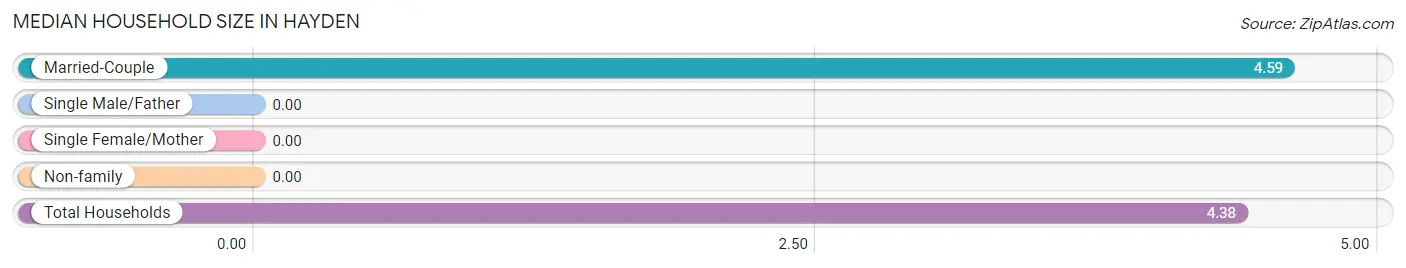
Median Household Size in Hayden
| Household Type | # Households | Household Size |
| Married-Couple | 188 (94.0%) | 4.59 |
| Single Male/Father | 0 (0.0%) | - |
| Single Female/Mother | 0 (0.0%) | - |
| Non-family | 12 (6.0%) | - |
| Total Households | 200 (100.0%) | 4.38 |
Household Size by Marriage Status in Hayden
Out of a total of 200 households in Hayden, 188 (94.0%) are family households, while 12 (6.0%) are nonfamily households. The most numerous type of family households are 2-person households, comprising 54, and the most common type of nonfamily households are 1-person households, comprising 12.
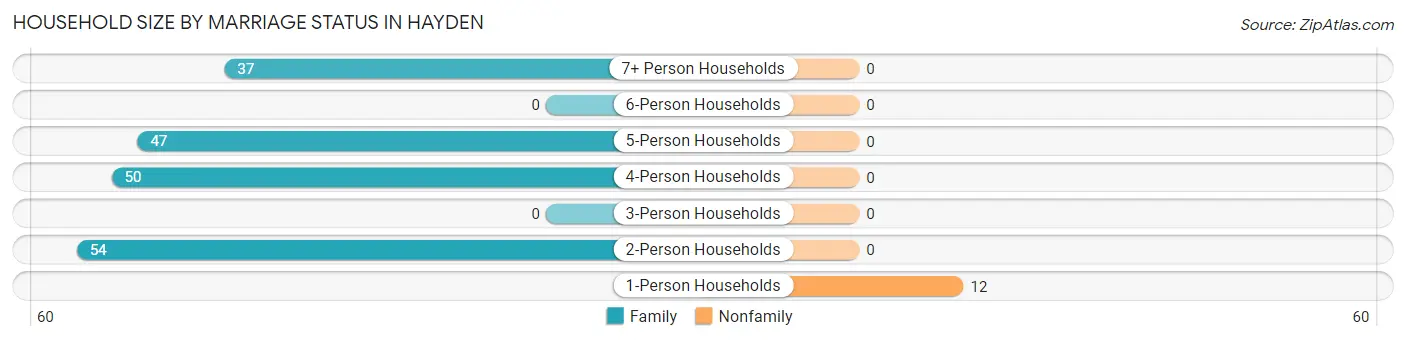
| Household Size | Family Households | Nonfamily Households |
| 1-Person Households | - | 12 (6.0%) |
| 2-Person Households | 54 (27.0%) | 0 (0.0%) |
| 3-Person Households | 0 (0.0%) | 0 (0.0%) |
| 4-Person Households | 50 (25.0%) | 0 (0.0%) |
| 5-Person Households | 47 (23.5%) | 0 (0.0%) |
| 6-Person Households | 0 (0.0%) | 0 (0.0%) |
| 7+ Person Households | 37 (18.5%) | 0 (0.0%) |
| Total | 188 (94.0%) | 12 (6.0%) |
Female Fertility in Hayden
Fertility by Age in Hayden
| Age Bracket | Women with Births | Births / 1,000 Women |
| 15 to 19 years | 0 (0.0%) | 0.0 |
| 20 to 34 years | 0 (0.0%) | 0.0 |
| 35 to 50 years | 0 (0.0%) | 0.0 |
| Total | 0 (0.0%) | 0.0 |
Fertility by Age by Marriage Status in Hayden
| Age Bracket | Married | Unmarried |
| 15 to 19 years | 0 (0.0%) | 0 (0.0%) |
| 20 to 34 years | 0 (0.0%) | 0 (0.0%) |
| 35 to 50 years | 0 (0.0%) | 0 (0.0%) |
| Total | 0 (0.0%) | 0 (0.0%) |
Fertility by Education in Hayden
| Educational Attainment | Women with Births | Births / 1,000 Women |
| Less than High School | 0 (0.0%) | 0.0 |
| High School Diploma | 0 (0.0%) | 0.0 |
| College or Associate's Degree | 0 (0.0%) | 0.0 |
| Bachelor's Degree | 0 (0.0%) | 0.0 |
| Graduate Degree | 0 (0.0%) | 0.0 |
| Total | 0 (0.0%) | 0.0 |
Fertility by Education by Marriage Status in Hayden
| Educational Attainment | Married | Unmarried |
| Less than High School | 0 (0.0%) | 0 (0.0%) |
| High School Diploma | 0 (0.0%) | 0 (0.0%) |
| College or Associate's Degree | 0 (0.0%) | 0 (0.0%) |
| Bachelor's Degree | 0 (0.0%) | 0 (0.0%) |
| Graduate Degree | 0 (0.0%) | 0 (0.0%) |
| Total | 0 (0.0%) | 0 (0.0%) |
Employment Characteristics in Hayden
Employment by Class of Employer in Hayden
Among the 445 employed individuals in Hayden, private company employees (333 | 74.8%), self-employed (incorporated) (53 | 11.9%), and self-employed (not incorporated) (47 | 10.6%) make up the most common classes of employment.
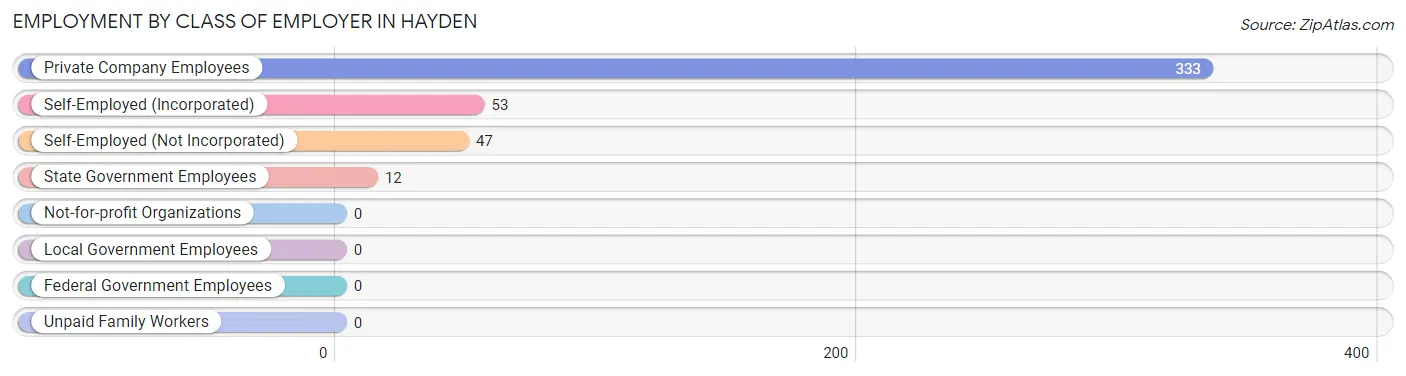
| Employer Class | # Employees | % Employees |
| Private Company Employees | 333 | 74.8% |
| Self-Employed (Incorporated) | 53 | 11.9% |
| Self-Employed (Not Incorporated) | 47 | 10.6% |
| Not-for-profit Organizations | 0 | 0.0% |
| Local Government Employees | 0 | 0.0% |
| State Government Employees | 12 | 2.7% |
| Federal Government Employees | 0 | 0.0% |
| Unpaid Family Workers | 0 | 0.0% |
| Total | 445 | 100.0% |
Employment Status by Age in Hayden
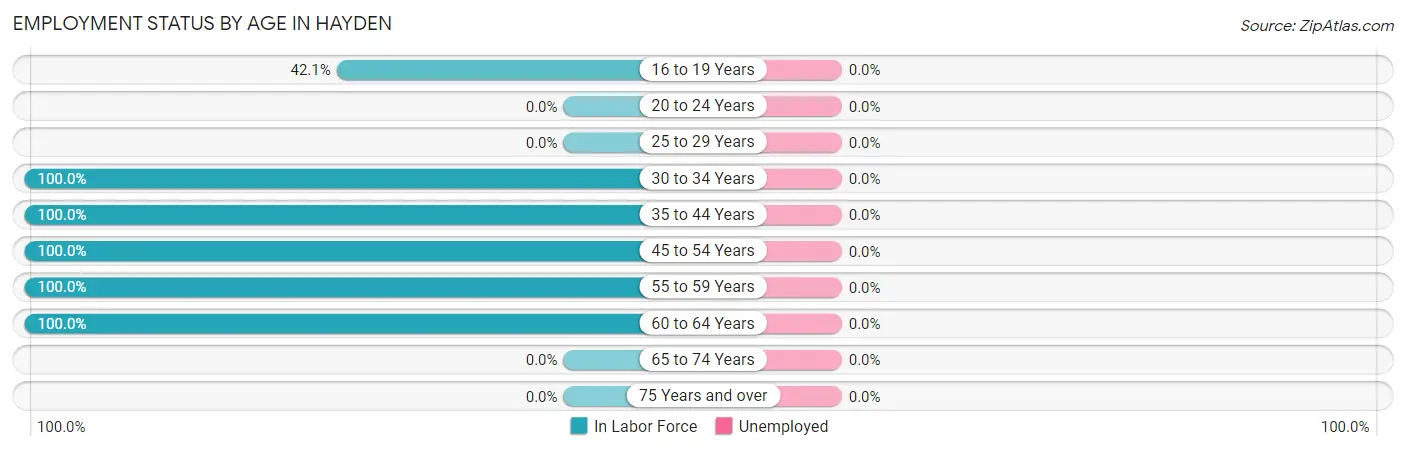
| Age Bracket | In Labor Force | Unemployed |
| 16 to 19 Years | 32 (42.1%) | 0 (0.0%) |
| 20 to 24 Years | 0 (0.0%) | 0 (0.0%) |
| 25 to 29 Years | 0 (0.0%) | 0 (0.0%) |
| 30 to 34 Years | 47 (100.0%) | 0 (0.0%) |
| 35 to 44 Years | 162 (100.0%) | 0 (0.0%) |
| 45 to 54 Years | 114 (100.0%) | 0 (0.0%) |
| 55 to 59 Years | 53 (100.0%) | 0 (0.0%) |
| 60 to 64 Years | 37 (100.0%) | 0 (0.0%) |
| 65 to 74 Years | 0 (0.0%) | 0 (0.0%) |
| 75 Years and over | 0 (0.0%) | 0 (0.0%) |
| Total | 445 (82.3%) | 0 (0.0%) |
Employment Status by Educational Attainment in Hayden
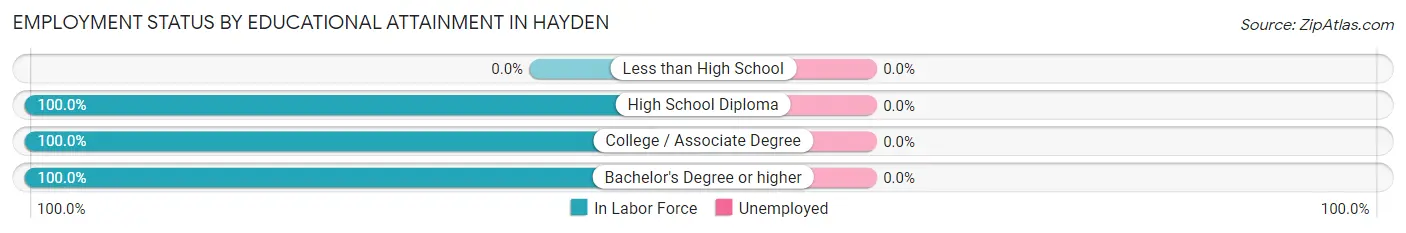
| Educational Attainment | In Labor Force | Unemployed |
| Less than High School | 0 (0.0%) | 0 (0.0%) |
| High School Diploma | 159 (100.0%) | 0 (0.0%) |
| College / Associate Degree | 120 (100.0%) | 0 (0.0%) |
| Bachelor's Degree or higher | 134 (100.0%) | 0 (0.0%) |
| Total | 413 (100.0%) | 0 (0.0%) |
Employment Occupations by Sex in Hayden
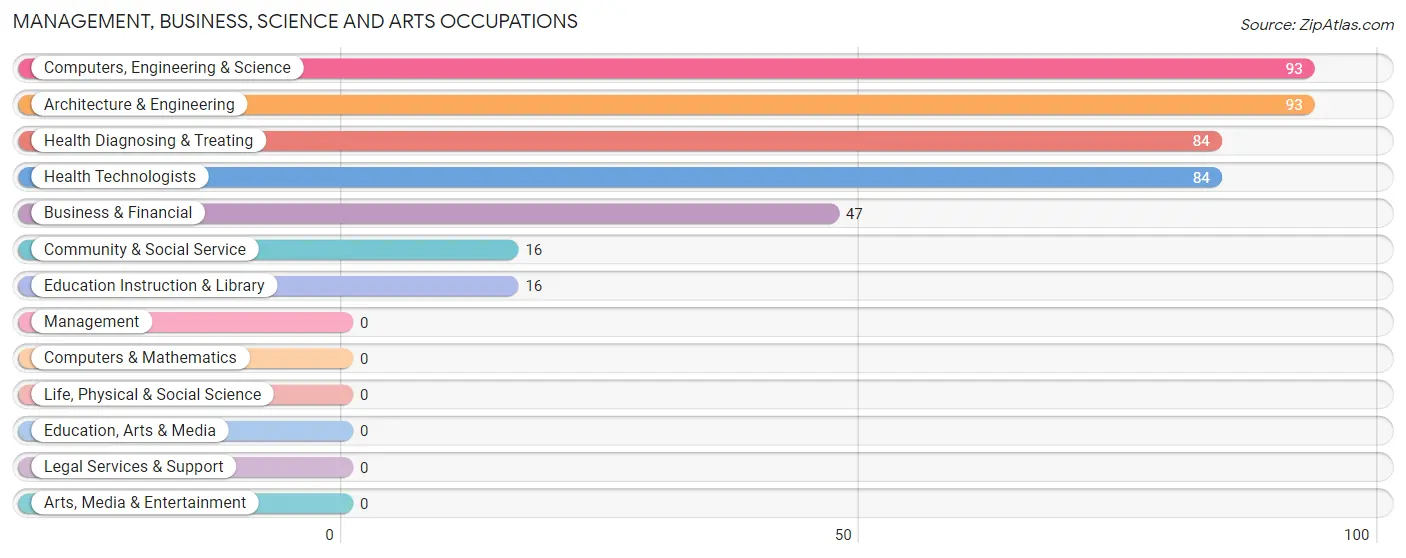
Management, Business, Science and Arts Occupations
The most common Management, Business, Science and Arts occupations in Hayden are Computers, Engineering & Science (93 | 20.9%), Architecture & Engineering (93 | 20.9%), Health Diagnosing & Treating (84 | 18.9%), Health Technologists (84 | 18.9%), and Business & Financial (47 | 10.6%).
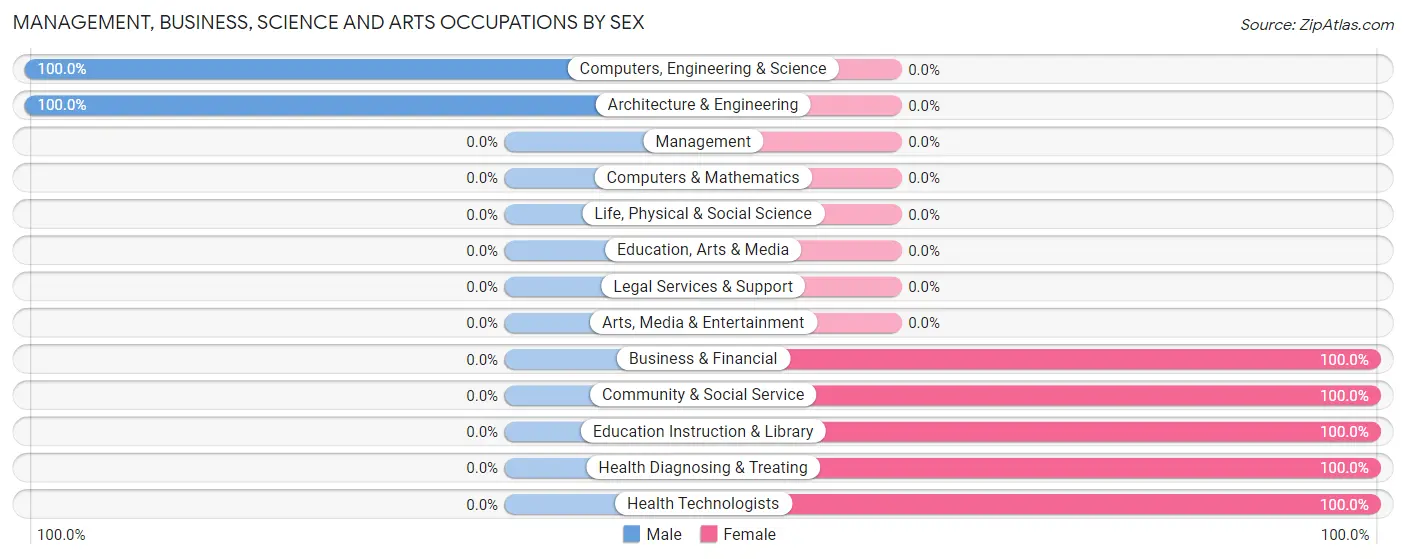
Management, Business, Science and Arts Occupations by Sex
Within the Management, Business, Science and Arts occupations in Hayden, the most male-oriented occupations are Computers, Engineering & Science (100.0%), and Architecture & Engineering (100.0%), while the most female-oriented occupations are Business & Financial (100.0%), Community & Social Service (100.0%), and Education Instruction & Library (100.0%).
| Occupation | Male | Female |
| Management | 0 (0.0%) | 0 (0.0%) |
| Business & Financial | 0 (0.0%) | 47 (100.0%) |
| Computers, Engineering & Science | 93 (100.0%) | 0 (0.0%) |
| Computers & Mathematics | 0 (0.0%) | 0 (0.0%) |
| Architecture & Engineering | 93 (100.0%) | 0 (0.0%) |
| Life, Physical & Social Science | 0 (0.0%) | 0 (0.0%) |
| Community & Social Service | 0 (0.0%) | 16 (100.0%) |
| Education, Arts & Media | 0 (0.0%) | 0 (0.0%) |
| Legal Services & Support | 0 (0.0%) | 0 (0.0%) |
| Education Instruction & Library | 0 (0.0%) | 16 (100.0%) |
| Arts, Media & Entertainment | 0 (0.0%) | 0 (0.0%) |
| Health Diagnosing & Treating | 0 (0.0%) | 84 (100.0%) |
| Health Technologists | 0 (0.0%) | 84 (100.0%) |
| Total (Category) | 93 (38.8%) | 147 (61.3%) |
| Total (Overall) | 216 (48.5%) | 229 (51.5%) |
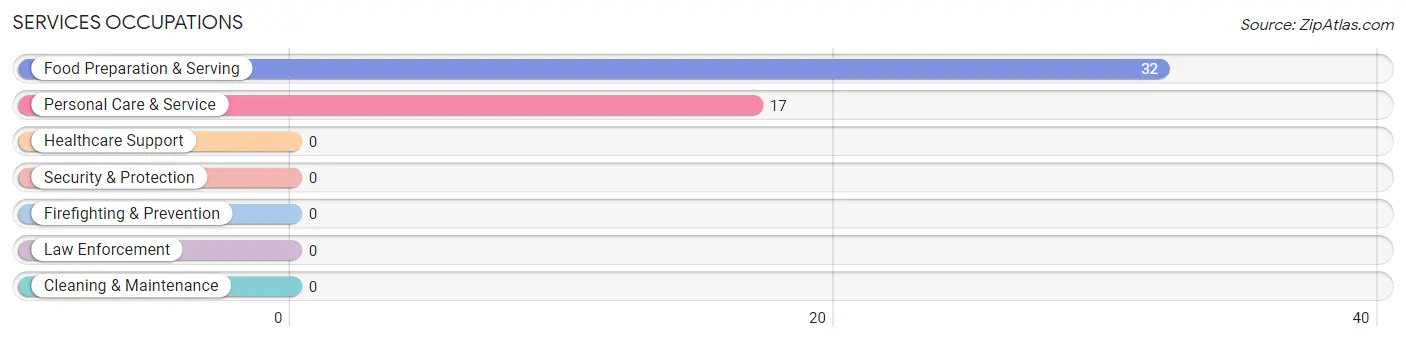
Services Occupations
The most common Services occupations in Hayden are Food Preparation & Serving (32 | 7.2%), and Personal Care & Service (17 | 3.8%).
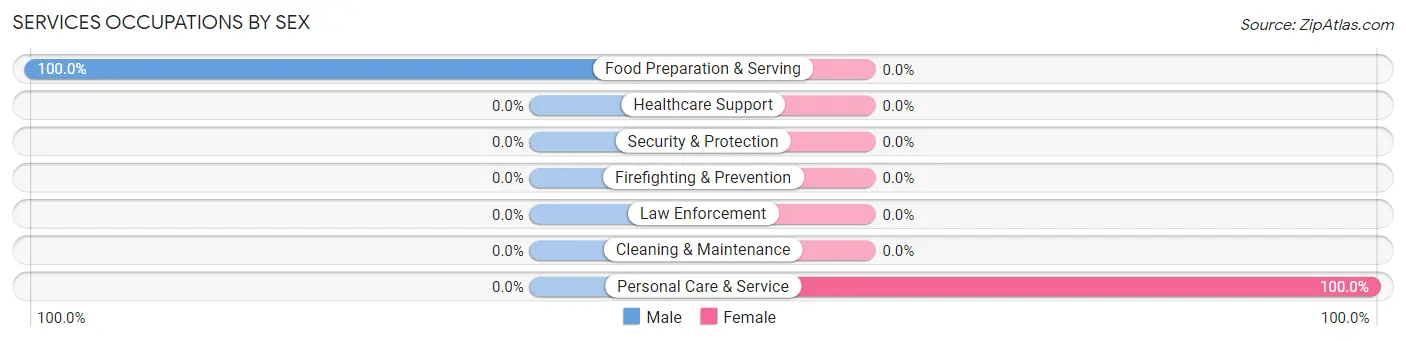
Services Occupations by Sex
| Occupation | Male | Female |
| Healthcare Support | 0 (0.0%) | 0 (0.0%) |
| Security & Protection | 0 (0.0%) | 0 (0.0%) |
| Firefighting & Prevention | 0 (0.0%) | 0 (0.0%) |
| Law Enforcement | 0 (0.0%) | 0 (0.0%) |
| Food Preparation & Serving | 32 (100.0%) | 0 (0.0%) |
| Cleaning & Maintenance | 0 (0.0%) | 0 (0.0%) |
| Personal Care & Service | 0 (0.0%) | 17 (100.0%) |
| Total (Category) | 32 (65.3%) | 17 (34.7%) |
| Total (Overall) | 216 (48.5%) | 229 (51.5%) |
Sales and Office Occupations
Sales and Office Occupations by Sex
| Occupation | Male | Female |
| Sales & Related | 0 (0.0%) | 0 (0.0%) |
| Office & Administration | 0 (0.0%) | 0 (0.0%) |
| Total (Category) | 0 (0.0%) | 0 (0.0%) |
| Total (Overall) | 216 (48.5%) | 229 (51.5%) |
Natural Resources, Construction and Maintenance Occupations
The most common Natural Resources, Construction and Maintenance occupations in Hayden are , and Construction & Extraction (53 | 11.9%).
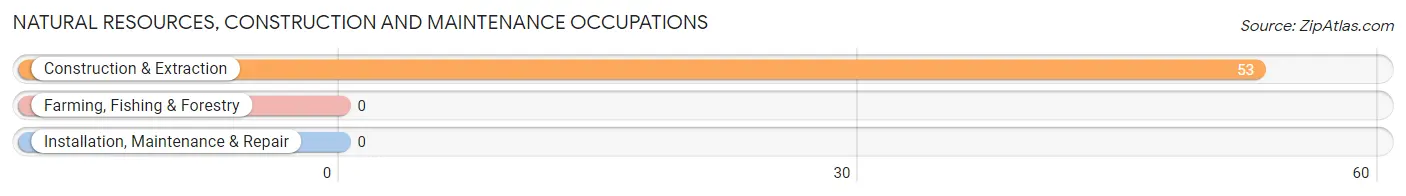
Natural Resources, Construction and Maintenance Occupations by Sex
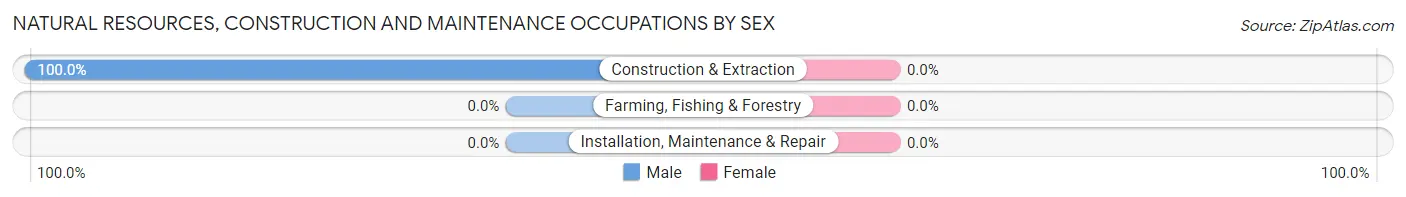
| Occupation | Male | Female |
| Farming, Fishing & Forestry | 0 (0.0%) | 0 (0.0%) |
| Construction & Extraction | 53 (100.0%) | 0 (0.0%) |
| Installation, Maintenance & Repair | 0 (0.0%) | 0 (0.0%) |
| Total (Category) | 53 (100.0%) | 0 (0.0%) |
| Total (Overall) | 216 (48.5%) | 229 (51.5%) |
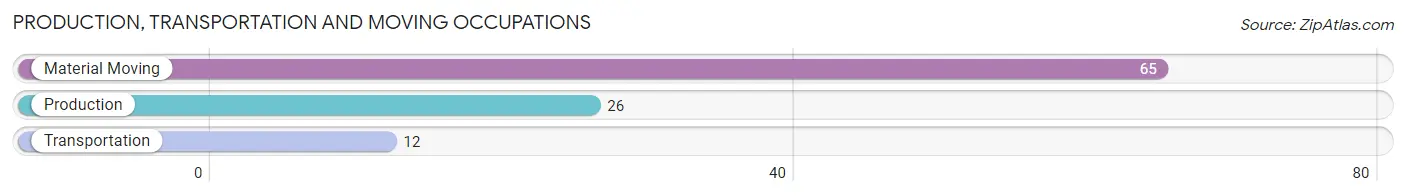
Production, Transportation and Moving Occupations
The most common Production, Transportation and Moving occupations in Hayden are Material Moving (65 | 14.6%), Production (26 | 5.8%), and Transportation (12 | 2.7%).
Production, Transportation and Moving Occupations by Sex
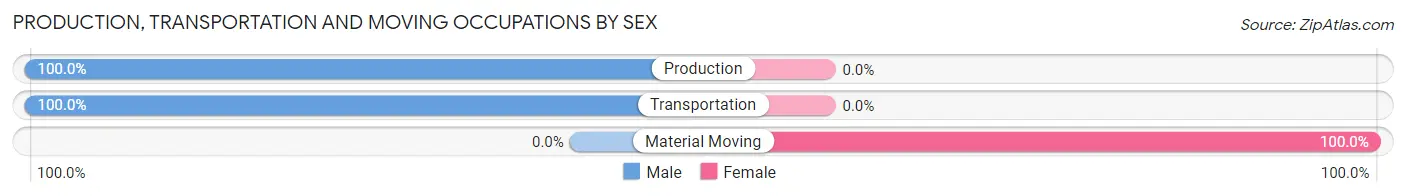
| Occupation | Male | Female |
| Production | 26 (100.0%) | 0 (0.0%) |
| Transportation | 12 (100.0%) | 0 (0.0%) |
| Material Moving | 0 (0.0%) | 65 (100.0%) |
| Total (Category) | 38 (36.9%) | 65 (63.1%) |
| Total (Overall) | 216 (48.5%) | 229 (51.5%) |
Employment Industries by Sex in Hayden
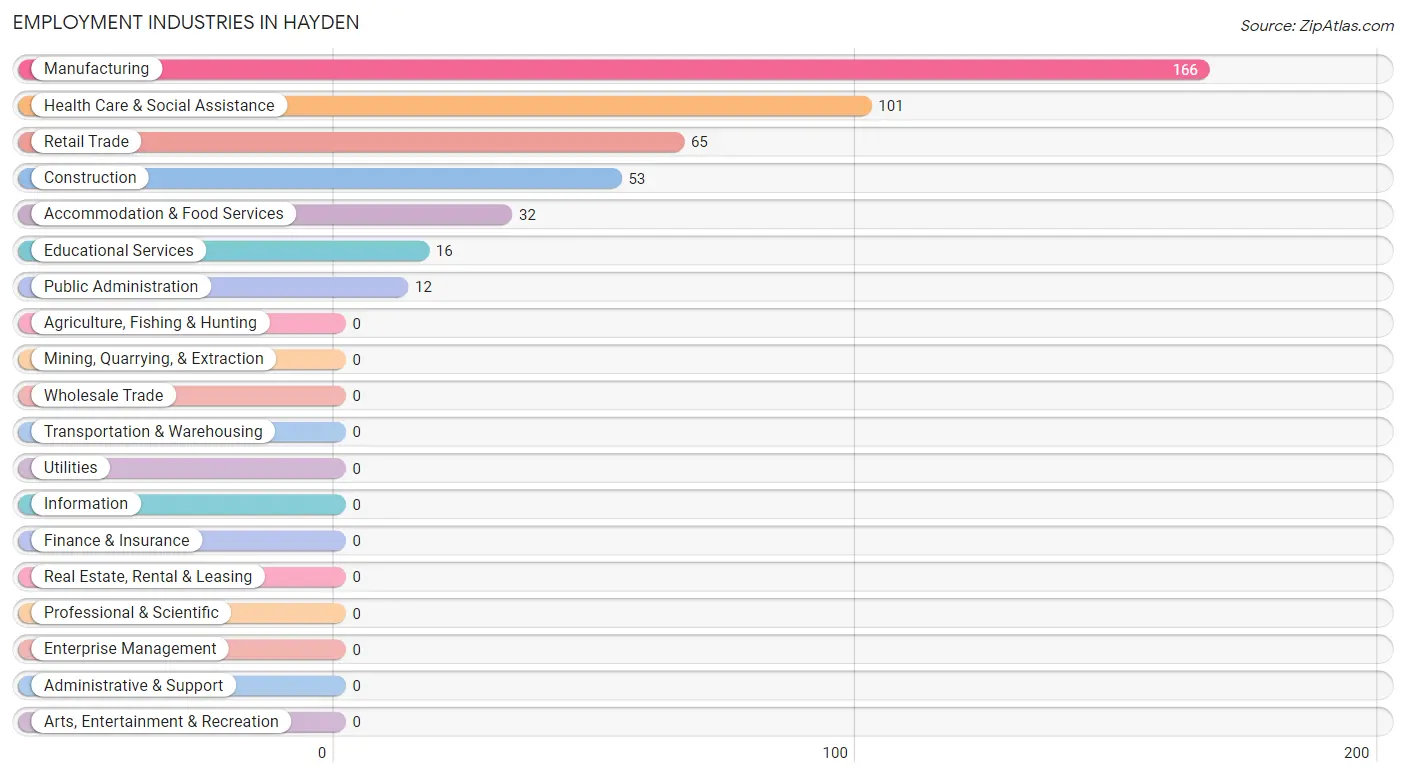
Employment Industries in Hayden
The major employment industries in Hayden include Manufacturing (166 | 37.3%), Health Care & Social Assistance (101 | 22.7%), Retail Trade (65 | 14.6%), Construction (53 | 11.9%), and Accommodation & Food Services (32 | 7.2%).
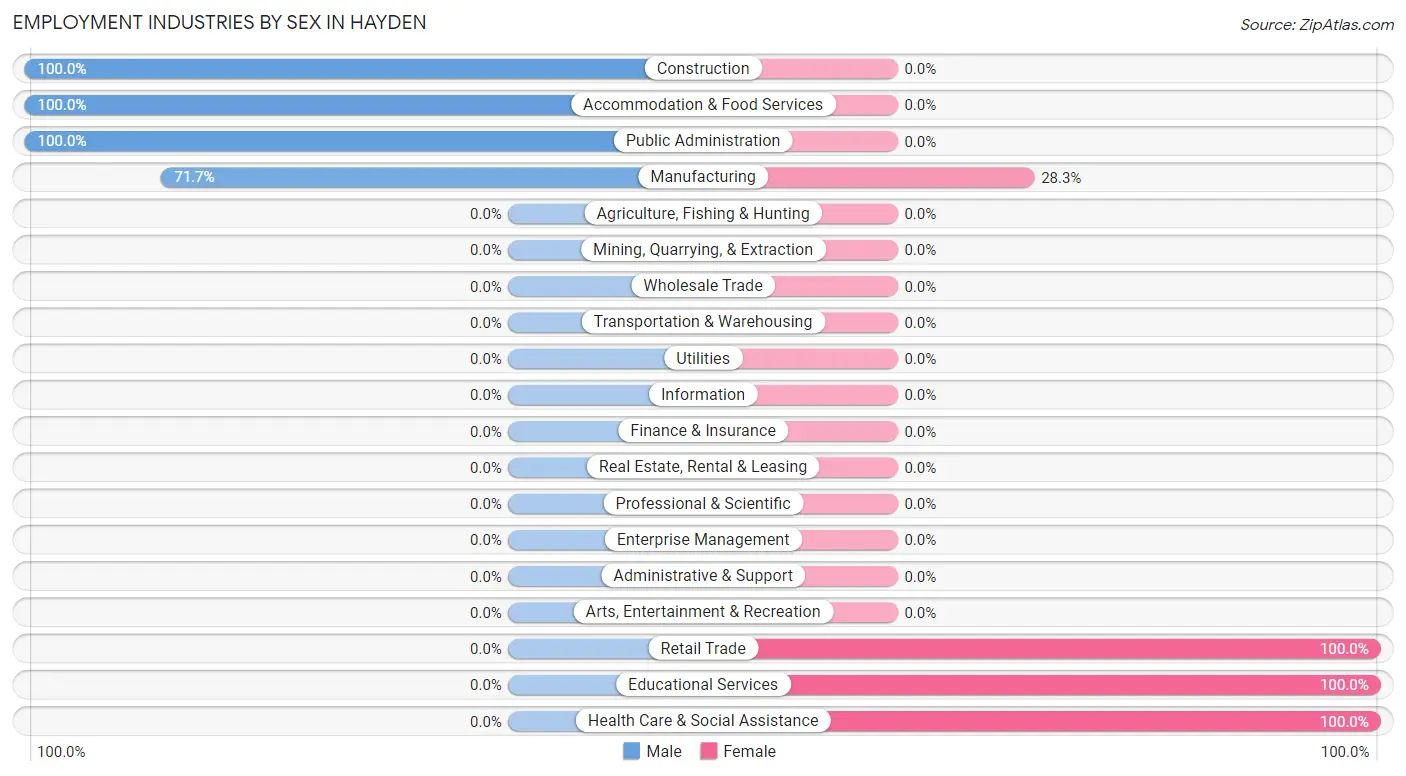
Employment Industries by Sex in Hayden
The Hayden industries that see more men than women are Construction (100.0%), Accommodation & Food Services (100.0%), and Public Administration (100.0%), whereas the industries that tend to have a higher number of women are Retail Trade (100.0%), Educational Services (100.0%), and Health Care & Social Assistance (100.0%).
| Industry | Male | Female |
| Agriculture, Fishing & Hunting | 0 (0.0%) | 0 (0.0%) |
| Mining, Quarrying, & Extraction | 0 (0.0%) | 0 (0.0%) |
| Construction | 53 (100.0%) | 0 (0.0%) |
| Manufacturing | 119 (71.7%) | 47 (28.3%) |
| Wholesale Trade | 0 (0.0%) | 0 (0.0%) |
| Retail Trade | 0 (0.0%) | 65 (100.0%) |
| Transportation & Warehousing | 0 (0.0%) | 0 (0.0%) |
| Utilities | 0 (0.0%) | 0 (0.0%) |
| Information | 0 (0.0%) | 0 (0.0%) |
| Finance & Insurance | 0 (0.0%) | 0 (0.0%) |
| Real Estate, Rental & Leasing | 0 (0.0%) | 0 (0.0%) |
| Professional & Scientific | 0 (0.0%) | 0 (0.0%) |
| Enterprise Management | 0 (0.0%) | 0 (0.0%) |
| Administrative & Support | 0 (0.0%) | 0 (0.0%) |
| Educational Services | 0 (0.0%) | 16 (100.0%) |
| Health Care & Social Assistance | 0 (0.0%) | 101 (100.0%) |
| Arts, Entertainment & Recreation | 0 (0.0%) | 0 (0.0%) |
| Accommodation & Food Services | 32 (100.0%) | 0 (0.0%) |
| Public Administration | 12 (100.0%) | 0 (0.0%) |
| Total | 216 (48.5%) | 229 (51.5%) |
Education in Hayden
School Enrollment in Hayden
The most common levels of schooling among the 410 students in Hayden are middle school (204 | 49.8%), high school (127 | 31.0%), and elementary school (40 | 9.8%).
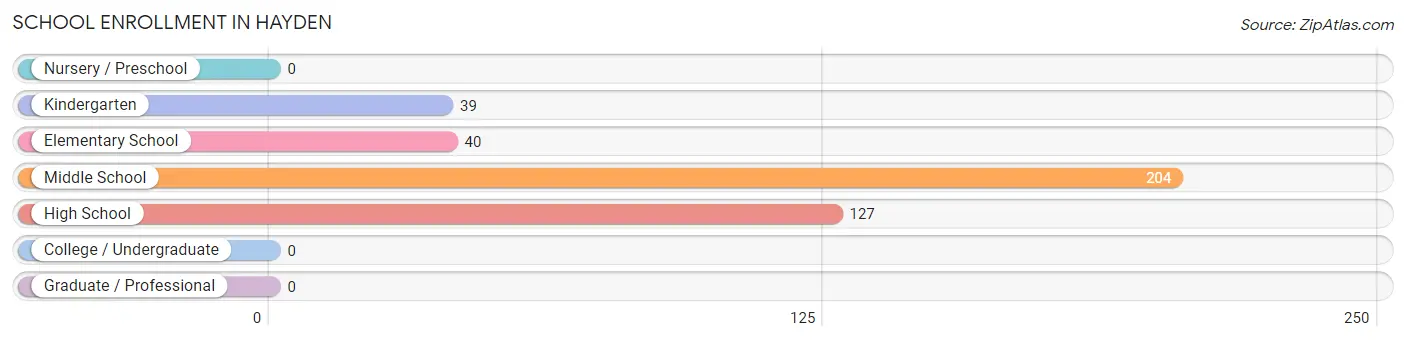
| School Level | # Students | % Students |
| Nursery / Preschool | 0 | 0.0% |
| Kindergarten | 39 | 9.5% |
| Elementary School | 40 | 9.8% |
| Middle School | 204 | 49.8% |
| High School | 127 | 31.0% |
| College / Undergraduate | 0 | 0.0% |
| Graduate / Professional | 0 | 0.0% |
| Total | 410 | 100.0% |
School Enrollment by Age by Funding Source in Hayden
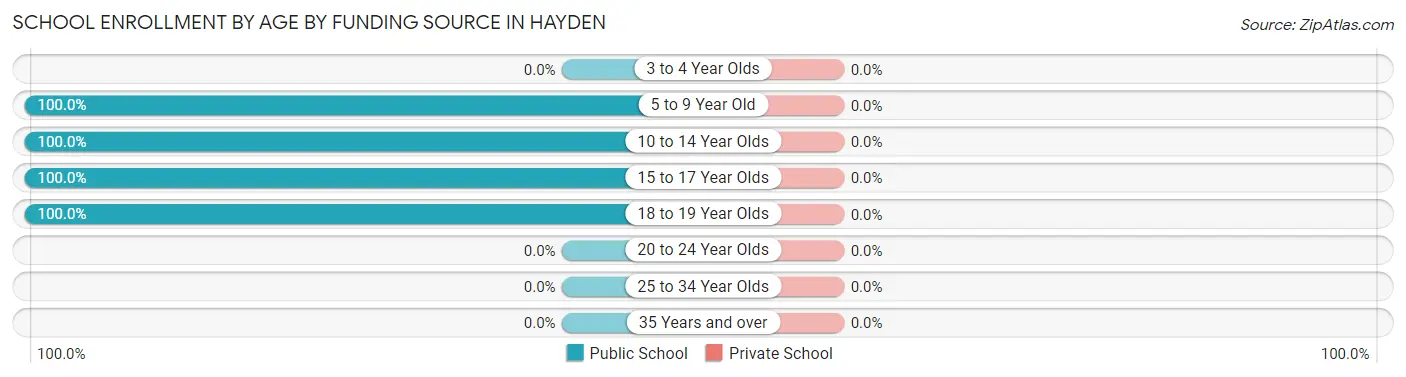
| Age Bracket | Public School | Private School |
| 3 to 4 Year Olds | 0 (0.0%) | 0 (0.0%) |
| 5 to 9 Year Old | 79 (100.0%) | 0 (0.0%) |
| 10 to 14 Year Olds | 160 (100.0%) | 0 (0.0%) |
| 15 to 17 Year Olds | 139 (100.0%) | 0 (0.0%) |
| 18 to 19 Year Olds | 32 (100.0%) | 0 (0.0%) |
| 20 to 24 Year Olds | 0 (0.0%) | 0 (0.0%) |
| 25 to 34 Year Olds | 0 (0.0%) | 0 (0.0%) |
| 35 Years and over | 0 (0.0%) | 0 (0.0%) |
| Total | 410 (100.0%) | 0 (0.0%) |
Educational Attainment by Field of Study in Hayden
Science & technology (134 | 74.0%), and bio, nature & agricultural (47 | 26.0%) are the most common fields of study among 181 individuals in Hayden who have obtained a bachelor's degree or higher.
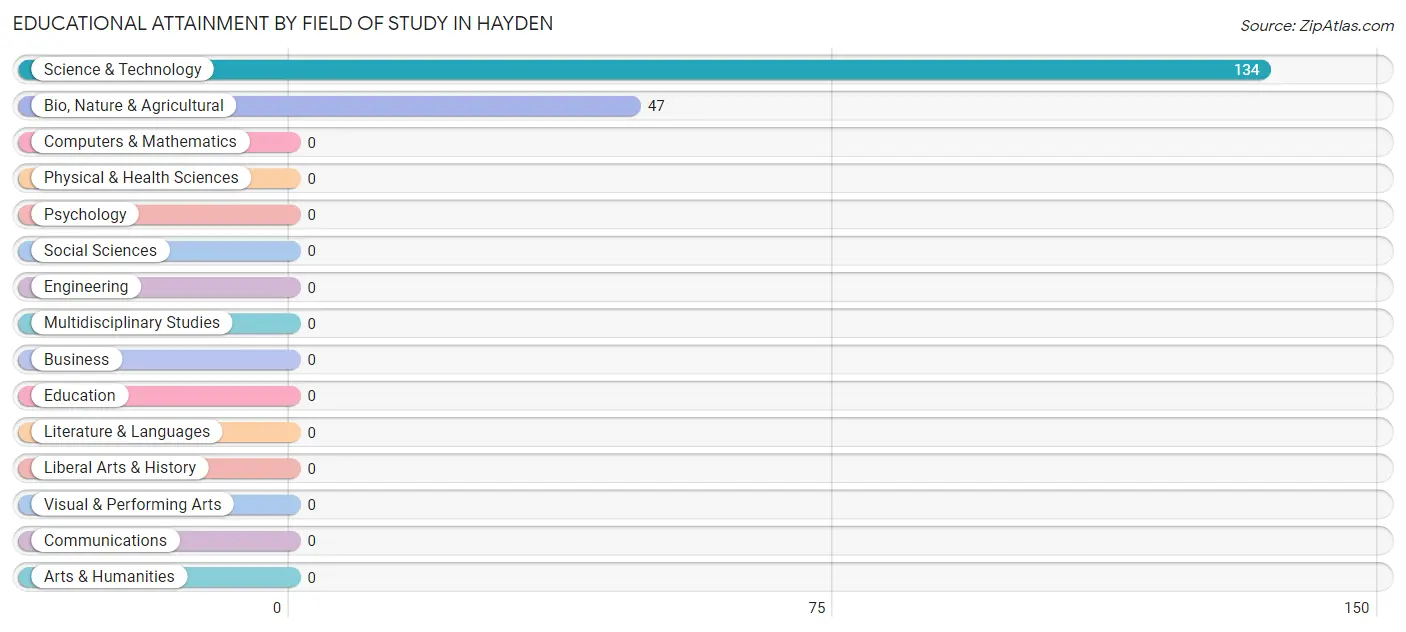
| Field of Study | # Graduates | % Graduates |
| Computers & Mathematics | 0 | 0.0% |
| Bio, Nature & Agricultural | 47 | 26.0% |
| Physical & Health Sciences | 0 | 0.0% |
| Psychology | 0 | 0.0% |
| Social Sciences | 0 | 0.0% |
| Engineering | 0 | 0.0% |
| Multidisciplinary Studies | 0 | 0.0% |
| Science & Technology | 134 | 74.0% |
| Business | 0 | 0.0% |
| Education | 0 | 0.0% |
| Literature & Languages | 0 | 0.0% |
| Liberal Arts & History | 0 | 0.0% |
| Visual & Performing Arts | 0 | 0.0% |
| Communications | 0 | 0.0% |
| Arts & Humanities | 0 | 0.0% |
| Total | 181 | 100.0% |
Transportation & Commute in Hayden
Vehicle Availability by Sex in Hayden
The most prevalent vehicle ownership categories in Hayden are males with 2 vehicles (137, accounting for 63.4%) and females with 2 vehicles (94, making up 59.8%).
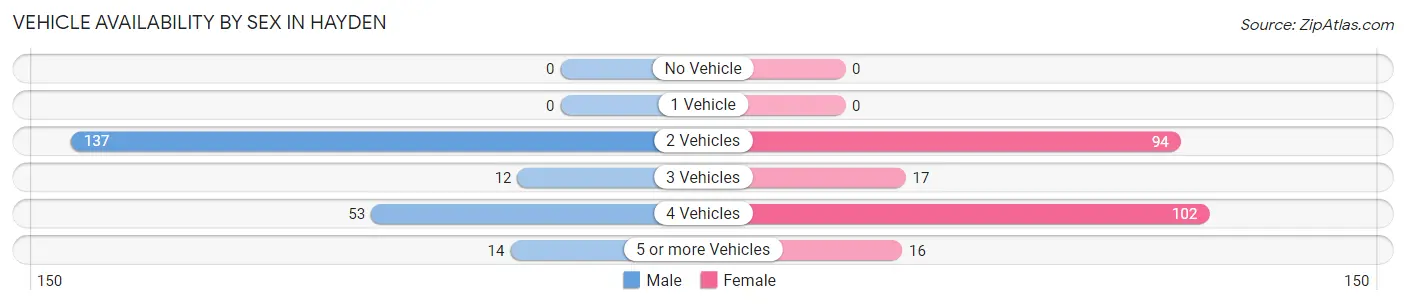
| Vehicles Available | Male | Female |
| No Vehicle | 0 (0.0%) | 0 (0.0%) |
| 1 Vehicle | 0 (0.0%) | 0 (0.0%) |
| 2 Vehicles | 137 (63.4%) | 94 (41.0%) |
| 3 Vehicles | 12 (5.6%) | 17 (7.4%) |
| 4 Vehicles | 53 (24.5%) | 102 (44.5%) |
| 5 or more Vehicles | 14 (6.5%) | 16 (7.0%) |
| Total | 216 (100.0%) | 229 (100.0%) |
Commute Time in Hayden
The most frequently occuring commute durations in Hayden are 20 to 24 minutes (193 commuters, 43.4%), 30 to 34 minutes (123 commuters, 27.6%), and 60 to 89 minutes (53 commuters, 11.9%).
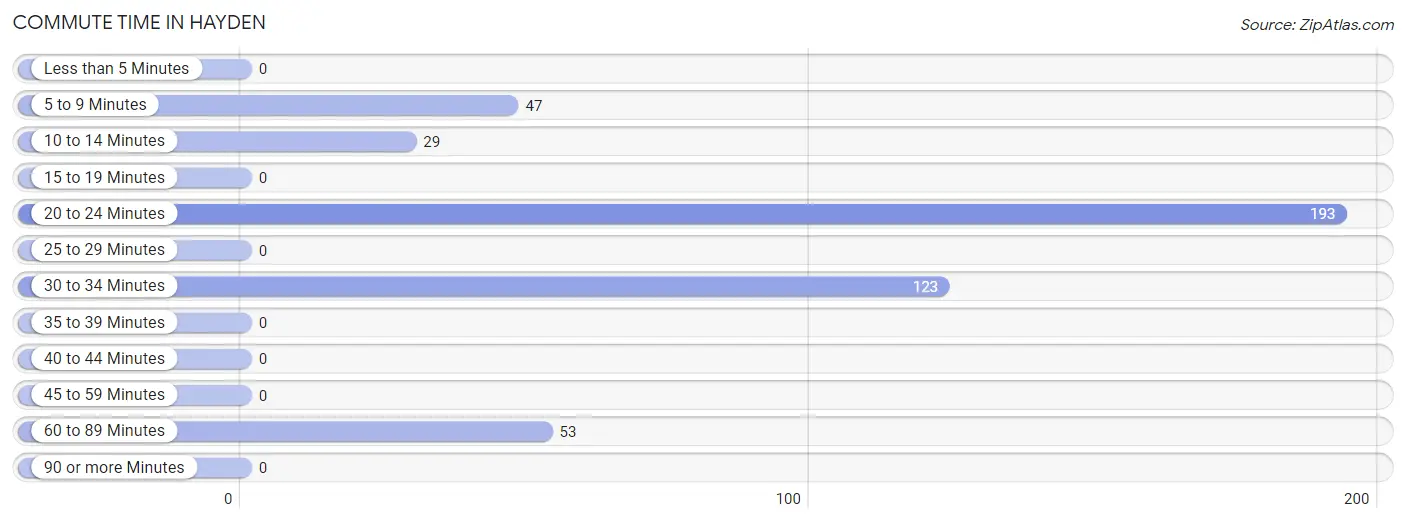
| Commute Time | # Commuters | % Commuters |
| Less than 5 Minutes | 0 | 0.0% |
| 5 to 9 Minutes | 47 | 10.6% |
| 10 to 14 Minutes | 29 | 6.5% |
| 15 to 19 Minutes | 0 | 0.0% |
| 20 to 24 Minutes | 193 | 43.4% |
| 25 to 29 Minutes | 0 | 0.0% |
| 30 to 34 Minutes | 123 | 27.6% |
| 35 to 39 Minutes | 0 | 0.0% |
| 40 to 44 Minutes | 0 | 0.0% |
| 45 to 59 Minutes | 0 | 0.0% |
| 60 to 89 Minutes | 53 | 11.9% |
| 90 or more Minutes | 0 | 0.0% |
Commute Time by Sex in Hayden
The most common commute times in Hayden are 30 to 34 minutes (107 commuters, 49.5%) for males and 20 to 24 minutes (149 commuters, 65.1%) for females.
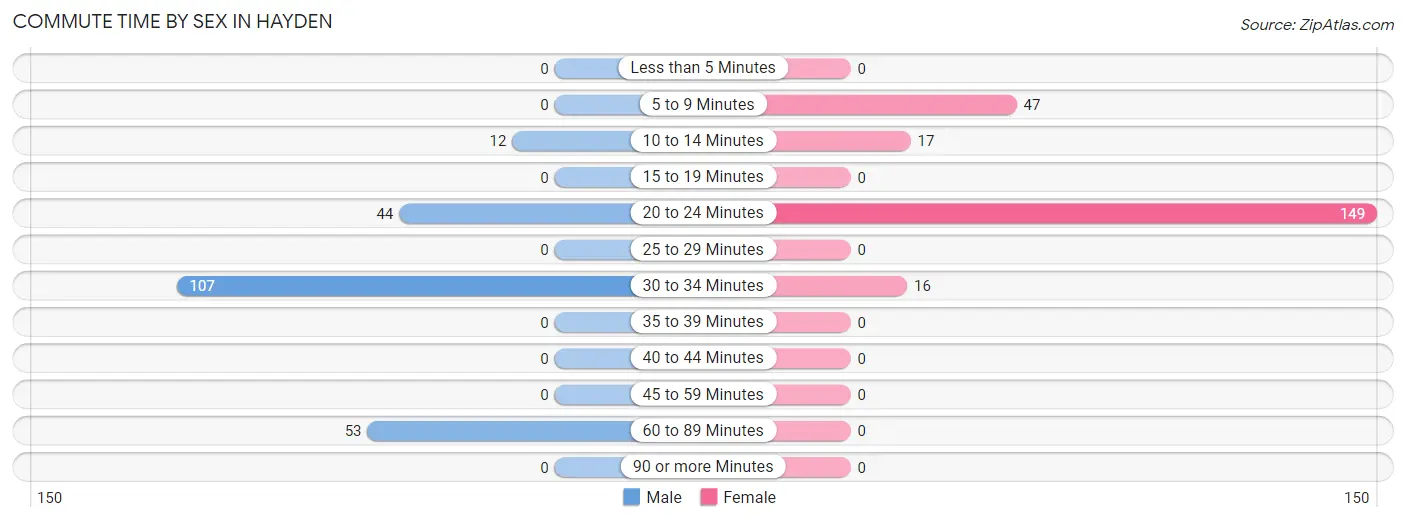
| Commute Time | Male | Female |
| Less than 5 Minutes | 0 (0.0%) | 0 (0.0%) |
| 5 to 9 Minutes | 0 (0.0%) | 47 (20.5%) |
| 10 to 14 Minutes | 12 (5.6%) | 17 (7.4%) |
| 15 to 19 Minutes | 0 (0.0%) | 0 (0.0%) |
| 20 to 24 Minutes | 44 (20.4%) | 149 (65.1%) |
| 25 to 29 Minutes | 0 (0.0%) | 0 (0.0%) |
| 30 to 34 Minutes | 107 (49.5%) | 16 (7.0%) |
| 35 to 39 Minutes | 0 (0.0%) | 0 (0.0%) |
| 40 to 44 Minutes | 0 (0.0%) | 0 (0.0%) |
| 45 to 59 Minutes | 0 (0.0%) | 0 (0.0%) |
| 60 to 89 Minutes | 53 (24.5%) | 0 (0.0%) |
| 90 or more Minutes | 0 (0.0%) | 0 (0.0%) |
Time of Departure to Work by Sex in Hayden
The most frequent times of departure to work in Hayden are 8:00 AM to 8:29 AM (53, 24.5%) for males and 12:00 AM to 4:59 AM (65, 28.4%) for females.
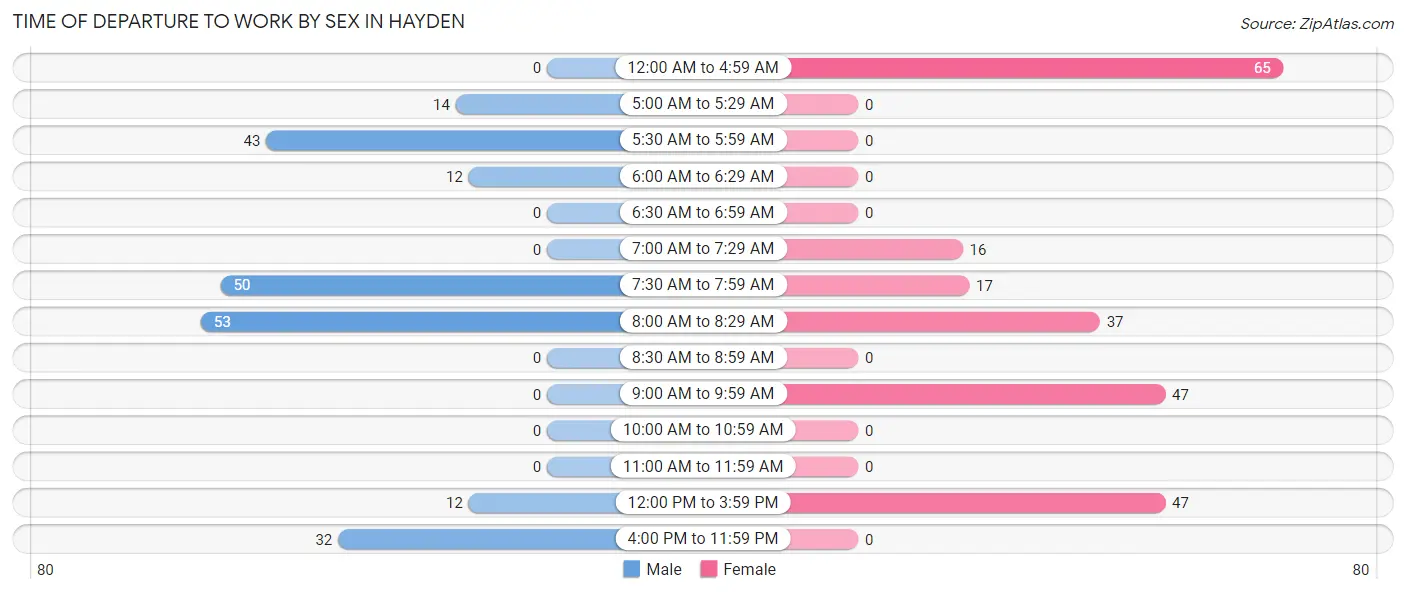
| Time of Departure | Male | Female |
| 12:00 AM to 4:59 AM | 0 (0.0%) | 65 (28.4%) |
| 5:00 AM to 5:29 AM | 14 (6.5%) | 0 (0.0%) |
| 5:30 AM to 5:59 AM | 43 (19.9%) | 0 (0.0%) |
| 6:00 AM to 6:29 AM | 12 (5.6%) | 0 (0.0%) |
| 6:30 AM to 6:59 AM | 0 (0.0%) | 0 (0.0%) |
| 7:00 AM to 7:29 AM | 0 (0.0%) | 16 (7.0%) |
| 7:30 AM to 7:59 AM | 50 (23.2%) | 17 (7.4%) |
| 8:00 AM to 8:29 AM | 53 (24.5%) | 37 (16.2%) |
| 8:30 AM to 8:59 AM | 0 (0.0%) | 0 (0.0%) |
| 9:00 AM to 9:59 AM | 0 (0.0%) | 47 (20.5%) |
| 10:00 AM to 10:59 AM | 0 (0.0%) | 0 (0.0%) |
| 11:00 AM to 11:59 AM | 0 (0.0%) | 0 (0.0%) |
| 12:00 PM to 3:59 PM | 12 (5.6%) | 47 (20.5%) |
| 4:00 PM to 11:59 PM | 32 (14.8%) | 0 (0.0%) |
| Total | 216 (100.0%) | 229 (100.0%) |
Housing Occupancy in Hayden
Occupancy by Ownership in Hayden
Of the total 200 dwellings in Hayden, owner-occupied units account for 185 (92.5%), while renter-occupied units make up 15 (7.5%).
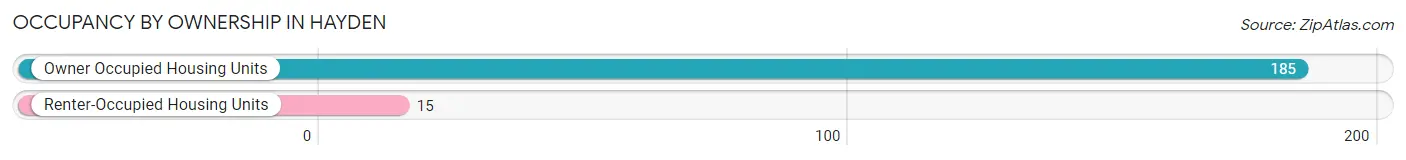
| Occupancy | # Housing Units | % Housing Units |
| Owner Occupied Housing Units | 185 | 92.5% |
| Renter-Occupied Housing Units | 15 | 7.5% |
| Total Occupied Housing Units | 200 | 100.0% |
Occupancy by Household Size in Hayden
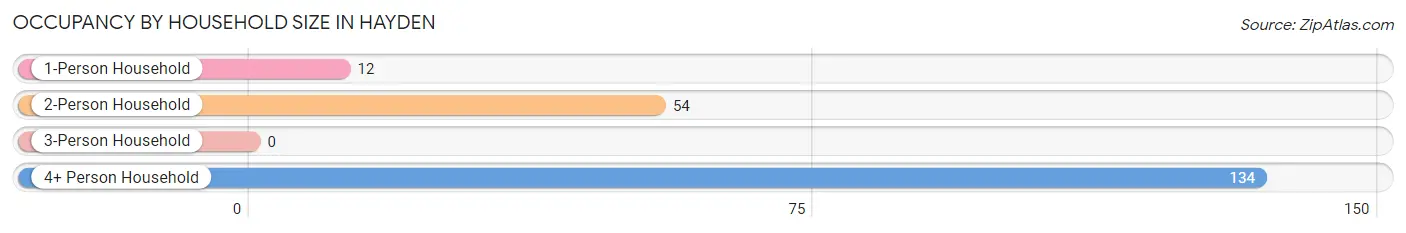
| Household Size | # Housing Units | % Housing Units |
| 1-Person Household | 12 | 6.0% |
| 2-Person Household | 54 | 27.0% |
| 3-Person Household | 0 | 0.0% |
| 4+ Person Household | 134 | 67.0% |
| Total Housing Units | 200 | 100.0% |
Occupancy by Ownership by Household Size in Hayden
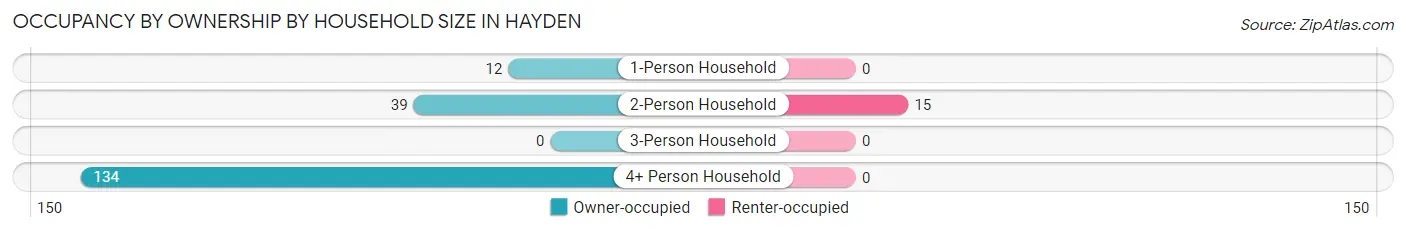
| Household Size | Owner-occupied | Renter-occupied |
| 1-Person Household | 12 (100.0%) | 0 (0.0%) |
| 2-Person Household | 39 (72.2%) | 15 (27.8%) |
| 3-Person Household | 0 (0.0%) | 0 (0.0%) |
| 4+ Person Household | 134 (100.0%) | 0 (0.0%) |
| Total Housing Units | 185 (92.5%) | 15 (7.5%) |
Occupancy by Educational Attainment in Hayden
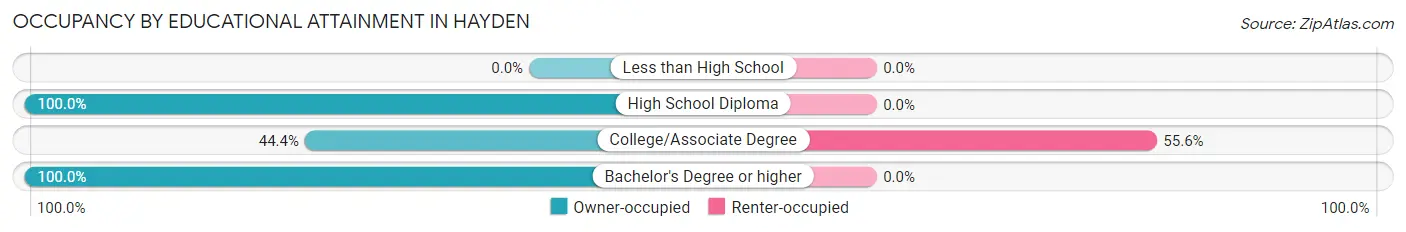
| Household Size | Owner-occupied | Renter-occupied |
| Less than High School | 0 (0.0%) | 0 (0.0%) |
| High School Diploma | 86 (100.0%) | 0 (0.0%) |
| College/Associate Degree | 12 (44.4%) | 15 (55.6%) |
| Bachelor's Degree or higher | 87 (100.0%) | 0 (0.0%) |
Occupancy by Age of Householder in Hayden
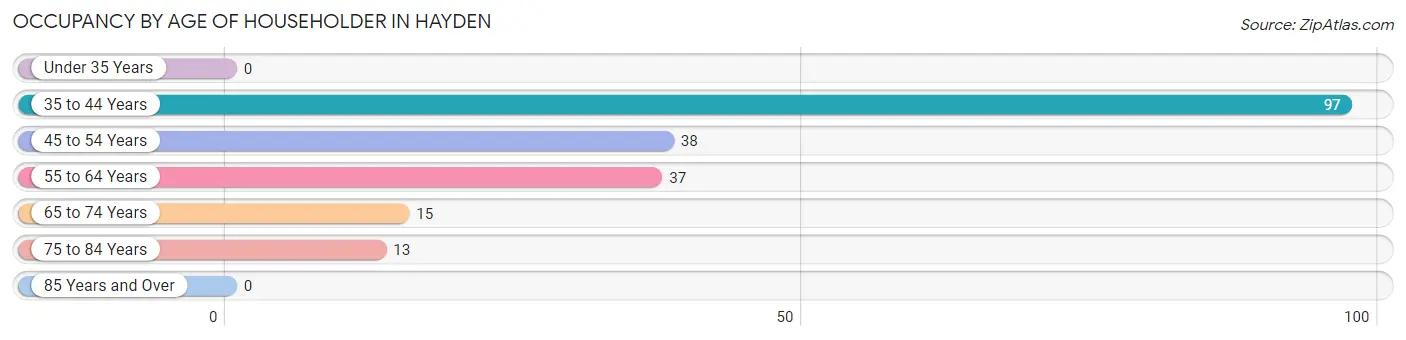
| Age Bracket | # Households | % Households |
| Under 35 Years | 0 | 0.0% |
| 35 to 44 Years | 97 | 48.5% |
| 45 to 54 Years | 38 | 19.0% |
| 55 to 64 Years | 37 | 18.5% |
| 65 to 74 Years | 15 | 7.5% |
| 75 to 84 Years | 13 | 6.5% |
| 85 Years and Over | 0 | 0.0% |
| Total | 200 | 100.0% |
Housing Finances in Hayden
Median Income by Occupancy in Hayden
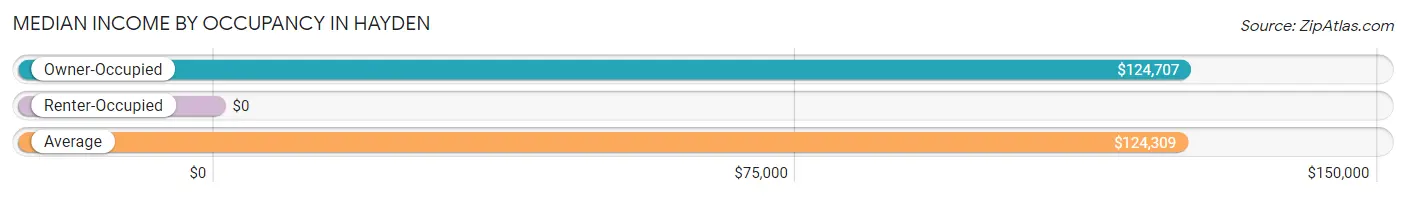
| Occupancy Type | # Households | Median Income |
| Owner-Occupied | 185 (92.5%) | $124,707 |
| Renter-Occupied | 15 (7.5%) | $0 |
| Average | 200 (100.0%) | $124,309 |
Occupancy by Householder Income Bracket in Hayden
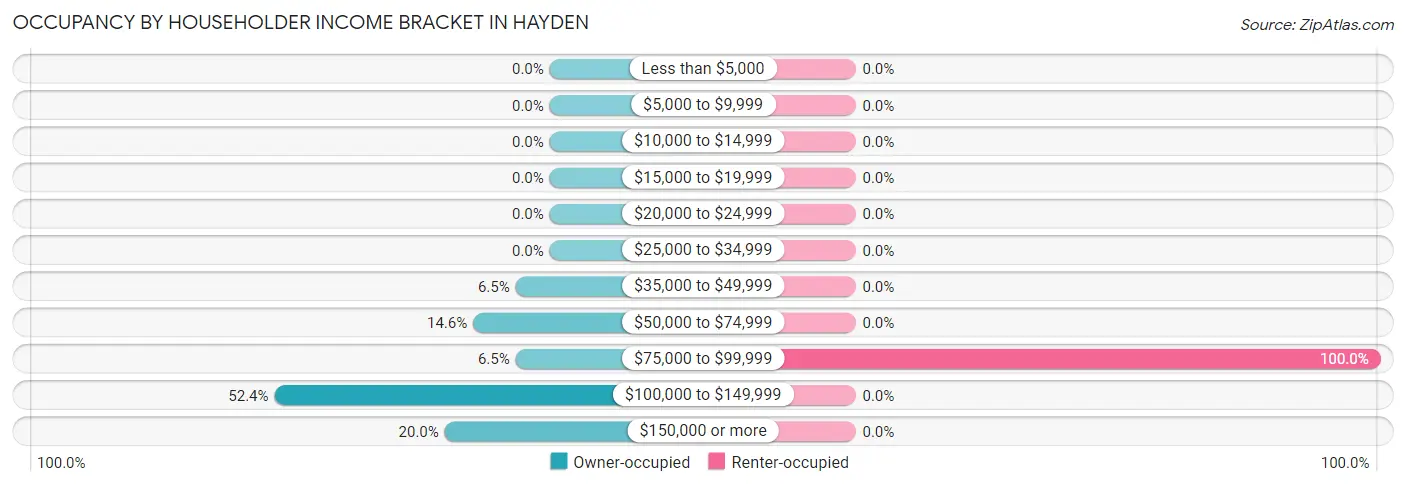
| Income Bracket | Owner-occupied | Renter-occupied |
| Less than $5,000 | 0 (0.0%) | 0 (0.0%) |
| $5,000 to $9,999 | 0 (0.0%) | 0 (0.0%) |
| $10,000 to $14,999 | 0 (0.0%) | 0 (0.0%) |
| $15,000 to $19,999 | 0 (0.0%) | 0 (0.0%) |
| $20,000 to $24,999 | 0 (0.0%) | 0 (0.0%) |
| $25,000 to $34,999 | 0 (0.0%) | 0 (0.0%) |
| $35,000 to $49,999 | 12 (6.5%) | 0 (0.0%) |
| $50,000 to $74,999 | 27 (14.6%) | 0 (0.0%) |
| $75,000 to $99,999 | 12 (6.5%) | 15 (100.0%) |
| $100,000 to $149,999 | 97 (52.4%) | 0 (0.0%) |
| $150,000 or more | 37 (20.0%) | 0 (0.0%) |
| Total | 185 (100.0%) | 15 (100.0%) |
Monthly Housing Cost Tiers in Hayden
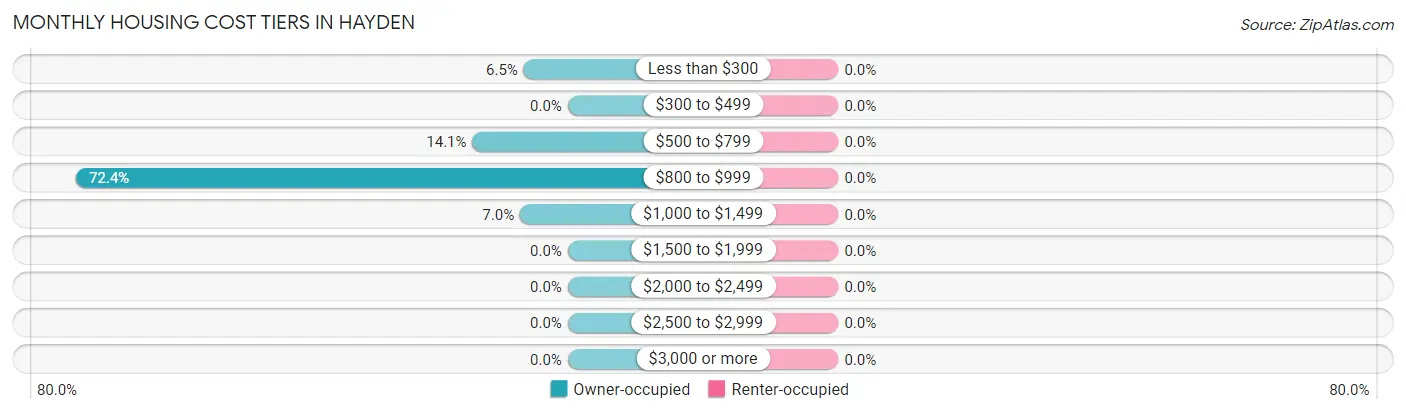
| Monthly Cost | Owner-occupied | Renter-occupied |
| Less than $300 | 12 (6.5%) | 0 (0.0%) |
| $300 to $499 | 0 (0.0%) | 0 (0.0%) |
| $500 to $799 | 26 (14.1%) | 0 (0.0%) |
| $800 to $999 | 134 (72.4%) | 0 (0.0%) |
| $1,000 to $1,499 | 13 (7.0%) | 0 (0.0%) |
| $1,500 to $1,999 | 0 (0.0%) | 0 (0.0%) |
| $2,000 to $2,499 | 0 (0.0%) | 0 (0.0%) |
| $2,500 to $2,999 | 0 (0.0%) | 0 (0.0%) |
| $3,000 or more | 0 (0.0%) | 0 (0.0%) |
| Total | 185 (100.0%) | 15 (100.0%) |
Physical Housing Characteristics in Hayden
Housing Structures in Hayden
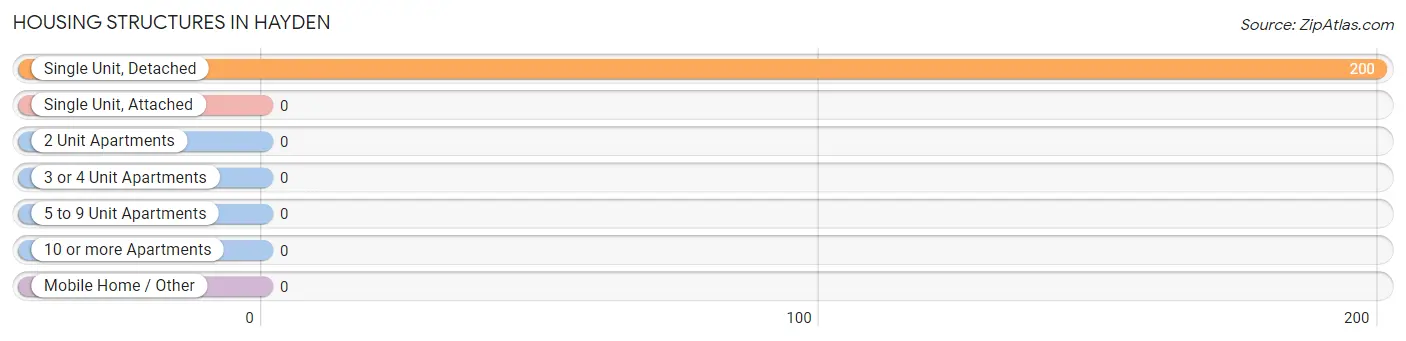
| Structure Type | # Housing Units | % Housing Units |
| Single Unit, Detached | 200 | 100.0% |
| Single Unit, Attached | 0 | 0.0% |
| 2 Unit Apartments | 0 | 0.0% |
| 3 or 4 Unit Apartments | 0 | 0.0% |
| 5 to 9 Unit Apartments | 0 | 0.0% |
| 10 or more Apartments | 0 | 0.0% |
| Mobile Home / Other | 0 | 0.0% |
| Total | 200 | 100.0% |
Housing Structures by Occupancy in Hayden
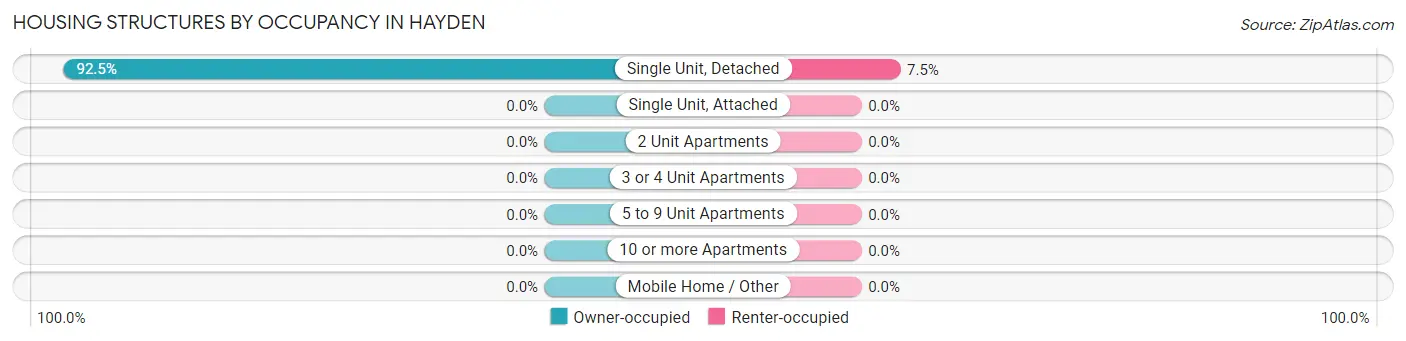
| Structure Type | Owner-occupied | Renter-occupied |
| Single Unit, Detached | 185 (92.5%) | 15 (7.5%) |
| Single Unit, Attached | 0 (0.0%) | 0 (0.0%) |
| 2 Unit Apartments | 0 (0.0%) | 0 (0.0%) |
| 3 or 4 Unit Apartments | 0 (0.0%) | 0 (0.0%) |
| 5 to 9 Unit Apartments | 0 (0.0%) | 0 (0.0%) |
| 10 or more Apartments | 0 (0.0%) | 0 (0.0%) |
| Mobile Home / Other | 0 (0.0%) | 0 (0.0%) |
| Total | 185 (92.5%) | 15 (7.5%) |
Housing Structures by Number of Rooms in Hayden
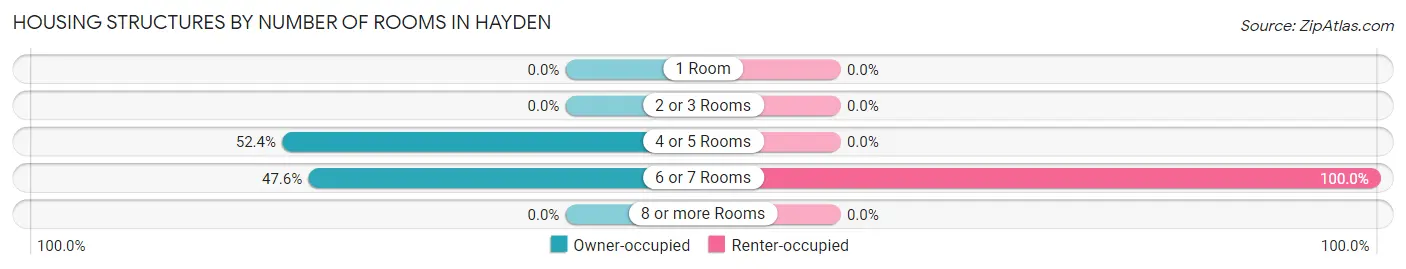
| Number of Rooms | Owner-occupied | Renter-occupied |
| 1 Room | 0 (0.0%) | 0 (0.0%) |
| 2 or 3 Rooms | 0 (0.0%) | 0 (0.0%) |
| 4 or 5 Rooms | 97 (52.4%) | 0 (0.0%) |
| 6 or 7 Rooms | 88 (47.6%) | 15 (100.0%) |
| 8 or more Rooms | 0 (0.0%) | 0 (0.0%) |
| Total | 185 (100.0%) | 15 (100.0%) |
Housing Structure by Heating Type in Hayden
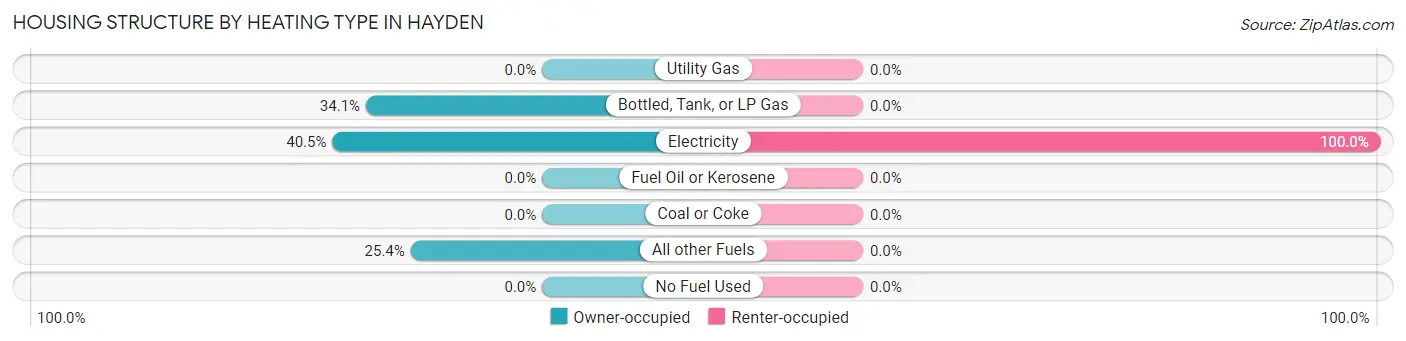
| Heating Type | Owner-occupied | Renter-occupied |
| Utility Gas | 0 (0.0%) | 0 (0.0%) |
| Bottled, Tank, or LP Gas | 63 (34.1%) | 0 (0.0%) |
| Electricity | 75 (40.5%) | 15 (100.0%) |
| Fuel Oil or Kerosene | 0 (0.0%) | 0 (0.0%) |
| Coal or Coke | 0 (0.0%) | 0 (0.0%) |
| All other Fuels | 47 (25.4%) | 0 (0.0%) |
| No Fuel Used | 0 (0.0%) | 0 (0.0%) |
| Total | 185 (100.0%) | 15 (100.0%) |
Household Vehicle Usage in Hayden
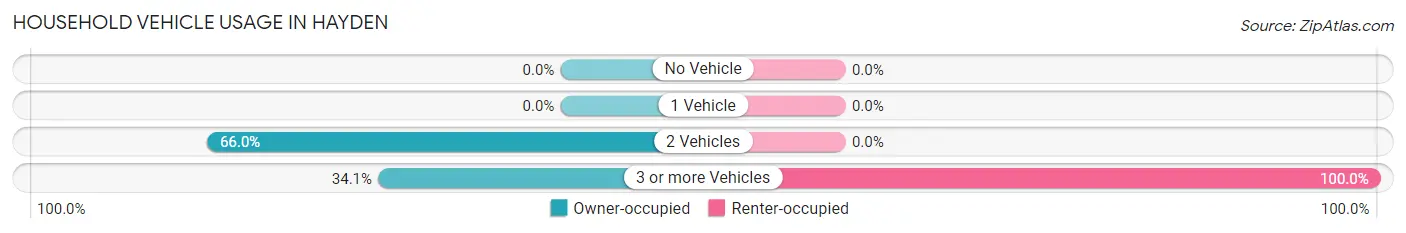
| Vehicles per Household | Owner-occupied | Renter-occupied |
| No Vehicle | 0 (0.0%) | 0 (0.0%) |
| 1 Vehicle | 0 (0.0%) | 0 (0.0%) |
| 2 Vehicles | 122 (65.9%) | 0 (0.0%) |
| 3 or more Vehicles | 63 (34.1%) | 15 (100.0%) |
| Total | 185 (100.0%) | 15 (100.0%) |
Real Estate & Mortgages in Hayden
Real Estate and Mortgage Overview in Hayden
| Characteristic | Without Mortgage | With Mortgage |
| Housing Units | 24 | 161 |
| Median Property Value | - | - |
| Median Household Income | - | - |
| Monthly Housing Costs | - | - |
| Real Estate Taxes | - | - |
Property Value by Mortgage Status in Hayden
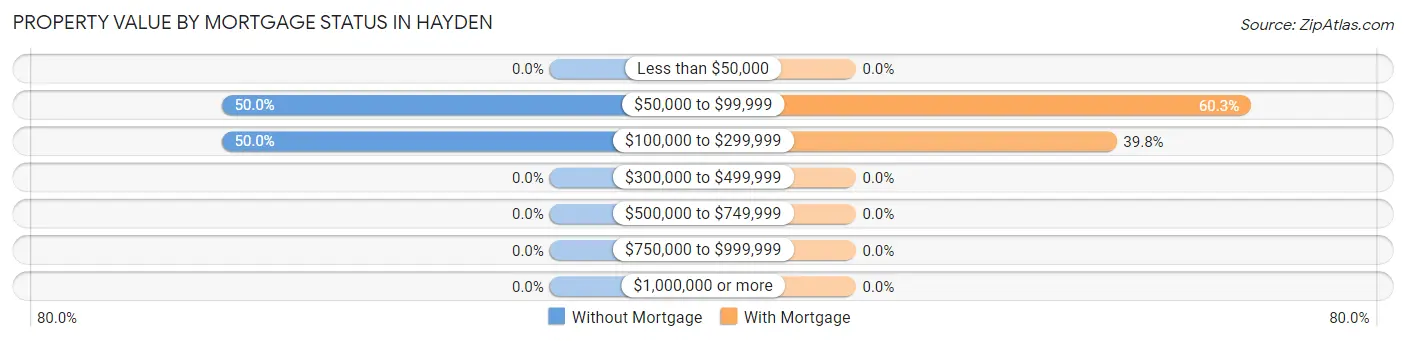
| Property Value | Without Mortgage | With Mortgage |
| Less than $50,000 | 0 (0.0%) | 0 (0.0%) |
| $50,000 to $99,999 | 12 (50.0%) | 97 (60.3%) |
| $100,000 to $299,999 | 12 (50.0%) | 64 (39.8%) |
| $300,000 to $499,999 | 0 (0.0%) | 0 (0.0%) |
| $500,000 to $749,999 | 0 (0.0%) | 0 (0.0%) |
| $750,000 to $999,999 | 0 (0.0%) | 0 (0.0%) |
| $1,000,000 or more | 0 (0.0%) | 0 (0.0%) |
| Total | 24 (100.0%) | 161 (100.0%) |
Household Income by Mortgage Status in Hayden
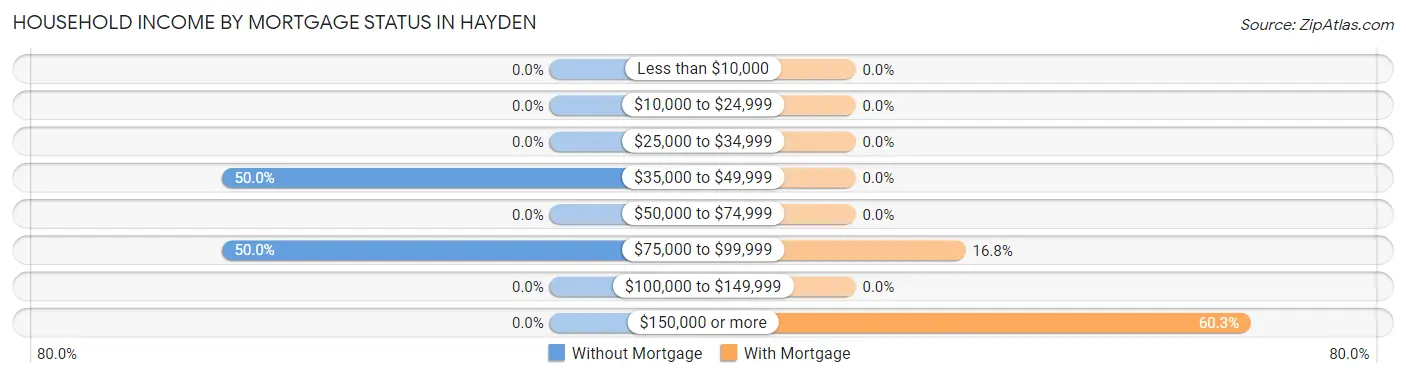
| Household Income | Without Mortgage | With Mortgage |
| Less than $10,000 | 0 (0.0%) | 0 (0.0%) |
| $10,000 to $24,999 | 0 (0.0%) | 0 (0.0%) |
| $25,000 to $34,999 | 0 (0.0%) | 0 (0.0%) |
| $35,000 to $49,999 | 12 (50.0%) | 0 (0.0%) |
| $50,000 to $74,999 | 0 (0.0%) | 0 (0.0%) |
| $75,000 to $99,999 | 12 (50.0%) | 27 (16.8%) |
| $100,000 to $149,999 | 0 (0.0%) | 0 (0.0%) |
| $150,000 or more | 0 (0.0%) | 97 (60.3%) |
| Total | 24 (100.0%) | 161 (100.0%) |
Property Value to Household Income Ratio in Hayden
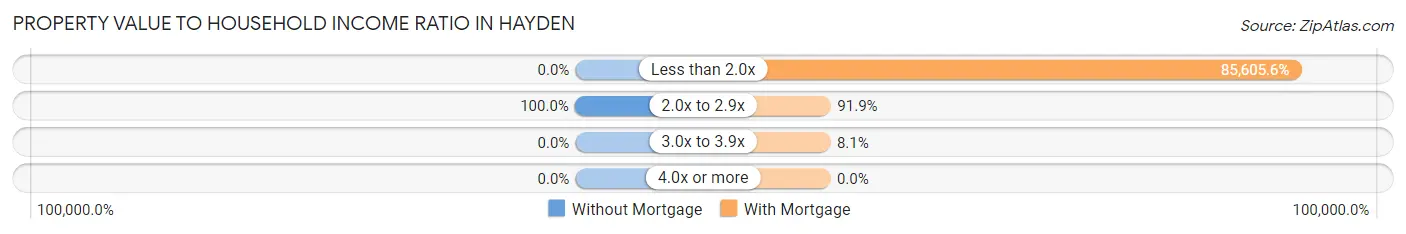
| Value-to-Income Ratio | Without Mortgage | With Mortgage |
| Less than 2.0x | 0 (0.0%) | 137,825 (85,605.6%) |
| 2.0x to 2.9x | 24 (100.0%) | 148 (91.9%) |
| 3.0x to 3.9x | 0 (0.0%) | 13 (8.1%) |
| 4.0x or more | 0 (0.0%) | 0 (0.0%) |
| Total | 24 (100.0%) | 161 (100.0%) |
Real Estate Taxes by Mortgage Status in Hayden
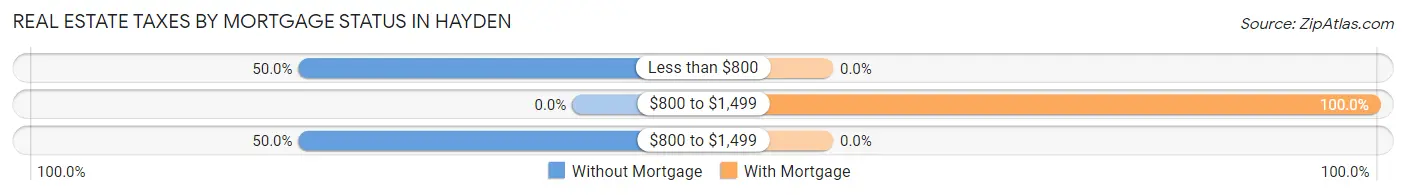
| Property Taxes | Without Mortgage | With Mortgage |
| Less than $800 | 12 (50.0%) | 0 (0.0%) |
| $800 to $1,499 | 0 (0.0%) | 161 (100.0%) |
| $800 to $1,499 | 12 (50.0%) | 0 (0.0%) |
| Total | 24 (100.0%) | 161 (100.0%) |
Health & Disability in Hayden
Health Insurance Coverage by Age in Hayden
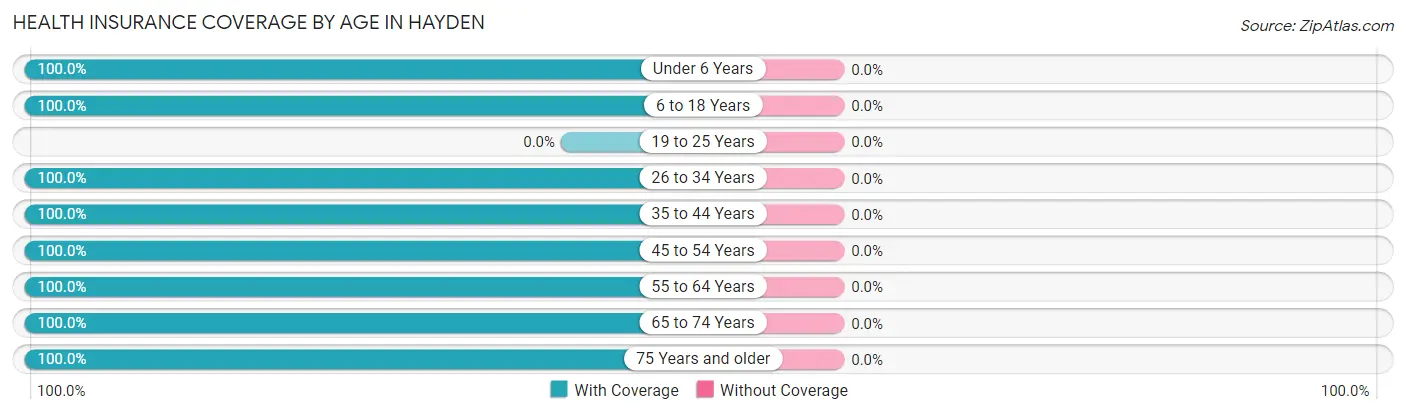
| Age Bracket | With Coverage | Without Coverage |
| Under 6 Years | 39 (100.0%) | 0 (0.0%) |
| 6 to 18 Years | 371 (100.0%) | 0 (0.0%) |
| 19 to 25 Years | 0 (0.0%) | 0 (0.0%) |
| 26 to 34 Years | 47 (100.0%) | 0 (0.0%) |
| 35 to 44 Years | 162 (100.0%) | 0 (0.0%) |
| 45 to 54 Years | 114 (100.0%) | 0 (0.0%) |
| 55 to 64 Years | 90 (100.0%) | 0 (0.0%) |
| 65 to 74 Years | 39 (100.0%) | 0 (0.0%) |
| 75 Years and older | 13 (100.0%) | 0 (0.0%) |
| Total | 875 (100.0%) | 0 (0.0%) |
Health Insurance Coverage by Citizenship Status in Hayden
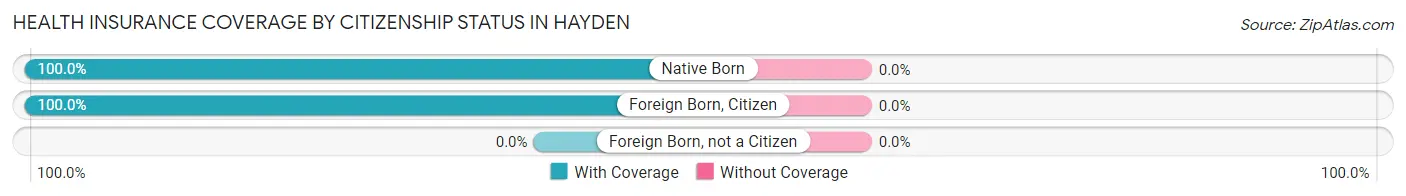
| Citizenship Status | With Coverage | Without Coverage |
| Native Born | 39 (100.0%) | 0 (0.0%) |
| Foreign Born, Citizen | 371 (100.0%) | 0 (0.0%) |
| Foreign Born, not a Citizen | 0 (0.0%) | 0 (0.0%) |
Health Insurance Coverage by Household Income in Hayden
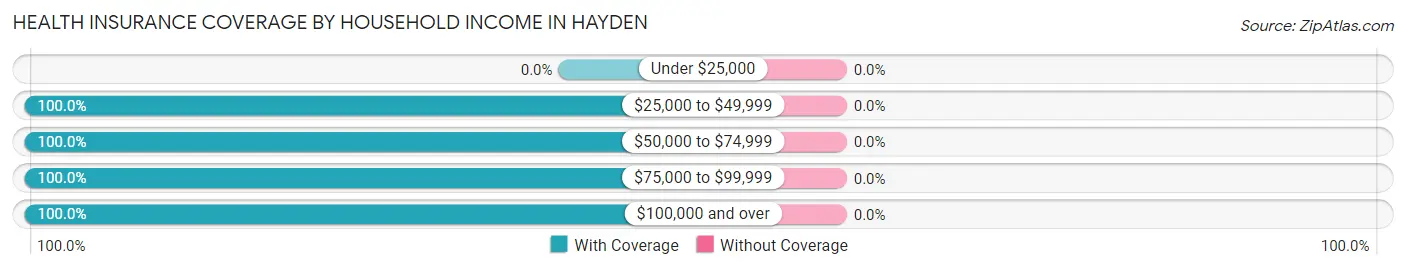
| Household Income | With Coverage | Without Coverage |
| Under $25,000 | 0 (0.0%) | 0 (0.0%) |
| $25,000 to $49,999 | 12 (100.0%) | 0 (0.0%) |
| $50,000 to $74,999 | 54 (100.0%) | 0 (0.0%) |
| $75,000 to $99,999 | 57 (100.0%) | 0 (0.0%) |
| $100,000 and over | 752 (100.0%) | 0 (0.0%) |
Public vs Private Health Insurance Coverage by Age in Hayden
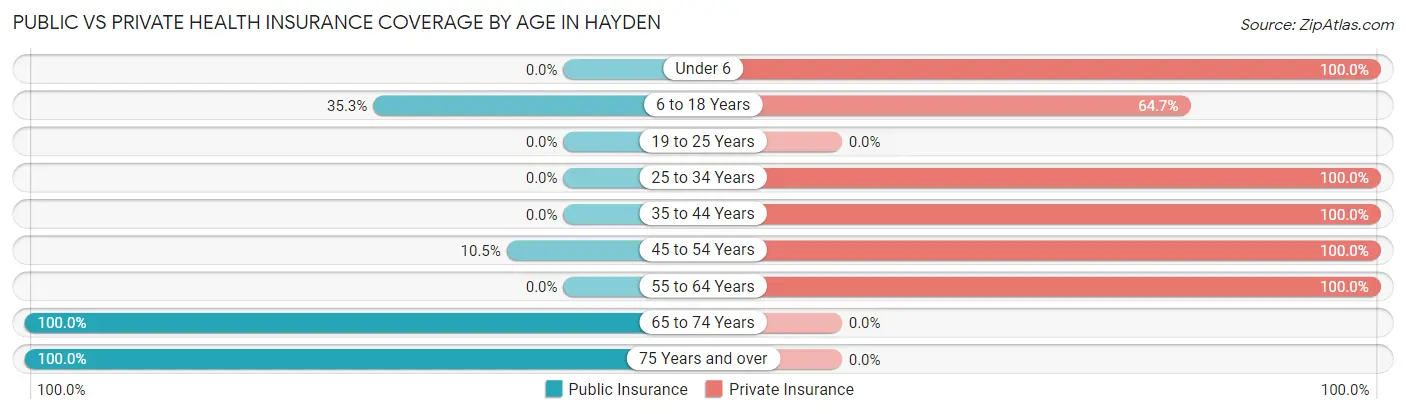
| Age Bracket | Public Insurance | Private Insurance |
| Under 6 | 0 (0.0%) | 39 (100.0%) |
| 6 to 18 Years | 131 (35.3%) | 240 (64.7%) |
| 19 to 25 Years | 0 (0.0%) | 0 (0.0%) |
| 25 to 34 Years | 0 (0.0%) | 47 (100.0%) |
| 35 to 44 Years | 0 (0.0%) | 162 (100.0%) |
| 45 to 54 Years | 12 (10.5%) | 114 (100.0%) |
| 55 to 64 Years | 0 (0.0%) | 90 (100.0%) |
| 65 to 74 Years | 39 (100.0%) | 0 (0.0%) |
| 75 Years and over | 13 (100.0%) | 0 (0.0%) |
| Total | 195 (22.3%) | 692 (79.1%) |
Disability Status by Sex by Age in Hayden
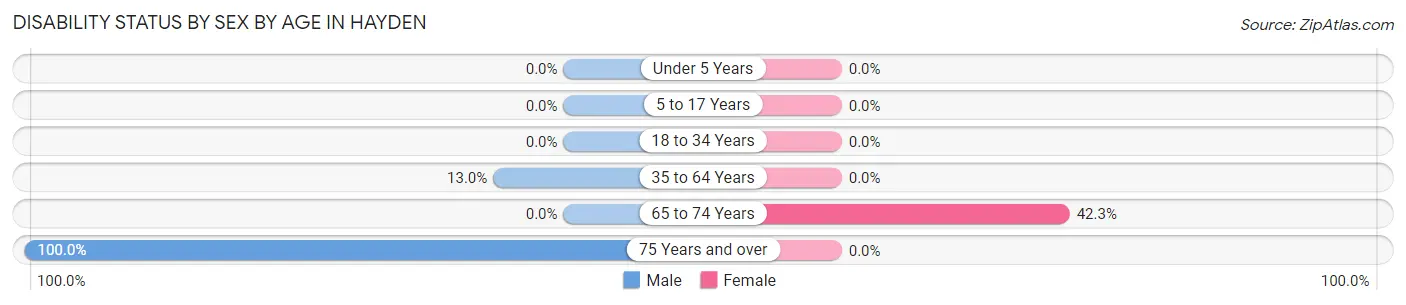
| Age Bracket | Male | Female |
| Under 5 Years | 0 (0.0%) | 0 (0.0%) |
| 5 to 17 Years | 0 (0.0%) | 0 (0.0%) |
| 18 to 34 Years | 0 (0.0%) | 0 (0.0%) |
| 35 to 64 Years | 24 (13.0%) | 0 (0.0%) |
| 65 to 74 Years | 0 (0.0%) | 11 (42.3%) |
| 75 Years and over | 13 (100.0%) | 0 (0.0%) |
Disability Class by Sex by Age in Hayden
Disability Class: Hearing Difficulty
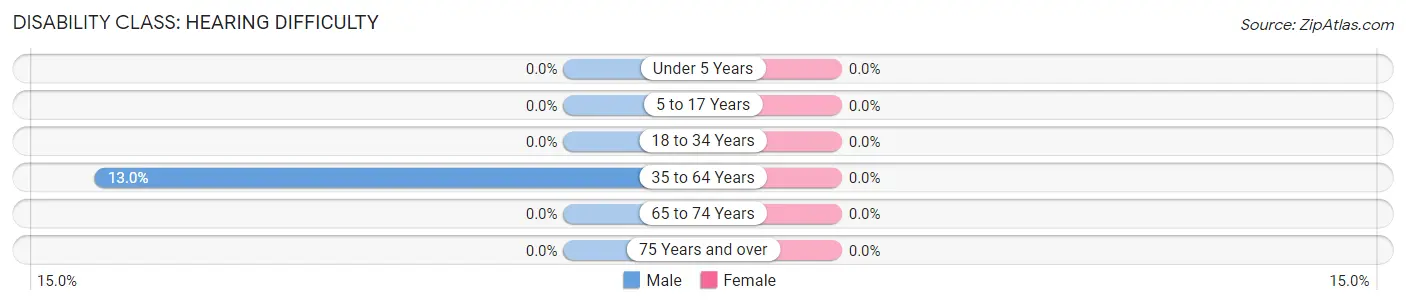
| Age Bracket | Male | Female |
| Under 5 Years | 0 (0.0%) | 0 (0.0%) |
| 5 to 17 Years | 0 (0.0%) | 0 (0.0%) |
| 18 to 34 Years | 0 (0.0%) | 0 (0.0%) |
| 35 to 64 Years | 24 (13.0%) | 0 (0.0%) |
| 65 to 74 Years | 0 (0.0%) | 0 (0.0%) |
| 75 Years and over | 0 (0.0%) | 0 (0.0%) |
Disability Class: Vision Difficulty
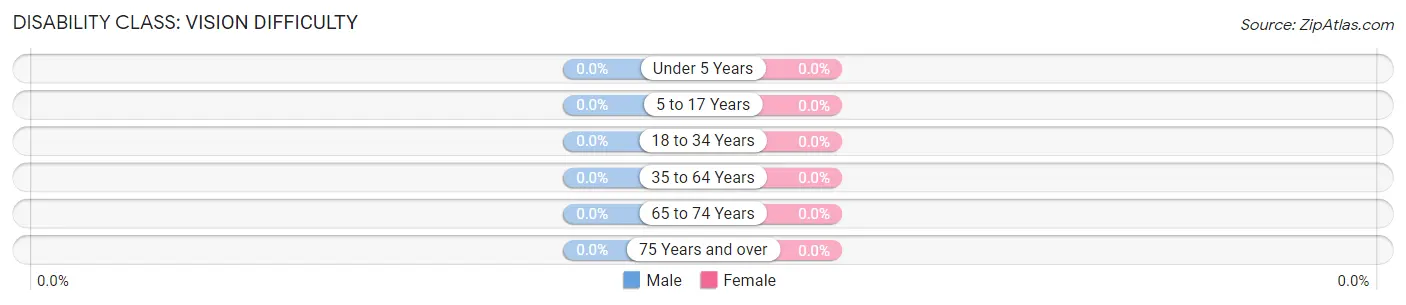
| Age Bracket | Male | Female |
| Under 5 Years | 0 (0.0%) | 0 (0.0%) |
| 5 to 17 Years | 0 (0.0%) | 0 (0.0%) |
| 18 to 34 Years | 0 (0.0%) | 0 (0.0%) |
| 35 to 64 Years | 0 (0.0%) | 0 (0.0%) |
| 65 to 74 Years | 0 (0.0%) | 0 (0.0%) |
| 75 Years and over | 0 (0.0%) | 0 (0.0%) |
Disability Class: Cognitive Difficulty
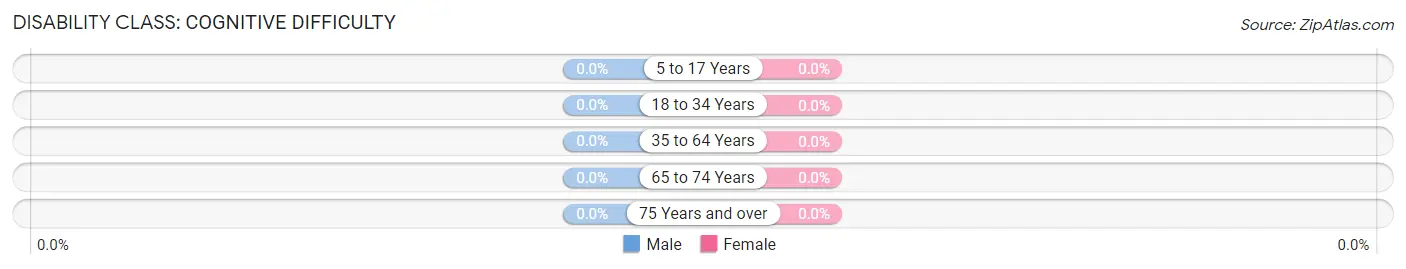
| Age Bracket | Male | Female |
| 5 to 17 Years | 0 (0.0%) | 0 (0.0%) |
| 18 to 34 Years | 0 (0.0%) | 0 (0.0%) |
| 35 to 64 Years | 0 (0.0%) | 0 (0.0%) |
| 65 to 74 Years | 0 (0.0%) | 0 (0.0%) |
| 75 Years and over | 0 (0.0%) | 0 (0.0%) |
Disability Class: Ambulatory Difficulty
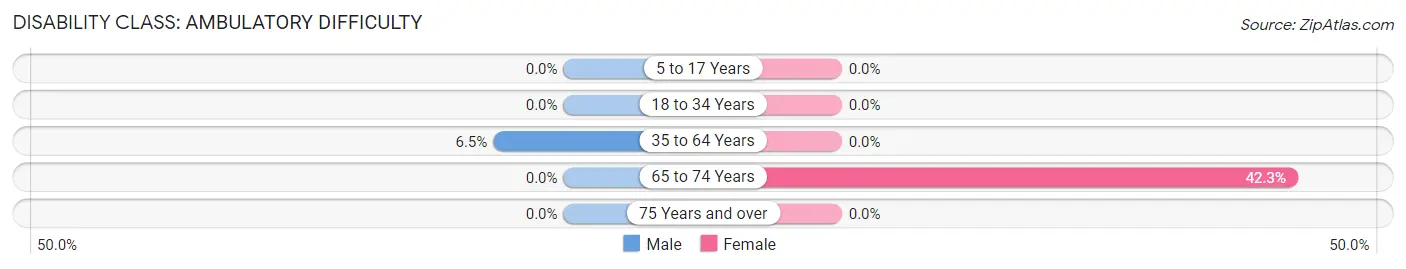
| Age Bracket | Male | Female |
| 5 to 17 Years | 0 (0.0%) | 0 (0.0%) |
| 18 to 34 Years | 0 (0.0%) | 0 (0.0%) |
| 35 to 64 Years | 12 (6.5%) | 0 (0.0%) |
| 65 to 74 Years | 0 (0.0%) | 11 (42.3%) |
| 75 Years and over | 0 (0.0%) | 0 (0.0%) |
Disability Class: Self-Care Difficulty
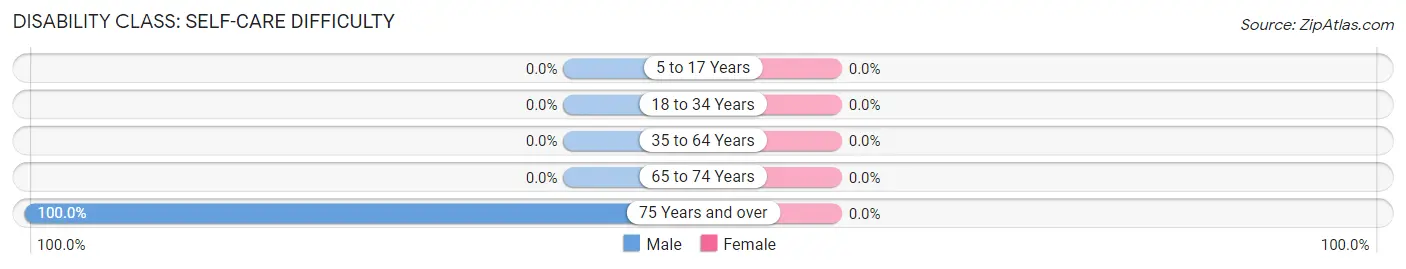
| Age Bracket | Male | Female |
| 5 to 17 Years | 0 (0.0%) | 0 (0.0%) |
| 18 to 34 Years | 0 (0.0%) | 0 (0.0%) |
| 35 to 64 Years | 0 (0.0%) | 0 (0.0%) |
| 65 to 74 Years | 0 (0.0%) | 0 (0.0%) |
| 75 Years and over | 13 (100.0%) | 0 (0.0%) |
Technology Access in Hayden
Computing Device Access in Hayden
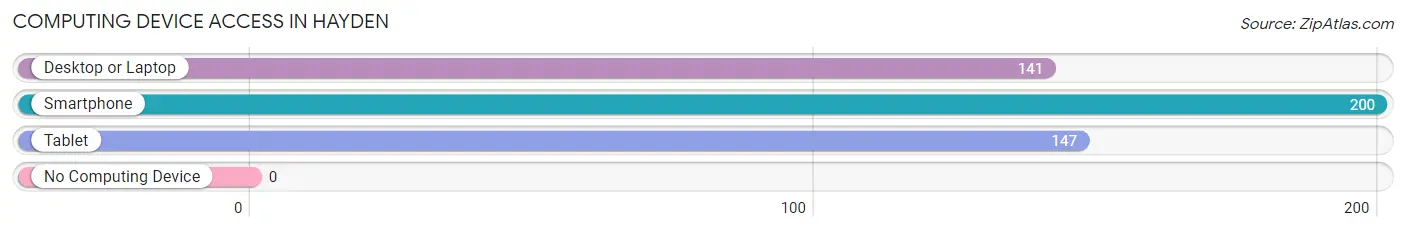
| Device Type | # Households | % Households |
| Desktop or Laptop | 141 | 70.5% |
| Smartphone | 200 | 100.0% |
| Tablet | 147 | 73.5% |
| No Computing Device | 0 | 0.0% |
| Total | 200 | 100.0% |
Internet Access in Hayden
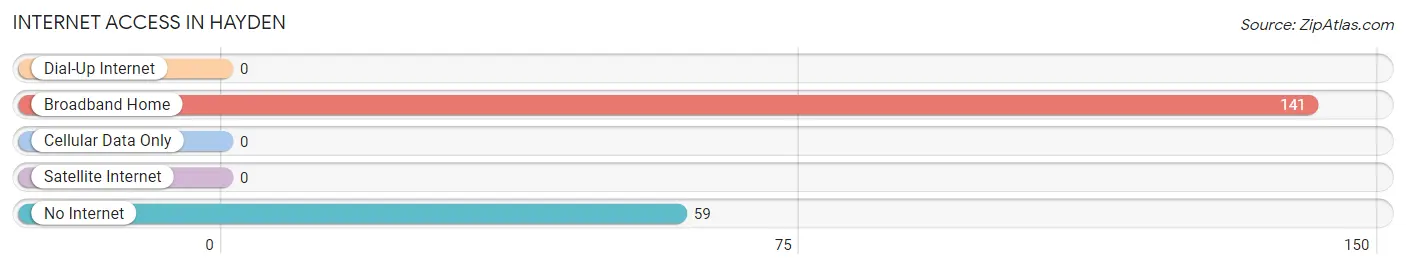
| Internet Type | # Households | % Households |
| Dial-Up Internet | 0 | 0.0% |
| Broadband Home | 141 | 70.5% |
| Cellular Data Only | 0 | 0.0% |
| Satellite Internet | 0 | 0.0% |
| No Internet | 59 | 29.5% |
| Total | 200 | 100.0% |
Hayden Summary
Hayden, Indiana is a small town located in the northern part of the state, in LaPorte County. It is situated on the banks of the Little Calumet River, and is part of the Michigan City-LaPorte Metropolitan Statistical Area. The town has a population of just over 1,000 people, and is known for its rural charm and small-town atmosphere.
History
The area that is now Hayden was first settled in the early 1800s by a group of settlers from New York. The town was originally known as “Hayden’s Station”, and was named after the first settler, William Hayden. The town was officially incorporated in 1871, and the first post office was established in 1872.
In the late 1800s, the town was a major hub for the lumber industry, and the town’s economy was largely based on the production of lumber. The town also had a thriving agricultural industry, and was home to several dairy farms.
In the early 1900s, the town began to experience a decline in its economy, as the lumber industry began to decline. The town’s population also began to decline, and by the 1950s, the population had dropped to just over 500 people.
Geography
Hayden is located in the northern part of LaPorte County, in the state of Indiana. The town is situated on the banks of the Little Calumet River, and is part of the Michigan City-LaPorte Metropolitan Statistical Area. The town is located approximately 25 miles east of South Bend, and is about an hour’s drive from Chicago.
The town has a total area of 1.2 square miles, all of which is land. The town is located in a rural area, and is surrounded by farmland and wooded areas. The town is also located near several lakes, including Lake Michigan, Lake George, and Lake Maxinkuckee.
Economy
The economy of Hayden is largely based on agriculture and tourism. The town is home to several dairy farms, and the surrounding area is known for its production of corn, soybeans, and wheat. The town is also home to several wineries, and is a popular destination for wine-tasting tours.
The town is also home to several small businesses, including restaurants, retail stores, and service providers. The town is also home to a small manufacturing plant, which produces plastic products.
Demographics
As of the 2010 census, the population of Hayden was 1,072 people. The racial makeup of the town was 97.2% White, 0.7% African American, 0.3% Native American, 0.2% Asian, 0.1% Pacific Islander, 0.7% from other races, and 0.9% from two or more races. Hispanic or Latino of any race were 1.7% of the population.
The median income for a household in the town was $41,250, and the median income for a family was $50,000. The per capita income for the town was $20,845. About 8.2% of families and 10.2% of the population were below the poverty line, including 14.3% of those under age 18 and 6.3% of those age 65 or over.
Common Questions
What is Per Capita Income in Hayden?
Per Capita income in Hayden is $31,837.
What is the Median Family Income in Hayden?
Median Family Income in Hayden is $124,628.
What is the Median Household income in Hayden?
Median Household Income in Hayden is $124,309.
What is Income or Wage Gap in Hayden?
Income or Wage Gap in Hayden is 22.0%.
Women in Hayden earn 78.0 cents for every dollar earned by a man.
What is Inequality or Gini Index in Hayden?
Inequality or Gini Index in Hayden is 0.23.
What is the Total Population of Hayden?
Total Population of Hayden is 875.
What is the Total Male Population of Hayden?
Total Male Population of Hayden is 405.
What is the Total Female Population of Hayden?
Total Female Population of Hayden is 470.
What is the Ratio of Males per 100 Females in Hayden?
There are 86.17 Males per 100 Females in Hayden.
What is the Ratio of Females per 100 Males in Hayden?
There are 116.05 Females per 100 Males in Hayden.
What is the Median Population Age in Hayden?
Median Population Age in Hayden is 34.6 Years.
What is the Average Family Size in Hayden
Average Family Size in Hayden is 4.6 People.
What is the Average Household Size in Hayden
Average Household Size in Hayden is 4.4 People.
How Large is the Labor Force in Hayden?
There are 445 People in the Labor Forcein in Hayden.
What is the Percentage of People in the Labor Force in Hayden?
82.3% of People are in the Labor Force in Hayden.