Zip Codes with the Highest Percentage of Population Employed in Architecture & Engineering in Hammond, IN
RELATED REPORTS & OPTIONS
Architecture & Engineering
Hammond
Compare Zip Codes
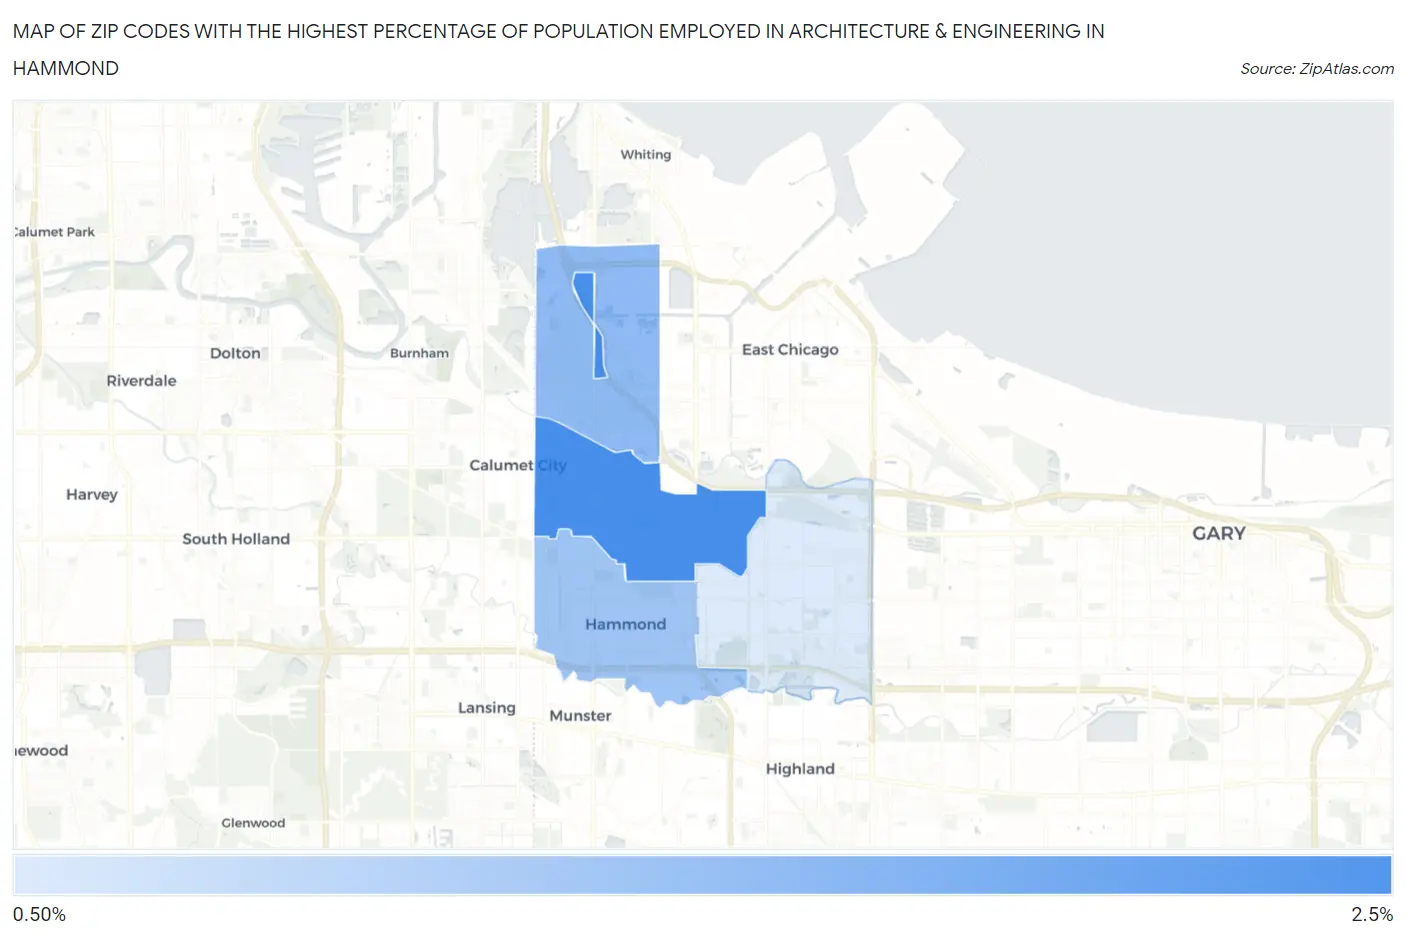
Map of Zip Codes with the Highest Percentage of Population Employed in Architecture & Engineering in Hammond
0.53%
2.1%
Zip Codes with the Highest Percentage of Population Employed in Architecture & Engineering in Hammond, IN
| Zip Code | % Employed | vs State | vs National | |
| 1. | 46320 | 2.1% | 2.2%(-0.141)#277 | 2.1%(-0.068)#9,152 |
| 2. | 46327 | 1.3% | 2.2%(-0.885)#407 | 2.1%(-0.813)#14,051 |
| 3. | 46324 | 1.2% | 2.2%(-1.06)#435 | 2.1%(-0.987)#15,389 |
| 4. | 46323 | 0.53% | 2.2%(-1.69)#548 | 2.1%(-1.62)#20,086 |
1
Common Questions
What are the Top 3 Zip Codes with the Highest Percentage of Population Employed in Architecture & Engineering in Hammond, IN?
Top 3 Zip Codes with the Highest Percentage of Population Employed in Architecture & Engineering in Hammond, IN are:
What zip code has the Highest Percentage of Population Employed in Architecture & Engineering in Hammond, IN?
46320 has the Highest Percentage of Population Employed in Architecture & Engineering in Hammond, IN with 2.1%.
What is the Percentage of Population Employed in Architecture & Engineering in Hammond, IN?
Percentage of Population Employed in Architecture & Engineering in Hammond is 1.9%.
What is the Percentage of Population Employed in Architecture & Engineering in Indiana?
Percentage of Population Employed in Architecture & Engineering in Indiana is 2.2%.
What is the Percentage of Population Employed in Architecture & Engineering in the United States?
Percentage of Population Employed in Architecture & Engineering in the United States is 2.1%.